
Multispectral Optical Diagnostics of Lightning from Space

 , ,
, ,
Abstract
:
1. Introduction
2. Materials and Methods
2.1. Modular Multispectral Imaging Array Measurements
2.2. Cloud Top Height Products
2.3. Spectroscopic Diagnostic Method
2.3.1. Calculation of Synthetic Spectra
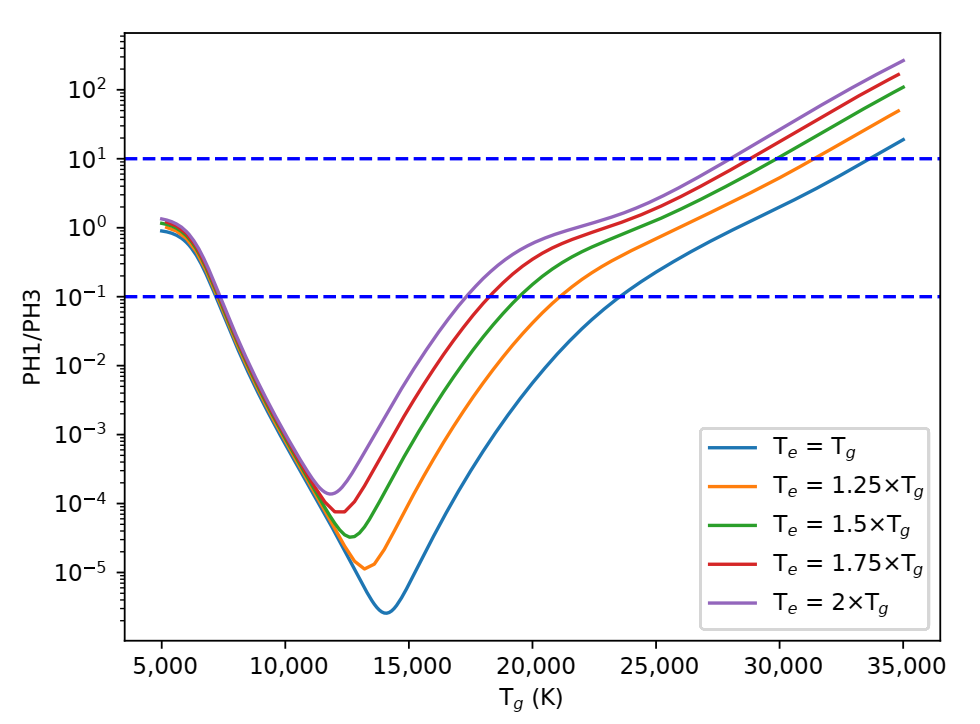
2.3.2. Estimation of the Gas and Electron Temperature
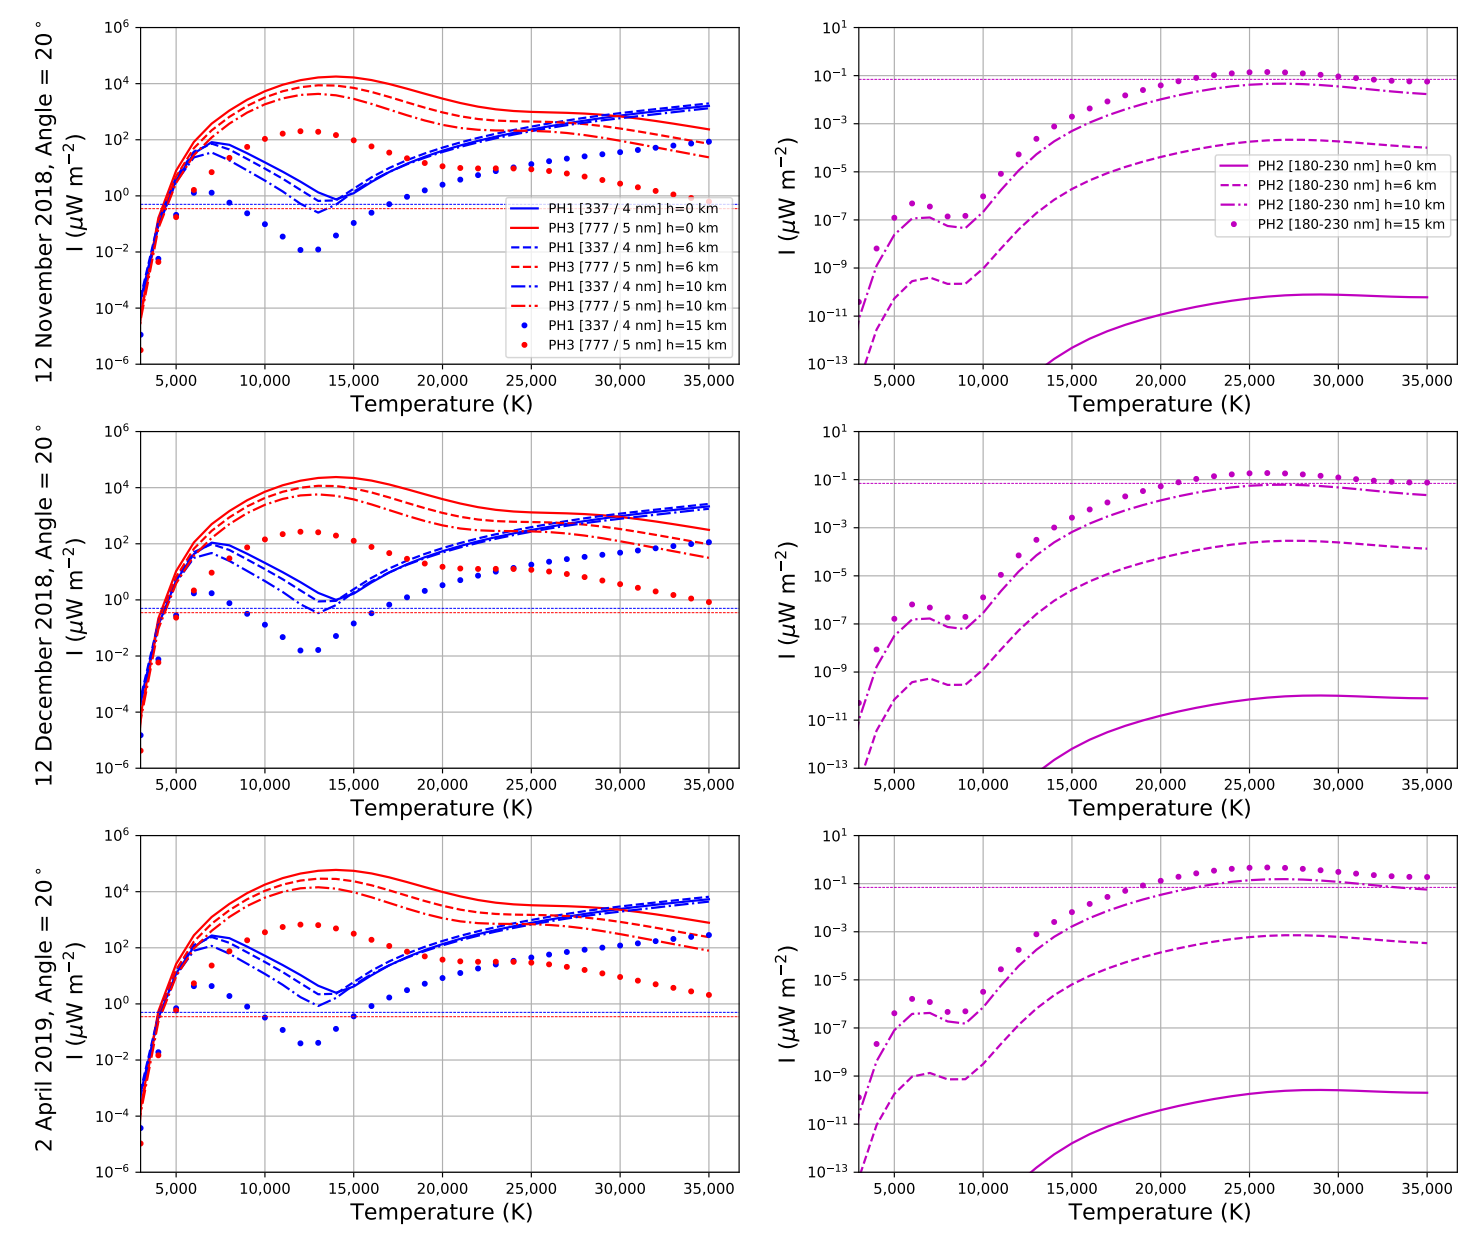
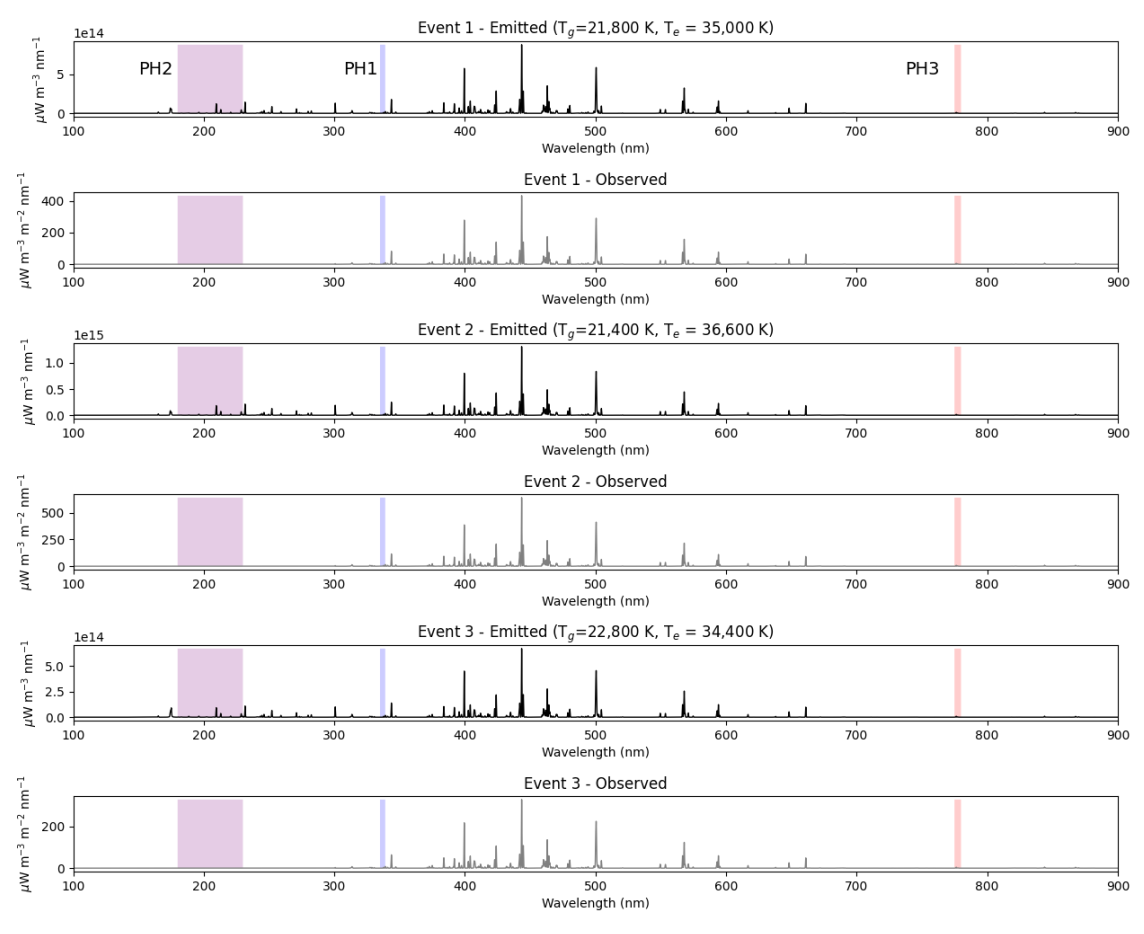
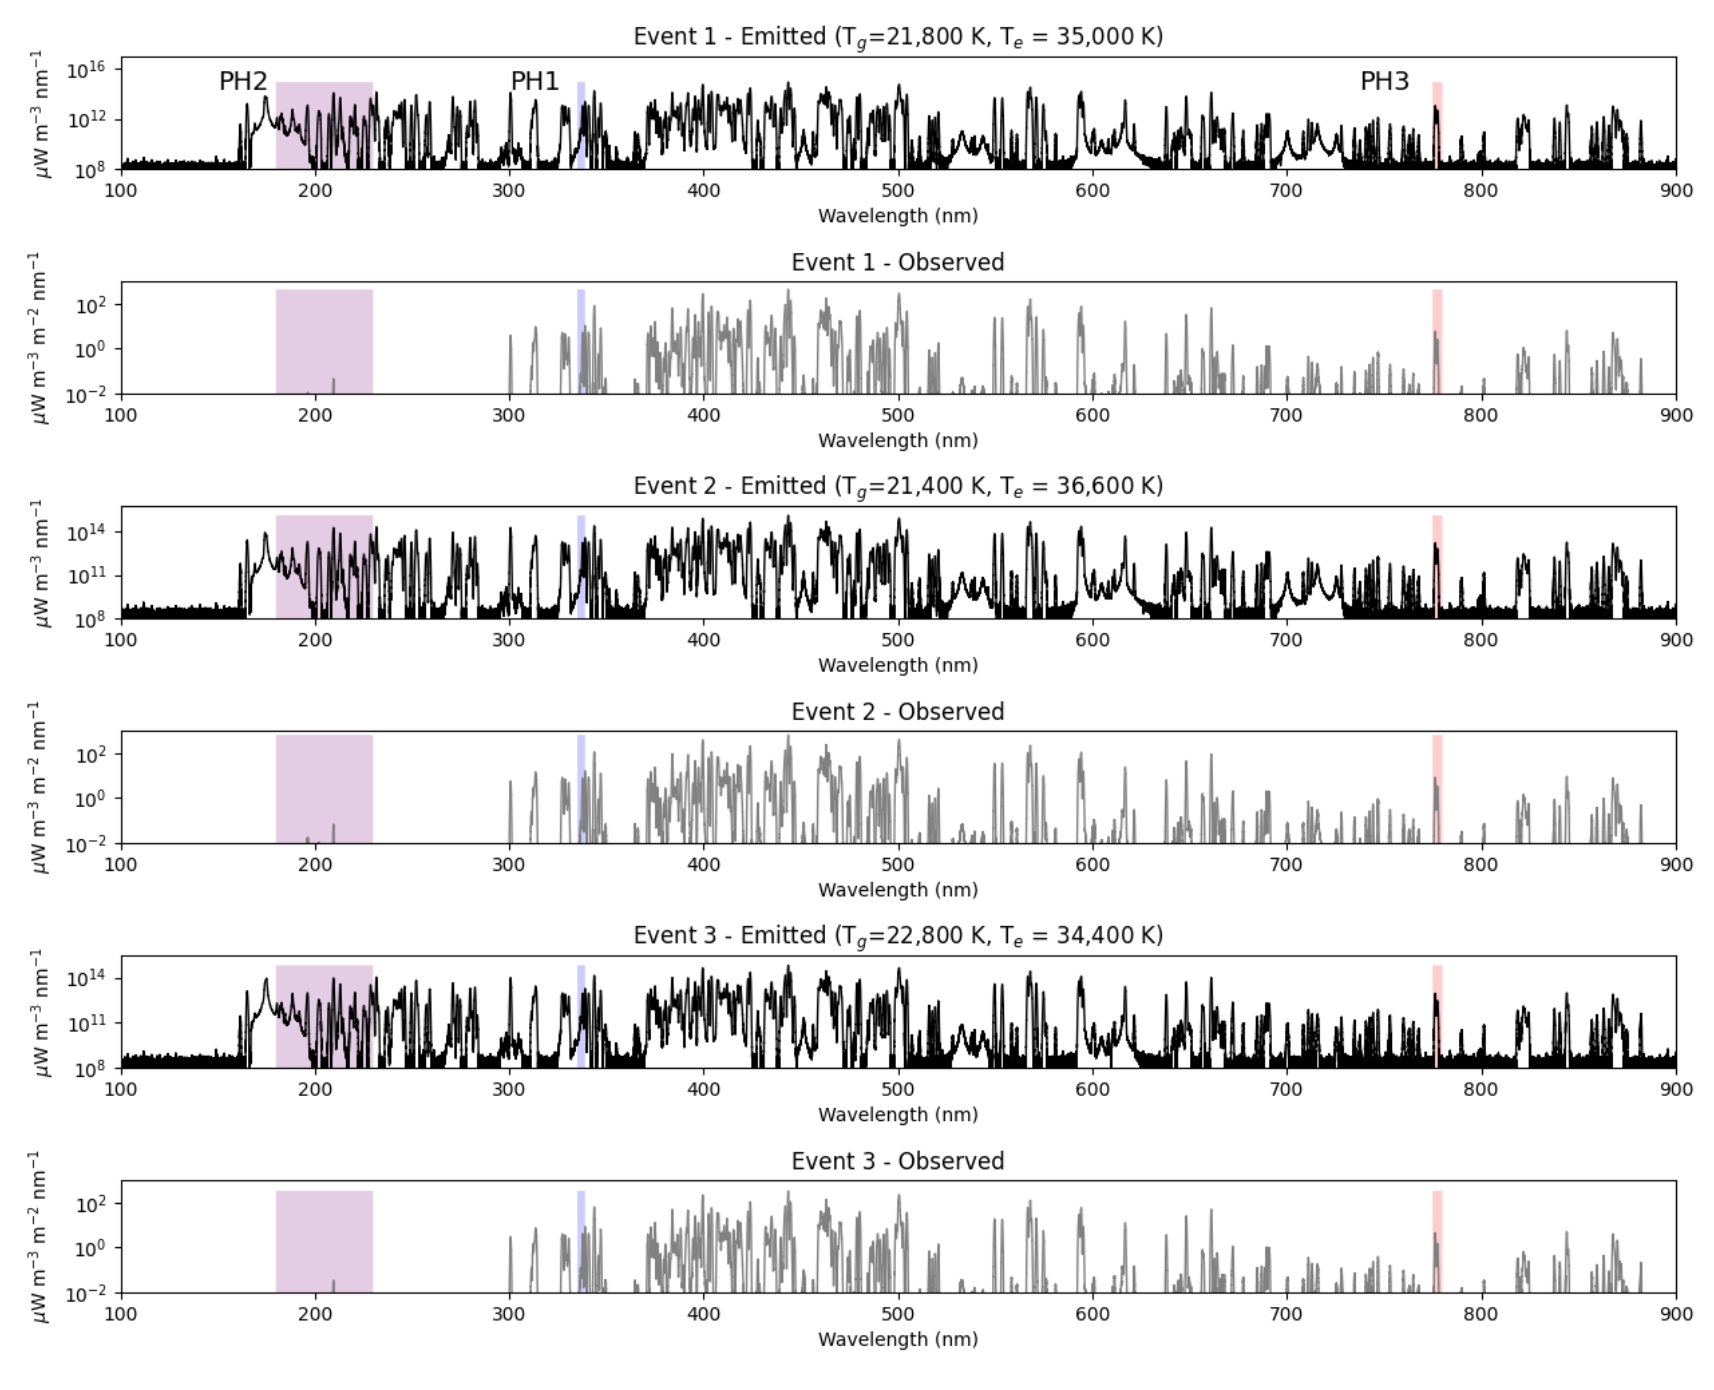
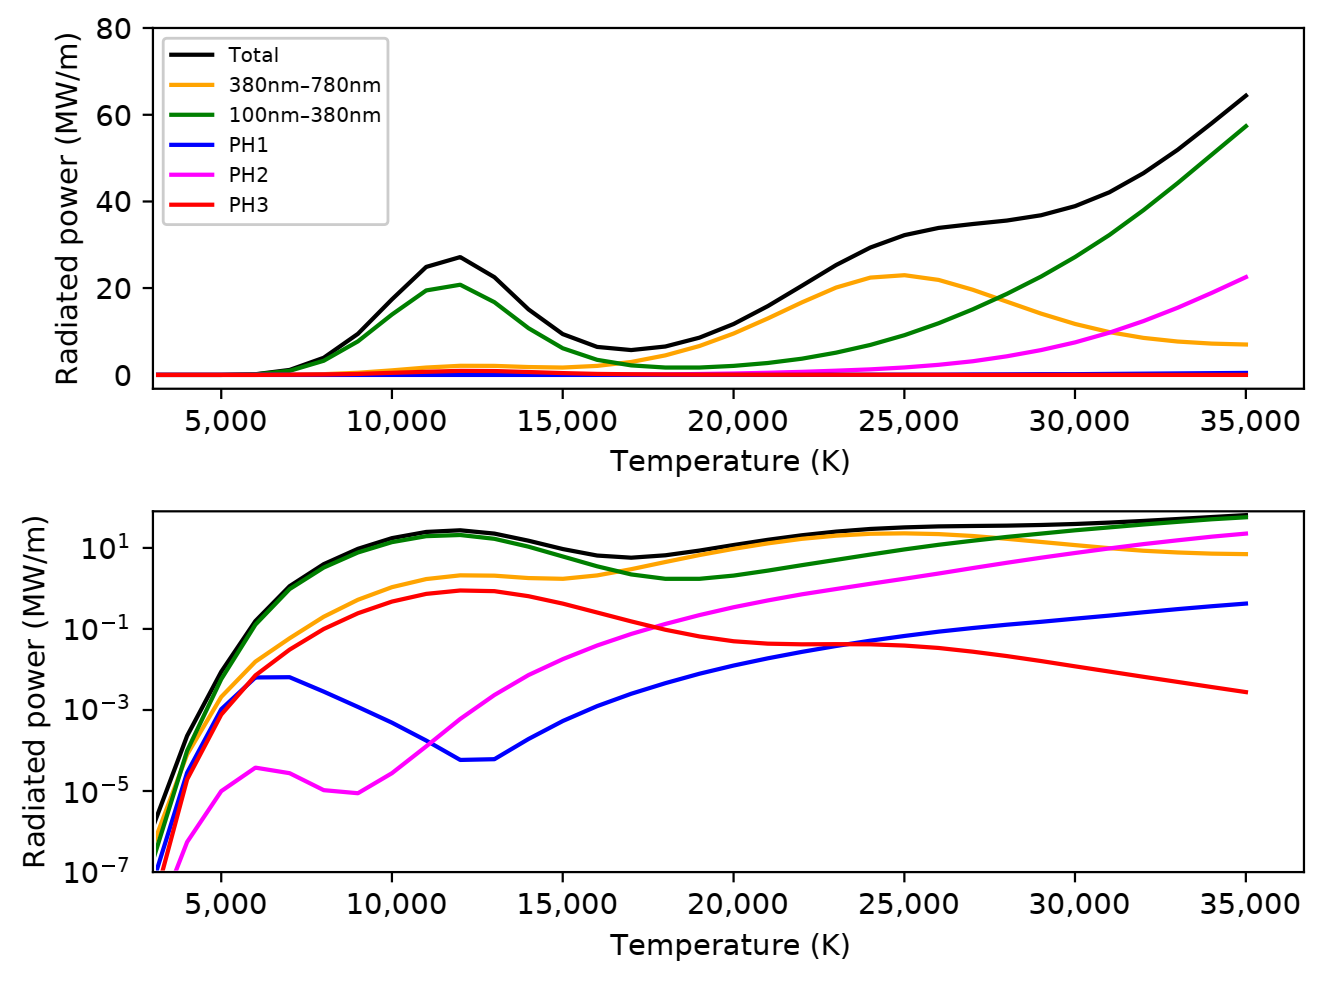
3. Results
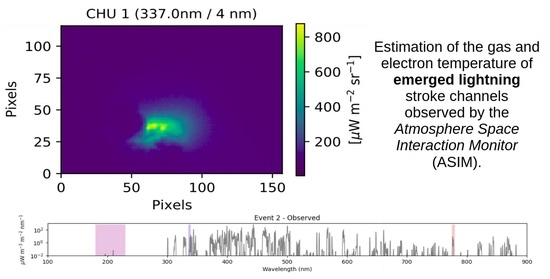
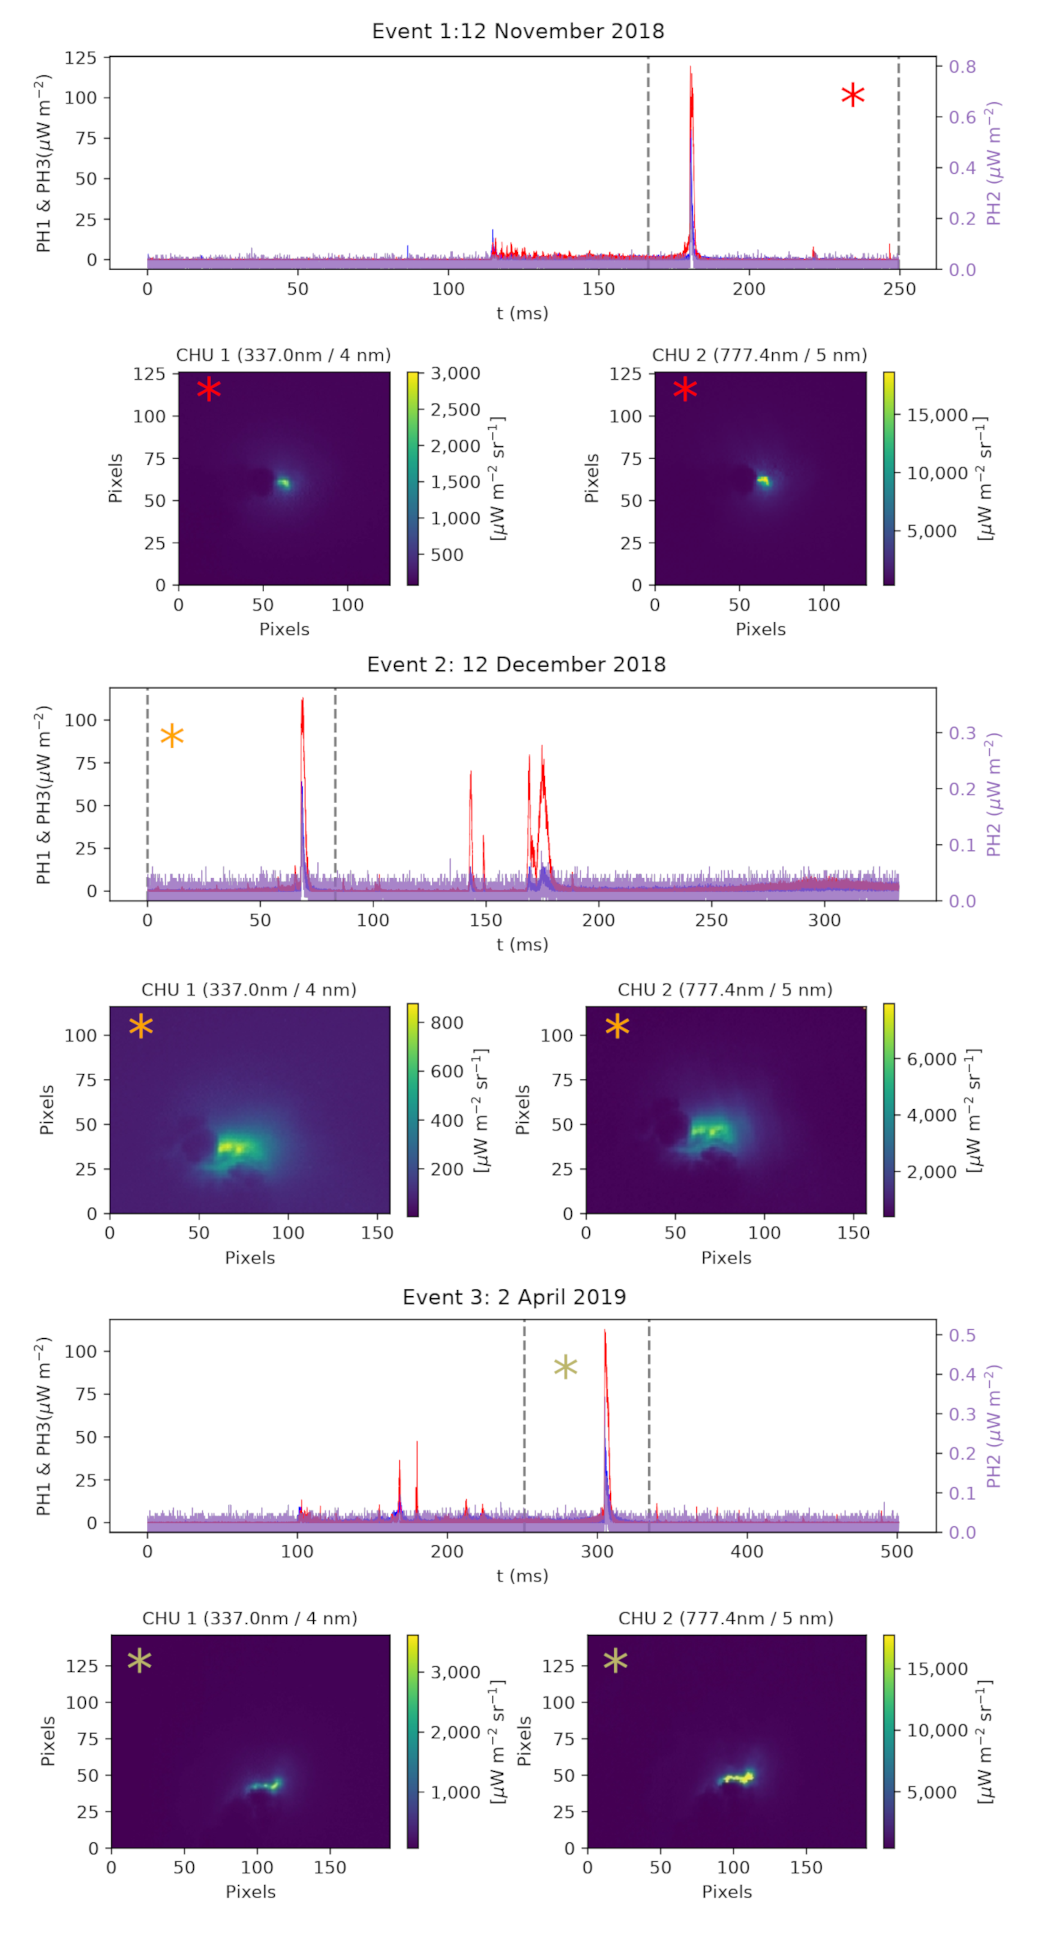
3.1. Events
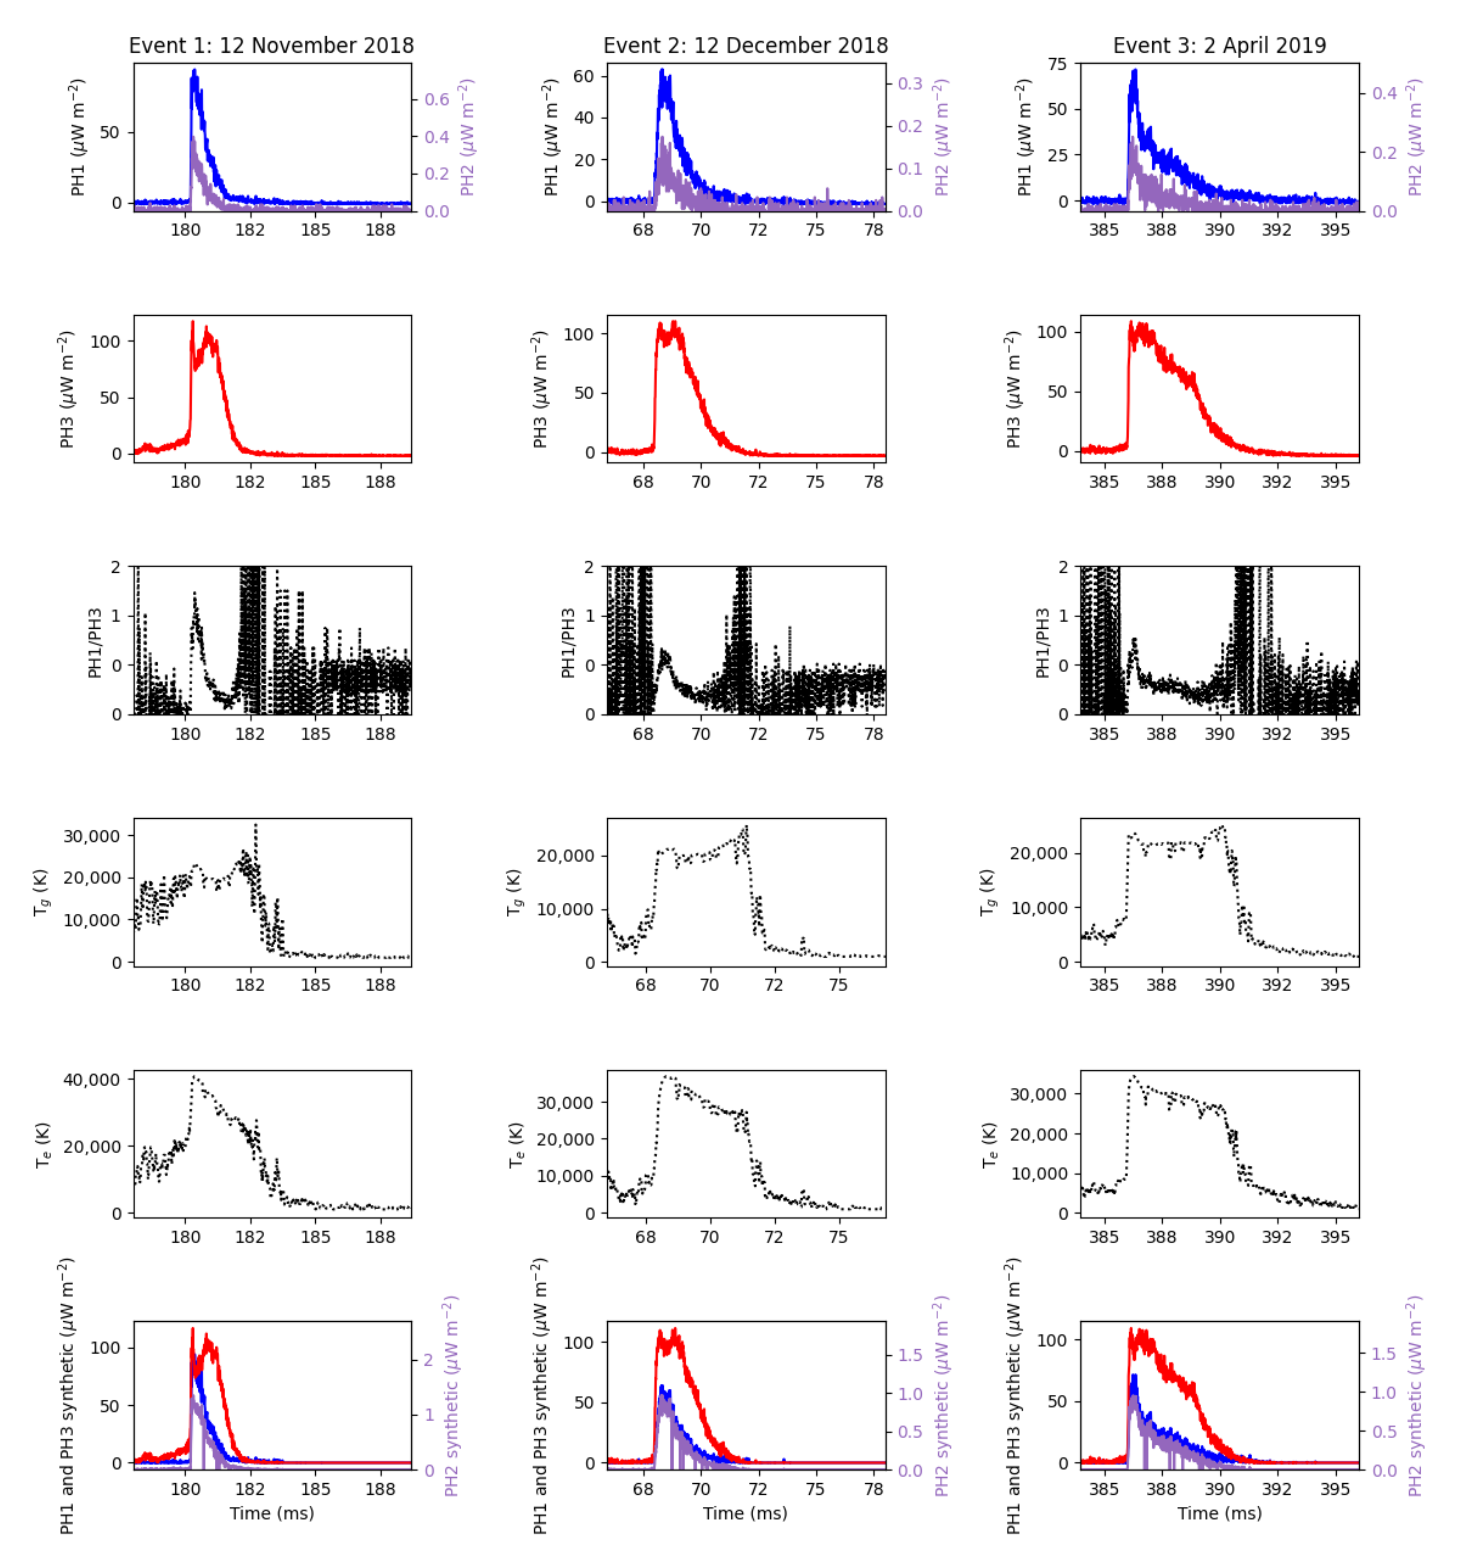
3.2. Analysis of ASIM-MMIA Measurements
4. Discussion and Conclusions
Author Contributions
Funding
Informed Consent Statement
Data Availability Statement
Acknowledgments
Conflicts of Interest
Abbreviations
| ASIM | Atmosphere Space Interaction Monitor |
| CCD | Charge-Coupled Device |
| CHU | Camera Head Units |
| CTH | Cloud Top Height |
| FPS | First Positive System |
| FUV | Far UltraViolet |
| ISUAL | Imager of Sprites and Upper Atmospheric Lightning |
| LBH | Lyman Birge Hopfield |
| LIS | Lightning Imaging Sensor |
| LTE | Local Thermal Equilibrium |
| MMIA | Modular Multispectral Imaging Array |
| MSG | Meteosat Second Generation |
| OTD | Optical Transient Detector |
| PH | Photometer |
| SPS | Second Positive System |
| T | Electron temperature |
| T | Gas temperature |
| TLEs | Transient Luminous Events |
| TRMM | Tropical Rainfall Measuring Mission |
| UTC | Universal Time Coordinated |
| UV | UltraViolet |
References
- Christian, H.J.; Blakeslee, R.J.; Boccippio, D.J.; Boeck, W.L.; Buechler, D.E.; Driscoll, K.T.; Goodman, S.J.; Hall, J.M.; Koshak, J.M.; Mach, D.M.; et al. Global frequency and distribution of lightning as observed from space by the Optical Transient Detector. J. Geophys. Res. 2003, 108, ACL 4-1. [Google Scholar] [CrossRef]
- Cecil, D.J.; Buechler, D.E.; Blakeslee, R.J. Gridded lightning climatology from TRMM-LIS and OTD: Dataset description. Atmos. Res. 2014, 135, 404–414. [Google Scholar] [CrossRef] [Green Version]
- Blakeslee, R.; Lang, T.; Koshak, W.; Buechler, D.; Gatlin, P.; Mach, D.; Stano, G.; Virts, K.; Walker, T.; Cecil, D.; et al. Three years of the Lightning Imaging Sensor onboard the International Space Station: Expanded Global Coverage and Enhanced Applications. Earth Space Sci. Open Arch. 2020, 35812, 83. [Google Scholar] [CrossRef]
- Walker, T.D. A 21st Century Investigation of the Lightning Spectrum. Ph.D. Thesis, School of Graduate Studies of the University of Alabama in Huntsville, Huntsville, AL, USA, 2015. [Google Scholar]
- Beirle, S.; Koshak, W.; Blakeslee, R.; Wagner, T. Global patterns of lightning properties derived by OTD and LIS. Nat. Hazards Earth Syst. Sci. 2014, 14, 2715–2726. [Google Scholar] [CrossRef] [Green Version]
- Marchand, M.; Hilburn, K.; Miller, S.D. Geostationary Lightning Mapper and Earth Networks lightning detection over the contiguous United States and dependence on flash characteristics. J. Geophys. Res. Atmos. 2019, 124, 11552–11567. [Google Scholar] [CrossRef]
- Rudlosky, S.D.; Goodman, S.J.; Virts, K.S.; Bruning, E.C. Initial geostationary lightning mapper observations. Geophys. Res. Lett. 2019, 46, 1097–1104. [Google Scholar] [CrossRef]
- Liu, Y.; Wang, H.; Li, Z.; Wang, Z. A verification of the lightning detection data from FY-4A LMI as compared with ADTD-2. Atmos. Res. 2021, 248, 105163. [Google Scholar] [CrossRef]
- Chang, S.C.; Kuo, C.L.; Lee, L.J.; Chen, A.B.; Su, H.T.; Hsu, R.R.; Frey, H.U.; Mende, S.B.; Takahashi, Y.; Lee, L.C. ISUAL far-ultraviolet events, elves, and lightning current. J. Geophys. Res. (Space Phys.) 2010, 115, A00E46. [Google Scholar] [CrossRef] [Green Version]
- Adachi, T.; Cummer, S.A.; Li, J.; Takahashi, Y.; Hsu, R.R.; Su, H.T.; Chen, A.B.; Mende, S.B.; Frey, H.U. Estimating lightning current moment waveforms from satellite optical measurements. Geophys. Res. Lett. 2009, 36, L18808. [Google Scholar] [CrossRef] [Green Version]
- Rakov, V.A.; Uman, M.A. Lightning Physics and Effects; Cambridge University Press: Cambridge, UK, 2003. [Google Scholar]
- Walker, T.D.; Christian, H.J. Triggered lightning spectroscopy: Part 1. A qualitative analysis. J. Geophys. Res. Atmos. 2017, 122, 8000–8011. [Google Scholar] [CrossRef]
- Walker, T.D.; Christian, H.J. Triggered lightning spectroscopy: 2. A quantitative analysis. J. Geophys. Res. Atmos. 2019, 124, 3930–3942. [Google Scholar] [CrossRef]
- Kieu, N.; Gordillo-Vázquez, F.J.; Passas, M.; Sánchez, J.; Pérez-Invernón, F.J.; Luque, A.; Montanyá, J.; Christian, H. Submicrosecond spectroscopy of lightning-like discharges: Exploring new time regimes. Geophys. Res. Lett. 2020, 47, e2020GL088755. [Google Scholar] [CrossRef] [PubMed]
- Kieu, N.; Gordillo-Vázquez, F.J.; Passas, M.; Sánchez, J.; Pérez-Invernón, F.J. High-speed spectroscopy of lightning-like discharges: Evidence of molecular optical emissions. J. Geophys. Res. Atmos. 2021, 126, e2021JD035016. [Google Scholar] [CrossRef]
- Orville, R.E. Spectrum of the lightning stepped leader. J. Geophys. Res. 1968, 73, 6999–7008. [Google Scholar] [CrossRef]
- Orville, R.E.; Salanave, L.E. Lightning Spectroscopy—Photographic Techniques. Appl. Opt. 1970, 9, 1775–1781. [Google Scholar] [CrossRef]
- Christian, H.; Frost, R.; Gillaspy, P.; Goodman, S.; Vaughan, O., Jr.; Brook, M.; Vonnegut, B.; Orville, R. Observations of optical lightning emissions from above thunderstorms using U-2 aircraft. Bull. Am. Meteorol. Soc. 1983, 64, 120–123. [Google Scholar] [CrossRef] [Green Version]
- Christian, H.; Goodman, S. Optical observations of lightning from a high-altitude airplane. J. Atmos. Ocean Technol. 1987, 4, 701–711. [Google Scholar] [CrossRef] [Green Version]
- Gigosos, M.A.; Gonzalez, M.A.; Cardenoso, V. Computer simulated Balmer alpha, beta and gamma Stark line profiles for non-equilibrium plasmas diagnostics. Spectrochim. Acta Part B At. Spectrosc. 2003, 58, 1489–1504. [Google Scholar] [CrossRef]
- Nikiforov, A.Y.; Leys, C.; Gonzalez, M.; Walsh, J. Electron density measurement in atmospheric pressure plasma jets: Stark broadening of hydrogenated and non-hydrogenated lines. Plasma Sources Sci. Technol. 2015, 24, 034001. [Google Scholar] [CrossRef]
- Prueitt, M.L. The excitation temperature of lightning. J. Geophys. Res. 1963, 68, 803–811. [Google Scholar] [CrossRef]
- Uman, M.A. Determination of lightning temperature. J. Geophys. Res. 1969, 74, 949–957. [Google Scholar] [CrossRef]
- Paris, P.; Aints, M.; Valk, F.; Plank, T.; Haljaste, A.; Kozlov, K.V.; Wagner, H.E. Intensity ratio of spectral bands of nitrogen as a measure of electric field strength in plasmas. J. Phys. D 2005, 38, 3894. [Google Scholar] [CrossRef] [Green Version]
- Šimek, M. Optical diagnostics of streamer discharges in atmospheric gases. J. Phys. D 2014, 47, 463001. [Google Scholar] [CrossRef]
- Hoder, T.; Simek, M.; Bonaventura, Z.; Prukner, V.; Gordillo-Vázquez, F.J. Radially and temporally resolved electric field of positive streamers in air and modelling of the induced plasma chemistry. Plasma Sources Sci. Technol. 2016, 25, 045021. [Google Scholar] [CrossRef]
- Bílek, P.; Obrusnik, A.; Hoder, T.; Šimek, M.; Bonaventura, Z. Electric field determination in air plasmas from intensity ratio of nitrogen spectral bands: II. Reduction of the uncertainty and state-of-the-art model. Plasma Sources Sci. Technol. 2018, 27, 085012. [Google Scholar] [CrossRef]
- Pérez-Invernón, F.J.; Luque, A.; Gordillo-Vazquez, F.J.; Sato, M.; Ushio, T.; Adachi, T.; Chen, A.B. Spectroscopic Diagnostic of Halos and Elves Detected From Space-Based Photometers. J. Geophys. Res. Atmos. 2018, 123, 12917–12941. [Google Scholar] [CrossRef]
- Malagón-Romero, A.; Pérez-Invernón, F.; Luque, A.; Gordillo-Vázquez, F.J. Analysis of the spatial non-uniformity of the electric field in spectroscopic diagnostic methods of atmospheric electricity phenomena. J. Geophys. Res. Atmos. 2019, 124, 12356–12370. [Google Scholar] [CrossRef] [PubMed]
- Neubert, T.; Østgaard, N.; Reglero, V.; Blanc, E.; Chanrion, O.; Oxborrow, C.A.; Orr, A.; Tacconi, M.; Hartnack, O.; Bhanderi, D.D. The ASIM mission on the International Space Station. Space Sci. Rev. 2019, 215, 26. [Google Scholar] [CrossRef] [Green Version]
- Chanrion, O.; Neubert, T.; Rasmussen, I.L.; Stoltze, C.; Tcherniak, D.; Jessen, N.C.; Polny, J.; Brauer, P.; Balling, J.E.; Kristensen, S.S.; et al. The Modular Multispectral Imaging Array (MMIA) of the ASIM payload on the International Space Station. Space Sci. Rev. 2019, 215, 28. [Google Scholar] [CrossRef] [Green Version]
- van der Velde, O.A.; Montanyà, J.; Neubert, T.; Chanrion, O.; Østgaard, N.; Goodman, S.; López, J.A.; Fabró, F.; Reglero, V. Comparison of high-speed optical observations of a lightning flash from space and the ground. Earth Space Sci. 2020, 7, e2020EA001249. [Google Scholar] [CrossRef]
- Montanyà, J.; López, J.A.; Morales Rodriguez, C.A.; van der Velde, O.A.; Fabró, F.; Pineda, N.; Navarro-González, J.; Reglero, V.; Neubert, T.; Chanrion, O.; et al. A Simultaneous Observation of Lightning by ASIM, Colombia-Lightning Mapping Array, GLM, and ISS-LIS. J. Geophys. Res. Atmos. 2021, 126, e2020JD033735. [Google Scholar] [CrossRef]
- López, J.A.; Montanyà, J.; van der Velde, O.; Romero, D.; Gordillo-Vázquez, F.J.; Pérez-Invernón, F.J.; Luque, A.; Morales, C.; Neubert, T.; Rison, W.; et al. Initiation of lightning flashes simultaneously observed from space and the ground: Narrow bipolar events. Atmos. Res. 2021, 268, 105981. [Google Scholar] [CrossRef]
- Soler, S.; Pérez-Invernón, F.J.; Gordillo-Vázquez, F.J.; Luque, A.; Li, D.; Malagón-Romero, A.; Neubert, T.; Chanrion, O.; Reglero, V.; Navarro-Gonzalez, J.; et al. Blue optical observations of narrow bipolar events by ASIM suggest corona streamer activity in thunderstorms. J. Geophys. Res. Atmos. 2020, 125, e2020JD032708. [Google Scholar] [CrossRef]
- Neubert, T.; Østgaard, N.; Reglero, V.; Chanrion, O.; Heumesser, M.; Dimitriadou, K.; Christiansen, F.; Budtz-Jørgensen, C.; Kuvvetli, I.; Rasmussen, I.L.; et al. A terrestrial gamma-ray flash and ionospheric ultraviolet emissions powered by lightning. Science 2020, 367, 183–186. [Google Scholar] [CrossRef] [PubMed]
- Soler, S.; Gordillo-Vázquez, F.J.; Pérez-Invernón, F.; Luque, A.; Li, D.; Neubert, T.; Chanrion, O.; Reglero, V.; Navarro-González, J.; Østgaard, N. Global frequency and geographical distribution of nighttime streamer corona discharges (BLUEs) in thunderclouds. Geophys. Res. Lett. 2021, 48, e2021GL094657. [Google Scholar] [CrossRef]
- Liu, F.; Lu, G.; Neubert, T.; Lei, J.; Chanrion, O.; Østgaard, N.; Li, D.; Luque, A.; Gordillo-Vázquez, F.J.; Reglero, V.; et al. Optical emissions associated with narrow bipolar events from thunderstorm clouds penetrating into the stratosphere. Nat. Commun. 2021, 12, 6631. [Google Scholar] [CrossRef]
- Neubert, T.; Chanrion, O.; Heumesser, M.; Dimitriadou, K.; Husbjerg, L.; Rasmussen, I.L.; Østgaard, N.; Reglero, V. Observation of the onset of a blue jet into the stratosphere. Nature 2021, 589, 371–375. [Google Scholar] [CrossRef]
- Luque, A.; Gordillo-Vázquez, F.J.; Li, D.; Malagón-Romero, A.; Pérez-Invernón, F.J.; Schmalzried, A.; Soler, S.; Chanrion, O.; Heumesser, M.; Neubert, T.; et al. Modeling lightning observations from space-based platforms (CloudScat. jl 1.0). Geosci. Model Dev. 2020, 13, 5549–5566. [Google Scholar] [CrossRef]
- Schmetz, J.; Pili, P.; Tjemkes, S.; Just, D.; Kerkmann, J.; Rota, S.; Ratier, A. An introduction to Meteosat second generation (MSG). Bull. Am. Meteorol. Soc 2002, 83, 977–992. [Google Scholar] [CrossRef]
- Liu, Q.; Li, Y.; Yu, M.; Chiu, L.S.; Hao, X.; Duffy, D.Q.; Yang, C. Daytime rainy cloud detection and convective precipitation delineation based on a deep neural Network method using GOES-16 ABI images. Remote Sens. 2019, 11, 2555. [Google Scholar] [CrossRef] [Green Version]
- Huang, Y.; Siems, S.; Manton, M.; Protat, A.; Majewski, L.; Nguyen, H. Evaluating Himawari-8 cloud products using shipborne and CALIPSO observations: Cloud-top height and cloud-top temperature. J. Atmos. Ocean Technol. 2019, 36, 2327–2347. [Google Scholar] [CrossRef] [Green Version]
- Godin, D.; Trépanier, J. A robust and efficient method for the computation of equilibrium composition in gaseous mixtures. Plasma Chem. Plasma Process. 2004, 24, 447–473. [Google Scholar] [CrossRef]
- Teulet, P.; Gonzalez, J.; Mercado-Cabrera, A.; Cressault, Y.; Gleizes, A. One-dimensional hydro-kinetic modelling of the decaying arc in air–PA66–copper mixtures: I. Chemical kinetics, thermodynamics, transport and radiative properties. J. Phys. D 2009, 42, 175201. [Google Scholar] [CrossRef]
- Gilmore, F.R.; Laher, R.R.; Espy, P.J. Franck-Condon Factors, r-Centroids, Electronic Transition Moments, and Einstein Coefficients for Many Nitrogen and Oxygen Band Systems. J. Phys. Chem. Ref. Data 1992, 21, 1005. [Google Scholar] [CrossRef] [Green Version]
- Ralchenko, Y.; Jou, F.C.; Kelleher, D.E.; Kramida, A.; Musgrove, A.; Reader, J.; Wiese, W.L.; Olsen, K.J. Nist Atomic Spectra Database (Version 3.1.0). 2006. Available online: https://www.nist.gov/publications/nist-atomic-spectra-database-version-310 (accessed on 7 April 2022).
- Capitelli, M.; Ferreira, C.M.; Gordiets, B.F.; Osipov, A.I. Plasma Kinetics in Atmospheric Gases; Atomic Optical and Plasma Physics; Springer: Berlin/Heidelberg, Germany, 2000. [Google Scholar]
- Gordillo-Vázquez, F.J.; Kunc, J.A. Statistical–mechanical calculations of thermal properties of diatomic gases. J. Appl. Phys. 1998, 84, 4693–4703. [Google Scholar] [CrossRef]
- Berk, A.; Anderson, G.P.; Acharya, P.K.; Bernstein, L.S.; Muratov, L.; Lee, J.; Fox, M.; Adler-Golden, S.M.; Chetwynd, J.H.; Hoke, M.L.; et al. MODTRAN 5: A reformulated atmospheric band model with auxiliary species and practical multiple scattering options: Update. In Algorithms and Technologies for Multispectral, Hyperspectral, and Ultraspectral Imagery XI; International Society for Optics and Photonics: Bellingham, WA, USA, 2005; Volume 5806, pp. 662–668. [Google Scholar]
- Molina, L.; Molina, M. Absolute absorption cross sections of ozone in the 185-to 350-nm wavelength range. J. Geophys. Res. Atmos. 1986, 91, 14501–14508. [Google Scholar] [CrossRef]
- Minschwaner, K.; Anderson, G.; Hall, L.; Yoshino, K. Polynomial coefficients for calculating O2 Schumann-Runge cross sections at 0.5/cm resolution. J. Geophys. Res. Atmos. 1992, 97, 10103–10108. [Google Scholar] [CrossRef]
- Ripoll, J.F.; Zinn, J.; Jeffery, C.A.; Colestock, P.L. On the dynamics of hot air plasmas related to lightning discharges: 1. Gas dynamics. J. Geophys. Res. Atmos. 2014, 119, 9196–9217. [Google Scholar] [CrossRef]
- Ripoll, J.F.; Zinn, J.; Colestock, P.L.; Jeffery, C.A. On the dynamics of hot air plasmas related to lightning discharges: 2. Electrodynamics. J. Geophys. Res. Atmos. 2014, 119, 9218–9235. [Google Scholar] [CrossRef]
- Pérez-Invernón, F.J.; Luque, A.; Gordillo-Vazquez, F.J. Modeling the chemical impact and the optical emissions produced by lightning-induced electromagnetic fields in the upper atmosphere: The case of halos and elves triggered by different lightning discharges. J. Geophys. Res. Atmos. 2018, 123, 7615–7641. [Google Scholar] [CrossRef]
- Da Silva, C.; Sonnenfeld, R.; Edens, H.; Krehbiel, P.; Quick, M.; Koshak, W. The plasma nature of lightning channels and the resulting nonlinear resistance. J. Geophys. Res. Atmos. 2019, 124, 9442–9463. [Google Scholar] [CrossRef]
- Wang, D.; Takagi, N.; Watanabe, T.; Rakov, V.; Uman, M.; Rambo, K.; Stapleton, M. A comparison of channel-base currents and optical signals for rocket-triggered lightning strokes. Atmos. Res. 2005, 76, 412–422. [Google Scholar] [CrossRef]
- Zhou, M.; Wang, D.; Wang, J.; Takagi, N.; Gamerota, W.; Uman, M.; Jordan, D.; Pilkey, J.; Ngin, T. Correlation between the channel-bottom light intensity and channel-base current of a rocket-triggered lightning flash. J. Geophys. Res. Atmos. 2014, 119, 13–457. [Google Scholar] [CrossRef] [Green Version]
- Zhou, M.; Fan, Y.; Wang, J.; Lu, Y.; Cai, L.; Li, Q.; Fan, Y. Experimental investigation on correlation between fast-front lightning current and the resultant arc channel luminosity. J. Electrost. 2020, 106, 103455. [Google Scholar] [CrossRef]


| Photometer | Molecular Transitions [46] | Atomic/Ionic Transitions [47] |
|---|---|---|
| PH1 (337/4 nm) | N(C, v = 0) → N(B, v = 0) | O II (337.7146 nm) |
| N II (336.734 nm) | ||
| PH2 (180–230 nm) | N(a, v = 0) → N(X, v = 6 … 11), N(a, v = 1) → N(X, v = 7 … 12), N(a, v = 2) → N(X, v = 8 … 13), N(a, v = 3) → N(X, v = 9 … 14), N(a, v = 4) → N(X, v = 9 … 15), N(a, v = 5) → N(X, v = 10 … 15), N(a, v = 6) → N(X, v = 11 … 16), N(a, v = 7) → N(X, v = 12 … 17), N(a, v = 8) → N(X, v = 12 … 18), N(a, v = 9) → N(X, v = 13 … 19), N(a, v = 10) → N(X, v = 14 … 20), N(a, v = 11) → N(X, v = 15 … 20), N(a, v = 12) → N(X, v = 15 … 21) , N(a, v = 13) → N(X, v = 16 … 21), N(a, v = 14 → N(X, v = 17 … 21), N(a, v = 15) → N(X, v = 17 … 21) | O II (182.1545 nm), O II (182.7276 nm), O II (182.9362 nm), O II (183.5906 nm), O II (189.3789 nm), O III (192.004 nm), O II (195.7441 nm), O II (195.8122 nm), O II (196.0265 nm), O II (196.2210 nm), O II (196.3793 nm), O II (196.4269 nm), O II (201.6589 nm), O II (202.0340 nm), O II (202.1445 nm), O II (202.3332 nm), O II (202.5694 nm), O II (202.7103 nm), O II (202.7603 nm), O II (207.22 nm), O II (207.2601 nm), O II (207.5169 nm), O II (209.2876 nm), O II (210.1283 nm), O II (212.3202 nm), O II (213.1818 nm), O II (213.1997 nm), O II (218.2580 nm), O II (219.0481 nm), O II (219.5464 nm), O II (221.5701 nm), O II (221.8679 nm), O II (224.9719 nm), O II (225.2746 nm), O II (225.9625 nm), O II (226.2685 nm), O II (228.3447 nm), O II (228.4836 nm), O II (229.0839 nm), O II (229.3301 nm), N III (180.4486 nm), N III (180.5669 nm), N III (184.642 nm), N III (188.506 nm), N III (188.522 nm), N III (190.799 nm), N III (191.955 nm), N III (191.977 nm), N III (192.065 nm), N III (192.084 nm), N III (192.130 nm), N III (206.401 nm), N III (208.034 nm), N II (209.553 nm), N II (209.620 nm), N II (209.686 nm), N III (211.759 nm), N III (211.150 nm), N II (213.018 nm), N II (214.278 nm), N III (214.731 nm), N II (220.609 nm), N II (228.669 nm), N II (228.844 nm) |
| PH3 (777.4/5 nm) | – | O I (777.194 nm). O I (777.417 nm). O I (777.539 nm), N II (776.224 nm) |
Publisher’s Note: MDPI stays neutral with regard to jurisdictional claims in published maps and institutional affiliations. |
© 2022 by the authors. Licensee MDPI, Basel, Switzerland. This article is an open access article distributed under the terms and conditions of the Creative Commons Attribution (CC BY) license (https://creativecommons.org/licenses/by/4.0/).
Share and Cite
Pérez-Invernón, F.J.; Gordillo-Vázquez, F.J.; Passas-Varo, M.; Neubert, T.; Chanrion, O.; Reglero, V.; Østgaard, N. Multispectral Optical Diagnostics of Lightning from Space. Remote Sens. 2022, 14, 2057. https://0-doi-org.brum.beds.ac.uk/10.3390/rs14092057
Pérez-Invernón FJ, Gordillo-Vázquez FJ, Passas-Varo M, Neubert T, Chanrion O, Reglero V, Østgaard N. Multispectral Optical Diagnostics of Lightning from Space. Remote Sensing. 2022; 14(9):2057. https://0-doi-org.brum.beds.ac.uk/10.3390/rs14092057
Chicago/Turabian StylePérez-Invernón, Francisco J., Francisco J. Gordillo-Vázquez, María Passas-Varo, Torsten Neubert, Olivier Chanrion, Victor Reglero, and Nikolai Østgaard. 2022. "Multispectral Optical Diagnostics of Lightning from Space" Remote Sensing 14, no. 9: 2057. https://0-doi-org.brum.beds.ac.uk/10.3390/rs14092057