
Upgrades of the Earth Networks Total Lightning Network in 2021


1
Earth System Science Center, University of Alabama in Huntsville, Huntsville, AL 35899, USA
2
Earth Networks, Germantown, MD 20874, USA
3
Now at Cooperative Institute for Severe and High-Impact Weather Research and Operations, University of Oklahoma, Norman, OK 73109, USA
*
Author to whom correspondence should be addressed.
Remote Sens. 2022, 14(9), 2209; https://0-doi-org.brum.beds.ac.uk/10.3390/rs14092209
Submission received: 31 March 2022
/
Revised: 28 April 2022
/
Accepted: 3 May 2022
/
Published: 5 May 2022
(This article belongs to the Special Issue Remote Sensing of Lightning and Its Applications in Atmospheric Electricity Studies)
Abstract
:The Earth Networks Total Lightning Network (ENTLN) launched a new processor (P2021) in December 2021. Some major upgrades were made in the new processor, including a new classification algorithm, a new propagation model, and regional data processing architecture. Ground-truth datasets of natural and rocket-triggered lightning acquired in Florida were used to evaluate the performance characteristics of the new processor. Compared to the last processor launched in 2015 (P2015), the stroke classification accuracy increased from 91% to 94% for natural lightning and from 86% to 88% for rocket-triggered lightning. The location accuracy improved significantly with the median location error decreasing from 215 m to 92 m. On a global scale, we found the number of pulses detected by the ENLTN increased in all regions with an overall detection gain of 149%. One can see modest gains in detection in regions with a fairly dense network of sensors and significant gains in regions where sensor density is much lower. Each of the major upgrades as well as their influences on the performance characteristics of the ENLTN are discussed.
1. Introduction
The Earth Networks Total Lightning Network (ENTLN) consists of over 1800 sensors deployed in over 100 countries that detect wideband electric field signals emitted by both intracloud (IC) and cloud-to-ground (CG) lightning [1]. The electric field signals recorded by the sensors are continuously sent back, in compressed data packets, to the central processor, where the geolocation of lightning is implemented in real-time using the time-of-arrival (TOA) technique. On average, the ENTLN reports about 50 lightning events per second worldwide. For each lightning event, time of occurrence, geolocation, event type, and peak current are reported by the ENTLN. The raw electric field waveforms from all ENTLN sensors are archived permanently, which allows for reprocessing in the future or use in scientific studies, e.g., [2,3].
The processor (i.e., data processing algorithms, including those for locating and classification) of the ENTLN underwent several upgrades throughout its lifetime to improve its detection efficiency, classification accuracy, and location accuracy. After each upgrade, the performance of the ENTLN was evaluated using independent datasets, such as high-speed video records [4], rocket-triggered lightning measurements [5], and satellite-based optical lightning observations [6,7,8]. The performance characteristics of the processor that was operational as of August 2015 (P2015) were evaluated using both natural and rocket-triggered lightning recorded in Florida [4]. In this study, the flash detection efficiency (DE), flash classification accuracy (CA), stroke DE, and stroke CA for P2015 were found to be 99%, 97%, 96%, and 91%, respectively, for natural lightning, and 100%, 97%, 97%, and 86%, respectively, for triggered lightning. In addition, the median location error and median peak current estimation error for triggered lightning were found to be 215 m and 15%, respectively. Compared with the previous processor (P2014), the most noticeable improvement of P2015 was the stroke CA, which increased by 23% for natural lightning and 42% for rocket-triggered lightning.
In December 2021, the ENLTN launched a new processor (P2021). The changes made in the new processor and its performance characteristics are discussed in this paper, which is organized as follows. In Section 2, we first show the performance characteristics of the P2021 evaluated using the same natural and rocket-triggered lightning datasets as we used for the performance evaluation of the older processor (P2015). The upgrades made in P2021 that led to different performance characteristics, including a new machine-learning classification algorithm, implementation of a new propagation model, and regional data processing architecture, are discussed in Section 3. We also showcase the performance characteristics of the new processor through some case studies in Section 4.
2. Performance Characteristics of P2021 Evaluated in Florida
The overall performance characteristics of P2021 evaluated in the North Central Florida region are shown in this section. The ground-truth datasets and methodology used for performance evaluation in this study are the same as those used in the evaluation study of P2015 [4]. Because the raw waveforms from ENTLN sensors are always archived, we generated the P2021 ENTLN evaluation dataset by running the same waveforms through the new processor, as if P2021 was operational when the ground-truth datasets were collected.
2.1. Ground-Truth Datasets
The ground-truth datasets contain two parts: natural CG lightning and rocket-triggered lightning, both recorded in North Central Florida. The datasets are summarized in Table 1. All the natural CG lightning flashes in the ground-truth dataset were simultaneously recorded by electric field change meters and high-speed video cameras at the Lightning Observatory in Gainesville (LOG) in 2014 and 2015. For return strokes in natural lightning, their time of occurrence and polarity were determined by the electric field measurements. All return strokes were confirmed with cloud-to-ground channels in video recordings. However, their ground-truth locations and peak currents are unknown. The natural lightning dataset can be used to evaluate the detection efficiency and classification accuracy of the ENTLN.
The rocket-triggered lightning dataset was acquired at Camp Blanding, Florida in the summers of 2014 and 2015. With the channel-base current measurements and the known location of the ground termination (the rocket launcher) for rocket-triggered lightning, peak current estimation error and location error can be additionally evaluated. The first strokes seen in natural lightning are absent in rocket-triggered lightning. Instead, rocket-triggered lightning begins with an initial stage that is composed of an upward positive leader and initial continuous current. Both the initial stage (in rocket-triggered lightning) and first strokes (in natural lightning) provide the conditioned channel for the development of the following subsequent strokes. Therefore, all return strokes in rocket-triggered lightning are similar to subsequent return strokes in natural lightning [9,10]. The performance of the ENTLN evaluated using rocket-triggered lightning as ground-truth data is only applicable to negative subsequent strokes in natural lightning.
2.2. Methodology
The criteria for searching for the ENTLN pulse that corresponds to a stroke in the ground-truth dataset is described in the P2015 evaluation study [4]. For every return stroke in the ground-truth datasets, we identified all the ENTLN-reported pulses (if any) in a 2 ms time window (±1 ms relative to the GPS time of the ground truth return stroke) and within 40 km of the LOG (or Camp Blanding for rocket-triggered lightning). A stroke is considered as a missed event if no ENTLN pulses were found meeting the criteria. If the detected ENTLN pulse was reported as a CG, we regard it as a correctly classified event. Otherwise, it is considered as misclassified. For rare cases of multiple pulses reported by the ENTLN in the search window, we used the pulse that was temporally closest to that of the ground-truth stroke.
2.3. Performance Characteristics
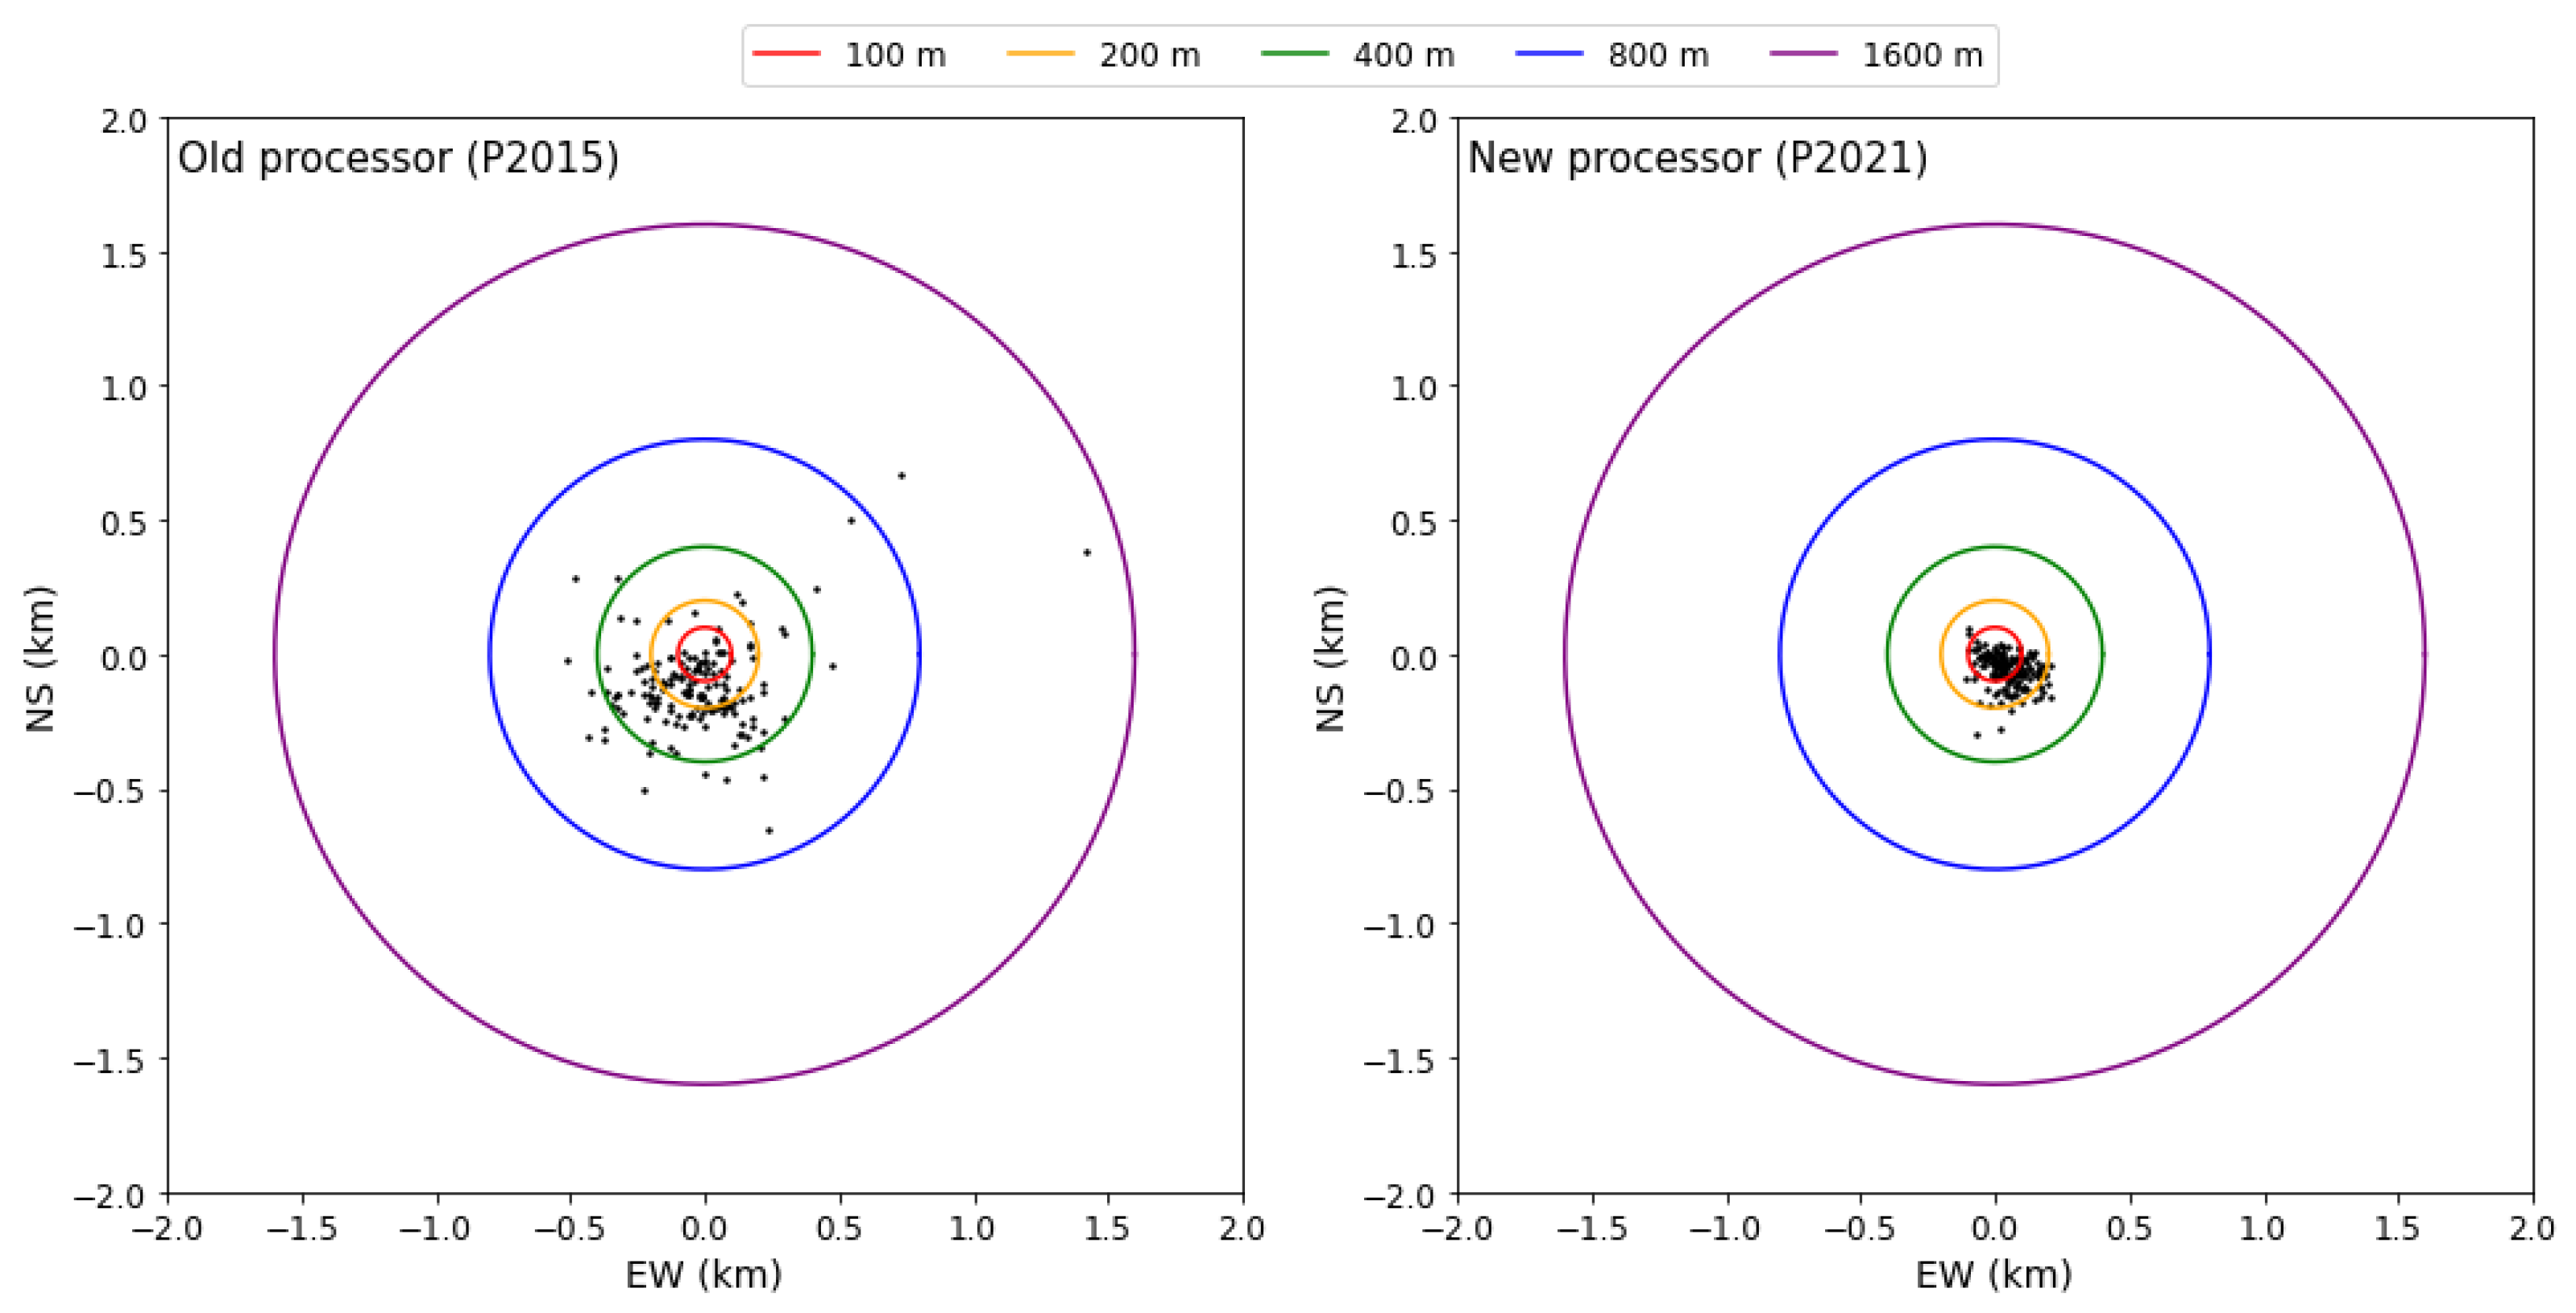
The performance characteristics of P2021 evaluated using the natural and rocket-triggered lightning datasets are summarized in Table 2 and Table 3, respectively. The performance characteristics of the old processor (P2015), which were evaluated using the same ground-truth datasets, are also given in these tables for comparison. Compared to P2015, both the flash and stroke detection efficiencies of P2021 are similarly good. The stroke classification accuracy increased from 91% to 94% for natural lightning and from 86% to 88% for rocket-triggered lightning. The location accuracy improved significantly, with the median location error decreasing from 215 m to 92 m. The median peak current estimation error slightly improved from 15% to 13%. The locations of ENTLN pulses corresponding to return strokes in rocket-triggered lightning that are detected by P2015 and P2021 are shown in Figure 1.
3. Upgrades
3.1. Location
Figure 1 and Table 3 show that the median location error of P2021 is less than half that of P2015. The improvement in location accuracy comes from (1) the correction of arrival time delays due to propagation effects, and (2) locating lightning in oblate spheroidal coordinates.
It is known that electromagnetic waves produced by lightning propagate over ground with finite conductivity are distorted. The lossy ground acts as a low-pass filter and the higher frequency component of the electromagnetic waves attenuates more. As a result, a lightning-produced field pulse has a longer rise time (become less sharp) after propagating a longer distance over finitely conducting ground, e.g., [11,12]. For a lightning locating system that uses the peak-finding and time-of-arrival techniques, the elongation of the rise time of field pulses causes delayed arrival times at sensors, which contributes to location errors, e.g., [13]. An empirical arrival time correction has been implemented in P2021 using the rocket-triggered lightning data. To do this, the delayed arrival time of the signal from a triggered return-stroke was modeled as
where the return-stroke time, tRS, and the distance from lightning to ENTLN sensors, D, are both precisely known for triggered lightning. The correction factor, is then found by comparing the measured () and expected () sferic arrival times at all detected ENTLN sensors.
In P2015, the lightning location was implemented in Cartesian coordinates, in which electromagnetic waves follow line-of-sight propagation. This is a reasonably good approximation when lightning is within a few hundred kilometers of a sensor. In truth, the low-frequency ground waves propagate along the earth’s curvature because the long wavelengths allow them to be diffracted around obstacles. The influence of the curved path becomes more obvious as the distance between lightning and a sensor becomes larger. In P2021, the lightning location is directly implemented in oblate spheroidal coordinates, in which the distance between two points was treated as a curved path instead of a straight line. This change also contributes to the improved location accuracy for P2021, and such improvement is more noticeable for regions with sparse ENTLN sensors.
3.2. Classification
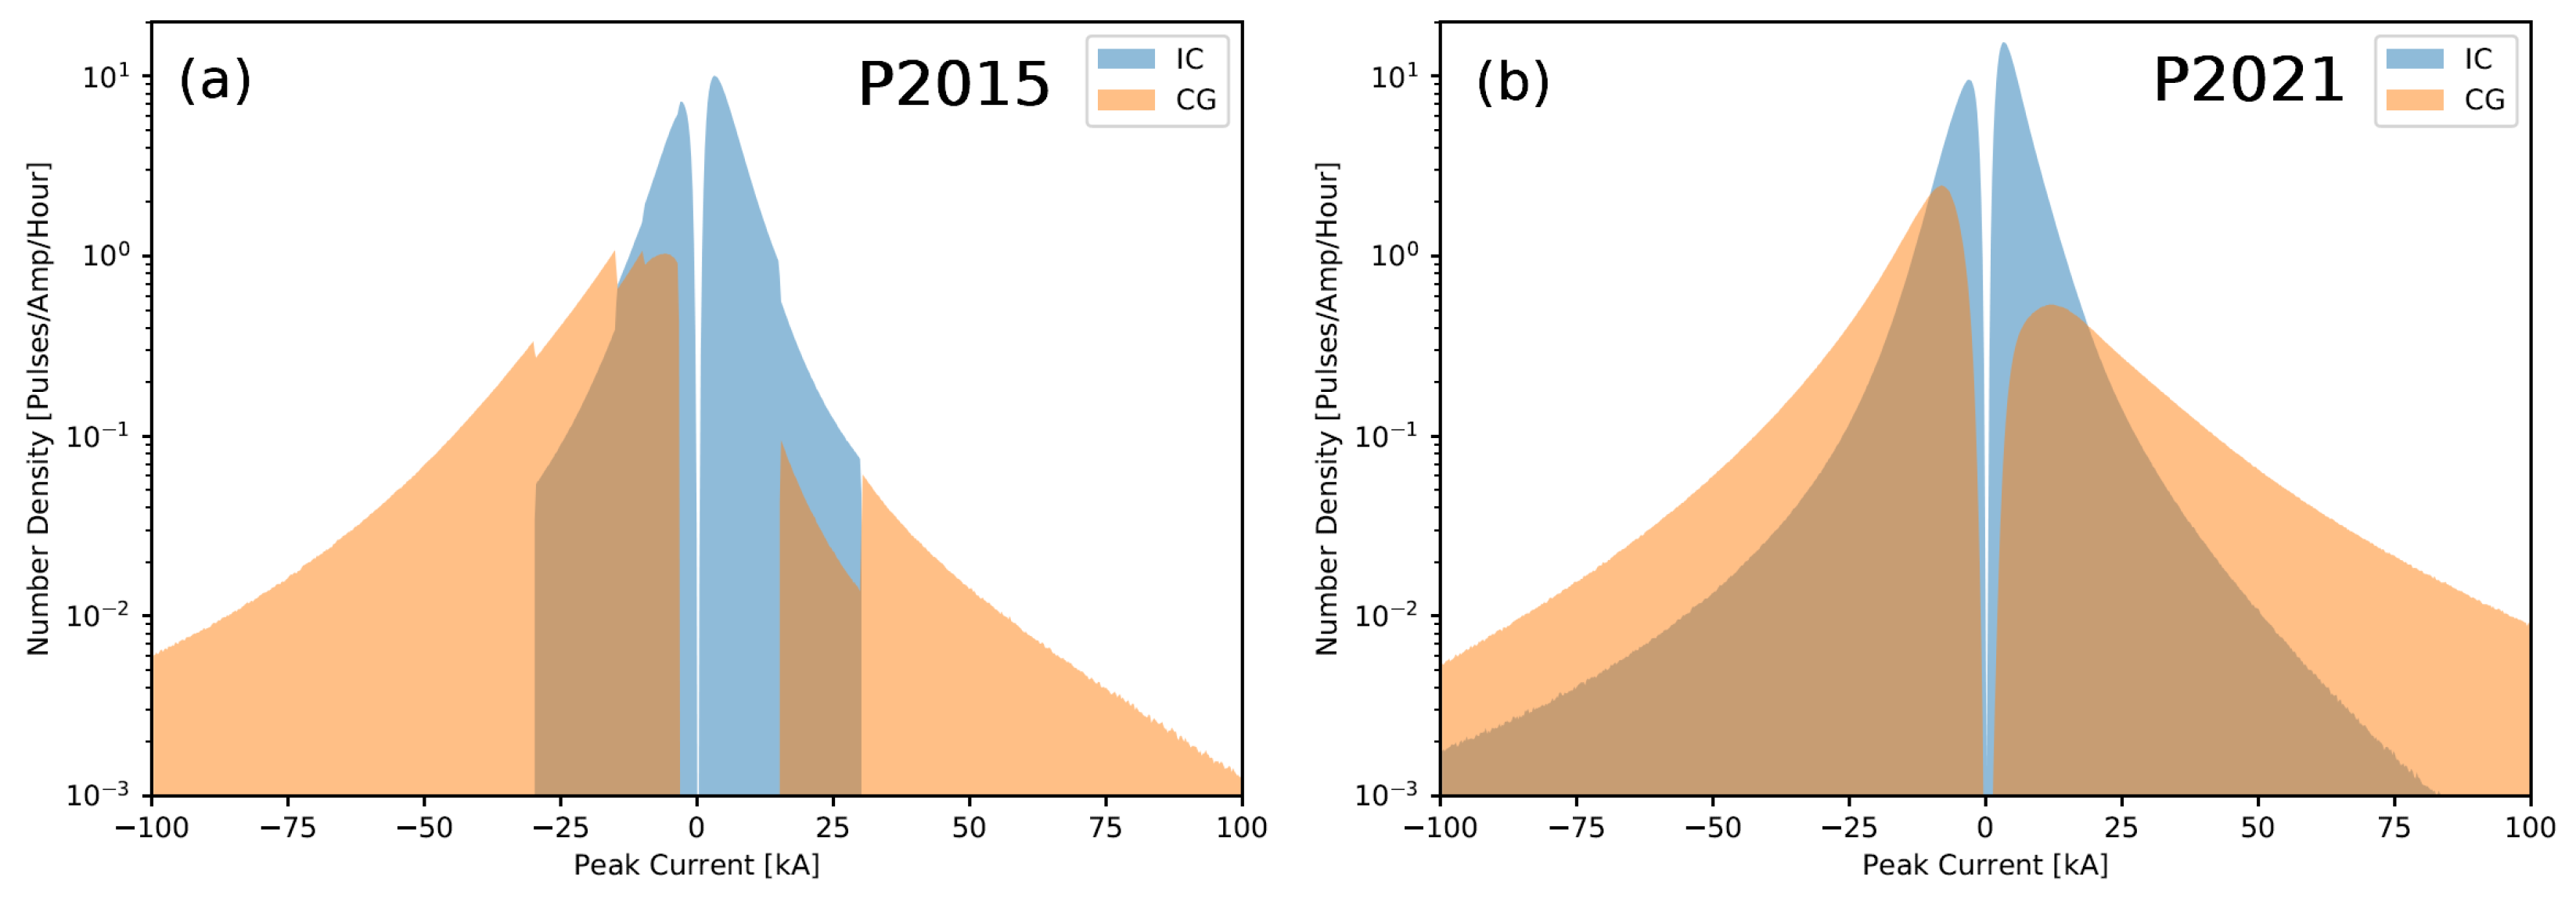
The classification algorithm for P2021 is completely different from that of P2015. In the algorithm of P2015, lightning classification was done using a decision tree based on a number of different waveform parameters (e.g., risetime, half peak width). While the classification accuracy of P2015 validated in Florida is reasonably good, sharp artifacts occurred when the parameter crossed from one side of the decision boundary to the other. This effect is particularly noticeable in peak current, and can be seen in the IC/CG peak current distributions shown in Figure 2a. For example, there are no pulses with peak current amplitude greater than 30 kA identified as ICs by P2015. In addition, there are no pulses with peak currents less than 15 kA identified as +CGs by P2015.
The new algorithm classifies lightning based on similar waveform parameters, but instead of a decision tree, P2021 uses a machine-learning algorithm based on a modified logistic regression. Logistic regression is an easily interpretable classification technique that predicts a binary classification and also probability for the classification. This method was chosen because it is not susceptible to the abrupt classification artifacts of the decision tree. It provides a confidence of the resulting classification, and the internals of the algorithm are transparent enough that is possible to ensure classification continues to behave properly in all edge cases. The details regarding developing this algorithm will be a subject of a future study, and only its validation will be covered here. To train the classification algorithm, a vastly expanded ground-truth dataset was laboriously compiled by manually classifying waveforms. While the new algorithm has a slightly improved stroke classification accuracy compared to that of P2015 (see Table 2 and Table 3), more importantly, the artifacts of the P2015 algorithm have been completely removed. As a result, the peak current distributions (Figure 2b) of P2021 are much more realistic compared to those reported in the literature, e.g., [14,15]. In addition, the new classification algorithm provides a probabilistic certainty that the classification is correct, which is a valuable metric for prediction uncertainty.
An example of the improvements provided by the new classification algorithm can be seen in how it performs on compact intracloud discharges (CIDs, also known as narrow bipolar events (NBEs)). It is a known issue that powerful CIDs are highly likely to be misclassified by lightning locating systems. For 1022 CIDs reported by Leal et al. [16], the misclassification rates were 78% and 56% for the National Lightning Detection Network (NLDN) and the ENTLN, respectively. They also found the percentage of misclassified CIDs becomes even higher for higher intensity events. To test if the new classification algorithm of P2021 has resolved this issue, we manually identified 1000 CIDs for each polarity based on the distinctive features of their waveforms. We found that only 5% out of a total of 2000 CIDs were misclassified by the P2021 as CGs.
3.3. Detection
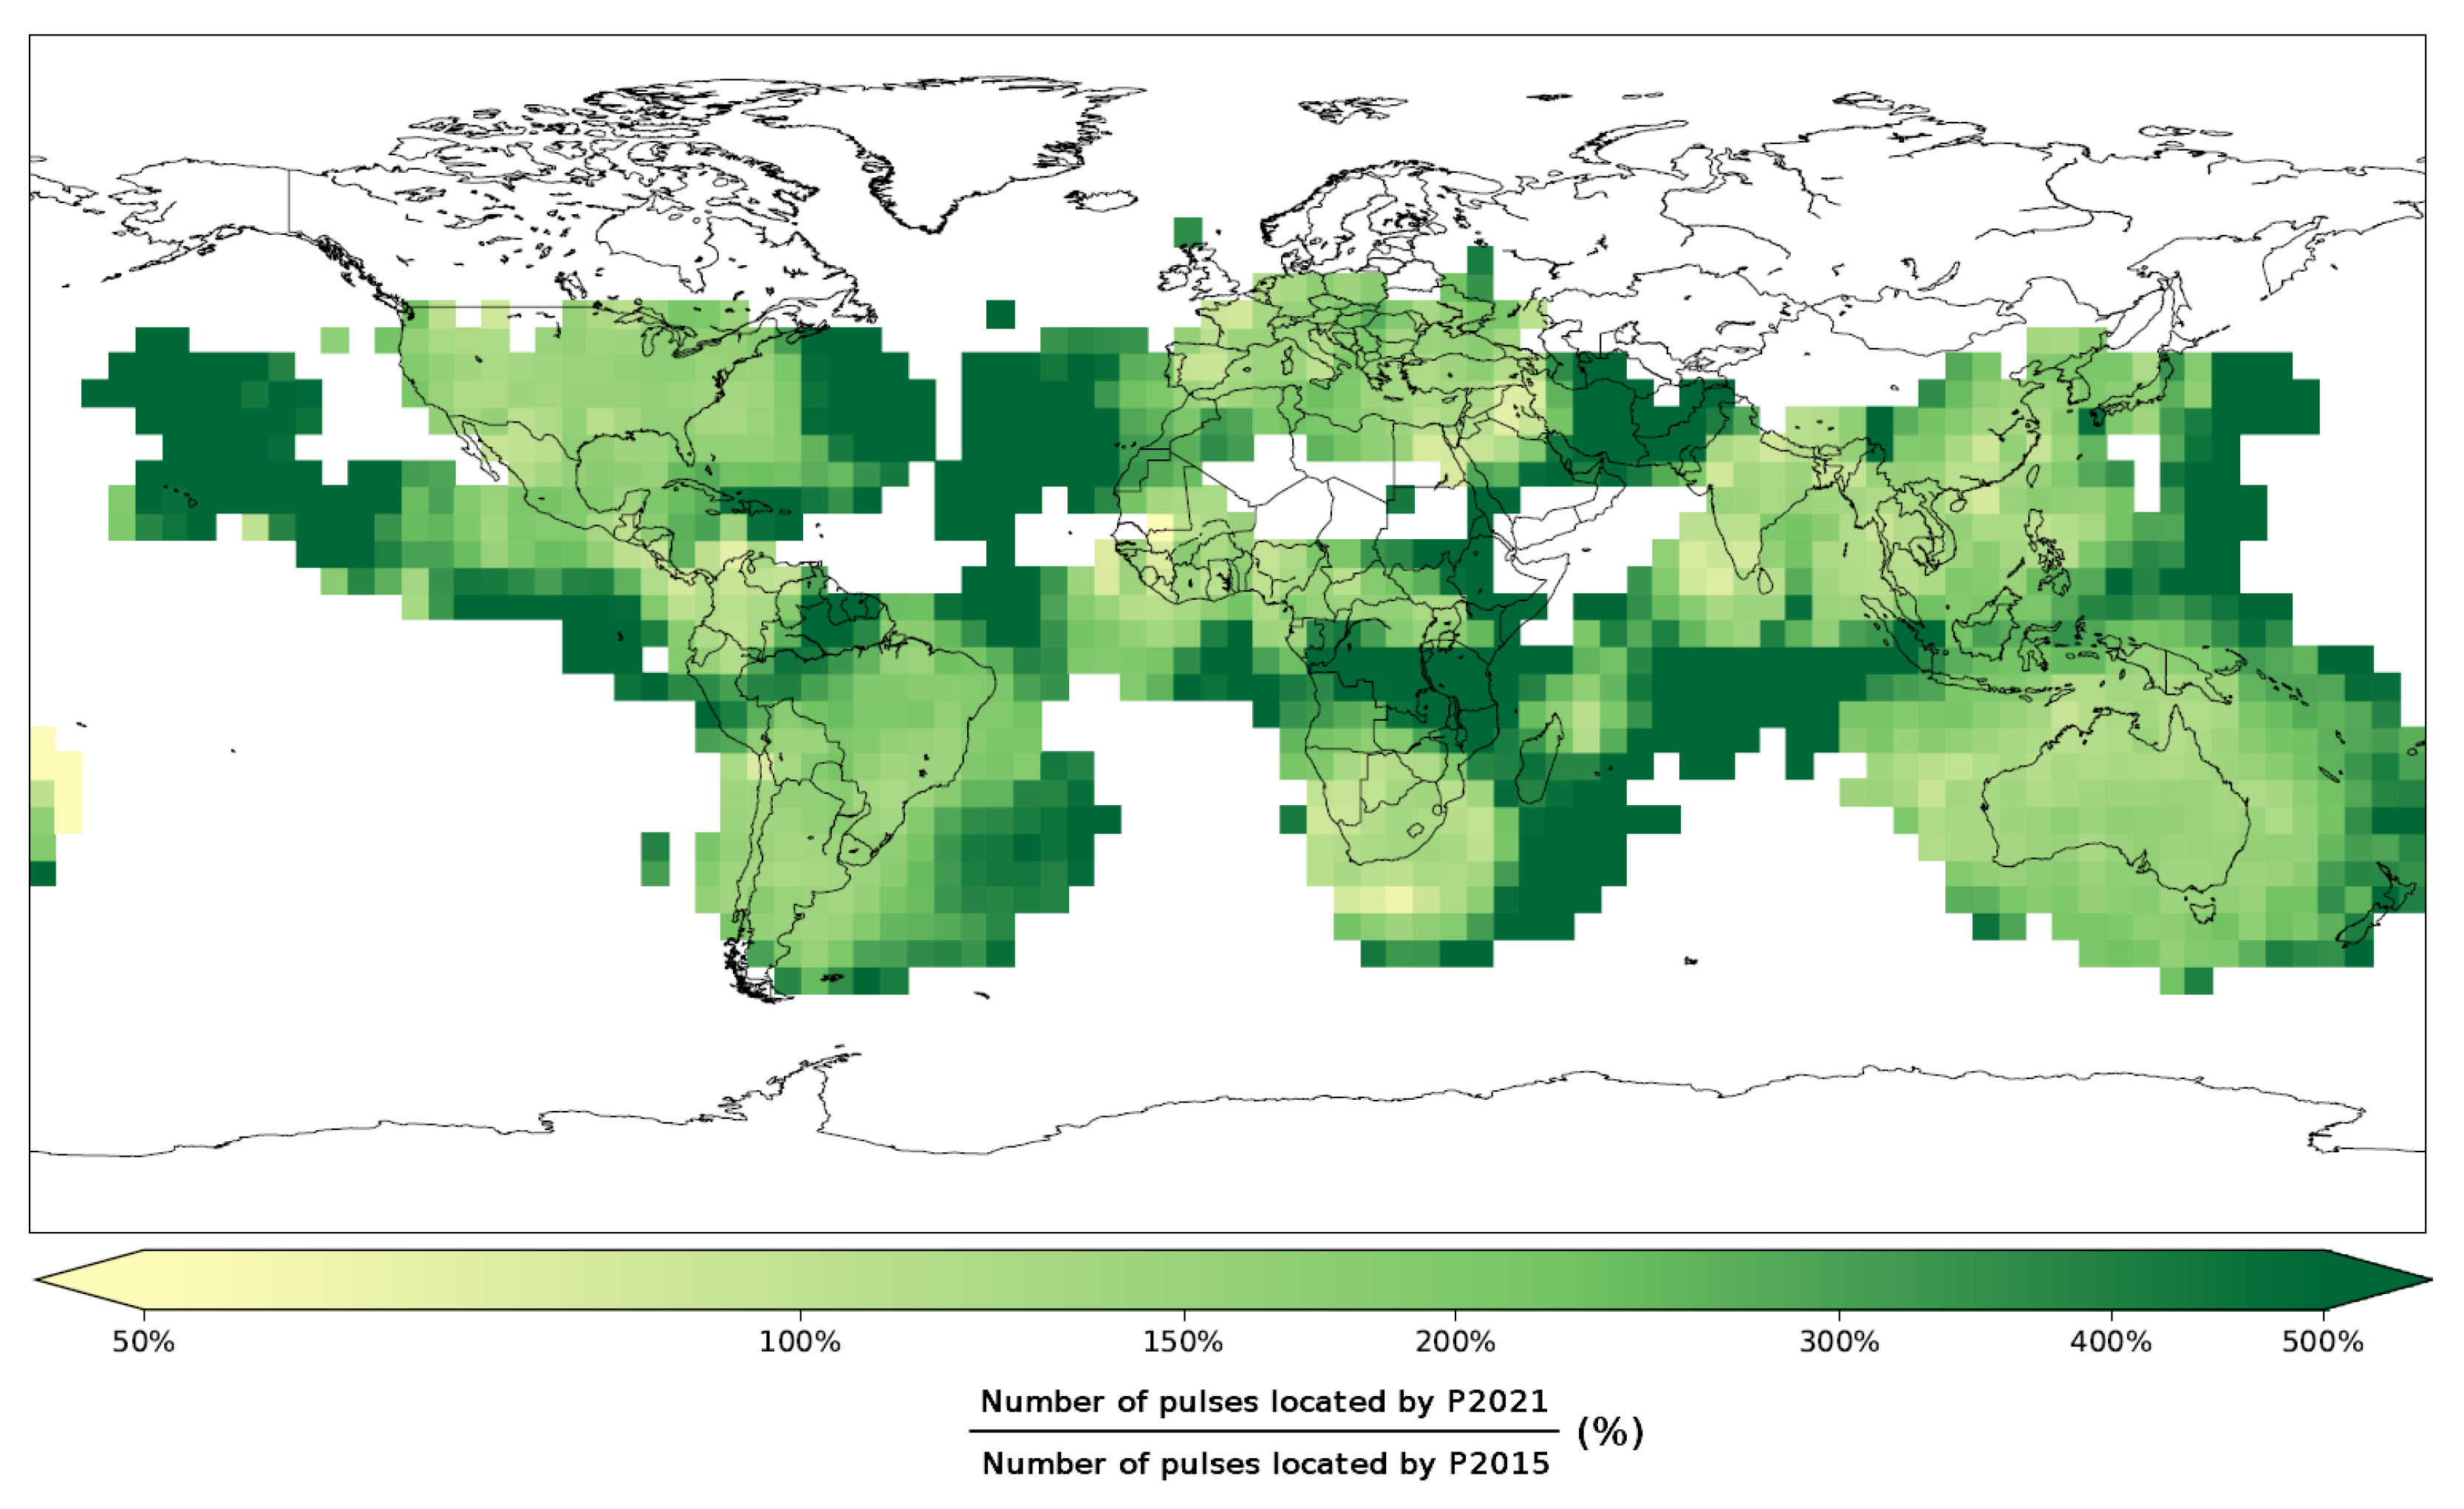
Several upgrades were made in the P2021 to improve the number of flashes/pulses detected. As shown in Table 4, the P2021 outperforms the P2015 in detection in all regions. Note the detection gains shown here are gains for only ENTLN-detected pulses and contributions from the World Wide Lightning Location Network (WWLLN) were excluded in the comparison. The detection gains in some regions are better than others with Africa experiencing the largest gains and Australia the smallest. The gains in detection for the world are shown in Figure 3. The overall trend is that P2021 sees modest detection gains in regions of the world with a fairly dense network of sensors (e.g., the Contiguous United States and Australia). The detection gains are significantly larger in regions where sensor density is much lower, such as off the coasts. For even more remote regions of the world, Earth Networks leverages its partnership with the WWLLN to supplement the data. These contributions are particularly important in regions where it is impossible to deploy sensors, such as the Pacific Ocean.
The first major change made in P2021 that led to the improved detection was implementing the regional processing architecture. In P2021, the world was split into a number of regions. Each region has the waveform data from all sensors all over the world to be used as inputs but only looks for lightning within the bounds of the region. A grid-based location approach is implemented in an iterative manner for every second of data arriving at the processor. First, the region is split into relatively large cells, and each one of those cells searches for lightning within its bounds through an approximate (and thus quick) TOA location calculation. If a cell contains lightning, that cell is split up into smaller cells, and each smaller cell performs the same search again with stricter constraints. This continues for a set number of iterations until initial lightning location guesses in the region are accurate enough and achieve an appropriate spatial resolution for the TOA optimizer. A better initial guess reduces the likelihood that the optimizer fails to converge to a solution.
The improved calculation of the ground wave propagation path (discussed in Section 3.1) also contributes to the improved detections, especially when detecting lightning that is distant from the network. Improving the distance calculation results in improved agreements in the arrival times of the electric field waveform peaks for the sensors involved in the location, thereby reducing the chance that real lightning gets rejected due to inadequate quality criteria.
Regional processing also allows each region to have its own processing configuration, which provides the ENTLN the flexibility to have customized parameters in the processing algorithms for each different region. First, the P2021 implemented a sophisticated probabilistic model involving a set of quality metrics to calculate the confidence of a solution, which better discerns if a solution is real lightning or noise. This probabilistic model is trained for each region individually and allows for maximal performance for each set of unique parameters (e.g., sensor density and environmental factors). Furthermore, the threshold criteria for deciding between real and false detections is also regional dependent. This threshold directly relates to the balance between detection efficiency and false alarm rate. For example, for a region with high sensor density, where the detection efficiency is high, stricter source/noise discrimination criteria by raising the threshold for confidence score of a solution are used in the configuration to achieve a very low false alarm rate (by reducing noise contamination in solutions). For a region where sensor density is low, the configuration will be set to achieve higher detection efficiency while allowing slightly higher false alarm rate. This regional processing also allows future possibilities for different regions covered by the ENTLN to have different IC/CG classifiers trained with local lightning data and also finer propagation correction models that better fit the local terrain and ground conductivity.
4. Case Studies
In the following section, we present some case studies to compare the performance of P2015 versus P2021. We present two case studies, the first in Africa and the other in Hawaii. Both are regions of moderate-to-low sensor density and experience the most dramatic performance gains. In these regions, P2015 relied heavily on the WWLLN to provide lightning locations, with the WWLLN frequently outperforming the ENTLN at very long ranges from the network.
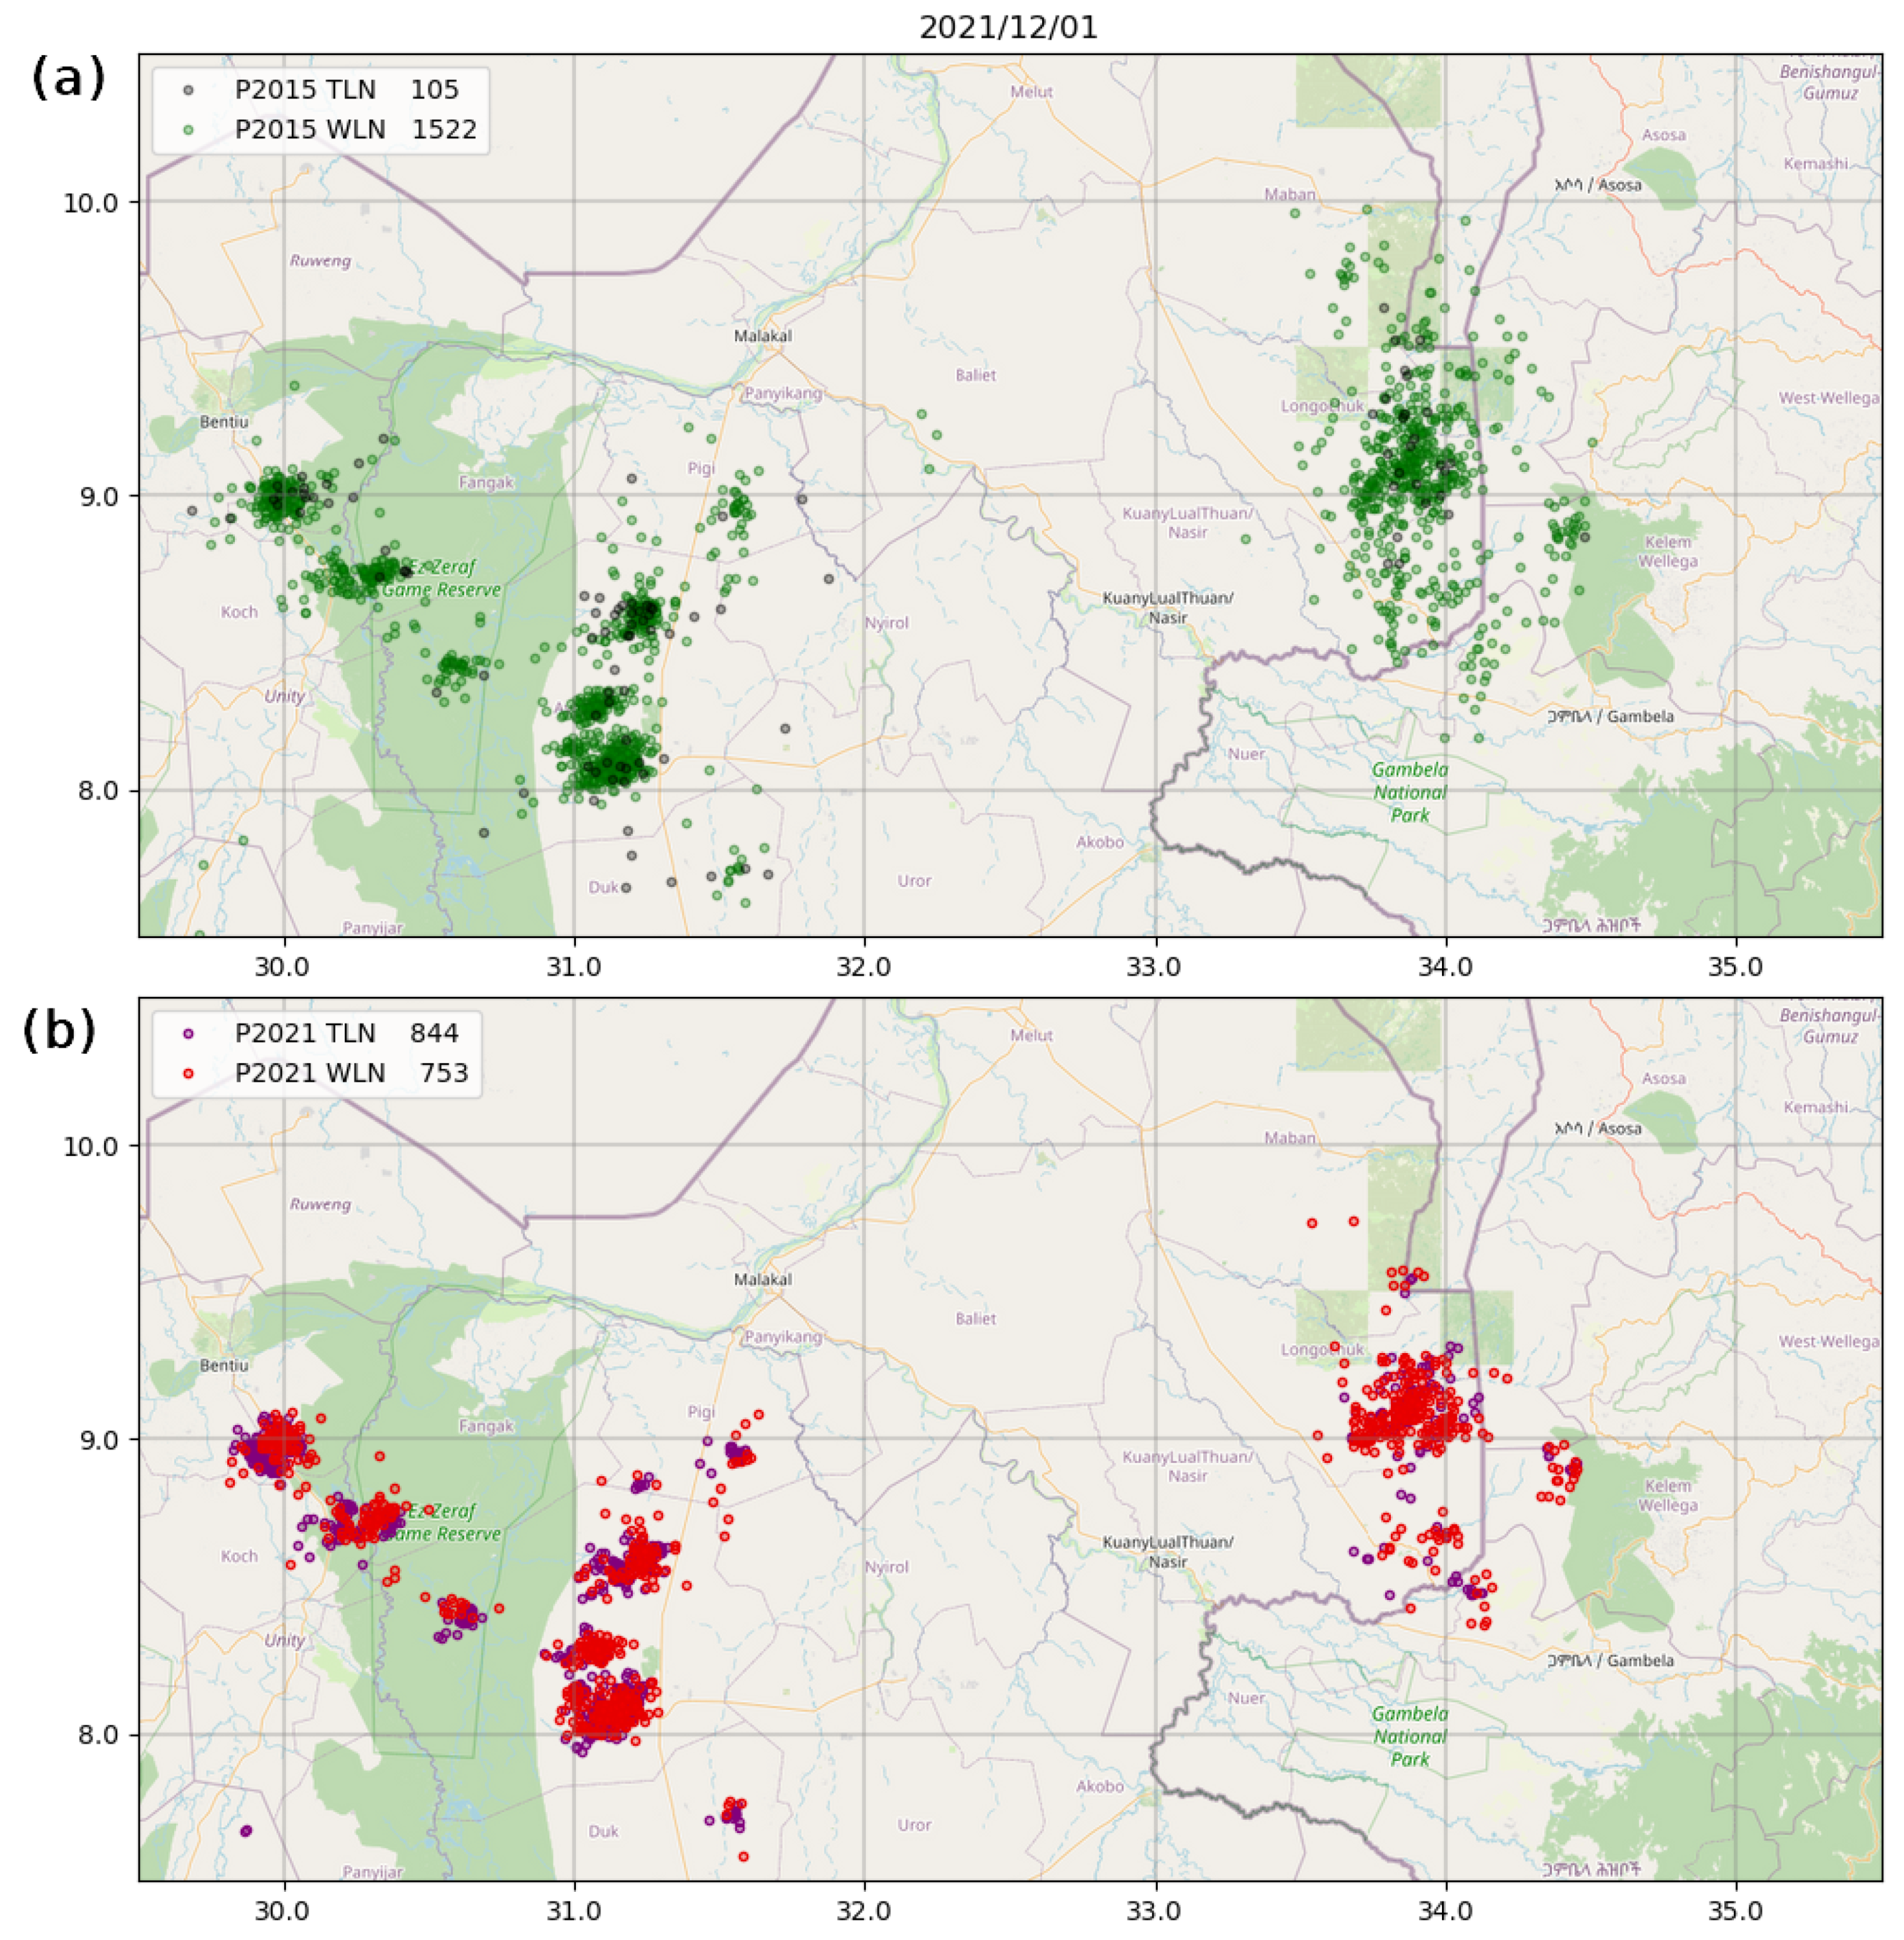
Lightning pulses located by the ENTLN and WWLLN using P2015 and P2021 in the African region near South Sudan are shown in Figure 4. The overall counts (i.e., ENTLN + WWLLN) are similar for both P2021 and P2015. However, the ENTLN detections of P2021 are more than eight times higher than that of P2015 (see counts in Figure 4). Note that the WWLLN counts for P2021 are much lower than that for P2015. This is due to the ENTLN detecting more of the same pulses that WWLLN detects, and doing so with better location accuracy. Therefore, the WWLLN pulses are rejected so as not to duplicate data for P2021. This improved location accuracy is illustrated in the data since the lightning locations reported by P2021 (ENTLN: purple circles, WWLLN: red circles) are substantially less scattered than those reported by P2015 (ENTLN: grey circles, WWLLN: green circles).
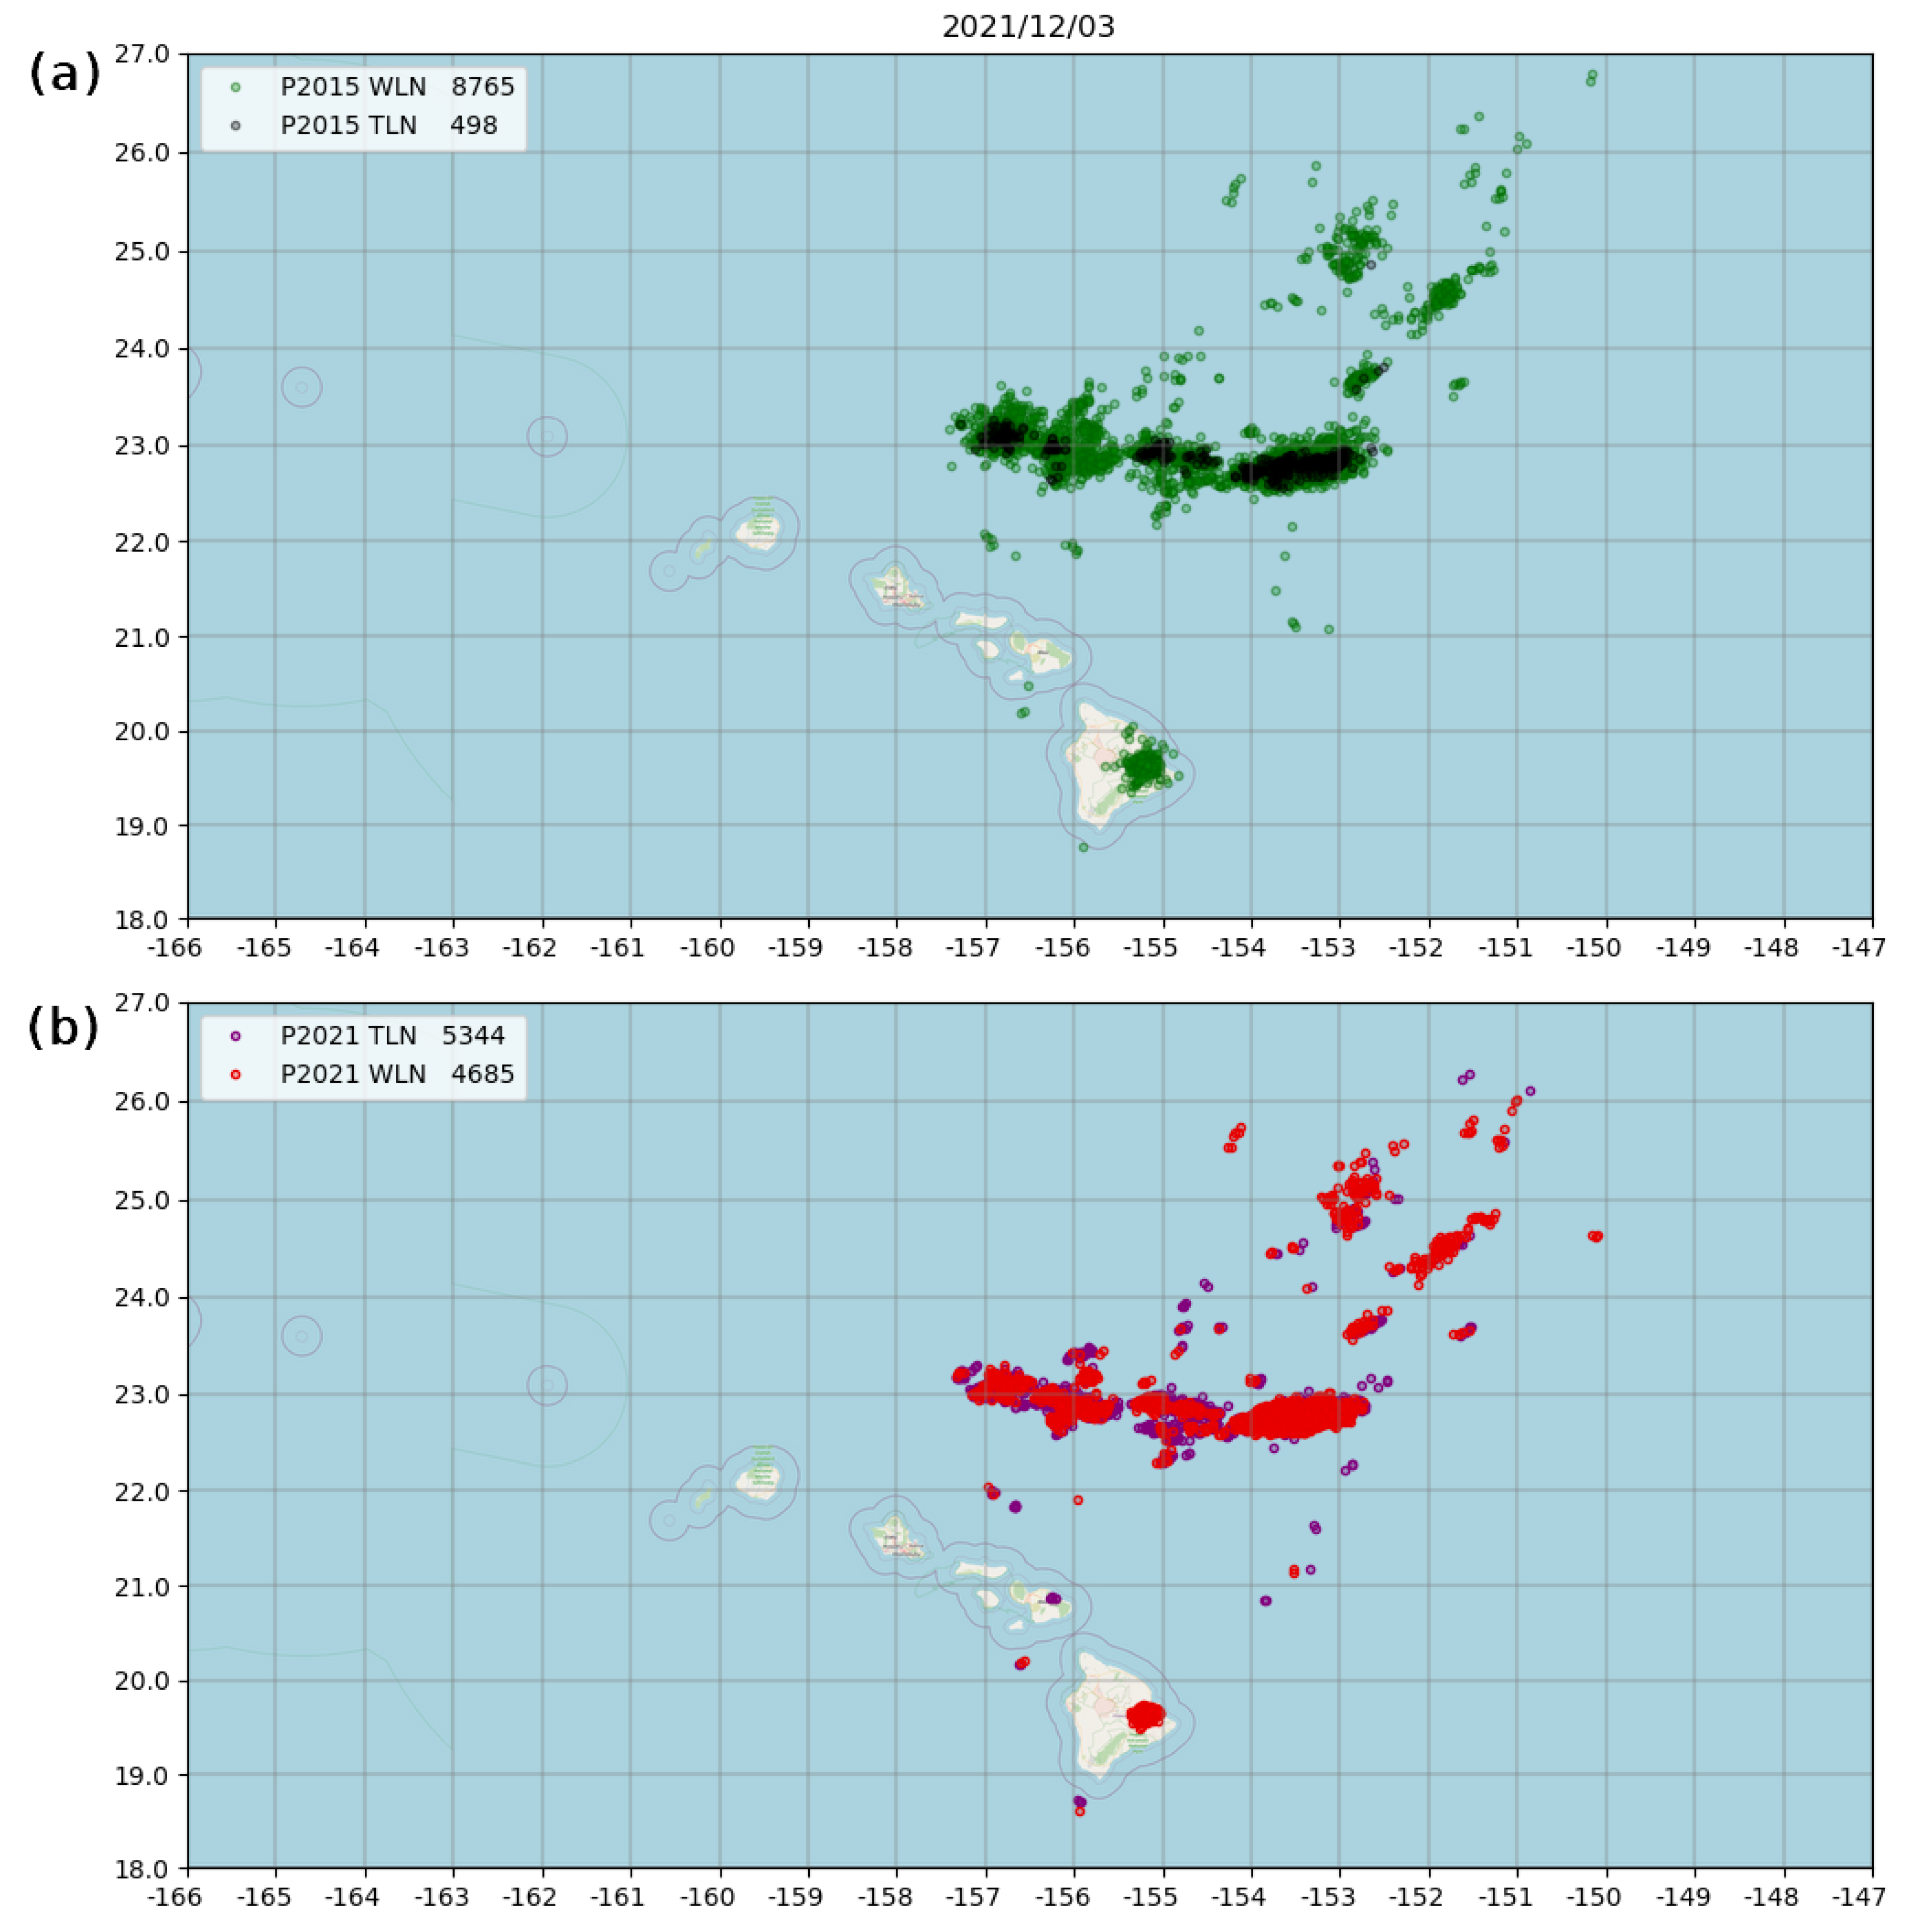
Another good example of remote performance gains is near Hawaii (Figure 5), where there are no landmasses for thousands of kilometers to deploy sensors. The ENTLN sensor network here is small and compact, resulting in subpar sensor geometry. Even in these challenging cases, we see massive performance gains (see counts in Figure 5) of the new processor when compared to the old one, similar to what is observed in the African case study described above.
The new processor is also better at incorporating the WWLLN solutions into the final lightning product and eliminating WWLLN pulses that may have been located with large errors. This can be seen in both case studies as a dramatic reduction in the scatter of WWLLN points around storms (compare green circles with red circles).
5. Summary
The upgraded processor of the ENTLN was deployed in December 2021. The performance characteristics of the new processor (P2021) were evaluated using the same ground-truth natural and rocket-triggered data acquired in Florida that was used in an earlier P2015 evaluation study [4]. The detection efficiencies of P2021 and P2015 are similarly good with the stroke detection efficiency being 97%. The stroke classification accuracies of P2021 are 94% and 88% for natural and rocket-triggered lightning, respectively, which shows slight improvement over P2015 (see Table 2 and Table 3). The location accuracy of P2021 (92 m) improved significantly compared with that of P2015 (215 m). The improved location accuracy is due to the new propagation model, which corrects the delays in arrival time due to propagation effects, as well as improves the distance calculation of the ground wave propagation path.
The classification algorithm in P2015, which was based on a decision tree, was replaced by a machine-learning classification algorithm in P2021. The artifacts in the P2015 classification distribution, which were due to sharp decision boundaries set for certain input parameters, have been removed in the new algorithm’s distribution. The IC/CG peak current distributions for P2021 (see Figure 2b) more accurately represent what has been reported in the literature.
The number of ENTLN pulses reported by P2021 all over the world is about 50% higher than that of P2015. The detection gains are modest in regions of the world with a fairly dense network of sensors, while the gains increase significantly in regions where sensor density is lower. The new regional processing architecture, new propagation model, and a sophisticated probabilistic source/noise discrimination model of P2021 contribute to these detection gains.
Author Contributions
Conceptualization, M.S. and Y.Z.; methodology, Y.Z.; software, M.S.; formal analysis, Y.Z. and M.S.; writing—original draft preparation, Y.Z.; writing—review and editing, Y.Z., M.S., J.L. and E.D. All authors contributed to discussion of the results and preparation of the manuscript. All authors have read and agreed to the published version of the manuscript.
Funding
This research received no external funding.
Institutional Review Board Statement
Not applicable.
Informed Consent Statement
Not applicable.
Data Availability Statement
The data support the findings of this study are available from the corresponding author upon reasonable request.
Acknowledgments
The authors thank faculty and previous student members of the Lightning Lab of University of Florida, Vladimir Rakov, Manh Tran, Douglas Jordan, Martin Uman, Jaime Caicedo, Daniel Kotovsky, Robert Wilkes, Felipe Carvalho, Terry Ngin, William Gamerota, John Pilkey, and Brian Hare for their contributions to the collection of ground-truth data used in this study.
Conflicts of Interest
The authors declare no conflict of interest.
Abbreviations
The following abbreviations are used in this manuscript:
| ENTLN | Earth Networks Total Lightning Network |
| TOA | Time of Arrival |
| IC | Intracloud Lightning |
| CG | Cloud-to-Ground Lightning |
| DE | Detection Efficiency |
| CA | Classification Accuracy |
| CID | Compact Intracloud Discharge |
| NBE | Narrow Bipolar Event |
| WWLLN | World Wide Lightning Location Network |
References
- Liu, C.; Heckman, S. The application of total lightning detection and cell tracking for severe weather prediction. In Proceedings of the 91st American Meteorological Society Annual Meeting, Seattle, WA, USA, 23–27 January 2011. [Google Scholar]
- Maiorana, C.; Marisaldi, M.; Füllekrug, M.; Soula, S.; Lapierre, J.; Mezentsev, A.; Skeie, C.A.; Heumesser, M.; Chanrion, O.; Østgaard, N.; et al. Observation of Terrestrial Gamma-Ray Flashes at Mid Latitude. J. Geophys. Res. Atmos. 2021, 126, e2020JD034432. [Google Scholar] [CrossRef]
- Tiberia, A.; Porcú, F.; Marisaldi, M.; Tavani, M.; Lapierre, J.; Ursi, A.; Fuschino, F.; D’Adderio, L.P.; Dietrich, S. GPM-DPR Observations on TGFs Producing Storms. J. Geophys. Res. Atmos. 2021, 126, e2020JD033647. [Google Scholar] [CrossRef]
- Zhu, Y.; Rakov, V.A.; Tran, M.D.; Stock, M.G.; Heckman, S.; Liu, C.; Sloop, C.D.; Jordan, D.M.; Uman, M.A.; Caicedo, J.A.; et al. Evaluation of ENTLN Performance Characteristics Based on the Ground Truth Natural and Rocket-Triggered Lightning Data Acquired in Florida. J. Geophys. Res. Atmos. 2017, 122, 9858–9866. [Google Scholar] [CrossRef]
- Mallick, S.; Rakov, V.A.; Hill, J.D.; Ngin, T.; Gamerota, W.R.; Pilkey, J.T.; Jordan, D.M.; Uman, M.A.; Heckman, S.; Sloop, C.D.; et al. Performance characteristics of the ENTLN evaluated using rocket-triggered lightning data. Electr. Power Syst. Res. 2015, 118, 15–28. [Google Scholar] [CrossRef]
- Rudlosky, S.D. Evaluating ENTLN performance relative to TRMM/LIS. J. Oper. Meteor 2015, 3, 11–20. [Google Scholar] [CrossRef]
- Bitzer, P.M.; Burchfield, J.C.; Christian, H.J. A Bayesian Approach to Assess the Performance of Lightning Detection Systems. J. Atmos. Ocean. Technol. 2016, 33, 563–578. [Google Scholar] [CrossRef]
- Marchand, M.; Hilburn, K.; Miller, S.D. Geostationary Lightning Mapper and Earth Networks Lightning Detection Over the Contiguous United States and Dependence on Flash Characteristics. J. Geophys. Res. Atmos. 2019, 124, 11552–11567. [Google Scholar] [CrossRef]
- Ding, Z.; Chen, S.; Rakov, V.A.; Kereszy, I.; Zhu, Y. Comparison of Far Electric Field Waveforms Produced by Rocket-Triggered Lightning Strokes and Subsequent Strokes in Natural Lightning. In Proceedings of the International Conference on Lightning Protection (ICLP), Colombo, Sri Lanka, 20–26 September 2021; pp. 1–5. [Google Scholar] [CrossRef]
- Wang, J.; Li, Q.; Cai, L.; Zhou, M.; Fan, Y.; Xiao, J.; Sunjerga, A. Multiple-station measurements of a return-stroke electric field from rocket-triggered lightning at distances of 68–126 km. IEEE Trans. Electromagn. Compat. 2019, 61, 440–448. [Google Scholar] [CrossRef]
- Cooray, V.; Lundquist, S. Effects of propagation on the rise times and the initial peaks of radiation fields from return strokes. Radio Sci. 1983, 18, 409–415. [Google Scholar] [CrossRef]
- Uman, M.A.; Swanberg, C.E.; Tiller, J.A.; Lin, Y.T.; Krider, E.P. Effects of 200 km propagation on Florida lightning return stroke electric fields. Radio Sci. 1976, 11, 985–990. [Google Scholar] [CrossRef]
- Zhu, Y.; Lyu, W.; Cramer, J.; Rakov, V.; Bitzer, P.; Ding, Z. Analysis of Location Errors of the U.S. National Lightning Detection Network Using Lightning Strikes to Towers. J. Geophys. Res. Atmos. 2020, 125, e2020JD032530. [Google Scholar] [CrossRef]
- Chowdhuri, P.; Anderson, J.P.; Chisholm, W.A.; Field, T.E.; Ishii, M.; Martinez, J.A.; Marz, M.B.; McDaniel, J.; McDermott, T.R.; Mousa, A.M.; et al. Parameters of lightning strokes: A review. IEEE Trans. Power Deliv. 2005, 20, 346–358. [Google Scholar] [CrossRef]
- Rakov, V.A.; Uman, M.A. Lightning: Physics and Effects; Cambridge University Press: New York, NY, USA, 2003. [Google Scholar]
- Leal, A.F.; Rakov, V.A.; Rocha, B.R. Compact intracloud discharges: New classification of field waveforms and identification by lightning locating systems. Electr. Power Syst. Res. 2019, 173, 251–262. [Google Scholar] [CrossRef]
Figure 1.
Locations of ENTLN pulses corresponding to return strokes in rocket-triggered lightning that are reported by P2015 (left) and P2021 (right). The ground-truth location (the position of the rocket launcher) is at the origin.
Figure 1.
Locations of ENTLN pulses corresponding to return strokes in rocket-triggered lightning that are reported by P2015 (left) and P2021 (right). The ground-truth location (the position of the rocket launcher) is at the origin.

Figure 2.
IC/CG peak current distributions for pulses (detected between 3 December 2021 and 14 April 2022) that are classified by the (a) old (P2015) and (b) new (P2021) processors.
Figure 2.
IC/CG peak current distributions for pulses (detected between 3 December 2021 and 14 April 2022) that are classified by the (a) old (P2015) and (b) new (P2021) processors.

Figure 3.
Comparison of the total number of ENTLN pulses detected by P2021 and P2015 between 3 December 2021 and 14 April 2022. Pixels with less than 1000 events detected by P2015 and P2021 are not shown. Note the detection gains shown here are gains for only ENTLN-detected pulses and contributions from the World Wide Lightning Location Network (WWLLN) were excluded in the comparison.

Figure 4.
Locations of lightning in South Sudan for one case study. (a) ENTLN (black circles) and WWLLN (green circles) locations from P2015; (b) ENTLN (purple circles) and WWLLN (red circles) locations from P2021.
Figure 4.
Locations of lightning in South Sudan for one case study. (a) ENTLN (black circles) and WWLLN (green circles) locations from P2015; (b) ENTLN (purple circles) and WWLLN (red circles) locations from P2021.

Figure 5.
Locations of lightning in Hawaii for one case study. (a) ENTLN (black circles) and WWLLN (green circles) locations from P2015; (b) ENTLN (purple circles) and WWLLN (red circles) locations from P2021.
Figure 5.
Locations of lightning in Hawaii for one case study. (a) ENTLN (black circles) and WWLLN (green circles) locations from P2015; (b) ENTLN (purple circles) and WWLLN (red circles) locations from P2021.


Table 1.
Summary of ground-truth datasets used for the ENTLN performance evaluation.
| Natural Lightning | Rocket-Triggered Lightning | |
|---|---|---|
| Number of flashes | 219 | 36 |
| Number of strokes | 608 | 175 |
Table 2.
Summary of performance characteristics of P2015 and P2021 evaluated using natural lightning.
Table 2.
Summary of performance characteristics of P2015 and P2021 evaluated using natural lightning.
| Processor | Old (P2015) | New (P2021) |
|---|---|---|
| Number of flashes | 219 | 219 |
| Number of strokes | 608 | 608 |
| Flash DE | 99% | 98% |
| Flash CA | 97% | 98% |
| Stroke DE | 96% | 97% |
| Stroke CA | 91% | 94% |
Table 3.
Summary of performance characteristics of P2015 and P2021 evaluated using rocket-triggered lightning.
Table 3.
Summary of performance characteristics of P2015 and P2021 evaluated using rocket-triggered lightning.
| Processor | Old (P2015) | New (P2021) |
|---|---|---|
| Number of flashes | 36 | 36 |
| Number of strokes | 175 | 175 |
| Number of detected flashes | 36 | 36 |
| Number of correctly classified flashes | 35 | 34 |
| Number of detected strokes | 169 | 170 |
| Number of correctly classified strokes | 145 | 150 |
| Flash DE | 100% | 100% |
| Flash CA | 97% | 94% |
| Stroke DE | 97% | 97% |
| Stroke CA | 86% | 88% |
| Median absolute current estimation error | 15% | 13% |
| Median location error (m) | 215 | 92 |
Table 4.
Detection gains of P2021 compared to P2015 in different regions (calculated using lightning pulses detected between 3 December 2021 and 14 April 2022).
Table 4.
Detection gains of P2021 compared to P2015 in different regions (calculated using lightning pulses detected between 3 December 2021 and 14 April 2022).
| Region | Pulse Detection Gain |
|---|---|
| Africa | 163% |
| Asia | 142% |
| Australia | 131% |
| Europe | 152% |
| N. America | 145% |
| S. America | 151% |
| World | 149% |
Publisher’s Note: MDPI stays neutral with regard to jurisdictional claims in published maps and institutional affiliations. |
© 2022 by the authors. Licensee MDPI, Basel, Switzerland. This article is an open access article distributed under the terms and conditions of the Creative Commons Attribution (CC BY) license (https://creativecommons.org/licenses/by/4.0/).
Share and Cite
MDPI and ACS Style
Zhu, Y.; Stock, M.; Lapierre, J.; DiGangi, E. Upgrades of the Earth Networks Total Lightning Network in 2021. Remote Sens. 2022, 14, 2209. https://0-doi-org.brum.beds.ac.uk/10.3390/rs14092209
AMA Style
Zhu Y, Stock M, Lapierre J, DiGangi E. Upgrades of the Earth Networks Total Lightning Network in 2021. Remote Sensing. 2022; 14(9):2209. https://0-doi-org.brum.beds.ac.uk/10.3390/rs14092209
Chicago/Turabian StyleZhu, Yanan, Michael Stock, Jeff Lapierre, and Elizabeth DiGangi. 2022. "Upgrades of the Earth Networks Total Lightning Network in 2021" Remote Sensing 14, no. 9: 2209. https://0-doi-org.brum.beds.ac.uk/10.3390/rs14092209
Note that from the first issue of 2016, this journal uses article numbers instead of page numbers. See further details here.