1. Introduction
Soil water erosion has become a serious environmental hazard around the global world, which impacts climate change, agricultural production, and socio-economic-ecological sustainable development [
1,
2,
3]. Land-use/land-cover (LULC) information reflects the interaction between human activities and natural ecosystems, which has been identified as a decisive factor to accelerate global land degradation and soil water erosion [
4]. The People’s Republic of China faces a critical challenge from soil water erosion [
5,
6]. Based on deep learning (DL) and remote sensing technology, high-accuracy LULC information could be extracted to perform large-scale and extensive intelligent ground monitoring, which is beneficial to conducting soil water erosion assessment (SWEA) in a cost-efficient manner [
7]. Compared with traditional models that rely on statistics or physical knowledge, DL networks are trained with massive samples that could automatically learn remote sensing parameter characteristics of ground objects [
8,
9,
10,
11]. This means that the performance of DL-based approaches strongly depends on the quality and quantity of the provided dataset [
12]. Therefore, the construction of a high-quality remote sensing image interpretation dataset contributes to enhancing the generalization ability of DL networks and further improving the accuracy of LULC mapping.
At present, many research institutions and scholars are devoted to remote sensing dataset research for mapping LULC. There are two main categories of datasets: scene classification datasets and object detection datasets. Object detection datasets focus on recognizing ground objects with bounding boxes to predict the location and LULC categories [
13], such as FAIR1M [
12], TAS [
14], ImageNet [
15], PASCCAL VOC [
16], SZTAKI-INRIA [
17], MSCOCO [
18], UCAS-AOD [
19], DLR 3K [
20], NWPU VHR-10 [
21], VEDAI [
22], HRSC2016 [
23], COWC [
24], RSOD [
25], LEVIR [
26], ITCVD [
27], DOTA [
28], DIOR [
14], and RSSOD [
29]. Scene classification is for categorizing remote sensing images into a series of LULC categories with the image patches [
29], such as UC Merced Land-Use [
30], WHU-RS19 [
31], RSSCN7 [
32], Brazilian Coffee Scene [
33], RSC11 [
34], SIRI-WHU [
35], NWPU-RESISC45 [
29], RSD46-WHU [
25], AID [
36], AID++ [
37], OPTIMAL-31 [
38], PatternNet [
39], OSAR [
40], RSI-CB [
41], DIOR [
42], Eurosat [
43], Bigearthnet [
44], MLRSNet [
45], BigEarthNet-MM [
46], MRSB [
47], AIFS-DATASET [
48], MRSID [
49], and LuoJiaSET [
50]. The available datasets could offer great potential in mitigating the highly nonlinear and overparameterized restrictions of DL networks [
51].
It is crucial and urgently necessary to construct thematic remote sensing datasets for conducting SWEA. There still exists an application gap between geographic research and specific geo-engineering applications. It is worth noting that different scholars or institutions have constructed diverse LULC classification systems to meet their respective research needs. However, this diversity of current datasets is not conducive to their universality across various geographical researches. To be specific, there is still a lack of thematic remote sensing datasets for conducting SWEA. Hence, it is crucial and urgently needed to construct datasets in accordance with a standard and authoritative LULC classification system. This could improve the application and universality of remote sensing datasets for SWEA research.
It is crucial and urgently necessary to construct refined fine-grained LULC datasets, which can significantly enhance the monitoring and assessing capacities of soil water erosion. LULC data are a significant factor for calculating the Chinese soil loss equation (CSLE) model [
5,
52]. It is also recognized as the authoritative model to quantitatively evaluate the magnitude and distribution of soil erosion in the People’s Republic of China, and it adopts the LULC classification system conforming to the national industry standards of the Standards for Classification and Gradation of Soil Erosion (SL 190-2007) published by the Ministry of Water Resources of the People’s Republic of China. It is generally regarded as the vegetation cover and biological practice factor, which reflects the impact of vegetation cover and biological practice on erosion rate under fallow conditions [
47]. Therefore, improving the accuracy of LULC mapping directly affects the monitoring level of SWEA. The development of the fine-grained (i.e., second-level LULC) dataset is beneficial to implementing high-accuracy LULC mapping. It can further enhance the intra-class similarity and improve the inter-class variability, which promotes the development of the LULC classification level and, in turn, further improves the accuracy of SWEA.
It is crucial and urgently necessary to improve the quality of LULC labeling for the remote sensing dataset. The correction of sample labeling is very important in remote-sensing application research [
53]. DL models rely on training using numerous labeled data to yield the high classification accuracy [
54]. Due to the phenomenon of the same object with different spectrum and the foreign body with the same spectrum, different ground objects in remote sensing images have similarities in respect of color, texture, size, shape, shadow, and distribution position. That generally results in errors of LULC labeling. To alleviate the issue, some researchers have delved into various aspects, as follows: on one hand, much research adopted quality control methods to reduce human errors [
55,
56,
57,
58,
59,
60,
61,
62,
63,
64,
65]. For example, Qi et al. [
45] rely on many technicians to train data labeling several times until reaching a predetermined and reliable confidence score. On the other hand, remote sensing interpretation keys have a great effect on image labeling [
66,
67,
68,
69,
70,
71,
72,
73,
74,
75]. Remote sensing interpretation keys are sampled through field survey, which can provide accurate interpretation reference and real LULC category information rather than relying on human visual interpretation. However, there are fewer studies that rely on field surveys to improve the quality of data labeling.
In conclusion, fine-grained remote sensing classification dataset research still faces the following scarcities:
- (1)
Lacking object-oriented fine-grained datasets for DL-based LULC mapping. Current remote sensing scene classification datasets and object detection datasets primarily emphasize recognizing the LULC category and spatial position information. The fixed image patches generally contain heterogeneous objects, which means that the detailed geometrical information of ground objects, such as object boundaries, is still missing. That limits the progression of high-accuracy LULC mapping.
- (2)
Lacking datasets conforming to national LULC classification standards. The classification systems of current remote sensing datasets are diverse and are formulated according to different research needs. This diversity in LULC classification systems hinders the broader applicability of these datasets in other related fields, such as agricultural production and socio-economic–ecologically sustainable development [
1,
2,
3]. Thus, developing datasets based on universal and authoritative standards, such as national industry standards, is essential to enhance their universality and application value.
- (3)
Lacking field surveys for LULC dataset labeling. Current remote sensing datasets generally depend on professional technicians to label the LULC category, which means that there is no process for field surveys to verify the correctness of the labeled LULC. The subjectivity of professional technicians and the complexity of remote sensing images contribute to the degradation of data labeling quality. Incorrect data labeling greatly influences the training of DL networks and reduces classification accuracy. Thus, improving the quality of image labeling will significantly enhance the quality of the dataset.
- (4)
Lacking datasets meeting the engineering application requirement to conduct SWEA in the Yangtze River Basin. The application gap between current published datasets and SWEA application is still not addressed. It is worth noting that there is no thematic dataset available for conducting SWEA. In addition, some samples of representative LULC categories (e.g., sloping cropland) are not sampled in current datasets, which plays an important role in soil and water conservation.
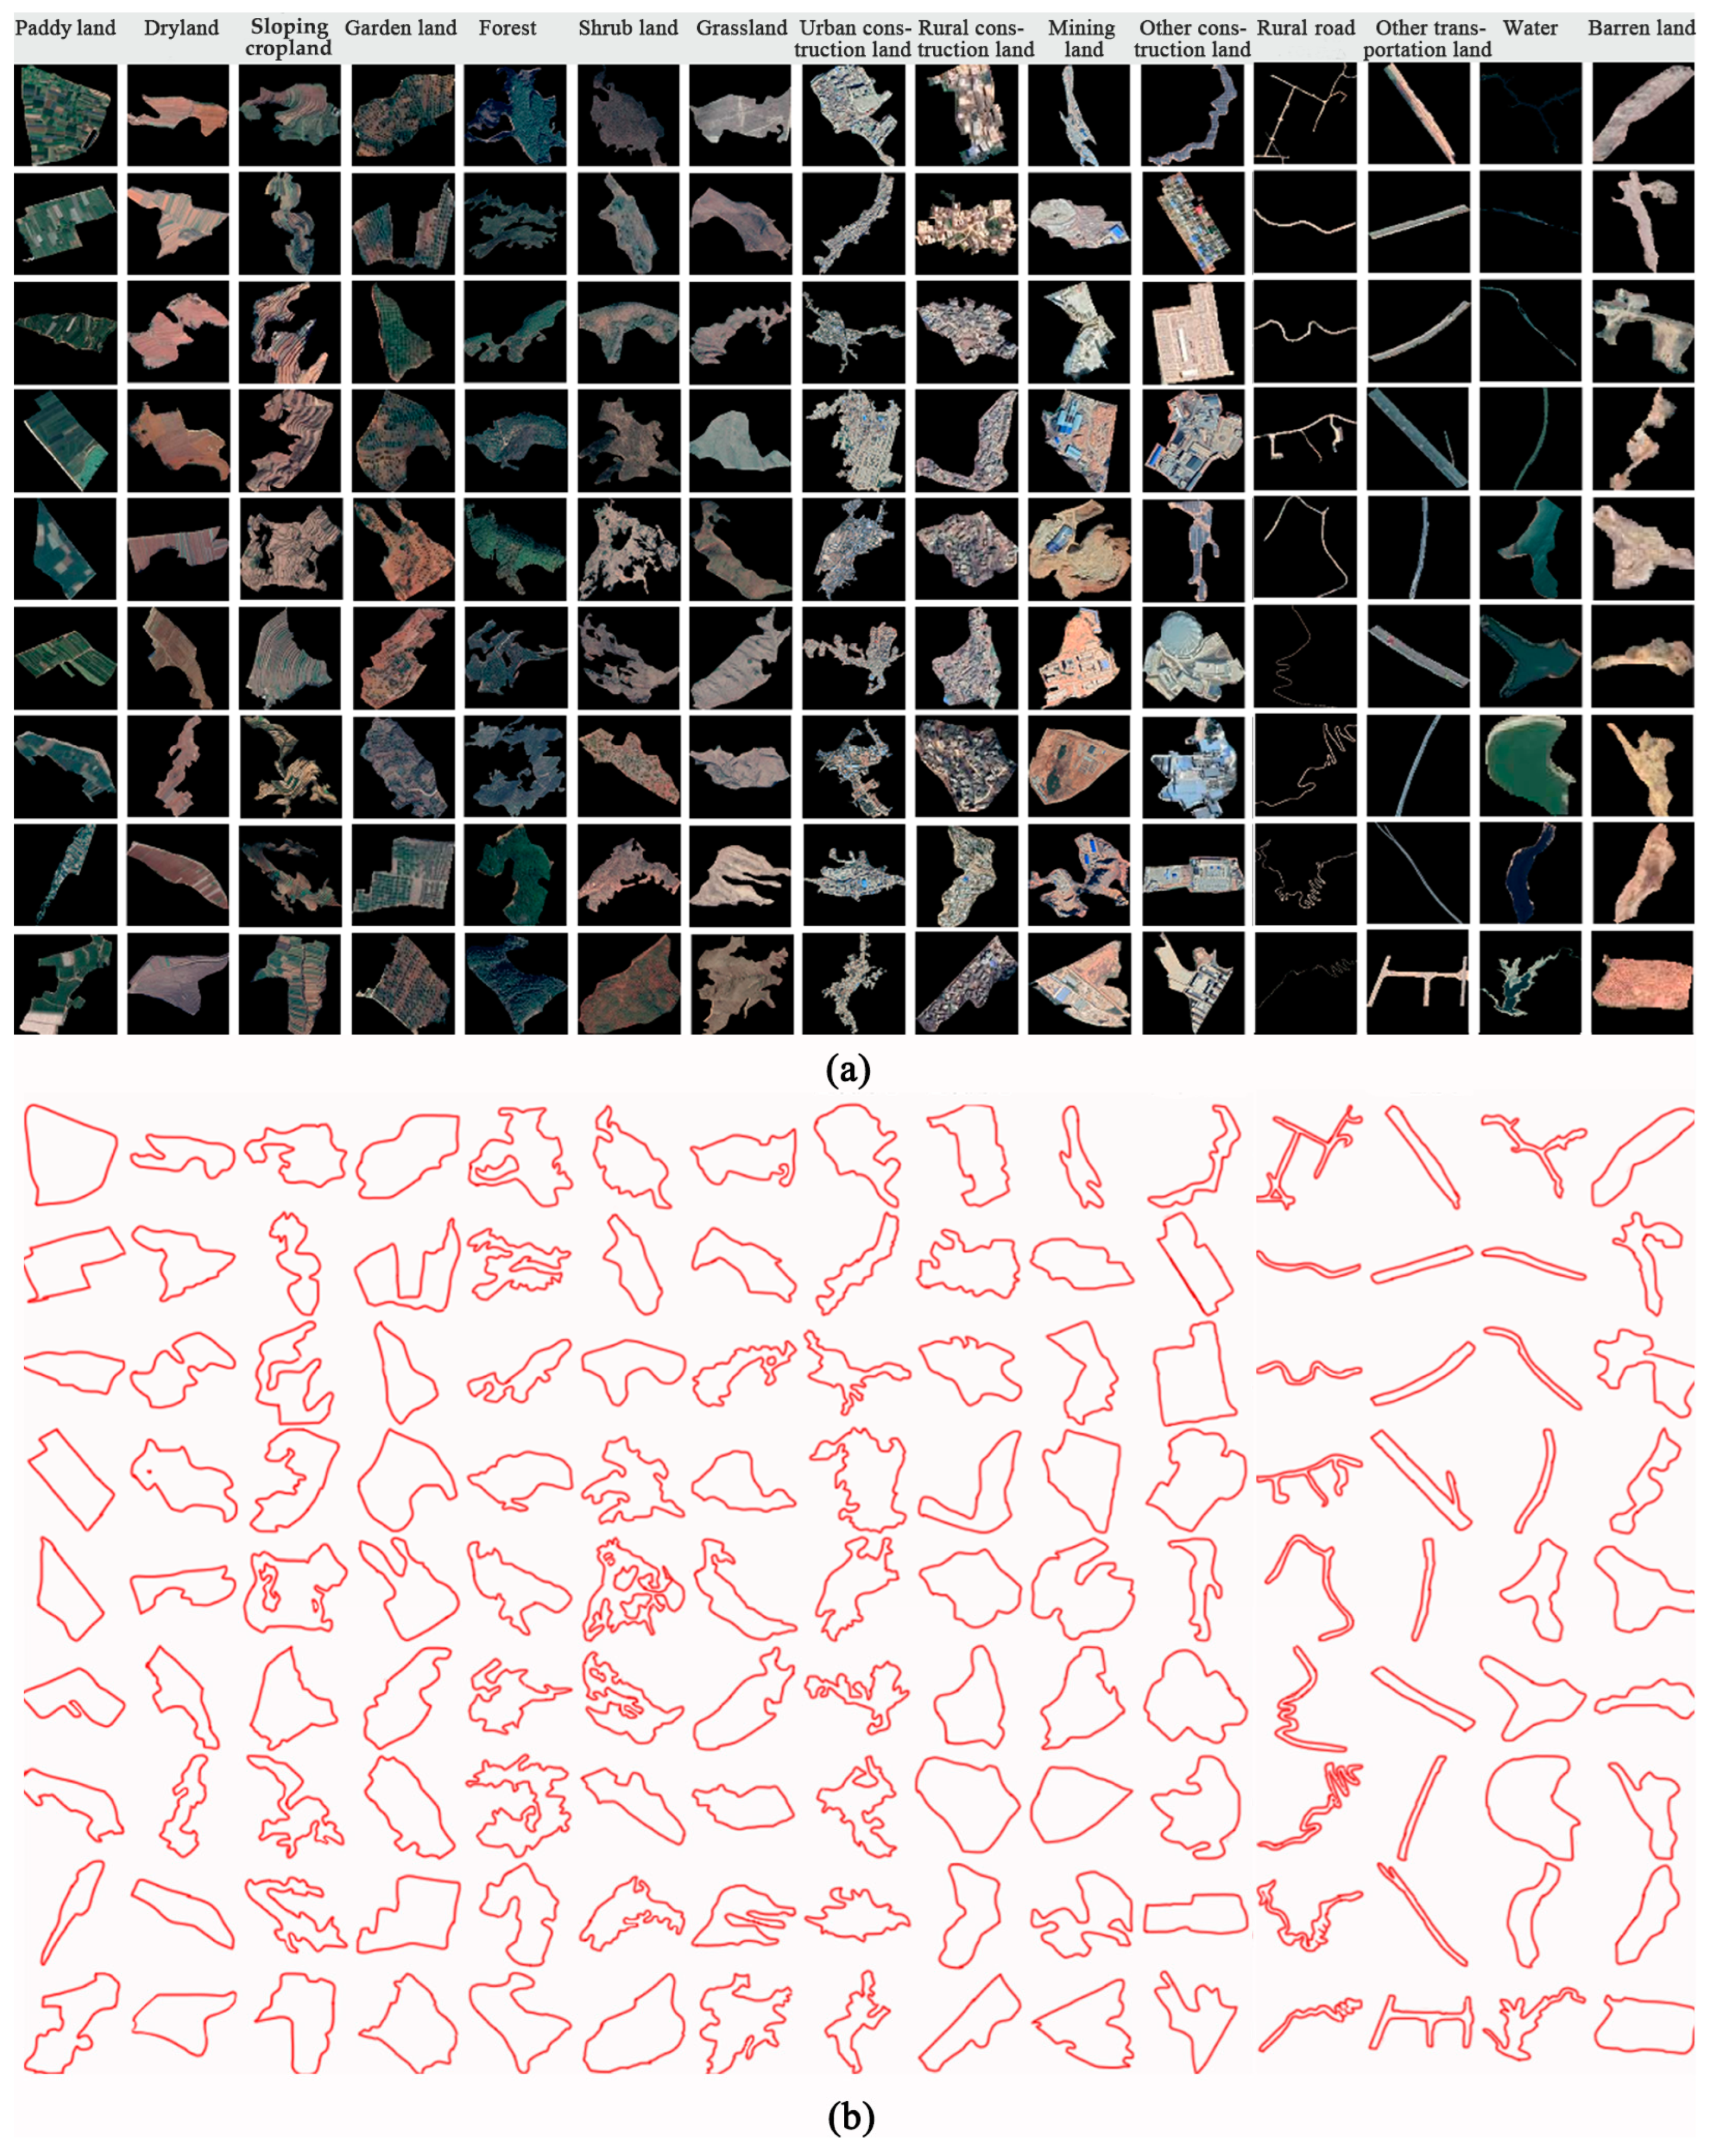
To solve the above issues, a second-level standards-of-the-Ministry-of-Water-Resources- and DL-oriented raster and vector benchmark dataset (RVBD) is the first to be established to perform LULC mapping for supporting SWEA in the Yangtze River Basin, which adheres to the notional standards published by the Ministry of Water Resources of the People’s Republic of China and meets the requirements of DL. The main remarkable innovation and contributions are shown as follows:
- (1)
A second-level object- and DL-oriented dataset with raster and vector data is first to be established for large-scale LULC mapping to the best of our knowledge. Different from the current datasets only containing remote sensing image patches, RVBD also includes vector data. In addition, image patches from open-source Google images are homogeneous objects with geometric boundary information, which can be directly applied for mapping LULC.
- (2)
An LULC dataset conforming to the national industry standards is the first to be established to the best of our knowledge. The classification system of RVBD is constructed following the water resources industry standard of the People’s Republic of China, i.e., the Current Land Use Classification (GB/T 21010-2017). It is significant for improving the universality of RVBD and the application value.
- (3)
A high-quality LULC labeling dataset with the assist of remote sensing interpretation keys is the first to be established to the best of our knowledge. Remote sensing interpretation keys are sampled through field surveys to facilitate the interpretation of LULC categories by indoor technicians. It is equally important that the correctness of sample labeling is verified through a field survey, which significantly improves the quality of sample labeling.
- (4)
RVBD is the first to lay an intelligent foundation for high-accuracy LULC mapping to support SWEA to the best of our knowledge. It greatly improves the application value of RVBD. Particularly, geographical theories and methods are further enriched based on artificial intelligence (AI) technology.
3. Methodology
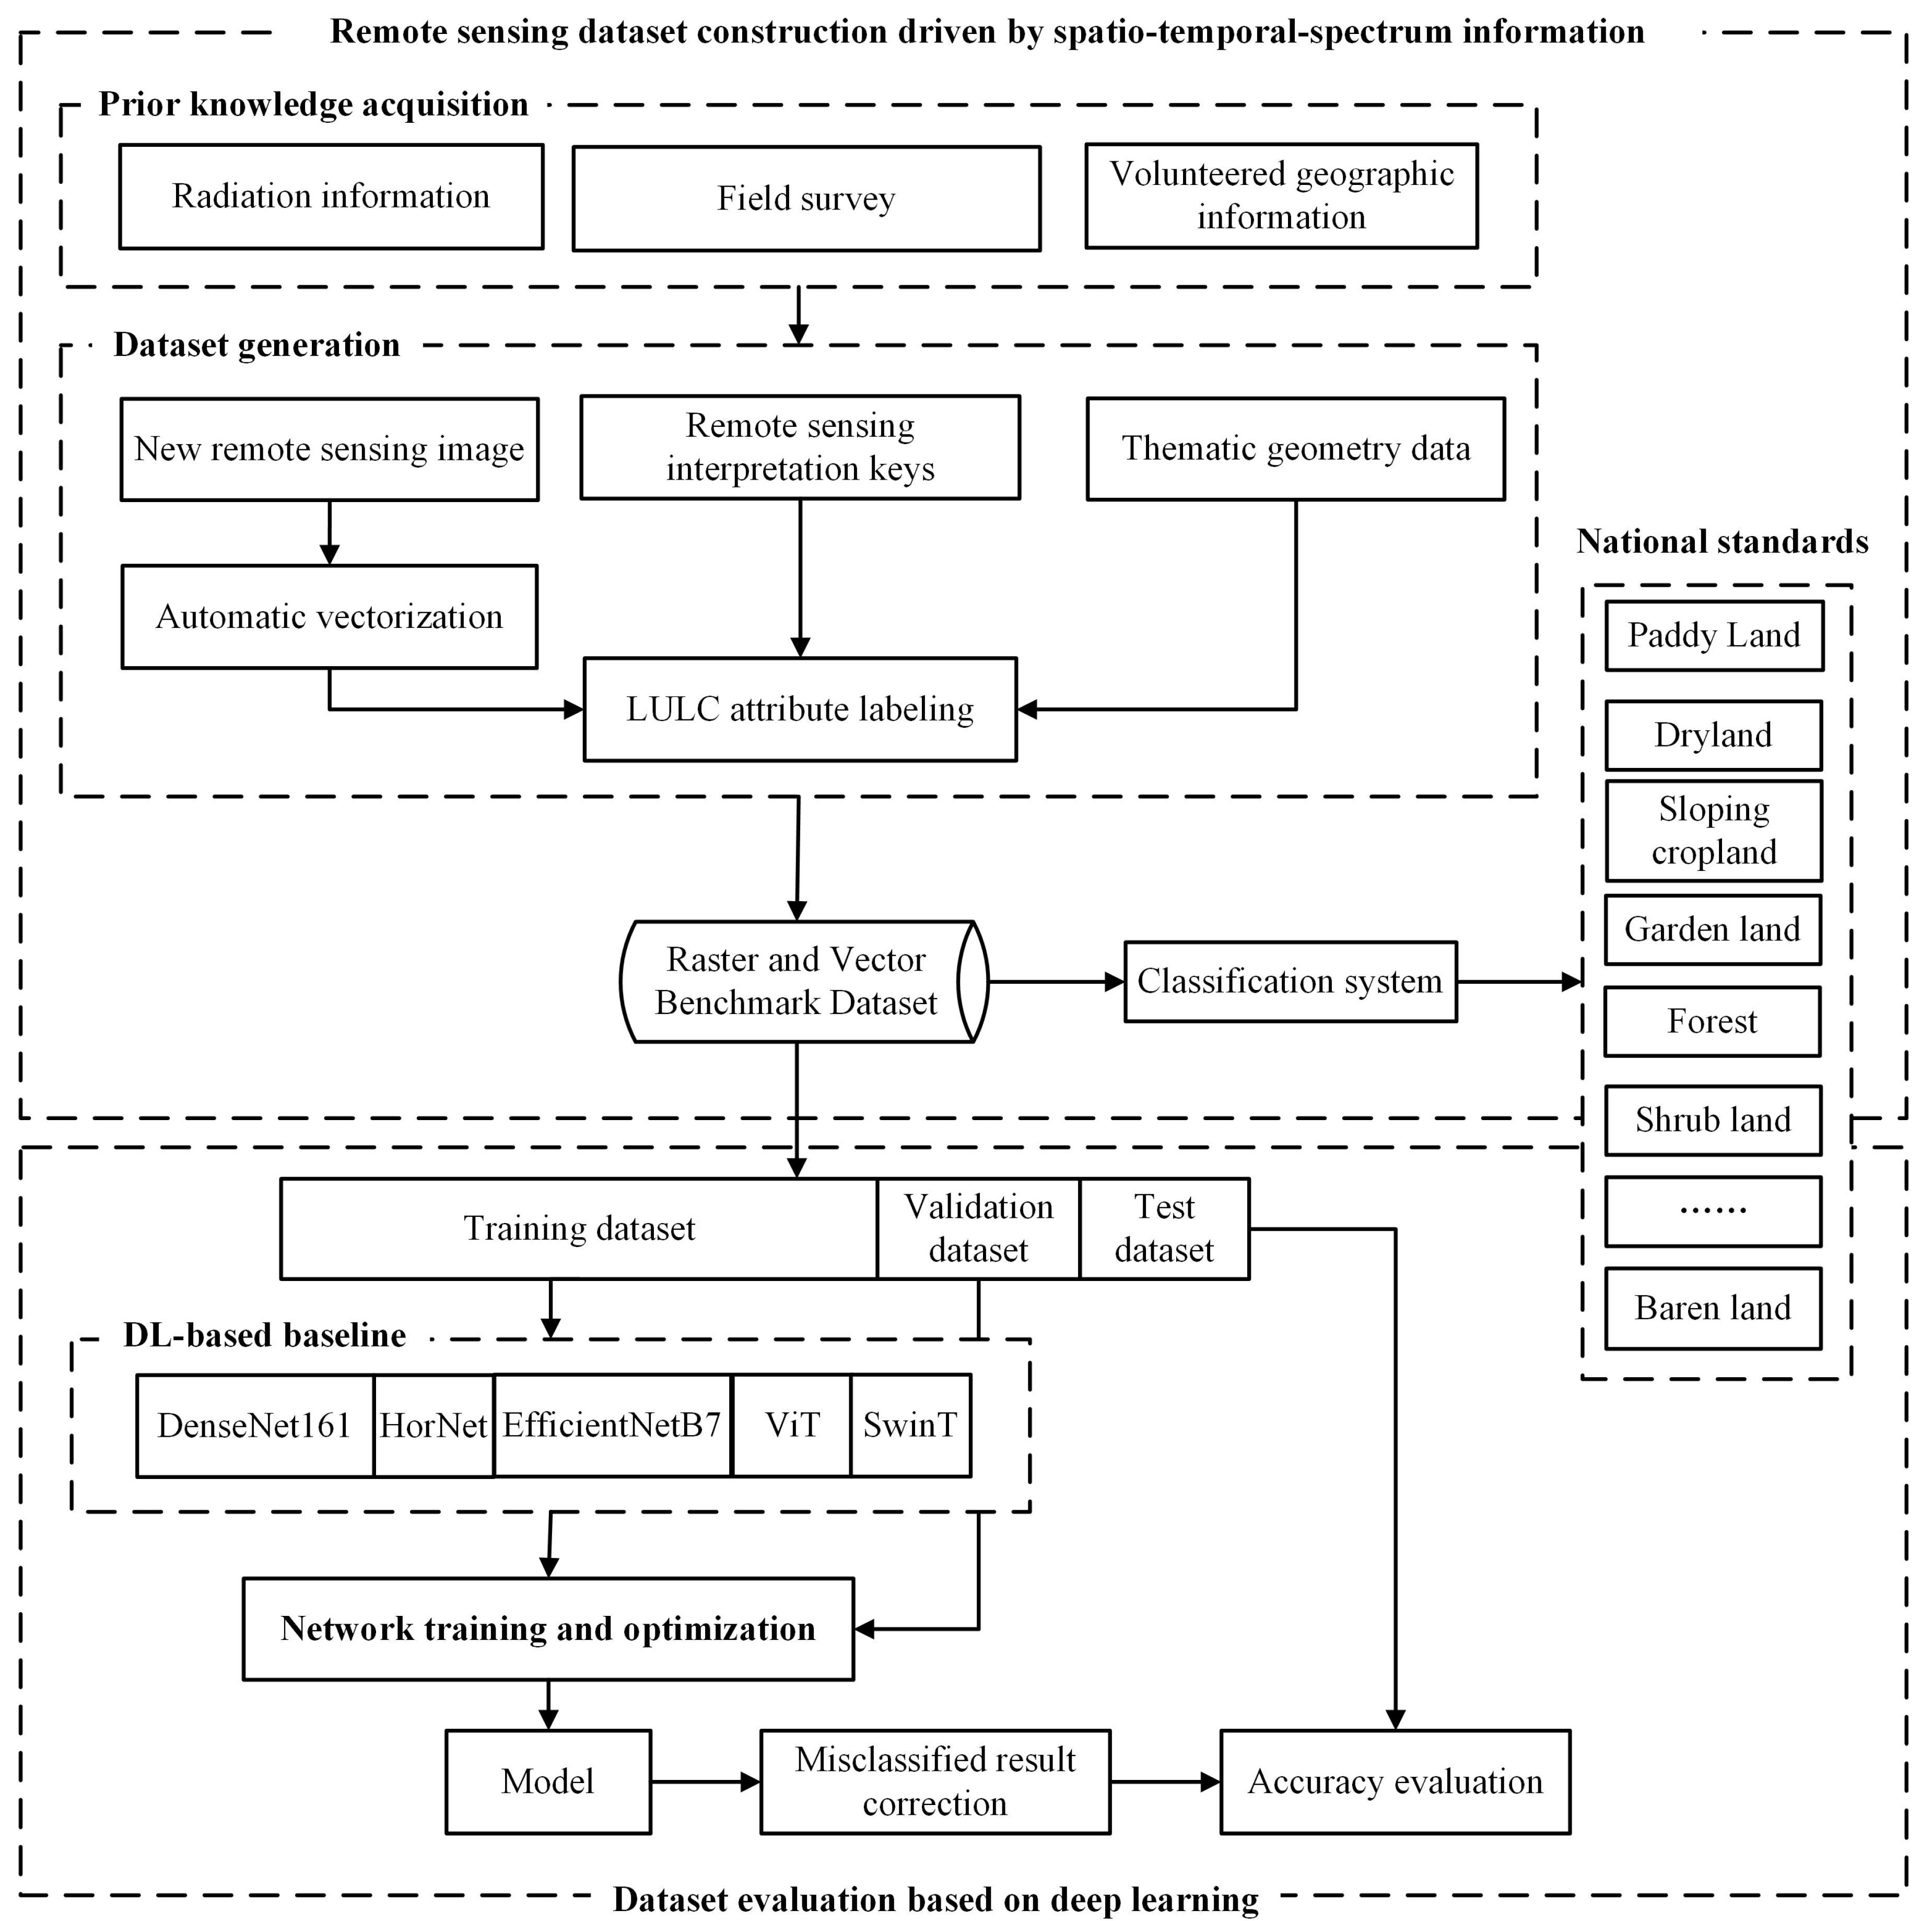
The overall workflow of the dataset construction method is shown in
Figure 5, which mainly includes the following two contents:
- (1)
Remote sensing dataset construction driven by spatio-temporal spectrum information
Various pieces of geographic information driven by spatio-temporal spectrum big data are utilized to construct the RVBD. Radiation knowledge is provided from remote sensing images to implement large-scale monitoring for SWEA. Thematic geometry knowledge is provided from volunteered geographic information, which is regarded as the mask data to yield the high-accuracy geometry vector data, such as road, river, and construction data. Then, automatic vectorization is performed for unmasked areas based on the multi-resolution segmentation approach. Finally, LULC attribute information is labeled by professional technicians with the assist of expert knowledge from remote sensing interpretation keys.
- (2)
Dataset evaluation based on DL
Five outstanding DL networks obtained from two different architectures, i.e., convolutional neural network (CNN) and Transformer, are chosen to evaluate the effectiveness of the established RVBD. This dataset is divided into a training set, a validation set, and a test set for DL network training and parameter optimization. Then, the manual labeling errors and machine errors generated by the DL networks are correcting based on field surveys. Finally, the accuracy evaluation is performed to verify the effectiveness of the RVBD.
3.1. Remote Sensing Dataset Construction Driven by Spatio-Temporal Spectrum Information
- (1)
Prior knowledge acquisition from spatio-temporal spectral big data
Prior knowledge is conducive to alleviate the problem that the acquisition of large-scale labeled training data is laborious and expensive [
76]. In the era of geographic big data, prior knowledge is obtained from spatio-temporal spectral big data to serve the construction of a remote sensing dataset, which includes various pieces of strictly calibrated geospatial information (e.g., radiation knowledge, thematic geometric knowledge, and expert knowledge). The spatio-temporal spectral big data provide the following data: remote sensing images are downloaded from open-source Google images and processed by strict geometric calibration and radiation calibration, high-accuracy volunteered geographic information from OpenStreetMap (OSM), and historical remote sensing interpretation keys sampled by field surveys. In addition, there are still much remote sensing data available that can be further explored, such as hyperspectral images. It is worth noting that they contain high-dimensional and multispectral information, which includes redundant data. This could increase the computational demands of DL networks and impede the convergence of DL training. Therefore, it is highly important to perform the dimensionality reduction methods, such as principal component analysis (PCA) [
77].
- (2)
Thematic geometry masking by volunteered geographic information
Volunteered geographic information (VGI) can provide high-accuracy geographic thematic data, which are widely recognized for the reliability, availability, and time efficiency of the data acquisition [
78]. OpenStreetMap data are generally regarded as the most active and widely applied VGI data [
79], which can be collected by both professional and amateur volunteers. Leveraging OSM data could save time and money on large-scale sample labeling. The accurate thematic vector data (i.e., road vector, river vector, and construction vector) could be yielded from OSM, and geographical registration is performed combining the aforementioned vector data with remote sensing images to minimize geometric errors. Then, remote sensing images can be masked with the above vector to obtain prior thematic vector regions.
- (3)
Automatic vectorization based on multi-resolution segmentation
The multi-resolution segmentation approach is adopted to implement automatic vectorization for the remained unmasked regions [
80]. It is a bottom-up region-merging approach to merge local homogeneity pixels to generate heterogenous objects, and three crucial parameters are generally utilized to optimize the segmentation results, as follows: the scale parameter is used to optimize the segmented objects and solve the phenomenon of over-segmentation and under-segmentation; the shape parameter takes the relationship between spectral and spatial uniformity into account; the compactness parameter considers spatial heterogeneity from two geometric attributes of different objects such as the perimeter and their area, the perimeter, and bounding boxes.
- (4)
Attribute labeling and dataset constructing
The LULC classification system is constructed for computing the model of CSLE, conforming to the national classification standard adopted by the Ministry of Water Resources of the People’s Republic of China (i.e., GB/T 21010-2017). LULC samples are selected on the geometric vector data of ground objects combining the automatic vectorization result with OSM thematic vector data. Based on visual interpretation, the sample attribute is labeled by professional technicians with the assist of remote sensing interpretation keys from field surveys, which are available by field surveys and are beneficial to identify ground objects on remote sensing images. Quality control is implemented to check the correctness of the labeled LULC category based on the field survey, which is over 92%. Finally, the remote sensing images are cropped with the geometric vector data of selected samples to generate the established RVBD.
3.2. Dataset Evaluation Based on DL
3.2.1. DL-Based Baseline
Current mainstream DL architectures are traditional CNN architectures and the more recent widely recognized Transformer architectures. The CNN and Transformer architectures have discrepant architecture designs and feature extraction capabilities. CNN architecture has a stronger local perceptual ability because of built-in inductive biases that apply local convolutional filters to enhance the spatial invariance [
81]. Transformer architecture generally splits the input image into a sequence of patches to model sequence-to-sequence (long-range) relations for yielding the stronger global modeling ability. Several superior DL networks of CNN and Transformer architectures are selected to evaluate the established RVBD, such as HorNet [
82], DenseNet161 [
83], EfficientNetB7 [
84], Vision Transformer (ViT) [
85], and Swin Transformer (SwinT) [
86], which are briefly introduced as follows.
EfficientNetB7 is one variant of EfficientNet and has been widely recognized for effectively evaluating the performance of remote sensing datasets [
84], tackling the issue that traditional CNNs are scaled only in following individual means of increasing the numbers of layers, increasing numbers of channels, or adjusting the input image size. EfficientNet designs a new scaling-up CNN approach, which develops an innovative compound coefficient to efficiently balance the scale relationships among depth, width, and resolution dimensions for yielding excellent whole-classification performance.
DenseNet161 is one variant of the Dense Convolutional Network and achieves a noteworthy improvement based on ResNet [
87], which has the several following convincing benefits: alleviating the vanishing gradient issue, enhancing information flow, improving feature reuse, and compressing the number of parameters [
83]. The dense block is the dominating feature extraction module in DenseNet, which regards any one of all the preceding layers as the input feature to directly access the subsequent layers. DenseNet enhances the reuse efficiency of the feature maps and yields good performance in remote sensing classification.
HorNet is inspired by the dot-product self-attention operation in Transformers and explicitly explores the spatial interaction relationship between local space and its circumjacent region [
82]. Recursive gated convolution is designed to implement high-order and long-term spatial interactions with recursive gating convolution and large kernel convolutions. The network achieves efficient, extendable, and translation-equivariant performance for yielding remarkable power in image classification.
The design inspiration of ViT stems from the natural language processing (NPL) architecture. ViT is a pure and standard Transformer that splits an image into sequences of patches like sequences of word tokens in NPL, which leverages multi-head self-attention to capture the global dependency relationship for the patches [
85]. In addition, position information remains based on the position-embedding module. It is a simple and scalable architecture that has shown superior performance in various visual tasks.
SwinT is different from pure visual Transformer architecture ViT, which introduces the additional visual inductive biases (i.e., locality, translation invariance, and hierarchy) with shifting windows to enhance the local modeling power [
86]. Instead of using a fixed window to generate image patches, the shifted windows can compute self-attention crossing the boundaries of the previous windows for yielding stronger performance. It has lower latency and enables efficient processing of high-resolution images while maintaining a good balance between performance and computation.
3.2.2. Network Training Strategy
Transfer learning is an excellent training strategy and could achieve higher levels of generalization power with fewer training iterations, which could leverage pretrained weight parameters and can be applied to downstream tasks directly, such as remote sensing image classification [
78]. For the aforementioned five DL networks for the established RVBD, the pretrained models stemming from ImageNet [
15], which is a popular deep learning image classification dataset, are transferred to train with the RVBD. It is worth noting that network weights of all layers are fine tuned to yield better classification performance.
3.2.3. Misclassified Result Correction
Manual labeling can easily lead to misclassification. To address this problem, field surveys are carried out to correct the manual labeling errors and machine errors generated by DL networks.
- (1)
Define unreliable classification results. Utilizing the softmax function, the DL-based classification probabilities are generated as output. If the top two highest classification probabilities are approximately equal (i.e., the difference is less than 0.1), they could be considered as unreliable classification results.
- (2)
Correct the unreliable results by visual interpretation. The manual visual interpretation is employed to update the classification result with the assist of remote sensing interpretation keys.
- (3)
Verify the results by field surveys. The aforementioned, easily misclassified objects are further verified by field surveys to correct the machine errors generated by DL-based classification and human errors generated by visual interpretation. Especially in regions with terrain or potential hazards, we employ unmanned aerial vehicles (UAVs) to facilitate the manual validation [
88].
3.2.4. Evaluation Metrics
To quantitatively evaluate the quality of the established RVBD, different evaluation metrics are adopted, such as overall accuracy (OA), Kappa coefficient (Kappa), precision, recall, and F1 score. These metrics focus on the different facets of the classification capabilities of the selected DL network. In addition, confusion matrices of predicted results of all networks are also provided to represent more performance details, which is conducive to the analysis classification results for each LULC class.
The Kappa coefficient can be calculated by the following Equation (1):
where Kappa is the Kappa coefficient,
m and
n are the number of correctly classified samples and total samples, respectively, and
pi and
qi are the number of real samples and the predicted samples of the
ith LULC category, respectively.
The OA can be calculated by the following Equation (2):
The precision can be calculated by the following Equation (3):
The recall can be calculated by the following Equation (4):
The F
1 score can be calculated by the following Equation (4):
In Equations (2) and (3), true positive (TP) means that the true LULC category and predicted LULC category are both positive, true negative (TN) means that the true LULC category and the predicted LULC category are both negative, false positive (FP) means that the true LULC category is negative but the predicted LULC category is positive, and false negative (FN) means that the true LULC category is positive but the predicted LULC category is negative.
4. Experiments and Results
4.1. Experimental Settings
Five popular DL networks, i.e., HorNet [
82], DenseNet161 [
83], EfficientNetB7 [
84], ViT [
85], and SwinT [
86], are chosen as the baseline networks to evaluate the classification performance for the constructed benchmark RVBD.
A fine-tuned training strategy is implemented to improve the generalization capability based on the pretrained weights of ImageNet [
15]. All remote sensing image patches of samples are resized to 256 × 256 pixels as the input for each network. Random horizontal and vertical flip operations are carried out for data augmentation. AdamW [
89] is chosen as the optimizer with 100 epochs. The cosine annealing strategy is utilized as a learning scheduler, and the initial learning rate is set to 0.001. The parameter of the batch size of all networks is set to 32.
In addition, all aforementioned networks are implemented in the study on a work station equipped with, i.e., an Intel Core i7-8700 central processing unit (CPU) and four NVIDIA GeForce GTX 3090Ti Central Processing Unit graphics processing units (GPUs).
4.2. Results and Analysis
In this section, five fine-tuned DL networks are performed as the baseline classification networks to evaluate the effectiveness of the constructed RVBD from the following two aspects: overall classification accuracy analysis and class-wise classification accuracy analysis.
- (1)
Overall classification accuracy analysis
The classification performance of the aforementioned five fine-tuned networks using RVBD is analyzed in detail from the overall classification view. As reported in
Table 3, it is even more evident that all five networks consistently perform well, with OA and Kappa metric values both exceeding 0.80. In particular, the values with bold font indicate the highest value in the comparative networks. It is obvious that the ViT network achieves the best performance, and its OA and Kappa metric values are 0.87 and 0.86, respectively. In addition, the relatively worse classification network is HorNet, which also yields reliable accuracy with OA of 0.81 and Kappa of 0.80. The above-excellent OA and Kappa metric values of the five networks indicate that DL networks achieve significant classification ability and the constructed dataset is effective.
- (2)
Class-wise accuracy analysis
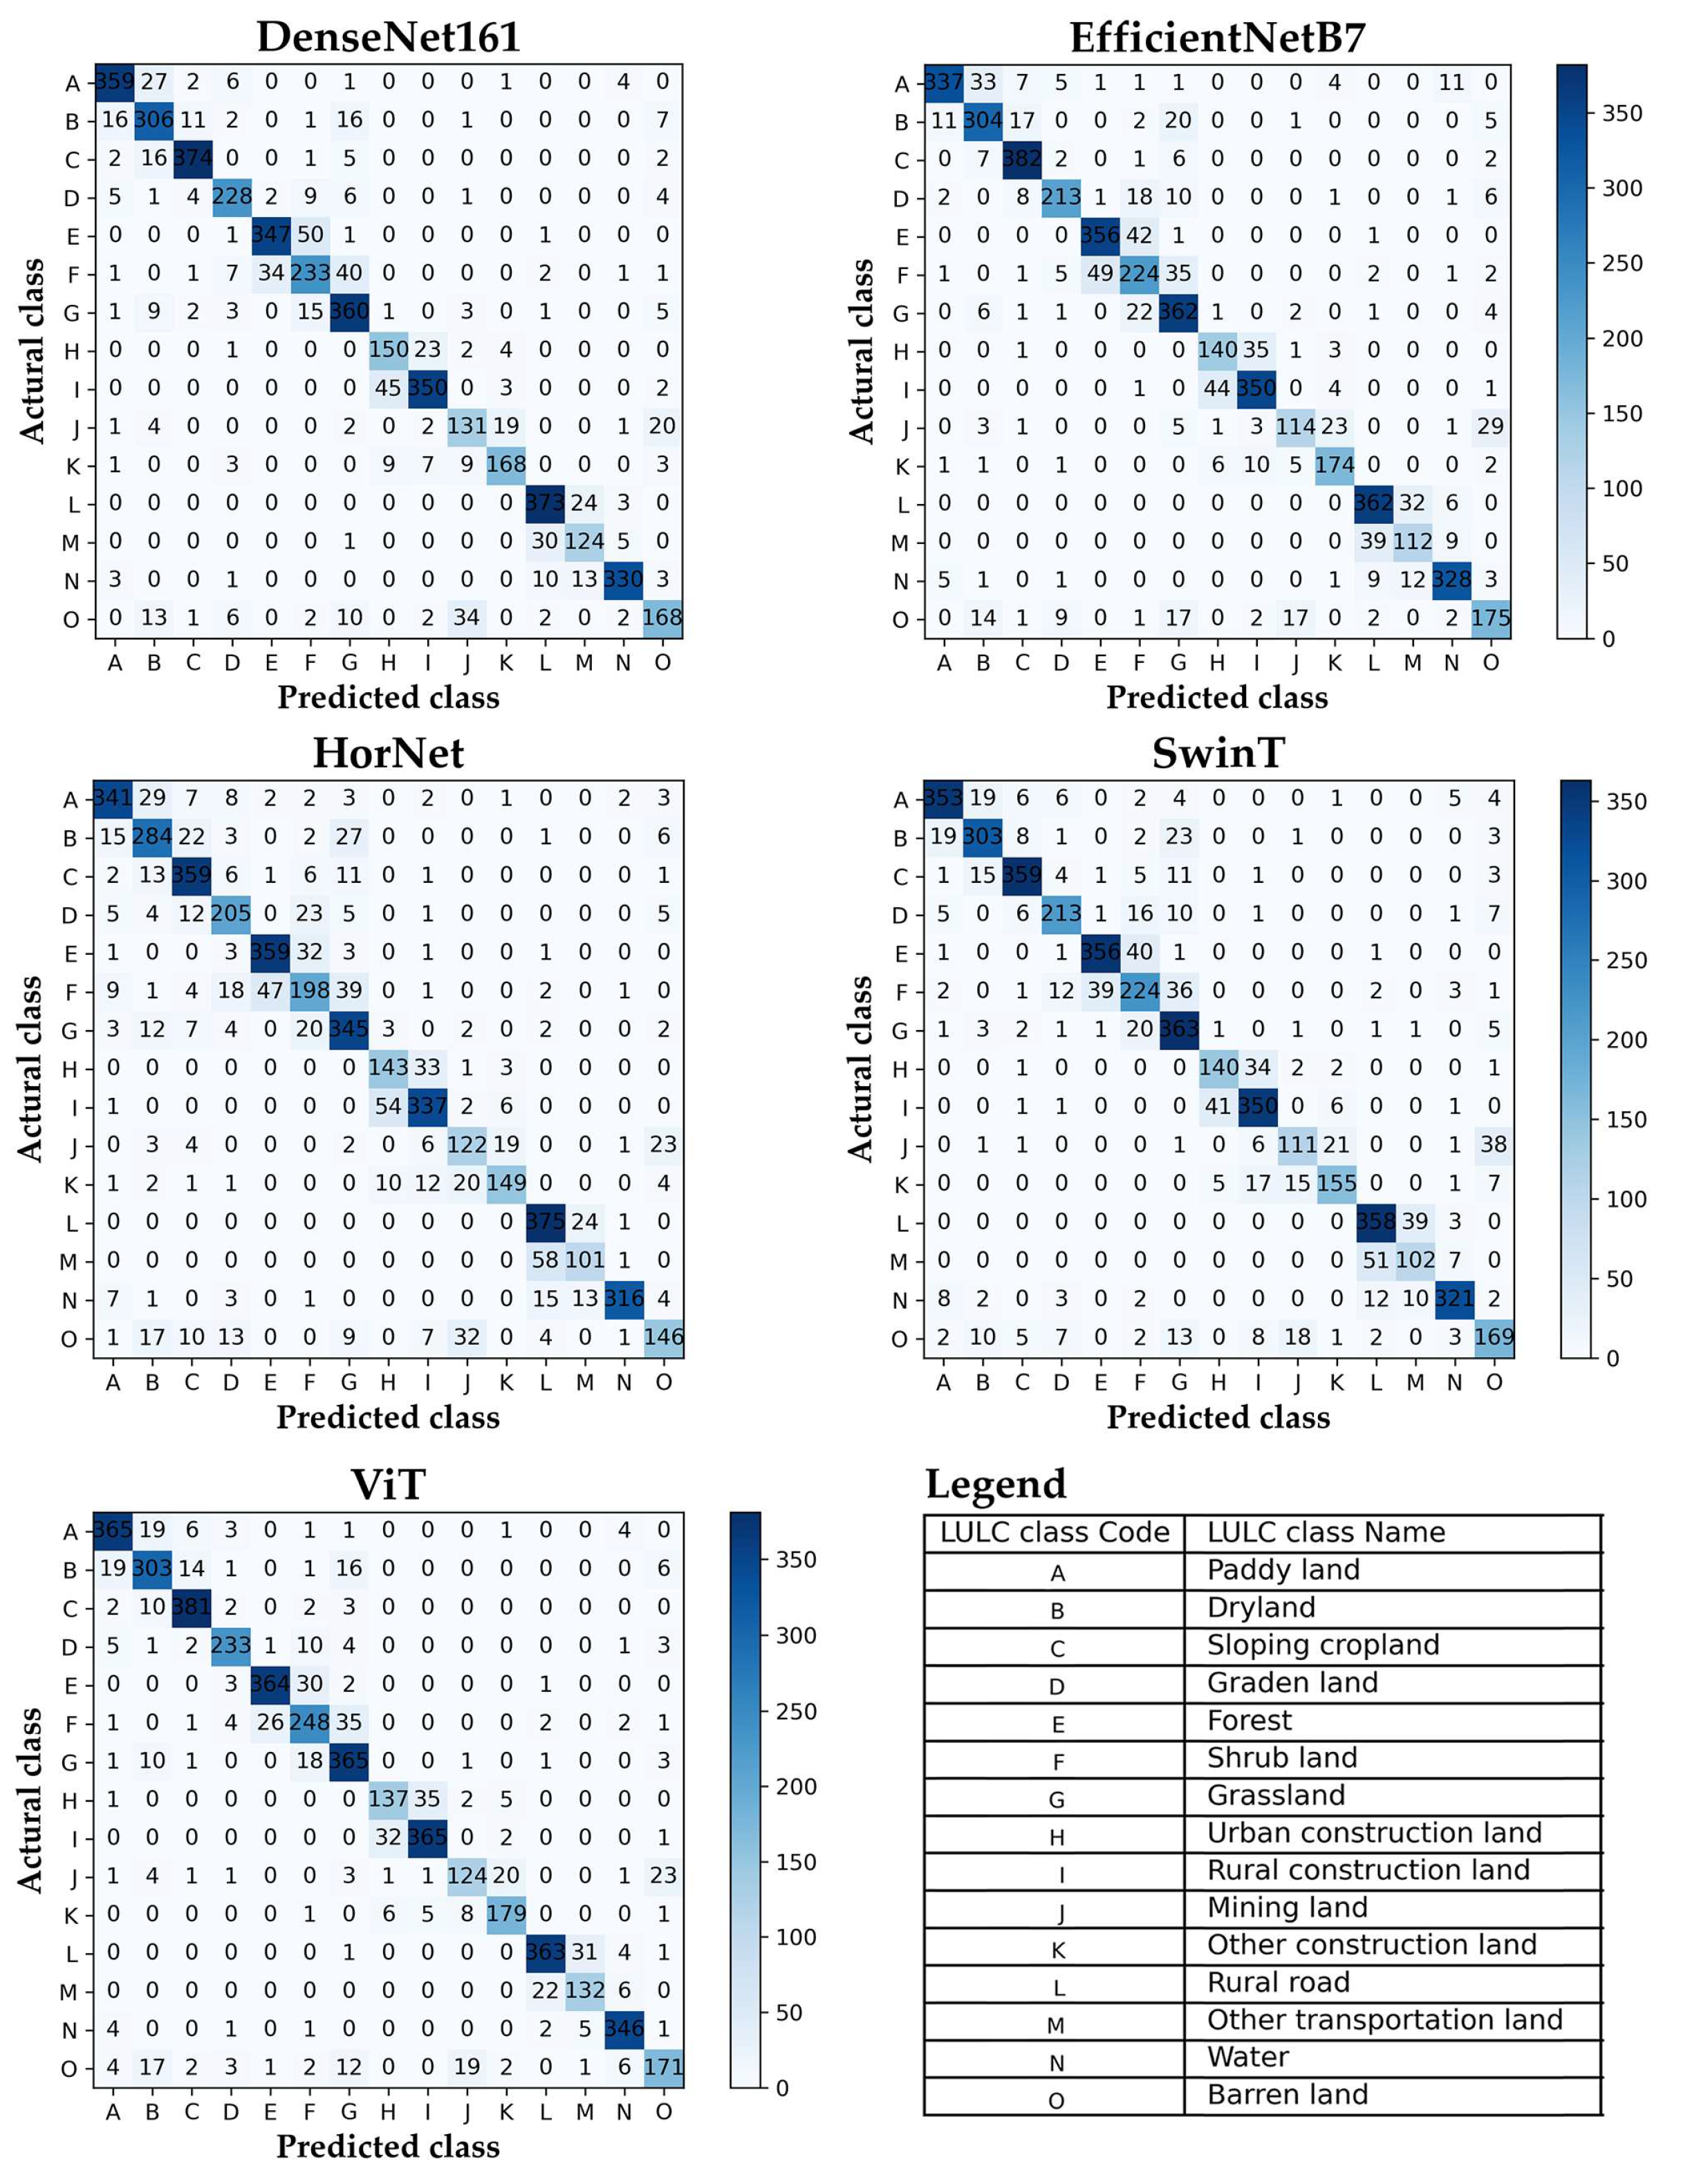
To represent the classification capacity of all the aforementioned networks for each LULC category of RVBD, class-wise accuracy analysis is carried out. The confusion matrixes of all networks are shown in
Figure 6, which represent the classification details for each LULC category. We find that all networks have yielded outstanding classification performance for most LULC categories. Precision, recall, and F
1-score metrics are chosen to quantitatively evaluate the classification performance for each LULC category of RVBD, which are shown in
Table 4,
Table 5, and
Table 6, respectively. It is worth noting that the highest classification values among the five aforementioned DL networks for each LULC category are annotated with bold font.
The results can be obviously observed as the following: (1) the mean values of all metrics (i.e., precision, recall, and F1 score) are basically higher than 0.80 for all chosen networks, which means that all networks represent the excellent and stable classification capacity for each LULC category; (2) the ViT network achieves the best performance on account of yielding the highest values of precision, recall, and F1-score metrics among most LULC categories; (3) the HorNet network has the relatively worst classification capacity compared with other chosen networks; (4) the F1 score is the harmonic mean of the precision and recall metrics. From the view of the F1-score metric, water, sloping cropland, and paddy land have the best classification effect for all chosen DL networks. Rural road, mining land, and shrub land are more easily misclassified.
4.3. Discussion
- (1)
The effectiveness and superiority of RVBD
This paper performs comprehensive experiments based on several outstanding DL baselines to further demonstrate the effectiveness and superiority of the established RVBD. (1) Some reliable accuracy evaluation metrics are selected to evaluate the effectiveness of RVBD. Regardless of the following two aspects of analysis, overall accuracy or class-wise accuracy, the classification results also achieve stable and outstanding performance. (2) The RVBD represents an excellent classification ability with the assist of geometric information. Some LULC categories with representative geometric shapes generally obtain better classification accuracy. For example, water is banded and planar, construction land generally has regular shapes, and other rural transportation land is generally striped. The above-mentioned LULC categories all achieve better F1 scores in all baselines. This indicates that the geometric information provided by vector data is beneficial to improving the classification accuracy. Meanwhile, our method has some substantive and reproducible practices for establishing relative datasets: (1) multiple-source vector data are beneficial for providing references for manual visual interpretation and reducing a certain amount of the workload of sample labeling; (2) field surveys are conducive to sampling remote sensing interpretation keys as references for indoor manual visual interpretation. In addition, it is also conducive for verifying the classification results for correcting the machine errors generated by DL networks and human errors generated by visual interpretation.
- (2)
The applicability of RVBD
The following advantages reflect the stronger applicability of the dataset: (1) the dataset is constructed based on the object-oriented approach. This means that it has complete geometric information, which makes it beneficial for mapping LULC [
73,
90,
91]. (2) The classification system conforms to the national industry standard adopted by the Ministry of Water Resources of the People’s Republic of China. This means that it has higher adaptability to be applied to other relative research. (3) The RVBD is a thematic dataset. This means that it can be applied to conduct SWEA in the Yangtze River Basin. (4) It is conducive to updating the ground-truth data comprehensively. The established dataset integrates raster and vector data, which makes it easy to update the classification results of ground-truth data based on the DL models to the vector data for achieving high-accuracy LULC mapping. (5) It is an excellent solution for a data application flexibility plan. On one hand, our dataset conforms to the national industry standards to construct a land-use/land-cover classification system, which makes it easily and directly applied in other research [
92,
93,
94,
95]; on the other hand, the transfer learning method [
96] could be adopted to train effective DL models for achieving high-accuracy land-use/land-cover mapping in other geographical areas, only depending on a limited number of samples without huge cost.
- (3)
The classification capacity of DL networks
DL networks are further verified to be effective in dealing with a remote sensing classification task. The aforementioned five DL networks are only selected to evaluate the established RVBD. However, the challenge still exists that samples of the established RVBD are easily misclassified, especially for similar LULC categories, because of the phenomenon of the same object with a different spectrum and a foreign body with the same spectrum. Hence, there is ample space for further optimizing DL networks to obtain better classification accuracy.
5. Conclusions
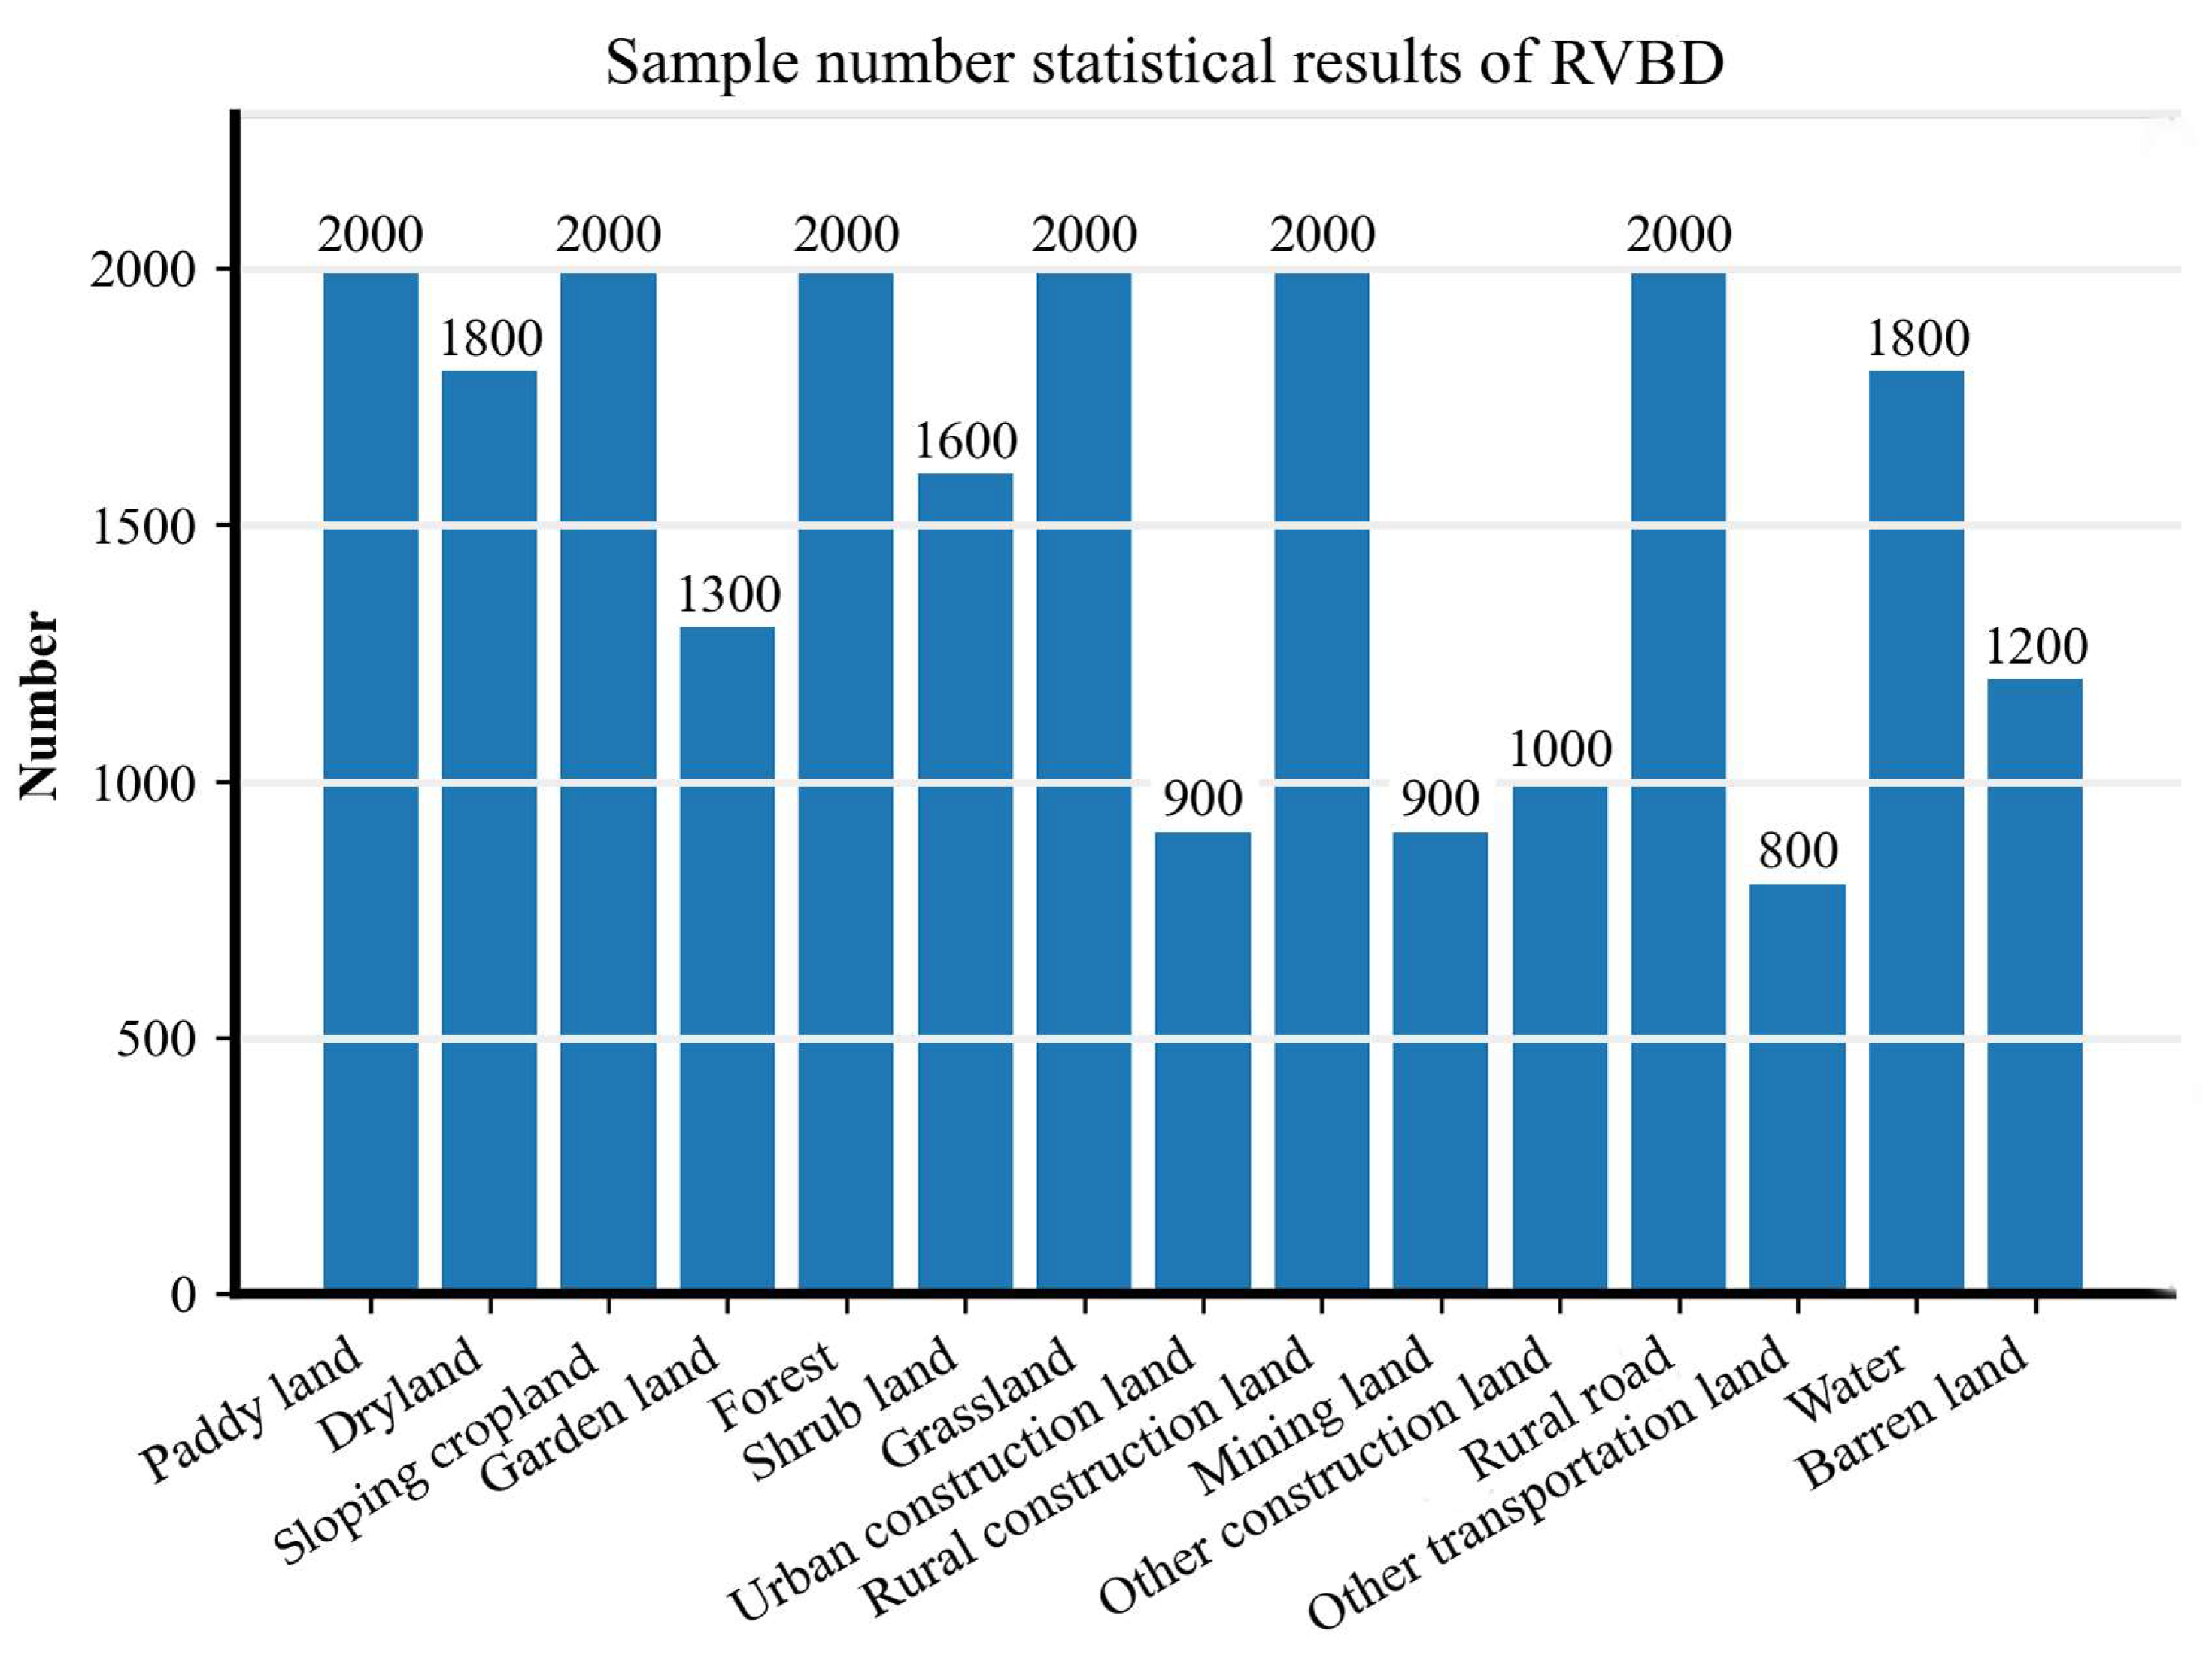
To the best of our knowledge, this paper is the first to construct an RVBD for conducting SWEA in the Yangtze River Basin based on the support of spatio-temporal spectral big data, which conforms the standards of the Ministry of Water Resources of the People’s Republic of China and is based on DL. The RVBD includes 15 LULC categories and 23,300 pairs of object-based samples with corresponding image patches and vector data. It is sampled from Google images with 2 m resolution, which are spread across many countries of the Yangtze River Basin. It is worth noting that five DL networks are introduced to verify the effectiveness of the RVBD by evaluating the classification accuracy from two aspects: overall accuracy analysis and class-wise accuracy analysis. Experimental results verify the effectiveness of the RVBD. Every chosen network achieved remarkable performance, and the ViT network achieves the best classification performance with overall accuracy of 0.87 and Kappa of 0.86.
It is worth noting that the RVBD has broad and flexible applicability significance: (1) it could be utilized to provide high resolution LULC data, which contribute to the research in the Yangtze River basin, such as geographical conditions monitoring [
95], prediction/simulation LULC change [
94], ecosystem service [
92], climate change [
93], and so on; (2) it could be easily applied in other areas because of its inclusion of abundant and diverse LULC categories. On the one hand, the Yangtze River Basin basically covers all the terrain around the world. It has abundant topography with a multi-level and terraced distribution that spans from plateaus to plains; on the other hand, the Yangtze River Basin exhibits diverse climate characteristics, which vary from plateau climate to subtropical monsoon climate to subtropical maritime climate. The above characteristics of natural conditions result in a rich variety of LULC categories except for deserts and glaciers, which allows our dataset to be easily transferred to any geographical area, such as the Yellow River Basin, and even to the world.
In addition to this, our research still contains some limitations: there are no LULC classes on the snow-covered plateau. Especially in the classification data verification of super-large national land, there still are some objective difficulties, as follows: (1) remote sensing images with limited spectral and spatial resolution pose difficulties for visual interpretation. The visual interpretation capacities of different technicians are different, which could inevitably result in misclassification results. (2) Sampling remote sensing interpretation keys by field surveys is difficult. Conducting field surveys is a challenging task for sampling remote sensing interpretation keys and verifying the accuracy of classification results because of the substantial human and financial resources required. In future, we will further improve this dataset in the following promising aspects: (1) the classification ability needs to be further explored and strengthened by incorporating or designing more advanced deep learning models; (2) the generalization ability should be further investigated and enhanced, especially under conditions of few-shot samples, to broaden its application potential. In particular, it lays an intelligent data foundation for SWEA in the Yangtze River Basin, which is beneficial for the promotion and development of the intelligent application of remote sensing.


 ,
, 


