Next Issue
Volume 15, November-1
Previous Issue
Volume 15, October-1
 
 
remotesensing-logo

Journal Browser

Journal Browser

Remote Sens., Volume 15, Issue 20 (October-2 2023) – 182 articles

Cover Story (view full-size image): 
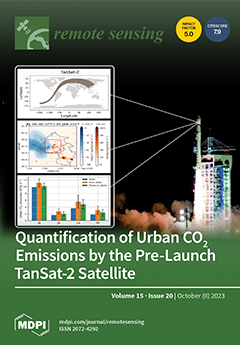
This paper evaluates the theoretical capability of TanSat-2 (the next-generation Chinese greenhouse gas monitoring satellite) to quantify integrated urban CO2 emissions over the cities of Beijing, Jinan, Los Angeles, and Paris. We design a series of numerical experiments to evaluate the impacts of sampling patterns and measurement errors on inferring urban CO2 emissions. The correction in systematic and random flux errors is correlated with the signal-to-noise ratio of satellite-based CO2 measurements. It is feasible to infer urban CO2 emissions from synthetic unbiased TanSat-2 data with a 19–28% correction in random flux errors. This study suggests deploying ground-based atmospheric remote sensing networks to correct systematic errors in satellite measurements and reduce uncertainties in urban CO2 emission estimates. View this paper
  • Issues are regarded as officially published after their release is announced to the table of contents alert mailing list.
  • You may sign up for e-mail alerts to receive table of contents of newly released issues.
  • PDF is the official format for papers published in both, html and pdf forms. To view the papers in pdf format, click on the "PDF Full-text" link, and use the free Adobe Reader to open them.
Order results
Result details
Section
Select all
Export citation of selected articles as:
37 pages, 7107 KiB  
Article
Assessing Spectral Band, Elevation, and Collection Date Combinations for Classifying Salt Marsh Vegetation with Unoccupied Aerial Vehicle (UAV)-Acquired Imagery
by Michael Routhier, Gregg Moore and Barrett Rock
Remote Sens. 2023, 15(20), 5076; https://0-doi-org.brum.beds.ac.uk/10.3390/rs15205076 - 23 Oct 2023
Viewed by 1442
Abstract
New England salt marshes provide many services to humans and the environment, but these landscapes are threatened by drivers such as sea level rise. Mapping the distribution of salt marsh plant species can help resource managers better monitor these ecosystems. Because salt marsh [...] Read more.
New England salt marshes provide many services to humans and the environment, but these landscapes are threatened by drivers such as sea level rise. Mapping the distribution of salt marsh plant species can help resource managers better monitor these ecosystems. Because salt marsh species often have spatial distributions that change over horizontal distances of less than a meter, accurately mapping this type of vegetation requires the use of high-spatial-resolution data. Previous work has proven that unoccupied aerial vehicle (UAV)-acquired imagery can provide this level of spatial resolution. However, despite many advances in remote sensing mapping methods over the last few decades, limited research focuses on which spectral band, elevation layer, and acquisition date combinations produce the most accurate species classification mappings from UAV imagery within salt marsh landscapes. Thus, our work classified and assessed various combinations of these characteristics of UAV imagery for mapping the distribution of plant species within these ecosystems. The results revealed that red, green, and near-infrared camera image band composites produced more accurate image classifications than true-color camera-band composites. The addition of an elevation layer within image composites further improved classification accuracies, particularly between species with similar spectral characteristics, such as two forms of dominant salt marsh cord grasses (Spartina alterniflora) that live at different elevations from each other. Finer assessments of misclassifications between other plant species pairs provided us with additional insights into the dynamics of why classification total accuracies differed between assessed image composites. The results also suggest that seasonality can significantly affect classification accuracies. The methods and findings utilized in this study may provide resource managers with increased precision in detecting otherwise subtle changes in vegetation patterns over time that can inform future management strategies. Full article
(This article belongs to the Special Issue Remote Sensing in Coastal Ecosystem Monitoring)
Show Figures

Graphical abstract

11 pages, 8629 KiB  
Technical Note
A PANN-Based Grid Downscaling Technology and Its Application in Landslide and Flood Modeling
by Binlan Zhang, Chaojun Ouyang, Dongpo Wang, Fulei Wang and Qingsong Xu
Remote Sens. 2023, 15(20), 5075; https://0-doi-org.brum.beds.ac.uk/10.3390/rs15205075 - 23 Oct 2023
Viewed by 963
Abstract
The efficiency and accuracy of grid-based computational fluid dynamics methods are strongly dependent on the chosen cell size. The computational time increases exponentially with decreasing cell size. Therefore, a grid coarsing technology without apparent precision loss is essential for various numerical modeling methods. [...] Read more.
The efficiency and accuracy of grid-based computational fluid dynamics methods are strongly dependent on the chosen cell size. The computational time increases exponentially with decreasing cell size. Therefore, a grid coarsing technology without apparent precision loss is essential for various numerical modeling methods. In this article, a physical adaption neural network (PANN) is proposed to optimize coarse grid representation from a fine grid. A new convolutional neural network is constructed to achieve a significant reduction in computational cost while maintaining a relatively accurate solution. An application to numerical modeling of dynamic processes in landslides is firstly carried out, and better results are obtained compared to the baseline method. More applications in various flood scenarios in mountainous areas are then analyzed. It is demonstrated that the proposed PANN downscaling method outperforms other currently widely used downscaling methods. The code is publicly available and can be applied broadly. Computing by PANN is hundreds of times more efficient, meaning that it is significant for the numerical modeling of various complicated Earth-surface flows and their applications. Full article
(This article belongs to the Special Issue Advanced Techniques for Water-Related Remote Sensing)
Show Figures

Figure 1

20 pages, 4470 KiB  
Article
LiDAR-Generated Images Derived Keypoints Assisted Point Cloud Registration Scheme in Odometry Estimation
by Haizhou Zhang, Xianjia Yu, Sier Ha and Tomi Westerlund
Remote Sens. 2023, 15(20), 5074; https://0-doi-org.brum.beds.ac.uk/10.3390/rs15205074 - 23 Oct 2023
Viewed by 1177
Abstract
Keypoint detection and description play a pivotal role in various robotics and autonomous applications, including Visual Odometry (VO), visual navigation, and Simultaneous Localization And Mapping (SLAM). While a myriad of keypoint detectors and descriptors have been extensively studied in conventional camera images, the [...] Read more.
Keypoint detection and description play a pivotal role in various robotics and autonomous applications, including Visual Odometry (VO), visual navigation, and Simultaneous Localization And Mapping (SLAM). While a myriad of keypoint detectors and descriptors have been extensively studied in conventional camera images, the effectiveness of these techniques in the context of LiDAR-generated images, i.e., reflectivity and ranges images, has not been assessed. These images have gained attention due to their resilience in adverse conditions, such as rain or fog. Additionally, they contain significant textural information that supplements the geometric information provided by LiDAR point clouds in the point cloud registration phase, especially when reliant solely on LiDAR sensors. This addresses the challenge of drift encountered in LiDAR Odometry (LO) within geometrically identical scenarios or where not all the raw point cloud is informative and may even be misleading. This paper aims to analyze the applicability of conventional image keypoint extractors and descriptors on LiDAR-generated images via a comprehensive quantitative investigation. Moreover, we propose a novel approach to enhance the robustness and reliability of LO. After extracting keypoints, we proceed to downsample the point cloud, subsequently integrating it into the point cloud registration phase for the purpose of odometry estimation. Our experiment demonstrates that the proposed approach has comparable accuracy but reduced computational overhead, higher odometry publishing rate, and even superior performance in scenarios prone to drift by using the raw point cloud. This, in turn, lays a foundation for subsequent investigations into the integration of LiDAR-generated images with LO. Full article
(This article belongs to the Special Issue Advances in the Application of Lidar)
Show Figures

Figure 1

20 pages, 5472 KiB  
Article
Global Evaluation and Intercomparison of XCO2 Retrievals from GOSAT, OCO-2, and TANSAT with TCCON
by Junjun Fang, Baozhang Chen, Huifang Zhang, Adil Dilawar, Man Guo, Chunlin Liu, Shu’an Liu, Tewekel Melese Gemechu and Xingying Zhang
Remote Sens. 2023, 15(20), 5073; https://0-doi-org.brum.beds.ac.uk/10.3390/rs15205073 - 23 Oct 2023
Cited by 1 | Viewed by 1087
Abstract
Accurate global monitoring of carbon dioxide (CO2) is essential for understanding climate change and informing policy decisions. This study compares column-averaged dry-air mole fractions of CO2 (XCO2) between ACOS_L2_Lite_FP V9r for Japan’s Greenhouse Gases Observing Satellite (GOSAT), OCO-2_L2_Lite_FP [...] Read more.
Accurate global monitoring of carbon dioxide (CO2) is essential for understanding climate change and informing policy decisions. This study compares column-averaged dry-air mole fractions of CO2 (XCO2) between ACOS_L2_Lite_FP V9r for Japan’s Greenhouse Gases Observing Satellite (GOSAT), OCO-2_L2_Lite_FP V10r for the USA’s Orbiting Carbon Observatory-2 (OCO-2), and IAPCAS V2.0 for China’s Carbon Dioxide Observation Satellite (TANSAT) collectively referred to as GOT, with data from the Total Carbon Column Observing Network (TCCON). Our findings are as follows: (1) Significant data quantity differences exist between OCO-2 and the other satellites, with OCO-2 boasting a data volume 100 times greater. GOT shows the highest data volume between 30–45°N and 20–30°S, but data availability is notably lower near the equator. (2) XCO2 from GOT exhibits similar seasonal variations, with lower concentrations during June, July, and August (JJA) (402.72–403.74 ppm) and higher concentrations during December, January, and February (DJF) (405.74–407.14 ppm). XCO2 levels are higher in the Northern Hemisphere during March, April, and May (MAM) and DJF, while slightly lower during JJA and September, October, and November (SON). (3) The differences in XCO2 (ΔXCO2) reveal that ΔXCO2 between OCO-2 and TANSAT are minor (−0.47 ± 0.28 ppm), whereas the most significant difference is observed between GOSAT and TANSAT (−1.13 ± 0.15 ppm). Minimal differences are seen in SON (with the biggest difference between GOSAT and TANSAT: −0.84 ± 0.12 ppm), while notable differences occur in DJF (with the biggest difference between GOSAT and TANSAT: −1.43 ± 0.17 ppm). Regarding latitudinal variations, distinctions between OCO-2 and TANSAT are most pronounced in JJA and SON. (4) Compared to TCCON, XCO2 from GOT exhibits relatively high determination coefficients (R2 > 0.8), with GOSAT having the highest root mean square error (RMSE = 1.226 ppm, <1.5 ppm), indicating a strong relationship between ground-based observed and retrieved values. This research contributes significantly to our understanding of the spatial characteristics of global XCO2. Furthermore, it offers insights that can inform the analysis of differences in the inversion of carbon sources and sinks within assimilation systems when incorporating XCO2 data from satellite observations. Full article
(This article belongs to the Section Atmospheric Remote Sensing)
Show Figures

Figure 1

19 pages, 956 KiB  
Article
SID-TGAN: A Transformer-Based Generative Adversarial Network for Sonar Image Despeckling
by Xin Zhou, Kun Tian, Zihan Zhou, Bo Ning and Yanhao Wang
Remote Sens. 2023, 15(20), 5072; https://0-doi-org.brum.beds.ac.uk/10.3390/rs15205072 - 23 Oct 2023
Cited by 1 | Viewed by 1060
Abstract
Sonar images are inherently affected by speckle noise, which degrades image quality and hinders image exploitation. Despeckling is an important pre-processing task that aims to remove such noise so as to improve the accuracy of analysis tasks on sonar images. In this paper, [...] Read more.
Sonar images are inherently affected by speckle noise, which degrades image quality and hinders image exploitation. Despeckling is an important pre-processing task that aims to remove such noise so as to improve the accuracy of analysis tasks on sonar images. In this paper, we propose a novel transformer-based generative adversarial network named SID-TGAN for sonar image despeckling. In the SID-TGAN framework, transformer and convolutional blocks are used to extract global and local features, which are further integrated into the generator and discriminator networks for feature fusion and enhancement. By leveraging adversarial training, SID-TGAN learns more comprehensive representations of sonar images and shows outstanding performance in speckle denoising. Meanwhile, SID-TGAN introduces a new adversarial loss function that combines image content, local texture style, and global similarity to reduce image distortion and information loss during training. Finally, we compare SID-TGAN with state-of-the-art despeckling methods on one image dataset with synthetic optical noise and four real sonar image datasets. The results show that it achieves significantly better despeckling performance than existing methods on all five datasets. Full article
Show Figures

Figure 1

15 pages, 10515 KiB  
Technical Note
A DeturNet-Based Method for Recovering Images Degraded by Atmospheric Turbulence
by Xiangxi Li, Xingling Liu, Weilong Wei, Xing Zhong, Haotong Ma and Junqiu Chu
Remote Sens. 2023, 15(20), 5071; https://0-doi-org.brum.beds.ac.uk/10.3390/rs15205071 - 23 Oct 2023
Viewed by 950
Abstract
Atmospheric turbulence is one of the main issues causing image blurring, dithering, and other degradation problems when detecting targets over long distances. Due to the randomness of turbulence, degraded images are hard to restore directly using traditional methods. With the rapid development of [...] Read more.
Atmospheric turbulence is one of the main issues causing image blurring, dithering, and other degradation problems when detecting targets over long distances. Due to the randomness of turbulence, degraded images are hard to restore directly using traditional methods. With the rapid development of deep learning, blurred images can be restored correctly and directly by establishing a nonlinear mapping relationship between the degraded and initial objects based on neural networks. These data-driven end-to-end neural networks offer advantages in turbulence image reconstruction due to their real-time properties and simplified optical systems. In this paper, inspired by the connection between the turbulence phase diagram characteristics and the attentional mechanisms for neural networks, we propose a new deep neural network called DeturNet to enhance the network’s performance and improve the quality of image reconstruction results. DeturNet employs global information aggregation operations and amplifies notable cross-dimensional reception regions, thereby contributing to the recovery of turbulence-degraded images. Full article
Show Figures

Figure 1

25 pages, 17826 KiB  
Article
Estimation of Lightning Activity of Squall Lines by Different Lightning Parameterization Schemes in the Weather Research and Forecasting Model
by Dongxia Liu, Han Yu and Chunfa Sun
Remote Sens. 2023, 15(20), 5070; https://0-doi-org.brum.beds.ac.uk/10.3390/rs15205070 - 23 Oct 2023
Viewed by 960
Abstract
Based on three-dimensional lightning data and an S-band Doppler radar, a strong relationship was identified between lightning activity and the radar volume of squall lines. A detailed analysis of the squall line investigates the relationship following an exponential relationship. According to the correlation [...] Read more.
Based on three-dimensional lightning data and an S-band Doppler radar, a strong relationship was identified between lightning activity and the radar volume of squall lines. A detailed analysis of the squall line investigates the relationship following an exponential relationship. According to the correlation between lightning and the radar volume, three radar-volume-based lightning parameterization schemes, named the V30dBZ, V35dBZ, and V40dBZ lightning schemes, have been established and introduced into the weather research and forecasting (WRF) model. The performance of lightning precondition by different lightning parameterization schemes was evaluated, including the radar-volume-based schemes (V30dBZ, V35dBZ, and V40dBZ), as well as existing lightning schemes (PR92_1, PR92_2, and the Lightning Potential Index (LPI)). The evaluation shows that the simulated spatial lightning density and temporal lightning frequency by the radar-volume-based lightning schemes are more consistent with the observations. While the two PR_92 lightning schemes significantly underestimated the magnitude of lightning density. The radar-volume-based lightning parameterization schemes are proven to be more reliable in estimating lightning activity than other lightning schemes. Full article
Show Figures

Figure 1

19 pages, 26823 KiB  
Article
Comprehensive Evaluation of Spatial Distribution and Temporal Trend of NO2, SO2 and AOD Using Satellite Observations over South and East Asia from 2011 to 2021
by Md Masudur Rahman, Shuo Wang, Weixiong Zhao, Arfan Arshad, Weijun Zhang and Cenlin He
Remote Sens. 2023, 15(20), 5069; https://0-doi-org.brum.beds.ac.uk/10.3390/rs15205069 - 23 Oct 2023
Cited by 1 | Viewed by 1187
Abstract
The past decade has witnessed remarkable economic development, marked by rapid industrialization and urbanization across Asian regions. This surge in economic activity has led to significant emissions, resulting in alarming levels of air pollution. Our study comprehensively assessed the spatial and temporal trends [...] Read more.
The past decade has witnessed remarkable economic development, marked by rapid industrialization and urbanization across Asian regions. This surge in economic activity has led to significant emissions, resulting in alarming levels of air pollution. Our study comprehensively assessed the spatial and temporal trends of key pollutants, namely nitrogen dioxide (NO2), sulfur dioxide (SO2), and aerosol (using aerosol optical depth (AOD) at 550 nm as an indicator), from 2011 to 2021. The data sources utilized include OMI onboard the Aura satellite for NO2 and SO2, as well as MODIS onboard Terra and Aqua satellites for AOD. The results from spatial and temporal trend analyses of the three parameters show that there is a clear declining trend over China and Republic of Korea (e.g., NO2 is declining with an overall rate of −7.8 × 10¹² molecules/cm2/year over China) due to the strict implementation of air pollution control policies. However, it is essential to note that both countries still grapple with substantial pollution levels, with proportions exceeding 0.5, indicating that air quality is improving but has not yet reached a safe threshold. In contrast, South Asian regions, including Bangladesh, Pakistan, and India, are experiencing an increasing trend (e.g., NO2 is increasing with an overall rate of 1.2 × 10¹² molecules/cm2/year in Bangladesh), primarily due to the lack of rigorous air pollution control policies. The average emissions of NO2 and SO2 were remarkably higher in winter than in summer. Notably, the identified hotspots are statistically significant and predominantly coincide with densely populated areas, such as the North China Plain (NCP). Furthermore, this study underscores the pivotal role of sector-wise emissions in air quality monitoring and improvement. Different cities are primarily influenced by emissions from specific sectors, emphasizing the need for targeted pollution control measures. The findings presented in this research contribute valuable insights to the air quality monitoring and improvement efforts in East and South Asian regions. Full article
(This article belongs to the Section Atmospheric Remote Sensing)
Show Figures

Figure 1

19 pages, 5245 KiB  
Article
Raindrop Size Distribution Characteristics of Heavy Precipitation Events Based on a PWS100 Disdrometer in the Alpine Mountains, Eastern Tianshan, China
by Puchen Chen, Puyu Wang, Zhongqin Li, Yefei Yang, Yufeng Jia, Min Yang, Jiajia Peng and Hongliang Li
Remote Sens. 2023, 15(20), 5068; https://0-doi-org.brum.beds.ac.uk/10.3390/rs15205068 - 23 Oct 2023
Viewed by 917
Abstract
As a key component of the hydrological cycle, knowledge and comprehension of precipitation formation and evolution are of leading significance. This study investigates the statistical characteristics of raindrop size distribution for heavy precipitation events with observations collected by a Present Weather Sensor (PWS100) [...] Read more.
As a key component of the hydrological cycle, knowledge and comprehension of precipitation formation and evolution are of leading significance. This study investigates the statistical characteristics of raindrop size distribution for heavy precipitation events with observations collected by a Present Weather Sensor (PWS100) disdrometer located in the alpine area of eastern Tianshan, China. The characteristics are quantified based on heavy rain, heavy snow, and hail precipitation events classified using the rainfall intensity and the precipitation-related weather codes (US National Weather Service). On average, the heavy precipitation events in the headwaters of the Urumqi River are dominated by medium-sized (2–4 mm) raindrops. As well, we investigate mass-weighted mean diameter–normalized intercept parameter scatterplots, which demonstrate that the heavy precipitation events in alpine regions of the Tianshan Mountains can be identified as maritime-like clusters. The concentration of raindrops in heavy precipitation is the highest overall, while the concentration of raindrops in heavy snow is the lowest when the diameter is lower than 1.3 mm. The power–law relationships of radar reflectivity (Z) and rain rate (R) [Z = ARb] for the heavy rain, heavy snow, and hail precipitation events are also calculated. The Z–R relationship of heavy rain and heavy snow in this work has a lower coefficient value of A (10 and 228.7, respectively) and a higher index value of b (2.6 and 2.1, respectively), and the hail events are the opposite (A = 551.5, b = 1.3), compared to the empirical relation (Z = 300R1.4). Furthermore, the possible thermodynamics and general atmospheric circulation that cause the distinctions in the raindrop size distribution characteristics between alpine areas and other parts of the Tianshan Mountains are also debated in this work. The headwaters of the Urumqi River in alpine areas have relatively colder and wetter surroundings in the near-surface layer than the foothills of the Tianshan Mountains during the precipitation process. Meanwhile, a lower temperature, a higher relative humidity, a more efficient collision coalescence mechanism, and glacier local microclimate effects (temperature jump, inverse glacier temperature, glacier wind) at the headwaters of the Urumqi River during the precipitation process are probably partly responsible for more medium- and large-size drops in the mountains. Full article
Show Figures

Graphical abstract

23 pages, 34669 KiB  
Article
Assessment of Combined Reflectance, Transmittance, and Absorbance Hyperspectral Sensors for Prediction of Chlorophyll a Fluorescence Parameters
by Renan Falcioni, Werner Camargos Antunes, Roney Berti de Oliveira, Marcelo Luiz Chicati, José Alexandre M. Demattê and Marcos Rafael Nanni
Remote Sens. 2023, 15(20), 5067; https://0-doi-org.brum.beds.ac.uk/10.3390/rs15205067 - 22 Oct 2023
Viewed by 1367
Abstract
Photosynthesis is a key process in plant physiology. Understanding its mechanisms is crucial for optimizing crop yields and for environmental monitoring across a diverse range of plants. In this study, we employed reflectance, transmittance, and absorbance hyperspectral sensors and utilized multivariate statistical techniques [...] Read more.
Photosynthesis is a key process in plant physiology. Understanding its mechanisms is crucial for optimizing crop yields and for environmental monitoring across a diverse range of plants. In this study, we employed reflectance, transmittance, and absorbance hyperspectral sensors and utilized multivariate statistical techniques to improve the predictive models for chlorophyll a fluorescence (ChlF) parameters in Hibiscus and Geranium model plants. Our objective was to identify spectral bands within hyperspectral data that correlate with ChlF indicators using high-resolution data spanning the electromagnetic spectrum from ultraviolet to shortwave infrared (UV–VIS–NIR–SWIR). Utilizing the hyperspectral vegetation indices (HVIs) tool to align importance projection for wavelength preselection and select the most responsive wavelength by variable importance projection (VIP), we optimized partial least squares regression (PLSR) models to enhance predictive accuracy. Our findings revealed a strong relationship between hyperspectral sensor data and ChlF parameters. Employing principal component analysis, kappa coefficients (k), and accuracy (Acc) evaluations, we achieved values exceeding 86% of the predicted ChlF parameters for both Hibiscus and Geranium plants. Regression models for parameters such as Ψ(EO), ϕ(PO), ϕ(EO), ϕ(DO), δRo, ρRo, Kn, Kp, SFI(abs), PI(abs), and D.F. demonstrated model accuracies close to 0.84 for R2 and approximately 1.96 for RPD. The spectral regions linked with these parameters included blue, green, red, infrared, SWIR1, and SWIR2, emphasizing their relevance for noninvasive evaluations. This research demonstrates the ability of hyperspectral sensors to noninvasively predict chlorophyll a fluorescence (ChlF) parameters, which are essential for assessing photosynthetic efficiency in plants. Notably, hyperspectral absorbance data were more accurate in predicting JIP-test-based chlorophyll a kinetic parameters. In conclusion, this study underscores the potential of hyperspectral sensors for deepening our understanding of plant photosynthesis and monitoring plant health. Full article
Show Figures

Figure 1

17 pages, 3389 KiB  
Article
Similarity and Change Detection of Relief in a Proglacial River Valley (Scott River, SW Svalbard)
by Leszek Gawrysiak and Waldemar Kociuba
Remote Sens. 2023, 15(20), 5066; https://0-doi-org.brum.beds.ac.uk/10.3390/rs15205066 - 22 Oct 2023
Viewed by 854
Abstract
This study focuses on contemporary geomorphic changes in the proglacial valley floor of the Scott River catchment (northwest of Wedel Jarlsberg Land, southwestern Spitsbergen). The similarity and variability of landforms along the entire 3.3 km length of the unglaciated valley floor was assessed [...] Read more.
This study focuses on contemporary geomorphic changes in the proglacial valley floor of the Scott River catchment (northwest of Wedel Jarlsberg Land, southwestern Spitsbergen). The similarity and variability of landforms along the entire 3.3 km length of the unglaciated valley floor was assessed using precision terrestrial laser scanning (TLS) measurements made in July/August 2010–2013. Digital terrain models (DTMs) were generated from the high-resolution TLS survey data, followed by a geomorphon map, which was then used for a similarity and changes of morphology analysis performed with GeoPAT2 software. The study revealed a large spatial variation of contemporary processes shaping the valley floor and changes in its morphology. Their spatial distribution relates to the geologically determined split of the valley floor into three morphological zones separated by gorges. The upper gorge cuts the terminal moraine rampart, which limits the uppermost section of the valley floor, which is up to 700 m wide and is occupied by the outwash plain. The study showed that this is the area characterised by the greatest dynamics of contemporary geomorphic processes and relief changes. The similarity index value here is characterised by a large spatial variation that in some places reaches values close to 0. In the middle section stretching between the upper gorge (cutting the terminal moraine) and the lower gorge (cutting the elevated marine terraces), a much smaller variability of processes and landforms is observed, and the found changes of the valley floor relief mainly include the area of braided channel activity. Similarity index values in this zone do not fall below 0.65. The lowest section, the mouth of the alluvial fan, on the other hand, is characterised by considerable spatial differentiation. The southern part of the fan is stable, while the northern part is intensively re-shaped and has a similarity index that locally falls below 0.5. The most dynamic changes are found within the active channel system along the entire length of the unglaciated section of the Scott River. The peripheral areas, located in the outer zones of the valley floor, show great stability. Full article
(This article belongs to the Special Issue Recent Advances in GIS Techniques for Remote Sensing)
Show Figures

Figure 1

18 pages, 9706 KiB  
Article
Satellite-Based Evaluation of Submarine Permafrost Erosion at Shallow Offshore Areas in the Laptev Sea
by Alexander Osadchiev, Polina Adamovskaya, Stanislav Myslenkov, Oleg Dudarev and Igor Semiletov
Remote Sens. 2023, 15(20), 5065; https://0-doi-org.brum.beds.ac.uk/10.3390/rs15205065 - 22 Oct 2023
Cited by 1 | Viewed by 1031
Abstract
Large areas of the seafloor in the Laptev Sea consist of submarine permafrost, which has experienced intense degradation over the last decades and centuries. Thermal abrasion of the submarine permafrost results in upward advection of suspended matter, which could reach the surface layer [...] Read more.
Large areas of the seafloor in the Laptev Sea consist of submarine permafrost, which has experienced intense degradation over the last decades and centuries. Thermal abrasion of the submarine permafrost results in upward advection of suspended matter, which could reach the surface layer in shallow areas. This process is visually manifested through increased turbidity of the sea surface layer, which is regularly detected in optical satellite imagery of the study areas. In this study, satellite data, wind and wave reanalysis, as well as in situ measurements are analyzed in order to reveal the main mechanisms of seafloor erosion in shallow areas of the Laptev Sea. We describe the synoptic variability in erosion at the Vasilyevskaya and Semenovskaya shoals in response to wind and wave conditions. Finally, using reanalysis data, daily suspended matter flux from this area was evaluated during ice-free periods in 1979–2021, and its seasonal and inter-annual variabilities were described. The obtained results contribute to our understanding of subsea permafrost degradation, the sediment budget, and carbon and nutrient cycles in the Laptev Sea. Full article
Show Figures

Figure 1

22 pages, 12136 KiB  
Article
The Use of a Stable Super-Resolution Generative Adversarial Network (SSRGAN) on Remote Sensing Images
by Boyu Pang, Siwei Zhao and Yinnian Liu
Remote Sens. 2023, 15(20), 5064; https://0-doi-org.brum.beds.ac.uk/10.3390/rs15205064 - 22 Oct 2023
Cited by 2 | Viewed by 1060
Abstract
Because of the complicated imaging conditions in space and the finite imaging systems on satellites, the resolution of remote sensing images is limited. The process of increasing an image’s resolution, image super-resolution, aims to obtain a clearer image. High-resolution (HR) images are affected [...] Read more.
Because of the complicated imaging conditions in space and the finite imaging systems on satellites, the resolution of remote sensing images is limited. The process of increasing an image’s resolution, image super-resolution, aims to obtain a clearer image. High-resolution (HR) images are affected by various input conditions, such as motion, imaging blur, down-sampling matrix, and various types of noise. Changes in these conditions seriously affect low-resolution (LR) images, so if the imaging process is a pathological problem, super-resolution reconstruction is a pathological anti-problem. To optimize the imaging quality of satellites without changing the optical system, we chose to reconstruct images acquired by satellites using deep learning. We changed the original super-resolution generative adversarial nets network, upgraded the generator’s network part to ResNet-50, and inserted an additional fully connected (FC) layer in the network of the discriminator part. We also modified the loss function by changing the weight of regularization loss from 2 × 10⁻⁸ to 2 × 10⁻⁹, aiming to preserve more detail. In addition, we carefully and specifically chose remote sensing images taken under low-light circumstances from GF-5 satellites to form a new dataset for training and validation. The test results proved that our method can obtain good results. The reconstruction peak signal-to-noise ratio (PSNR) at the scaling factors of 2, 3, and 4 reached 32.6847, 31.8191, and 30.5095 dB, respectively, and the corresponding structural similarity (SSIM) reached 0.8962, 0.8434, and 0.8124. The super-resolution speed was also satisfactory, making real-time reconstruction more probable. Full article
(This article belongs to the Topic Hyperspectral Imaging and Signal Processing)
Show Figures

Figure 1

24 pages, 17199 KiB  
Article
Polar Sea Ice Detection Using a Rotating Fan Beam Scatterometer
by Liling Liu, Xiaolong Dong, Wenming Lin and Shuyan Lang
Remote Sens. 2023, 15(20), 5063; https://0-doi-org.brum.beds.ac.uk/10.3390/rs15205063 - 21 Oct 2023
Cited by 2 | Viewed by 1219
Abstract
Scatterometers are dedicated to monitoring sea surface wind vectors, but they also provide valuable data for polar applications. As a new type of scatterometer, the rotating fan beam scatterometer delivers a higher diversity of incidence angles and more azimuth sampling. The paper takes [...] Read more.
Scatterometers are dedicated to monitoring sea surface wind vectors, but they also provide valuable data for polar applications. As a new type of scatterometer, the rotating fan beam scatterometer delivers a higher diversity of incidence angles and more azimuth sampling. The paper takes the first rotating fan beam scatterometer, the China France Oceanography Satellite scatterometer (CSCAT), as an example to explore the effectiveness of this new type of scatterometer in polar sea ice detection. In this paper, a Bayesian method with consideration of geometric characteristics of CSCAT is developed for sea ice detection. The implementation of this method includes the definition of CSCAT backscatter space, an estimation of the sea ice Physical Model Function (GMF), a calculation of the sea ice backscatter distance to the sea ice GMF, a probability distribution function (PDF) estimation of the square distance to the GMF (sea ice GMF and wind GMF), and a calculation of the sea ice Bayesian posterior probability. This algorithm was used to generate a daily CSCAT polar sea ice mask during the CSCAT mission period (2019–2022) (by setting a 55% threshold on the Bayesian posterior probability). The sea ice masks were validated against passive microwaves by quantitatively comparing the sea ice edges and extents. The validation suggests that the CSCAT sea ice edge and extent show good agreement with the sea ice concentration distribution (i.e., sea ice concentration ≥ 15%) of the Advanced Microwave Scanning Radiometer 2 (AMSR2). The average Euclidean distance of the sea ice edges was basically less than 12.5 km, and the deviation of the sea ice extents was less than 0.3 × 10⁶ km2. Full article
(This article belongs to the Section Ocean Remote Sensing)
Show Figures

Graphical abstract

34 pages, 3652 KiB  
Review
A Review of GAN-Based Super-Resolution Reconstruction for Optical Remote Sensing Images
by Xuan Wang, Lijun Sun, Abdellah Chehri and Yongchao Song
Remote Sens. 2023, 15(20), 5062; https://0-doi-org.brum.beds.ac.uk/10.3390/rs15205062 - 21 Oct 2023
Cited by 2 | Viewed by 3155
Abstract
High-resolution images have a wide range of applications in image compression, remote sensing, medical imaging, public safety, and other fields. The primary objective of super-resolution reconstruction of images is to reconstruct a given low-resolution image into a corresponding high-resolution image by a specific [...] Read more.
High-resolution images have a wide range of applications in image compression, remote sensing, medical imaging, public safety, and other fields. The primary objective of super-resolution reconstruction of images is to reconstruct a given low-resolution image into a corresponding high-resolution image by a specific algorithm. With the emergence and swift advancement of generative adversarial networks (GANs), image super-resolution reconstruction is experiencing a new era of progress. Unfortunately, there has been a lack of comprehensive efforts to bring together the advancements made in the field of super-resolution reconstruction using generative adversarial networks. Hence, this paper presents a comprehensive overview of the super-resolution image reconstruction technique that utilizes generative adversarial networks. Initially, we examine the operational principles of generative adversarial networks, followed by an overview of the relevant research and background information on reconstructing remote sensing images through super-resolution techniques. Next, we discuss significant research on generative adversarial networks in high-resolution image reconstruction. We cover various aspects, such as datasets, evaluation criteria, and conventional models used for image reconstruction. Subsequently, the super-resolution reconstruction models based on generative adversarial networks are categorized based on whether the kernel blurring function is recognized and utilized during training. We provide a brief overview of the utilization of generative adversarial network models in analyzing remote sensing imagery. In conclusion, we present a prospective analysis of forthcoming research directions pertaining to super-resolution reconstruction methods that rely on generative adversarial networks. Full article
(This article belongs to the Special Issue Weakly Supervised Deep Learning in Exploiting Remote Sensing Big Data)
Show Figures

Figure 1

22 pages, 12575 KiB  
Article
Identifying Major Diurnal Patterns and Drivers of Surface Urban Heat Island Intensities across Local Climate Zones
by Yongjuan Guan, Jinling Quan, Ting Ma, Shisong Cao, Chengdong Xu and Jiali Guo
Remote Sens. 2023, 15(20), 5061; https://0-doi-org.brum.beds.ac.uk/10.3390/rs15205061 - 21 Oct 2023
Cited by 1 | Viewed by 1209
Abstract
Deepening the understanding of diurnal characteristics and driving mechanisms of surface urban heat islands (SUHIs) across different local climate zones (LCZs) and time scales is of great significance for guiding urban surface heat mitigation. However, a comprehensive investigation of SUHIs from the diurnal, [...] Read more.
Deepening the understanding of diurnal characteristics and driving mechanisms of surface urban heat islands (SUHIs) across different local climate zones (LCZs) and time scales is of great significance for guiding urban surface heat mitigation. However, a comprehensive investigation of SUHIs from the diurnal, local, multi-seasonal, and interactive perspectives remains a large gap. Here, we generalized major diurnal patterns of LCZ-based SUHI intensities (SUHIIs) throughout 2020 over the urban area of Beijing, China, based on diurnal temperature cycle modeling, block-level LCZ mapping, and hierarchical clustering. A geographical detector was then employed to explore the individual and interactive impacts of 10 morphological, socioeconomic, and meteorological factors on the multi-temporal spatial differentiations of SUHIIs. Results indicate six prevalent diurnal SUHII patterns with distinct features among built LCZ types. LCZs 4 and 5 (open high- and mid-rise buildings) predominantly display patterns one, two, and five, characterized by an afternoon increase and persistently higher values during the night. Conversely, LCZs 6, 8, and 9 (open, large, and sparsely built low-rise buildings) mainly exhibit patterns three, four, and six, with a decrease in SUHII during the afternoon and lower intensities at night. The maximum/minimum SUHIIs occur in the afternoon–evening/morning for patterns 1–3 but in the morning/afternoon for patterns 5–6. In all four seasons, the enhanced vegetation index (EVI) and gross domestic product (GDP) have the top two individual effects for daytime spatial differentiations of SUHIIs, while the air temperature (TEM) has the largest explanatory power for nighttime differentiations of SUHIIs. All factor interactions are categorized as two-factor or nonlinear enhancements, where nighttime interactions exhibit notably greater explanatory powers than daytime ones. The strongest interactions are EVI ∩ GDP (q = 0.80) during the day and TEM ∩ EVI (q = 0.86) at night. The findings of this study contribute to an improved interpretation of the diurnal continuous dynamics of local SUHIIs in response to various environmental conditions. Full article
Show Figures

Graphical abstract

18 pages, 17063 KiB  
Article
Volume Estimation of Stem Segments Based on a Tetrahedron Model Using Terrestrial Laser Scanning Data
by Lei You, Xiaosa Chang, Yian Sun, Yong Pang, Yan Feng and Xinyu Song
Remote Sens. 2023, 15(20), 5060; https://0-doi-org.brum.beds.ac.uk/10.3390/rs15205060 - 21 Oct 2023
Viewed by 1081
Abstract
Stem volume is a very important parameter in forestry inventory and carbon storage. The stem volume estimated by most existing methods deviates from its true value because the irregularity of the stem is usually overlooked. In this study, we propose a stem segment [...] Read more.
Stem volume is a very important parameter in forestry inventory and carbon storage. The stem volume estimated by most existing methods deviates from its true value because the irregularity of the stem is usually overlooked. In this study, we propose a stem segment volume estimation based on the tetrahedron model using TLS data. First, the initial stem segment surface model, including the lower, upper, and outer triangular surface models, was gradually reconstructed. Next, the outer surface model was subdivided based on the edge subdivision. Then, a closed triangular surface model without self-intersection was obtained. Afterward, a tetrahedron model of the stem segment was generated using TetGen software (Version 1.6.0) for the triangular surface model. Finally, the stem segment volume was calculated by summing the volumes of all the tetrahedrons in the tetrahedron model. An experiment with 76 stem segments from different tree species with different parameters showed that the reconstructed stem segment surface model effectively reflected the geometrical features of the stem segment surface. Compared to the volume based on the simulated sectional measurement, the MAPE of the volume based on the tetrahedron model was 2.12%. The results demonstrated the validity of the presented method for stem surface reconstruction and stem volume estimation, and the volume based on the tetrahedron model was closer to the true value than that based on the sectional measurement. Full article
(This article belongs to the Special Issue 3D Point Clouds in Forest Remote Sensing III)
Show Figures

Figure 1

15 pages, 10654 KiB  
Technical Note
Simulation of Thermal Infrared Brightness Temperatures from an Ocean Color and Temperature Scanner Onboard a New Generation Chinese Ocean Color Observation Satellite
by Liqin Qu, Mingkun Liu and Lei Guan
Remote Sens. 2023, 15(20), 5059; https://0-doi-org.brum.beds.ac.uk/10.3390/rs15205059 - 21 Oct 2023
Viewed by 893
Abstract
Since 2002, China has launched four Haiyang-1 (HY-1) satellites equipped with the Chinese Ocean Color and Temperature Scanner (COCTS), which can observe the sea surface temperature (SST). The planned new generation ocean color observation satellites also carry a sensor for observing the SST [...] Read more.
Since 2002, China has launched four Haiyang-1 (HY-1) satellites equipped with the Chinese Ocean Color and Temperature Scanner (COCTS), which can observe the sea surface temperature (SST). The planned new generation ocean color observation satellites also carry a sensor for observing the SST represented by the payload in this paper. We analyze the spectral brightness temperature (BT) difference between the payload and the Moderate Resolution Imaging Spectroradiometer (MODIS) onboard Terra for the thermal infrared channels (11 and 12 µm) based on atmospheric radiative transfer simulation. The bias and standard deviation (SD) of spectral BT difference for the 11 µm channel are −0.12 K and 0.15 K, respectively, and those for the 12 µm channel are −0.10 K and 0.03 K, respectively. When the total column water vapor (TCWV) decreases from the oceans near the equator to high-latitude oceans, the spectral BT difference of the 11 µm channel varies from a positive deviation to a negative deviation, and that of the 12 µm channel basically remains stable. By correcting the MODIS BT observation using the spectral BT differences, we produce the simulated BT data for the thermal infrared channels of the payload, and then validate it using the Infrared Atmospheric Sounding Interferometer (IASI) carried on METOP-B. The validation results show that the bias of BT difference between the payload and IASI is −0.22 K for the 11 µm channel, while it is −0.05 K for the 12 µm channel. The SD of both channels is 0.13 K. In this study, we provide the simulated BT dataset for the 11 and 12 µm channels of a payload for the retrieval of SST. The simulated BT dataset corrected may be used to develop SST-retrieval algorithms. Full article
(This article belongs to the Section Ocean Remote Sensing)
Show Figures

Figure 1

21 pages, 7251 KiB  
Article
Spring Phenology Outweighs Temperature for Controlling the Autumn Phenology in the Yellow River Basin
by Moxi Yuan, Xinxin Li, Sai Qu, Zuoshi Wen and Lin Zhao
Remote Sens. 2023, 15(20), 5058; https://0-doi-org.brum.beds.ac.uk/10.3390/rs15205058 - 21 Oct 2023
Viewed by 1033
Abstract
Recent research has revealed that the dynamics of autumn phenology play a decisive role in the inter-annual changes in the carbon cycle. However, to date, the shifts in autumn phenology (EGS) and the elements that govern it have not garnered unanimous acknowledgment. This [...] Read more.
Recent research has revealed that the dynamics of autumn phenology play a decisive role in the inter-annual changes in the carbon cycle. However, to date, the shifts in autumn phenology (EGS) and the elements that govern it have not garnered unanimous acknowledgment. This paper focuses on the Yellow River Basin (YRB) ecosystem and systematically analyzes the dynamic characteristics of EGS and its multiple controls across the entire region and biomes from 1982 to 2015 based on the long-term GIMMS NDVI3g dataset. The results demonstrated that a trend toward a significant delay in EGS (p < 0.05) was detected and this delay was consistently observed across all biomes. By using the geographical detector model, the association between EGS and several main driving factors was quantified. The spring phenology (SGS) had the largest explanatory power among the interannual variations of EGS across the YRB, followed by preseason temperature. For different vegetation types, SGS and preseason precipitation were the dominant driving factors for the EGS in woody plants and grasslands, respectively, whereas the explanatory power for each driving factor on cultivated land was very weak. Furthermore, the EGS was controlled by drought at different timescales and the dominant timescales were concentrated in 1–3 accumulated months. Grasslands were more significantly influenced by drought than woody plants at the biome level. These findings validate the significance of SGS on the EGS in the YRB as well as highlight that both drought and SGS should be considered in autumn fall phenology models for improving the prediction accuracy under future climate change scenarios. Full article
Show Figures

Figure 1

20 pages, 11985 KiB  
Article
Simultaneous Vehicle Localization and Roadside Tree Inventory Using Integrated LiDAR-Inertial-GNSS System
by Xianghua Fan, Zhiwei Chen, Peilin Liu and Wenbo Pan
Remote Sens. 2023, 15(20), 5057; https://0-doi-org.brum.beds.ac.uk/10.3390/rs15205057 - 21 Oct 2023
Cited by 2 | Viewed by 1166
Abstract
Autonomous driving systems rely on a comprehensive understanding of the surrounding environment, and trees, as important roadside features, have a significant impact on vehicle positioning and safety analysis. Existing methods use mobile LiDAR systems (MLS) to collect environmental information and automatically generate tree [...] Read more.
Autonomous driving systems rely on a comprehensive understanding of the surrounding environment, and trees, as important roadside features, have a significant impact on vehicle positioning and safety analysis. Existing methods use mobile LiDAR systems (MLS) to collect environmental information and automatically generate tree inventories based on dense point clouds, providing accurate geometric parameters. However, the use of MLS systems requires expensive survey-grade laser scanners and high-precision GNSS/IMU systems, which limits their large-scale deployment and results in poor real-time performance. Although LiDAR-based simultaneous localization and mapping (SLAM) techniques have been widely applied in the navigation field, to the best of my knowledge, there has been no research conducted on simultaneous real-time localization and roadside tree inventory. This paper proposes an innovative approach that uses LiDAR technology to achieve vehicle positioning and a roadside tree inventory. Firstly, a front-end odometry based on an error-state Kalman filter (ESKF) and a back-end optimization framework based on factor graphs are employed. The updated poses from the back-end are used for establishing point-to-plane residual constraints for the front-end in the local map. Secondly, a two-stage approach is adopted to minimize global mapping errors, refining accumulated mapping errors through GNSS-assisted registration to enhance system robustness. Additionally, a method is proposed for creating a tree inventory that extracts line features from real-time LiDAR point cloud data and projects them onto a global map, providing an initial estimation of possible tree locations for further tree detection. This method uses shared feature extraction results and data pre-processing results from SLAM to reduce the computational load of simultaneous vehicle positioning and roadside tree inventory. Compared to methods that directly search for trees in the global map, this approach benefits from fast perception of the initial tree position, meeting real-time requirements. Finally, our system is extensively evaluated on real datasets covering various road scenarios, including urban and suburban areas. The evaluation metrics are divided into two parts: the positioning accuracy of the vehicle during operation and the detection accuracy of trees. The results demonstrate centimeter-level positioning accuracy and real-time automatic creation of a roadside tree inventory. Full article
Show Figures

Graphical abstract

18 pages, 8127 KiB  
Article
GFCNet: Contrastive Learning Network with Geography Feature Space Joint Negative Sample Correction for Land Cover Classification
by Zhaoyang Zhang, Wenxuan Jing, Haifeng Li, Chao Tao and Yunsheng Zhang
Remote Sens. 2023, 15(20), 5056; https://0-doi-org.brum.beds.ac.uk/10.3390/rs15205056 - 21 Oct 2023
Cited by 1 | Viewed by 862
Abstract
With the continuous improvement in the volume and spatial resolution of remote sensing images, the self-supervised contrastive learning paradigm driven by a large amount of unlabeled data is expected to be a promising solution for large-scale land cover classification with limited labeled data. [...] Read more.
With the continuous improvement in the volume and spatial resolution of remote sensing images, the self-supervised contrastive learning paradigm driven by a large amount of unlabeled data is expected to be a promising solution for large-scale land cover classification with limited labeled data. However, due to the richness and scale diversity of ground objects contained in remote sensing images, self-supervised contrastive learning encounters two challenges when performing large-scale land cover classification: (1) Self-supervised contrastive learning models treat random spatial–spectral transformations of different images as negative samples, even though they may contain the same ground objects, which leads to serious class confusion in land cover classification. (2) The existing self-supervised contrastive learning models simply use the single-scale features extracted by the feature extractor for land cover classification, which limits the ability of the model to capture different scales of ground objects in remote sensing images. In this study, we propose a contrastive learning network with Geography Feature space joint negative sample Correction (GFCNet) for land cover classification. To address class confusion, we propose a Geography Feature space joint negative sample Correction Strategy (GFCS), which integrates the geography space and feature space relationships of different images to construct negative samples, reducing the risk of negative samples containing the same ground object. In order to improve the ability of the model to capture the features of different scale ground objects, we adopt a Multi-scale Feature joint Fine-tuning Strategy (MFFS) to integrate different scale features obtained by the self-supervised contrastive learning network for land cover classification tasks. We evaluate the proposed GFCNet on three public land cover classification datasets and achieve the best results compared to seven baselines of self-supervised contrastive learning methods. Specifically, on the LoveDA Rural dataset, the proposed GFCNet improves 3.87% in Kappa and 1.54% in mIoU compared with the best baseline. Full article
Show Figures

Figure 1

19 pages, 5129 KiB  
Article
Annual and Interannual Variability in the Diffuse Attenuation Coefficient and Turbidity in Urbanized Washington Lake from 2013 to 2022 Assessed Using Landsat-8/9
by Jennifer A. Schulien, Tessa Code, Curtis DeGasperi, David A. Beauchamp, Arielle Tonus Ellis and Arni H. Litt
Remote Sens. 2023, 15(20), 5055; https://0-doi-org.brum.beds.ac.uk/10.3390/rs15205055 - 21 Oct 2023
Viewed by 886
Abstract
Water clarity, defined in this study using measurements of the downwelling diffuse light attenuation coefficient (Kd) and turbidity, is an important indicator of lake trophic status and ecosystem health. We used in-situ measurements to evaluate existing semi-analytical models for Kd [...] Read more.
Water clarity, defined in this study using measurements of the downwelling diffuse light attenuation coefficient (Kd) and turbidity, is an important indicator of lake trophic status and ecosystem health. We used in-situ measurements to evaluate existing semi-analytical models for Kd and turbidity, developed a regional turbidity model based on spectral shape, and evaluated the spatial and temporal trends in Lake Washington from 2013 to 2022 using Landsat-8/9 Operational Land Imager (OLI). We found no significant trends from 2013 to 2022 in Kd or turbidity when both the annual and full datasets were considered. In addition to the spring peak lasting from April through June, autumn Kd peaks were present at all sites, a pattern consistent with seasonal chlorophyll a and zooplankton concentrations. There existed no autumn peak in the monthly turbidity dataset, and the spring peak occurred two months before the Kd peak, nearly mirroring seasonal variability in the Cedar River discharge rates over the same period. The Kd and turbidity algorithms were thus each more sensitive to different sources of water clarity variability in Lake Washington. Full article
(This article belongs to the Special Issue Advances in Remote Sensing of the Inland and Coastal Water Zones II)
Show Figures

Figure 1

19 pages, 3613 KiB  
Article
Spatio-Temporal Variation in Soil Salinity and Its Influencing Factors in Desert Natural Protected Forest Areas
by Xinyue Zhao, Haiyang Xi, Tengfei Yu, Wenju Cheng and Yuqing Chen
Remote Sens. 2023, 15(20), 5054; https://0-doi-org.brum.beds.ac.uk/10.3390/rs15205054 - 21 Oct 2023
Viewed by 1118
Abstract
Soil salinity is a crucial parameter affecting soil health. Excessive surface salt accumulation degrades soil structure, inhibits vegetation growth, and diminishes plant diversity. Such increases in salinity can accelerate desertification, leading to soil resource loss, hampering agricultural progress, and compromising ecological security. However, [...] Read more.
Soil salinity is a crucial parameter affecting soil health. Excessive surface salt accumulation degrades soil structure, inhibits vegetation growth, and diminishes plant diversity. Such increases in salinity can accelerate desertification, leading to soil resource loss, hampering agricultural progress, and compromising ecological security. However, the vastness of arid regions and data acquisition challenges often hinder efficient SSC monitoring and modeling. In this study, we leveraged remote sensing data coupled with machine learning techniques to investigate the spatio-temporal dynamics of SSC in a representative desert natural forest area, the Alxa National Public Welfare Forest. Utilizing the geodetector model, we also delved into the factors influencing SSC. Our results underscored the effectiveness of the Convolutional Neural Networks (CNN) model in predicting SSC, achieving an accuracy of 0.745. Based on this model, we mapped the spatial distribution of SSC, revealing hydrothermal conditions as pivotal determinants of salt accumulation. From 2016 to 2021, soils impacted by salinity in the research area exhibited a rising trend, attributed to the prevailing dry climate and low precipitation. Such intensified salinity accumulation poses threats to the healthy growth of protective forest vegetation. This study can provide a theoretical reference for salinization management and ecological protection in desert natural forest areas. Full article
Show Figures

Figure 1

23 pages, 17870 KiB  
Article
Spatio-Temporal Validation of GNSS-Derived Global Ionosphere Maps Using 16 Years of Jason Satellites Observations
by Mateusz Poniatowski, Grzegorz Nykiel, Claudia Borries and Jędrzej Szmytkowski
Remote Sens. 2023, 15(20), 5053; https://0-doi-org.brum.beds.ac.uk/10.3390/rs15205053 - 21 Oct 2023
Cited by 1 | Viewed by 1268
Abstract
Existing ionospheric models perform very well in mapping the calm state of the ionosphere. However, the problem is accurately determining the total electron content (TEC) for disturbed days. Knowledge of the exact electron density is essential for single−frequency receivers, which cannot eliminate the [...] Read more.
Existing ionospheric models perform very well in mapping the calm state of the ionosphere. However, the problem is accurately determining the total electron content (TEC) for disturbed days. Knowledge of the exact electron density is essential for single−frequency receivers, which cannot eliminate the ionospheric delay. This study aims to investigate temporal and spatial variability in the distribution of TEC based on differences between maps of individual Ionospheric Associated Analysis Centers (IAACs) of the International GNSS Service (IGS) and aligned altimetry−TEC from 2005–2021. Based on the temporal distribution, we have observed a significant effect of solar activity on the mean and standard deviation behavior of the differences between global ionospheric maps (GIMs) and Jason−derived TEC. We determined the biases for the entire calculation period, through which it can be concluded that the upcg-Jason and igsg-Jason differences have the lowest standard deviation (±1.81 TECU). In addition, the temporal analysis made it possible to detect annual, semi−annual, and 117-day oscillations occurring in the Jason−TEC data, as well as 121-day oscillations in the GIMs. It also allowed us to analyze the potential sources of these cyclicities, solar and geomagnetic activity, in the case of the annual and semi−annual periodicities. When considering spatial variations, we have observed that the most significant average differences are in the intertropical areas. In contrast, the smallest differences were recorded in the southern hemisphere, below the Tropic of Capricorn (23.5°S). However, the slightest variations were noted for the northern hemisphere above the Tropic of Cancer (23.5°N). Our research presented in this paper allows a better understanding of how different methods of GNSS TEC approximation affect the model’s accuracy. Full article
(This article belongs to the Special Issue BDS/GNSS for Earth Observation: Part II)
Show Figures

Figure 1

16 pages, 6094 KiB  
Communication
Horizontal Magnetic Anomaly Accompanying the Co-Seismic Earthquake Light of the M7.3 Fukushima Earthquake of 16 March 2022: Phenomenon and Mechanism
by Busheng Xie, Lixin Wu, Wenfei Mao, Ziqing Wang, Licheng Sun and Youyou Xu
Remote Sens. 2023, 15(20), 5052; https://0-doi-org.brum.beds.ac.uk/10.3390/rs15205052 - 21 Oct 2023
Viewed by 834
Abstract
A horizontal magnetic disturbance accompanying the co-seismic earthquake light (EQL) of the M7.3 Fukushima earthquake of 16 March 2022 was detected by a fluxgate magnetometer installed at the KAK station, which is 270 km south of the EQL and 210 km west of [...] Read more.
A horizontal magnetic disturbance accompanying the co-seismic earthquake light (EQL) of the M7.3 Fukushima earthquake of 16 March 2022 was detected by a fluxgate magnetometer installed at the KAK station, which is 270 km south of the EQL and 210 km west of the epicenter. The instantaneous change of the declination component of the geomagnetic field reached about 1.7″, much exceeding the threshold of three-fold error (0.72″). Considering the direction information of the geomagnetic data, the horizontal magnetic disturbance vector was further analyzed, which manifested the normal of the horizontal magnetic disturbance vector passing through the position of the EQL. Combined with the experimental results of pressure-simulated rock current (PSRC), the mechanism of the EQL and the geomagnetic anomaly was proposed to interpret the spatiotemporal correlation between the EQL and the horizontal magnetic disturbance vector, which should be a manifest of the induced magnetic horizontal vector (IMHV), attributed to the upward seismic PSRC. Different from previous precursor studies on geomagnetic disturbance on the power spectrum, vertical component, or polarization, this paper focuses on the direction information of the horizontal magnetic disturbance vector, which could be further applied to locate potential seismogenic zones based on the IMHVs observed by multiple geomagnetic stations. Full article
Show Figures

Figure 1

20 pages, 25160 KiB  
Article
Edge Consistency Feature Extraction Method for Multi-Source Image Registration
by Yang Zhou, Zhen Han, Zeng Dou, Chengbin Huang, Li Cong, Ning Lv and Chen Chen
Remote Sens. 2023, 15(20), 5051; https://0-doi-org.brum.beds.ac.uk/10.3390/rs15205051 - 21 Oct 2023
Viewed by 1016
Abstract
Multi-source image registration has often suffered from great radiation and geometric differences. Specifically, grayscale and texture from similar landforms in different source images often show significantly different visual features, and these differences disturb the corresponding point extraction in the following image registration process. [...] Read more.
Multi-source image registration has often suffered from great radiation and geometric differences. Specifically, grayscale and texture from similar landforms in different source images often show significantly different visual features, and these differences disturb the corresponding point extraction in the following image registration process. Considering that edges between heterogeneous images can provide homogeneous information and more consistent features can be extracted based on image edges, an edge consistency radiation-change insensitive feature transform (EC-RIFT) method is proposed in this paper. Firstly, the noise and texture interference are reduced by preprocessing according to the image characteristics. Secondly, image edges are extracted based on phase congruency, and an orthogonal Log-Gabor filter is performed to replace the global algorithm. Finally, the descriptors are built with logarithmic partition of the feature point neighborhood, which improves the robustness of the descriptors. Comparative experiments on datasets containing multi-source remote sensing image pairs show that the proposed EC-RIFT method outperforms other registration methods in terms of precision and effectiveness. Full article
Show Figures

Figure 1

21 pages, 1036 KiB  
Article
Local Differential Privacy Based Membership-Privacy-Preserving Federated Learning for Deep-Learning-Driven Remote Sensing
by Zheng Zhang, Xindi Ma and Jianfeng Ma
Remote Sens. 2023, 15(20), 5050; https://0-doi-org.brum.beds.ac.uk/10.3390/rs15205050 - 20 Oct 2023
Viewed by 1013
Abstract
With the development of deep learning, image recognition based on deep learning is now widely used in remote sensing. As we know, the effectiveness of deep learning models significantly benefits from the size and quality of the dataset. However, remote sensing data are [...] Read more.
With the development of deep learning, image recognition based on deep learning is now widely used in remote sensing. As we know, the effectiveness of deep learning models significantly benefits from the size and quality of the dataset. However, remote sensing data are often distributed in different parts. They cannot be shared directly for privacy and security reasons, and this has motivated some scholars to apply federated learning (FL) to remote sensing. However, research has found that federated learning is usually vulnerable to white-box membership inference attacks (MIAs), which aim to infer whether a piece of data was participating in model training. In remote sensing, the MIA can lead to the disclosure of sensitive information about the model trainers, such as their location and type, as well as time information about the remote sensing equipment. To solve this issue, we consider embedding local differential privacy (LDP) into FL and propose LDP-Fed. LDP-Fed performs local differential privacy perturbation after properly pruning the uploaded parameters, preventing the central server from obtaining the original local models from the participants. To achieve a trade-off between privacy and model performance, LDP-Fed adds different noise levels to the parameters for various layers of the local models. This paper conducted comprehensive experiments to evaluate the framework’s effectiveness on two remote sensing image datasets and two machine learning benchmark datasets. The results demonstrate that remote sensing image classification models are susceptible to MIAs, and our framework can successfully defend against white-box MIA while achieving an excellent global model. Full article
(This article belongs to the Topic AI and Data-Driven Advancements in Industry 4.0)
Show Figures

Graphical abstract

19 pages, 6036 KiB  
Article
Characterizing Ionospheric Effects on GNSS Reflectometry at Grazing Angles from Space
by Mario Moreno, Maximilian Semmling, Georges Stienne, Mainul Hoque and Jens Wickert
Remote Sens. 2023, 15(20), 5049; https://0-doi-org.brum.beds.ac.uk/10.3390/rs15205049 - 20 Oct 2023
Viewed by 1224
Abstract
Coherent observations in GNSS reflectometry are prominent in regions with smooth reflecting surfaces and at grazing elevation angles. However, within these lower elevation ranges, GNSS signals traverse a more extensive atmospheric path, and increased ionospheric effects (e.g., delay biases) are expected. These biases [...] Read more.
Coherent observations in GNSS reflectometry are prominent in regions with smooth reflecting surfaces and at grazing elevation angles. However, within these lower elevation ranges, GNSS signals traverse a more extensive atmospheric path, and increased ionospheric effects (e.g., delay biases) are expected. These biases can be mitigated by employing dual-frequency receivers or models tailored for single-frequency receivers. In preparation for the single-frequency GNSS-R ESA “PRETTY” mission, this study aims to characterize ionospheric effects under variable parameter conditions: elevation angles in the grazing range (5° to 30°), latitude-dependent regions (north, tropic, south) and diurnal changes (day and nighttime). The investigation employs simulations using orbit data from Spire Global Inc.’s Lemur-2 CubeSat constellation at the solar minimum (F10.7 index at 75) on March, 2021. Changes towards higher solar activity are accounted for with an additional scenario (F10.7 index at 180) on March, 2023. The electron density associated with each reflection event is determined using the Neustrelitz Electron Density Model (NEDM2020) and the NeQuick 2 model. The results from periods of low solar activity reveal fluctuations of up to approximately 300 TECUs in slant total electron content, 19 m in relative ionospheric delay for the GPS L1 frequency, 2 Hz in Doppler shifts, and variations in the peak electron density height ranging from 215 to 330 km. Sea surface height uncertainty associated with ionospheric model-based corrections in group delay altimetric inversion can reach a standard deviation at the meter level. Full article
(This article belongs to the Special Issue GNSS-R Earth Remote Sensing from SmallSats)
Show Figures

Graphical abstract

19 pages, 6565 KiB  
Article
Recurrent Residual Deformable Conv Unit and Multi-Head with Channel Self-Attention Based on U-Net for Building Extraction from Remote Sensing Images
by Wenling Yu, Bo Liu, Hua Liu and Guohua Gou
Remote Sens. 2023, 15(20), 5048; https://0-doi-org.brum.beds.ac.uk/10.3390/rs15205048 - 20 Oct 2023
Cited by 1 | Viewed by 875
Abstract
Considering the challenges associated with accurately identifying building shape features and distinguishing between building and non-building features during the extraction of buildings from remote sensing images using deep learning, we propose a novel method for building extraction based on U-Net, incorporating a recurrent [...] Read more.
Considering the challenges associated with accurately identifying building shape features and distinguishing between building and non-building features during the extraction of buildings from remote sensing images using deep learning, we propose a novel method for building extraction based on U-Net, incorporating a recurrent residual deformable convolution unit (RDCU) module and augmented multi-head self-attention (AMSA). By replacing conventional convolution modules with an RDCU, which adopts a deformable convolutional neural network within a residual network structure, the proposed method enhances the module’s capacity to learn intricate details such as building shapes. Furthermore, AMSA is introduced into the skip connection function to enhance feature expression and positions through content–position enhancement operations and content–content enhancement operations. Moreover, AMSA integrates an additional fusion channel attention mechanism to aid in identifying cross-channel feature expression Intersection over Union (IoU) score differences. For the Massachusetts dataset, the proposed method achieves an Intersection over Union (IoU) score of 89.99%, PA (Pixel Accuracy) score of 93.62%, and Recall score of 89.22%. For the WHU Satellite dataset I, the proposed method achieves an IoU score of 86.47%, PA score of 92.45%, and Recall score of 91.62%, For the INRIA dataset, the proposed method achieves an IoU score of 80.47%, PA score of 90.15%, and Recall score of 85.42%. Full article
Show Figures

Figure 1

18 pages, 6101 KiB  
Article
A Computationally Efficient Approach for Resampling Microwave Radiances from Conical Scanners to a Regular Earth Grid
by Carl Mears, Andrew Manaster and Frank Wentz
Remote Sens. 2023, 15(20), 5047; https://0-doi-org.brum.beds.ac.uk/10.3390/rs15205047 - 20 Oct 2023
Viewed by 748
Abstract
Satellite-borne microwave imagers are often operated as “conical scanners”, which use an off-axis paraboloid antenna that spins around an Earth-directed axis. As a result, individual measurements are arranged in curved “scans” on the Earth. Each measurement footprint is generally elliptical, with a range [...] Read more.
Satellite-borne microwave imagers are often operated as “conical scanners”, which use an off-axis paraboloid antenna that spins around an Earth-directed axis. As a result, individual measurements are arranged in curved “scans” on the Earth. Each measurement footprint is generally elliptical, with a range of alignments relative to fixed directions on the Earth. Taken together, these geometrical features present a challenge for users who want collocate microwave radiances with other sources of information. These sources include maps of surface conditions (often available on a regular latitude–longitude grid), information from other satellites (which will have a different, non-aligned scan geometry), or point-like in situ information. Such collocations are important for algorithm development and validation activities. Some of these challenges associated with collocating microwave radiances would be eliminated by resampling satellite data onto circular footprints on an Earth-fixed grid. This is because circular footprints help enable accurate collocations between satellite sensors on different platforms whose native footprints are usually ellipses canted at varying angles. Here, we describe a computationally efficient method to accurately resample microwave radiances onto circular footprints, facilitating comparisons and combinations between different types of geophysical information. Full article
(This article belongs to the Section Satellite Missions for Earth and Planetary Exploration)
Show Figures

Figure 1

Previous Issue
Back to TopTop