Article

AFRE-Net: Adaptive Feature Representation Enhancement for Arbitrary Oriented Object Detection

1
Key Laboratory of Computational Optical Imaging Technology, Aerospace Information Research Institute, Chinese Academy of Sciences, Beijing 100094, China
2
Key Laboratory of Digital Earth Science, Aerospace Information Research Institute, Chinese Academy of Sciences, Beijing 100094, China
3
International Research Center of Big Data for Sustainable Development Goals, Chinese Academy of Sciences, Beijing 100094, China
4
College of Resources and Environment, University of Chinese Academy of Sciences, Beijing 100049, China
5
Department of Complexity Science and Engineering, The University of Tokyo, Tokyo 277-8561, Japan
6
College of Intelligent Systems Science and Engineering, Harbin Engineering University, Harbin 150001, China
7
Qingdao Innovation and Development Center, Harbin Engineering University, Qingdao 266000, China
8
College of Geography and Environment, Liaocheng University, Liaocheng 252059, China
*
Author to whom correspondence should be addressed.
Remote Sens. 2023, 15(20), 4965; https://0-doi-org.brum.beds.ac.uk/10.3390/rs15204965
Submission received: 15 August 2023 / Revised: 30 September 2023 / Accepted: 8 October 2023 / Published: 14 October 2023

Abstract

:
Arbitrary-oriented object detection (AOOD) is a crucial task in aerial image analysis but is also faced with significant challenges. In current AOOD detectors, commonly used multi-scale feature fusion modules fall short in spatial and semantic information complement between scales. Additionally, fixed feature extraction structures are usually used following a fusion model, resulting in the inability of detectors to self-adjust. At the same time, feature fusion and extraction modules are designed in isolation and the internal synergy between them is ignored. The above problems result in feature representation deficiency, thus affecting the overall detection precision. To solve these problems, we first create a fine-grained feature pyramid network (FG-FPN) that not only provides richer spatial and semantic features, but also completes neighbor scale features in a self-learning mode. Subsequently, we propose a novel feature enhancement module (FEM) to fit FG-FPN. FEM authorizes the detection unit to automatically adjust the sensing area and adaptively suppress background interference, thereby generating stronger feature representations. Our proposed solution was tested through extensive experiments on challenging datasets, including DOTA (77.44% mAP), HRSC2016 (97.82% mAP), UCAS-AOD (91.34% mAP), as well as ICDAR2015 (86.27% F-score) and its effectiveness and high applicability are verified on all the above datasets.

1. Introduction

As a fundamental task in remote sensing image understanding, arbitrary-oriented-object-detection (AOOD) is attracting the attention of researchers more and more. At the same time, with the rapid development of convolutional neural network (CNN)-based methods [1,2,3,4,5], many outstanding AOOD detectors stand out [6,7,8,9,10,11,12]. However, different from object detection in natural images, AOOD is more challenging mainly due to the following two reasons:
  • Objects in remote sensing images tend to have random orientation and larger aspect ratios, which increase the feature representation complexity of detectors.
  • Remote sensing images, due to their wide imaging range, contain complex and diverse ground objects and scenes, resulting in increased interference targets and features.
However, the existing design of AOOD detectors cannot adapt to the feature representation of remote sensing objects very well. Although AOOD detectors use the oriented bounding box (OBB) as the object’s marker, which can better fit the object’s spatial contour, the feature representation ability of each detection unit (DN) (i.e., feature point in multi-scale detection layers) does not change.
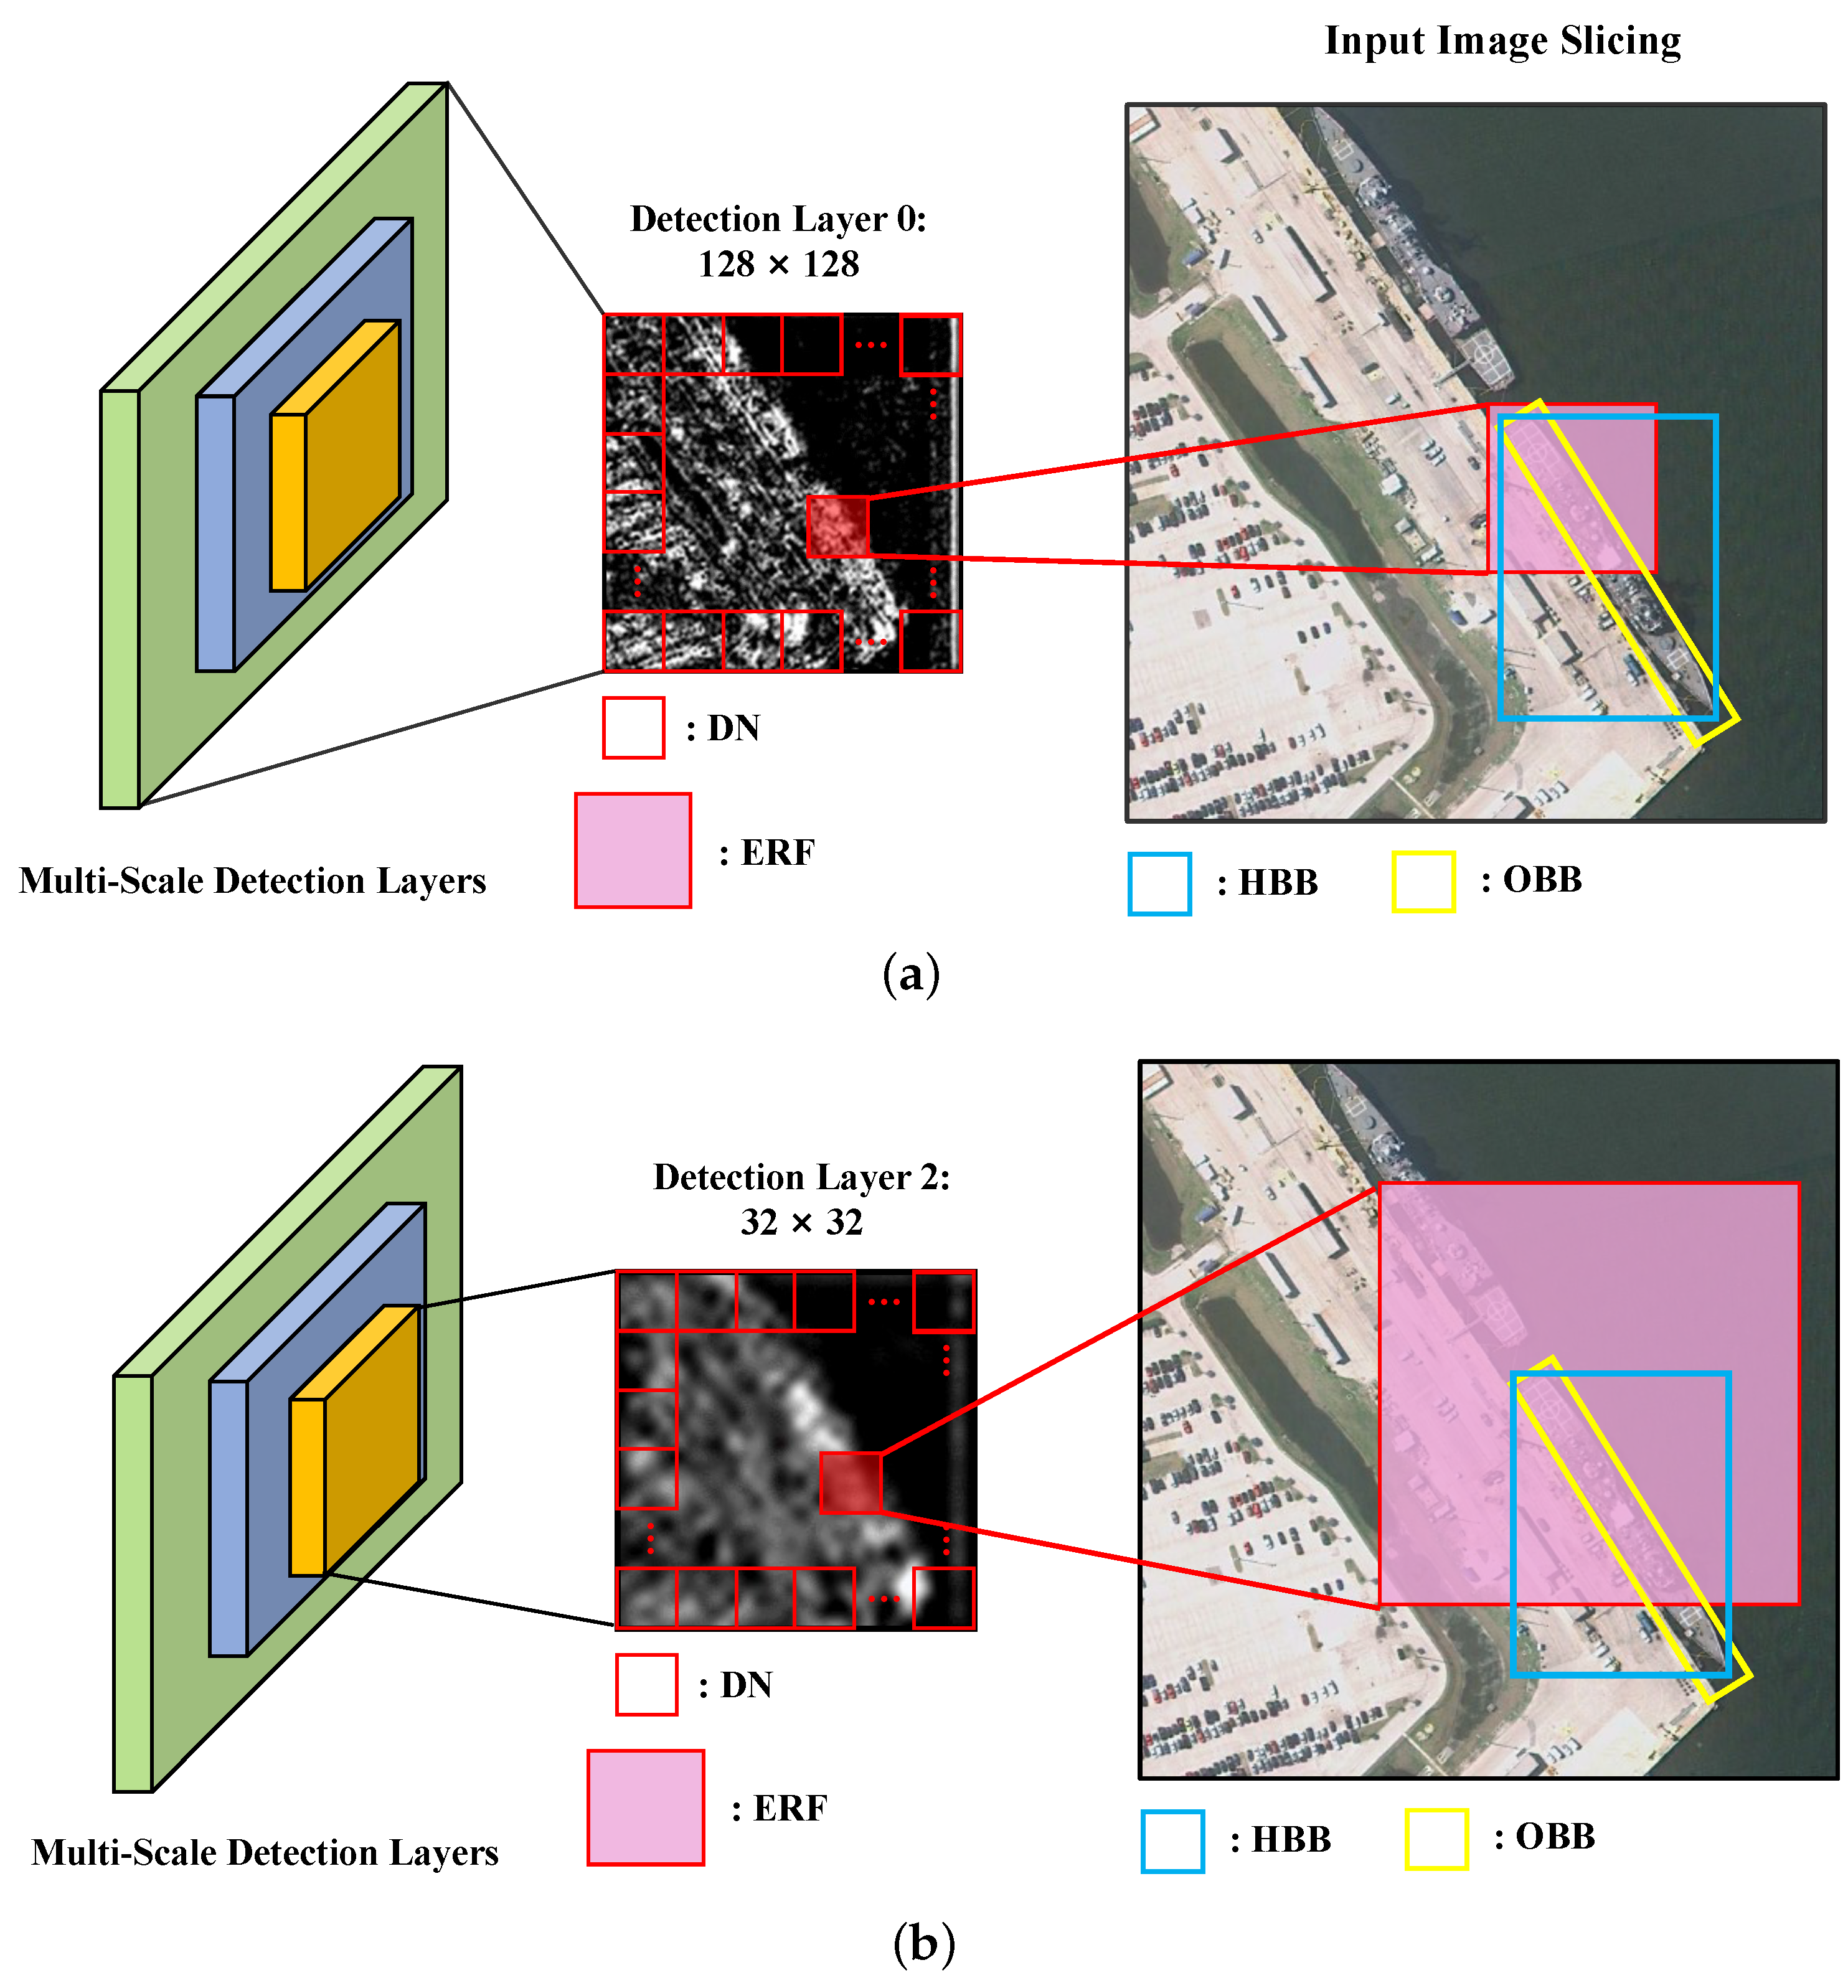
Take the classic anchor-based object detector as an example, as shown in 
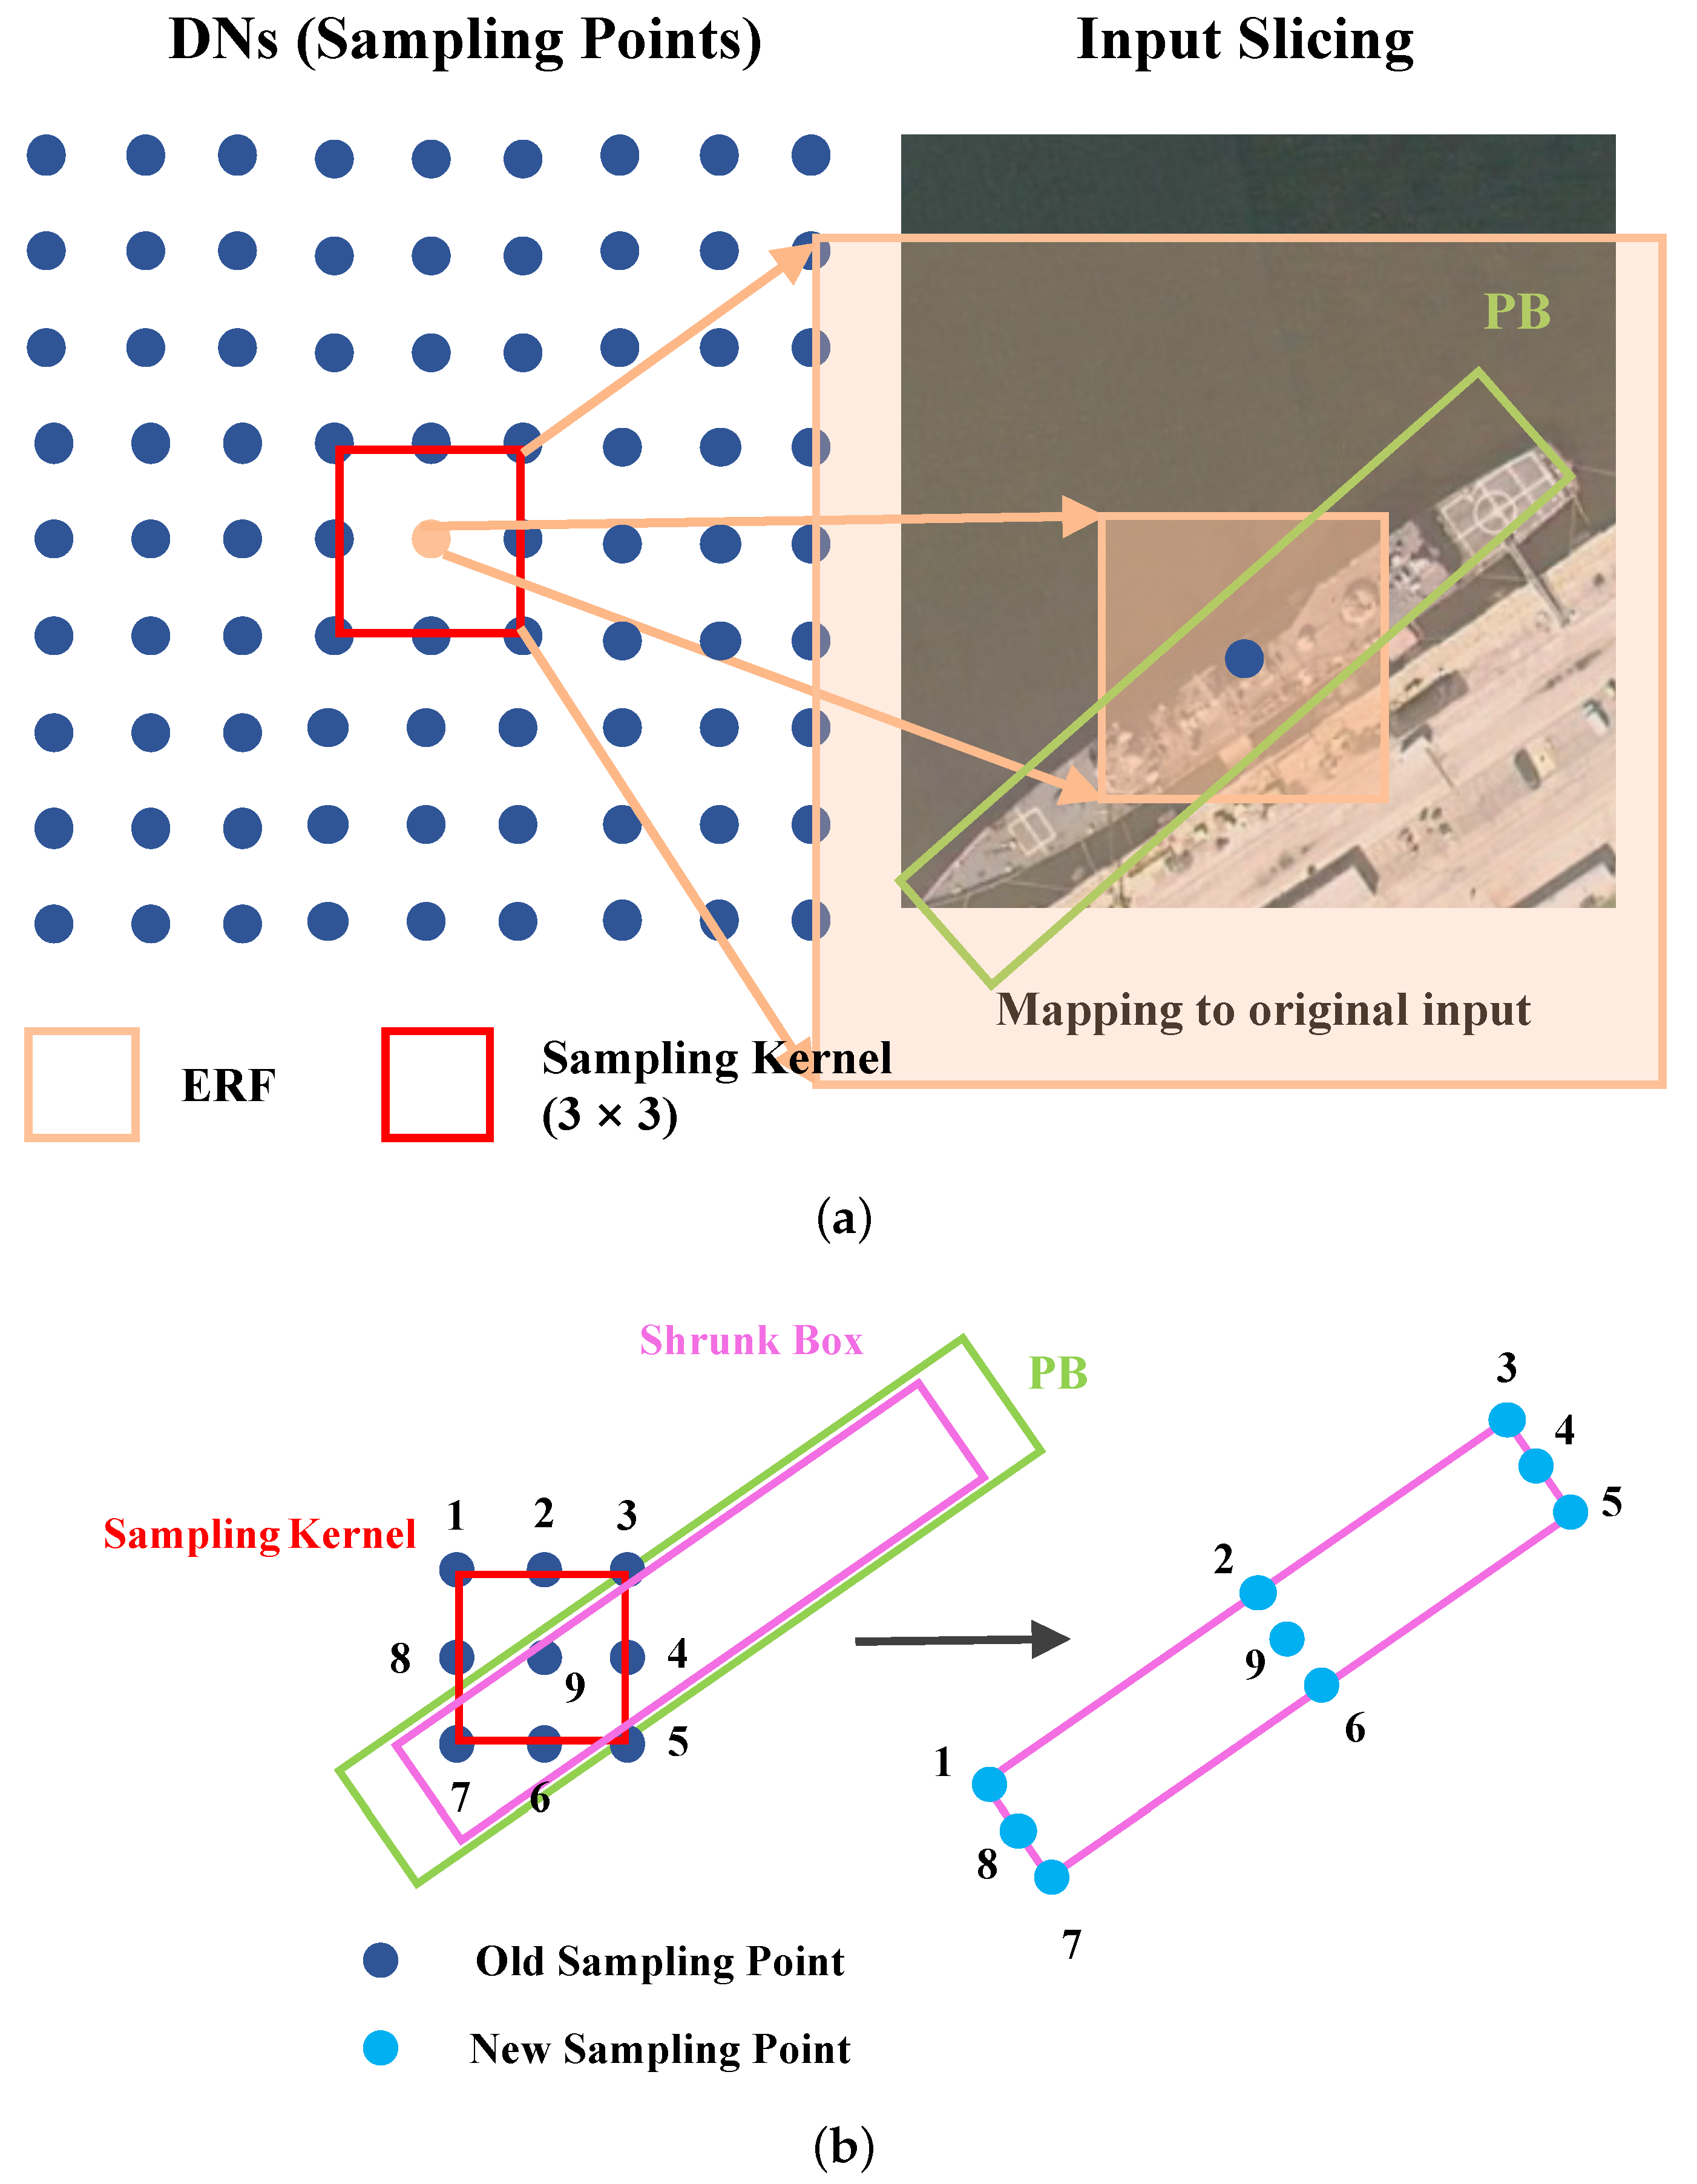
Figure 1, at each position of the multi-scale detection layers, a certain number of anchors will be preset for overlap calculation with GT (ground truth). When an anchor and GT meet certain position and overlap conditions (i.e., label assignment strategy), it will be determined as positive or negative. However, no matter whether HBB (horizontal bounding box) or OBB (oriented bounding box) is used as the labeling of GT, the effective receptive field (ERF) [13] of each DN does not change; that is, no matter what shape and aspect ratio of the object appears at the current position, existing detectors use a fixed feature vector to represent it. This means that for the red high potential DN in shallow feature layers shown in Figure 1a, its feature learning area is limited and does not coincide with the space occupied by the target. This issue has been discussed by some scholars [14,15] and summarized as a feature misalignment problem; however, these researches have not conducted in-depth summary and analysis of internal causes.
For this issue, one intuitive solution is using multi-scale feature representations to compensate for the uncertainty caused by the change of image and target size. However, another problem arises, as shown in 
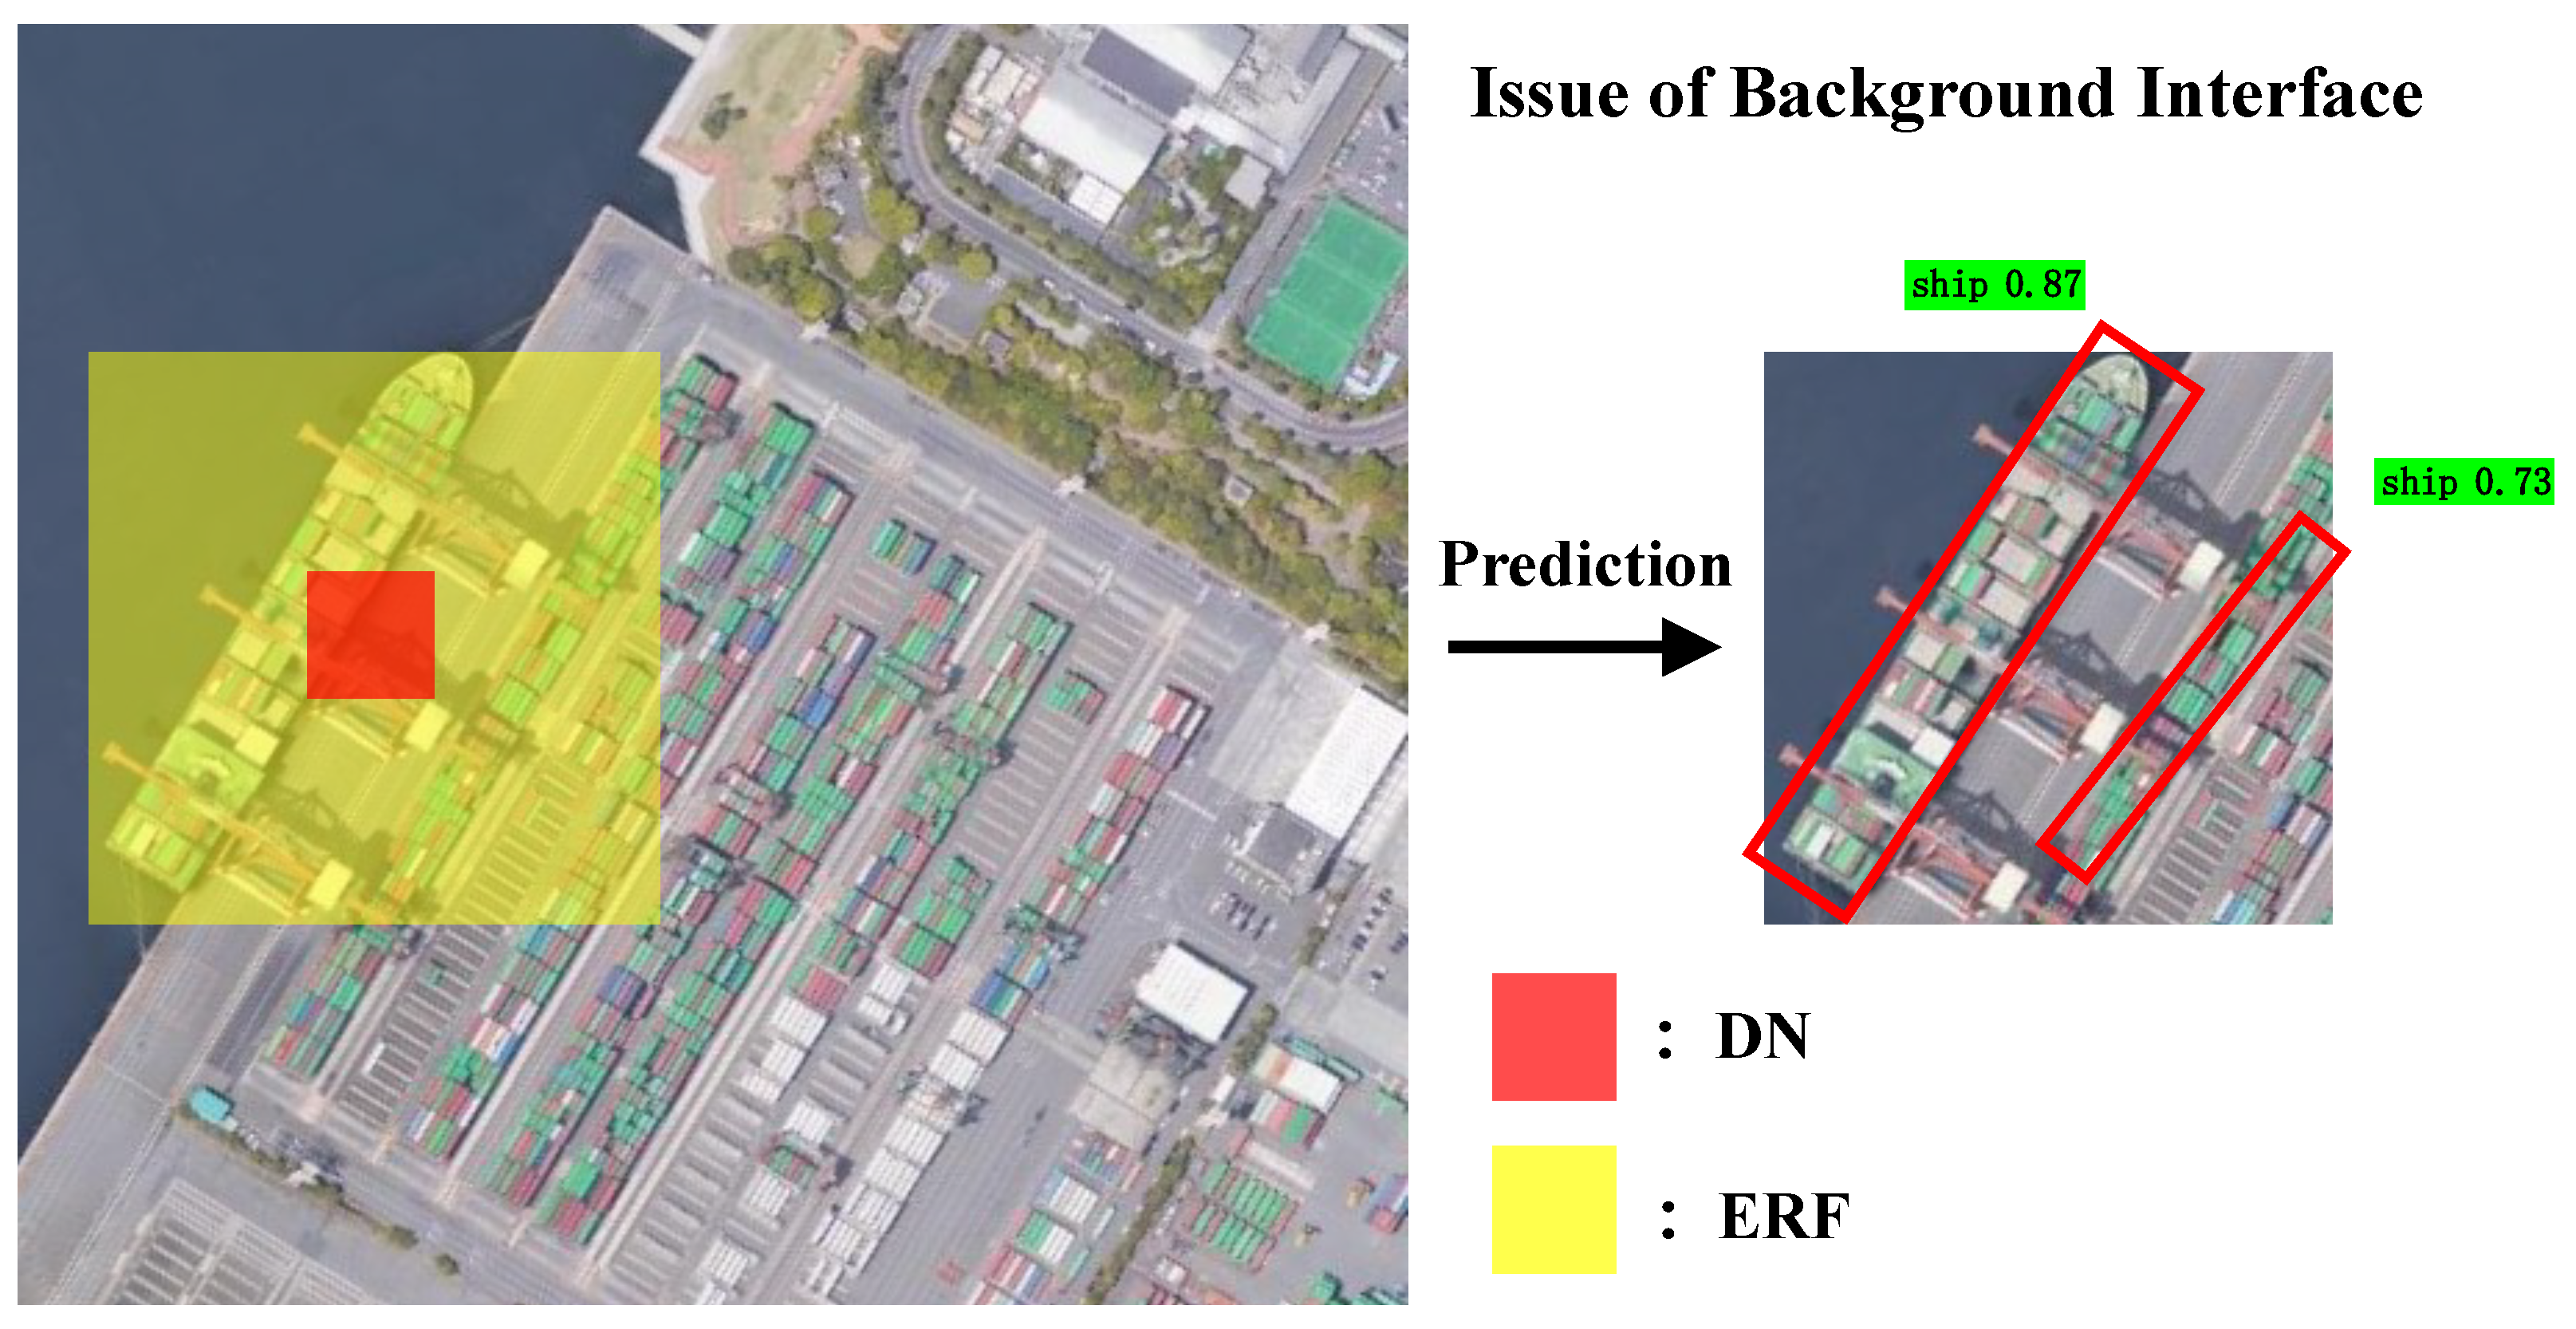
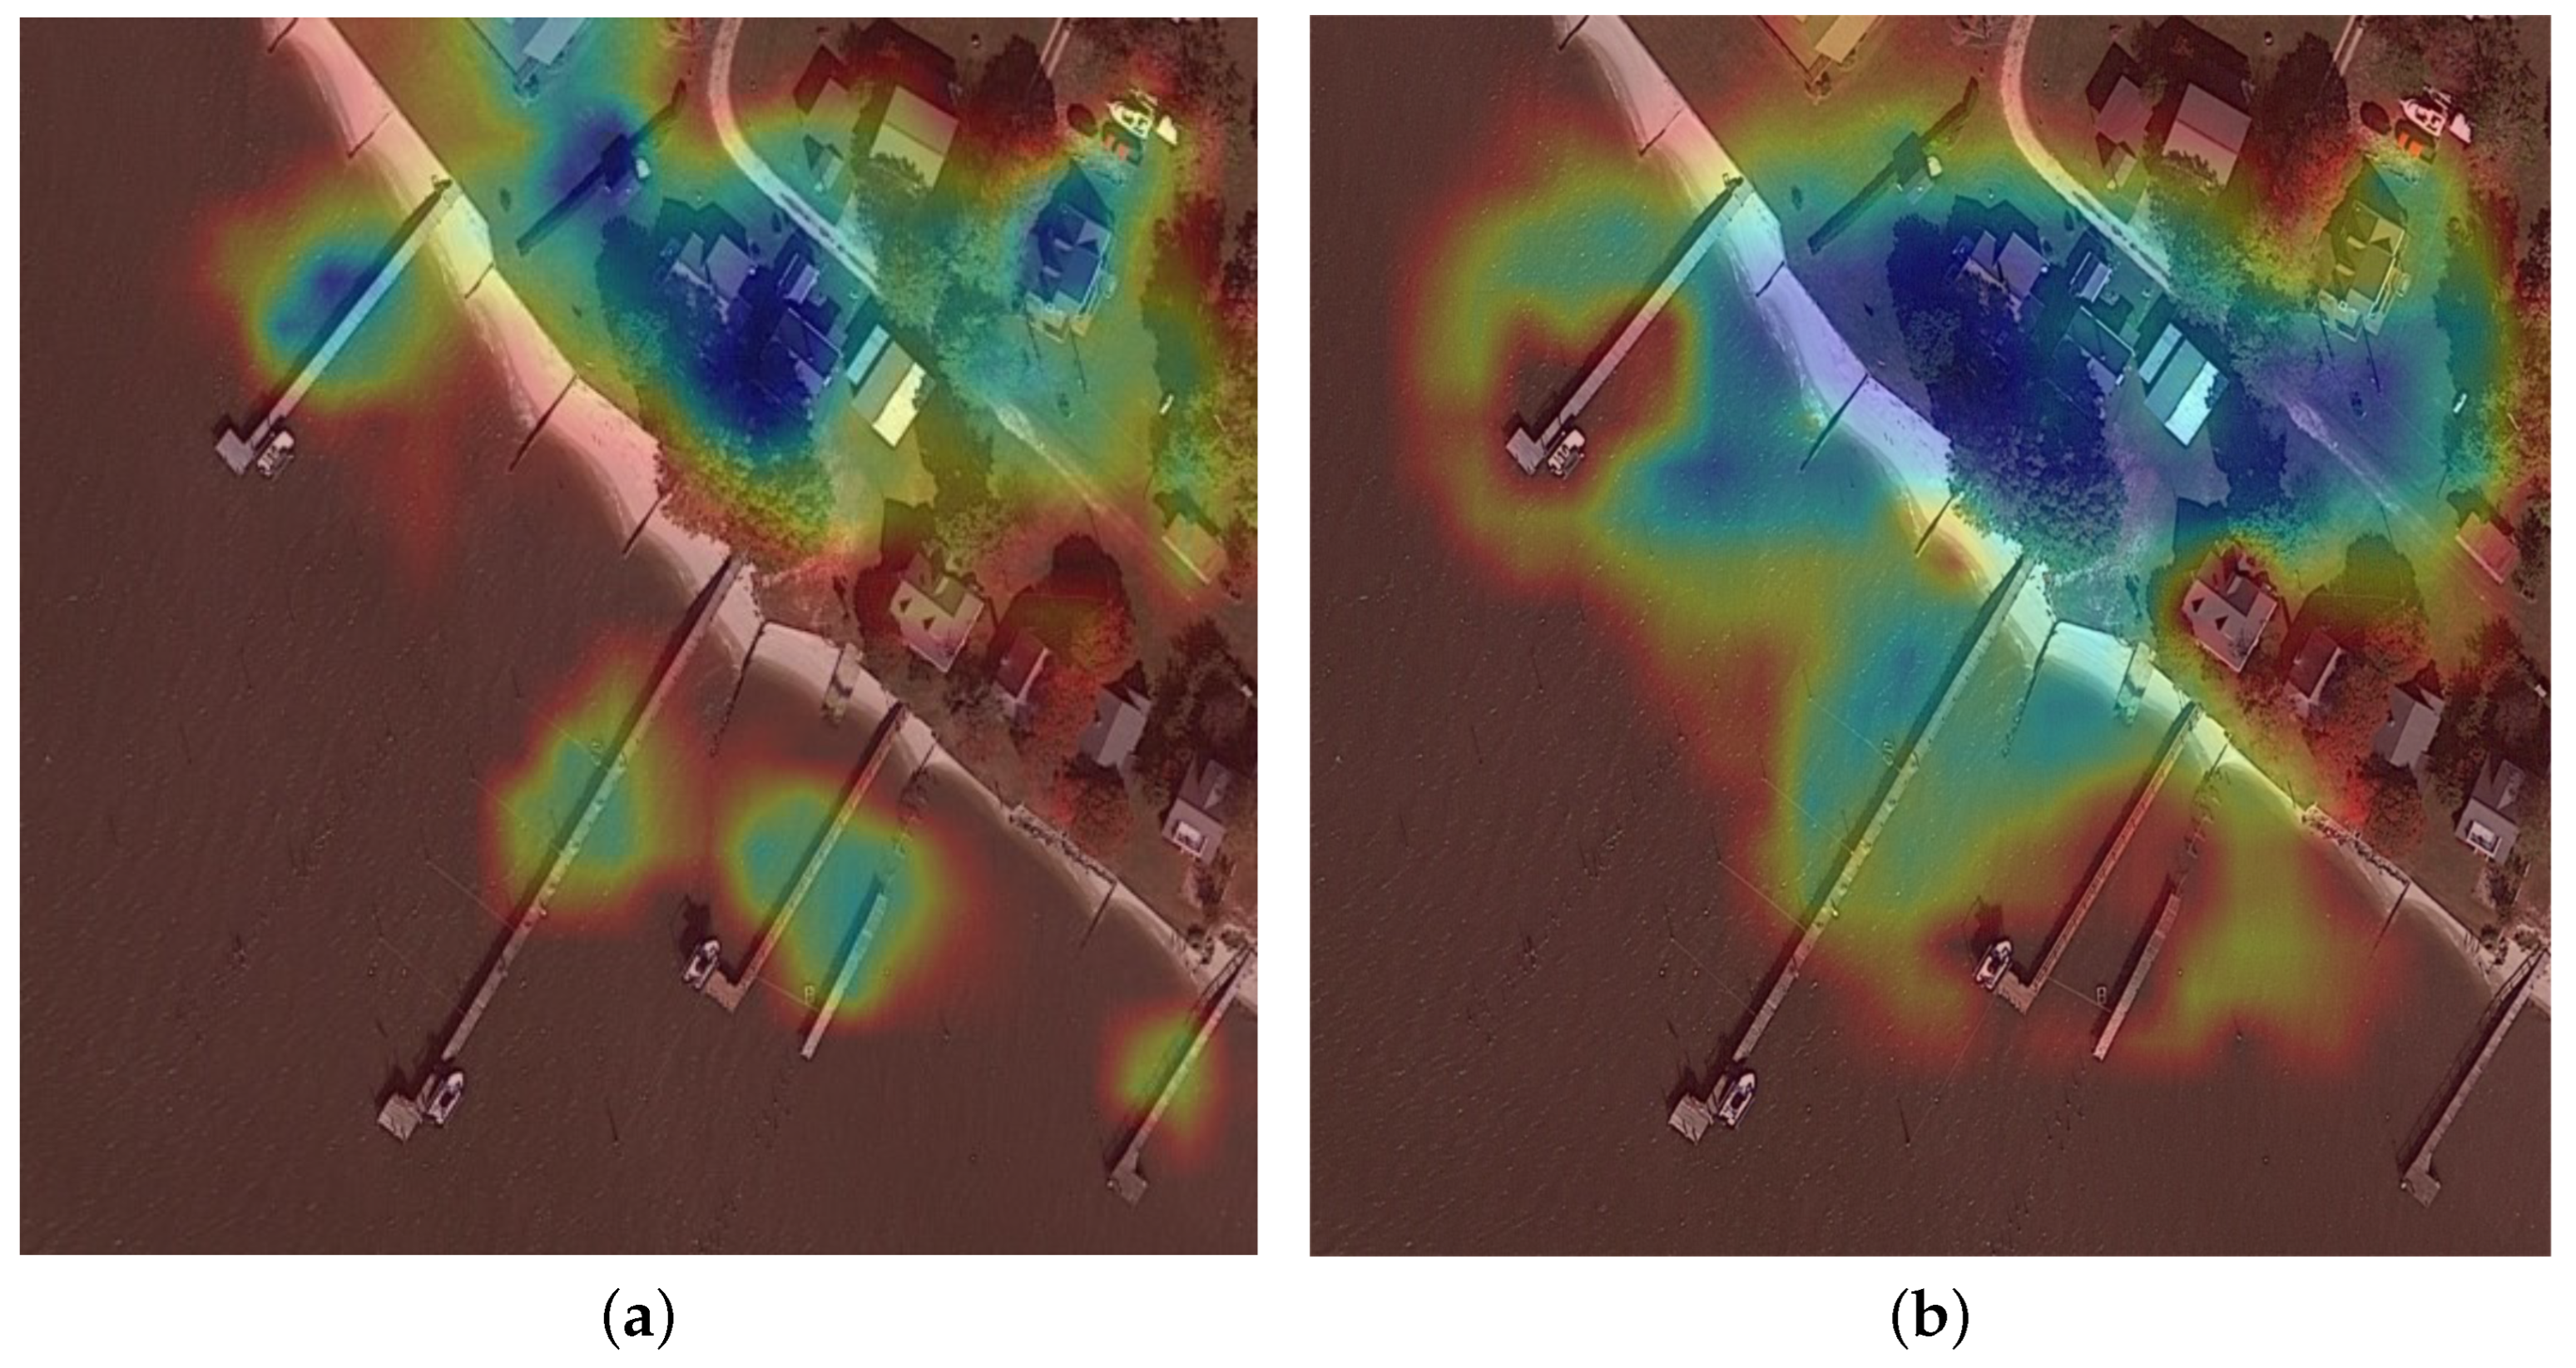
Figure 1b. With the deepening of the network and the down sampling operation, the ERF of DN has expanded. In the detection layer 2 with the size of 32 × 32, the marked DN expands its knowledge learning range but also receives more complex background information. The case in Figure 2 shows the negative impact of the disorderly expansion of ERF, which occurs in a real application scenario. Because the containers and cargo ships in the port have very similar characteristics, they are easily confused when they appear in the ERF of the same DN. Therefore, the container on the shore is also mistakenly identified as a ship with a high confidence. To deal with those problems, an ideal situation is that the field of vision focused by each DN is the whole body of the target, and does not contain additional background. However, due to the randomness of target size and input image size, it is difficult to achieve the above situation. More importantly, through the above case study, we observed that multi-scale feature fusion and feature extraction units are mutually constrained and auxiliary, because they jointly affect the ERF of each DN.
In summary, we need multi-scale fusion models to provide rich feature information to meet the size transformation of the target, and feature extraction operators to achieve the adaptive adjustment of ERF to suppress background information and highlight the key areas. However, the existing feature fusion models, such as FPN [17] and FPN-variants [18,19,20,21], cannot realize the information supplement between neighbor-scale features. The existing feature adaptive learning operators based on deformable convolution (DCN) [14,22,23] cannot achieve the synergy between the capture of key areas and background suppression, and their design is mostly separated from the fusion model, which does not form a good chemical reaction.
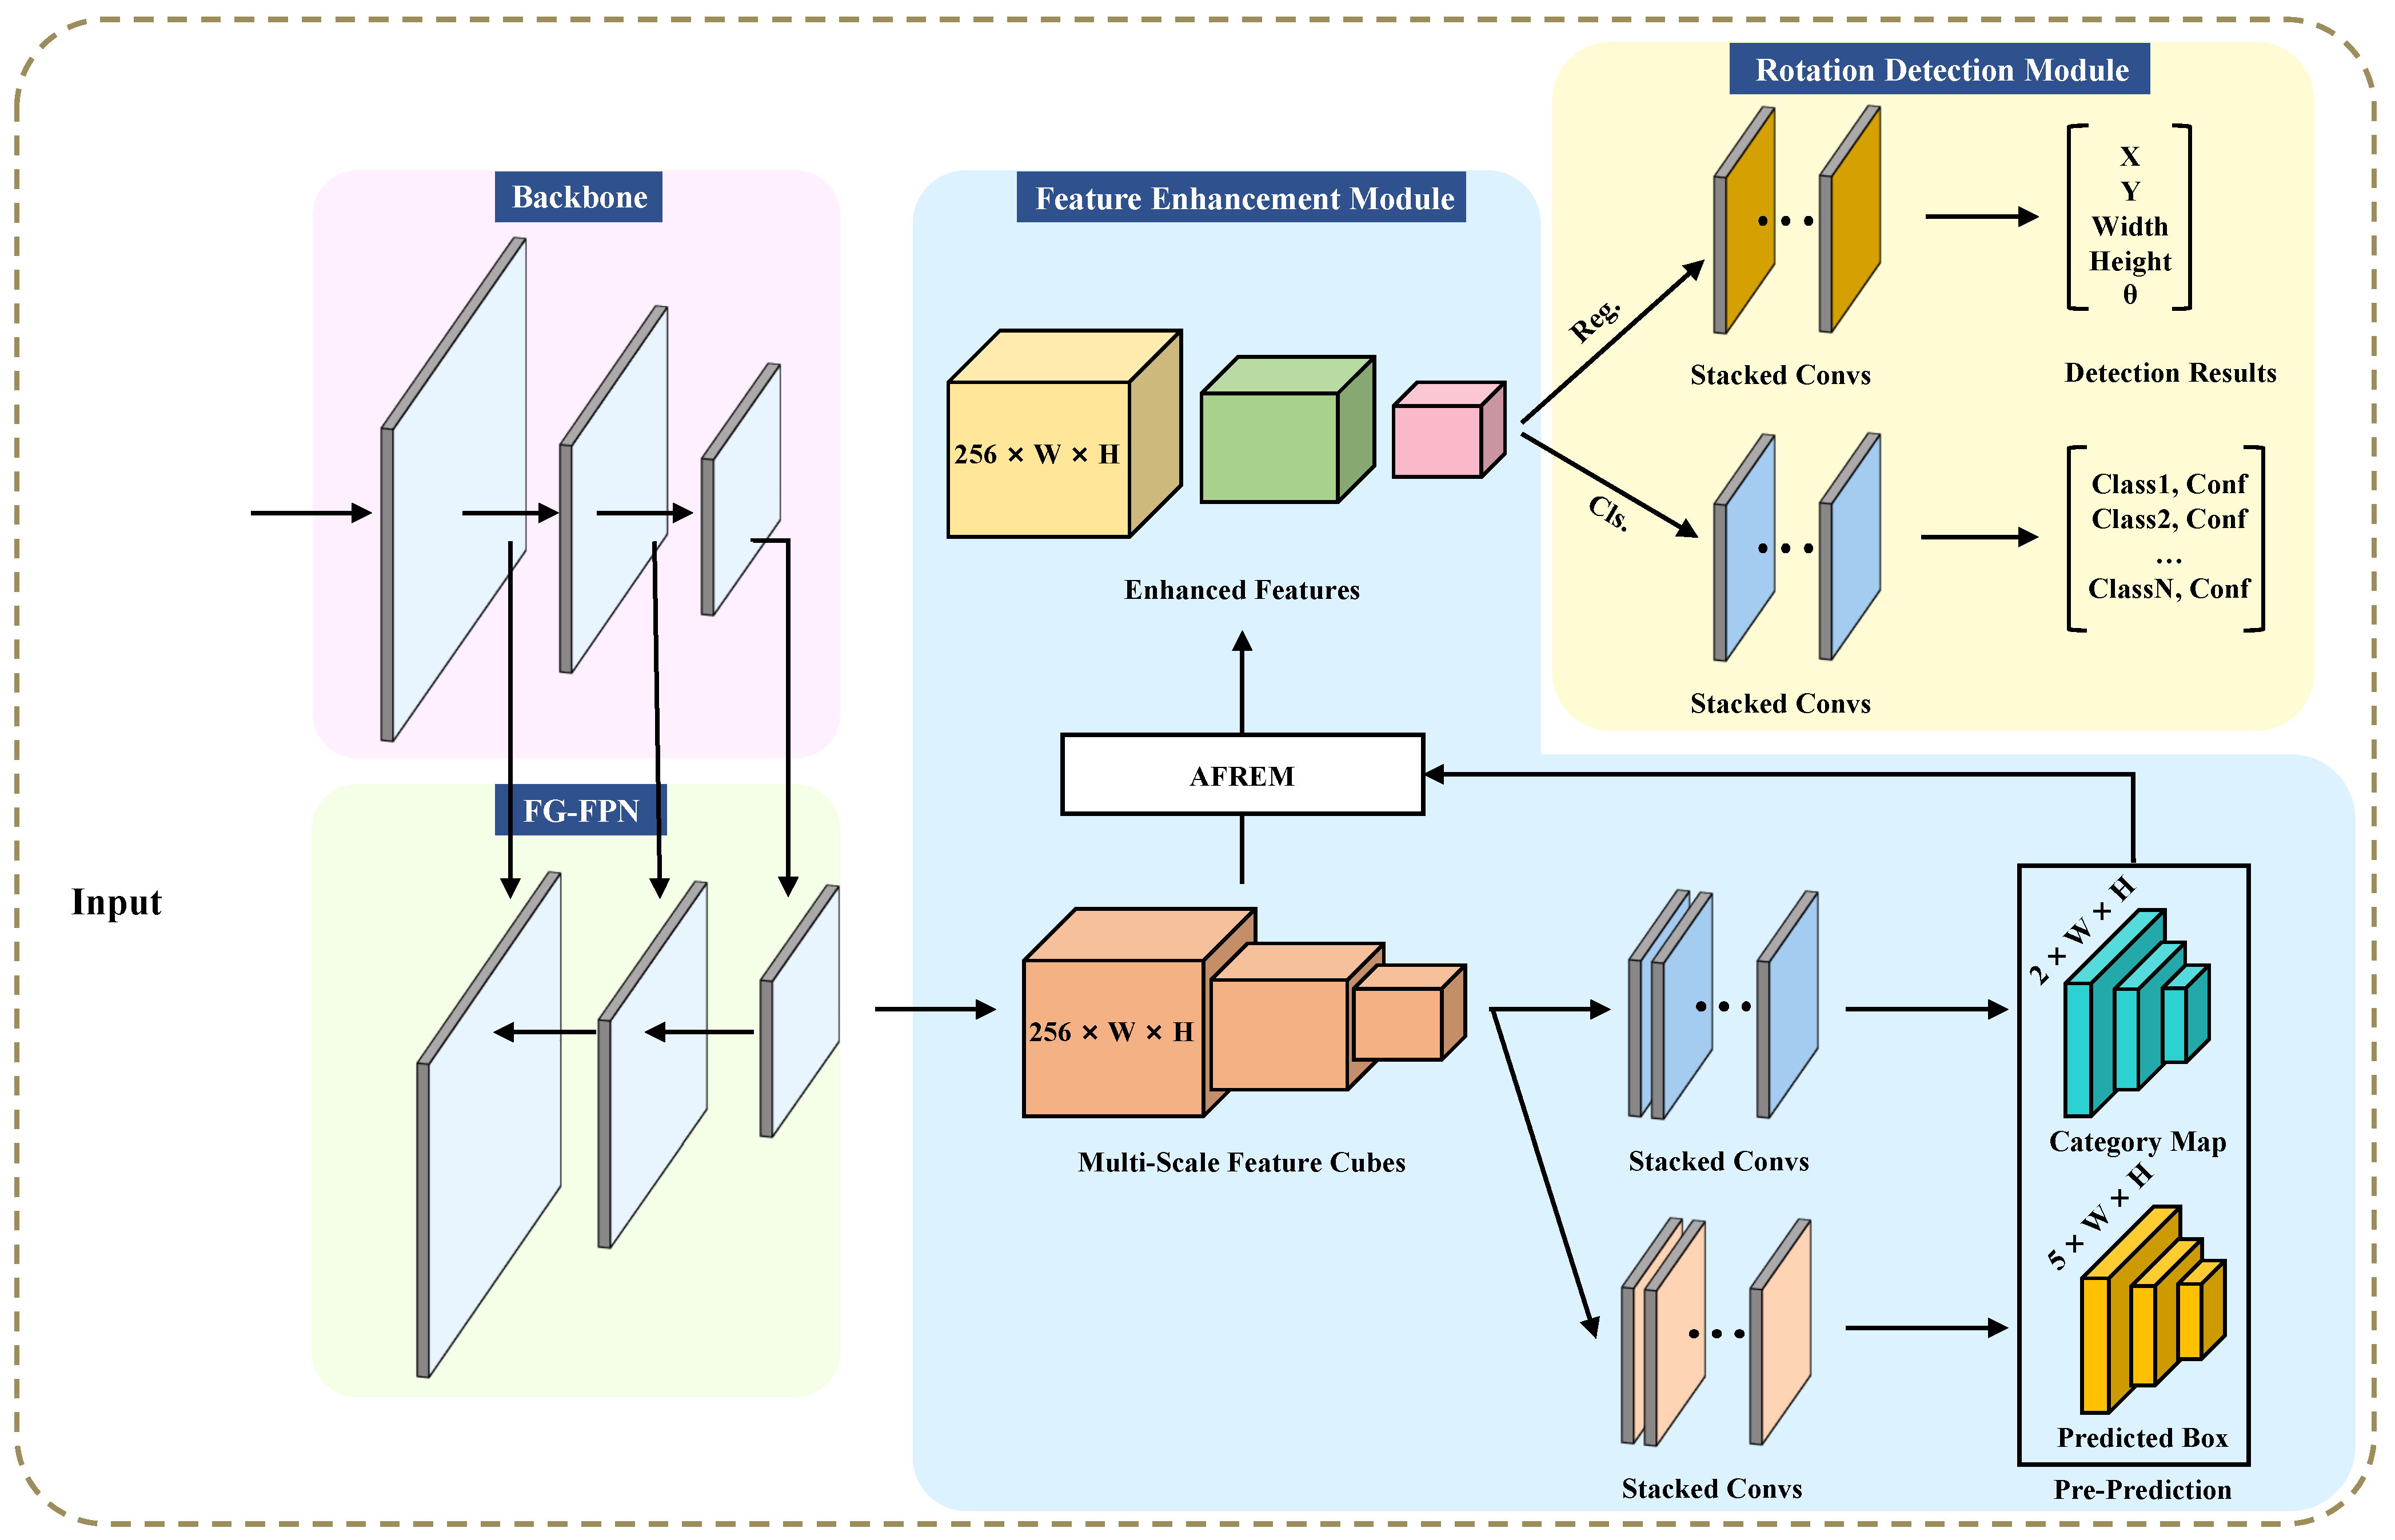
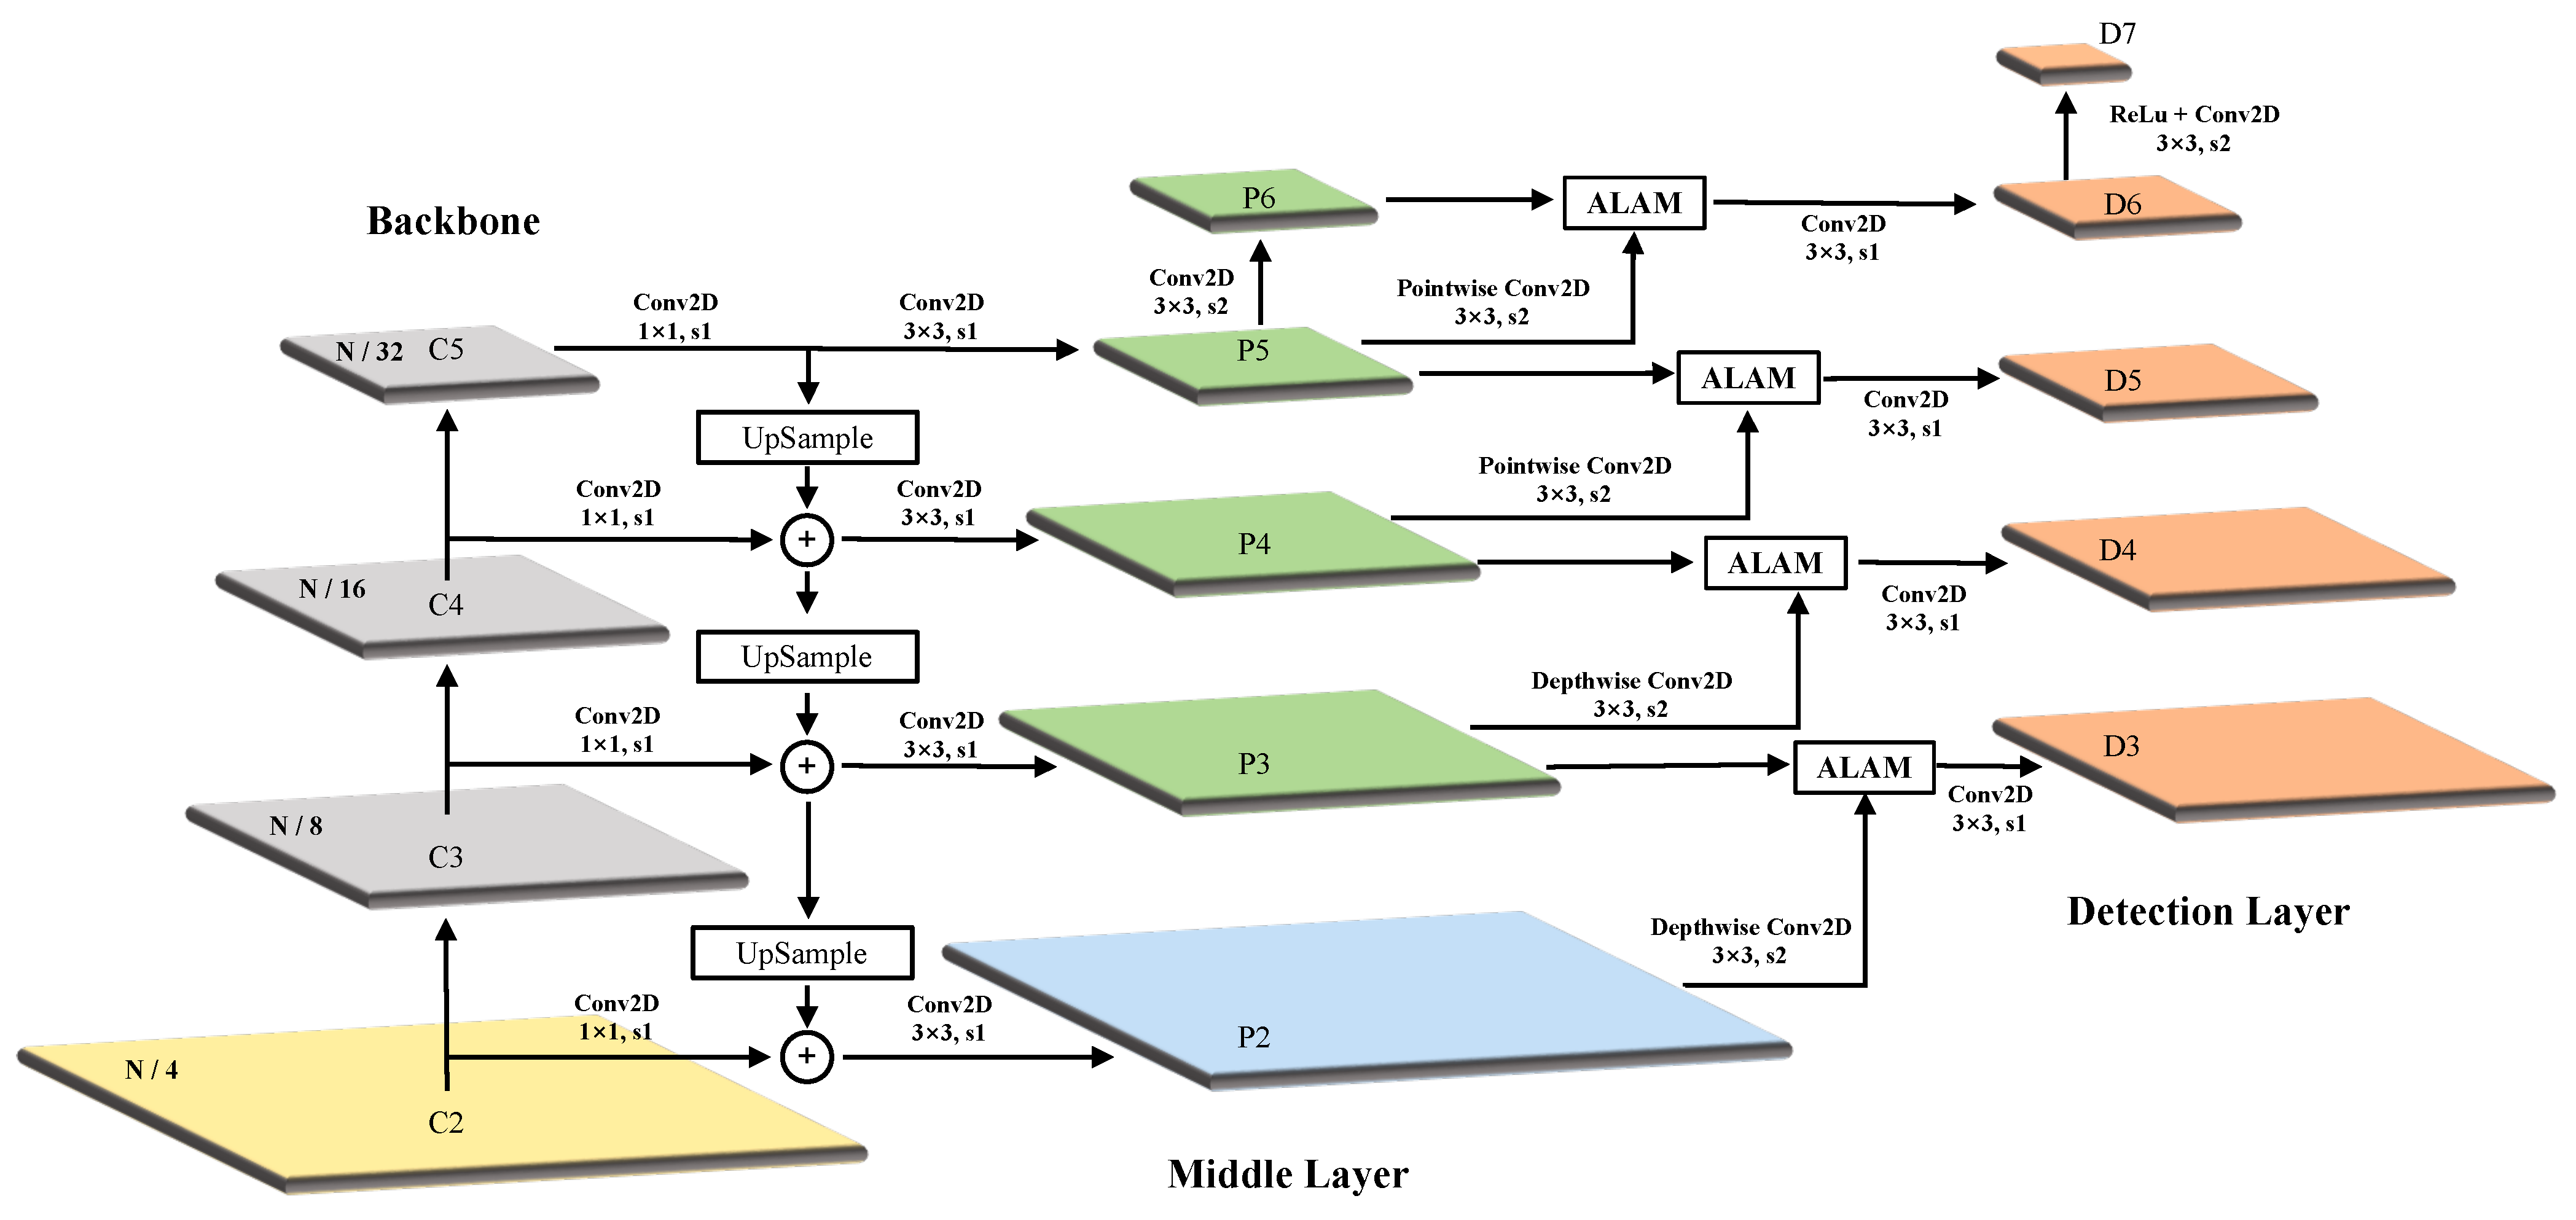
Seeing the above challenges, we propose an innovative AOOD detector called AFRE-Net (adaptive feature representation enhancement network), which effectuates adaptive feature representation enhancement for DNs in multi-scale detection layers. AFRE-Net is committed to achieving feature relevance learning between adjacent scales and end-to-end ERF transformation, so as to strengthen the feature representation in the detection layer. The overall architecture of the proposed AFRE-Net is shown in 
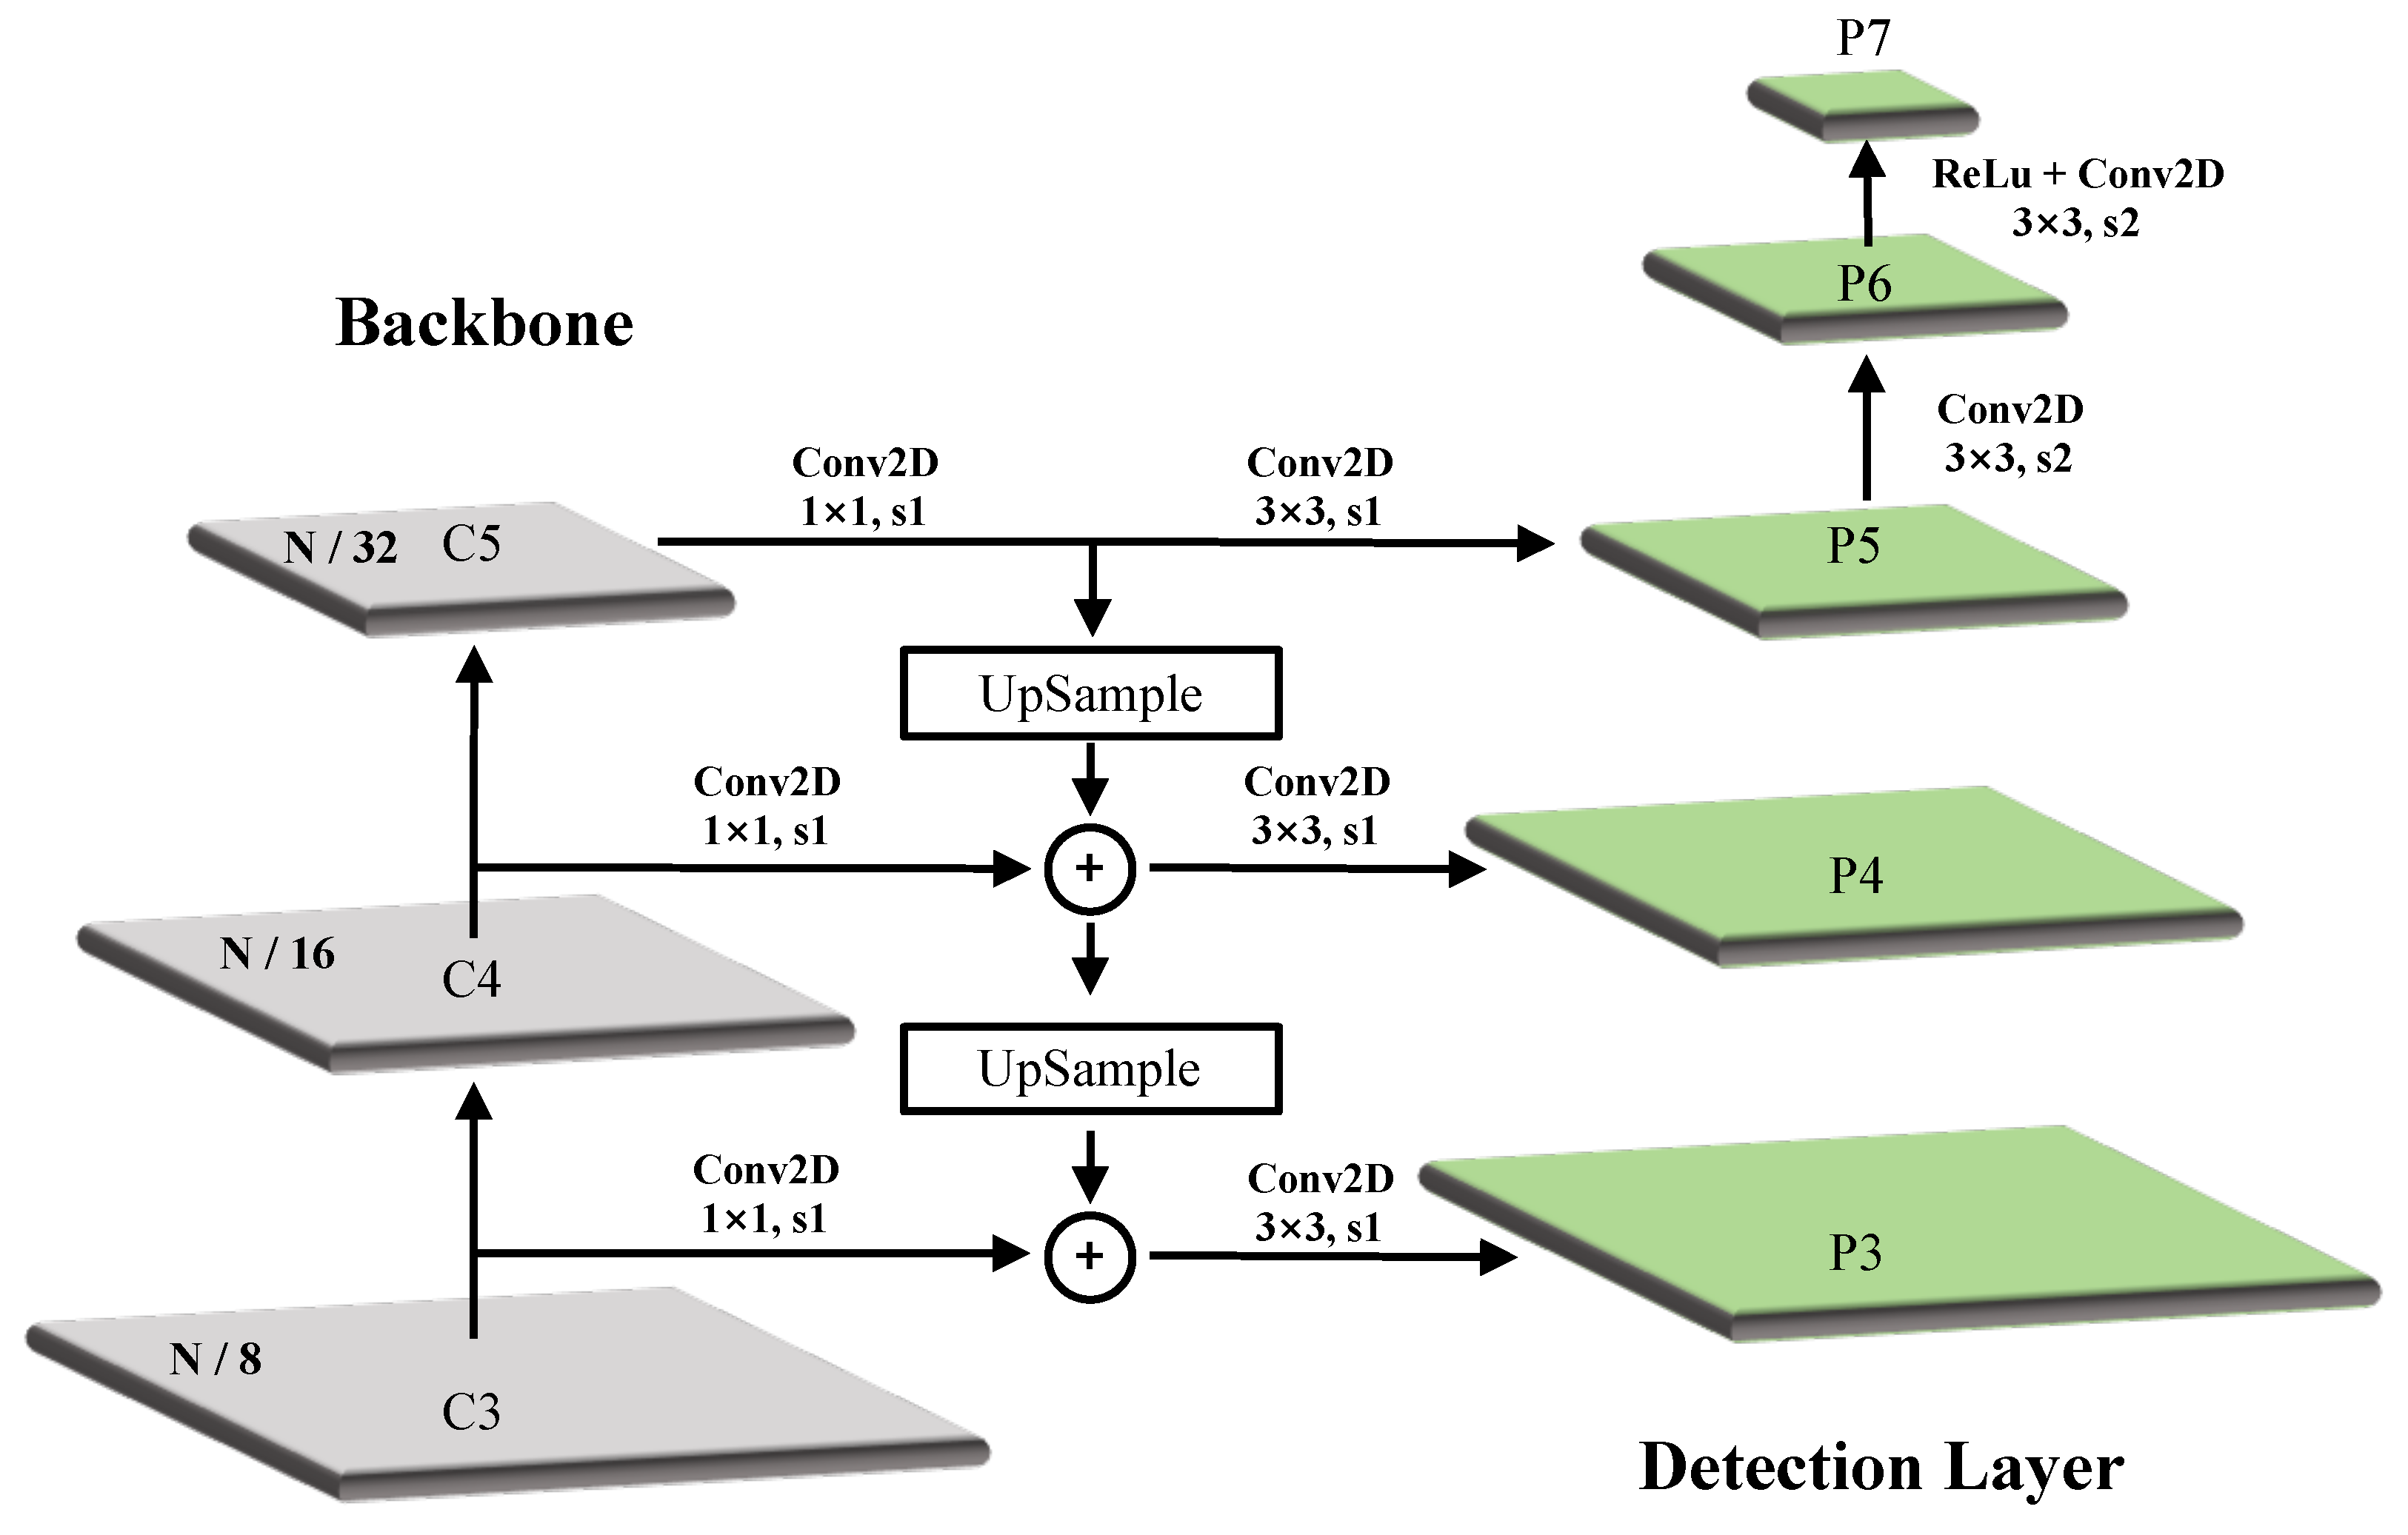
Figure 3, which consists of four modules: (1) The backbone for basic feature extraction; (2) An FG-FPN (fine-grained feature pyramid network) for providing finer multi-dimensional feature maps and performing feature fusions; (3) A feature enhancement module (FEM) and (4) a rotation detection module for category prediction (CP) and bounding box regression (BBR). As opposed to the regular feature pyramid network (FPN) [
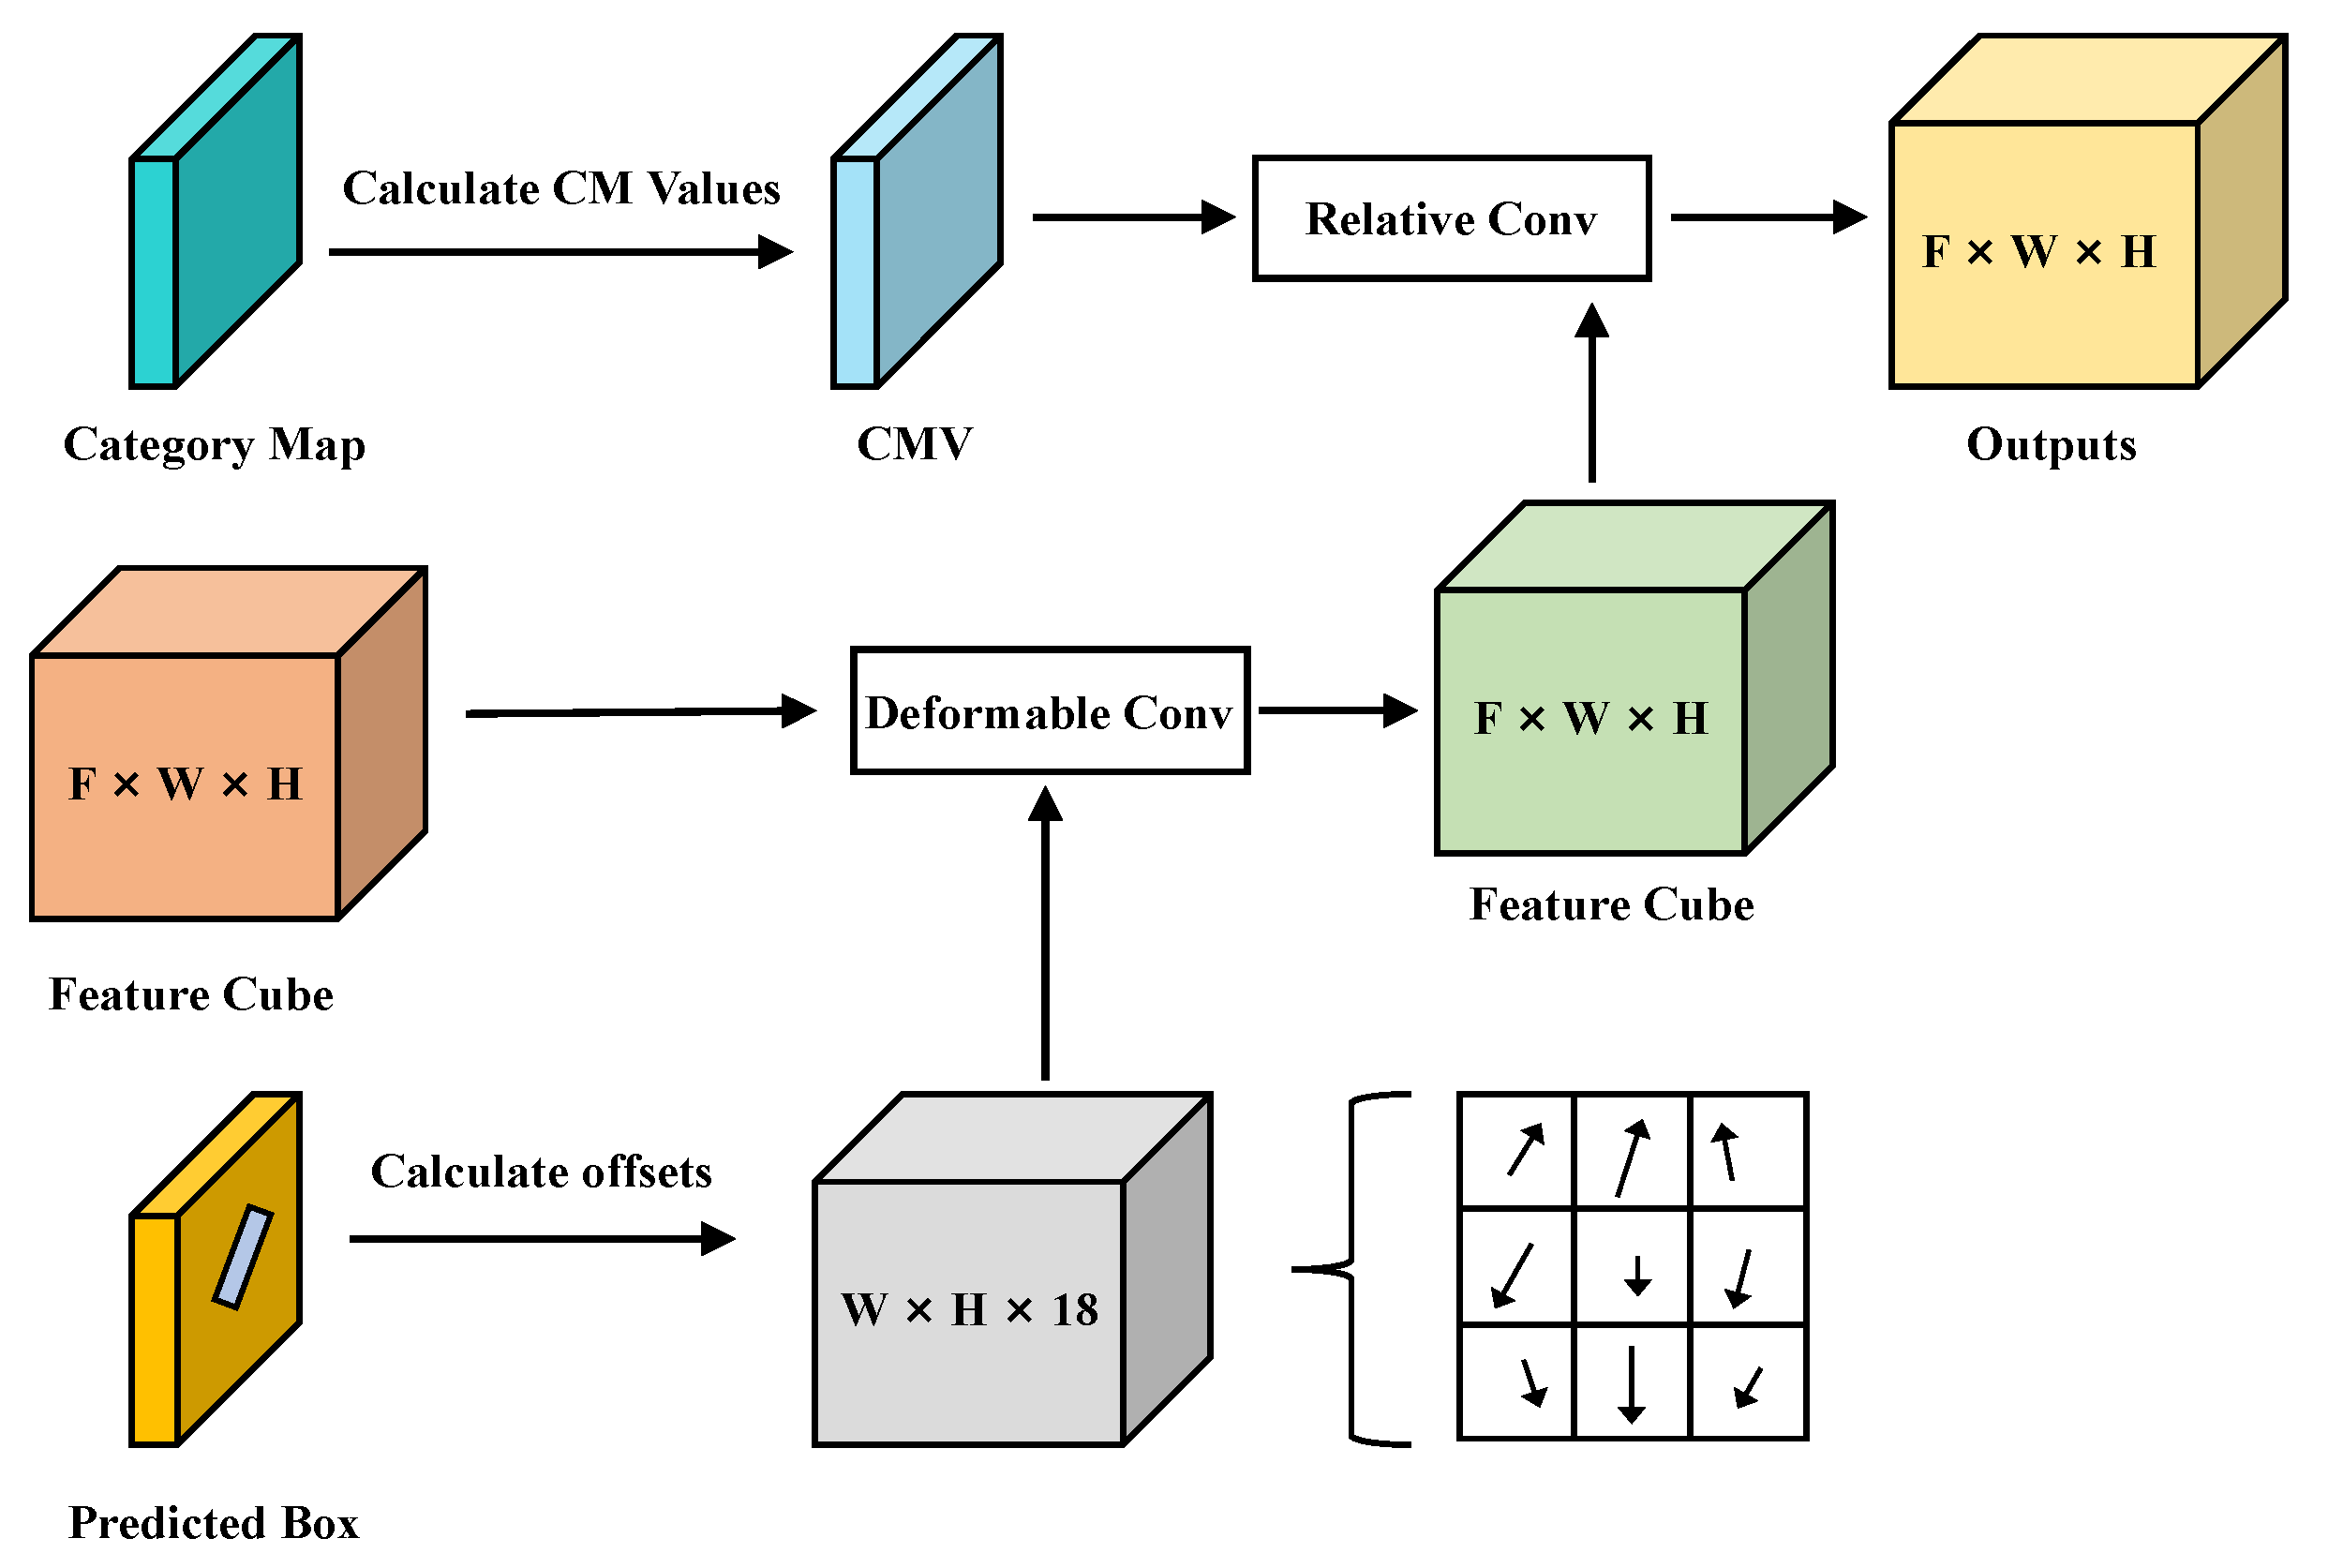
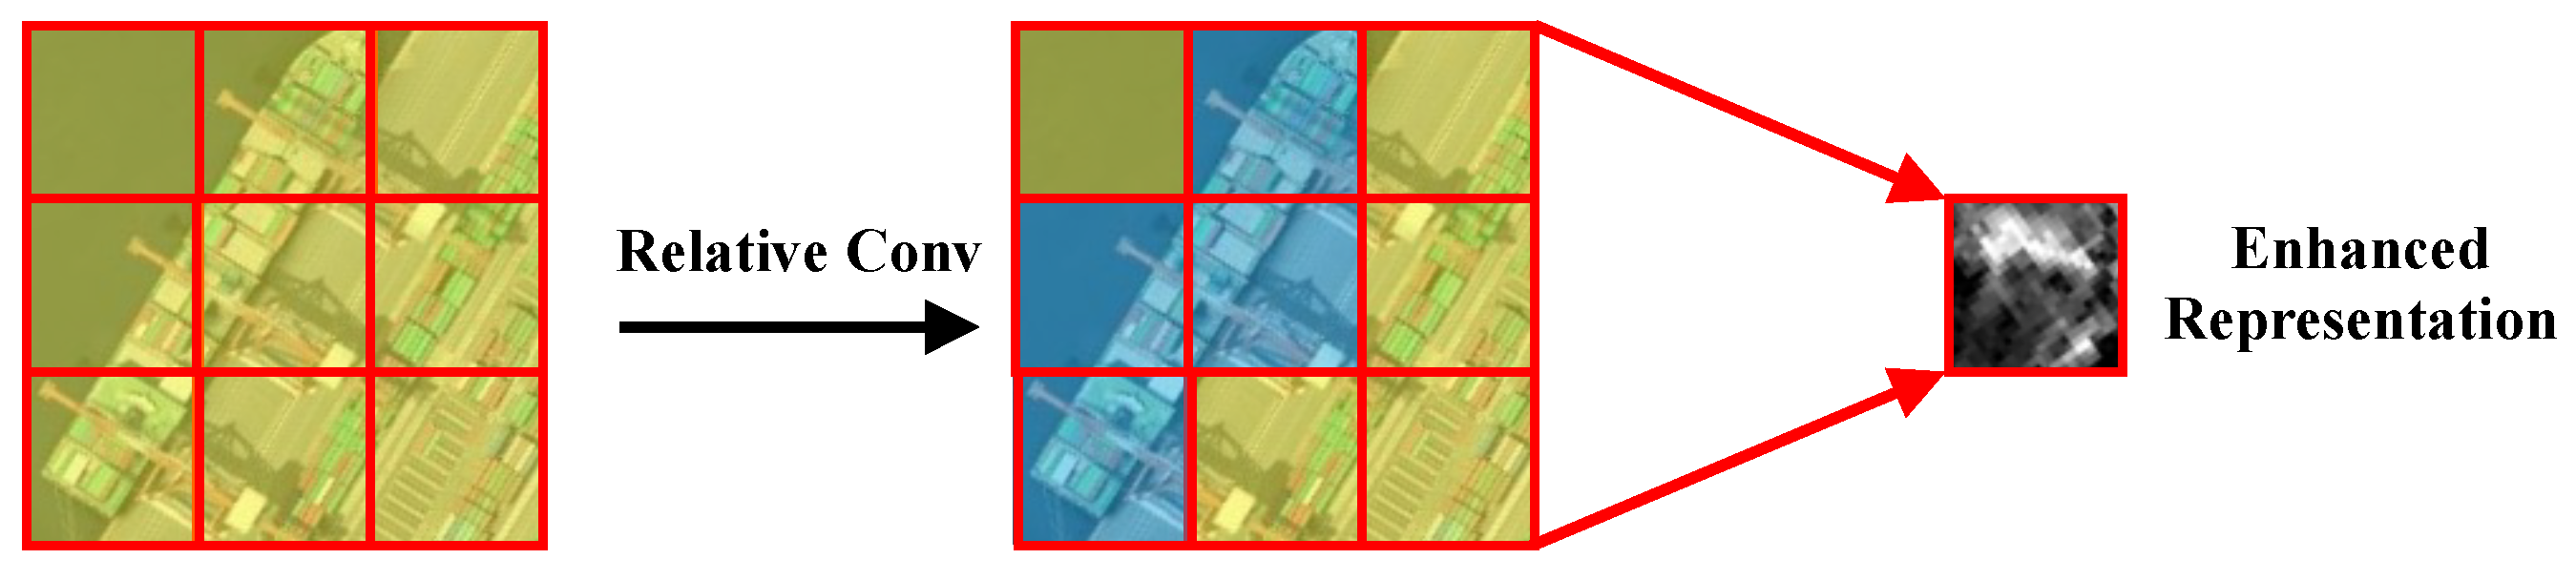
17], FG-FPN is designed to make better use of the low-dimensional feature maps rich in spatial information, and it uses a more fine-grained fusion method to provide a basis of features for subsequent FEM. In FEM, we apply the ERF transformation based on DCN, and invented a background suppression and foreground enhancement algorithm named relative-Conv, to achieve automatic and adaptive object representation enhancement. Extensive experimental tests on three benchmark remote sensing datasets (DOTA, HRSC2016, UCAS-AOD), as well as a text recognition dataset (ICDAR2015) demonstrate the state-of-the-art performance of our AFRE-Net.
The contributions of our work can be concluded as follows:
  • Our systematic analysis has mined three aspects that need to be considered together to improve the detector’s feature representation ability: fusion module, receptive field adjustment, and background suppression.
  • We propose a novel FG-FPN to provide finer features and fuse them in a more efficient manner. Different from FPN and its modifications, we focus on neighbor-scale information supplement to fullfil all-scale features.
  • A novel background suppression and foreground enhancement convolution module called relative conv is proposed to encourage DNs to learn the key areas adaptively.
  • We propose a new ERF transformation algorithm to make the sampling position more accurately located on the main body of the target, obtaining stronger semantic features.

2. Related Work

2.1. Arbitrary Oriented Object Detection

AOOD is an extension of object detection tasks in natural scenes [24,25], which follows the basic natural object detector pipeline. Concretely, detectors can be divided into anchor-based methods and anchor-free methods. For anchor-based detectors, YOLO [26,27] series lead the one-stage field and have achieved remarkable effects by designing regression models that balance accuracy and speed. R-CNN series [28,29] represent two-stage detectors and use region proposal network (RPN) to filter potential DNs. The latter often achieves higher detection accuracy due to its ability to control positive and negative samples well; however, the authors of ATSS [30] point out that the sample learning strategy is the key factor. After that, plenty of intelligent positive and negative sample learning strategies have been proposed [31,32].
Additionally, numerous scholars have attempted to tackle the practical issues that arise in AOOD. For example, refs. [10,11,12,33] have focused on solving the discontinuous problem of angle parameter regression in the training process, and constantly refining the loss function to improve performance. Some other scholars attempt to use a target representation vector that can eliminate such boundary discontinuities to represent instances, such as polar coordinates [12], ellipse bounding box [34], and middle lines of boxes [35]. Additionally, to obtain better-refined rotated anchor boxes, RR-CNN [36], R3Det [37], and CFC-Net [38] focus on spatial alignment and anchor refinement to guide the training process. However, none of them try to explain the limitations of detection units on target feature expression in a deeper perspective.

2.2. Feature Fusion Module

Feature pyramid network (FPN) [17] is the most frequently used feature fusion structure, because it can well integrate low-level spatial information with high-level semantic information, and can well cope with the feature differences caused by the change of target size. After FPN is proposed, PANet [18] proposed a dual-path fusion mode of top-down plus bottom-up to enhance the semantic representation of low-level feature maps. BiFPN [20] refined the design of this pattern and further improved its performance. Recursive-FPN [21] adds the additional feedback connection of FPN to the bottom-up backbone layer and it convolves features with different void rates based on switchable atrous convolution. However, these methods are not designed from the perspective of scale information supplement. Considering that no feature pyramid can completely cover the full size of all targets and input images, we need to mine the feature correlation of critical scale as far as possible to make up for this deficiency.

2.3. Feature Enhancement Module

FEM in AOOD has a broader scope of reference and is not limited to using a certain class of methods or specific means to be called feature representation enhancement. For example, some scholars [14,39] focus on solving feature misalignment between classification and box regression (localization), arguing the classification score of anchor boxes cannot reflect real localization accuracy. FFN [40] enhances the model’s feature expression ability for sub-optimal detection units in a creative way, but its design is too complex. Han et al. [14] were the first to attempt to alleviate this inconsistency through deformable convolutions [22] in AOOD; however, they ignore the adaptive feature representation learning. Ref. [39] proposed rotated align convolution (RAC) to improve feature representation of ship targets. However, they did not consider that the selection of sampling location should fall on the main body of the target body, and did not analyze the impact of background information interference within the detection unit on feature expression.
In addition, the performance of CNN in rotational feature extraction is known to be subpar [41]. Therefore, the research on rotation invariant feature extraction, as highlighted by works such as [42,43,44], plays a crucial role in improving CNN-based detectors. To achieve enhanced rotation invariant features, spatial and channel interpolation techniques are often employed [45,46]. For instance, Cheng et al. [6] were the pioneers in utilizing a fully connected layer as the rotation invariant layer, constraining it within the loss function. Furthermore, ReDet [8] takes a different approach by adaptively extracting rotation-invariant features from equivariant features based on the orientation of the Region of Interest (RoI). This adaptive extraction process contributes to the overall effectiveness of the detector. Oriented Reppoints [23] proposes an adaptive point set feature representation for AOOD tasks based on [47]. Although it can realize the adaptive transformation of ERF, its learning process is unordered and it does not realize the adaptive background suppression within a single feature extraction operator. Moreover, the above methods did not consider how to integrate the design of feature fusion with subsequent FEM as a whole. Our experiments show when the feature fusion module and ERF transformation are more fit, the feature representation ability of the detector is stronger.

3. Methodology

In this section, we will introduce the design of each independent module in AFRE-Net in detail. The overall pipeline of our detector is first introduced in Section 3.1. Then, we detail the FG-FPN in Section 3.2. Later, the adaptive feature representation enhancement module is unveiled in Section 3.4. Finally, experiment details about label assignment strategy are presented in Section 3.5.

3.1. Overall Pipeline

AFRE-Net is built based on RetinaNet-R [16] (baseline detector), which has classic object detector architecture and is easy to transfer. The overall pipeline of our AFRE-Net is shown in Figure 3. AFRE-Net consists of four main parts:
(1):
A backbone network (ResNet [48] in our experiments) for basic feature extraction.
(2):
A feature pyramid network for multi-scale feature fusions. We replace FPN [17] with our FG-FPN. FG-FPN is more capable of taking advantage of lower dimensional feature maps, which contain richer spatial information, can provide more fine-grained feature vectors for subsequent FEM, and enhance feature capture for small objects. FG-FPN fuses the feature maps with a top-down-top (rather than top-down only in FPN) pathway so the network constructs both rich semantic features and spacial information.
(3):
A feature enhancement module (FEM). FEM is designed to reconstruct the feature vectors of DNs in the detection layer, including the automatic transformation of the FRF and adaptive background suppression.
(4):
A rotation detection module (RDM). RDM converts semantic features into predicted bounding boxes and confidence of prediction categories for regions. RDM is a multi-task module and the regression targets are obtained in it. In our experiments, we adopt the five-parameter method to describe the bounding box, which is denoted as:
{ ( x , y , w , h , θ ) } ,
where x , y , w , h are coordinates of the bounding box center, the width, and the height, respectively. Parameter θ π 4 , 3 π 4 denotes the angle from the position direction of x to the direction of w. We have
t x = x x a / w a , t y = y y a / h a , t w = log w / w a , t h = log h / h a , t θ = tan θ θ a .

3.2. FG-FPN

3.2.1. Overall Architecture

It can be seen in Figure 4, RetinaNet-R employs the C 3 , C 4 , C 5 in the backbone network as the foundation for the following feature fusions. C 3 , C 4 , and C 5 are performed by 1 × 1 convolution to obtain the same channel dimension (256 in the baseline). Then, P 5 is obtained through a convolution layer of 3 × 3. The top-level feature P 5 is transmitted in a top-down manner and fused with low-level features layer by layer to obtain P 4 and P 3 . In this way, layer P i ( i = 3 , 4 , 5 ) is the same size as layer C i . Based on P 5 , P 6 is obtained through a 3 × 3 convolution with stride set to 2. P 7 is obtained through a Relu activation function and a 3 × 3 convolution with stride set to 2.
However, the structure of FPN has the following defects:
(1):
The utilization efficiency of low-level features is insufficient. It is necessary to add lower-level features rich in spatial information to participate in the fusion process, in order to improve the feature perception ability of small objects.
(2):
There are barriers between high-level features and low-level feature maps, as using only the top-down linking makes it impossible for high-dimensional feature maps to communicate directly with low-level feature maps (such as C3 and P5).
(3):
Lack of mining for the correlation of features between adjacent scales.
Therefore,
(1):
We re-enable the C 2 layer in ResNet (yellow layer shown in Figure 5);
(2):
After performing the top-down fusion, we perform the down-top feature fusion as well, which means using top-down-top structure.
(3):
We design an attention mechanism for mining inter-scale correlations, achieving the goal of simulating full-scale pyramid layers.
It should be noted that both the size and the numbers of the detection layer in FG-FPN have not changed, and C 2 is only used to generate polished P 2 (blue layer in Figure 5). All the feature channels are set to 256. Additionally, in order to better ensure the integrity of low-level spatial characteristics, depthwise convolution is used when P 2 P 3 is down-sampled and pointwise convolution is used when P 4 P 5 is down-sampled. In this way, high-level features can extract richer spatial information, and, most importantly, can greatly enhance the effectiveness of the proposed FEM in later processing stages.
After strengthening the feature map of each scale, we tried to find a way to compensate for the differences between scales. Considering such an extreme situation, by building a feature pyramid with countless scales, we can cover the object scale transformation of various sizes, but this is obviously unrealistic. Therefore, we try to use the attention mechanism to generate a feature map with inter scale correlation. It is equivalent to further enhancing representation between scales.

3.2.2. ALAM

The Arhat layer attention module (ALAM) is proposed to create a strong correlation between neighbor scales. Specifically, we regard the P i as the query, and P i 1 D (down-sampling output of P i 1 ) as the Key and Value. P i 1 D , P i 1 R H × W × C . Layer output A H T i is calculated as:
A H T i = soft max ( P i P i D · T H · W · C ) P i 1 D ,
where, ⊗ denotes element-wise multiplication, P i D · T denotes the transposition function, i { 3 , 4 , 5 } . D i is generated from R e L U ( C o n v 2 D ( A H T i ) ) . Through ALAM, D i is equivalent to a correlation map between neighbor scales, which are significantly different from FPN and its variants. Because we use the attention mechanism to connect the upper and lower levels, we enrich them by building a pseudo pyramid to cover more scale information.
As shown in Figure 6, to further demonstrate the effectiveness of FG-FPN embedded with ALAM, we visualized the highest-resolution feature layers of BiFPN and FG-FPN after the same training iterations. It can be seen that FG-FPN has a more divergent heatmap distribution, but has a stronger response to the target. This is because ALAM allows for more implicated neurons in a single feature unit, which can cover a larger range of receptive fields.

3.3. FEM

FEM is a multi-stage feature enhancement module because we perform a pre-prediction before accurate detection. As shown in Figure 3, FEM takes FG-FPN output X L I as the module input, where L I denotes the layer index of different feature maps, assigning multi-scale feature cubes into two separate task brunches (i.e., classification and bounding box regression). Classification and regression subnetworks are fully convolutional networks with a fixed number of stacked convolution layers (two in our experiments.) Note that here we only set one anchor in each DN and focal loss and smooth L1 loss are used for classification and bounding box regression, respectively. Softmax is used to generate category confidence and then the classification map (CM) is obtained. CM has the shape of 2 × W × H . For each point ( i , j ) in C M , C M ( i , j ) saves category labels and corresponding confidence, which are recorded as C M L ( i , j ) and C M C ( i , j ) , respectively. For predicted box (PB), P B ( i , j ) preserves the box position vector and has a shape of 5 × W × H . Finally, FEM re-inputs X L I , PB, and CM into AFREM to complete feature representation enhancement.

3.4. AFREM

The pipeline of AFREM is shown in Figure 7. To adaptively achieve ERF transformation, we design the ERF transformation algorithm based on deformable convolutional networks (DCN) [22], making it more suitable for objects in AOOD scenes. Relative convolution network (Relative Conv) is proposed to mitigate the impact of background features and magnify foreground information in a self-learning manner.

3.4.1. ERF Transformation

DCN pioneered the idea of changing the sampling position of the convolution kernel for each feature point in a self-learning manner. Outstanding works like oriented-reppoints and align-conv both achieve effective ERF transformation for remote sensing objects. However, the lack of control in the training process of the former leads to slow convergence of the network, and the lack of refined design of the latter leads to the inability of the sampling point to fall on the key area of the target of interest. Therefore, we try to use a more convenient way to make up for the two shortcomings at the same time.
Taking the convolution of 3 × 3 as an example, sampling offsets in both directions (18 values) are claimed at each point, making it possible to expand the ERF of DNs by providing learning capabilities in the sampling process. However, when applying DCN in AOOD, due to the larger object ratios and random orientations, intelligent ERF transformation faces challenges. As shown in Figure 8a, since PB is derived by OBB-guided regression, it basically fits the contour of the target. However, we hope that our sampling points (dark blue points in Figure 8a) can evenly fall on the target body, rather than just be limited to a certain part of the target (ERF box with mapping to original input in Figure 8a) or the boundary of the target. Alignment convolution in [14] ignores the solution to this problem. In our experiments, we try our best to place each sampling point on the main body of the object, as this ensures that the learned knowledge is focused on the object itself rather than the background features. Hence, we have designed a sample point reassignment strategy, as shown in Figure 8b. We use a shrunk PB to constrain the sampling position, making the sampling point better located inside the rotated bounding box.
Given an F × W × H (F denotes feature channels) feature cubes X L I , for each position P ( x 0 , y 0 ) , we obtain ERF transformation results F E L I by
F E L I ( P ) = Deformable ( X L I , offsets ( P ) ) ,
where offsets( P ) is the position bias with the size of W × H × 18 . The original offsets of 3 × 3 convolutions can be defined as O G = {(−1, -1), (−1, 0), (−1, 1), (0, −1), …, (1,1)},
offsets ( P ) = O G + σ S ,
where σ S is the shifting vector from the original sampling box to shrunk PB. As shown in Figure 8b, PB is scaled down with a shrinkage coefficient α to obtain shrunk PB (SPB). Let ( x , y , w , h , θ ) represent the PB in position P, shrunk box can be defined as ( x , y , α w , α h , θ ) . We set α = 0.85 in our experiments to suitably fit the target body. Since PB is derived from horizontal anchor box V a ( w a , h a ) by
S P B = α V a · t w , h · R T ( θ ) ,
the sampling DN S P in position P can be calculated as
S p = 1 S ( P + 1 K · S P B ) ,
where K is the kernel size and S is the down-sampling strides of current feature maps. Then, we can obtain offsets( P ) by
offsets ( P ) = S p O G σ S .

3.4.2. Relative ConV

For a DN, to automatically suppress background and highlight foreground targets, it is necessary to enable it to learn which regions are more important during back-propagation. In a standard 2D convolution, the output feature Y can be obtained by
Y LI ( P ) = g O G W ( g ) · X LI ( P + g ) ,
where P is the position of each DN, P { 0 , 1 , , W 1 } × { 0 , 1 , , H 1 } , and W ( g ) is the kernel weights. W ( g ) is the weights in an ordinary 3 × 3 convolution layer, which is updated and iterated with the optimization of the model. In relative convolution, we define the output Y R by
Y R ( P ) = g O G ( δ R J ( g ) + 1 ) W ( g ) · X ( P ) ,
and
R J ( g ) = 0 , C M L ( g ) C M L ( ( 0 , 0 ) ) 1 , C M L ( g ) = C M L ( ( 0 , 0 ) ) and C M L ( g ) 1
C M L is the category label obtained in FEM, δ is the accommodation coefficient and can be calculated by
δ = C M C + η ,
where C M C is the category prediction confidence. Symbol η = 0.2 is used to control the learning intensity. Figure 9 illustrates the operating mode of the relative convolution. By using it, detectors can obtain enhanced representations by strengthening learning about foreground targets.

3.5. Label Assignment Strategy

Label assignment strategy (LAS) has a significant impact on the overall accuracy of the model since it encourages the model to select and refine positive samples reasonably and effectively during training. To enhance the robustness of our AFRE-Net, we have decided to optimize the LAS in our detector. In the FEM, we utilize intersection over union (IoU) as the matching metric. Specifically, we set the foreground and background thresholds for determining whether an anchor is positive or negative to 0.5 and 0.4, respectively. These thresholds help us differentiate between foreground and background regions effectively. In the RDM, we employ dynamic anchor learning (DAL) [31] for intelligent anchor selection, which aims to activate more positive anchors during the refinement process. The matching degree, denoted as m d , is defined as follows:
m d = α · s a + ( 1 α ) · f a u γ
u = | s a f a |
where s a denotes IoU of the anchor input, and f a represents the IoU between the GT box and the regression box. The term u is the absolute difference between the IoU of the anchor and the IoU between the GT box and the regression box. In our experiments, we set α to 0.3, and γ to 5. If the IoU of an anchor is greater than m d , it will be classified as positive; otherwise, it will be classified as negative. This approach allows us to effectively determine the positive anchors based on their IoU values.

4. Experimental Results and Analysis

4.1. Datasets

Our AFRE-Net was assessed on three publicly available and challenging datasets, namely DOTA [49], HRSC2016 [50], and UCAS-AOD [51].
DOTA is an extensive dataset consisting of aerial images that capture complex scenes relevant to AOOD. It comprises a total of 2806 aerial images, with 1411 images for training, 458 images for validation, and 937 images for testing. These images contain a total of 188,281 instances belonging to 15 categories. The image size ranges from 800 × 800 to 4000 × 4000, and all instances are labeled with OBB, which exhibit variations in scales, aspect ratios, and orientations. To facilitate training, we divided the images into regular 1024 × 1024 patches with a stride of 200. The categories and corresponding IDs are as follows: Plane (PL), Baseball diamond (BD), Bridge (BR), Ground track field (GTF), Small vehicle (SV), Large vehicle (LV), Ship (SH), Tennis court (TC), Basketball court (BC), Storage tank (ST), Soccer-ball field (SBF), Roundabout (RA), Harbor (HA), Swimming pool (SP), and Helicopter (HC).
HRSC2016 is a high-resolution ship detection dataset that contains images collected from six international harbors. It consists of 1061 images, with image sizes ranging from 300 × 300 to 1500 × 900. The dataset includes 436 images for training, 541 images for validation, and 444 images for testing. All ship objects are labeled with OBB, and the substantial variation in ship sizes poses a significant challenge for detection.
UCAS-AOD is an aerial image dataset specifically designed for oriented aircraft and car detection. It comprises 1510 images, including 1000 airplane images and 510 car images. We randomly divided the dataset into training, validation, and test sets in a ratio of 5:2:3.
Additionally, to assess the scenario generalization capabilities of our AFRE-Net, we utilized the ICDAR-2015 [52] dataset as a benchmark for testing. This dataset consists of 1000 training images and 500 test images. The text boxes in this dataset are labeled with OBB and exhibit a very large aspect ratio, making them particularly challenging for detection.

4.2. Implementation Detail

For all datasets, we only set one horizontal anchor with aspect ratios of {1}, and resize all images to 1024 × 1024. Data augmentation techniques, such as random flip, rotation, and HSV color space transformation, are employed. The training optimizer used is Adam, with the initial learning rate set to 5 × 10 4 . At each decay step, the learning rate is divided by six. We utilize ResNet50 as the backbone network, which has been pre-trained on ImageNet. For DOTA, the models are trained on a single RTX 3090, and the batch size is set to two. Regarding HRSC2016, the detector undergoes a total of 12 K iterations during training, with the learning rate decaying at 8 K and 11 K, respectively. We evaluate the performance using average precision (AP) as the metric, following the same definition as the PASCAL VOC 2012 object detection challenge [53]. Unless explicitly stated, mAP refers to A P 50 .

4.3. Ablation Studies

In this section, we conduct a series of experiments on DOTA and HRSC2016 to test our proposed AFRE-Net. We first verify the progressiveness of FG-FPN at the entire detector. Then, FEM is disassembled from the model to analyze its vital impact on overall performance. Finally, the respective capabilities of FRF expansion and RC are verified separately. Our ablation experiments demonstrate that when FG-FPN is combined with our meticulously designed FEM, our detector can achieve greater efficacy, thereby demonstrating the advantages of AFRE-Net.
To ensure fair comparisons, our baseline model adopts the same configuration as described in Section 4.2. Furthermore, we set the depth of the detection head (i.e., the rotation detection module in Figure 3) to a uniform value of 2, as it has a significant impact on the final detection result. In contrast to our AFRE-Net, which only utilizes one preset anchor with an aspect ratio of {1}, our baseline model employs three horizontal anchors with aspect ratios of {0.5, 1, 2} for matching objects. The results presented in Table 1 and Table 2 demonstrate that our baseline model achieves an mAP of 68.2% on DOTA and 86.32% on HRSC2016.

4.3.1. Effectiveness of Hyper-Parameter

The parameter η in our model is used to deal with the weight imbalance caused by strengthening the learning of key areas in relative conv. As shown in Table 3, when η is around −0.2, negative compensation can achieve better performance by relative conv.

4.3.2. Effectiveness of FG-FPN

Our baseline detector applies FPN as the neck to fuse multi-scale feature maps. As shown in Table 4, when replacing FPN with FG-FPN alone, the detector achieves accuracy gains of +1.01 and +0.92 on two datasets, respectively, proving that FG-FPN has a stronger feature fusion ability than FPN. In particular, it can provide low-level spatial information, which is very friendly for small targets. As can be seen in Table 1, the detection accuracy of SV has been greatly improved. However, at the same time, the replacement of FG-FPN also increased the number of parameters in the model, and we calculated that the size of the weight checkpoint file increased by 6.5 M. The detailed FG-FPN complexity is shown in Table 5. It can be seen that the introduction of FG-FPN has brought about a certain increase in model complexity, mainly caused by ALAM, as a large number of intermediate parameters are generated during the calculation process of this attention mechanism, also leading to an increase in inference time. It should be noted that this group of testing experiments did not use any feature enhancement modules, including AFREM. As shown in Table 5, when FG-FPN is used alone, it can only slightly improve the overall detection accuracy of the model. However, when FG-FPN is combined with our proposed AFREM, it can fully release the model performance, as AFREM can utilize the features rich in low-level spatial information provided by FG-FPN, obtaining more robust target feature representations.

4.3.3. Effectiveness of FEM

FEM consists of two parts: ERF expansion and Relative ConV. We first verified how the overall detection accuracy of the detector changes when the entire FEM module is removed. As shown in the third and fourth control experiments in Table 4 (third and fourth columns), the use of different combinations of embeddings in detectors results in varying levels of detection accuracy. The combination of FG-FPN and FEM resulted in an astonishing mAP gain of +6.92 for the detector on DOTA, while FPN plus FEM achieves a +4.91 mAP improvement, which is also satisfactory. However, the former cannot be compared to the latter. Similar results also occurred on HRSC2016, where the combination of FG-FPN plus PEM achieves better performance, and improves the mAP by 5.12%.
In addition, to verify the contributions made by ERF transformation and Relative Conv in FEM, we conducted two comparative experiments, as shown in Table 6. It should be noted that both FG-FPN and DAL are used in these two comparative experiments. Inside FEM, since the size of feature cubes does not change, we only need to remove the other embedding when testing only one embedding. The experimental results show that when the two are combined, they can play a greater role. This is because by combining the two embeddings, DN not only can obtain the self-learning changes of the ERF, but also can adaptively learn the key areas in it and suppress the background information, thus obtaining better feature expression ability.

4.3.4. Effectiveness of Label Assignment Strategy

In order to eliminate the impact of LAS in our experiment, we also conducted comparative experiments to verify the universality of our proposed methods. As shown in Table 6, when using DAL in the baseline, the accuracy of the detector on DOTA increased by 1.54% and on HRSC06 by 1.26%, indicating that the optimization of LAS is significantly helpful in improving the overall detection accuracy. However, the experimental results show that the use of LAS does not affect the improvement of the model detection accuracy brought by FG-FPN and FEM. On the contrary, when the three are combined, the maximum gain can be achieved.

4.4. Comparison with State-of-the-Art Detectors

4.4.1. Results on DOTA

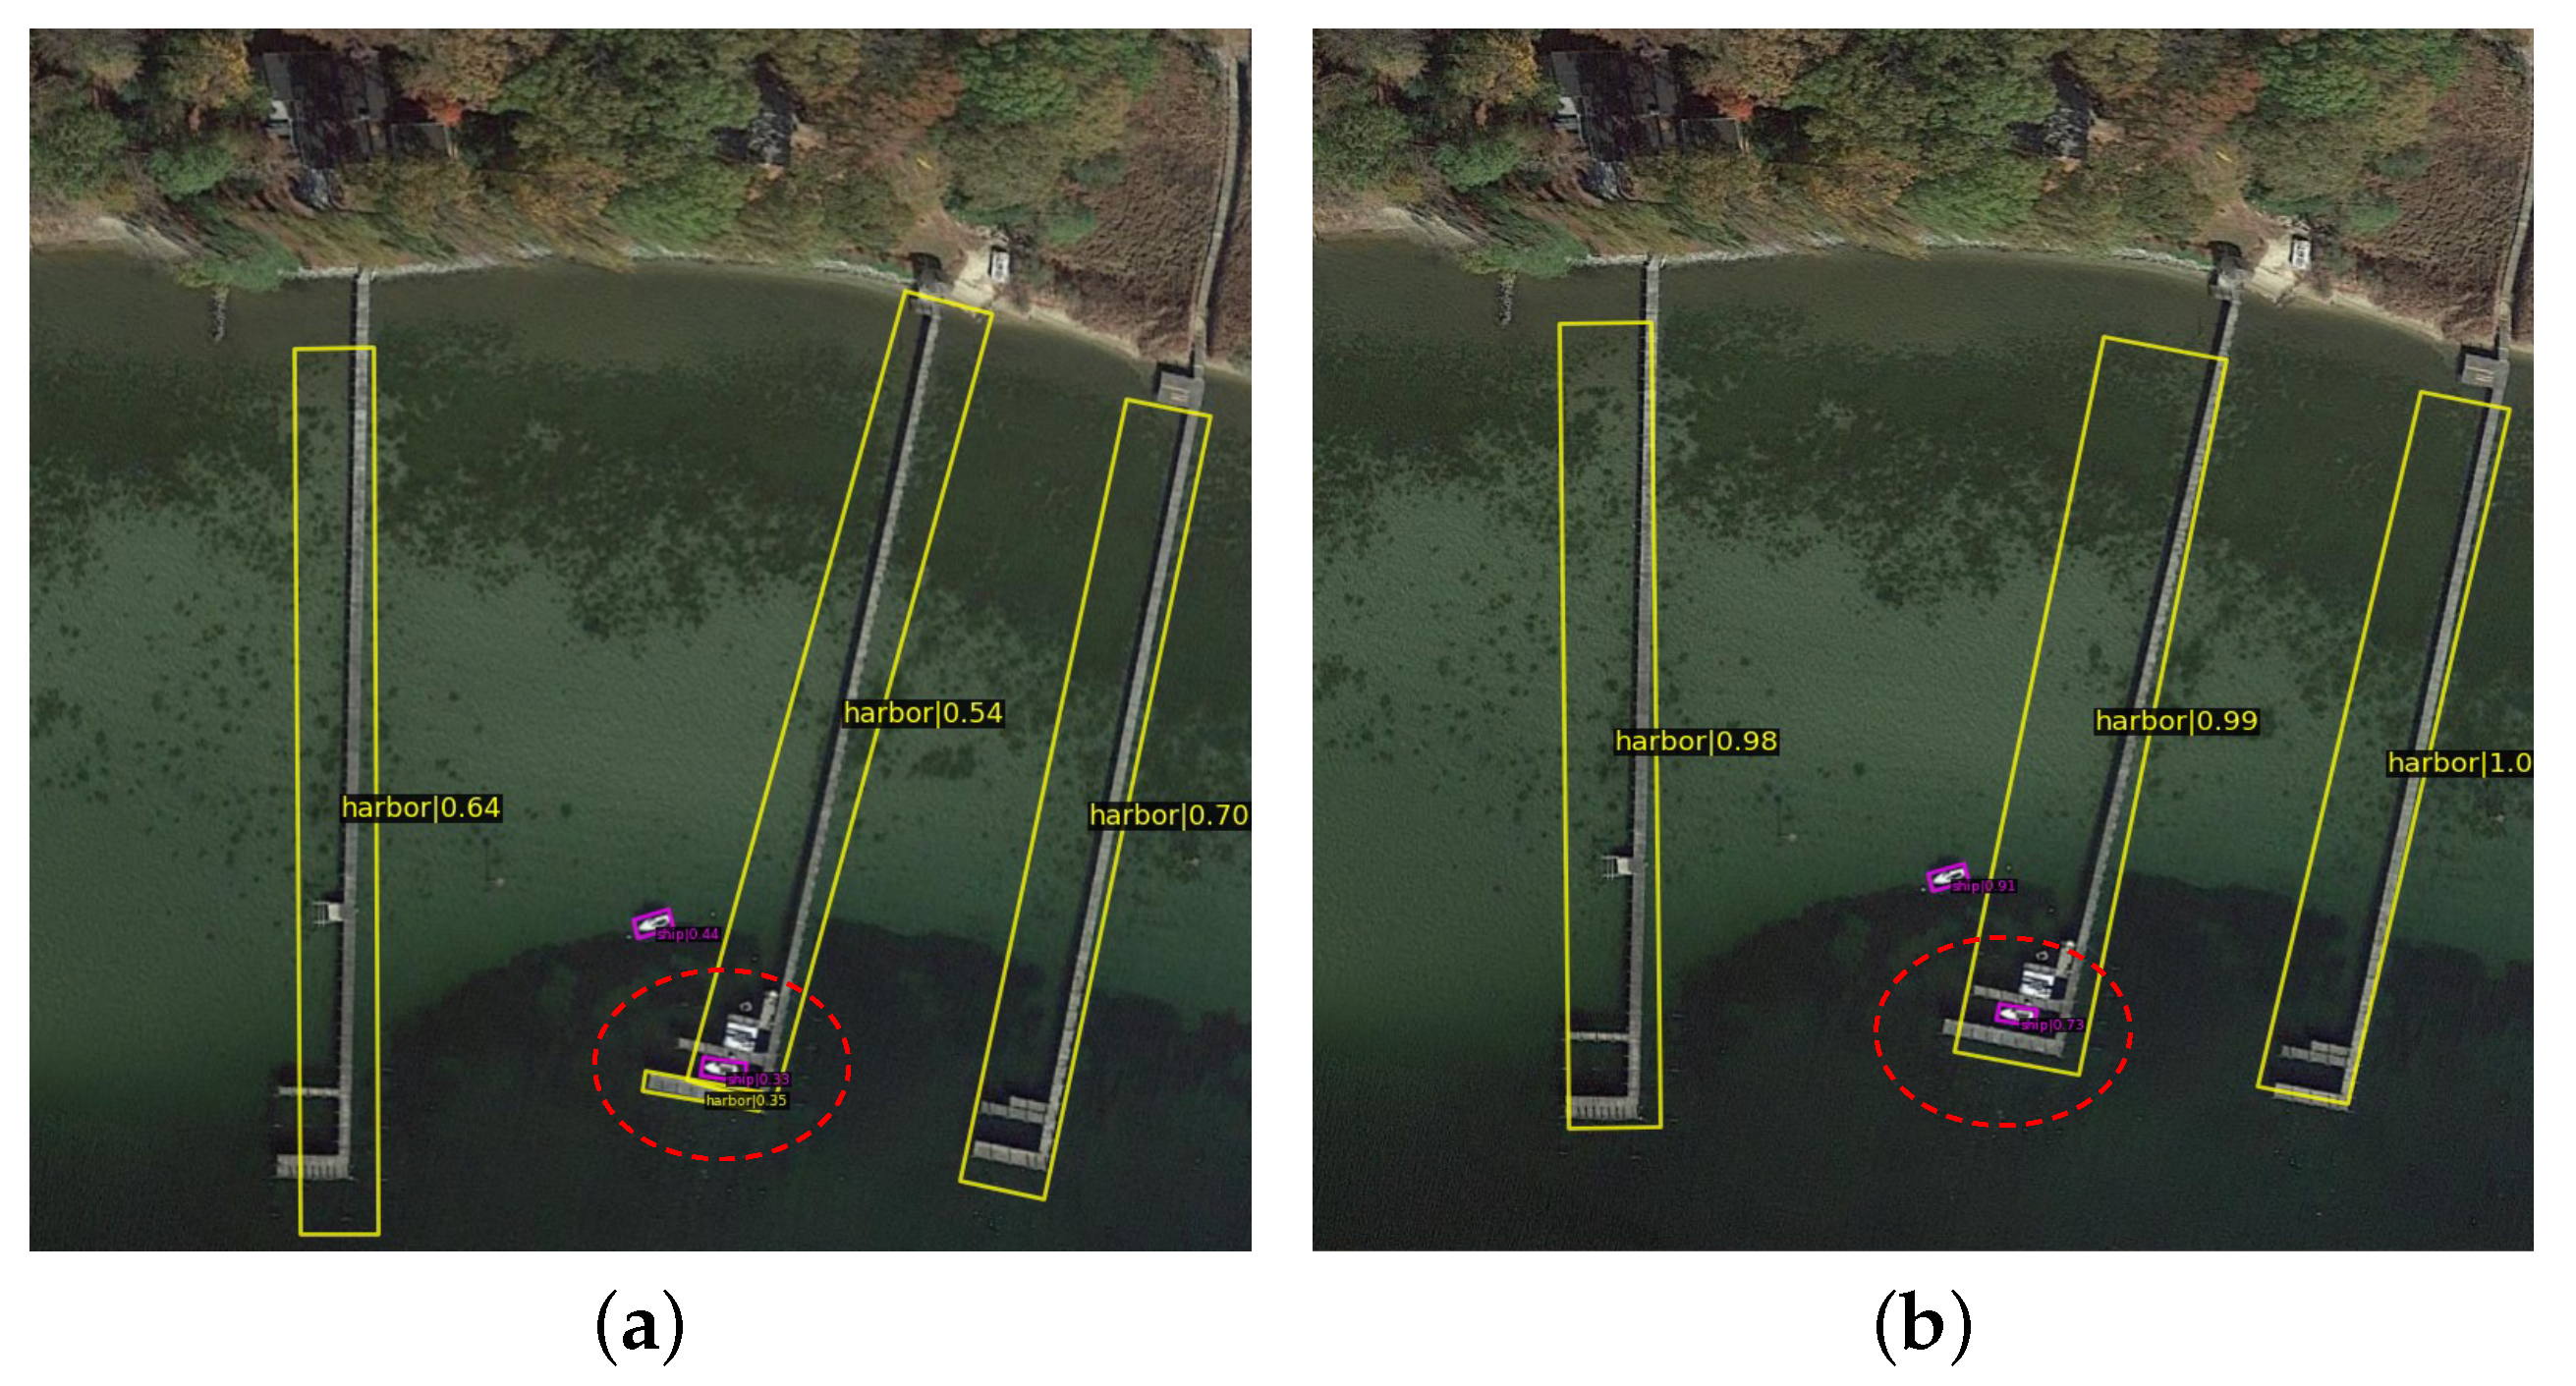
We select some difficult scenarios as a demonstration of AFRE Net’s detection capabilities. As shown in Figure 10 and Figure 11, because our detector has improved the ability of feature expression, its confidence in the predicted output of the target has been greatly improved, and error detection has been effectively avoided (red circle in 
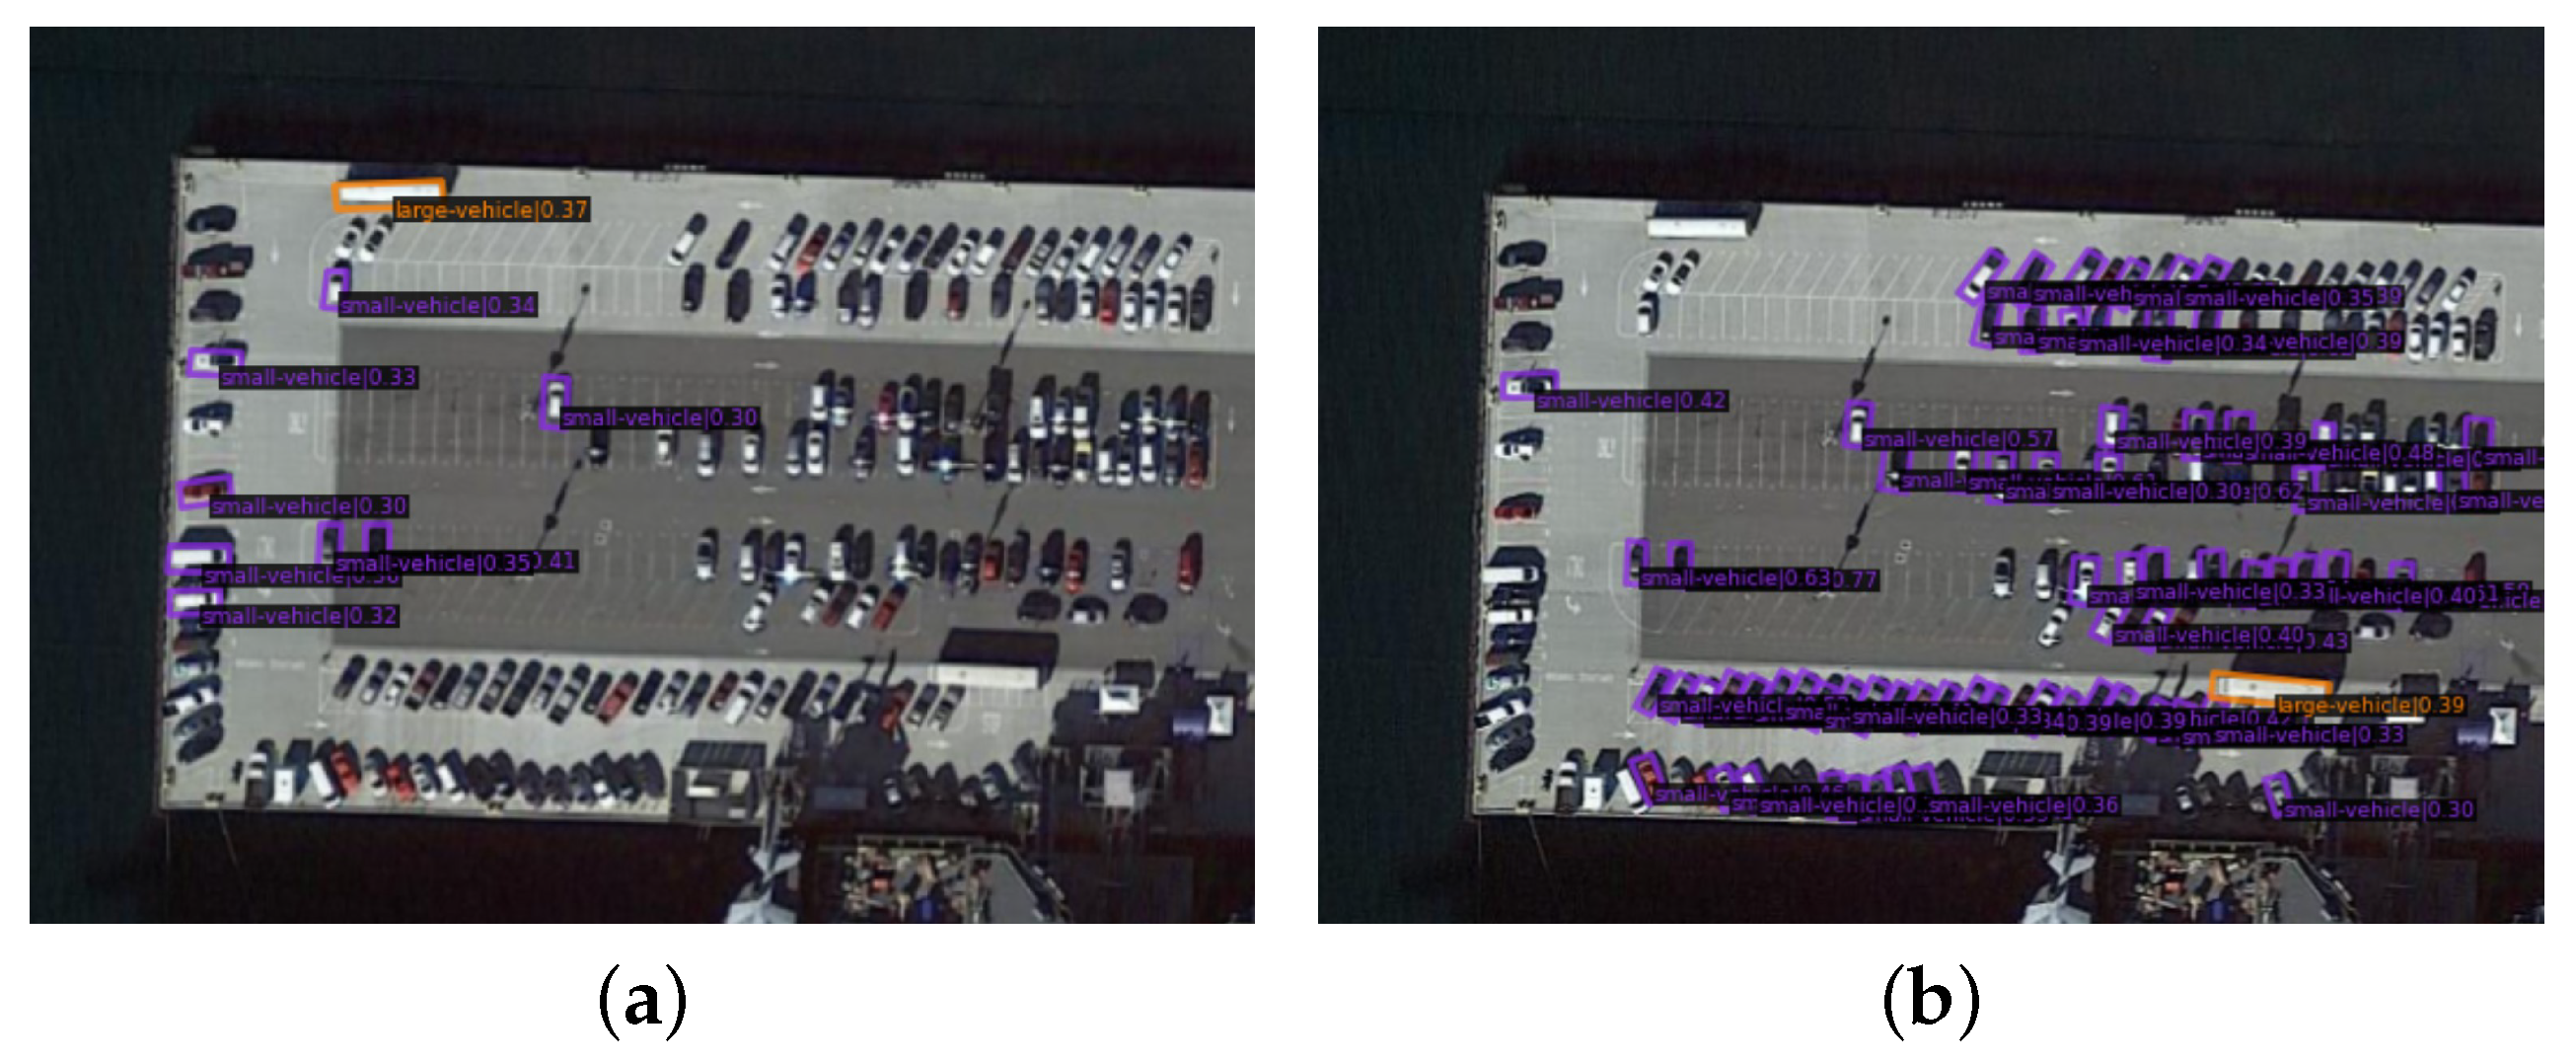
Figure 10a). Moreover, the detection ability for small targets has also been greatly improved.
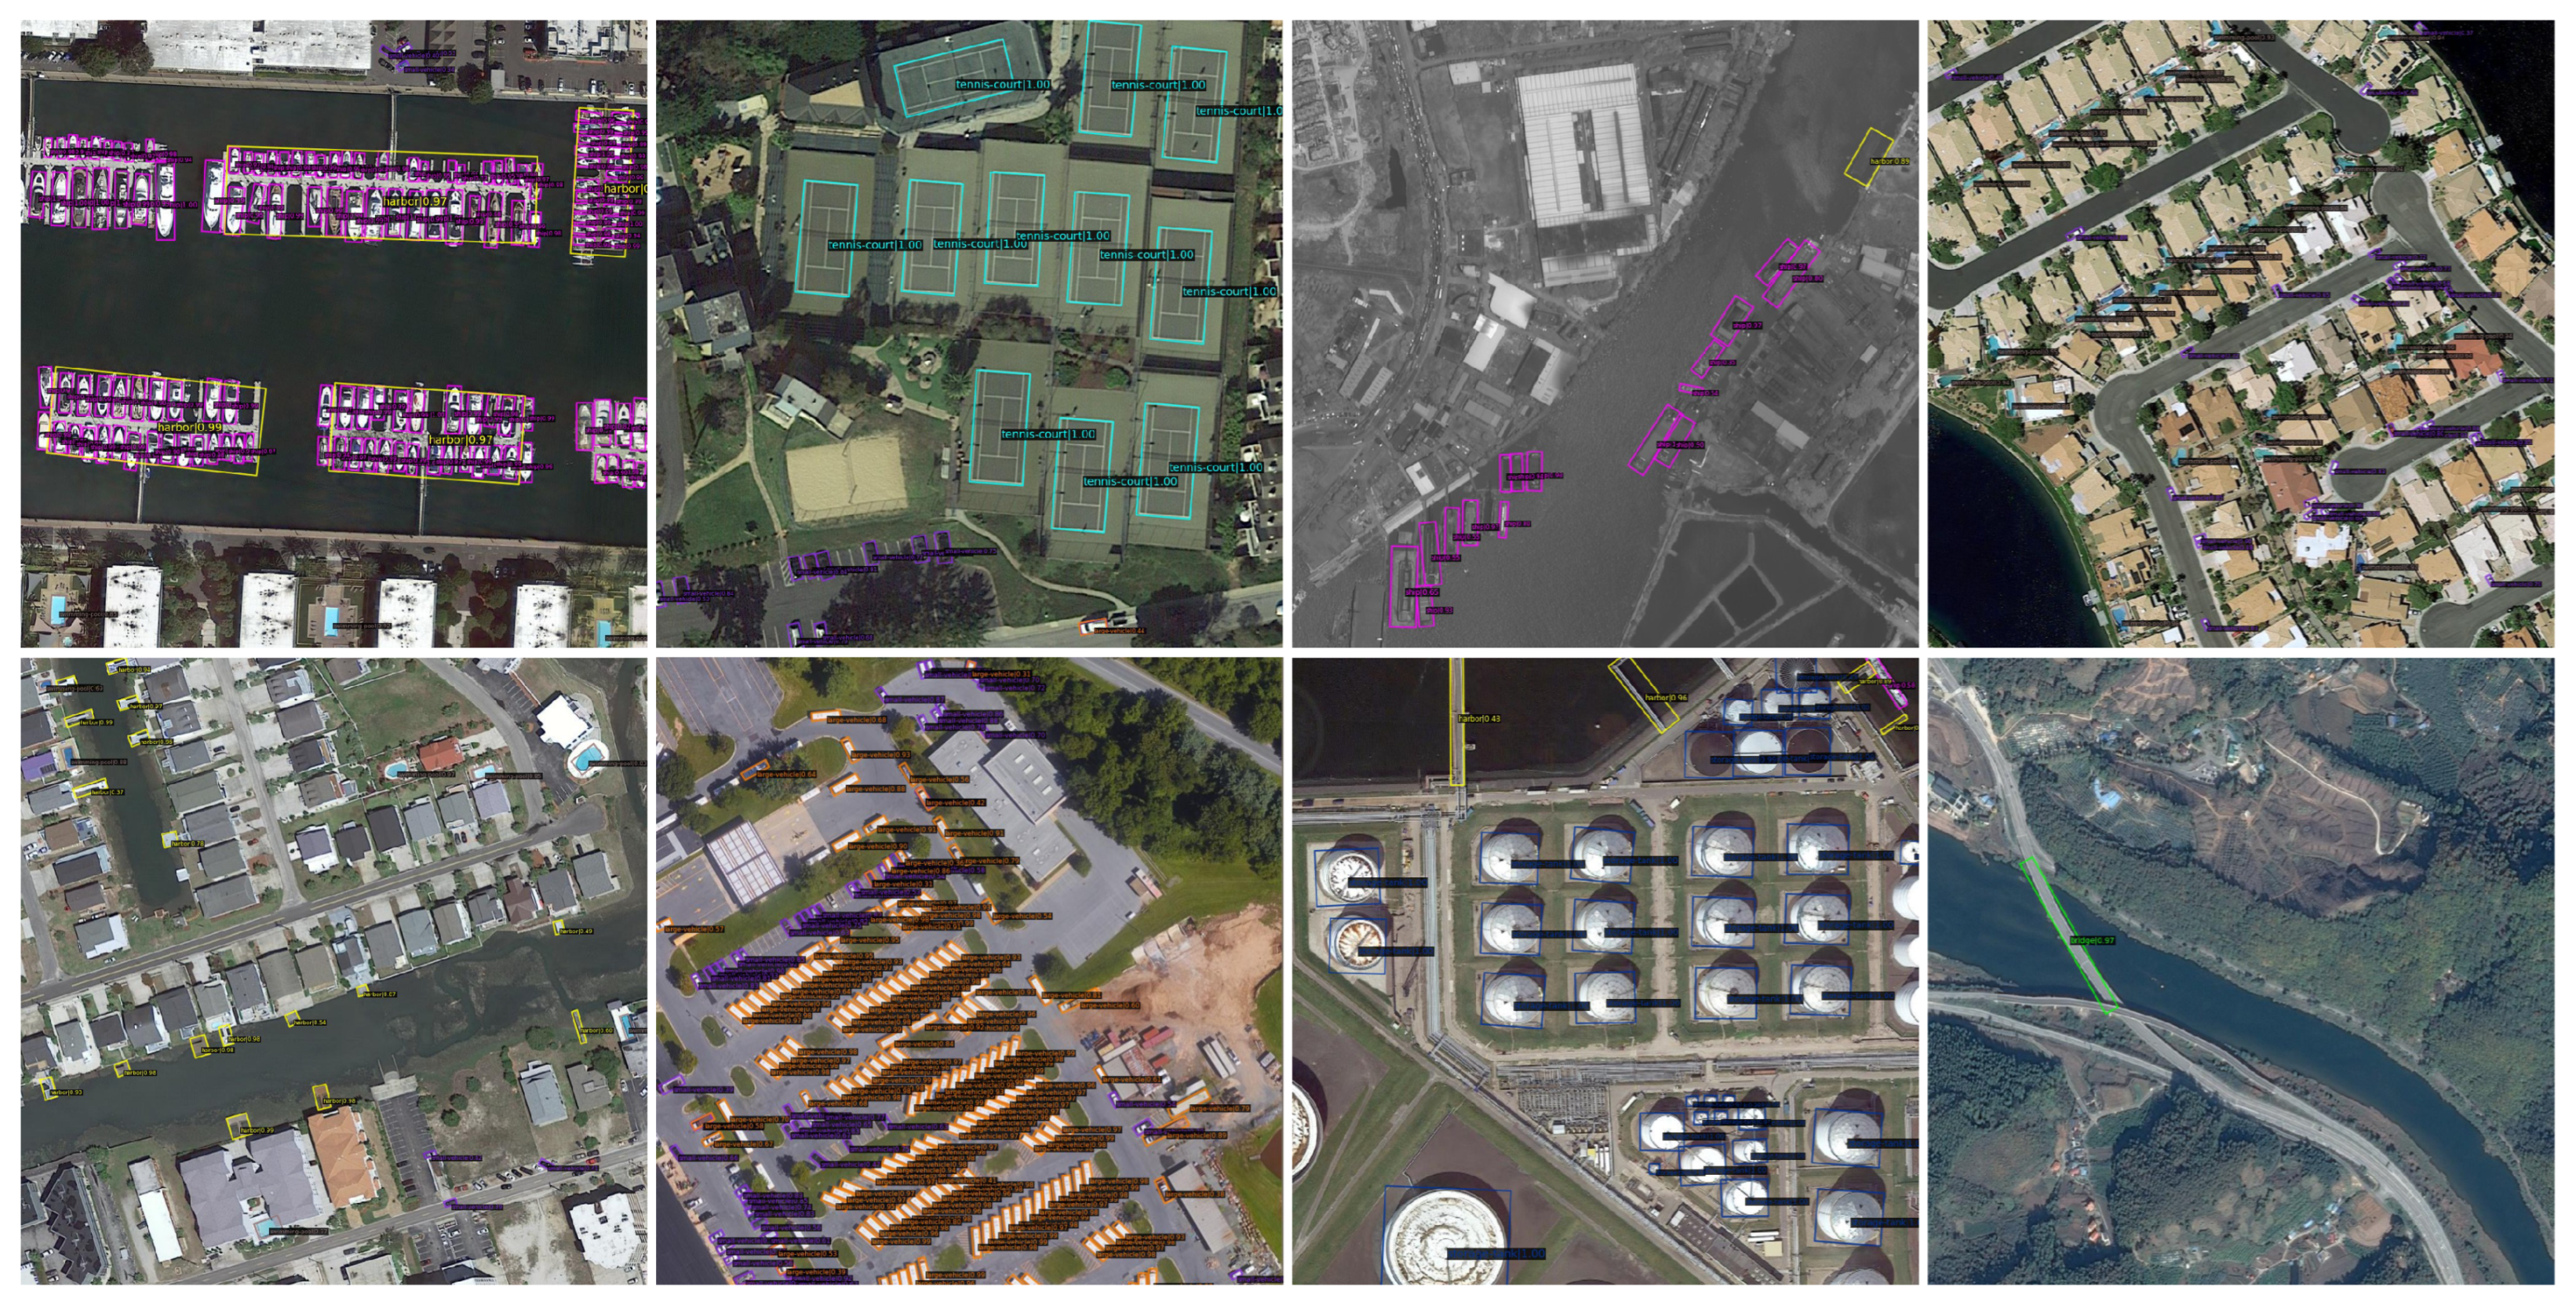
Figure 12 also shows some tough detection scenarios in AOOD (dense, small, large aspect ratio, chaotic, and orientation random). It can be seen that AFRE-Net is able to better cope with the above challenges. Compared with other state-of-the-art AOOD detectors shown in Table 1, our model outperforms the best R 4 Det [61] by an mAP of 1.6%, and achieves mAP improvement of 9.01% over the baseline detector. Compared with the anchor-free reppoints, our AFRE-Net achieves better performance on most categories.
Surprisingly, the accuracy improvement ability of AFRE-Net on specific objects is impressive. For SP, HA, RA, SBF, and ST, AFRE-Net achieves improvements of 3.39%, 13.95%, 6.73%, 11.2%, and 12.76%, respectively over the baseline. This suggests that our proposed method has a more significant and prominent effect on improving the feature expression of targets with large aspect ratio scales. The first reason is that the target with a large aspect ratio is more likely to contain more area of background information within the rectangular box of its outer contour, increasing the likelihood of interference; Secondly, the original regular feature sampling mode makes it impossible to accurately collect all the spatial scale features of the target when representing the target with a large-scale aspect ratio. AFREM achieves finer feature extractions by accurately changing the sampling points. Lastly, it can be seen that AFRE-Net has a good accuracy improvement effect on small targets, because the application of FG-FPN improves the ability of the detector to capture features in a small space range.

4.4.2. Results on HRSC2016

We evaluate the performance of our AFRE-Net on HRSC2016 with existing state-of-the-art AOOD detectors, which are divided into two categories, i.e., two-stage methods, such as R 2 CNN [36], RRPN [55], R 2 PN [65], RoI Trans. [57], and Gliding Vertex [66], and single-stage methods, such as DCL [9], DAL [31], DRN [59], and S2A-Net [14]. As shown in Table 2, our AFRE-Net outperforms all the detectors, especially towards two-stage methods, by a large gap up to 4.16%. Our AFRE-Net obtains an mAP of 92.36% under the condition that only ResNet50 is used, meaning that our model can achieve better feature extraction and detection results with fewer parameters of backbones. Compared with the baseline model, we improve 6.04% mAP with only one preset anchor in the FEM and RDM. In addition, Table 2 also shows the performance of our method in terms of model complexity and efficiency. The FG-FPN and AFREM has greatly improved the complexity of the model and increased the inference time of the detector, but extensive experiments have proved that our method is powerful in improving the detection performance. We have achieved 15.8FPS inference speed on a single RTX3090, proving that the model has maintained certain efficacy while improving its performance.

4.4.3. Results on UCAS-AOD

The distribution of vehicle targets in UCAS-AOD is relatively dense, and the spatial size is small, making detection difficult. As shown in Table 7, our baseline detector only achieved an accuracy performance of 83.22% on car detection. However, after AFRE-Net is applied, the mAP is improved to 90.62%, and the overall mAP is promoted to 91.34%, which surpasses all other comparison methods.

4.4.4. Results on ICDAR2015

To assess the robustness and generalization capability of our proposed AFRE-Net algorithm across various application scenarios, as well as to tackle annotation boxes with larger aspect ratio scales, we conducted training and testing on the ICDAR2015 dataset.
ICDAR2015 comprises challenging targets with significant variations in length and width, annotated in the oriented bounding box (OBB) format. As depicted in Table 8, our baseline model achieved an F-measure of 80.72 and a recall of 80.23%. Compared with other text detectors, such as EAST [67], R 2 CNN [36], and R 3 Det [37], AFRE-Net obtains the best recall performance at 88.82% and the best F-measure score at 86.27%, proving that our proposed solution has good migration application capabilities.

5. Conclusions

In this paper, we make several significant contributions to arbitrary-oriented object detection (AOOD). First, we identify the shortcomings and possible problems of the existing AOOD detectors in the structure design of feature extraction. Specifically, we point out that the existing models cannot automate DN learning and adjust ERF, and cannot adapt learning focus areas and suppress background information. To address these limitations, we conceive our detector AFRE-Net by designing a finer-grained feature fusion neck, and proposing ERF transformation and relative conv on this basis. These modifications enable the detector to acquire new capabilities for expressing object features. We validate the effectiveness of our algorithm on several remote sensing datasets and application scenarios. Extensive experimental results show that our method is effective and has a positive impact on the future design of feature representation enhancement strategies.

Author Contributions

Conceptualization, T.Z.; methodology, T.Z.; software, T.Z.; validation, T.Z.; formal analysis, T.Z.; investigation, T.Z.; resources, T.Z., X.S. and K.Z.; data curation, T.Z.; writing—original draft preparation, T.Z.; writing—review and editing, L.Z. and X.D.; visualization, T.Z.; supervision, J.S.; project administration, B.Z.; funding acquisition, B.Z. All authors have read and agreed to the published version of the manuscript.

Funding

This work was supported by the National Key R&D Program of China (Grant No. 2021YFB3900502).

Data Availability Statement

For all source data and code, please contact us: [email protected].

Acknowledgments

We sincerely appreciate the constructive comments and suggestions of the anonymous reviewers, which have greatly helped to improve this paper.

Conflicts of Interest

The authors declare no conflict of interest.

References

  1. He, K.; Gkioxari, G.; Dollár, P.; Girshick, R. Mask r-cnn. In Proceedings of the IEEE International Conference on Computer Vision, Venice, Italy, 22–29 October 2017; pp. 2961–2969. [Google Scholar]
  2. Chen, Y.; Zhu, L.; Ghamisi, P.; Jia, X.; Li, G.; Tang, L. Hyperspectral images classification with Gabor filtering and convolutional neural network. IEEE Geosci. Remote Sens. Lett. 2017, 14, 2355–2359. [Google Scholar] [CrossRef]
  3. Chen, Y.; Jiang, H.; Li, C.; Jia, X.; Ghamisi, P. Deep feature extraction and classification of hyperspectral images based on convolutional neural networks. IEEE Trans. Geosci. Remote Sens. 2016, 54, 6232–6251. [Google Scholar] [CrossRef]
  4. Ma, T.Y.; Li, H.C.; Wang, R.; Du, Q.; Jia, X.; Plaza, A. Lightweight Tensorized Neural Networks for Hyperspectral Image Classification. IEEE Trans. Geosci. Remote Sens. 2022, 60, 5544816. [Google Scholar] [CrossRef]
  5. Bai, L.; Liu, Q.; Li, C.; Ye, Z.; Hui, M.; Jia, X. Remote sensing image scene classification using multiscale feature fusion covariance network with octave convolution. IEEE Trans. Geosci. Remote Sens. 2022, 60, 5620214. [Google Scholar] [CrossRef]
  6. Cheng, G.; Zhou, P.; Han, J. Learning rotation-invariant convolutional neural networks for object detection in VHR optical remote sensing images. IEEE Trans. Geosci. Remote Sens. 2016, 54, 7405–7415. [Google Scholar] [CrossRef]
  7. Jaderberg, M.; Simonyan, K.; Zisserman, A. Spatial transformer networks. In Proceedings of the Advances in Neural Information Processing Systems, Montreal, QC, Canada, 7–12 December 2015; Volume 28. [Google Scholar]
  8. Han, J.; Ding, J.; Xue, N.; Xia, G.S. Redet: A rotation-equivariant detector for aerial object detection. In Proceedings of the IEEE/CVF Conference on Computer Vision and Pattern Recognition, Nashville, TN, USA, 20–25 June 2021; pp. 2786–2795. [Google Scholar]
  9. Yang, X.; Hou, L.; Zhou, Y.; Wang, W.; Yan, J. Dense Label Encoding for Boundary Discontinuity Free Rotation Detection. arXiv 2021, arXiv:2011.09670. [Google Scholar]
  10. Yang, X.; Yan, J. Arbitrary-oriented object detection with circular smooth label. In Proceedings of the European Conference on Computer Vision, Glasgow, UK, 23–28 August 2020; Springer: Berlin/Heidelberg, Germany, 2020; pp. 677–694. [Google Scholar]
  11. Qian, W.; Yang, X.; Peng, S.; Guo, Y.; Yan, J. Learning modulated loss for rotated object detection. arXiv 2019, arXiv:1911.08299. [Google Scholar] [CrossRef]
  12. Zhou, L.; Wei, H.; Li, H.; Zhao, W.; Zhang, Y.; Zhang, Y. Arbitrary-oriented object detection in remote sensing images based on polar coordinates. IEEE Access 2020, 8, 223373–223384. [Google Scholar] [CrossRef]
  13. Luo, W.; Li, Y.; Urtasun, R.; Zemel, R. Understanding the effective receptive field in deep convolutional neural networks. In Proceedings of the Advances in Neural Information Processing Systems, Barcelona, Spain, 5–10 December 2016; Volume 29. [Google Scholar]
  14. Han, J.; Ding, J.; Li, J.; Xia, G.S. Align Deep Features for Oriented Object Detection. arXiv 2020, arXiv:2008.09397. [Google Scholar] [CrossRef]
  15. Wang, J.; Chen, K.; Yang, S.; Loy, C.C.; Lin, D. Region proposal by guided anchoring. In Proceedings of the IEEE/CVF Conference on Computer Cision and Pattern Recognition, Long Beach, CA, USA, 16–17 June 2019; pp. 2965–2974. [Google Scholar]
  16. Lin, T.Y.; Goyal, P.; Girshick, R.; He, K.; Dollár, P. Focal loss for dense object detection. In Proceedings of the IEEE International Conference on Computer Vision, Venice, Italy, 22–29 October 2017; pp. 2980–2988. [Google Scholar]
  17. Lin, T.Y.; Dollár, P.; Girshick, R.; He, K.; Hariharan, B.; Belongie, S. Feature pyramid networks for object detection. In Proceedings of the IEEE Conference on Computer Vision and Pattern Recognition, Honolulu, HI, USA, 21–26 July 2017; pp. 2117–2125. [Google Scholar]
  18. Wang, K.; Liew, J.H.; Zou, Y.; Zhou, D.; Feng, J. Panet: Few-shot image semantic segmentation with prototype alignment. In Proceedings of the IEEE/CVF International Conference on Computer Vision, Seoul, Republic of Korea, 27 October–2 November 2019; pp. 9197–9206. [Google Scholar]
  19. Ghiasi, G.; Lin, T.Y.; Le, Q.V. Nas-fpn: Learning scalable feature pyramid architecture for object detection. In Proceedings of the IEEE/CVF Conference on Computer Cision and Pattern Recognition, Long Beach, CA, USA, 16–17 June 2019; pp. 7036–7045. [Google Scholar]
  20. Tan, M.; Pang, R.; Le, Q.V. Efficientdet: Scalable and efficient object detection. In Proceedings of the IEEE/CVF Conference on Computer Cision and Pattern Recognition, Seattle, WA, USA, 13–19 June 2020; pp. 10781–10790. [Google Scholar]
  21. Qiao, S.; Chen, L.C.; Yuille, A. Detectors: Detecting objects with recursive feature pyramid and switchable atrous convolution. In Proceedings of the IEEE/CVF Conference on Computer Cision and Pattern Recognition, Nashville, TN, USA, 20–25 June 2021; pp. 10213–10224. [Google Scholar]
  22. Dai, J.; Qi, H.; Xiong, Y.; Li, Y.; Zhang, G.; Hu, H.; Wei, Y. Deformable convolutional networks. In Proceedings of the IEEE International Conference on Computer Vision, Venice, Italy, 22–29 October 2017; pp. 764–773. [Google Scholar]
  23. Li, W.; Chen, Y.; Hu, K.; Zhu, J. Oriented reppoints for aerial object detection. In Proceedings of the IEEE/CVF Conference on Computer Vision and Pattern Recognition, New Orleans, LA, USA, 18–24 June 2022; pp. 1829–1838. [Google Scholar]
  24. Liu, W.; Anguelov, D.; Erhan, D.; Szegedy, C.; Reed, S.; Fu, C.Y.; Berg, A.C. Ssd: Single shot multibox detector. In Proceedings of the European Conference on Computer Vision, Amsterdam, The Netherlands, 11–14 October 2016; Springer: Berlin/Heidelberg, Germany, 2016; pp. 21–37. [Google Scholar]
  25. Zhang, X.; Wan, F.; Liu, C.; Ji, R.; Ye, Q. Freeanchor: Learning to match anchors for visual object detection. In Proceedings of the Advances in Neural Information Processing Systems, Vancouver, BC, Canada, 8–14 December 2019; pp. 147–155. [Google Scholar]
  26. Redmon, J.; Divvala, S.; Girshick, R.; Farhadi, A. You only look once: Unified, real-time object detection. In Proceedings of the IEEE Conference on Computer Vision and Pattern Recognition, Las Vegas, NV, USA, 27–30 June 2016; pp. 779–788. [Google Scholar]
  27. Redmon, J.; Farhadi, A. YOLO9000: Better, faster, stronger. In Proceedings of the IEEE Conference on Computer Vision and Pattern Recognition, Honolulu, HI, USA, 21–26 July 2017; pp. 7263–7271. [Google Scholar]
  28. Girshick, R. Fast r-cnn. In Proceedings of the IEEE International Conference on Computer Vision, Santiago, Chile, 7–13 December 2015; pp. 1440–1448. [Google Scholar]
  29. Ren, S.; He, K.; Girshick, R.; Sun, J. Faster r-cnn: Towards real-time object detection with region proposal networks. In Proceedings of the Advances in Neural Information Processing Systems, Montreal, QC, Canada, 7–12 December 2015; pp. 91–99. [Google Scholar]
  30. Zhang, S.; Chi, C.; Yao, Y.; Lei, Z.; Li, S.Z. Bridging the gap between anchor-based and anchor-free detection via adaptive training sample selection. In Proceedings of the IEEE/CVF Conference on Computer Vision and Pattern Recognition, Seattle, WA, USA, 13–19 June 2020; pp. 9759–9768. [Google Scholar]
  31. Ming, Q.; Zhou, Z.; Miao, L.; Zhang, H.; Li, L. Dynamic anchor learning for arbitrary-oriented object detection. arXiv 2020, arXiv:2012.04150. [Google Scholar] [CrossRef]
  32. Zhang, T.W.; Dong, X.Y.; Sun, X.; Gao, L.R.; Qu, Y.; Zhang, B.; Zheng, K. Performance releaser with smart anchor learning for arbitrary-oriented object detection. Caai Trans. Intell. Technol. 2022. [Google Scholar] [CrossRef]
  33. Yang, X.; Yan, J.; Ming, Q.; Wang, W.; Zhang, X.; Tian, Q. Rethinking rotated object detection with gaussian wasserstein distance loss. In Proceedings of the International Conference on Machine Learning, PMLR, Virtual, 18–24 July 2021; pp. 11830–11841. [Google Scholar]
  34. Liu, J.; Zheng, H. EFN: Field-Based Object Detection for Aerial Images. Remote Sens. 2020, 12, 3630. [Google Scholar] [CrossRef]
  35. Wei, H.; Zhou, L.; Zhang, Y.; Li, H.; Guo, R.; Wang, H. Oriented objects as pairs of middle lines. arXiv 2019, arXiv:1912.10694. [Google Scholar] [CrossRef]
  36. Jiang, Y.; Zhu, X.; Wang, X.; Yang, S.; Li, W.; Wang, H.; Fu, P.; Luo, Z. R2cnn: Rotational region cnn for orientation robust scene text detection. arXiv 2017, arXiv:1706.09579. [Google Scholar]
  37. Yang, X.; Liu, Q.; Yan, J.; Li, A.; Zhang, Z.; Yu, G. R3det: Refined single-stage detector with feature refinement for rotating object. arXiv 2019, arXiv:1908.05612. [Google Scholar] [CrossRef]
  38. Ming, Q.; Miao, L.; Zhou, Z.; Dong, Y. Cfc-net: A critical feature capturing network for arbitrary-oriented object detection in remote sensing images. arXiv 2021, arXiv:2101.06849. [Google Scholar] [CrossRef]
  39. Yu, Y.; Yang, X.; Li, J.; Gao, X. A cascade rotated anchor-aided detector for ship detection in remote sensing images. IEEE Trans. Geosci. Remote Sens. 2020, 60, 5600514. [Google Scholar] [CrossRef]
  40. Zhang, T.; Sun, X.; Zhuang, L.; Dong, X.; Gao, L.; Zhang, B.; Zheng, K. FFN: Fountain Fusion Net for Arbitrary-Oriented Object Detection. IEEE Trans. Geosci. Remote Sens. 2023, 61, 5609913. [Google Scholar] [CrossRef]
  41. Cohen, T.; Welling, M. Group equivariant convolutional networks. In Proceedings of the International Conference on Machine Learning, PMLR, New York, NY, USA, 19–24 June 2016; pp. 2990–2999. [Google Scholar]
  42. Worrall, D.E.; Garbin, S.J.; Turmukhambetov, D.; Brostow, G.J. Harmonic networks: Deep translation and rotation equivariance. In Proceedings of the IEEE Conference on Computer Vision and Pattern Recognition, Honolulu, HI, USA, 21–26 July 2017; pp. 5028–5037. [Google Scholar]
  43. Weiler, M.; Hamprecht, F.A.; Storath, M. Learning steerable filters for rotation equivariant cnns. In Proceedings of the IEEE Conference on Computer Vision and Pattern Recognition, Salt Lake City, UT, USA, 18–22 June 2018; pp. 849–858. [Google Scholar]
  44. Weiler, M.; Cesa, G. General e (2)-equivariant steerable cnns. In Proceedings of the Advances in Neural Information Processing Systems, Vancouver, BC, Canada, 8–14 December 2019; Volume 32. [Google Scholar]
  45. Marcos, D.; Volpi, M.; Komodakis, N.; Tuia, D. Rotation equivariant vector field networks. In Proceedings of the IEEE International Conference on Computer Vision, Venice, Italy, 22–29 October 2017; pp. 5048–5057. [Google Scholar]
  46. Zhou, Y.; Ye, Q.; Qiu, Q.; Jiao, J. Oriented response networks. In Proceedings of the IEEE Conference on Computer Vision and Pattern Recognition, Honolulu, HI, USA, 21–26 July 2017; pp. 519–528. [Google Scholar]
  47. Yang, Z.; Liu, S.; Hu, H.; Wang, L.; Lin, S. Reppoints: Point set representation for object detection. In Proceedings of the IEEE/CVF International Conference on Computer Vision, Seoul, Republic of Korea, 27 October–2 November 2019; pp. 9657–9666. [Google Scholar]
  48. He, K.; Zhang, X.; Ren, S.; Sun, J. Deep residual learning for image recognition. In Proceedings of the IEEE Conference on Computer Vision and Pattern Recognition, Las Vegas, NA, USA, 27–30 June 2016; pp. 770–778. [Google Scholar]
  49. Xia, G.S.; Bai, X.; Ding, J.; Zhu, Z.; Belongie, S.; Luo, J.; Datcu, M.; Pelillo, M.; Zhang, L. DOTA: A large-scale dataset for object detection in aerial images. In Proceedings of the IEEE Conference on Computer Vision and Pattern Recognition, Salt Lake City, UT, USA, 18–22 June 2018; pp. 3974–3983. [Google Scholar]
  50. Liu, Z.; Yuan, L.; Weng, L.; Yang, Y. A high resolution optical satellite image dataset for ship recognition and some new baselines. In Proceedings of the 6th International Conference on Pattern Recognition Applications and Methods (ICPRAM 2017), Porto, Portugal, 24–26 February 2017. [Google Scholar]
  51. Zhu, H.; Chen, X.; Dai, W.; Fu, K.; Ye, Q.; Jiao, J. Orientation robust object detection in aerial images using deep convolutional neural network. In Proceedings of the 2015 IEEE International Conference on Image Processing (ICIP), Quebec City, QC, Canada, 27–30 September 2015; IEEE: New York, NY, USA, 2015; pp. 3735–3739. [Google Scholar]
  52. Karatzas, D.; Gomez-Bigorda, L.; Nicolaou, A.; Ghosh, S.; Bagdanov, A.; Iwamura, M.; Matas, J.; Neumann, L.; Chandrasekhar, V.R.; Lu, S.; et al. ICDAR 2015 competition on robust reading. In Proceedings of the 2015 13th International Conference on Document Analysis and Recognition (ICDAR), Nancy, France, 23–26 August 2015; IEEE: New York, NY, USA, 2015; pp. 1156–1160. [Google Scholar]
  53. Everingham, M.; Van Gool, L.; Williams, C.K.; Winn, J.; Zisserman, A. The pascal visual object classes (voc) challenge. Int. J. Comput. Vis. 2010, 88, 303–338. [Google Scholar] [CrossRef]
  54. Yang, X.; Sun, H.; Fu, K.; Yang, J.; Sun, X.; Yan, M.; Guo, Z. Automatic ship detection in remote sensing images from google earth of complex scenes based on multiscale rotation dense feature pyramid networks. Remote Sens. 2018, 10, 132. [Google Scholar] [CrossRef]
  55. Ma, J.; Shao, W.; Ye, H.; Wang, L.; Wang, H.; Zheng, Y.; Xue, X. Arbitrary-oriented scene text detection via rotation proposals. IEEE Trans. Multimed. 2018, 20, 3111–3122. [Google Scholar] [CrossRef]
  56. Azimi, S.M.; Vig, E.; Bahmanyar, R.; Körner, M.; Reinartz, P. Towards multi-class object detection in unconstrained remote sensing imagery. In Proceedings of the Asian Conference on Computer Vision, Perth, Australia, 2–6 December 2018; Springer: Berlin/Heidelberg, Germany, 2018; pp. 150–165. [Google Scholar]
  57. Ding, J.; Xue, N.; Long, Y.; Xia, G.S.; Lu, Q. Learning RoI transformer for oriented object detection in aerial images. In Proceedings of the IEEE Conference on Computer Vision and Pattern Recognition, Long Beach, CA, USA, 15–20 June 2019; pp. 2849–2858. [Google Scholar]
  58. Zhang, G.; Lu, S.; Zhang, W. Cad-net: A context-aware detection network for objects in remote sensing imagery. IEEE Trans. Geosci. Remote Sens. 2019, 57, 10015–10024. [Google Scholar] [CrossRef]
  59. Pan, X.; Ren, Y.; Sheng, K.; Dong, W.; Yuan, H.; Guo, X.; Ma, C.; Xu, C. Dynamic Refinement Network for Oriented and Densely Packed Object Detection. In Proceedings of the IEEE/CVF Conference on Computer Vision and Pattern Recognition, Seattle, WA, USA, 13–19 June 2020; pp. 11207–11216. [Google Scholar]
  60. Yang, X.; Yang, J.; Yan, J.; Zhang, Y.; Zhang, T.; Guo, Z.; Sun, X.; Fu, K. Scrdet: Towards more robust detection for small, cluttered and rotated objects. In Proceedings of the IEEE International Conference on Computer Vision, Seoul, Republic of Korea, 27 October–2 November 2019; pp. 8232–8241. [Google Scholar]
  61. Sun, P.; Zheng, Y.; Zhou, Z.; Xu, W.; Ren, Q. R4 Det: Refined single-stage detector with feature recursion and refinement for rotating object detection in aerial images. Image Vis. Comput. 2020, 103, 104036. [Google Scholar] [CrossRef]
  62. Liao, M.; Zhu, Z.; Shi, B.; Xia, G.s.; Bai, X. Rotation-sensitive regression for oriented scene text detection. In Proceedings of the IEEE Conference on Computer Vision and Pattern Recognition, Salt Lake City, UT, USA, 18–22 June 2018; pp. 5909–5918. [Google Scholar]
  63. Cheng, G.; Wang, J.; Li, K.; Xie, X.; Lang, C.; Yao, Y.; Han, J. Anchor-free oriented proposal generator for object detection. IEEE Trans. Geosci. Remote Sens. 2022, 60, 5625411. [Google Scholar] [CrossRef]
  64. Xie, X.; Cheng, G.; Wang, J.; Yao, X.; Han, J. Oriented R-CNN for object detection. In Proceedings of the IEEE/CVF International Conference on Computer Vision, Montreal, BC, Canada, 11–17 October 2021; pp. 3520–3529. [Google Scholar]
  65. Zhang, Z.; Guo, W.; Zhu, S.; Yu, W. Toward arbitrary-oriented ship detection with rotated region proposal and discrimination networks. IEEE Geosci. Remote Sens. Lett. 2018, 15, 1745–1749. [Google Scholar] [CrossRef]
  66. Xu, Y.; Fu, M.; Wang, Q.; Wang, Y.; Chen, K.; Xia, G.S.; Bai, X. Gliding vertex on the horizontal bounding box for multi-oriented object detection. IEEE Trans. Pattern Anal. Mach. Intell. 2020. [Google Scholar] [CrossRef]
  67. Zhou, X.; Yao, C.; Wen, H.; Wang, Y.; Zhou, S.; He, W.; Liang, J. East: An efficient and accurate scene text detector. In Proceedings of the IEEE conference on Computer Vision and Pattern Recognition, Honolulu, HI, USA, 21–26 July 2017; pp. 5551–5560. [Google Scholar]
Figure 1. Illustration of the relationship between DN and GT and ERF. A part of the input image is captured inside the detector (RetinaNet-R [16]). The HBB and the OBB are the predicted box. The red box is virtual and represents only one pixel in detection layers. The ERF is calculated according to [13]. It should be noted that this is only a local scene captured from a large remote sensing image input. (a) Detection Layer 0; (b) Detection Layer 2.
Remotesensing 15 04965 g001
Figure 2. Example of wrong detection caused by background interference. In this case, RetinaNet-R is used. The prediction confidence threshold is 0.3. The container at the port is mistaken as a freighter because they have similar features.
Remotesensing 15 04965 g002
Figure 3. The overall architecture of the AFRE-Net. AFRENet is composed of a backbone, a fine-grained feature pyramid network, a feature enhancement module, and a rotation detection module. AFPEM denotes adaptive feature representation enhancement module. PB and CM denote the predicted box and classification map, respectively.
Remotesensing 15 04965 g003
Figure 4. FPN structure of the RetinaNet. Conv2D 1 × 1, s1 refers to 1 × 1 convolution with stride set to 1. N denotes input image size. N/4 denotes the feature map resolution. ⊕ means addition.
Remotesensing 15 04965 g004
Figure 5. Structure of FG-FPN. Conv2D 1 × 1, s1 refers to 1 × 1 convolution with stride set to 1. N denotes input image size. N/4 denotes the feature map resolution. ⊕ means addition. ALAM refers to arhat layer attention module.
Remotesensing 15 04965 g005
Figure 6. Feature heatmap visualization of P3 in BiFPN [20] and D3 in FG-FPN. This experiment scenario is selected from baseline and AFRE-Net after 10K iterations of training on the DOTA dataset, respectively. It can be seen that FG-FPN has a stronger response to the targets’ proposals, and can better distinguish the foreground and background. (a) Feature heatmap from BiFPN; (b) Feature heatmap from FG-FPN.
Remotesensing 15 04965 g006
Figure 7. Pipeline of AFREM.
Remotesensing 15 04965 g007
Figure 8. Illustration of ERF transformation. (a) Explanation diagram of the relationship between PB, sampling point, and ERF; (b) Identify sampling points through shrunk PB.
Remotesensing 15 04965 g008
Figure 9. Illustration of Relative ConV.
Remotesensing 15 04965 g009
Figure 10. Detection comparison between baseline detector and our AFRE-Net. AFRE-Net tends to obtain higher confidence score and more accurate predictions. (a) Wrong Detection by baseline; (b) Correct Detection by AFRE-Net.
Remotesensing 15 04965 g010
Figure 11. Detection comparison between baseline detector and our AFRE-Net. AFRE-Net is more capable of generating small predictions. (a) Missed Detection by baseline; (b) Finer detection by AFRE-Net.
Remotesensing 15 04965 g011
Figure 12. Visualization of some detection results on DOTA.
Remotesensing 15 04965 g012
Table 1. Comparison on DOTA test dataset. R-101 represents ResNet-101 (likewise for R-50), and H-104 denotes Hourglass-104.
MethodsBackbonePLBDBRGTFSVLVSHTCBCSTSBFRAHASPHCmAP
FR-O [49]R-10179.0969.1217.1763.4934.2037.1636.2089.1969.6058.9649.4052.5246.6944.8046.3052.93
R-DFPN [54]R-10180.9265.8233.7758.9455.7750.9454.7890.3366.3468.6648.7351.7655.1051.3235.8857.94
R 2 CNN [36]R-10180.9465.6735.3467.4459.9250.9155.8190.6766.9272.3955.0652.2355.1453.3548.2260.67
RRPN [55]R-10188.5271.2031.6659.3051.8556.1957.2590.8172.8467.3856.6952.8453.0851.9453.5861.01
ICN [56]R-10181.3674.3047.7070.3264.8967.8269.9890.7679.0678.2053.6462.9067.0264.1750.2368.16
RetinaNet-O [16]R-5088.6777.6241.8158.1774.5871.6479.1190.2982.1374.3254.7560.6062.5769.6760.6468.43
RoI Trans. [57]R-10188.6478.5243.4475.9268.8173.6883.5990.7477.2781.4658.3953.5462.8358.9347.6769.56
CAD-Net [58]R-10187.8082.4049.4073.5071.1063.5076.7090.9079.2073.3048.4060.9062.0067.0062.2069.90
DRN [59]H-10488.9180.2243.5263.3573.4870.6984.9490.1483.8584.1150.1258.4167.6268.6052.5070.70
O 2 - DNet [35]H-10489.3182.1447.3361.2171.3274.0378.6290.7682.2381.3660.9360.1758.2166.9861.0371.04
DAL [31]R-10188.6179.6946.2770.3765.8976.1078.5390.8479.9878.4158.7162.0269.2371.3260.6571.78
SCRDet [60]R-10189.9880.6552.0968.3668.3660.3272.4190.8587.9486.8665.0266.6866.2568.2465.2172.61
R 3 Det [37]R-15289.4981.1750.5366.1070.9278.6678.2190.8185.2684.2361.8163.7768.1669.8367.1773.74
S 2 A - Net  [14]R-5089.1182.8448.3771.1178.1178.3987.2590.8384.9085.6460.3662.6065.2669.1357.9474.12
R 4 Det [61]R-15288.9685.4252.9173.8474.8681.5280.2990.7986.9585.2564.0560.9369.0070.5567.7675.84
Oriented Reppoints [23]R-10189.5384.0759.8671.7679.9580.0387.3390.8487.5485.2359.1566.3775.2373.7557.2376.52
AFRE-Net (ours)R-10189.3485.7453.2375.9679.2281.0387.8890.8683.8287.0865.9567.3376.5273.0664.5277.44
1 Best results for each category are in red. Second-best results achieved by our detector are labeled in blue.
Table 2. Performance comparisons with state-of-the-art AOOD methods on the test set of HRSC2016. NA denotes the number of preset anchors of RDM. mAP (07/12): VOC2007/VOC2012 metrics.
MethodsBackboneSizeNAmAP (07)mAP (12)Params (M)FLOPS
R 2 CNN  [36]ResNet101800 × 8002173.07---
* RRD [62]VGG16384 × 3841384.30-27.6176 G
RoI Trans. [57]ResNet101512 × 8002086.20-55.1200 G
R 3 Det  [37]ResNet101800 × 8002189.2696.0141.9336 G
* R-RetinaNet [16]ResNet101800 × 80012189.18-35.8236 G
* DCL [9]ResNet101800 × 800-89.46-49.6472 G
GWD [33]ResNet101800 × 800-89.8597.3747.4456 G
DAL [31]ResNet101800 × 800389.77-36.4216 G
DRN [59]ResNet101768 × 768-92.7---
S2A-Net [14]ResNet50512 × 800190.1795.0138.6198 G
AOPG [63]ResNet101800 × 800-90.3496.22--
ReDet [8]-800 × 800-90.4697.6331.6-
O-RCNN [64]ResNet101800 × 800-90.5097.6041.1199 G
* BaselineResNet50800 × 800386.3291.0431.5199 G
AFRE-Net (ours)ResNet50800 × 8001 92 . 36 97.3242.2323 G
AFRE-Net (ours)ResNet101800 × 800192.18 97 . 82 51.4469 G
1 The instances of best detection performance are in bold. 2 * means that the precision and model complexity data source is from our local machine.
Table 3. Influence of hyperparameters η on HRSC2016 dataset.
η 0.45 0.35 0.25 0.20 0.15 0.10 NaN
AP 50 87.2689.3391.08 92 . 16 88.5489.34NaN
η 0.450.350.250.200.150.100.00
AP 50 79.3281.2682.7779.9882.3286.0288.06
1 The instances of best detection performance are in bold. 2 Both FG-FPN and DAL are used.
Table 4. Ablation study of embeddings in AFRE-Net on DOTA and HRSC2016 dataset.
BaselineComponent SettingsAFRE-Net
FPN [17]
FG-FPN (ours)
FEM (ours)
DAL [31]
mAP D O T A +0+1.01+6.92+4.81+1.54+9.01
mAP H R S C 2016 +0+0.92+5.12+3.79+1.26+6.04
1 η is set to −2.
Table 5. Module complexity on different datasets.
DatasetsModulesParams (M)FLOPSRuntimes (s)mAP (%)
DOTAB+FPN27.6168 G0.4271.27
HRSC2016B+FPN27.6168 G0.3685.24
UCAS-AODB+FPN27.6168 G0.3584.72
DOTAB+FG-FPN34.1 (+6.5)321 G0.7972.28 (+1.01)
HRSC2016B+FG-FPN34.1 (+6.5)321 G0.6886.16 (0.92)
UCAS-AODB+FG-FPN34.1 (+6.5)321 G0.6886.88 (+2.16)
1 Runtimes refer to inference time, and B denotes backbone network. 2 AFREM was not used in this set of experiments.
Table 6. Effects of FEM structure on DOTA an HRSC2016.
FEM SettingsAFRE-Net
ERF transformation
AlignConV [14]
Relative ConV
mAP D O T A +3.77+5.65+2.89+9.01
mAP H R S C 2016 +2.85+4.26+4.33+6.04
1 FG-FPN and DAL are both used in this experiments set.
Table 7. Results comparison with advanced detectors on UCAS-AOD dataset.
MethodsCarAirplanemAP
Baseline0.83220.86430.8472
* YOLOv3-O [26]0.74630.89520.8208
Faster R-CNN-O [49]0.86870.89860.8836
* DAL [31]0.89250.90490.8987
* O-RCNN [64]0.88740.91230.9003
* Oriented Reppoints [23]0.89510.90700.9011
* ReDet [8]0.90340.91070.9079
AFRE-Net (ours) 0 . 9062 0 . 9143 0 . 9134
1 The instances of best detection performance are in bold. 2 * means that the precision and model complexity data source is from our local machine.
Table 8. Results comparison with text detector on ICDAR 2015.
MethodsRecallPrecisionF-Measure
RRPN [55]82.1773.2377.44
EAST [67]78.3383.2780.72
R 2 CNN [36]79.6885.6282.54
R 3 Det [37]81.6484.9783.27
Baseline80.2382.0680.72
AFRE-Net (ours)88.8285.8286.27
1 Best results for each category are in red. Second-best results achieved by our detector are labeled in blue.
Disclaimer/Publisher’s Note: The statements, opinions and data contained in all publications are solely those of the individual author(s) and contributor(s) and not of MDPI and/or the editor(s). MDPI and/or the editor(s) disclaim responsibility for any injury to people or property resulting from any ideas, methods, instructions or products referred to in the content.

