Article

Evaluating the Sensitivity of Polarimetric Features Related to Rotation Domain and Mapping Chinese Fir AGB Using Quad-Polarimetric SAR Images

1
Research Center of Forestry Remote Sensing & Information Engineering, Central South University of Forestry and Technology, Changsha 410004, China
2
Key Laboratory of Forestry Remote Sensing Based Big Data & Ecological Security for Hunan Province, Changsha 410004, China
3
Key Laboratory of State Forestry Administration on Forest Resources Management and Monitoring in Southern Area, Changsha 410004, China
*
Author to whom correspondence should be addressed.
Submission received: 14 January 2023 / Revised: 2 March 2023 / Accepted: 7 March 2023 / Published: 10 March 2023
(This article belongs to the Special Issue SAR for Forest Mapping II)

Abstract

:
Unaffected by cloud cover and solar illumination, synthetic aperture radar (SAR) images coupled with quad-polarimetric techniques have significant potential for mapping forest aboveground biomass (AGB) in the mountains of southern China. To improve the accuracy of mapping forest AGB, it is necessary to accurately interpret and evaluate the sensitivity of polarimetric features related to polarimetric response in complex forests. In this study, several rotated polarimetric features were extracted from L-band quad-polarimetric ALOS PALSAR-2 images based on uniform polarimetric matrix rotation theory. In addition, the sensitivity of rotated polarimetric features with forest parameters was evaluated by the Pearson correlation coefficient, sensitivity index (SI), and saturation levels. Ultimately, the forest AGB was mapped with various combinatorial feature sets by a proposed feature selection method based on the sensitivity index. The results illustrated that rotated polarimetric features extracted from the rotational domain have higher sensitivity with various forest parameters and higher saturation levels for mapping forests than other traditional features. After using the proposed feature selection method and combinatorial feature sets, the rRMSE of mapped forest AGB ranged from 22.5% to 33.9% for two acquired images, and the best result was obtained from the combination of three types of polarimetric features (BC + C4 + Ro). It is also confirmed that different types of features extracted from quad-polarimetric SAR images have better compensation effects and the accuracy of mapped forest AGB is significantly improved.

Graphical Abstract

1. Introduction

Normally, forest aboveground biomass (AGB) is widely used to evaluate the geographical and temporal variations and the potential carbon sink of forest ecosystems [1,2]. Thereby, quantitative mapping forest AGB is valuable for evaluating forest quality [3]. Traditional forest AGB surveying and mapping require a large amount of human and material resources. In recent years, remote sensing technology is becoming an important means of forest mapping and dynamic monitoring [4]. Unaffected by cloud cover and solar illumination, synthetic aperture radar (SAR) data coupled with quad-polarimetric techniques bear significant potential for mapping forest AGB and forest carbon stocks assessment in heterogeneous complex biophysical environments [5,6,7,8,9]. Due to higher penetration through the forest canopy and greater sensitivity to the forest components, it has been confirmed that L-band quad-polarimetric ALOS-2 SAR images are more suitable for mapping forest AGB in planted forests [10,11,12].
To precisely estimate forest AGB, alternative features are firstly required to extract from SAR images, and the accuracy of mapped forest AGB is directly determined by the sensitivity of features [13,14]. Commonly, there are three types of polarimetric features widely used for AGB estimation [15,16]. The first type is the backscattering coefficients of difference polarimetric modes directly extracted from the quad-polarimetric SAR images [17,18]. In addition, various radar vegetation indices and texture features with various sizes are also obtained based on intensity images of backscattering coefficients [19]. The second one is features derived from SAR interferometry (InSAR) or polarimetric SAR interferometry (PolInSAR), such as coherence with various polarizations [20,21]. However, it is difficult to obtain enough data to meet the requirements of InSAR or PolInSAR at present [22]. The last one is the features associated with target scattering processes extracted from the quad-polarimetric SAR images by various polarimetric decomposition theory [23,24,25,26,27,28,29]. For mapping forest AGB, these features extracted from polarimetric decomposition theory have shown more sensitivity than backscattering coefficients. However, the polarimetric response of a target is strongly dependent on its orientation. Thereby, the correct understanding and interpretation of PolSAR data in forests are hindered by scattering mechanism ambiguity caused by the target orientation diversity effect.
To further interpret the scattering mechanism related to forest canopy, roll-invariant polarimetric features are commonly applied to reduce the effect of the target orientation. Based on uniform polarimetric matrix rotation theory, several polarimetric features in the rotation domain have been proposed and applied to vegetation classification using L-band airborne SAR images [30]. This theory proposes the methods of rotational domain around the radar line of sight to complement the information of the rotation invariant feature of polarized SAR data, which can obtain the implicit information of the target in the rotational domain formed around the radar line of sight [31]. Though, these proposed features have been successfully applied to artificial target detection and crop classification, the capability of these features is unknown for mapping forest AGB using satellite-based quad SAR images [32,33]. Facing more complex geography, canopy shape, and vertical structure characteristics in forests, further investigation should be performed to interpret the meanings of features extracted from uniform polarimetric matrix rotation theory and further evaluate the sensitivity between these features and forest AGB.
Moreover, after extracting alternative features, how to obtain the optimal feature set is a key point to improving the accuracy of mapping forest AGB [4,34]. Limiting the capability and saturation problems of single-variable models, it is difficult to obtain reasonable and reliable forest AGB [10,35]. Recently, multi-variable models have become the mainstream of parameter estimation, and how to evaluate and select the optimal feature sets becomes a difficult task [36,37]. Normally, the widely accepted feature evaluating criteria are mainly based on the linear or nonlinear relationships between features and forest AGB, such as importance, maximal information coefficient (MIC), and Pearson correlation coefficient [38,39]. However, without considering the sensitivity and saturation levels of features, it is rather difficult to evaluate the capability of selected features for mapping forest AGB, especially for the forest plantation with a high growing stem volume (GSV) [40,41]. Moreover, a sensitivity index (SI) has been proposed to express the relationship between polarimetric characteristics and AGB, which considers the saturation and the correlation problems [42]. Therefore, it is meaningful that future studies should be performed to assess SI as a feature evaluation criterion in mapping forest AGB.
In this study, to interpret the response of features related to the forest in the rotation domain, several rotated features were extracted from L-band quad-polarimetric SAR images based on uniform polarimetric matrix rotation theory. Then, the sensitivity of rotated features with forest parameters was evaluated by Pearson correlation coefficient, sensitivity index (SI), and saturation levels. Subsequently, a proposed feature selection method based on SI was applied to obtain optimal feature sets from several types of alternative features. Finally, the forest AGBs with various feature combinations were inverted by these optimal feature sets and multiple linear regression models (MLR), and the capability of various features for mapping forest AGB was explored.

2. Study Area and Collected Data

2.1. Study Area

The study area focused on an area of the Huangfengqiao state-owned forestry (113°04′~113°43′E and 27°06′~27°4′N) located in You County, Zhuzhou City, Hunan Province, China (Figure 1). The elevation and slope of the study area range from 115 m to 1270 m and from 20° to 35°, respectively [43]. With a humid subtropical monsoon climate, the average annual temperature and precipitation are 17.8 °C and 1410.8 mm, respectively. With a total land area of 101,134.7 ha in the study area, the forest cover rate is near 90.57% and living wood growing stem volume is up to 879,186 m3. The predominant tree species present in the forest is Chinese fir (Figure 1).

2.2. Ground Data

Based on the stratified random sampling approach, 50 ground samples were set in planted Chinese fir forests in 2016 and 2017. The size of each sample was fixed to 30 m × 30 m and the positions of corners and central points were precisely measured by GPS. In each sample, the diameter at breast height (d) and tree height (h) with diameter tape and laser altimeter of each tree was measured. In our study, the mean diameter and average tree height ranged from 4.06 cm to 29.48 cm and ranged from 3.3 m to 20.5 m, respectively. Then, the total AGB of the tree was obtained using formulas as follows [36]:
W i = a × d 2 h b
W A G B = W S + W P + W B + W L
where  W i  is the biomass of each part of Chinese fir, a and b are coefficients,  W S  is the biomass of the trunk part of the tree,  W P  is the biomass of the bark part of the tree,  W B  is the biomass of the branch part of the tree,  W L  is the biomass of the leaf part of the tree, and  W A G B  is the total AGB of the tree. Finally, the AGB of each sample was derived by getting the sum of every tree in the sample. In our study, the samples covered all growth stages of Chinese fir growth (young, middle-aged, near-mature, mature, and over-mature forests), and the AGB of these samples ranged from 7.69 t/ha to 367.99 t/ha.

2.3. Remote Sensing Data

To map the AGB of the study area, two L-band qual-polarization synthetic aperture radar (PolSAR) images were acquired by ALOS-2 on 16 June and 30 June 2016. There are four polarizations in each image (HH, HV, VH, and VV). The incidence angle, azimuth resolution, and range resolution of these SAR images are 38.99°, 2.83 m, and 2.86 m, respectively. Additionally, the meteorological conditions for image acquisition were moderate rain and sunny (Table 1), respectively.
For accurately extracting SAR features, image preprocessing was initially conducted, such as polarimetric calibration, filter, and geocoding. Firstly, polarimetric calibration was used to reduce the influence of Faraday rotation on the image, and then a Refined Lee filter with a size of 7 × 7 was applied to reduce the speckle noise of images, and the polarization orientation angle (POA) was also compensated in order to reduce the influence of topography, and finally, the polarization scattering matrix ( S 2 ) and polarization coherence matrix ( T 3 ) of the image were extracted. After extracting features, geocoding of polarization features was required to match with ground measurements by using external DEM with a resolution of 12.5 m produced by the ALOS SAR images with the Alaska Satellite Facility’s (ASF) [15].

3. Methodology

3.1. Backscattering Coefficient and Its Derived Features

Normally, backscattering coefficients with various polarizations are widely used in mapping forest AGB. In this study, four backscattering coefficients ( σ H H , σ H V , σ V H , σ V V ) were extracted from ALOS-2 images. The following conversion equation can be used to perform intensity conversion of backscatter coefficients for the four channels to provide target intensity information [35,44].
S i d b = 10 l o g 10 I 2 + Q 2 + C F 1 A
where I and Q are the real and imaginary parts of the complex images; CF is the radiometric calibration factor (−83 dB); and A is the conversion factor (32 dB). Then, the derived features, including backscatter coefficient ratio with various combinations, radar vegetation indices, and texture features with different sizes can be extracted from four backscatter coefficients [21,45] (Table 2).

3.2. Features Extracted from Polarization Decomposition

Normally, quad-Polarimetric SAR data can be used to extract the target’s scattering characteristics based on polarimetric decomposition theory. At present, the approaches to the forest area are mainly based on four-component polarimetric decomposition. In this study, the widely used four-component decomposition method proposed by Yamaguchi was applied to extract features from the polarimetric coherence matrix ( T 3 ), including surface scattering (ODD), double-bounce scattering (DBL), volume scattering (VOL), and helix scattering (HLX). The following is a formula for the appropriate total scattering (SPAN) [15]:
S P A N = P O D D + P D B L + P V O L + P H L X
To enlarge the number of alternative features, the normalized scattering components between different scattering mechanisms were obtained by the ratio transformation. Moreover, the ratio between the components, such as DBL/ODD, DBL × OL, and other ratio-derived variables were also applied to map forest AGB in the next step.

3.3. Polarimetric Features in the Rotation Domain

Commonly, the scattering intensity severely depends on the orientation of the target, and the polarization mode correspondence of SAR to the target is also closely related to the relative geometry of the target. Because of complex vertical and horizontal structures of the forest canopy, it is more complicated to interpret scattering signals of the forest canopy [31]. Therefore, it is necessary to further interpret the orientation of the forest canopy to obtain more characteristics related to forest parameters.
For quad-polarization SAR, the full polarimetric information can be extracted from the polarization scattering matrix (S2). Based on the theory of rotational domain polarization, the polarization scattering matrix can be deformed to S(θ) by rotating the previously specified  S 2  by a certain angle around the radar line of sight [30]:
S θ = R 2 θ S 2 R 2 H θ
where  θ  is the rotation angle ranging from −π to π,  S θ  is the rotational polarization scattering matrix,  R 2 θ  is the rotation matrix  c o s θ s i n θ s i n θ c o s θ , and H denotes the conjugate transpose. Subsequently, the rotated polarization coherence matrix  T θ  is also created by rotating  T 3  by the same amount around the radar line of sight:
T θ = R 3 θ T 3 R 3 H θ
where  R 3 θ  is the rotation matrix  1 0 0 0 c o s 2 θ s i n 2 θ 0 s i n 2 θ c o s 2 θ .

3.3.1. Polarimetric Features Extracted from Oscillation Parameters

To decode the rotational properties of each element of  T 3  after rotation, a further analysis of  T θ  followed as [31]:
T 12 θ = T 12 cos 2 θ + T 13 sin 2 θ
and the powers of  T 12 θ  followed as:
T 12 θ 2 = T 12 2 cos 2 2 θ + T 13 2 sin 2 2 θ + R e T 12 T 13 * s i n 4 θ
For elements of the rotated polarization coherence matrix T(θ), a uniform representation of a sinusoidal function by mathematic transformations can be used to express the rotationally polarized coherence matrix as shown below [30]:
f θ = A s i n ω θ + θ 0 + B
where A is the amplitude of oscillation, B is the center of oscillation, ω is the angular frequency, and  θ 0  is the initial angle. Therefore, for each element in the rotationally polarized coherence matrix, four parameters, A, B, ω, and  θ 0 , can be used to express explicit relationships related with    T 3 . So, these parameters in each element are viewed as new characteristic parameters to characterize the elements.
The elements of  T θ  are expressed by uniform sinusoidal function are  R e T 12 θ ,   R e T 13 θ ,   I m T 12 θ ,   I m T 13 θ ,   R e T 23 θ ,   T 22 θ ,   T 33 θ ,   T 12 θ 2 ,   T 13 θ 2  and  T 33 θ 2 . The same or equivalent information exists for the oscillation parameters of these elements such as  A _ R e [ T 12 θ ]  is the same as  A _ Re [ T 13 θ ] . Finally, there are 12 final oscillation parameters (OP) with independent information, which are summarized in Table 3.

3.3.2. Polarimetric Coherence Features in Rotation Domain

A frequently utilized polarization feature is the polarization coherence feature (PC) of the polarization SAR, which is written as follows [46]:
γ a b = S a × S b * S a × S a * × S b × S b *
where  S a  and  S b  denote arbitrary polarization channels. After replacing    S a  and  S b  with the rotational domain scattering matrix considering the rotational domain, the rotational domain polarization coherence features (RPC) is obtained as follows [32]:
γ a b θ = S a θ × S b * θ S a θ × S a * θ × S b θ × S b * θ
where (θ) ∈ [−π, π). Thus, four independent RPC features can be obtained:
γ H H V V θ γ H H H V θ | γ H H + V V H H V V θ | | γ H H V V H V θ | . Furthermore, the RPC features under each channel can in turn be derived from multiple features, as shown in Figure 2. The derived RPC features are shown in Table 4.

3.4. Sensitivity of Polarimetric Features

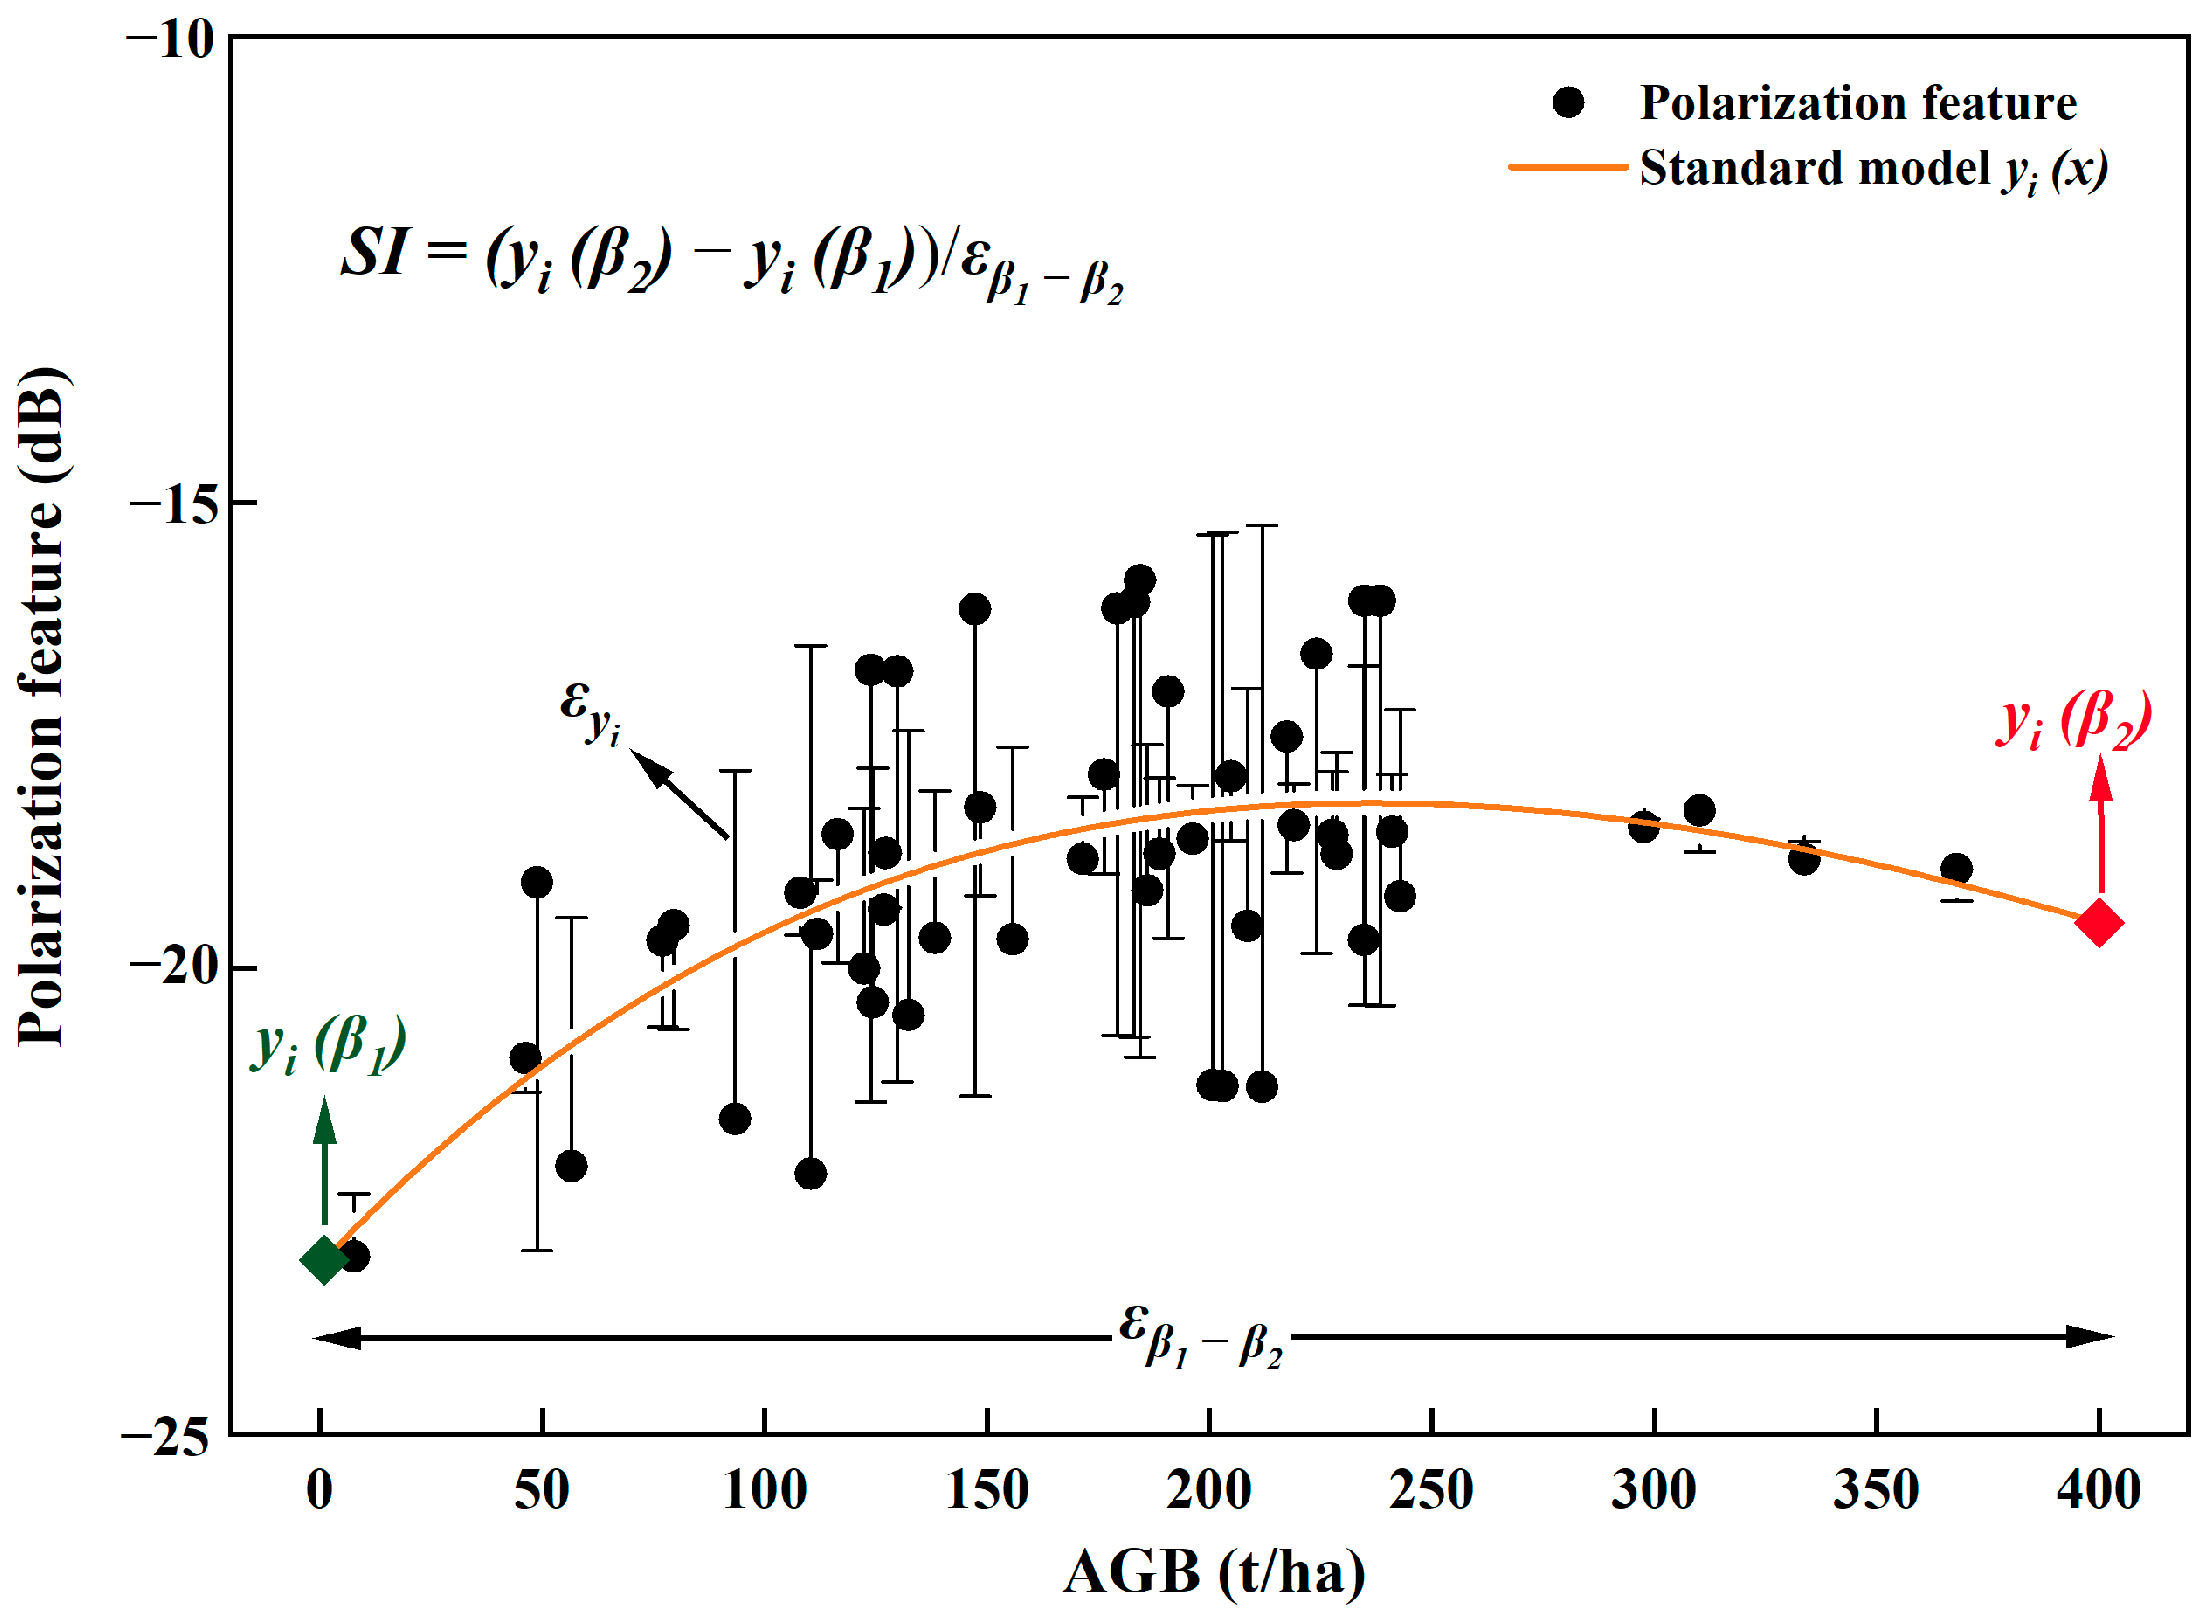
To map forest AGB using quad-polarimetric SAR images, the sensitivity of features with forest parameters should be initially evaluated. Normally, it is a rather complex issue to evaluate the sensitivity between polarimetric features and forest parameters. The common approach is visual interpretation by scatterplots or quantitative indicators using Pearson correlation coefficients or saturation levels. In a previous study, a sensitivity index (SI) has been proposed to express relationship between polarimetric characteristics and AGB, which considers the saturation and the correlation problems [42].
Using a conventional semi-exponential model, the sensitivity of polarimetric features is constructed as followed:
y i = a e c β + b 1 e c β
where  y i  indicates polarimetric feature,  β  is AGB, and a, b, and c are model coefficients, which are obtained by least squares fitting. The sensitivity index (SI) of a polarimetric feature, which can reflect the sensitivity of a polarimetric feature within a specific AGB interval, is obtained as follows:
SI = y i β 2 y i β 1 ε β 1 β 2
where  ε β 1 β 2  denotes the standard error of this feature model in the AGB interval of  ( β 1 β 2 ) . The AGB of ground samples in this study ranged from 7.69 t/ha to 367.99 t/ha, so the  ( β 1 β 2 )  interval of the SI of each polarimetric feature is selected from 0 t/ha to 400 t/ha. 
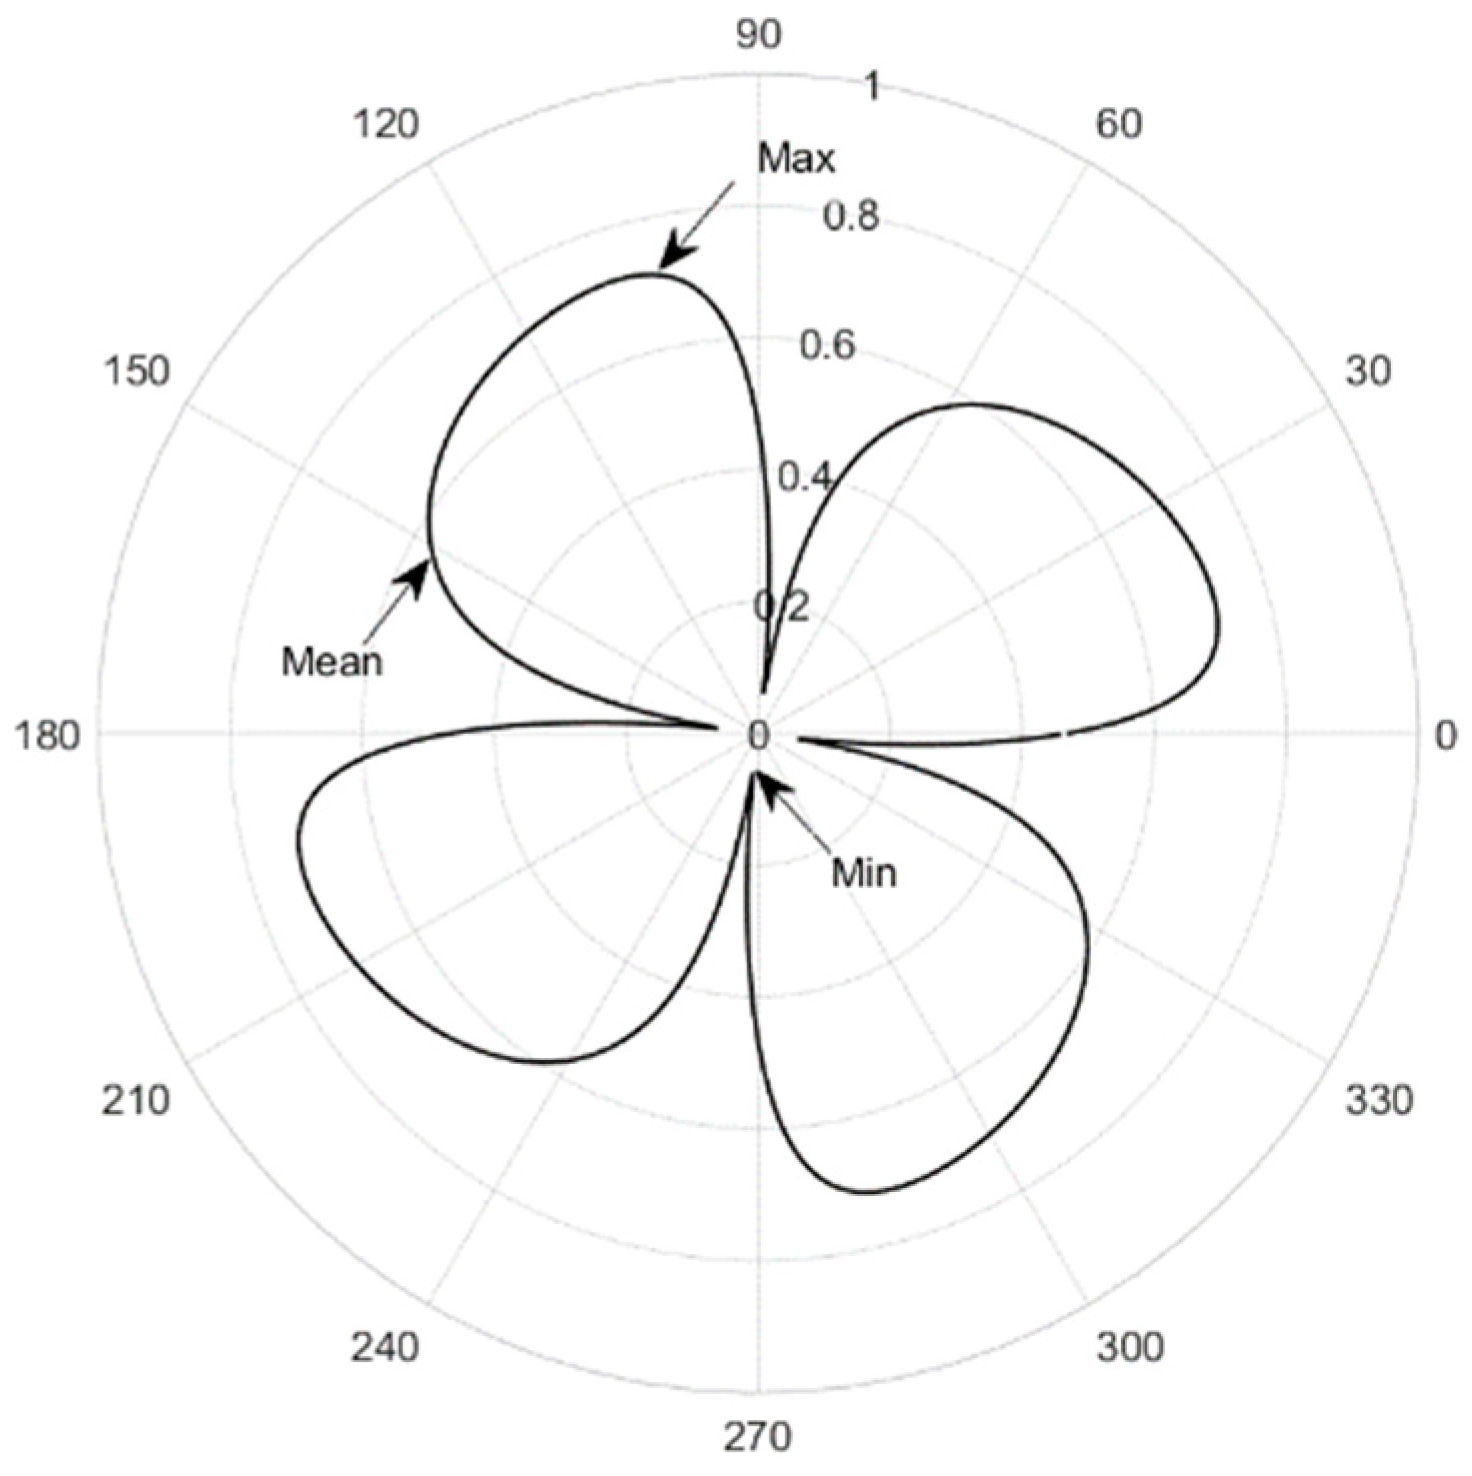
Figure 3 indicates the schematic diagram of SI, the value of SI is determined by two parts: (1) The difference between the fitted model at the beginning and the end of the interval, the larger the greater the indication that the feature still has a good response as the AGB increases. (2) The standard deviation of the fitted model estimates in the interval, the smaller the better the response relationship between the feature and AGB. It is confirmed that SI indicates both the saturation problem and the correlation problem between features and AGB. The larger the SI, the greater the sensitivity between the feature and AGB.

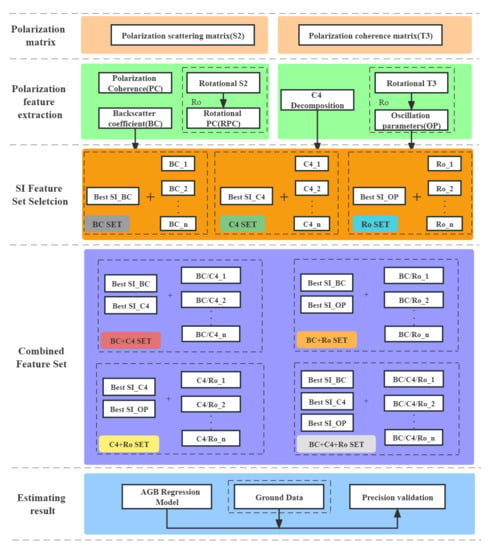
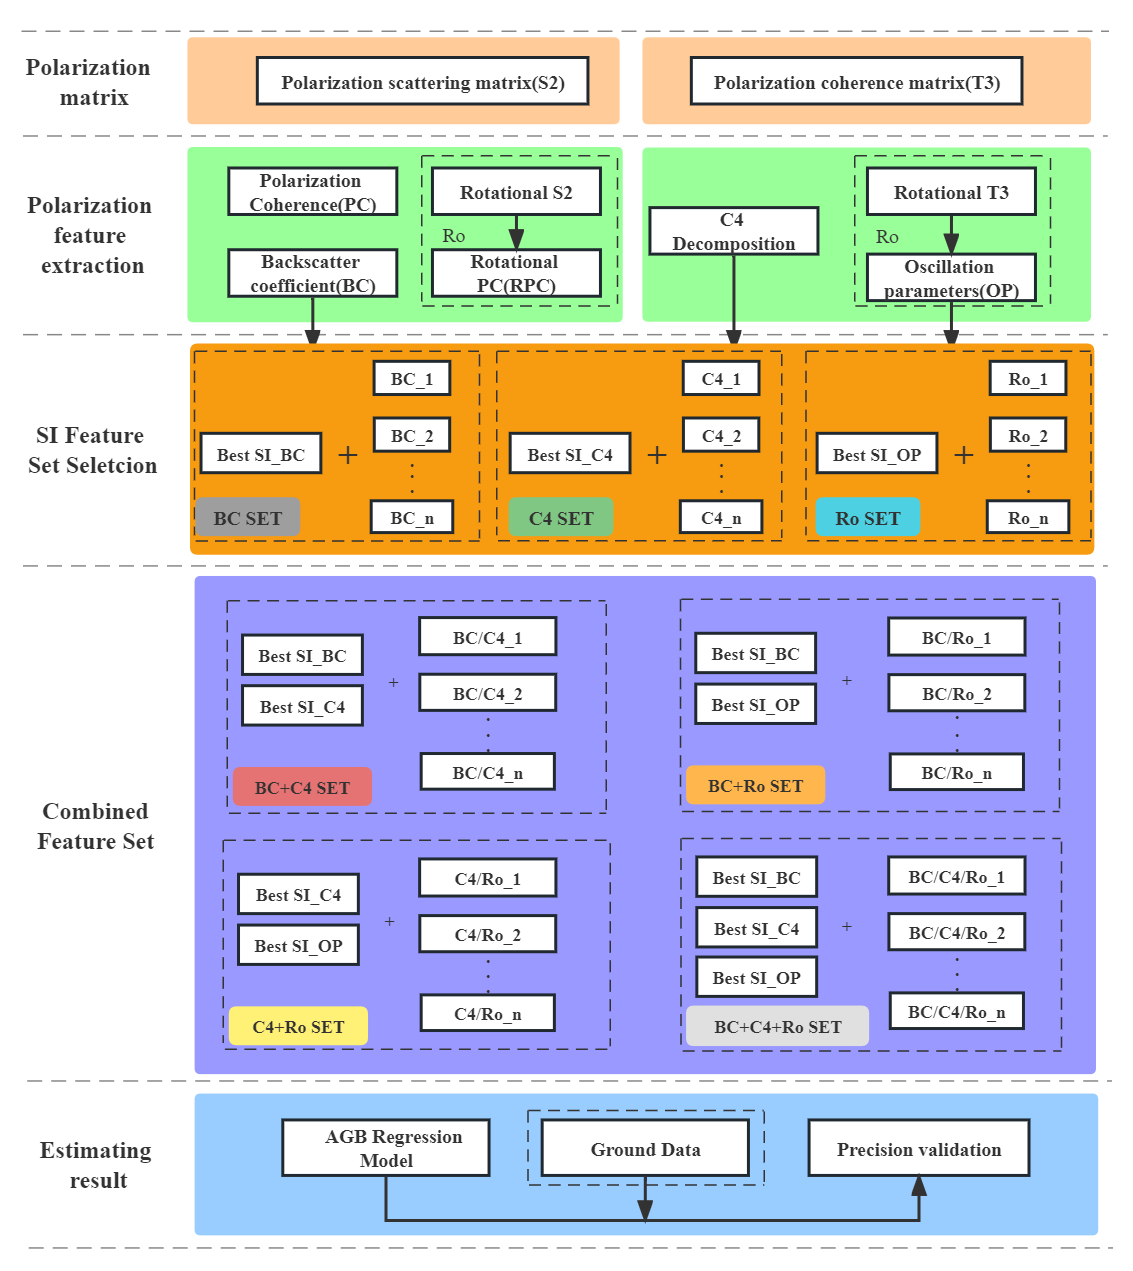
3.5. Feature Selection with SI and Mapping AGB

After extracting alternative features from quad-polarimetric SAR images, how to obtain the optimal feature set is a key point to improve the accuracy of mapping forest AGB. Normally, the accuracy of mapped forest AGB is directly dependent on the sensitivity of the selected feature set. However, the Pearson correlation coefficient based on linear independence finds it hard to express the nonlinear correlations. Moreover, the range of accurately estimated forest AGB is also determined by saturation levels of polarimetric features. In previous studies, the sensitivity index has shown great potential to express the relationship between polarimetric characteristics and AGB [42]. In this study, the values of SI can be also employed as a criterion and proposed to evaluate the capability of features for mapping forest AGB [
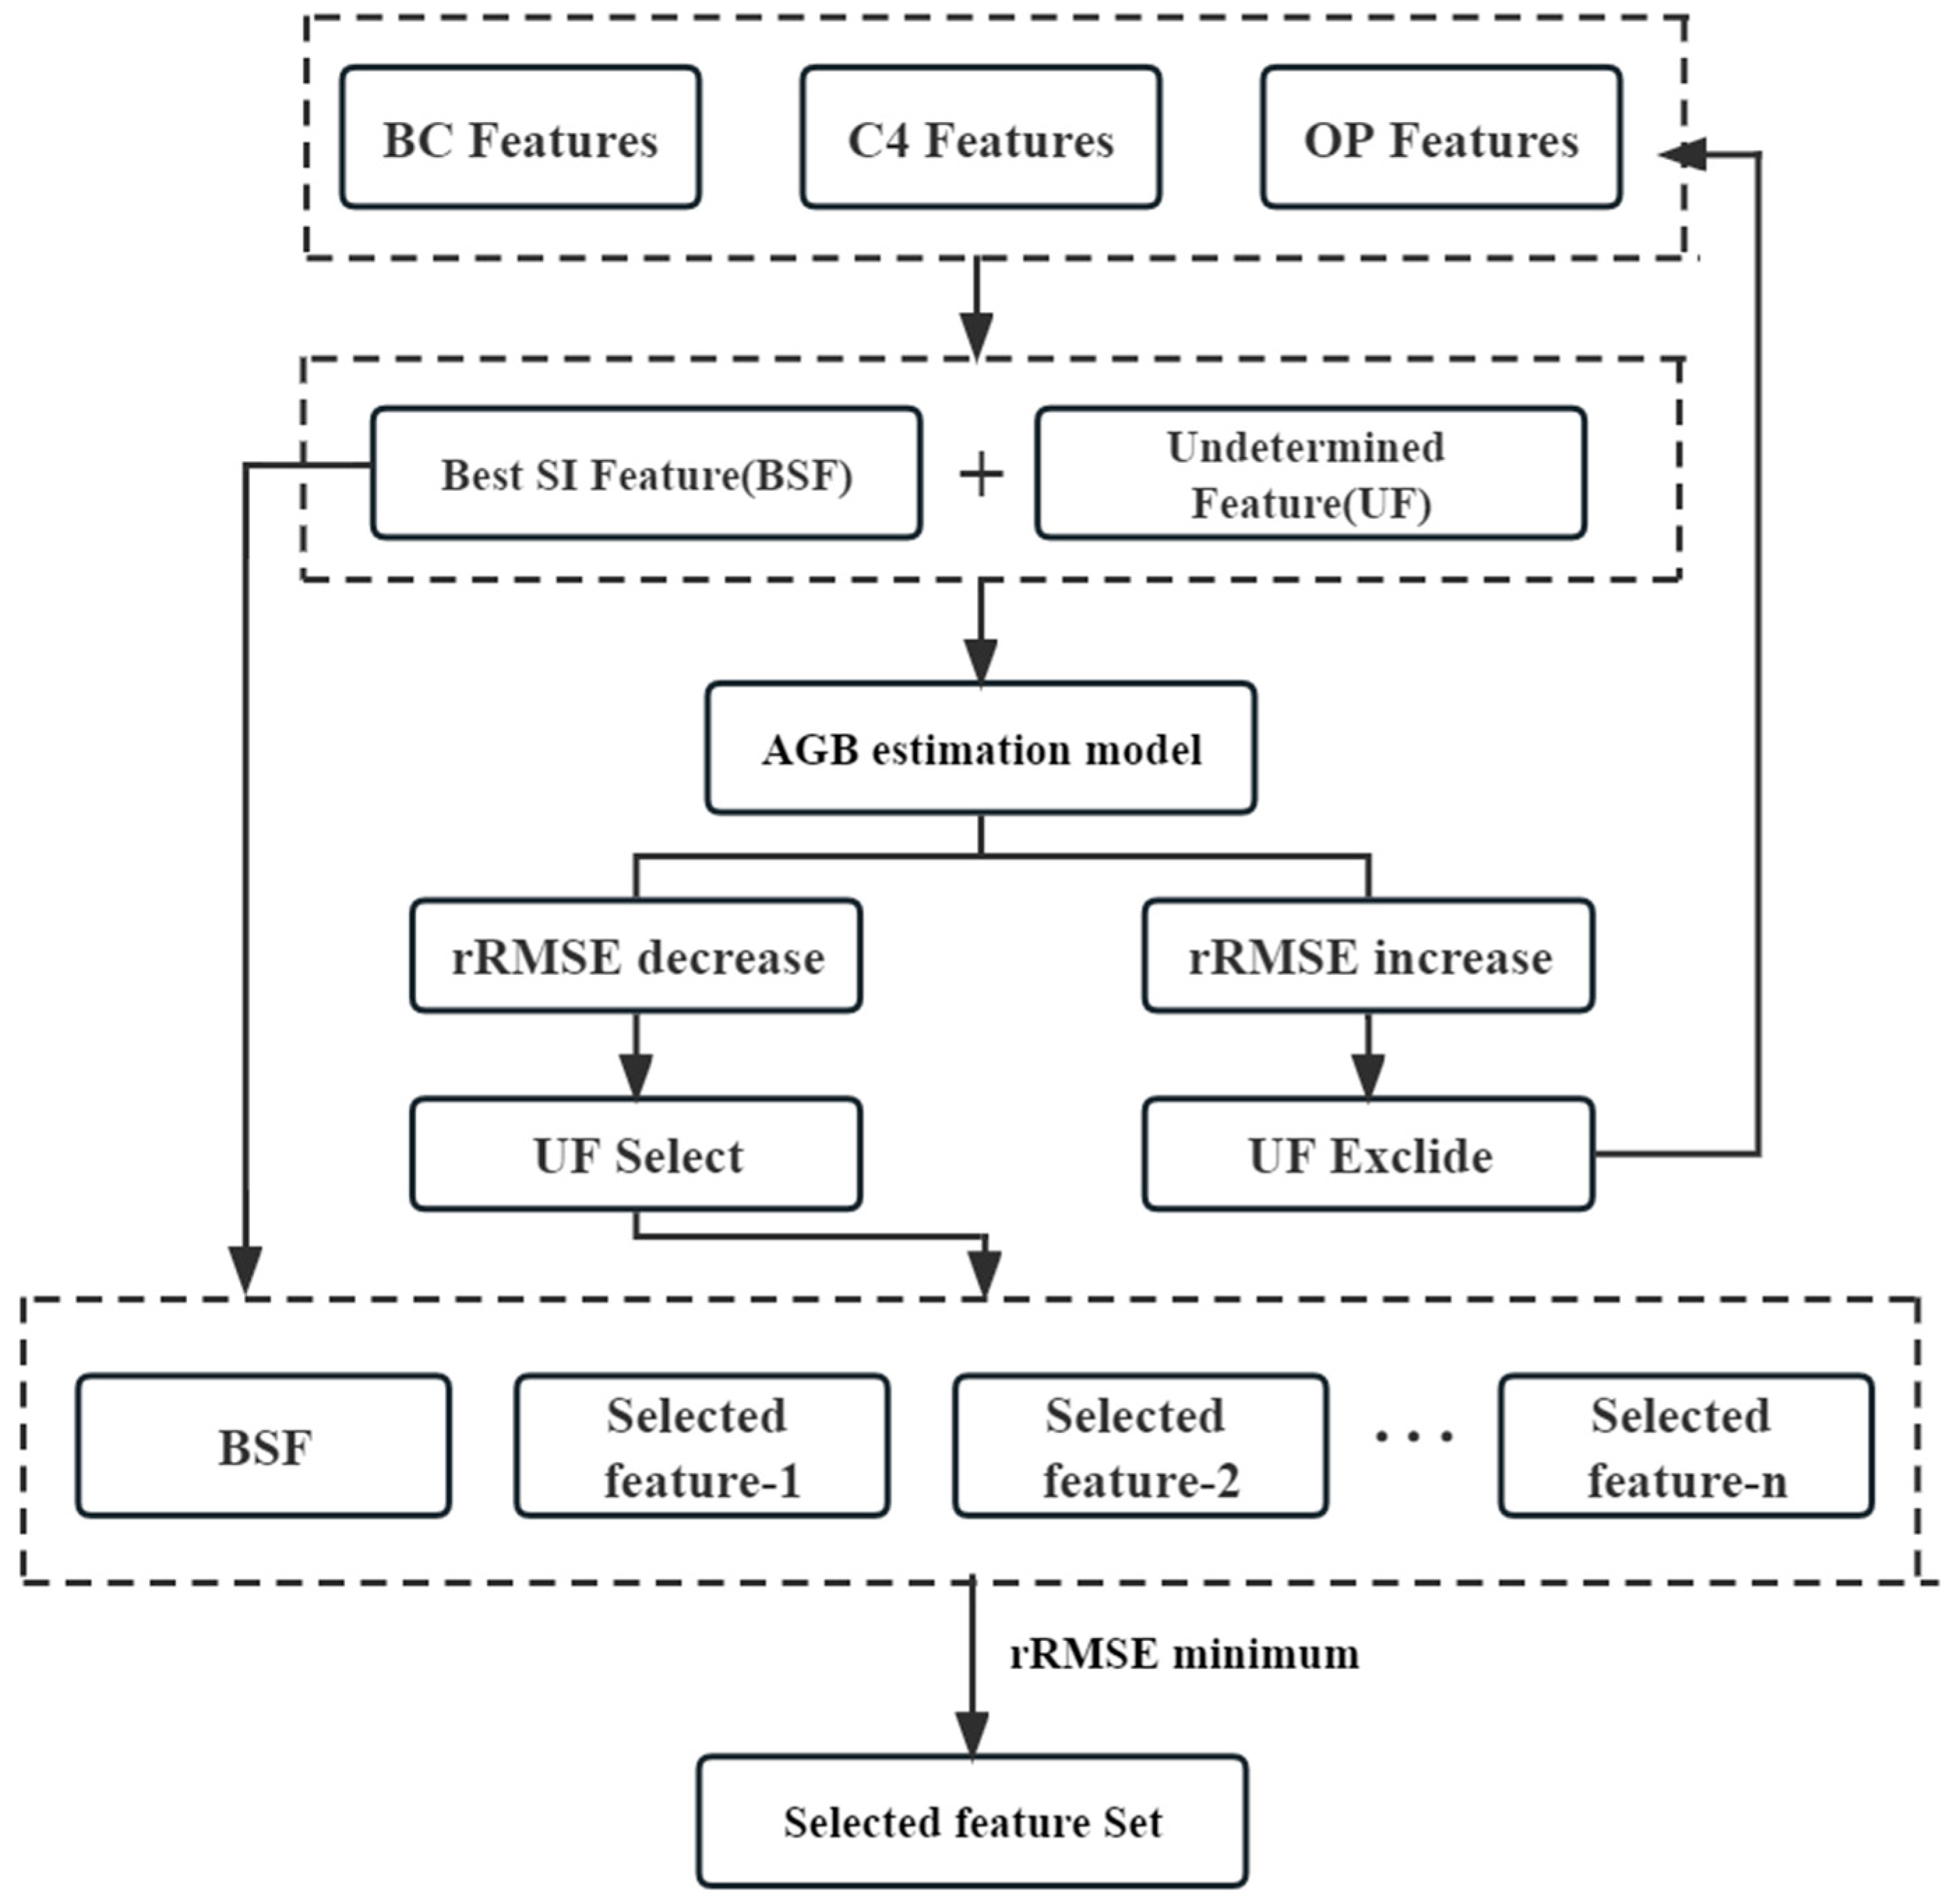
42]. So, the proposed feature selection method with SI criterion was constructed (SIS) as follows:
Step 1. SI of all features in the alternative feature set is calculated and ranked and the feature with the largest SI value is selected as the first one in the optimal feature set.
Step 2. Using the feature with the largest SI, the AGB regression model with multiple linear regression (MLR) is constructed and the relative mean square error (rRMSE) between predicted and ground measured AGB is obtained by the leave-one-out cross-validation (LOOCV).
Step 3. After that, the remaining sorted features are added one by one to the optimal features, and the updated rRMSE is obtained using the updated optimal feature set. If the updated rRMSE decreases after adding features ranked according to SI, the feature should remain in the optimal feature set. Otherwise, the feature should be removed from the optimal feature set.
Step 4. The optimal feature set is ultimately determined by the smallest rRMSE. The SIS method’s schematic diagram (Figure 4) is displayed below.
Furthermore, the Pearson correlation was also applied to obtain optimal feature sets for comparing. Three different polarimetric feature sets (backscatter coefficients and derived features (BC), four-component polarimetric decomposition features (C4), and rotated polarimetric features (Ro)) were used to map the AGB of the forest, and their sensitivity to different forest parameters was assessed by SI. Ultimately, forest AGB were mapped using common MLR and optimal feature sets obtained by proposed feature selection method. In addition, LOOCV method was also applied to obtain evaluation indices, such as coefficient of determination (R2), the root mean square error (RMSE), and the relative mean square error (rRMSE) between the estimated and measured AGB.

4. Results

4.1. Response Analysis of Forest Parameters and Polarization Features

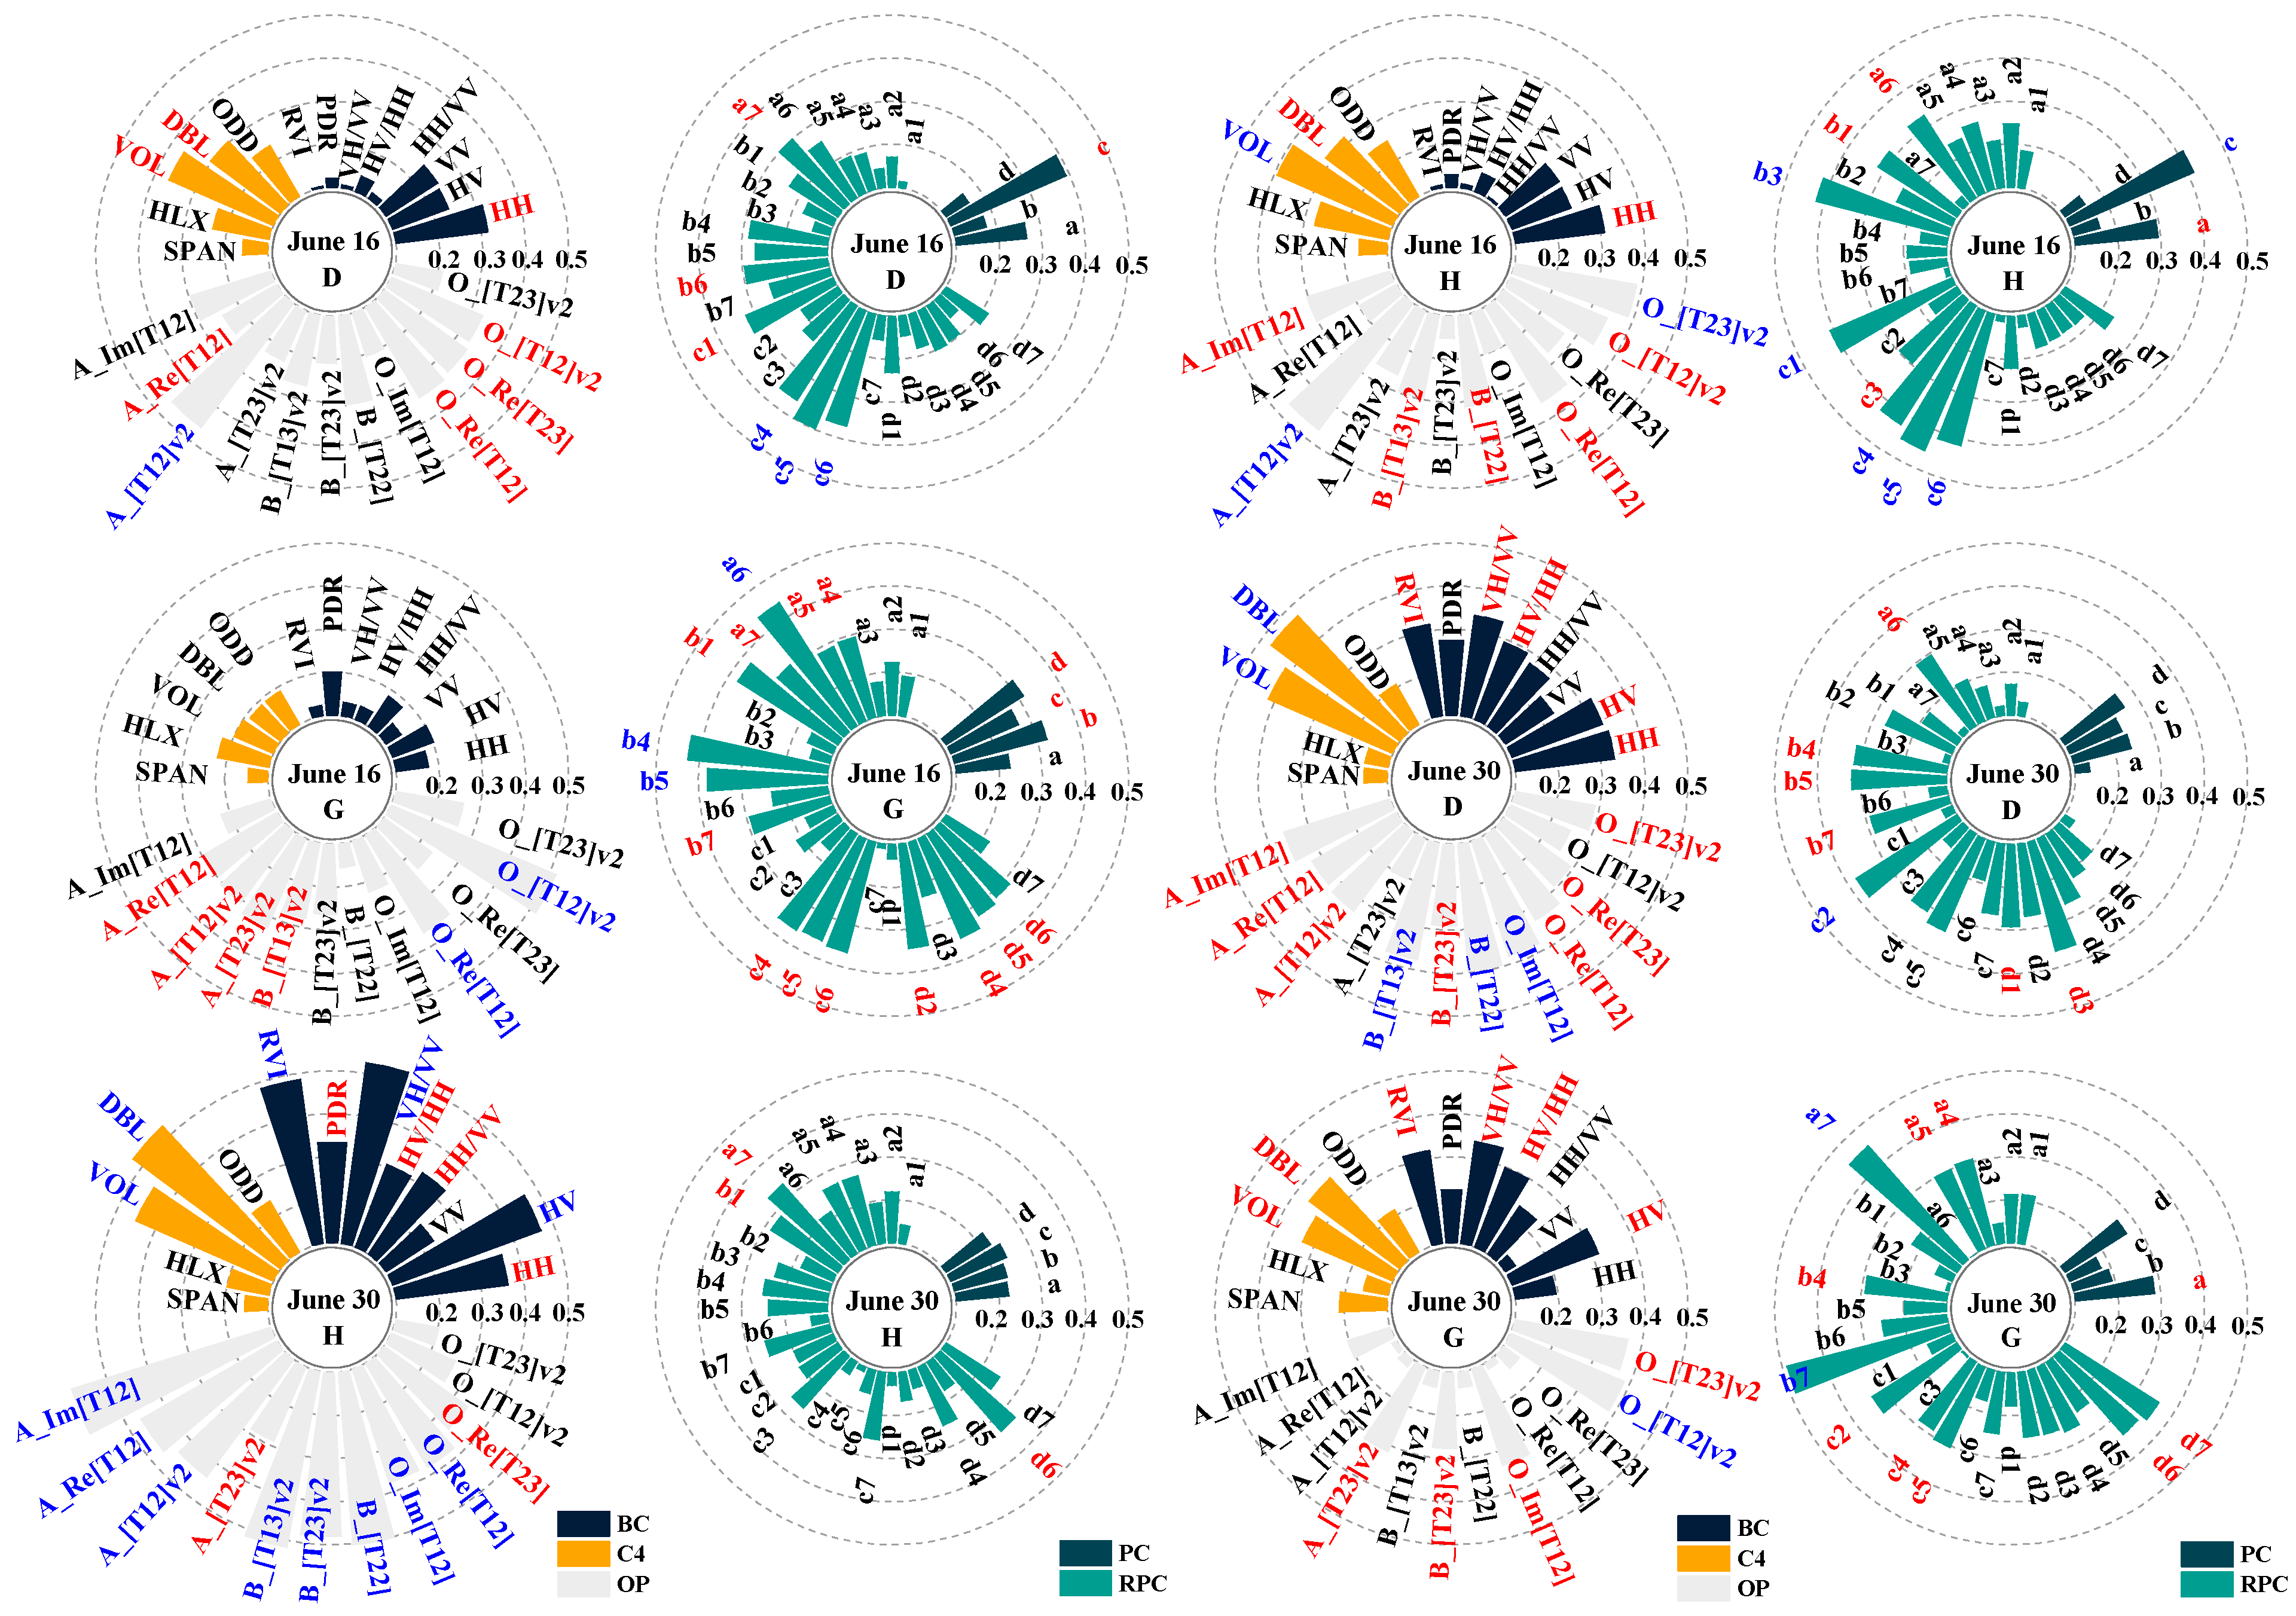
After deriving polarimetric features from SAR images, three forest parameters related to AGB (average DBH (D), forest average height (H), and forest stand average crown width (G)) were chosen to analyze the correlations with polarimetric features. This study involved polarimetric features, including backscattering coefficients with difference polarizations (BC), polarimetric decomposition features (C4), oscillation parameters (OP), original polarimetric coherence (PC), and rotational domain polarimetric coherence (RPC). The Pearson correlation coefficient was calculated and a significance test was also carried out for each type of feature and Pearson correlation coefficients between each selected feature and forest parameters are illustrated in Figure 5.
For three involved forest parameters (D, H, and G), it is illustrated that the number of oscillation parameters with the Pearson correlation larger than 0.3 is more than that related to backscattering coefficients and decomposition features. Moreover, the OP features had the highest correlation features with three forest parameters (D, H, and G). Furthermore, based on the theory of rotational domain polarimetric, more features were obtained from rotational domain polarimetric coherence, and the Pearson correlations of most features related to RPC are obvious higher than these features related to original polarimetric coherence. It is confirmed that the number of alternative features with high Pearson correlations is obviously increased and the sensitivity between forest parameters and features related to rotational domain polarimetric are improved after using the theory of rotational domain polarimetric.

4.2. The Results of Sensitivity

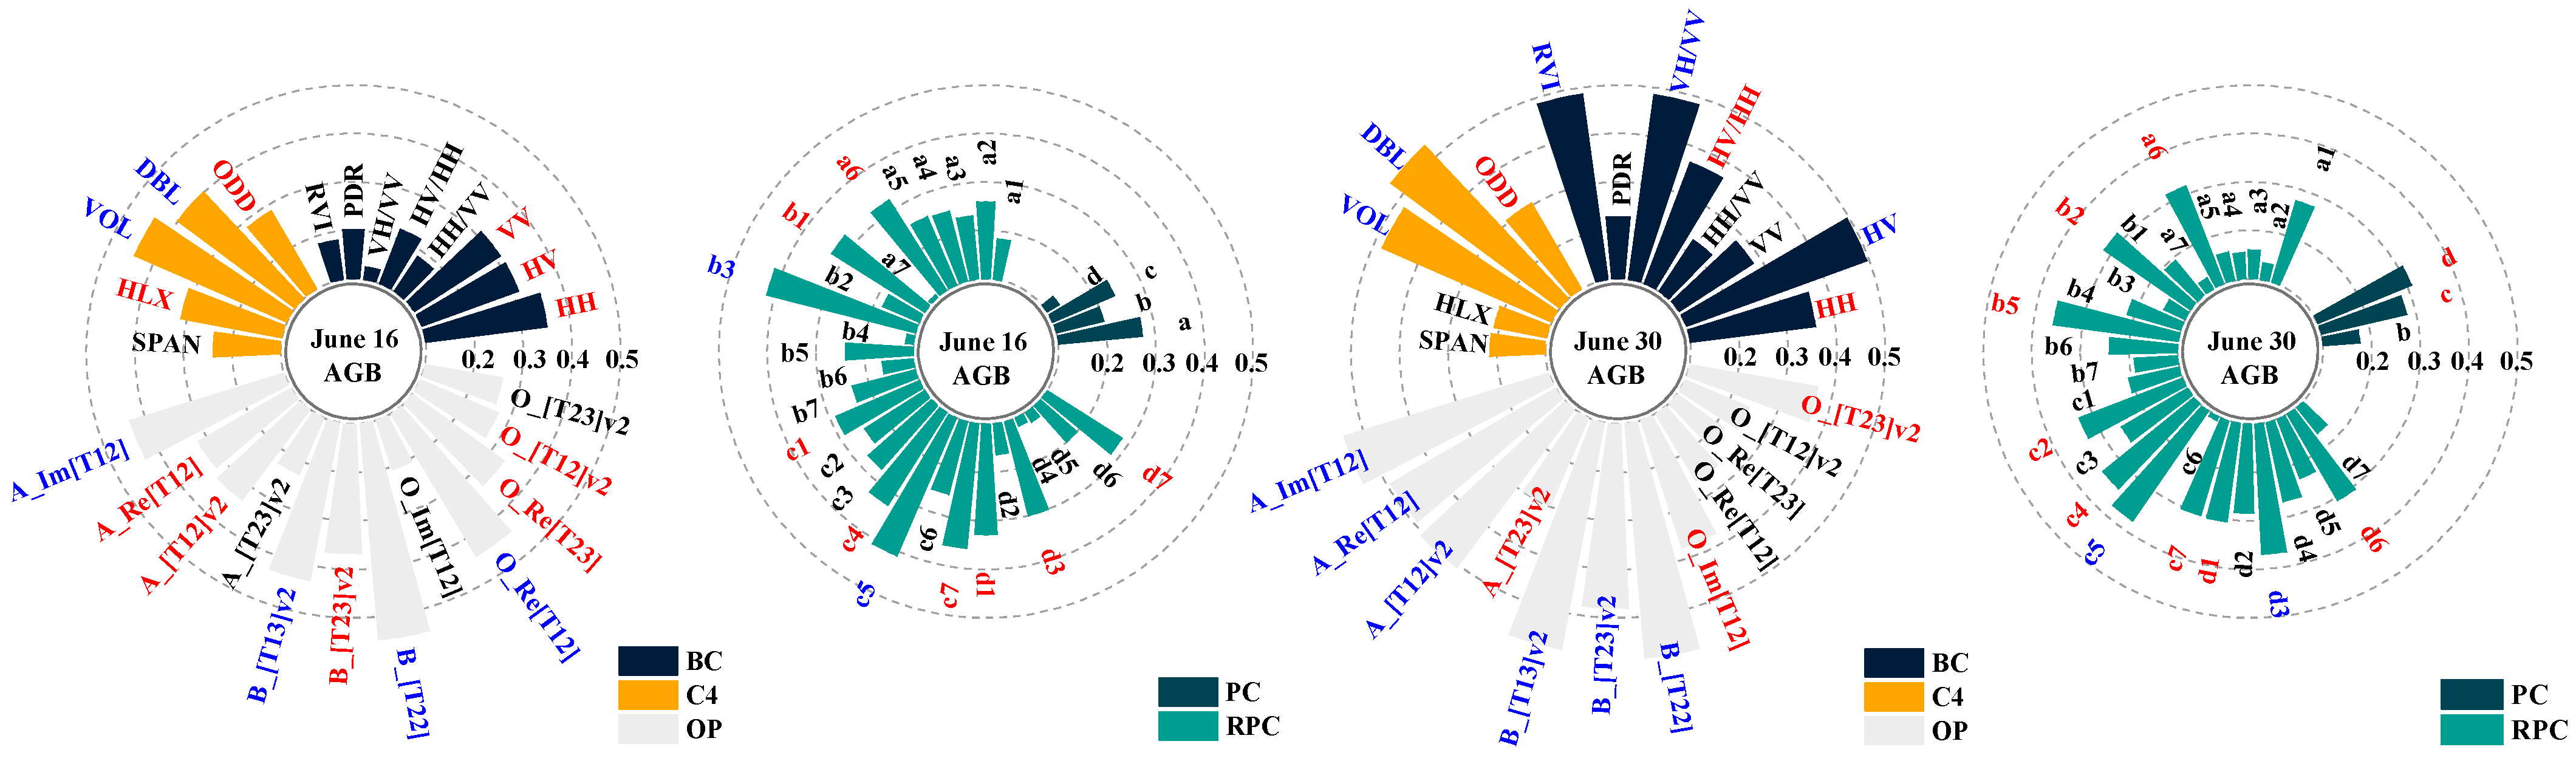
To evaluate the relationships between alternative features and forest AGB, the Pearson correlations between all alternative features and forest AGB are shown in Figure 6. For one quad polarimetric SAR image, all polarimetric features were split into two groups (BC, C4, and OP, PC and RPC). For the images acquired on 30 June, the Pearson correlations of the first group ranged from −0.296 to 0.486, and the number of features larger than 0.4 is four for OP and 1 for BC and C4, respectively. In addition, the Pearson correlations of the second group ranged from −0.181 to 0.210 for PC, and from −0.271 to 0.277 for RPC, respectively. It is confirmed that features extracted from Oscillation parameters are more sensitive to forest AGB than that extracted from polarimetric decomposition (C4) and polarimetric coherence features. In addition, because of the difference in weather conditions of the images acquired to date, the gaps of sensitivity between the two images are also illustrated in Figure 6.
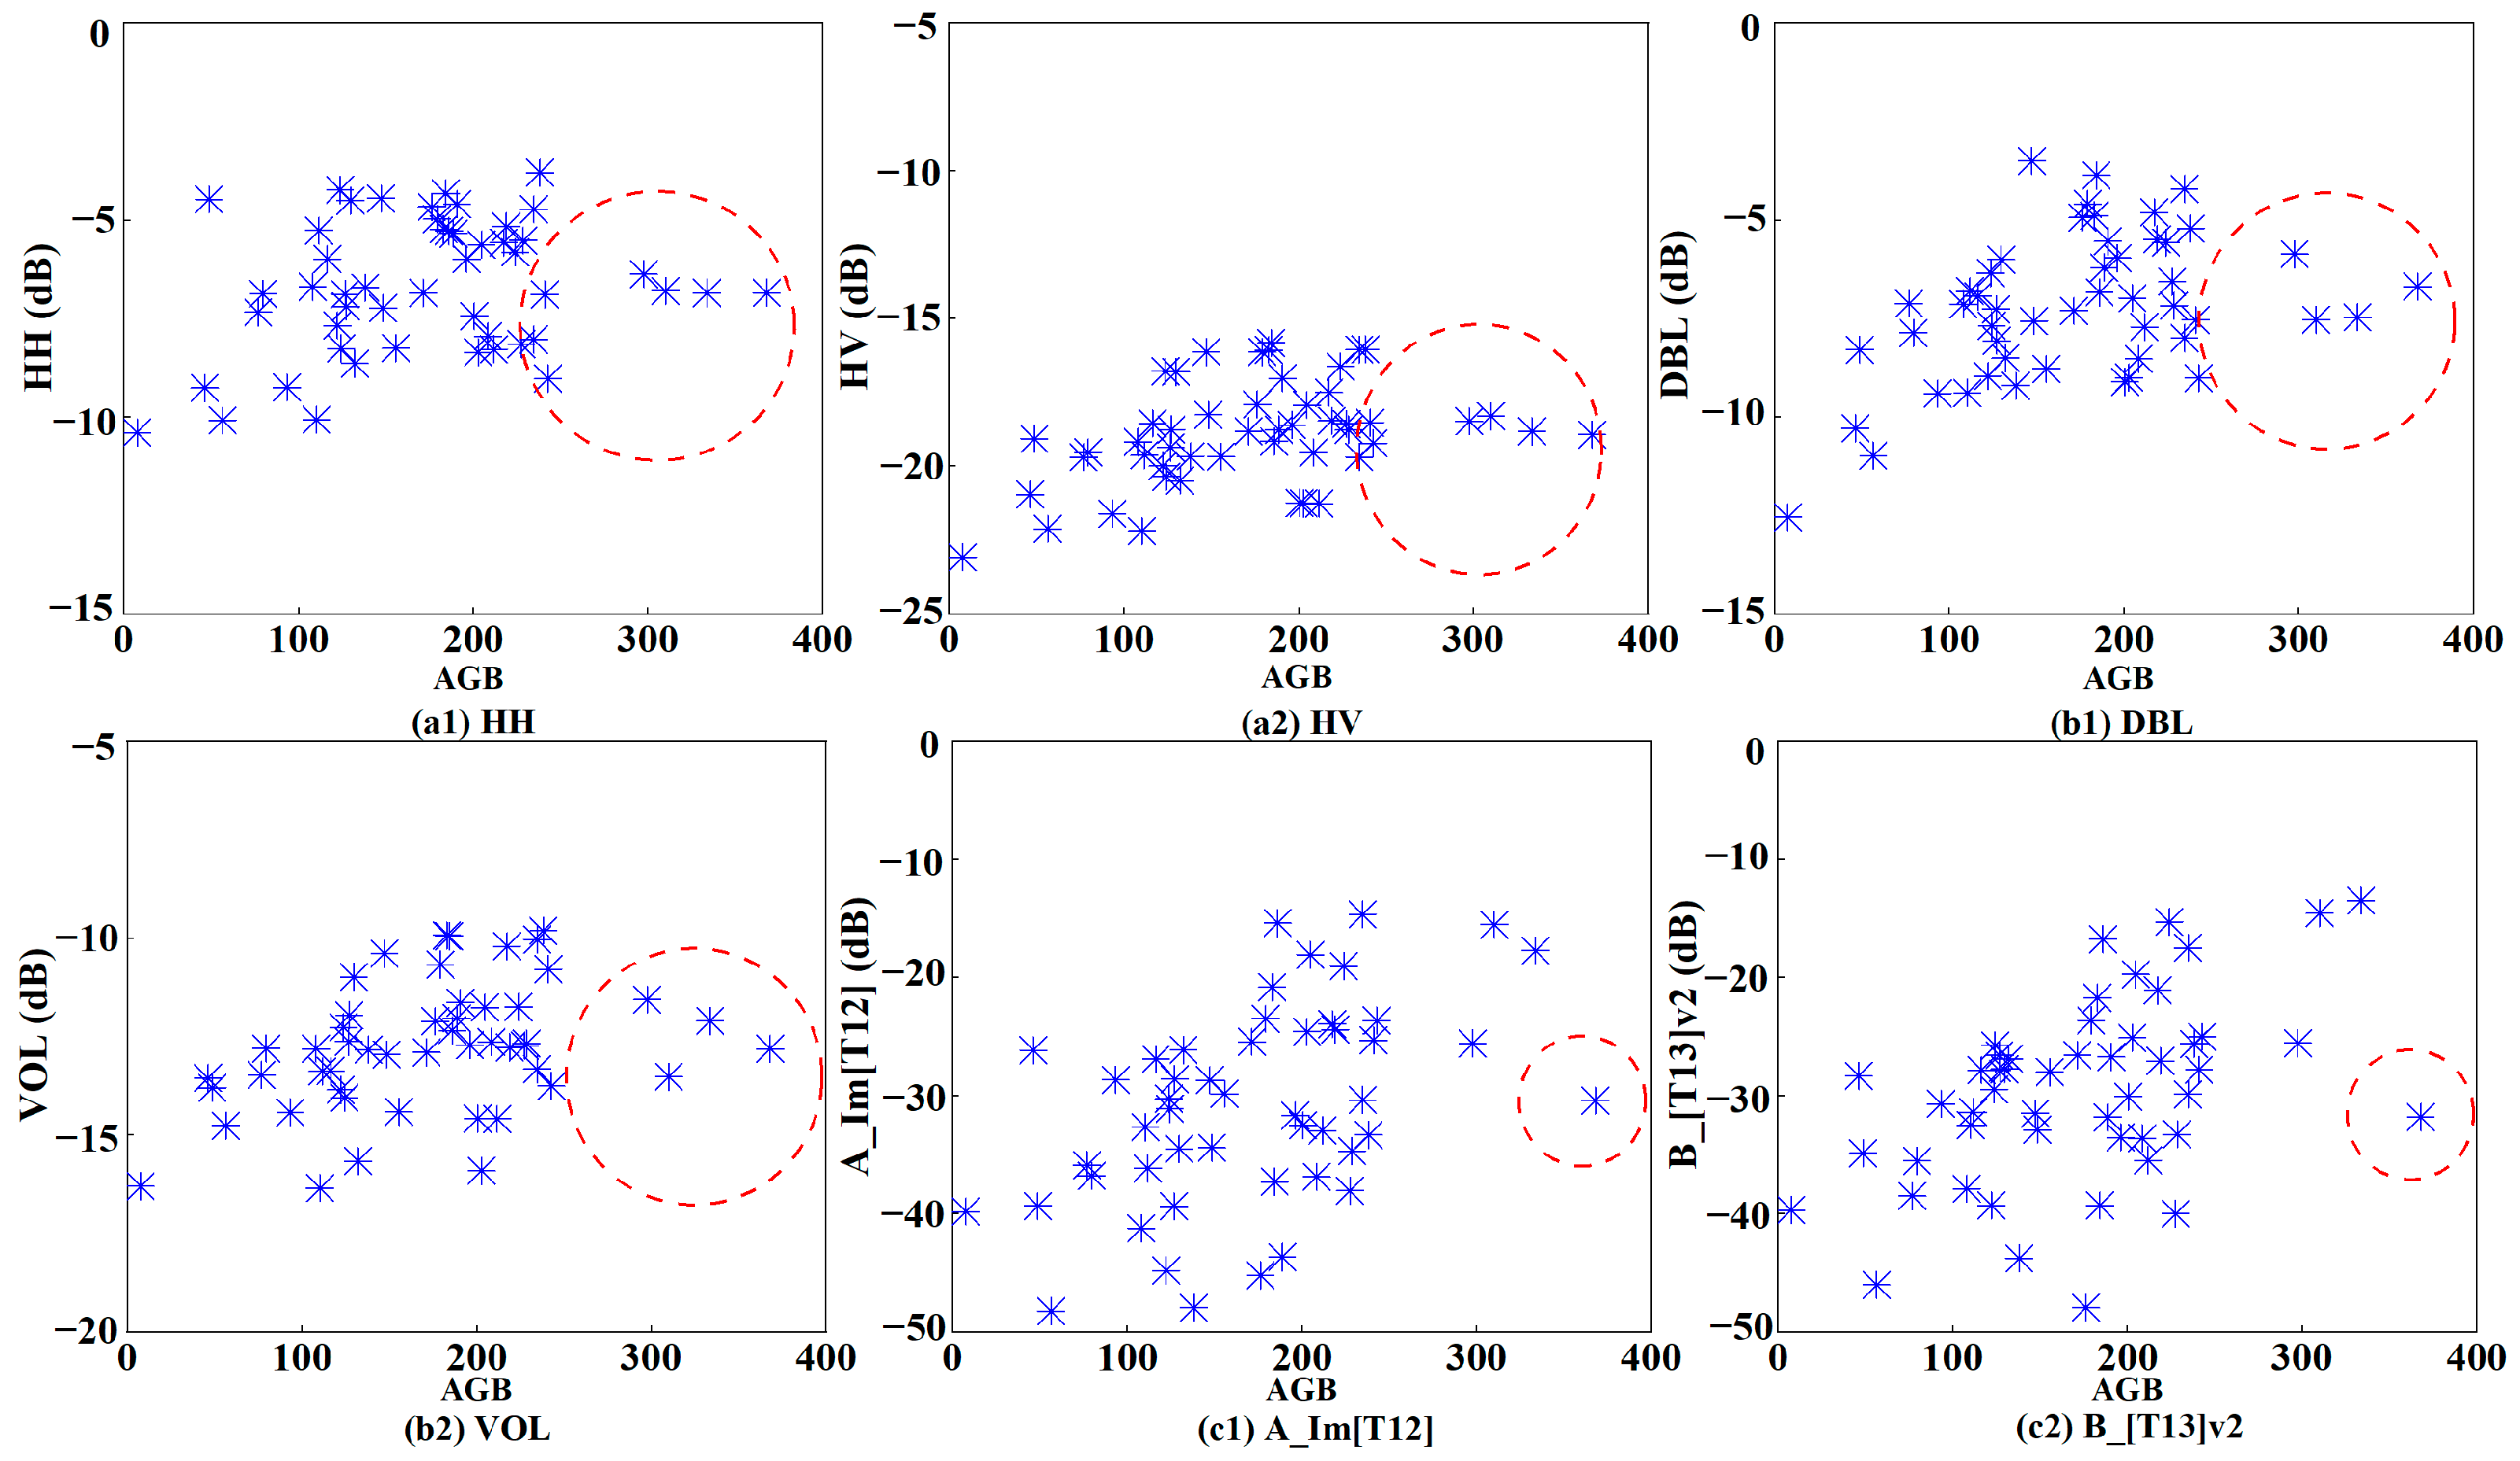
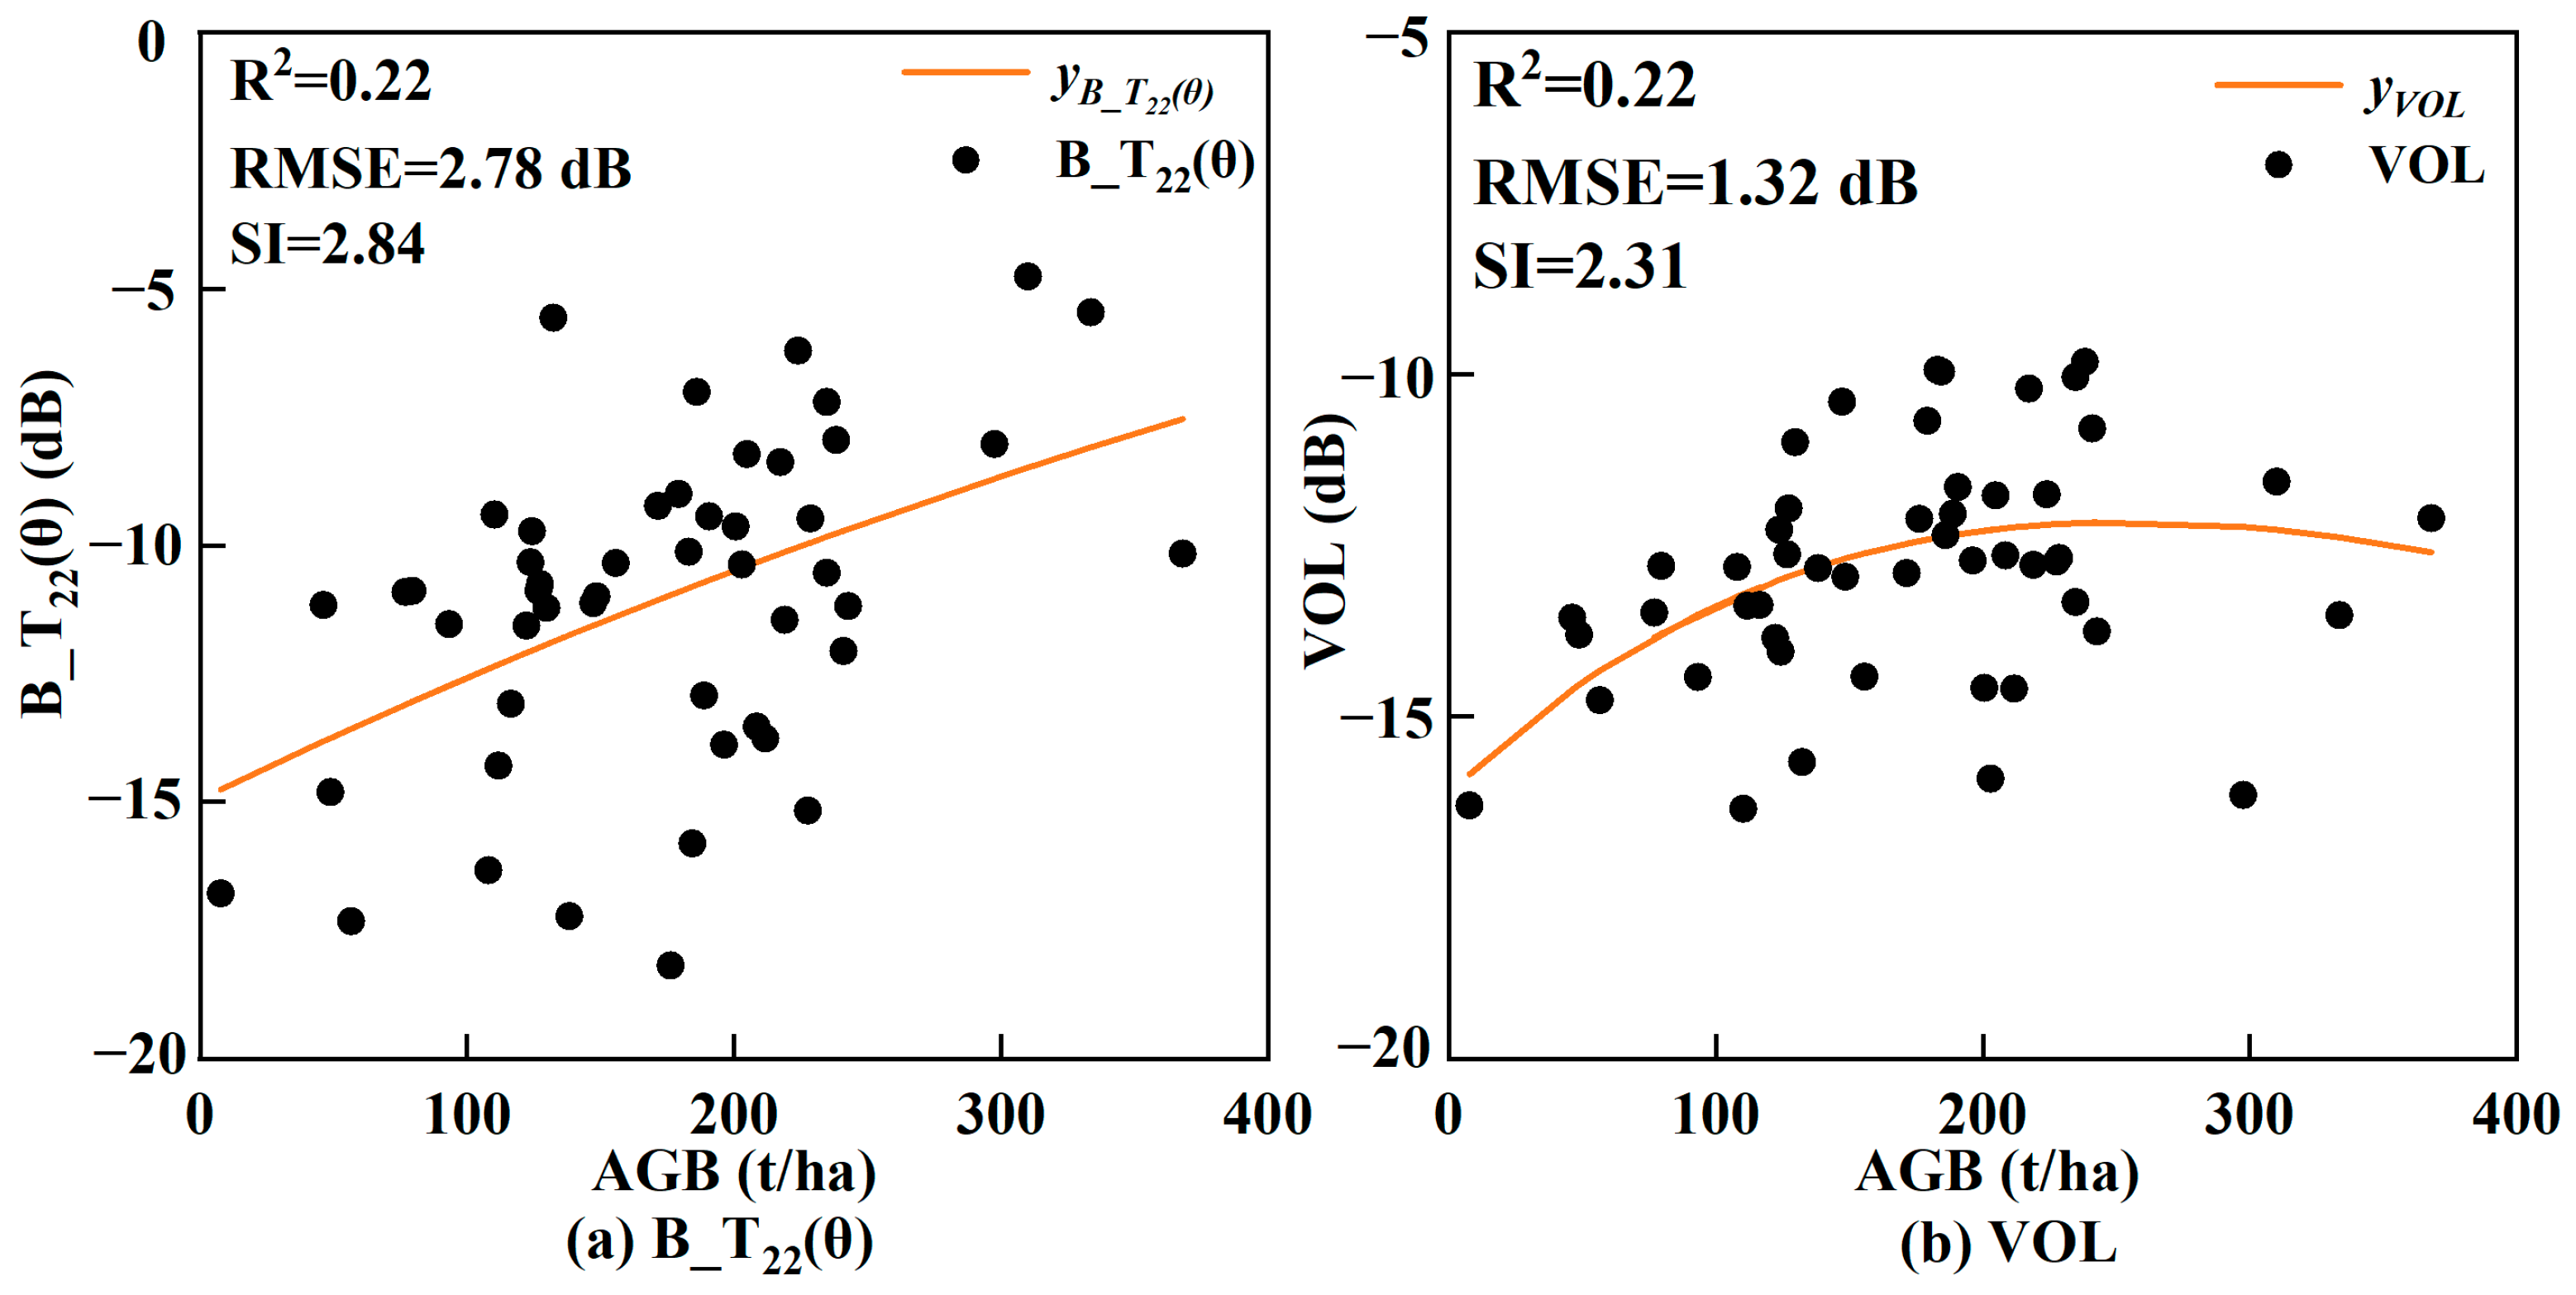
To further evaluate the relationships between feature and forest AGB, several features (HH (dB), HH (dB), DBl(dB), Vol (dB),  A _ Im [ T 12 ] ,  and  B _ T 13 2 ) were employed to illustrate the scatters related with forest AGB (Figure 7). The scatters illustrated that both BC features and C4 features of SAR images have a good response relationship with AGB before 200 t/ha, and it becomes more challenging to respond accurately to AGB after 200 t/ha. It is confirmed that the saturation phenomenon is obviously observed for these common features, such as HH (dB), HH (dB), DBl(dB), and Vol (dB). Furthermore, OP features ( A _ Im [ T 12 ] , and  B _ T 13 2 ) may be more sensitive with the AGB, even forest AGB larger than 200 t/ha, with the saturation levels ultimately occurring at roughly 300 t/ha. The results demonstrated that the proposed features extracted from rotational domain polarimetric have higher saturation levels than these traditional features.
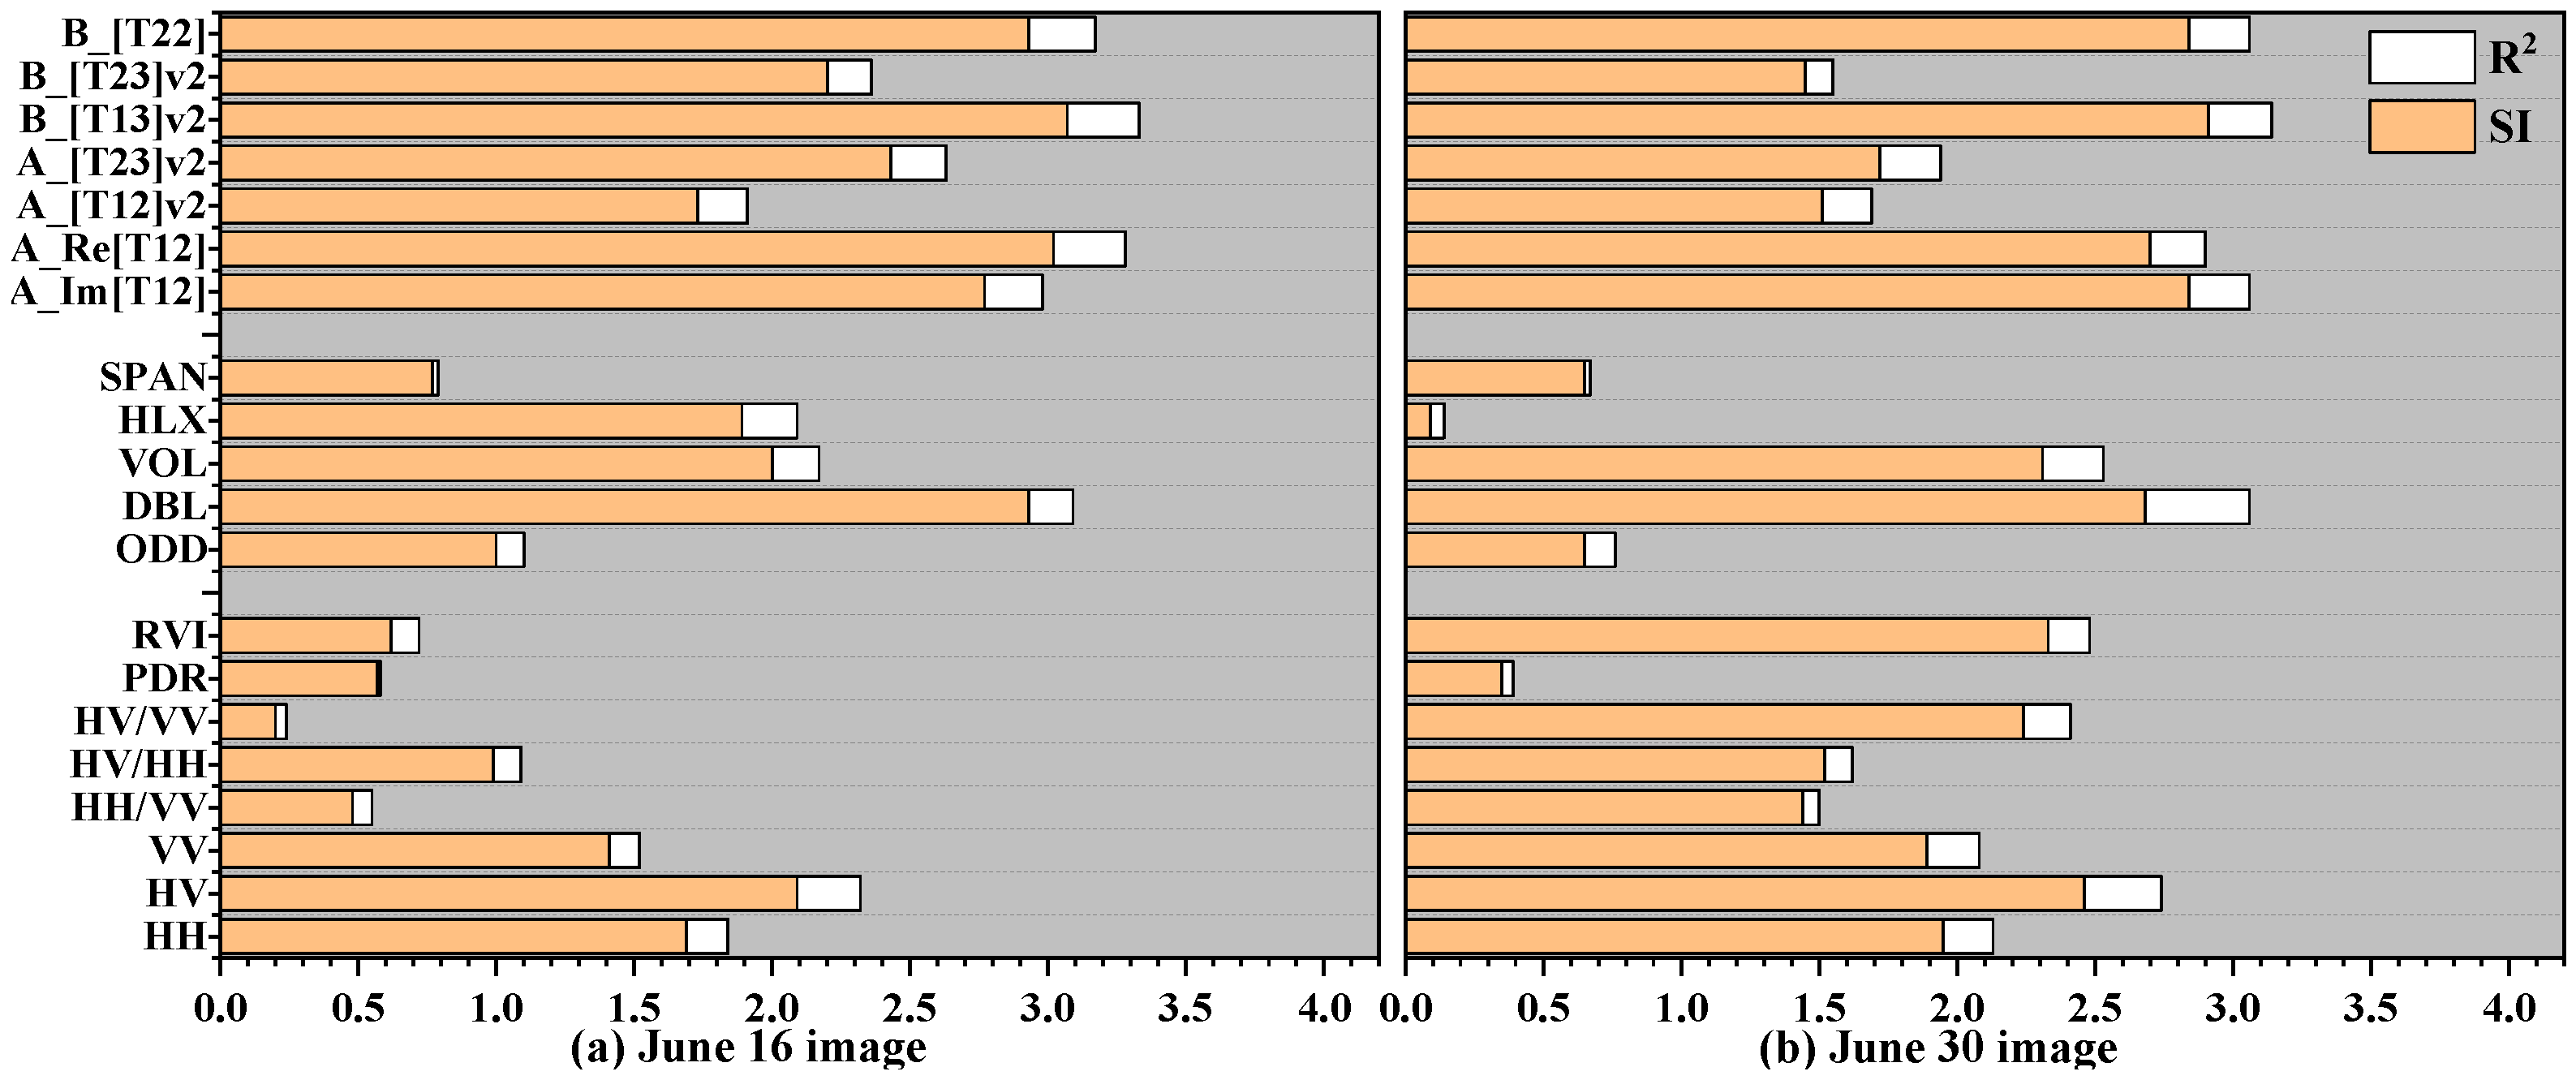
To quantitatively express the sensitivity between features and forest AGB, SI was applied to evaluate the capability of features for mapping forest AGB. In this study, backscattering coefficients with difference polarizations (BC), polarimetric decomposition features (C4), and intensity of proposed features (A_ [·] and B_ [·]) were employed to obtain the SI (Figure 8). The SI values of proposed features ranged from 1.73 to 3.07 for SAR images acquired on 16 June, and from 1.45 to 2.91 for SAR images acquired on 30 June, respectively. The largest SI value was obtained by  B _ T 13 2  for two acquired images (16 June: 3.07; 30 June: 2.91). It is also found that the values of SI and R2 derived from features related to oscillation parameters (OP) are significantly larger than that from backscattering coefficients with difference polarizations (BC) and polarimetric decomposition features (C4). Compared with traditional features (BC and C4), the results demonstrated that features related to oscillation parameters (OP) have high sensitivity to forest AGB.

4.3. The Results of Feature Selection Based on SI

To evaluate the capability of involved features in mapping forest AGB, all alternative features were grouped into three categories. The first category is the BC feature set, including the backscattering coefficient features and its derived features, and the second is the C4 feature set, including four-component polarimetric decomposition features and its derived features, and the OP features and the RPC features are regarded as Ro feature sets. For each category, the optimal feature set is obtained by the feature selection method. In this study, a proposed feature selection method (SIS) combined sensitivity index (SI) with common MLR was applied to obtain optimal feature sets. For comparison, the feature selection method combined Pearson correlation with MLR (PSS) was also applied to obtain optimal feature sets. Using two feature selection methods within three categories of feature sets, the optimal feature set of each category was obtained with the smallest rRMSE values.
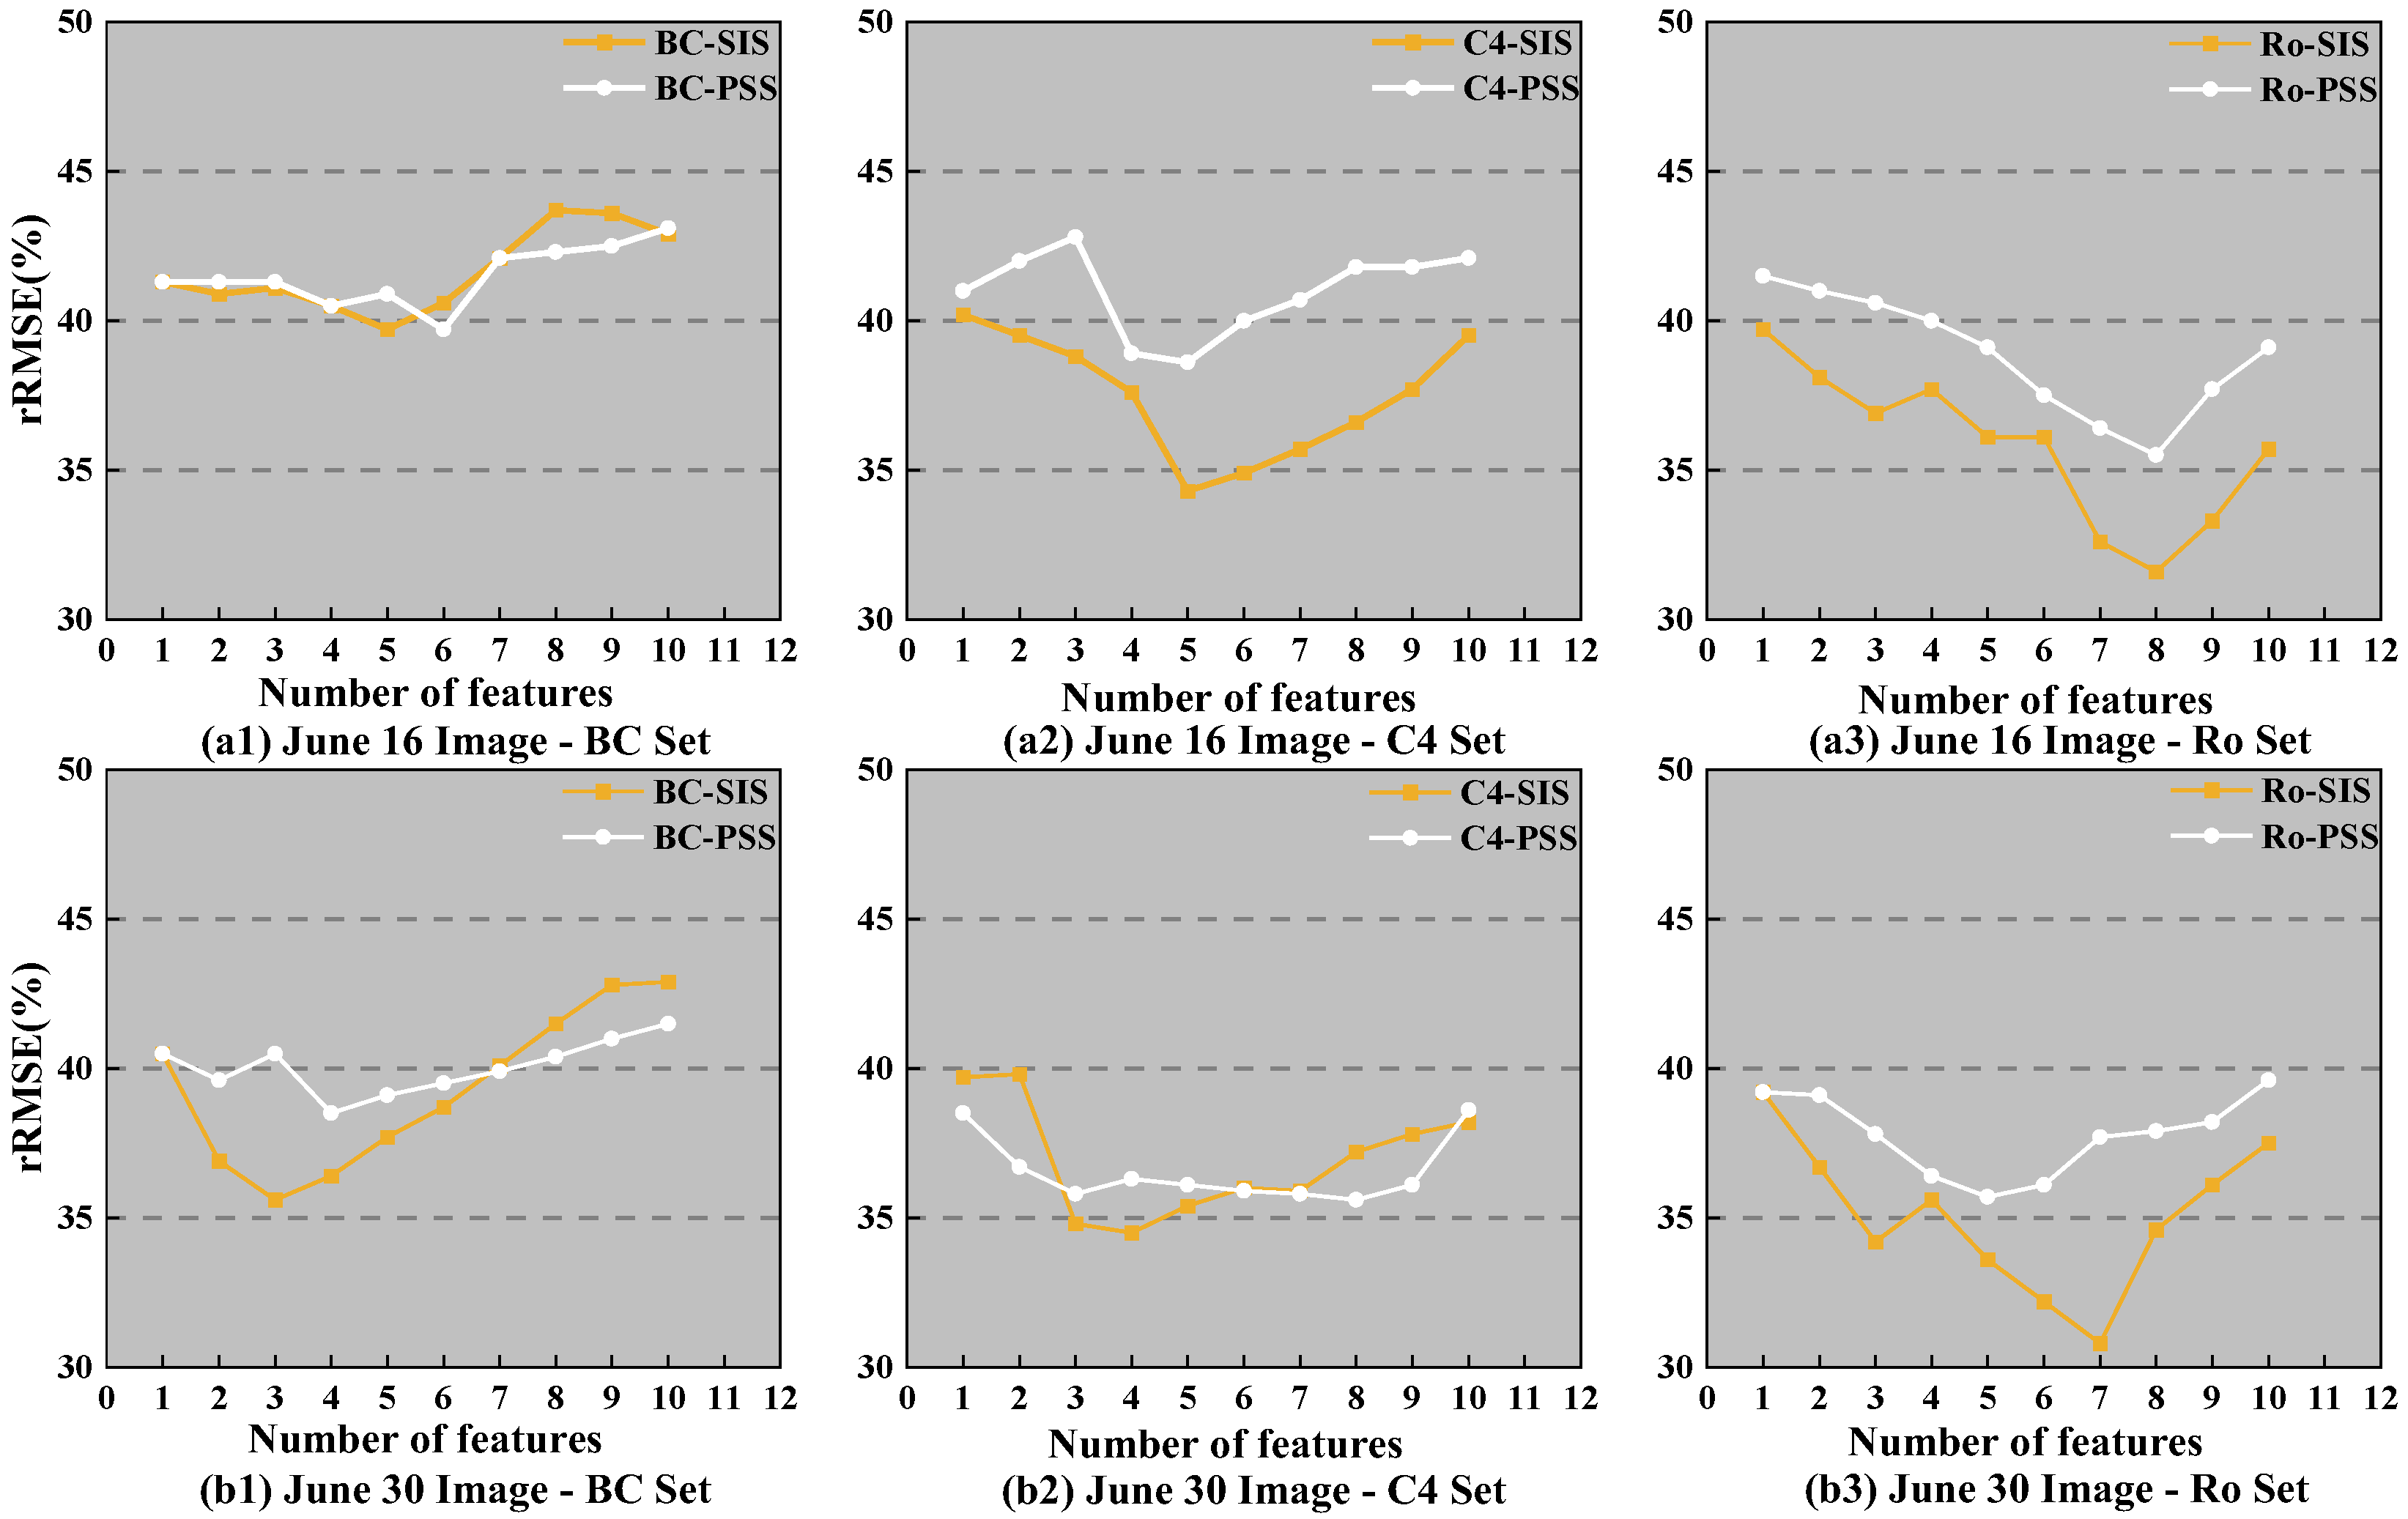
In this study, the maximum number of optimal feature sets was ten for reducing the amount of computation for mapping forest AGB. Figure 9 illustrated that the rRMSE values varied with the number of optimal feature sets with various feature selection methods for two acquired SAR images. The results showed that rRMSE values varied with the number of features in optimal feature sets, and the smallest rRMSE could be easily observed in each category using two feature selection methods. Furthermore, the rRMSE using the optimal feature set by the proposed SIS feature selection method is significantly lower than that by the PSS feature selection method. It is confirmed that the proposed SIS feature selection method is more suitable for mapping forest AGB than the PSS feature selection method.

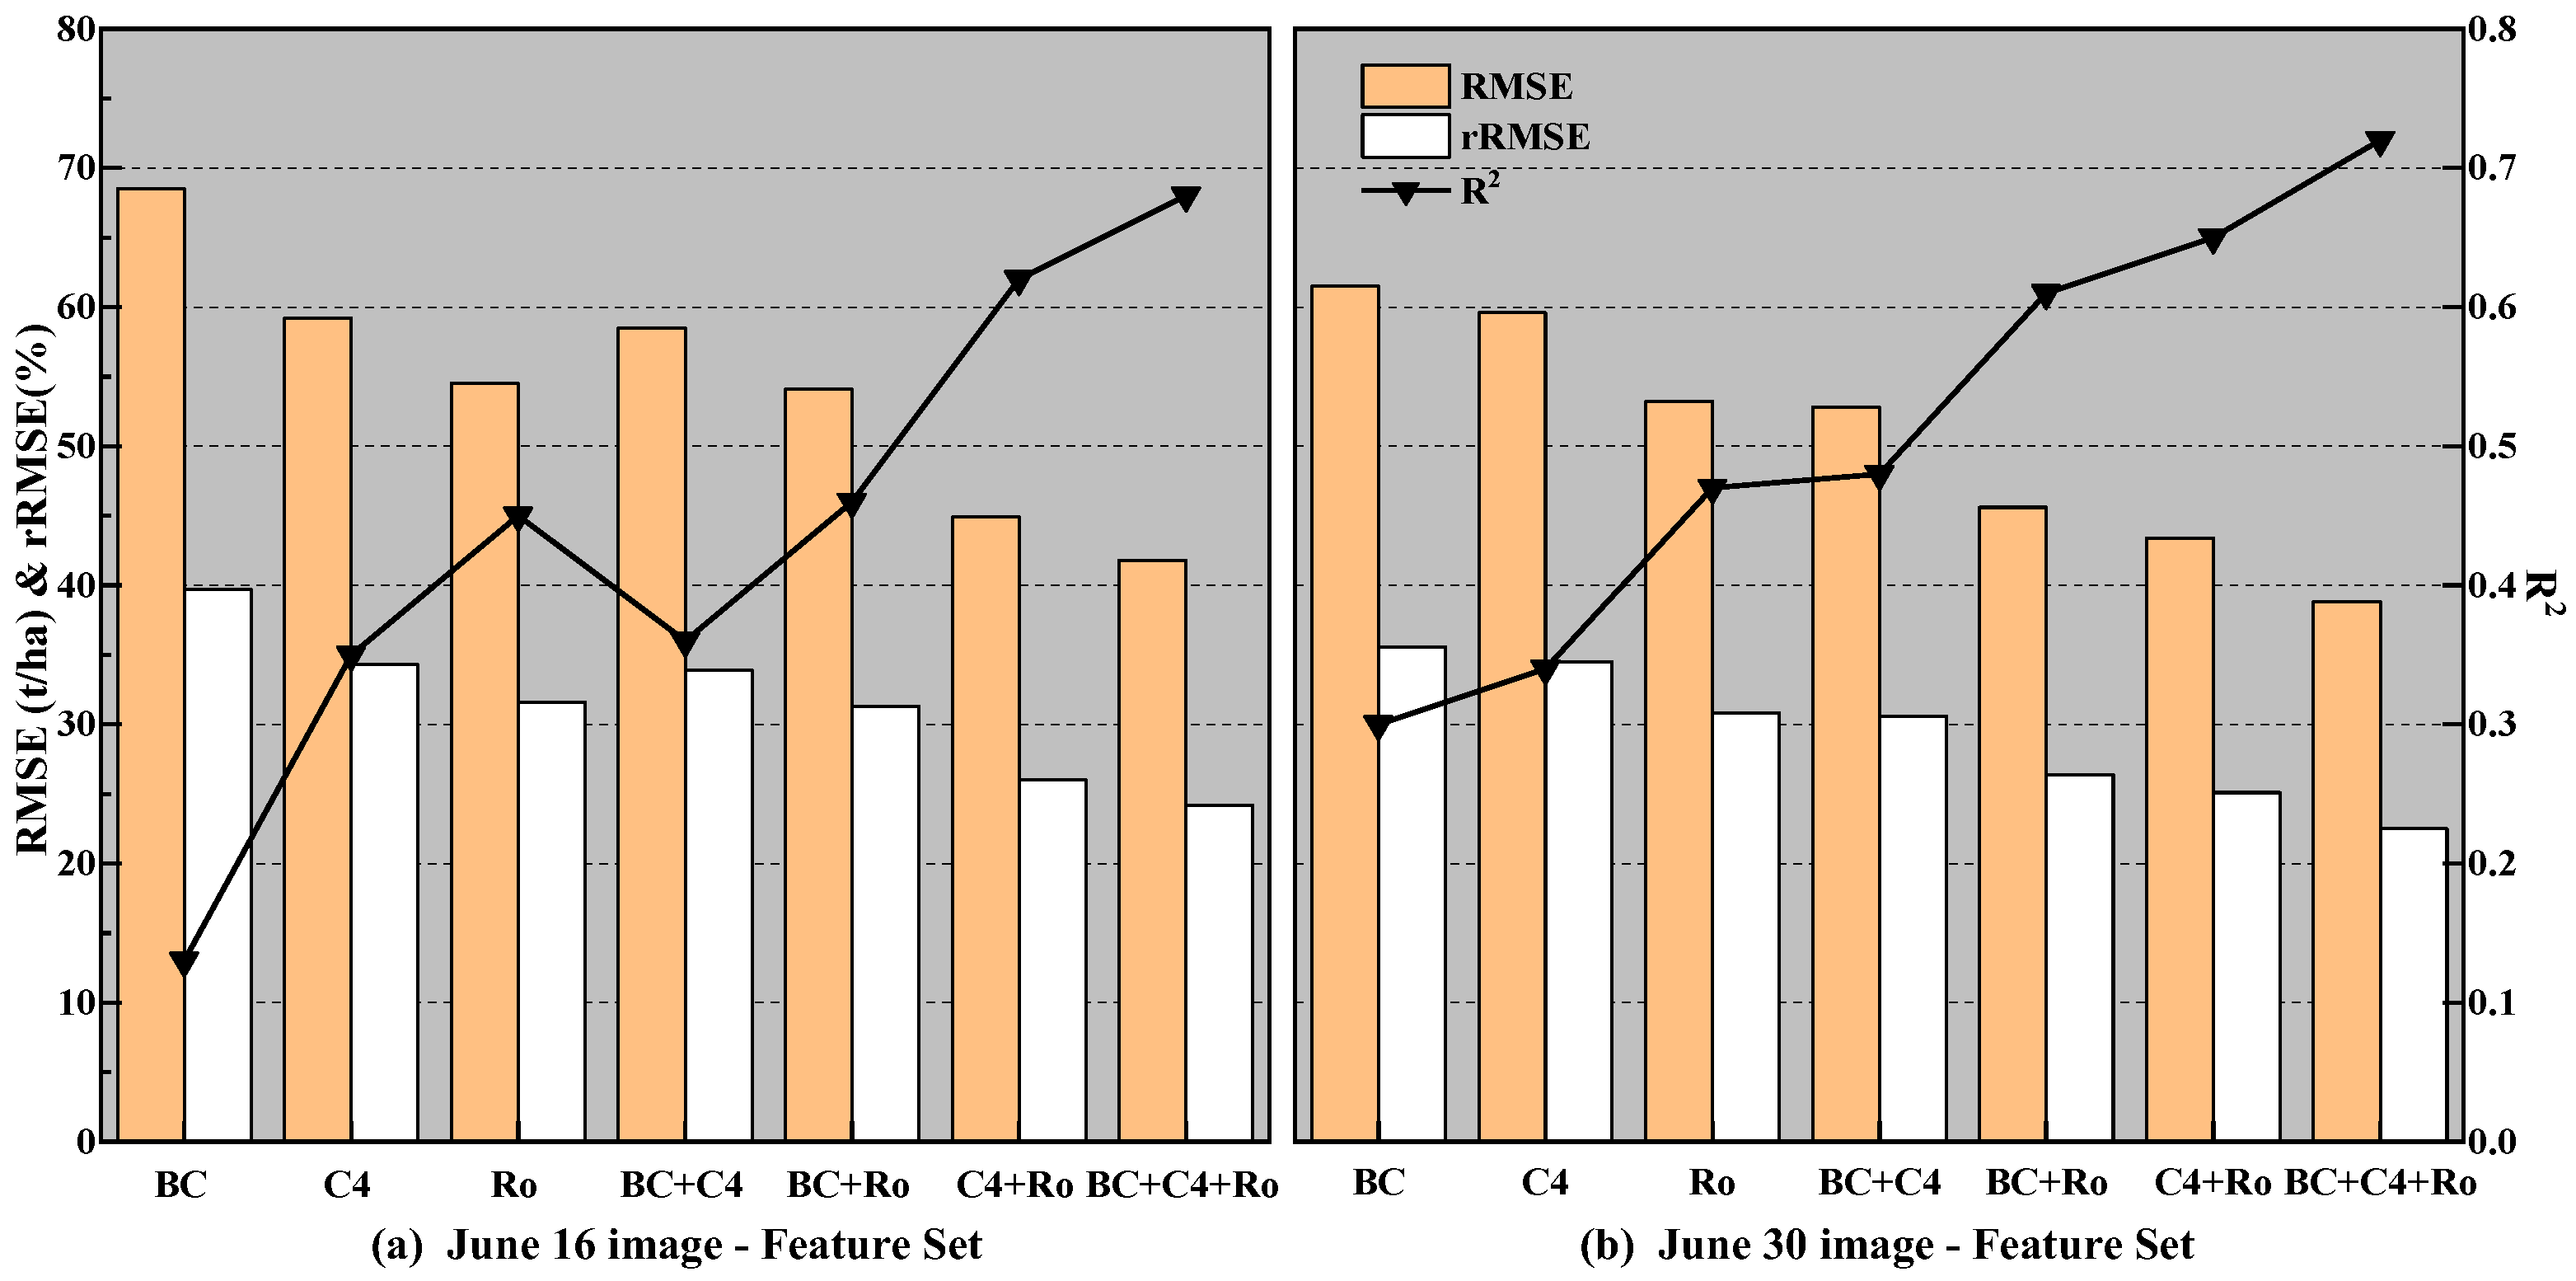
4.4. Mapping Forest AGB Using Various Types of Feature Sets

To evaluate the potential of optimal feature sets, several models are widely applied to invert forest AGB. In this study, widely used MLR was employed to estimate the forest AGB for reducing the gaps induced by various models. After obtaining the optimal feature sets, forest AGB was estimated by MLR using various types of features. Three accuracy indices (R2, RMSE, and rRMSE) extracted from the LOOCV method were applied to evaluate the performance of various optimal feature sets and the results were listed in Table 5.
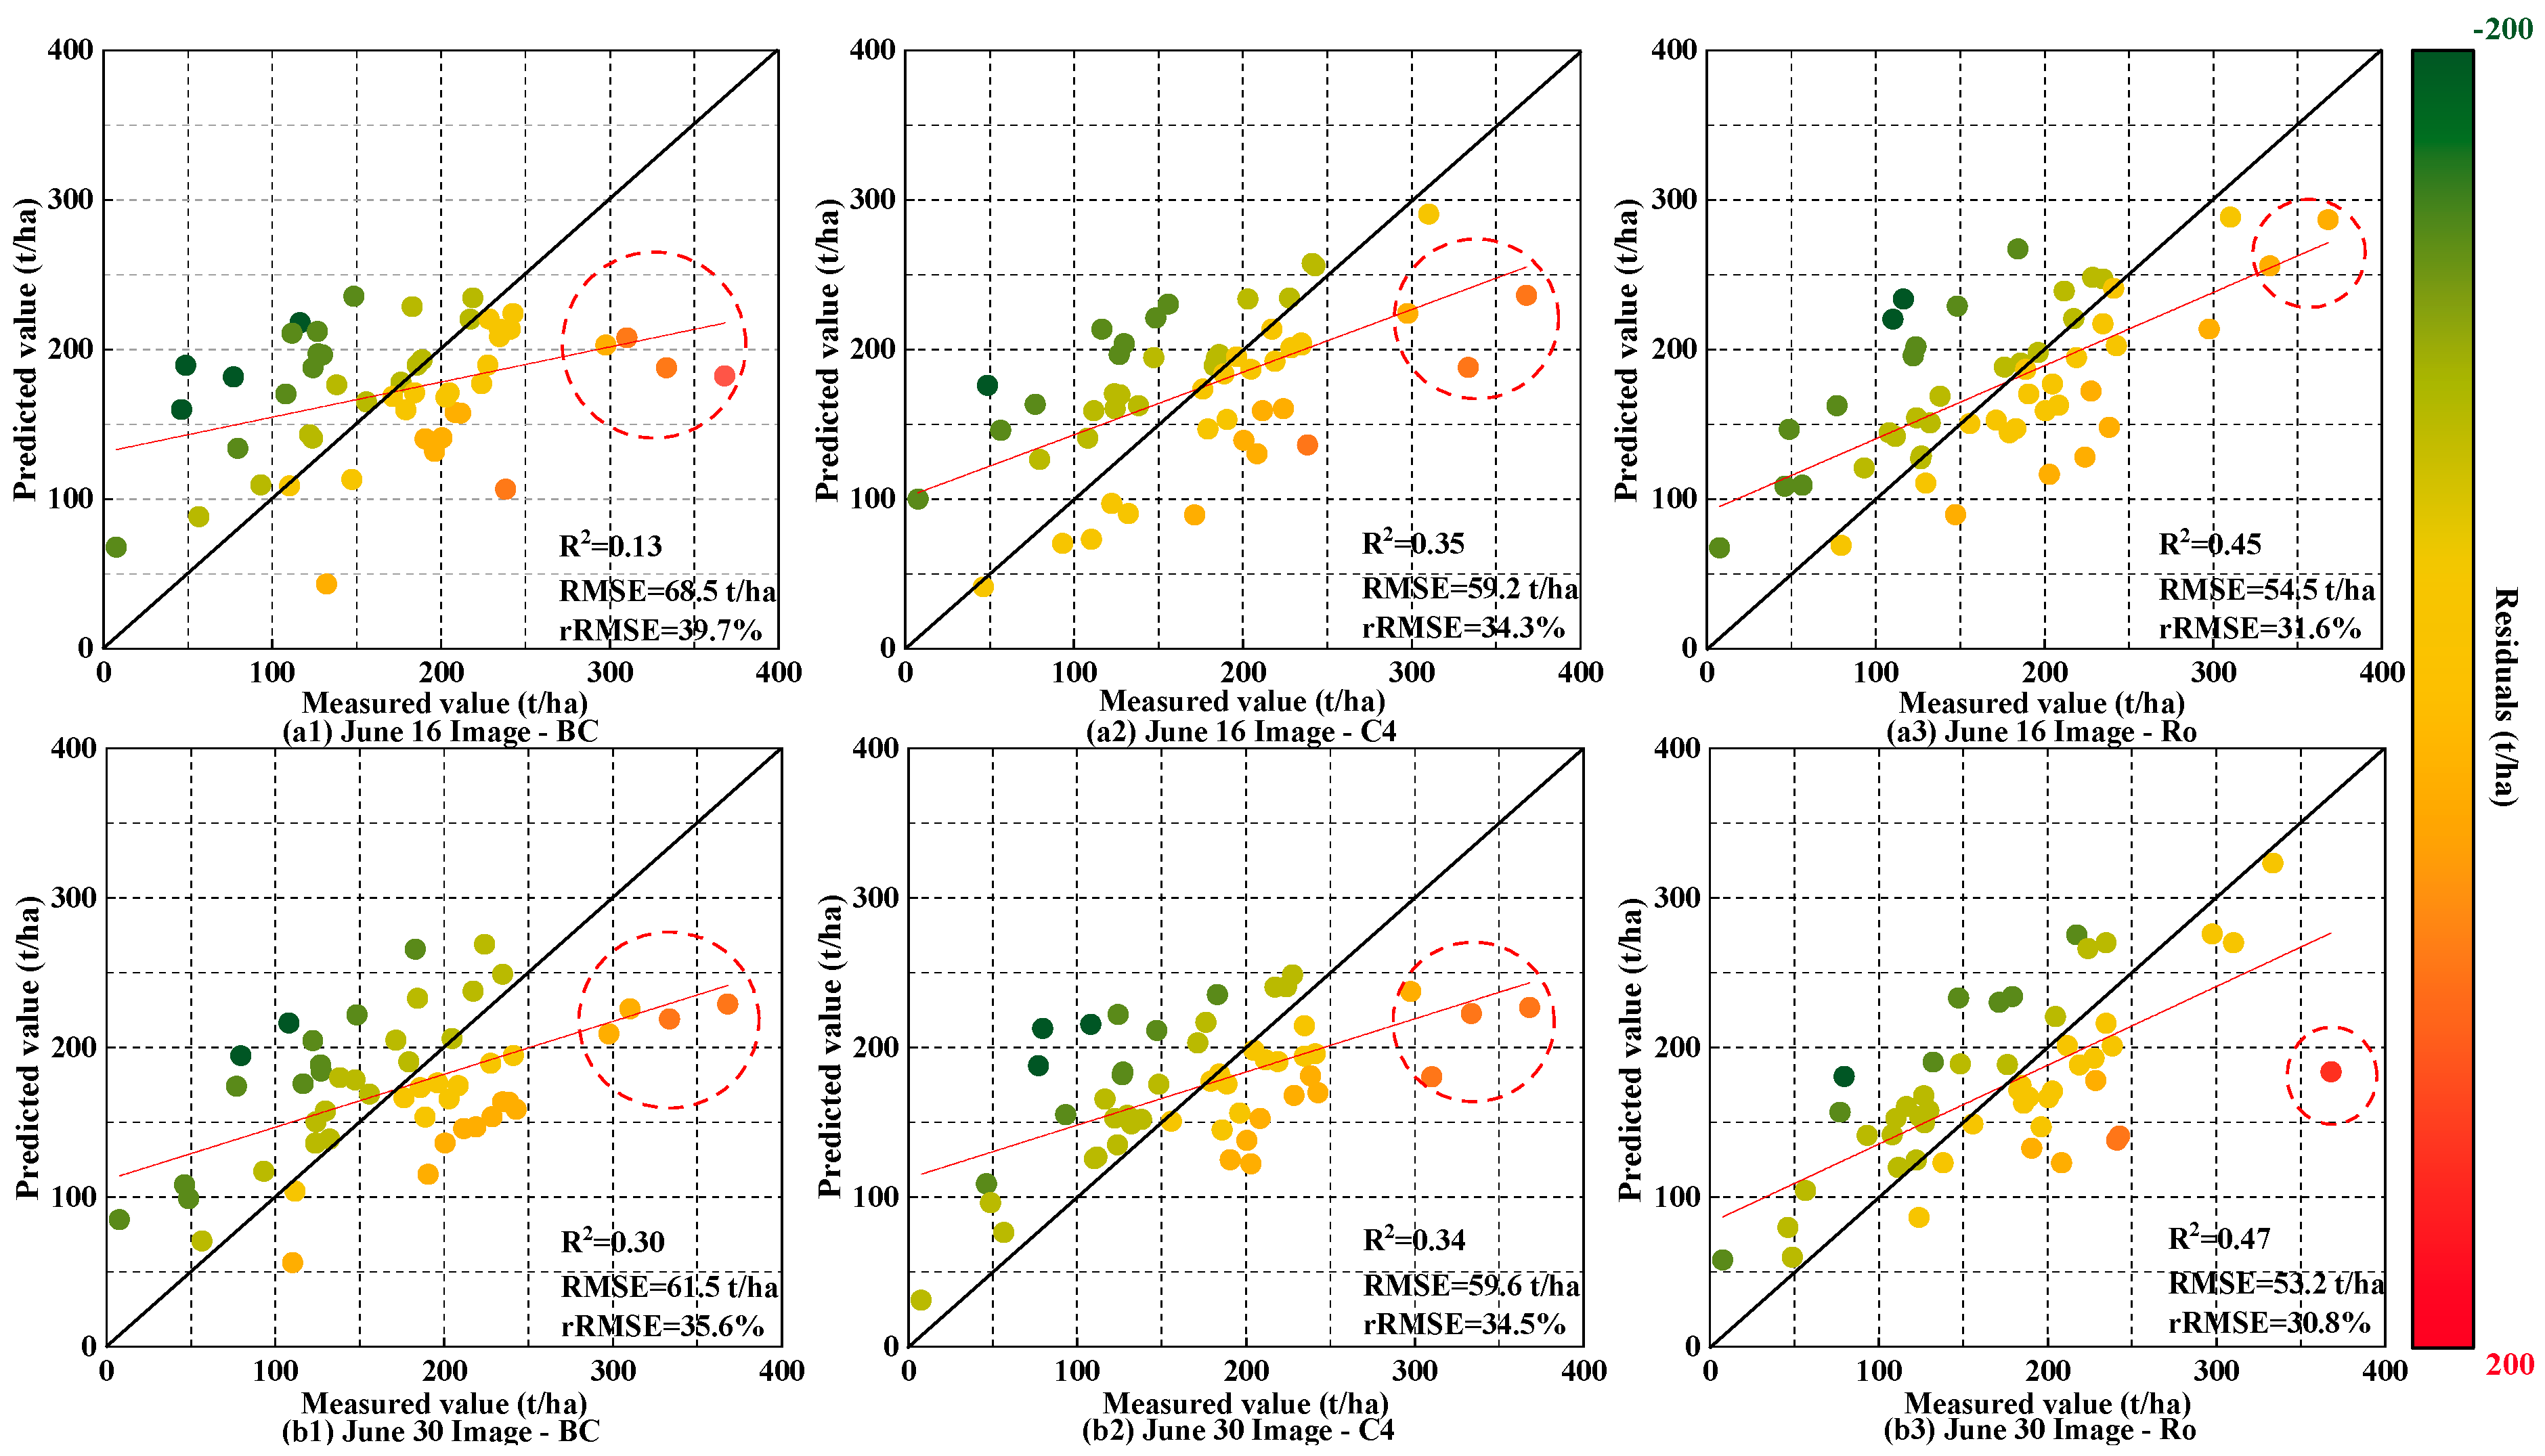
The results showed that the accuracy of estimating forest AGB is obviously improved by the proposed feature selection method. Using optimal feature sets obtained by SIS, the rRMSE values between predicted and ground-measured AGB ranged from 31.6% to 39.7% for images acquired on 16 June, and from 30.8% to 35.6% for images acquired on 30 June, respectively. For two images, the values of R2 using SIS (ranging from 0.13 to 0.47) are significantly larger than that using PSS (ranging from 0.13 to 0.34). Moreover, within three feature categories, the highest accuracy of results is obtained from the Ro feature set with the SIS method. It is demonstrated that features based on the theory of rotational domain polarimetric have more capability to map forest AGB.
For BC feature sets and C4 feature sets, over-estimated (Green in Figure 10) and under-estimated samples (Red in Figure 11) mainly focused on young and mature or over-mature forests, respectively. Thereby, the saturation phenomenon frequently occurs at the level of 250 t/ha. For the Ro feature set, the errors between predicted and ground-measured AGB are obviously decreased, and saturation levels are delayed (Figure 10(a3,b3)). The results also confirmed that the rotated polarimetric feature set is more sensitive with forest AGB than other feature sets.

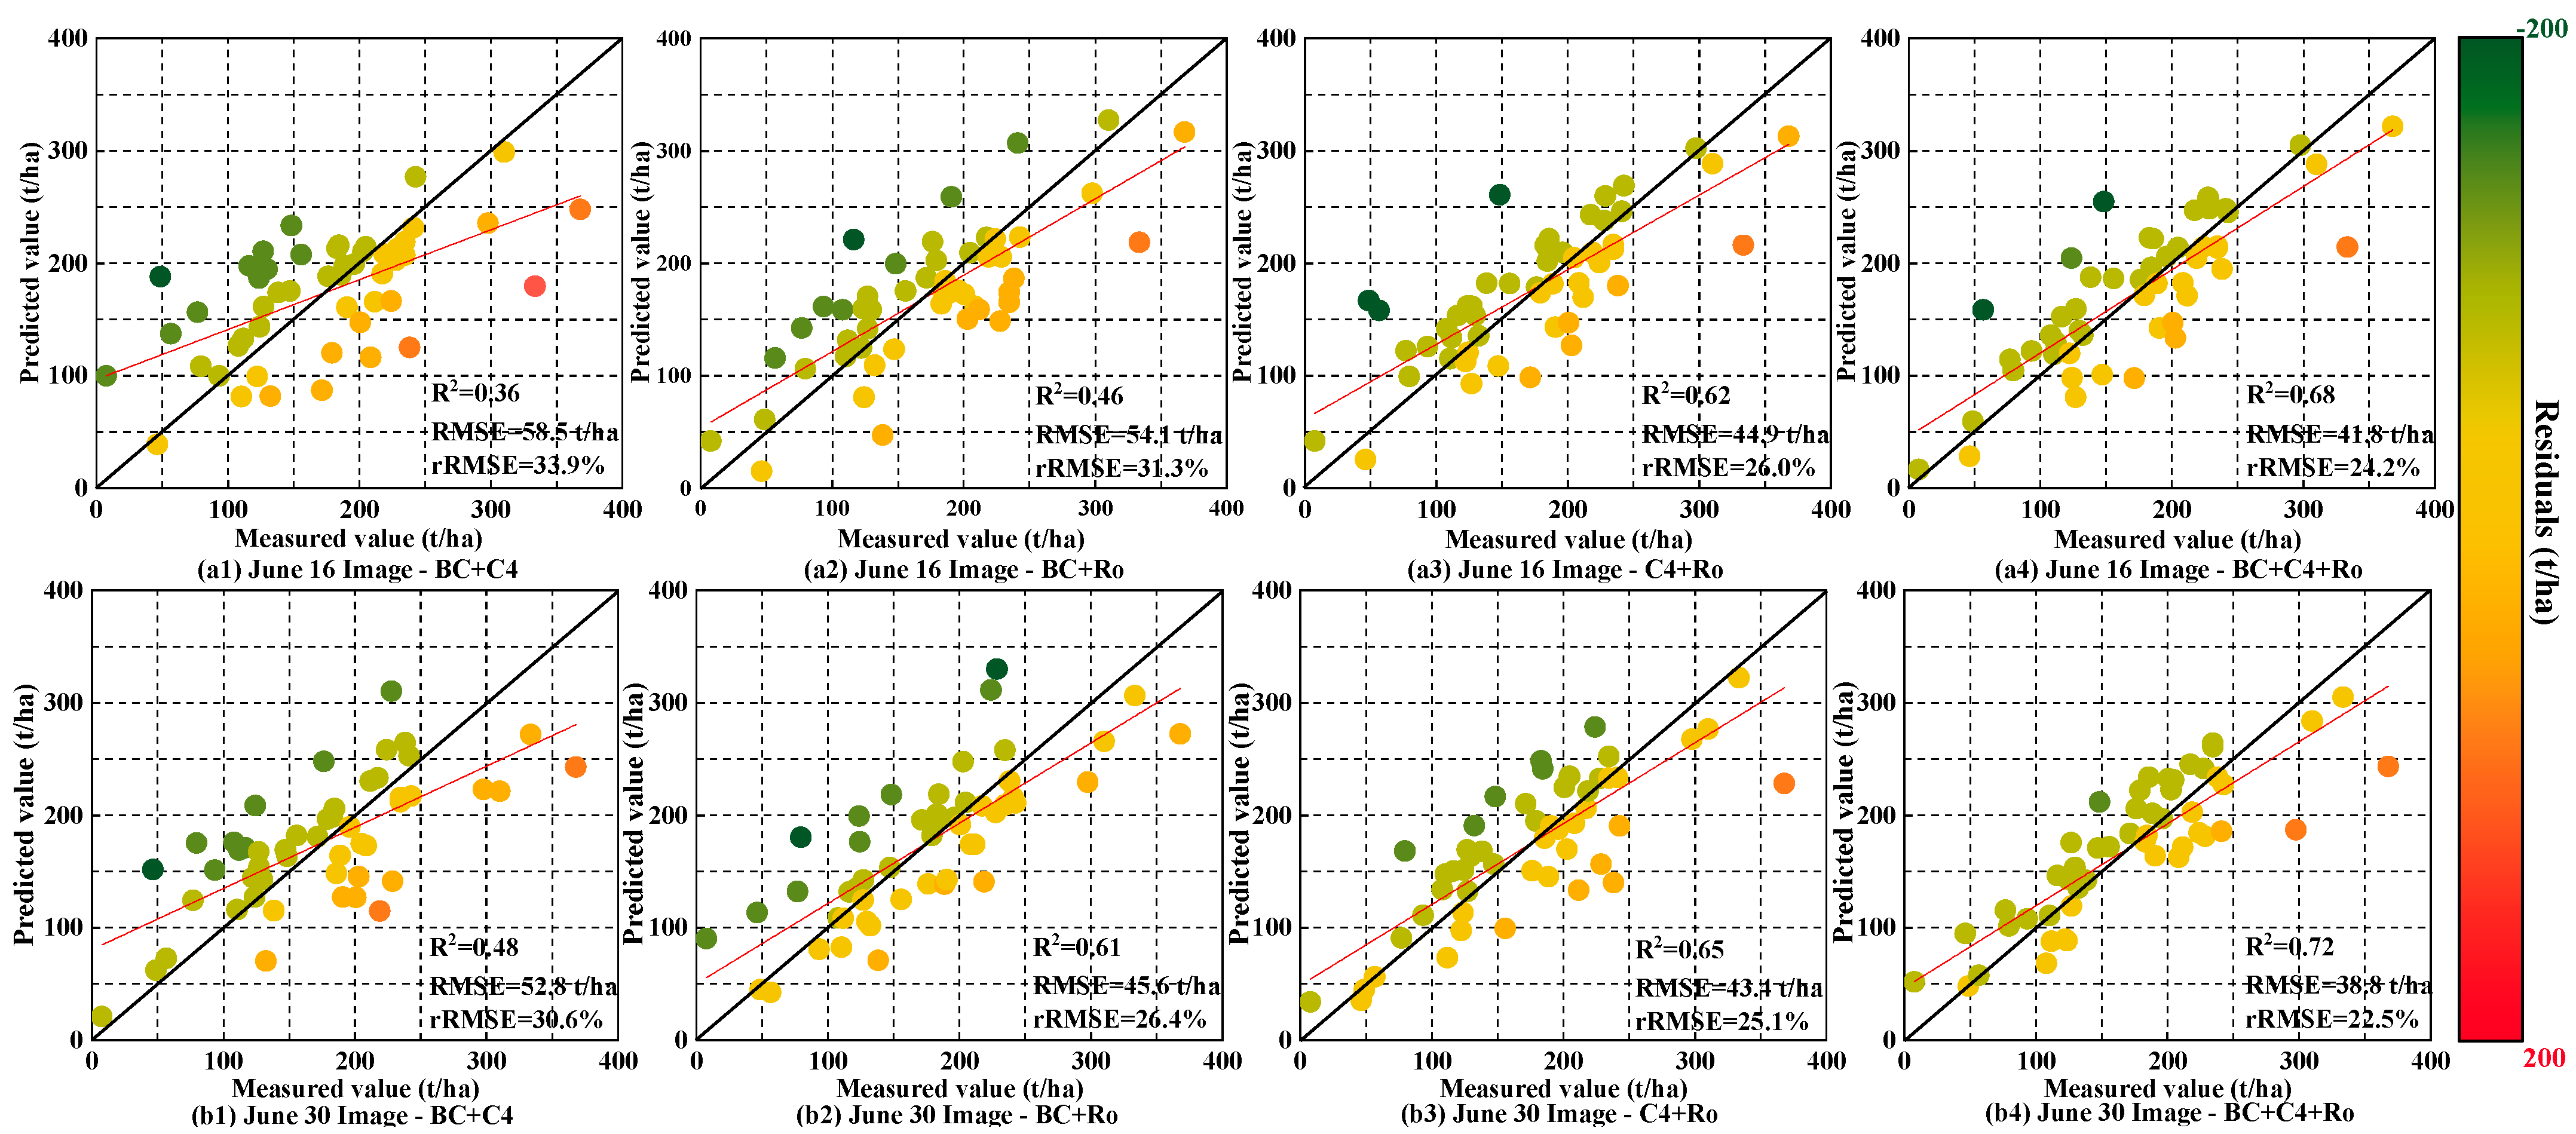
4.5. Results of Mapped Forest AGB with Combined Feature Sets

To further improve the accuracy of mapping forest AGB, several combined feature sets with different strategies were employed to obtain estimated AGB. In this study, four combined feature sets were formed with three categories of features, including BC + C4, BC + Ro, C4 + Ro, and BC + C4 + Ro. The forest AGBs were inverted using MLR and each combined feature set, and the results of the estimated forest AGB are listed in Table 6.
Compared with the results in Table 5, the accuracy of mapped forest AGB using combined feature sets is obviously higher than that using single feature set. The rRMSE values ranged from 24.2% to 33.9% for images acquired on 16 June, and from 22.5% to 30.6% for images acquired on 30 June, respectively, and the best result was obtained by BC + C4 + Ro for two images. To further analyze the mapped forest AGB, scatterplots between predicted and ground-measured AGB are shown in Figure 11 and errors between predicted and ground-measured AGB are indicated by various colors.
Figure 11. Scatterplots between predicted and ground-measured AGB using combined feature sets.
Remotesensing 15 01519 g011
It was found that the ranges of errors were decreased after using combined feature sets, and the number of samples with over-estimated or under-estimated results was obviously reduced, especially for the mapped forest AGB by BC + C4 + Ro in two images (Figure 11(a4,b4)). 
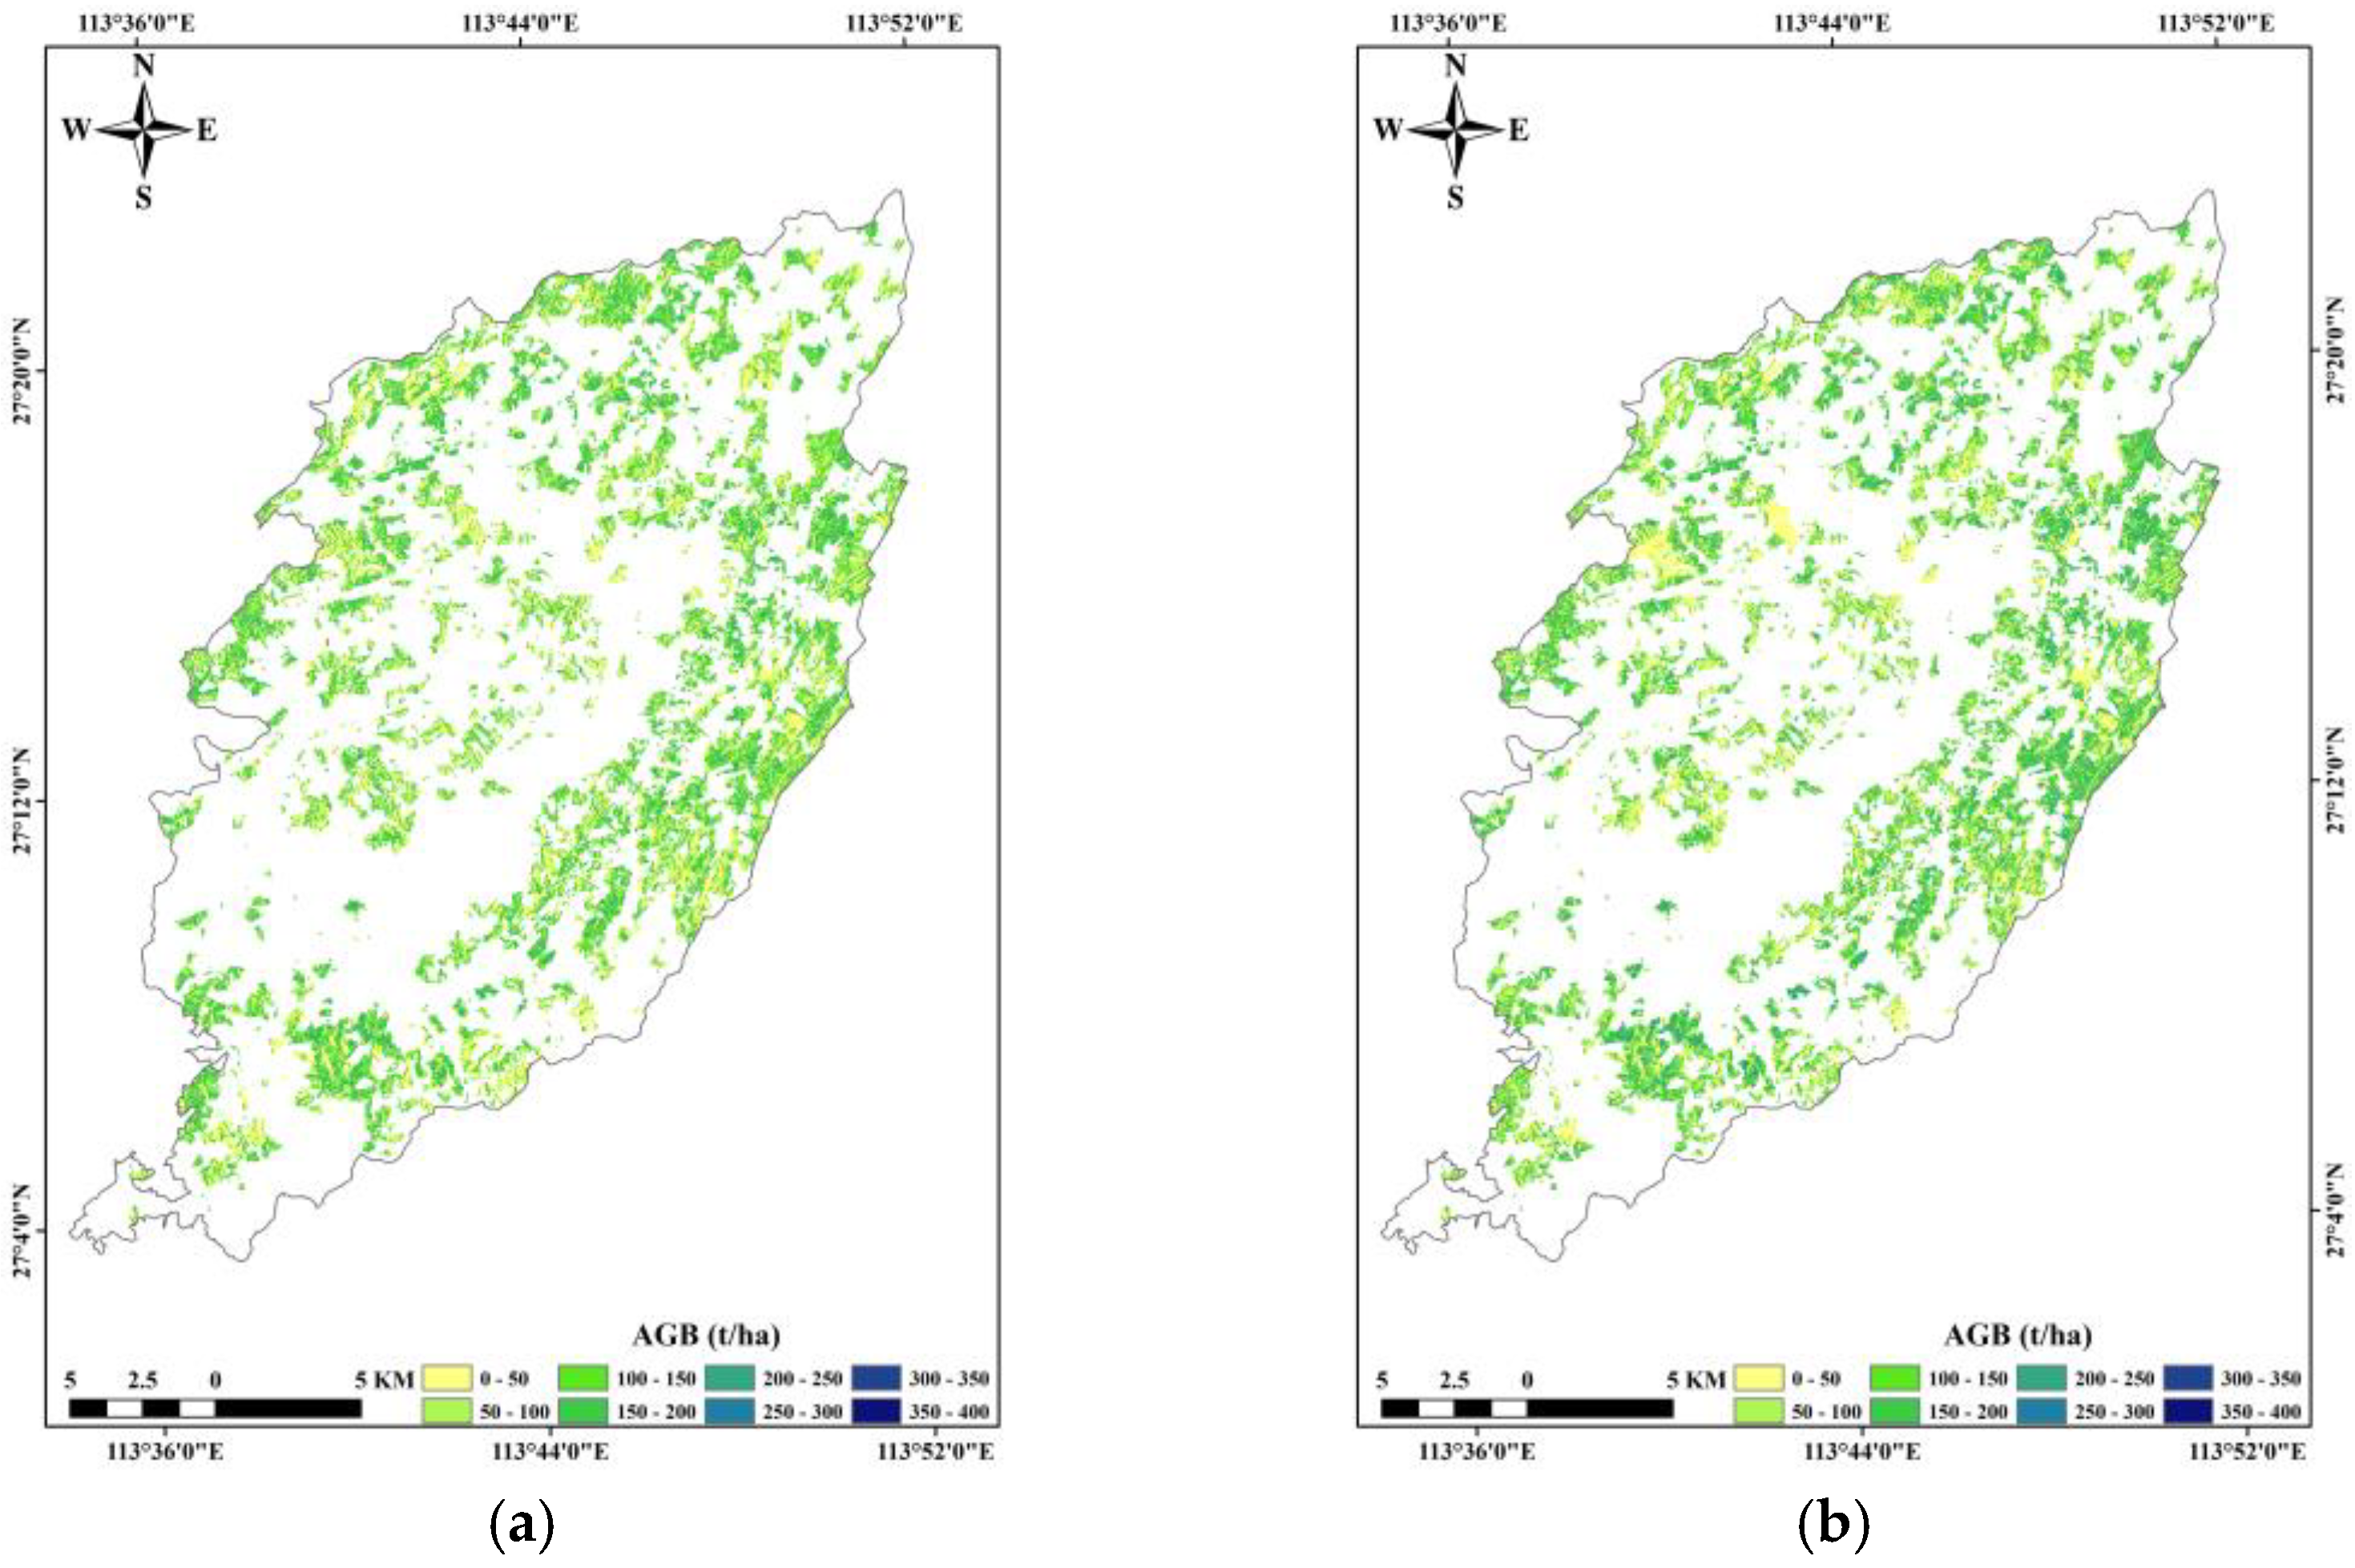
Figure 11 also illustrates that the saturation levels were alleviated to a large extent after using combined feature sets. It is inferred that different types of features extracted from quad-polarimetric SAR images have a better compensation effect and the accuracy of mapped forest AGB is significantly improved. Ultimately, the maps of forest AGB in two images were generated using MLR and combined feature sets (BC + C4 + Ro), and the results of mapped forest AGB are shown in Figure 12. The results showed that mapped forest AGB ranged from 0 to 384.8 t/ha for images acquired on 16 June, and from 0 to 371.2 for images acquired on 30 June, respectively.

5. Discussion

5.1. Sensitivity between Forest Parameters and Polarimetric Features

Normally, polarimetric features that are highly sensitive to forest parameters can be used to accurately map forest AGB. Widely used features extracted from quad-polarimetric SAR images mainly include backscattering coefficients, scattering components by various polarimetric decomposition theories, and coherence of SAR interferometry (InSAR). The first two types of polarimetric features are frequently applied to the forest AGB. The previous results demonstrated that the Pearson correlation between BC features and AGB mainly ranged from 0.2 to 0.3, and scattering components by polarimetric decomposition theory have more sensitivity with forest parameters than backscattering coefficients and other derived features [13,21]. In this study, backscattering coefficients and the four-component decomposition method proposed by Yamaguchi were extracted from quad-polarimetric ALOS SAR images, and the results illustrated that the intensities of Dbl and Vol are more sensitive than other extracted features. Basically, the values of Pearson correlation between forest parameters and these features (Figure 6) are consistent with previous results.
Furthermore, different from these mentioned features, rotated polarimetric features (oscillation parameters and polarimetric coherence features after rotation) were extracted from a new perspective based on uniform polarimetric matrix rotation theory. Essentially, these rotation polarimetric features are directly related to the polarimetric scattering matrix (S2), polarimetric coherence matrix ( T 3 ), and rotation angle (θ) ranging from −π to π. Recently, the rotation polarimetric features were proposed and applied to vegetation classification with L-band airborne SAR images [32]. However, unlike polarimetric decomposition features, it is very difficult to directly interpret the relationships between rotation polarimetric features and polarimetric forest parameters.
In this study, two criteria (Pearson correlation and SI) were employed to evaluate the sensitivity with forest parameters, and the Pearson correlation between these involved features and forest parameters (average DBH (D), forest average height (H), and forest stand average crown width (G)) are shown in Figure 6. The results demonstrated that the rotation polarimetric features have higher values of Pearson correlations than traditional features, especially for oscillation parameters. It was also found that the values of SI derived from oscillation parameters are significantly larger than that from backscattering coefficients with different polarizations and polarimetric decomposition features (Figure 8). Furthermore, the results also demonstrated that the rotation polarimetric features have higher saturation levels than these traditional features. Thereby, using employed evaluation indices, it is confirmed that the rotation polarimetric features have more sensitivity with forest parameters and more capability for mapping forest AGB. Nonetheless, it is still uncommon to apply rotational domain polarization features to forest AGB estimates. The research objective for this study was a Chinese fir plantation within the confines of a forest farm; however, natural forests, other species, or bigger regions still require additional verification.

5.2. Feature Selection and Compensation Effect

Generally, the accuracy of mapping forest AGB is severely dependent on the optimal feature set related to multi-variate models [40,47], and the optimal feature set is often obtained by feature evaluation criteria and feature selection strategies [37]. Normally, several criteria were widely accepted to evaluate alternative features based on the linear or nonlinear relationships between features and forest AGB. However, it is rather difficult to evaluate the relationships fully and accurately between features and forest AGB by these criteria. Especially, the saturation phenomenon frequently occurred in mapping forest parameters and is almost rarely considered in traditional feature evaluation criteria.
In a previous study, the sensitivity index (SI) indirectly related to saturation and correlation problems, has been proposed to express the relationship between polarimetric characteristics and AGB [42]). Figure 13 illustrated the relationships between the SI and saturation levels with different features, SI has the potential to express the sensitivity and saturation levels. In this study, the SI of features was proposed to be regarded as a criterion and further study was performed to evaluate the capability of feature selection using the proposed criterion. Then, two feature selection methods (PSS and SIS) were applied to obtain optimal feature sets. The results of feature selection and mapped forest AGB (in Figure 9 and Table 5) also demonstrated that the accuracy of mapped AGB by the SIS method is higher than that of the traditional PSS method.
Furthermore, each type of feature has its own physical meaning related to targets and PolSAR images, and the capability of mapping forest AGB depends on the sensitivity between selected features and forest parameters. In this study, several types of polarimetric features were extracted from quad-polarimetric SAR images based on various theories. For single-type and combined feature sets within different types, the R2 and rRMSE of all results were illustrated in Figure 14.
The results illustrated that accuracy indices varied with different types of features. It is inferred that the sensitivity of rotated polarimetric features is significantly higher than other features. After using combined feature sets with various strategies, the accuracy of mapping forest AGB is improved, and the best results were obtained using a combined feature set with three types. It is confirmed that different types of features extracted from quad-polarimetric SAR images have a better compensation effect and the accuracy of mapped forest AGB is significantly improved. Instead of the more well-known and sophisticated machine learning model, deep learning model, or other non-parametric models, only the most widely used and straightforward multiple linear regression model was utilized in this experiment in order to compare the two feature selection approaches. The methodology outlined in this research still needs validation using other regression models.

6. Conclusions

In this study, L-band quad-polarimetric ALOS PALSAR-2 images were acquired to interpret the response of polarimetric features related to forests in the rotation domain, and the sensitivity of several rotated polarimetric and other traditional features (BC and C4) were evaluated by the Pearson correlation coefficient, sensitivity index (SI), and saturation levels. After that, a proposed feature selection method based on SI was applied to obtain optimal feature sets from several types of alternative features and the forest AGB with various feature combinations was inverted by these optimal feature sets and MLR. The results confirmed that the rotated polarimetric features extracted from the rotational domain have higher sensitivity and saturation levels than other traditional features. It is also confirmed that the proposed SIS feature selection method is more suitable for mapping forest AGB than the PSS feature selection method, and the best result was obtained from the combination of three types of polarimetric features (BC + C4 + Ro). In the future, the study will be performed to interpret the response of various components extracted from polarimetric decomposition in the rotation domain and the sensitivity of these rotated components will be further evaluated.

Author Contributions

Conceptualization, J.L. and T.Z.; methodology, J.L. and T.Z.; software, H.L., J.L. and H.Z.; validation, H.L. and J.L.; formal analysis, T.Z. and Z.L.; investigation, H.L., J.L., Z.L., Z.Y. and T.Z.; resources, H.L., T.Z. and J.L.; data processing, T.Z., H.Z., Z.Y. and Z.L.; original draft, T.Z.; review and revision, H.L. and J.L.; final editing: J.L.; visualization, J.L. and T.Z.; supervision, H.L. and J.L.; project administration, H.L. and J.L.; funding acquisition, H.L. and J.L. All authors have read and agreed to the published version of the manuscript.

Funding

This work was supported by National Natural Science Foundation of China (Project number: 42030112) and National Natural Science Foundation of China (Project number: 32171784) and Hunan Provincial Natural Science Foundation of China (Project number: 2021JJ31158).

Data Availability Statement

The data presented in this study are available on request from the corresponding author.

Conflicts of Interest

The authors declare no conflict of interest.

References

  1. Carnus, J.M.; Parrotta, J.; Brockerhoff, E.G.; Arbez, M.; Jactel, H.; Kremer, A.; Lamb, D.; O’Hara, K.; Walters, B. Planted forests and biodiversity. Soc. Am. For. 2006, 104, 65–77. [Google Scholar]
  2. Pan, Y.; Birdsey, R.A.; Phillips, O.L.; Jackson, R.B. The Structure, Distribution, and Biomass of the World’s Forests. Annu. Rev. Ecol. Evol. Syst. 2013, 44, 593. [Google Scholar] [CrossRef] [Green Version]
  3. Dengsheng, L.U. The potential and challenge of remote sensing-based biomass estimation. Int. J. Remote Sens. 2006, 27, 1297–1328. [Google Scholar]
  4. Lu, D.; Chen, Q.; Wang, G.; Liu, L.; Li, G.; Moran, E. A survey of remote sensing-based aboveground biomass estimation methods in forest ecosystems. Int. J. Remote Sens. 2016, 9, 63–105. [Google Scholar] [CrossRef]
  5. Koch, B. Status and future of laser scanning, synthetic aperture radar and hyperspectral remote sensing data for forest biomass assessment. ISPRS J. Photogramm. Remote Sens. 2010, 65, 581–590. [Google Scholar] [CrossRef]
  6. Saatchi, S.; Marlier, M.; Chazdon, R.L.; Clark, D.B.; Russell, A.E. Impact of spatial variability of tropical forest structure on radar estimation of aboveground biomass. Remote Sens. Environ. 2011, 115, 2836–2849. [Google Scholar] [CrossRef]
  7. Mandal, D.; Hosseini, M.; McNairn, H.; Kumar, V.; Bhattacharya, A.; Rao, Y.; Mitchell, S.; Robertson, L.D.; Davidson, A.; Dabrowska-Zielinska, K. An investigation of inversion methodologies to retrieve the leaf area index of corn from C-band SAR data. Int. J. Appl. Earth Obs. Geoinf. 2019, 82, 101893. [Google Scholar] [CrossRef]
  8. Mandal, D.; Kumar, V.; McNairn, H.; Bhattacharya, A.; Rao, Y. Joint estimation of Plant Area Index (PAI) and wet biomass in wheat and soybean from C-band polarimetric SAR data. Int. J. Appl. Earth Obs. Geoinf. 2019, 79, 24–34. [Google Scholar] [CrossRef]
  9. Shuai, G.; Zhang, J.; Basso, B.; Pan, Y.; Zhu, X.; Zhu, S.; Liu, H. Multi-temporal RADARSAT-2 polarimetric SAR for maize mapping supported by segmentations from high-resolution optical image. Int. J. Appl. Earth Obs. Geoinf. 2019, 74, 1–15. [Google Scholar] [CrossRef]
  10. Hamdan, O.; Aziz, H.K.; Hasmadi, I.M. L-band ALOS PALSAR for biomass estimation of Matang Mangroves, Malaysia. Remote Sens. Environ. 2014, 155, 69–78. [Google Scholar] [CrossRef]
  11. Thiel, C.; Schmullius, C. The potential of ALOS PALSAR backscatter and InSAR coherence for forest growing stock volume estimation in Central Siberia. Remote Sens. Environ. 2016, 173, 258–273. [Google Scholar] [CrossRef]
  12. Antropov, O.; Rauste, Y.; Häme, T.; Praks, J. Polarimetric ALOS PALSAR time series in mapping biomass of boreal forests. Remote Sens. 2017, 9, 999. [Google Scholar] [CrossRef] [Green Version]
  13. Forkuor, G.; Zoungrana, J.-B.B.; Dimobe, K.; Ouattara, B.; Vadrevu, K.P.; Tondoh, J.E. Above-ground biomass mapping in West African dryland forest using Sentinel-1 and 2 datasets-A case study. Remote Sens. Environ. 2020, 236, 111496. [Google Scholar] [CrossRef]
  14. Liao, Z.; He, B.; Quan, X. Potential of texture from SAR tomographic images for forest aboveground biomass estimation. Int. J. Appl. Earth Obs. Geoinf. 2020, 88, 102049. [Google Scholar] [CrossRef]
  15. Long, J.; Lin, H.; Wang, G.; Sun, H.; Yan, E. Mapping growing stem volume of chinese fir plantation using a saturation-based multivariate method and Quad-polarimetric SAR images. Remote Sens. 2019, 11, 1872. [Google Scholar] [CrossRef] [Green Version]
  16. Nesha, M.K.; Hussin, Y.A.; van Leeuwen, L.M.; Sulistioadi, Y.B. Modeling and mapping aboveground biomass of the restored mangroves using ALOS-2 PALSAR-2 in East Kalimantan, Indonesia. Int. J. Appl. Earth Obs. Geoinf. 2020, 91, 102158. [Google Scholar] [CrossRef]
  17. Peregon, A.; Yamagata, Y. The use of ALOS/PALSAR backscatter to estimate above-ground forest biomass: A case study in Western Siberia. Remote Sens. Environ. 2013, 137, 139–146. [Google Scholar] [CrossRef]
  18. Santoro, M.; Eriksson, L.; Askne, J.; Schmullius, C. Assessment of stand-wise stem volume retrieval in boreal forest from JERS-1 L-band SAR backscatter. Int. J. Remote Sens. 2006, 27, 3425–3454. [Google Scholar] [CrossRef]
  19. Suzuki, R.; Kim, Y.; Ishii, R. Sensitivity of the backscatter intensity of ALOS/PALSAR to the above-ground biomass and other biophysical parameters of boreal forest in Alaska. Polar Sci. 2013, 7, 100–112. [Google Scholar] [CrossRef] [Green Version]
  20. Hosseini, S.; Garestier, F. Pol-InSAR sensitivity to hemi-boreal forest structure at L-and P-bands. Int. J. Appl. Earth Obs. Geoinf. 2021, 94, 102213. [Google Scholar] [CrossRef]
  21. Li, X.; Ye, Z.; Long, J.; Zheng, H.; Lin, H. Inversion of Coniferous Forest Stock Volume Based on Backscatter and InSAR Coherence Factors of Sentinel-1 Hyper-Temporal Images and Spectral Variables of Landsat 8 OLI. Remote Sens. 2022, 14, 2754. [Google Scholar] [CrossRef]
  22. Liao, Z.; He, B.; Shi, Y. Improved forest biomass estimation based on P-band repeat-pass PolInSAR data across different forest sites. Int. J. Appl. Earth Obs. Geoinf. 2022, 115, 103088. [Google Scholar] [CrossRef]
  23. Freeman, A.; Durden, S.L. A three-component scattering model for polarimetric SAR data. IEEE Trans. Geosci. Remote Sens. 1998, 36, 963–973. [Google Scholar] [CrossRef] [Green Version]
  24. Krogager, E. New decomposition of the radar target scattering matrix. Electron. Lett. 1990, 18, 1525–1527. [Google Scholar] [CrossRef]
  25. Singh, G.; Yamaguchi, Y. Model-based six-component scattering matrix power decomposition. IEEE Trans. Geosci. Remote Sens. 2018, 56, 5687–5704. [Google Scholar] [CrossRef]
  26. Singh, G.; Malik, R.; Mohanty, S.; Rathore, V.S.; Yamada, K.; Umemura, M.; Yamaguchi, Y. Seven-component scattering power decomposition of POLSAR coherency matrix. IEEE Trans. Geosci. Remote Sens. 2019, 57, 8371–8382. [Google Scholar] [CrossRef]
  27. Singh, G.; Yamaguchi, Y.; Park, S.-E. General four-component scattering power decomposition with unitary transformation of coherency matrix. IEEE Trans. Geosci. Remote Sens. 2012, 51, 3014–3022. [Google Scholar] [CrossRef]
  28. Yamaguchi, Y.; Moriyama, T.; Ishido, M.; Yamada, H. Four-component scattering model for polarimetric SAR image decomposition. IEEE Trans. Geosci. Remote Sens. 2005, 43, 1699–1706. [Google Scholar] [CrossRef]
  29. Yamaguchi, Y.; Yajima, Y.; Yamada, H. A four-component decomposition of POLSAR images based on the coherency matrix. IEEE Geosci. Remote Sens. Lett. 2006, 3, 292–296. [Google Scholar] [CrossRef]
  30. Chen, S.-W.; Wang, X.-S.; Sato, M. Uniform polarimetric matrix rotation theory and its applications. IEEE Trans. Geosci. Remote Sens. 2013, 52, 4756–4770. [Google Scholar] [CrossRef]
  31. Chen, S.W.; Wang, X.S.; Xiao, S.P. PolSAR target scattering interpretation in rotation domain: Theory and application. J. Eng. 2019, 2019, 7649–7652. [Google Scholar] [CrossRef]
  32. Tao, C.; Chen, S.; Li, Y.; Xiao, S. PolSAR land cover classification based on roll-invariant and selected hidden polarimetric features in the rotation domain. Remote Sens. 2017, 9, 660. [Google Scholar] [CrossRef] [Green Version]
  33. Tao, C.-S.; Chen, S.-W.; Li, Y.-Z.; Xiao, S.-P. Polsar Land Cover Classification Based on Hidden Polarimetric Features in Rotation Domain and Svm Classifier. ISPRS Ann. Photogramm. Remote Sens. Spat. Inf. Sci. 2017, 4, 485. [Google Scholar] [CrossRef] [Green Version]
  34. Periasamy, S. Significance of dual polarimetric synthetic aperture radar in biomass retrieval: An attempt on Sentinel-1. Remote Sens. Environ. 2018, 217, 537–549. [Google Scholar] [CrossRef]
  35. Bouvet, A.; Mermoz, S.; Le Toan, T.; Villard, L.; Mathieu, R.; Naidoo, L.; Asner, G.P. An above-ground biomass map of African savannahs and woodlands at 25 m resolution derived from ALOS PALSAR. Remote Sens. Environ. 2018, 206, 156–173. [Google Scholar] [CrossRef]
  36. Li, X.; Zhang, M.; Long, J.; Lin, H. A Novel Method for Estimating Spatial Distribution of Forest Above-Ground Biomass Based on Multispectral Fusion Data and Ensemble Learning Algorithm. Remote Sens. 2021, 13, 3910. [Google Scholar] [CrossRef]
  37. Fjab, C.; Mk, D.; Kmab, C.; Song, C.; Jlab, C.; Hua, S. Estimating the aboveground biomass of coniferous Forest in Northeast China using spectral variables, land surface temperature and soil moisture. Sci. Total Environ. 2021, 785, 147335. [Google Scholar]
  38. Liu, Z.; Ye, Z.; Xu, X.; Lin, H.; Zhang, T.; Long, J. Mapping Forest Stock Volume Based on Growth Characteristics of Crown Using Multi-Temporal Landsat 8 OLI and ZY-3 Stereo Images in Planted Eucalyptus Forest. Remote Sens. 2022, 14, 5082. [Google Scholar] [CrossRef]
  39. Pavlov, Y.L. Random Forests. Karelian Centre Russian. Acad. Sci. Petrozavodsk 1997, 45, 5–32. [Google Scholar]
  40. Xu, X.; Lin, H.; Liu, Z.; Ye, Z.; Li, X.; Long, J. A Combined Strategy of Improved Variable Selection and Ensemble Algorithm to Map the Growing Stem Volume of Planted Coniferous Forest. Remote Sens. 2021, 13, 4631. [Google Scholar] [CrossRef]
  41. Persson, H.J.; Jonzén, J.; Nilsson, M. Combining TanDEM-X and Sentinel-2 for large-area species-wise prediction of forest biomass and volume. Int. J. Appl. Earth Obs. Geoinf. 2021, 96, 102275. [Google Scholar] [CrossRef]
  42. Cartus, O.; Santoro, M. Exploring combinations of multi-temporal and multi-frequency radar backscatter observations to estimate above-ground biomass of tropical forest. Remote Sens. Environ. 2019, 232, 111313. [Google Scholar] [CrossRef]
  43. Zhang, H.; Zhu, J.; Wang, C.; Lin, H.; Long, J.; Zhao, L.; Fu, H.; Liu, Z. Forest Growing Stock Volume Estimation in Subtropical Mountain Areas Using PALSAR-2 L-Band PolSAR Data. Forests 2019, 10, 276. [Google Scholar] [CrossRef] [Green Version]
  44. Shimada, M.; Isoguchi, O.; Tadono, T.; Isono, K. PALSAR Radiometric and Geometric Calibration. IEEE Trans. Geosci. Remote Sens. 2009, 47, 3915–3932. [Google Scholar] [CrossRef]
  45. Oh, Y.; Chang, J.G.; Shoshany, M. Polarimetric Radar Vegetation Index for Biomass Estimation in Desert Fringe Ecosystems. IEEE Trans. Geosci. Remote Sens. 2018, 56, 7102–7108. [Google Scholar]
  46. Chowdhury, T.A.; Thiel, C.; Schmullius, C. Growing stock volume estimation from L-band ALOS PALSAR polarimetric coherence in Siberian forest. Remote Sens. Environ. 2014, 155, 129–144. [Google Scholar] [CrossRef]
  47. Zhang, T.; Lin, H.; Long, J.; Zhang, M.; Liu, Z. Analyzing the Saturation of Growing Stem Volume Based on ZY-3 Stereo and Multispectral Images in Planted Coniferous Forest. IEEE J. Sel. Top. Appl. Earth Obs. Remote Sens. 2022, 15, 50–61. [Google Scholar] [CrossRef]
Figure 1. The position of study area and the distribution map of ground samples in planted Chinese fir forest, RGB image is the optical image of Huangfengqiao Forest Farm during the corresponding period.
Remotesensing 15 01519 g001
Figure 2. Polarization coherence pattern, Mean represents the average value of the RPC feature, Max represents the maximum value of the RPC feature, and Min represents the minimum value of the RPC feature.
Remotesensing 15 01519 g002
Figure 3. Schematic diagram of SI.
Remotesensing 15 01519 g003
Figure 4. Schematic diagram of SIS feature selection method.
Remotesensing 15 01519 g004
Figure 5. Pearson correlations between forest parameters and polarization characteristics acquired on 16 June and 30 June, a, b, c and d represent four polarization coherences, γ H H V V , γ H H H V , | γ H H + V V H H V V | , | γ H H V V H V | , 1–7 indicate  γ m a x γ m i n γ m e a n γ s t d γ m a x m i n θ γ m a x θ γ m i n  in each polarization coherences, respectively. (Note: Features in blue are significantly correlated at the 0.01 level; Features in red are significantly correlated at the 0.05 level).
Remotesensing 15 01519 g005
Figure 6. Pearson correlations between forest AGB and polarimatric features acquired on 16 June and 30 June, a, b, c, and d represent four polarization coherences, γ H H V V γ H H H V | γ H H + V V H H V V | | γ H H V V H V | , 1–7 indicate  γ m a x γ m i n γ m e a n γ s t d γ m a x m i n θ γ m a x θ γ m i n  in each polarization coherences, respectively. (Note: Features in blue are significantly correlated at the 0.01 level; Features in red are significantly correlated at the 0.05 level).
Remotesensing 15 01519 g006
Figure 7. Scatter plot of polarization features and AGB, the part in the red circle is considered saturated.
Remotesensing 15 01519 g007
Figure 8. SI and R2 of extracted features from two acquired quad polarimetric SAR images.
Remotesensing 15 01519 g008
Figure 9. Plots of rRMSE varied with the number of features with two feature selection methods.
Remotesensing 15 01519 g009
Figure 10. Scatterplots between predicted and ground-measured AGB using three categories of optimal feature sets obtained by SIS.
Remotesensing 15 01519 g010
Figure 12. Maps of forest AGB used images acquired on 16 June (a) and 30 June (b).
Remotesensing 15 01519 g012
Figure 13. The plots of SI with different features.
Remotesensing 15 01519 g013
Figure 14. The results of mapped forest AGB with seven feature sets.
Remotesensing 15 01519 g014
Table 1. Information of qual-polarimetric SAR images.
SensorDate of AcquiredBandsWeatherIncidence AngleAzimuth ResolutionRange ResolutionPolarimetric Modes
ALOS-2 PALSAR16 June 2016L-bandRainy38.99°2.83 m2.86 mHH, HV, VH, VV
ALOS-2 PALSAR30 June 2016L-bandSunny38.99°2.83 m2.86 mHH, HV, VH, VV
Table 2. The information of backscattering features.
Derived FeaturesDefinition
Backscatter coefficient ratio σ H H / σ V V
Backscatter coefficient ratio σ H V / σ H H
Backscatter coefficient ratio σ H V / σ V V
Polarization discrimination indexPDR =   ( σ H H σ V V )/   ( σ H H + σ V V )
Radar vegetation indexRVI = 8 σ H V / ( σ H H + σ V V +2 σ H V )
Texture features(Mean, ME), (Homogeneity, HO), (Variance, VA), (Correlation, CO), (Second moment, SM), (Dissimilarity, DI), (Entropy, EN), (Contrast, CT)
Table 3. Features related with oscillation parameters.
SortFeature
A   A _ R e [ T 12 θ ] ,     A _ I m [ T 12 θ ] ,     A _ T 12 θ 2 ,     A _ T 23 θ 2
B   B _ T 22 θ ,     B _ T 13 θ 2 ,     B _ T 23 θ 2
  ω 2, 4, 8
  θ 0 θ 0 _ Re [ T 12 θ ] ,   θ 0 _ Im [ T 12 θ ] ,   θ 0 _ Re [ T 23 θ ] ,   θ 0 _ T 12 θ 2 ,   θ 0 _ T 23 θ 2
Table 4. Features of RPC.
RPC FeaturesMeaning
  γ m a x = m a x γ a b Maximum value of RPC feature
  γ m i n = m i n γ a b Minimum value of the RPC feature
  γ m e a n = m e a n γ a b Average value of the RPC feature
  γ s t d = std γ a b Undulation value of RPC feature
  γ m a x m i n = max γ a b min γ a b Contrast ratio value of RPC feature
  θ γ m a x = argmax γ a b Maximize rotation angle of RPC feature
  θ γ m i n = argmin γ a b Minimize rotation angle of RPC feature
Table 5. Results of estimated forest AGB using two feature selection methods with three types of feature sets.
SAR ImageFeature SetFeature SelectionFeature NumberR2RMSE(t/ha)rRMSE (%)
16 JuneBCPSS60.1368.939.7
SIS50.1368.539.7
C4PSS50.1866.638.6
SIS50.3559.234.3
RoPSS80.3160.335.5
SIS80.4554.531.6
30 JuneBCPSS30.1567.439.6
SIS40.3061.535.6
C4PSS30.3161.135.8
SIS40.3459.634.5
RoPSS50.3262.035.7
SIS70.4753.230.8
Table 6. Results of estimated AGB using combined feature sets.
SAR ImageVariable SetR2RMSE (t/ha)rRMSE (%)
16 JuneBC + C40.3658.533.9
BC + Ro0.4654.131.3
C4 + Ro0.6244.926.0
BC + C4 + Ro0.6841.824.2
30 JuneBC + C40.4852.830.6
BC + Ro0.6145.626.4
C4 + Ro0.6543.425.1
BC + C4 + Ro0.7238.822.5
Disclaimer/Publisher’s Note: The statements, opinions and data contained in all publications are solely those of the individual author(s) and contributor(s) and not of MDPI and/or the editor(s). MDPI and/or the editor(s) disclaim responsibility for any injury to people or property resulting from any ideas, methods, instructions or products referred to in the content.

