A Pilot Randomized Controlled Trial of a Telenutrition Weight Loss Intervention in Middle-Aged and Older Men with Multiple Risk Factors for Cardiovascular Disease

 ,
,
Abstract
:1. Introduction
2. Materials and Methods
2.1. Study Design
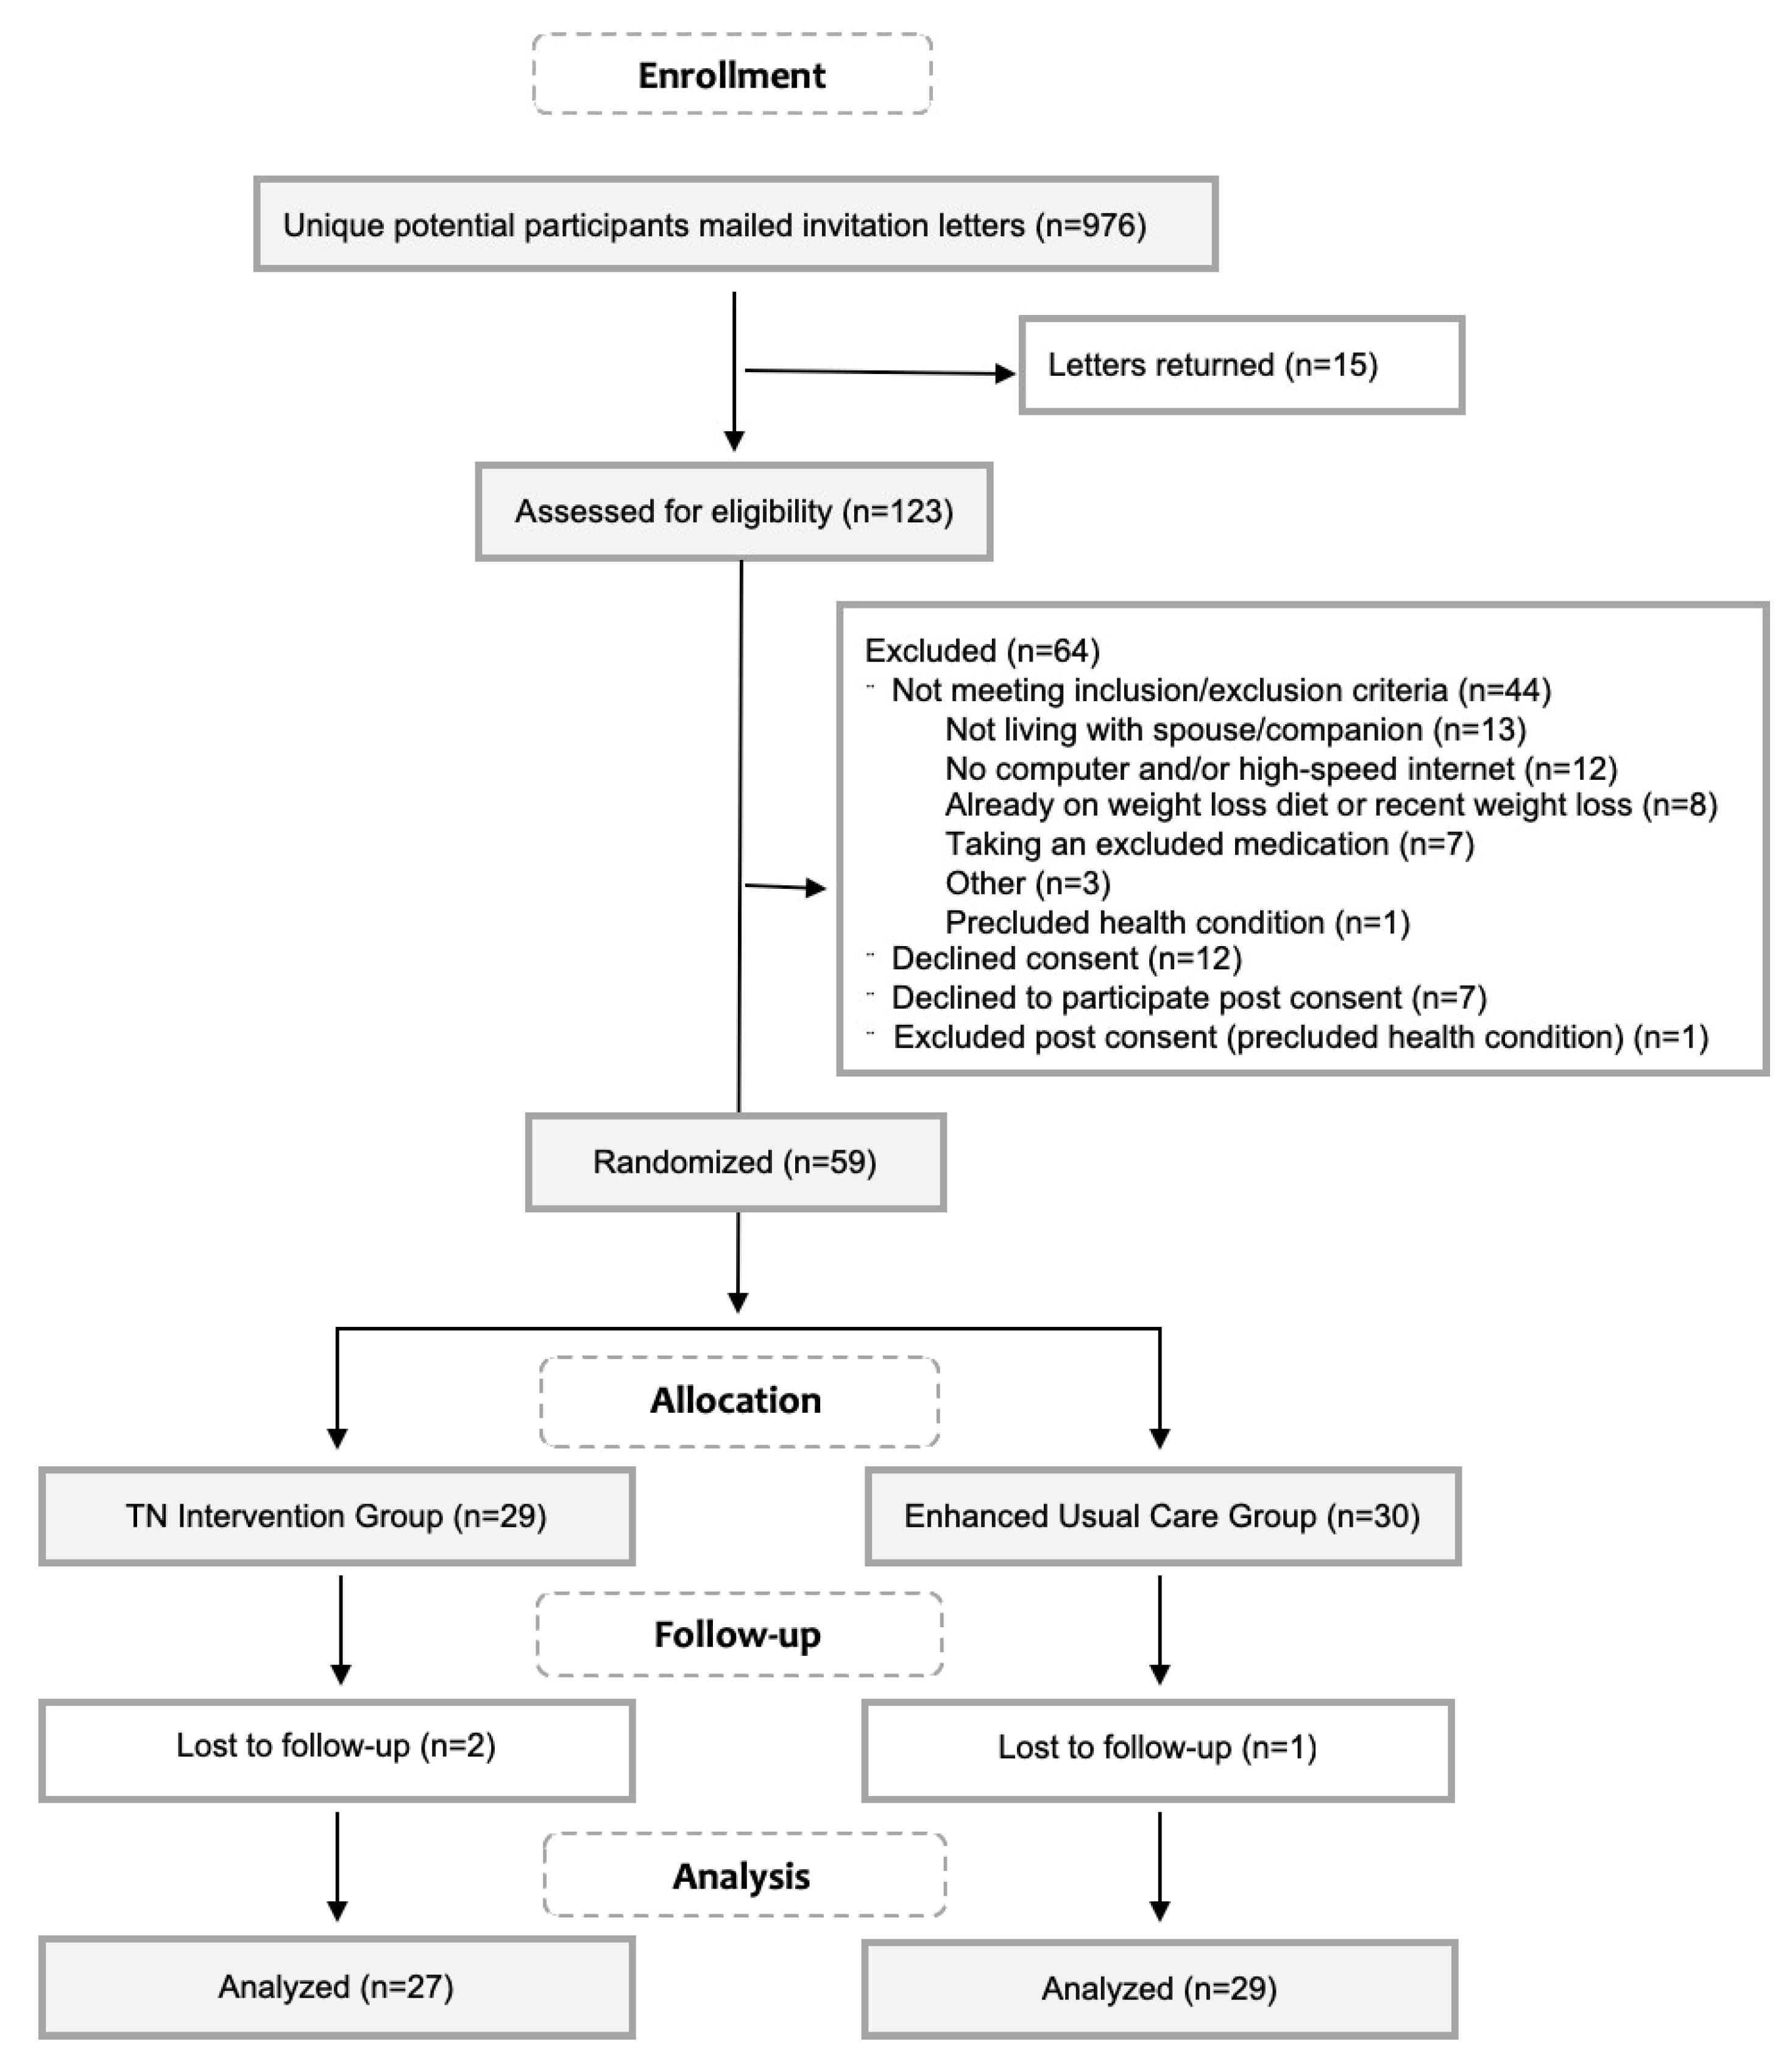
2.2. Participants
2.3. Telenutrition Intervention and Enhanced Usual Care (EUC) Groups
2.4. Measurements
2.4.1. Demographic and Baseline Medical Data
2.4.2. Feasibility Measures
2.4.3. Effectiveness Measures
2.5. Statistical Analysis
3. Results
3.1. Baseline Characteristics
3.2. Feasibility: Retention, Satisfaction and Perceived Adherence
3.3. Effectiveness: Change in Body Weight, Body Composition and Diet
4. Discussion
5. Conclusions
Author Contributions
Funding
Acknowledgments
Conflicts of Interest
References
- Overweight and Obesity Rates for Adults by Gender. Available online: https://www.kff.org/other/state-indicator/adult-overweightobesity-rate-by-gender/ (accessed on 18 April 2018).
- About Chronic Diseases. Available online: https://www.cdc.gov/chronicdisease/about/index.htm (accessed on 18 April 2018).
- The State of Obesity in West Virginia. Available online: https://stateofobesity.org/states/wv (accessed on 18 April 2018).
- Segal, L.M.; Rayburn, J.; Beck, S.E. The State of Obesity: Better Policies for a Healthier America 2017; The State of Obesity; Trust for America’s Health, The Robert Wood Johnson Foundation: Washington, DC, USA, 2017; pp. 1–108. [Google Scholar]
- Pagoto, S.L.; Schneider, K.L.; Oleski, J.L.; Luciani, J.M.; Bodenlos, J.S.; Whited, M.C. Male inclusion in randomized controlled trials of lifestyle weight loss interventions. Obes. Silver Spring Md 2012, 20, 1234–1239. [Google Scholar] [CrossRef] [PubMed]
- Jensen, M.D.; Ryan, D.H.; Apovian, C.M.; Ard, J.D.; Comuzzie, A.G.; Donato, K.A.; Hu, F.B.; Hubbard, V.S.; Jakicic, J.M.; Kushner, R.F. 2013 AHA/ACC/TOS guideline for the management of overweight and obesity in adults: A report of the American College of Cardiology/American Heart Association Task Force on Practice Guidelines and The Obesity Society. J. Am. Coll. Cardiol. 2014, 63, 2985–3023. [Google Scholar] [CrossRef] [PubMed]
- LeFevre, M.L. Behavioral counseling to promote a healthful diet and physical activity for cardiovascular disease prevention in adults with cardiovascular risk factors: US Preventive Services Task Force Recommendation Statement. Ann. Intern. Med. 2014, 161, 587–593. [Google Scholar] [CrossRef] [PubMed]
- Kushner, R.F. Barriers to providing nutrition counseling by physicians: a survey of primary care practitioners. Prev. Med. 1995, 24, 546–552. [Google Scholar] [CrossRef] [PubMed]
- Yarnall, K.S.H.; Pollak, K.I.; Østbye, T.; Krause, K.M.; Michener, J.L. Primary care: Is there enough time for prevention? Am. J. Public Health 2003, 93, 635–641. [Google Scholar] [CrossRef] [PubMed]
- Bleich, S.N.; Bennett, W.L.; Gudzune, K.A.; Cooper, L.A. National survey of US primary care physicians’ perspectives about causes of obesity and solutions to improve care. BMJ Open 2012, 2, e001871. [Google Scholar] [CrossRef] [PubMed]
- Abruzzino, B.; Marra, M.V. Primary Care Providers’ Perceived Barriers to Referring Patients to Registered Dietitian Nutritionists for Weight Loss Counseling in West Virginia. J. Acad. Nutr. Diet. 2015, 115, A32. [Google Scholar] [CrossRef]
- Haughton, B.; Stang, J. Population risk factors and trends in health care and public policy. J. Acad. Nutr. Diet. 2012, 112, S35–S46. [Google Scholar] [CrossRef] [PubMed]
- Academy of Nutrition and Dietetics: Definition of Terms List; eat right; Academy of Nutrition and Dietetics: Chicago, IL, USA, 2017; pp. 1–52.
- For weight loss, what is the effectiveness of telenutrition interventions involving an RDN? Available online: https://www.andeal.org/template.cfm?template=guide_summary&key=4278 (accessed on 18 April 2018).
- American Diabetes Association: Create Your Plate. Available online: http://www.diabetes.org/food-and-fitness/food/planning-meals/create-your-plate/ (accessed on 30 July 2018).
- Harris, P.A.; Taylor, R.; Thielke, R.; Payne, J.; Gonzalez, N.; Conde, J.G. Research electronic data capture (REDCap)—A metadata-driven methodology and workflow process for providing translational research informatics support. J. Biomed. Inform. 2009, 42, 377–381. [Google Scholar] [CrossRef] [Green Version]
- World Health Organization (WHO). Physical Status: The Use and Interpretation of Anthropometry. Available online: http://www.who.int/childgrowth/publications/physical_status/en/ (accessed on 24 April 2018).
- Nutrition Coordinating Center (NCC), University of Minnesota: Food Amounts Booklet for the Participant. Available online: http://www.ncc.umn.edu/wp-content/uploads/2015/12/FAB-Participant.pdf (accessed on 24 April 2018).
- Developing the Healthy Eating Index. Available online: https://epi.grants.cancer.gov/hei/developing.html (accessed on 20 November 2018).
- Guide to Creating Variables, Needed to Calculate Scores for Each Component of the Healthy Eating Index-2015 (HEI-2015). Available online: http://www.ncc.umn.edu/healthy-eating-index-hei/ (accessed on 24 April 2018).
- HEI Scores for Examining the Effect of an Intervention. Available online: https://epi.grants.cancer.gov/hei/hei-scores-examining-effect-of-intervention.html (accessed on 30 July 2018).
- Verbeke, G.; Molenberghs, G. Linear Mixed Models For longitudinal Data; Springer: New York, NY, USA, 2000; ISBN 978-1-4419-0300-6. [Google Scholar]
- Obesity Education Initiative Electronic Textbook—Treatment Guidelines. Available online: https://www.nhlbi.nih.gov/health-pro/guidelines/current/obesity-guidelines/e_textbook/txgd/4142.htm (accessed on 24 April 2018).
- Rural-Urban Commuting Area Codes. Available online: https://www.ers.usda.gov/data-products/rural-urban-commuting-area-codes.aspx (accessed on 24 April 2018).
- Morgan, P.J.; Callister, R.; Collins, C.E.; Plotnikoff, R.C.; Young, M.D.; Berry, N.; McElduff, P.; Burrows, T.; Aguiar, E.; Saunders, K.L. The SHED-IT community trial: a randomized controlled trial of internet-and paper-based weight loss programs tailored for overweight and obese men. Ann. Behav. Med. 2013, 45, 139–152. [Google Scholar] [CrossRef]
- Crane, M.M.; Lutes, L.D.; Ward, D.S.; Bowling, J.M.; Tate, D.F. A randomized trial testing the efficacy of a novel approach to weight loss among men with overweight and obesity. Obes. Silver Spring Md 2015, 23, 2398–2405. [Google Scholar] [CrossRef] [Green Version]
- Gray, C.M.; Hunt, K.; Mutrie, N.; Anderson, A.S.; Treweek, S.; Wyke, S. Weight management for overweight and obese men delivered through professional football clubs: A pilot randomized trial. Int. J. Behav. Nutr. Phys. Act. 2013, 10, 121. [Google Scholar] [CrossRef] [PubMed]
- Basiotis, P.; Carlson, A.; Gerrior, S.; Juan, W.; Lino, M. The Healthy Eating Index: 1999–2000; Center for Nutrition Policy and Promotion, CNPP-12; USDA: Washington, DC, USA, 2002.
- Schwingshackl, L.; Bogensberger, B.; Hoffmann, G. Diet Quality as Assessed by the Healthy Eating Index, Alternate Healthy Eating Index, Dietary Approaches to Stop Hypertension Score, and Health Outcomes: An Updated Systematic Review and Meta-Analysis of Cohort Studies. J. Acad. Nutr. Diet. 2018, 118, 74–100. [Google Scholar] [CrossRef] [PubMed]
- Sotos-Prieto, M.; Bhupathiraju, S.N.; Mattei, J.; Fung, T.T.; Li, Y.; Pan, A.; Willett, W.C.; Rimm, E.B.; Hu, F.B. Changes in Diet Quality Scores and Risk of Cardiovascular Disease Among US Men and Women. Circulation 2015, 132, 2212–2219. [Google Scholar] [CrossRef] [PubMed]
- LeBlanc, E.L.; Patnode, C.D.; Webber, E.M.; Redmond, N.; Rushkin, M.; O’Connor, E.A. Behavioral and Pharmacotherapy Weight Loss Interventions to Prevent Obesity-Related Morbidity and Mortality in Adults: An Updated Systematic Review for the U.S. Preventive Services Task Force; U.S. Preventive Services Task Force pEvidence Syntheses, formerly Systematic Evidence Reviews; Agency for Healthcare Research and Quality (US): Rockville, MD, USA, 2018.
- Millen, B.E.; Wolongevicz, D.M.; Nonas, C.A.; Lichtenstein, A.H. 2013 American Heart Association/American College of Cardiology/the Obesity Society Guideline for the Management of Overweight and Obesity in Adults: implications and new opportunities for registered dietitian nutritionists. J. Acad. Nutr. Diet. 2014, 114, 1730–1735. [Google Scholar] [CrossRef] [PubMed]
- Ogden, C.L.; Lamb, M.M.; Carroll, M.D.; Flegal, K.M. CDC: Obesity and Socioeconomic Status in Adults: United States, 2005–2008; National Center for Health Statistics: Hyattsville, MD, USA, 2010; pp. 1–8.


| Characteristic | Telenutrition Intervention (n = 29) | Enhanced Usual Care (n = 30) | p-Value |
|---|---|---|---|
| Age, years | 58.6 ± 8.1 | 59.3 ± 7.4 | 0.71 |
| Weight, kg | 114.9 ± 20.6 | 115.6 ± 21.8 | 0.90 |
| Height, cm | 176.4 ± 5.3 | 176.9 ± 5.8 | 0.75 |
| Body Mass Index, kg/m2 | 36.9 ± 6.4 | 36.8 ± 5.6 | 0.96 |
| Race: White | 29 (100.0) | 28 (93.3) | 1.00 |
| Ethnicity: Non-Hispanic | 29 (100.0) | 28 (93.3) | 1.00 |
| Household Income | 0.80 | ||
| <35 k | 3 (10.3) | 3 (10.0) | |
| 35k–50 k | 2 (6.9) | 3 (10.0) | |
| 50k–75 k | 6 (20.7) | 6 (20.0) | |
| >75 k | 16 (55.2) | 13 (43.3) | |
| Did not respond | 2 (6.9) | 5 (16.7) | |
| Education | 0.84 | ||
| High school graduate | 9 (31.0) | 7 (23.3) | |
| Some college | 7 (24.1) | 7 (23.3) | |
| College graduate | 13 (44.8) | 16 (53.3) | |
| Obesity Classification (BMI) | 0.92 | ||
| Class 1 (BMI 30.0–34.9) | 11 (37.9) | 10 (33.3) | |
| Class 2 (BMI 35.0–39.9) | 13 (44.8) | 15 (50.0) | |
| Class 3 (BMI 40.0+) | 5 (17.3) | 5 (16.7) | |
| Comorbidities | |||
| Pre-diabetes/diabetes | 12 (41.4) | 19 (63.3) | 0.12 |
| Hyperlipidemia | 26 (89.7) | 27 (90.0) | 1.00 |
| Hypertension | 25 (86.2) | 24 (80.0) | 0.73 |
| Number of comorbidities | 0.70 | ||
| 1 | 6 (20.7) | 4 (13.3) | |
| 2 | 12 (41.4) | 12 (40.0) | |
| 3 | 11 (37.9) | 14 (46.7) |
| Outcome | Week | Telenutrition Intervention | Enhanced Usual Care | p-Value | ||
|---|---|---|---|---|---|---|
| Group | Time | Group × Time | ||||
| Weight, kg | Baseline | 114.9 ± 20.6 | 115.6 ± 21.8 | 0.997 | <0.0001 | 0.111 |
| Week 6 | 109.3 ± 18.8 | 112.4 ± 20.8 | ||||
| Week 12 | 106.6 ± 19.0 | 110.6 ± 20.4 | ||||
| Waist Circumference, cm | Baseline | 123.5 ± 12.9 | 125.8 ± 13.2 | 0.605 | <0.0001 | 0.128 |
| Week 6 | 119.0 ± 12.0 | 123.3 ± 13.4 | ||||
| Week 12 | 116.7 ± 12.4 | 121.3 ± 13.9 | ||||
| Body Fat, % | Baseline | 38.2 ± 4.9 | 39.6 ± 4.7 | 0.297 | <0.0001 | 0.772 |
| Week 6 | 36.6 ± 5.0 | 38.5 ± 5.4 | ||||
| Week 12 | 35.7 ± 5.3 | 37.7 ± 6.1 | ||||
| Energy intake, kcal | Baseline | 2194.1 ± 578.2 | 2138.3 ± 623.7 | 0.399 | 0.0001 | 0.253 |
| Week 6 | 1677.8 ± 462.9 | 1665.3 ± 553.2 | ||||
| Week 12 | 1593.9 ± 424.3 | 1693.3 ± 480.8 | ||||
| Diet quality, 0–100 | Baseline | 51.0 ± 10.9 | 51.1 ± 14.0 | 0.629 | <0.0001 | 0.110 |
| Week 6 | 70.6 ± 14.3 | 61.2 ± 15.6 | ||||
| Week 12 | 71.3 ± 13.9 | 63.9 ± 14.8 | ||||
| Outcome | Telenutrition Intervention | Enhanced Usual Care | p Value a |
|---|---|---|---|
| Week 6 | (n = 27) | (n = 30) | |
| Gained | 1 (3.7) | 2 (6.7) | 0.40 |
| Lost 0–2.9% | 12 (44.4) | 17 (56.7) | |
| Lost 3–4.9% | 5 (18.5) | 6 (20.0) | |
| Lost 5–9.9% | 9 (33.3) | 4 (13.3) | |
| Lost ≥ 10% | 0 (0.0) | 1 (3.33) | |
| Lost ≥ 5% | 9 (33.3) | 5 (16.7) | 0.22 |
| Week 12 | (n = 27) | (n = 29) | |
| Gained | 2 (7.4) | 4 (13.8) | 0.25 |
| Lost 0–2.9% | 3 (11.1) | 9 (31.0) | |
| Lost 3–4.9%b | 3 (11.1) | 4 (13.8) | |
| Lost 5–9.9% | 15 (55.6) | 9 (31.0) | |
| Lost ≥ 10% | 4 (14.8) | 3 (10.3) | |
| Lost ≥ 5% | 19 (70.4) | 12 (41.4) | 0.035 |
| Outcome | Max Score | Week | Telenutrition Intervention | Enhanced Usual Care | p-Value | ||
|---|---|---|---|---|---|---|---|
| Group | Time | Group × Time | |||||
| Total Vegetables | 5 | Baseline | 3.62 ± 1.3 | 3.70 ± 1.4 | 0.471 | 0.203 | 0.206 |
| Week 6 | 4.56 ± 0.9 | 4.38 ± 1.1 | |||||
| Week 12 | 4.69 ± 0.8 | 4.23 ± 1.1 | |||||
| Greens and Beans | 5 | Baseline | 1.15 ± 1.6 | 2.51 ± 2.2 | 0.013 | 0.411 | 0.013 |
| Week 6 | 3.56 ± 2.0 | 2.83 ± 2.0 | |||||
| Week 12 | 3.55 ± 1.9 | 2.95 ± 2.3 | |||||
| Total Fruit | 5 | Baseline | 1.77 ± 1.4 | 1.69 ± 1.5 | 0.333 | 0.050 | 0.040 |
| Week 6 | 2.92 ± 1.5 | 2.40 ± 1.7 | |||||
| Week 12 | 3.71 ± 1.7 | 2.51 ± 1.9 | |||||
| Whole Fruit | 5 | Baseline | 2.43 ± 1.9 | 2.60 ± 2.0 | 0.297 | 0.070 | 0.037 |
| Week 6 | 3.72 ± 1.6 | 3.29 ± 1.9 | |||||
| Week 12 | 4.22 ± 1.4 | 3.31 ± 1.9 | |||||
| Whole Grains | 10 | Baseline | 3.97 ± 3.1 | 4.06 ± 3.6 | 0.930 | 0.004 | 0.580 |
| Week 6 | 7.08 ± 3.3 | 5.44 ± 3.5 | |||||
| Week 12 | 6.42 ± 3.7 | 5.49 ± 3.7 | |||||
| Dairy | 10 | Baseline | 5.38 ± 2.5 | 5.06 ± 2.9 | 0.877 | 0.592 | 0.807 |
| Week 6 | 4.95 ± 3.0 | 5.46 ± 2.4 | |||||
| Week 12 | 5.33 ± 2.8 | 4.82 ± 3.0 | |||||
| Total Protein Foods | 5 | Baseline | 4.82 ± 0.6 | 4.80 ± 0.7 | 0.835 | 0.124 | 0.993 |
| Week 6 | 5.00 ± 0.0 | 4.86 ± 0.6 | |||||
| Week 12 | 4.93 ± 0.3 | 4.99 ± 0.1 | |||||
| Seafood and Plant Protein | 5 | Baseline | 2.97 ± 2.1 | 3.60 ± 1.9 | 0.269 | 0.604 | 0.092 |
| Week 6 | 4.65 ± 1.1 | 3.51 ± 2.0 | |||||
| Week 12 | 3.89 ± 1.9 | 3.32 ± 2.2 | |||||
| Fatty Acid Ratio | 10 | Baseline | 4.28 ± 2.8 | 3.41 ± 2.2 | 0.116 | 0.002 | 0.228 |
| Week 6 | 6.45 ± 3.2 | 5.04 ± 2.9 | |||||
| Week 12 | 5.55 ± 3.4 | 5.81 ± 2.8 | |||||
| Sodium | 10 | Baseline | 2.57 ± 2.8 | 2.30 ± 2.6 | 0.802 | 0.013 | 0.485 |
| Week 6 | 3.30 ± 3.0 | 3.31 ± 3.2 | |||||
| Week 12 | 4.95 ± 3.2 | 4.16 ± 3.5 | |||||
| Refined Grains | 10 | Baseline | 6.45 ± 3.3 | 5.94 ± 3.6 | 0.474 | 0.039 | 0.643 |
| Week 6 | 8.51 ± 2.3 | 6.65 ± 3.4 | |||||
| Week 12 | 8.53 ± 2.3 | 7.33 ± 3.2 | |||||
| Added Sugar | 10 | Baseline | 7.60 ± 2.5 | 7.76 ± 2.9 | 0.894 | 0.012 | 0.720 |
| Week 6 | 9.29 ± 1.2 | 8.74 ± 2.2 | |||||
| Week 12 | 9.41 ± 1.0 | 8.99 ± 2.1 | |||||
| Saturated Fats | 10 | Baseline | 4.03 ± 2.6 | 3.65 ± 2.4 | 0.298 | 0.002 | 0.493 |
| Week 6 | 6.66 ± 2.7 | 5.26 ± 3.4 | |||||
| Week 12 | 6.12 ± 2.8 | 6.02 ± 3.2 | |||||
© 2019 by the authors. Licensee MDPI, Basel, Switzerland. This article is an open access article distributed under the terms and conditions of the Creative Commons Attribution (CC BY) license (http://creativecommons.org/licenses/by/4.0/).
Share and Cite
Ventura Marra, M.; Lilly, C.L.; Nelson, K.R.; Woofter, D.R.; Malone, J. A Pilot Randomized Controlled Trial of a Telenutrition Weight Loss Intervention in Middle-Aged and Older Men with Multiple Risk Factors for Cardiovascular Disease. Nutrients 2019, 11, 229. https://0-doi-org.brum.beds.ac.uk/10.3390/nu11020229
Ventura Marra M, Lilly CL, Nelson KR, Woofter DR, Malone J. A Pilot Randomized Controlled Trial of a Telenutrition Weight Loss Intervention in Middle-Aged and Older Men with Multiple Risk Factors for Cardiovascular Disease. Nutrients. 2019; 11(2):229. https://0-doi-org.brum.beds.ac.uk/10.3390/nu11020229
Chicago/Turabian StyleVentura Marra, Melissa, Christa L. Lilly, Kelly R. Nelson, Dominick R. Woofter, and James Malone. 2019. "A Pilot Randomized Controlled Trial of a Telenutrition Weight Loss Intervention in Middle-Aged and Older Men with Multiple Risk Factors for Cardiovascular Disease" Nutrients 11, no. 2: 229. https://0-doi-org.brum.beds.ac.uk/10.3390/nu11020229