Effects of a Fat-Rich Diet on the Spontaneous Release of Acetylcholine in the Neuromuscular Junction of Mice


Abstract
:1. Introduction
2. Materials and Methods
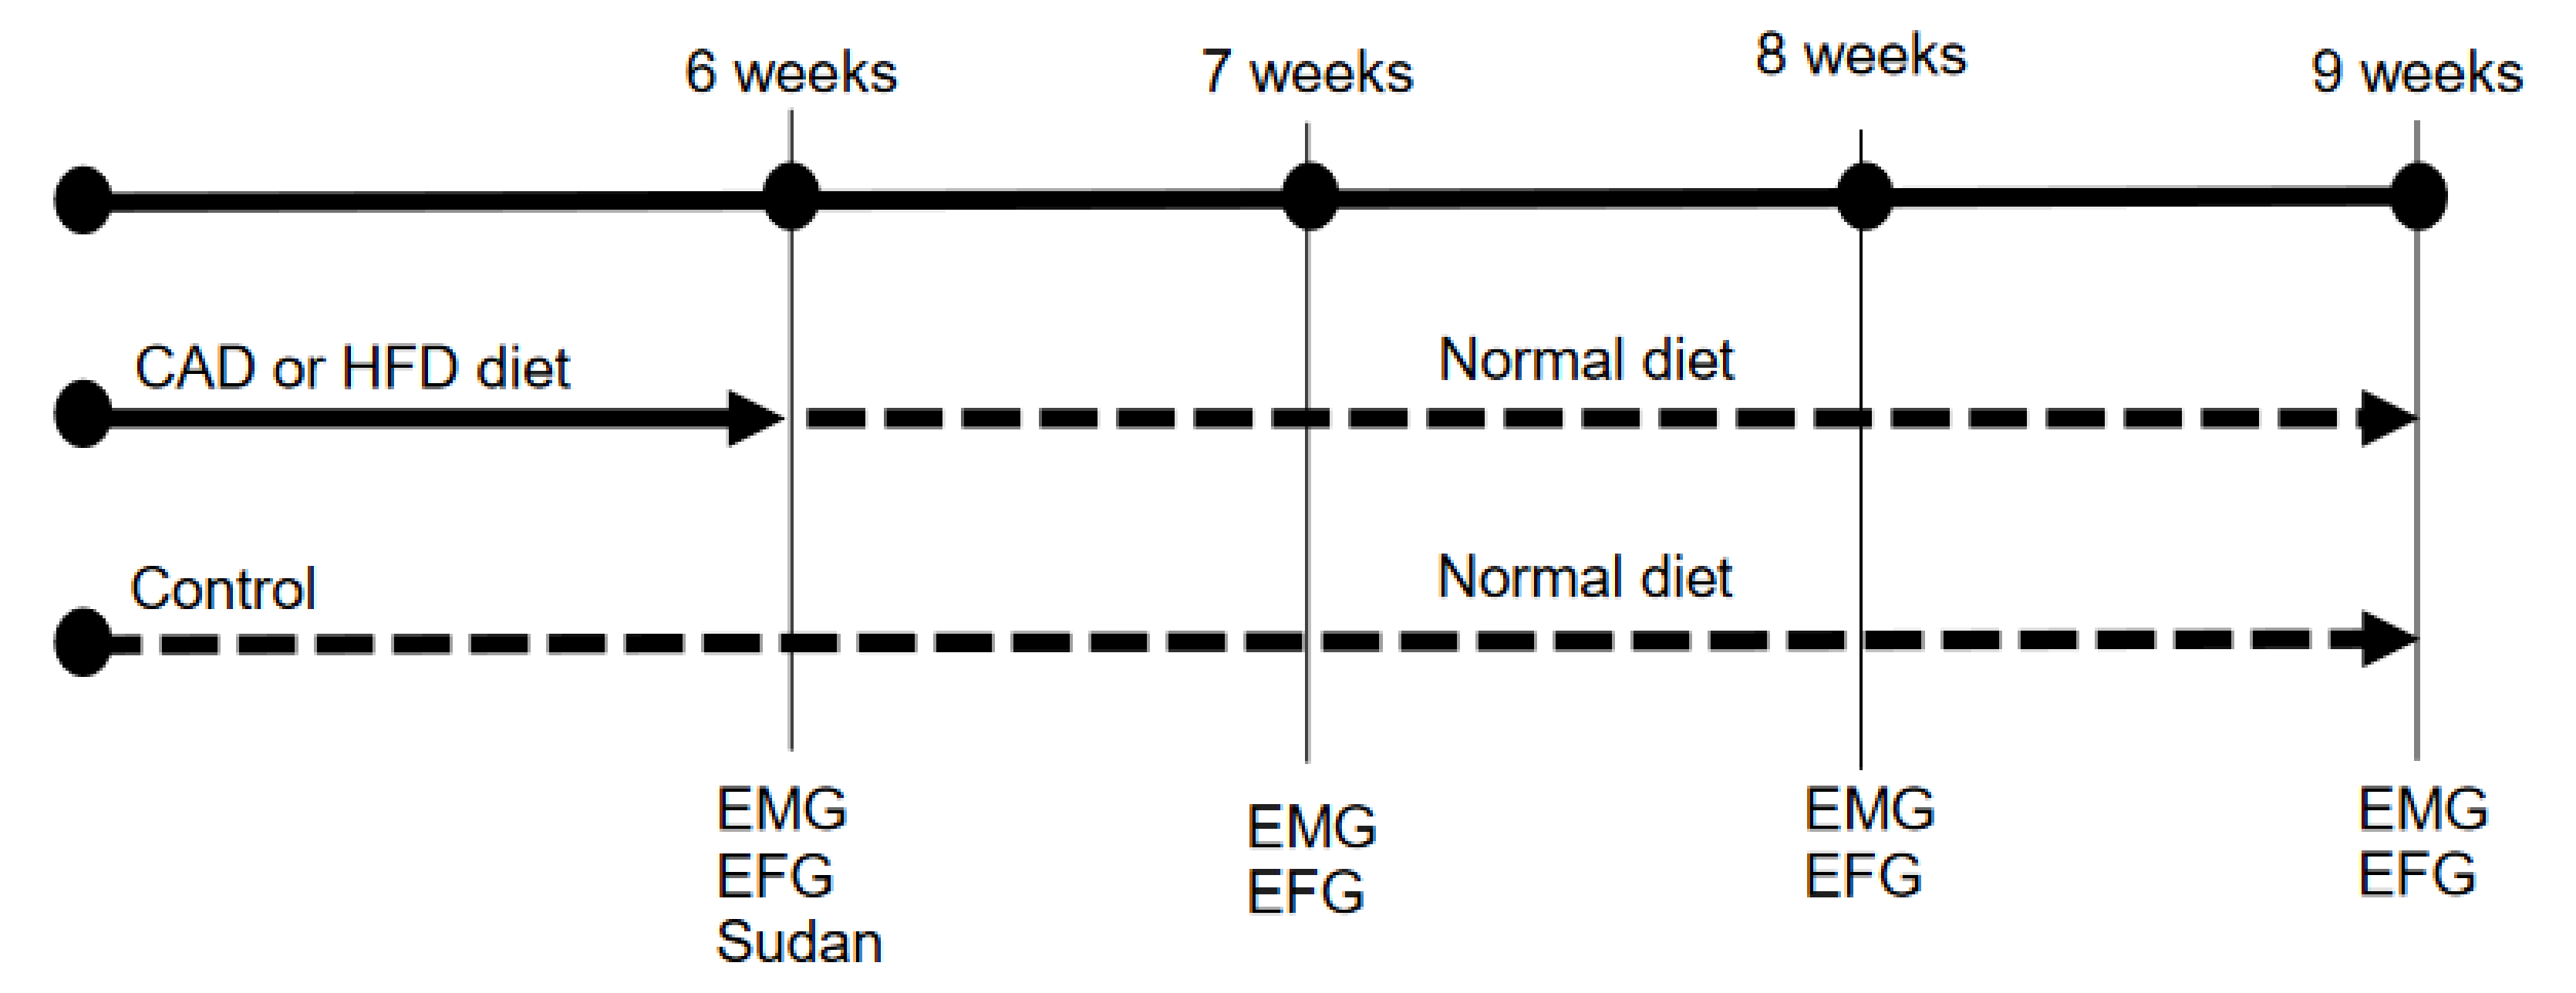
2.1. Animals and Dietary Protocol
2.2. Muscles
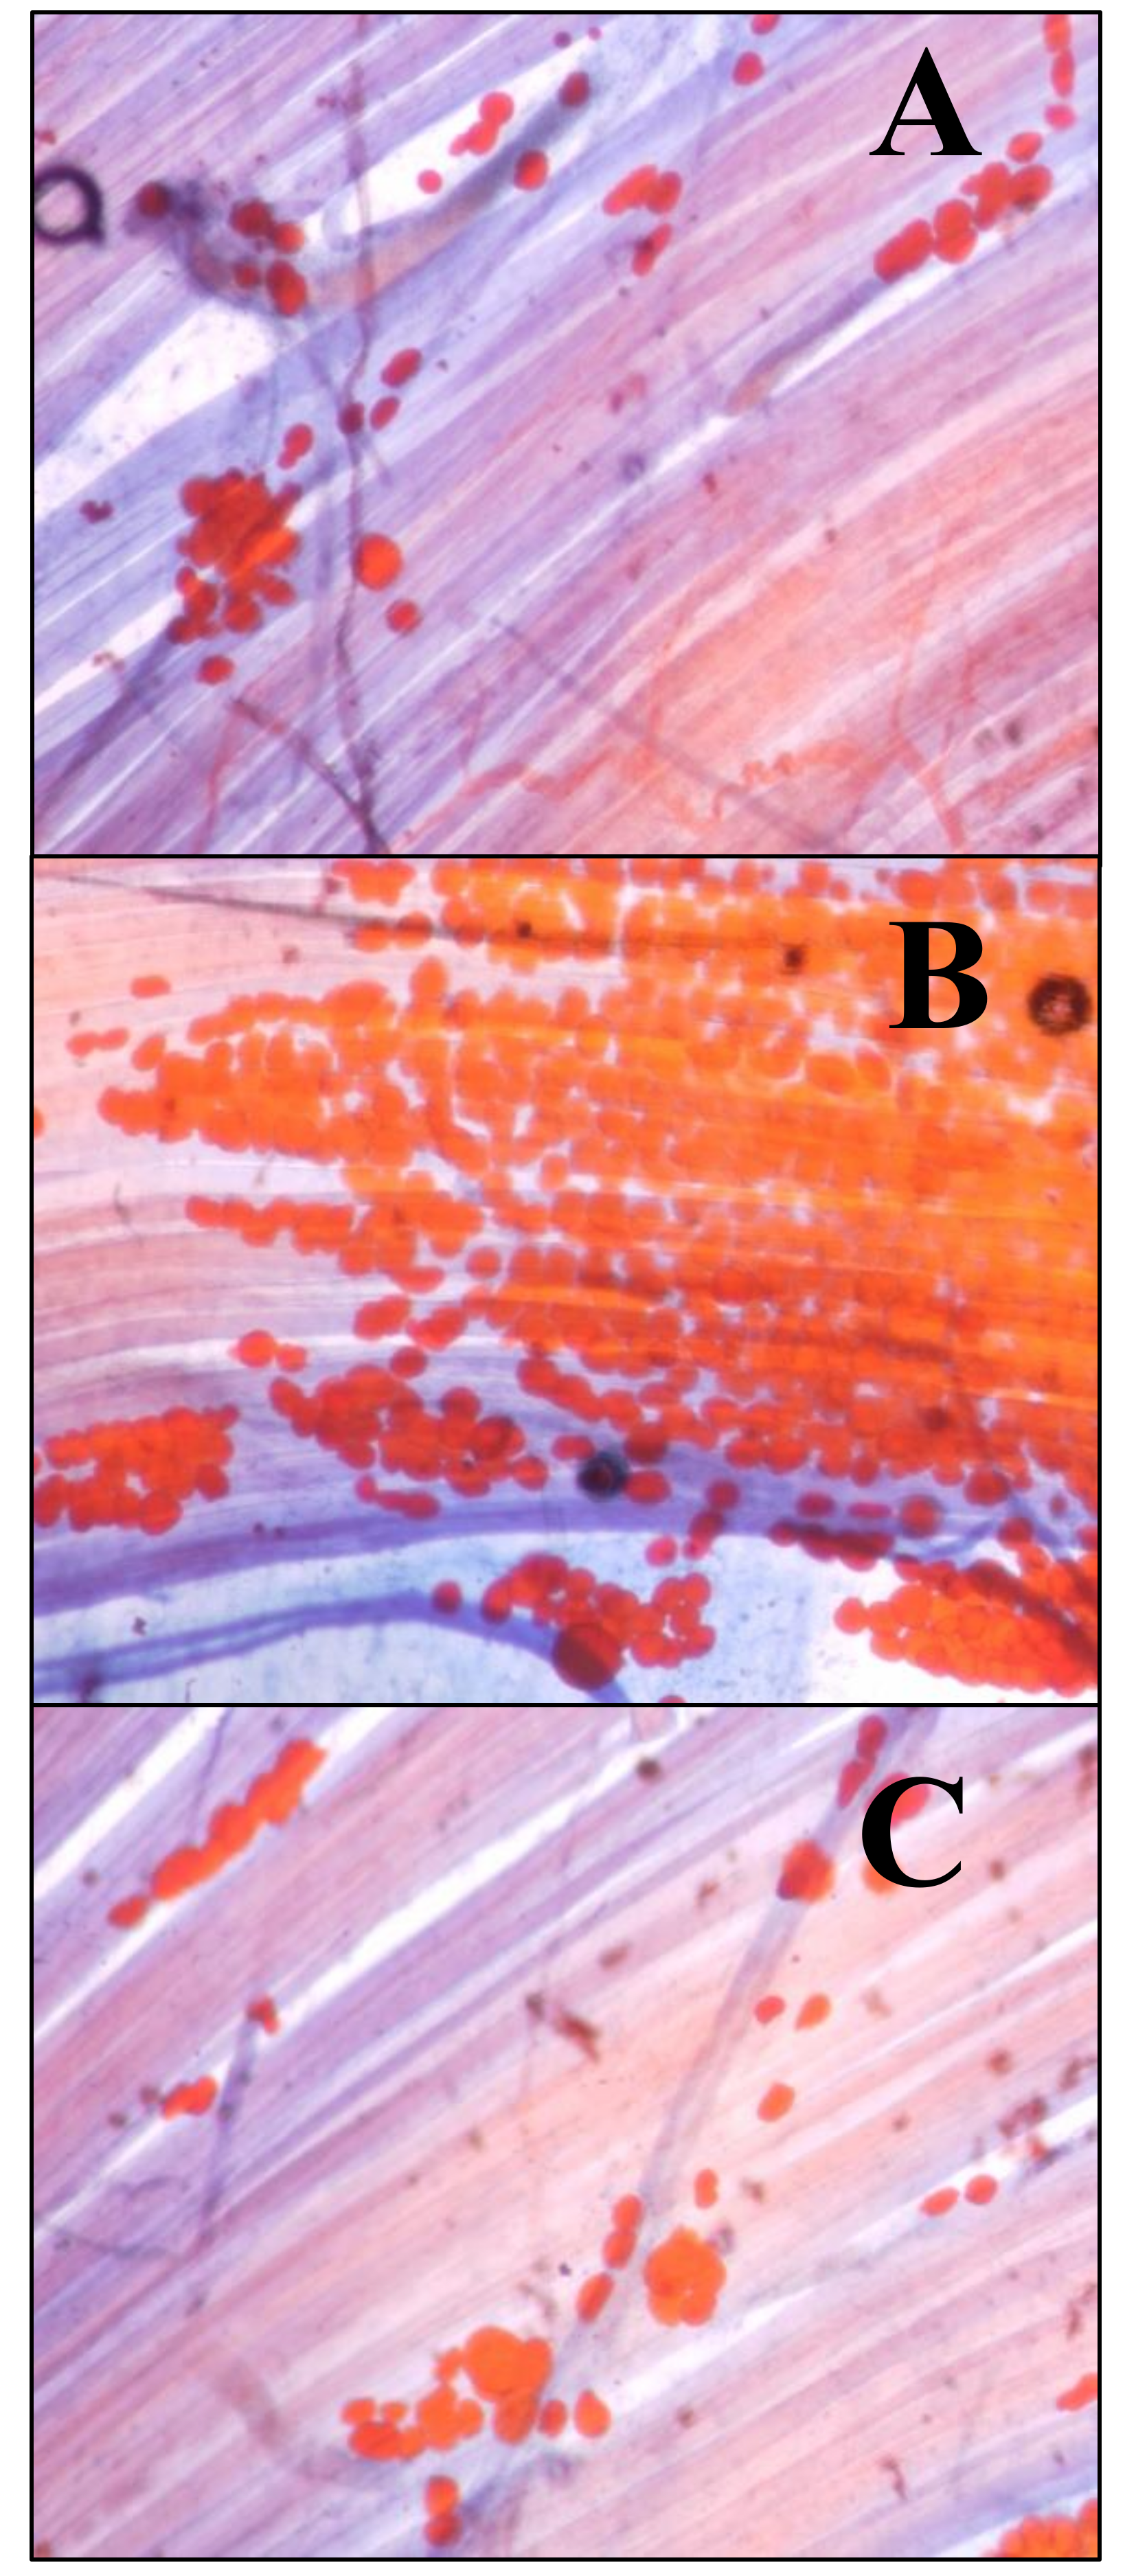
2.3. Sudan III
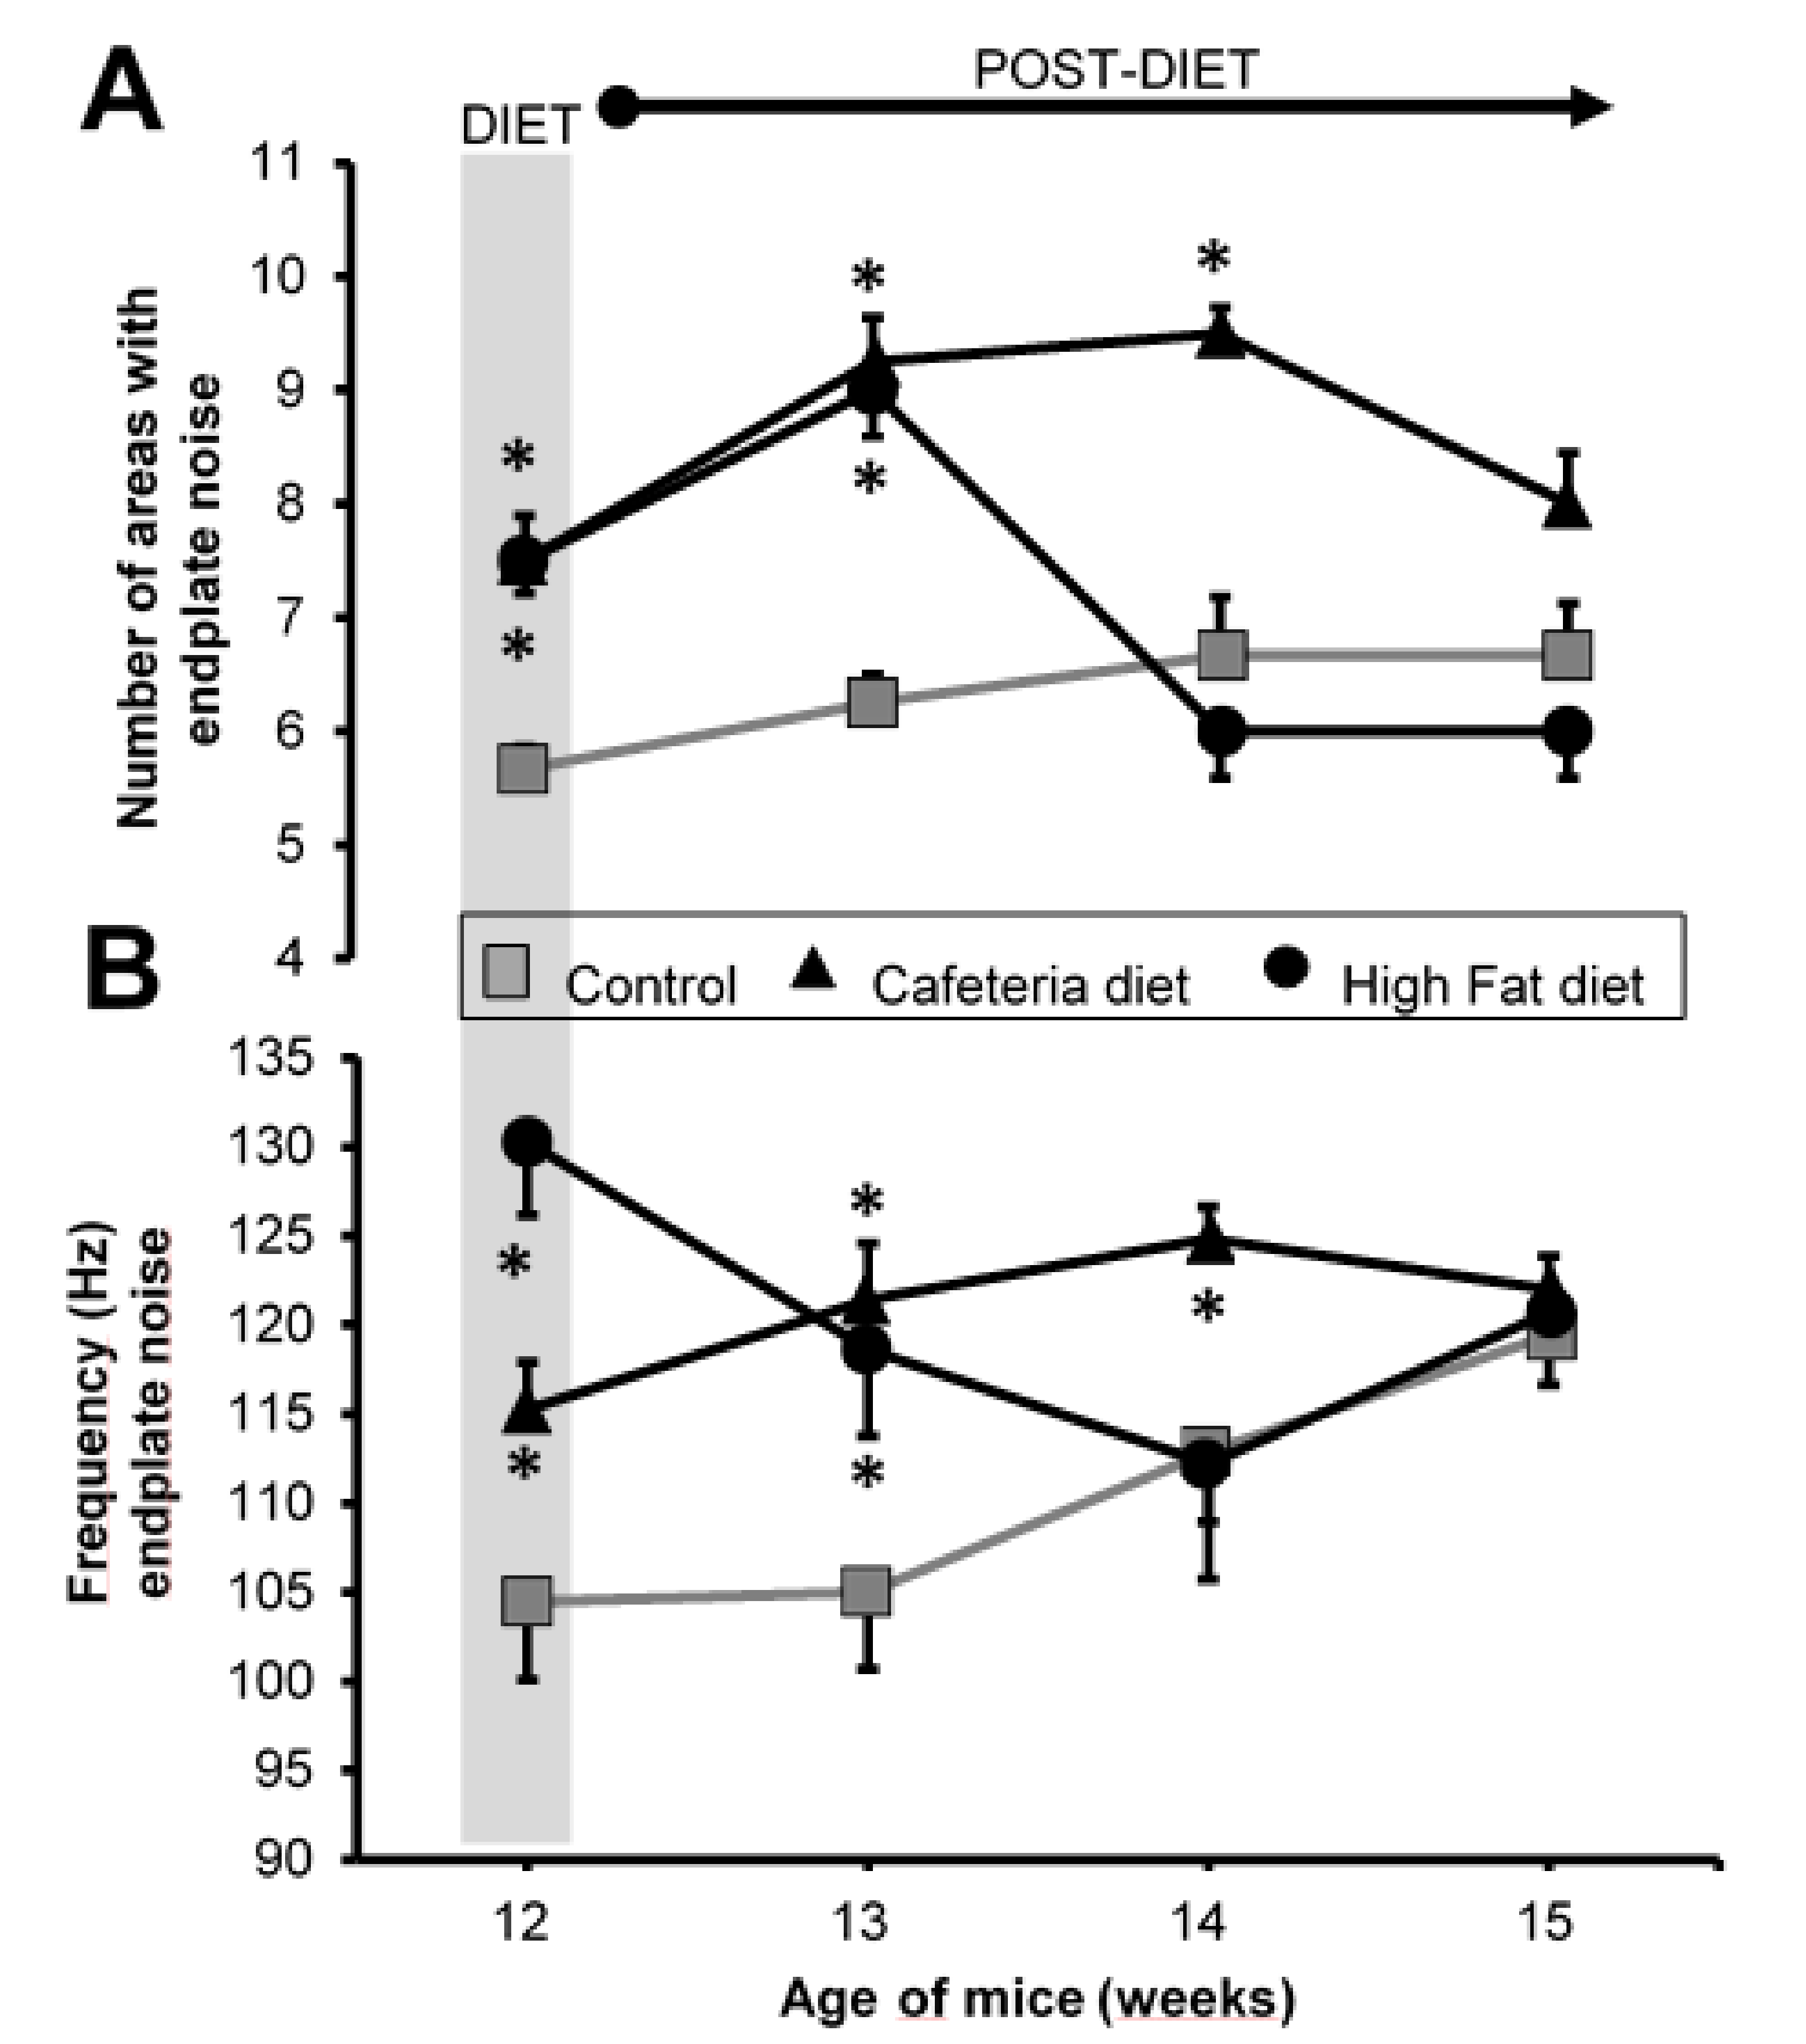
2.4. Endplate Noise Recordings
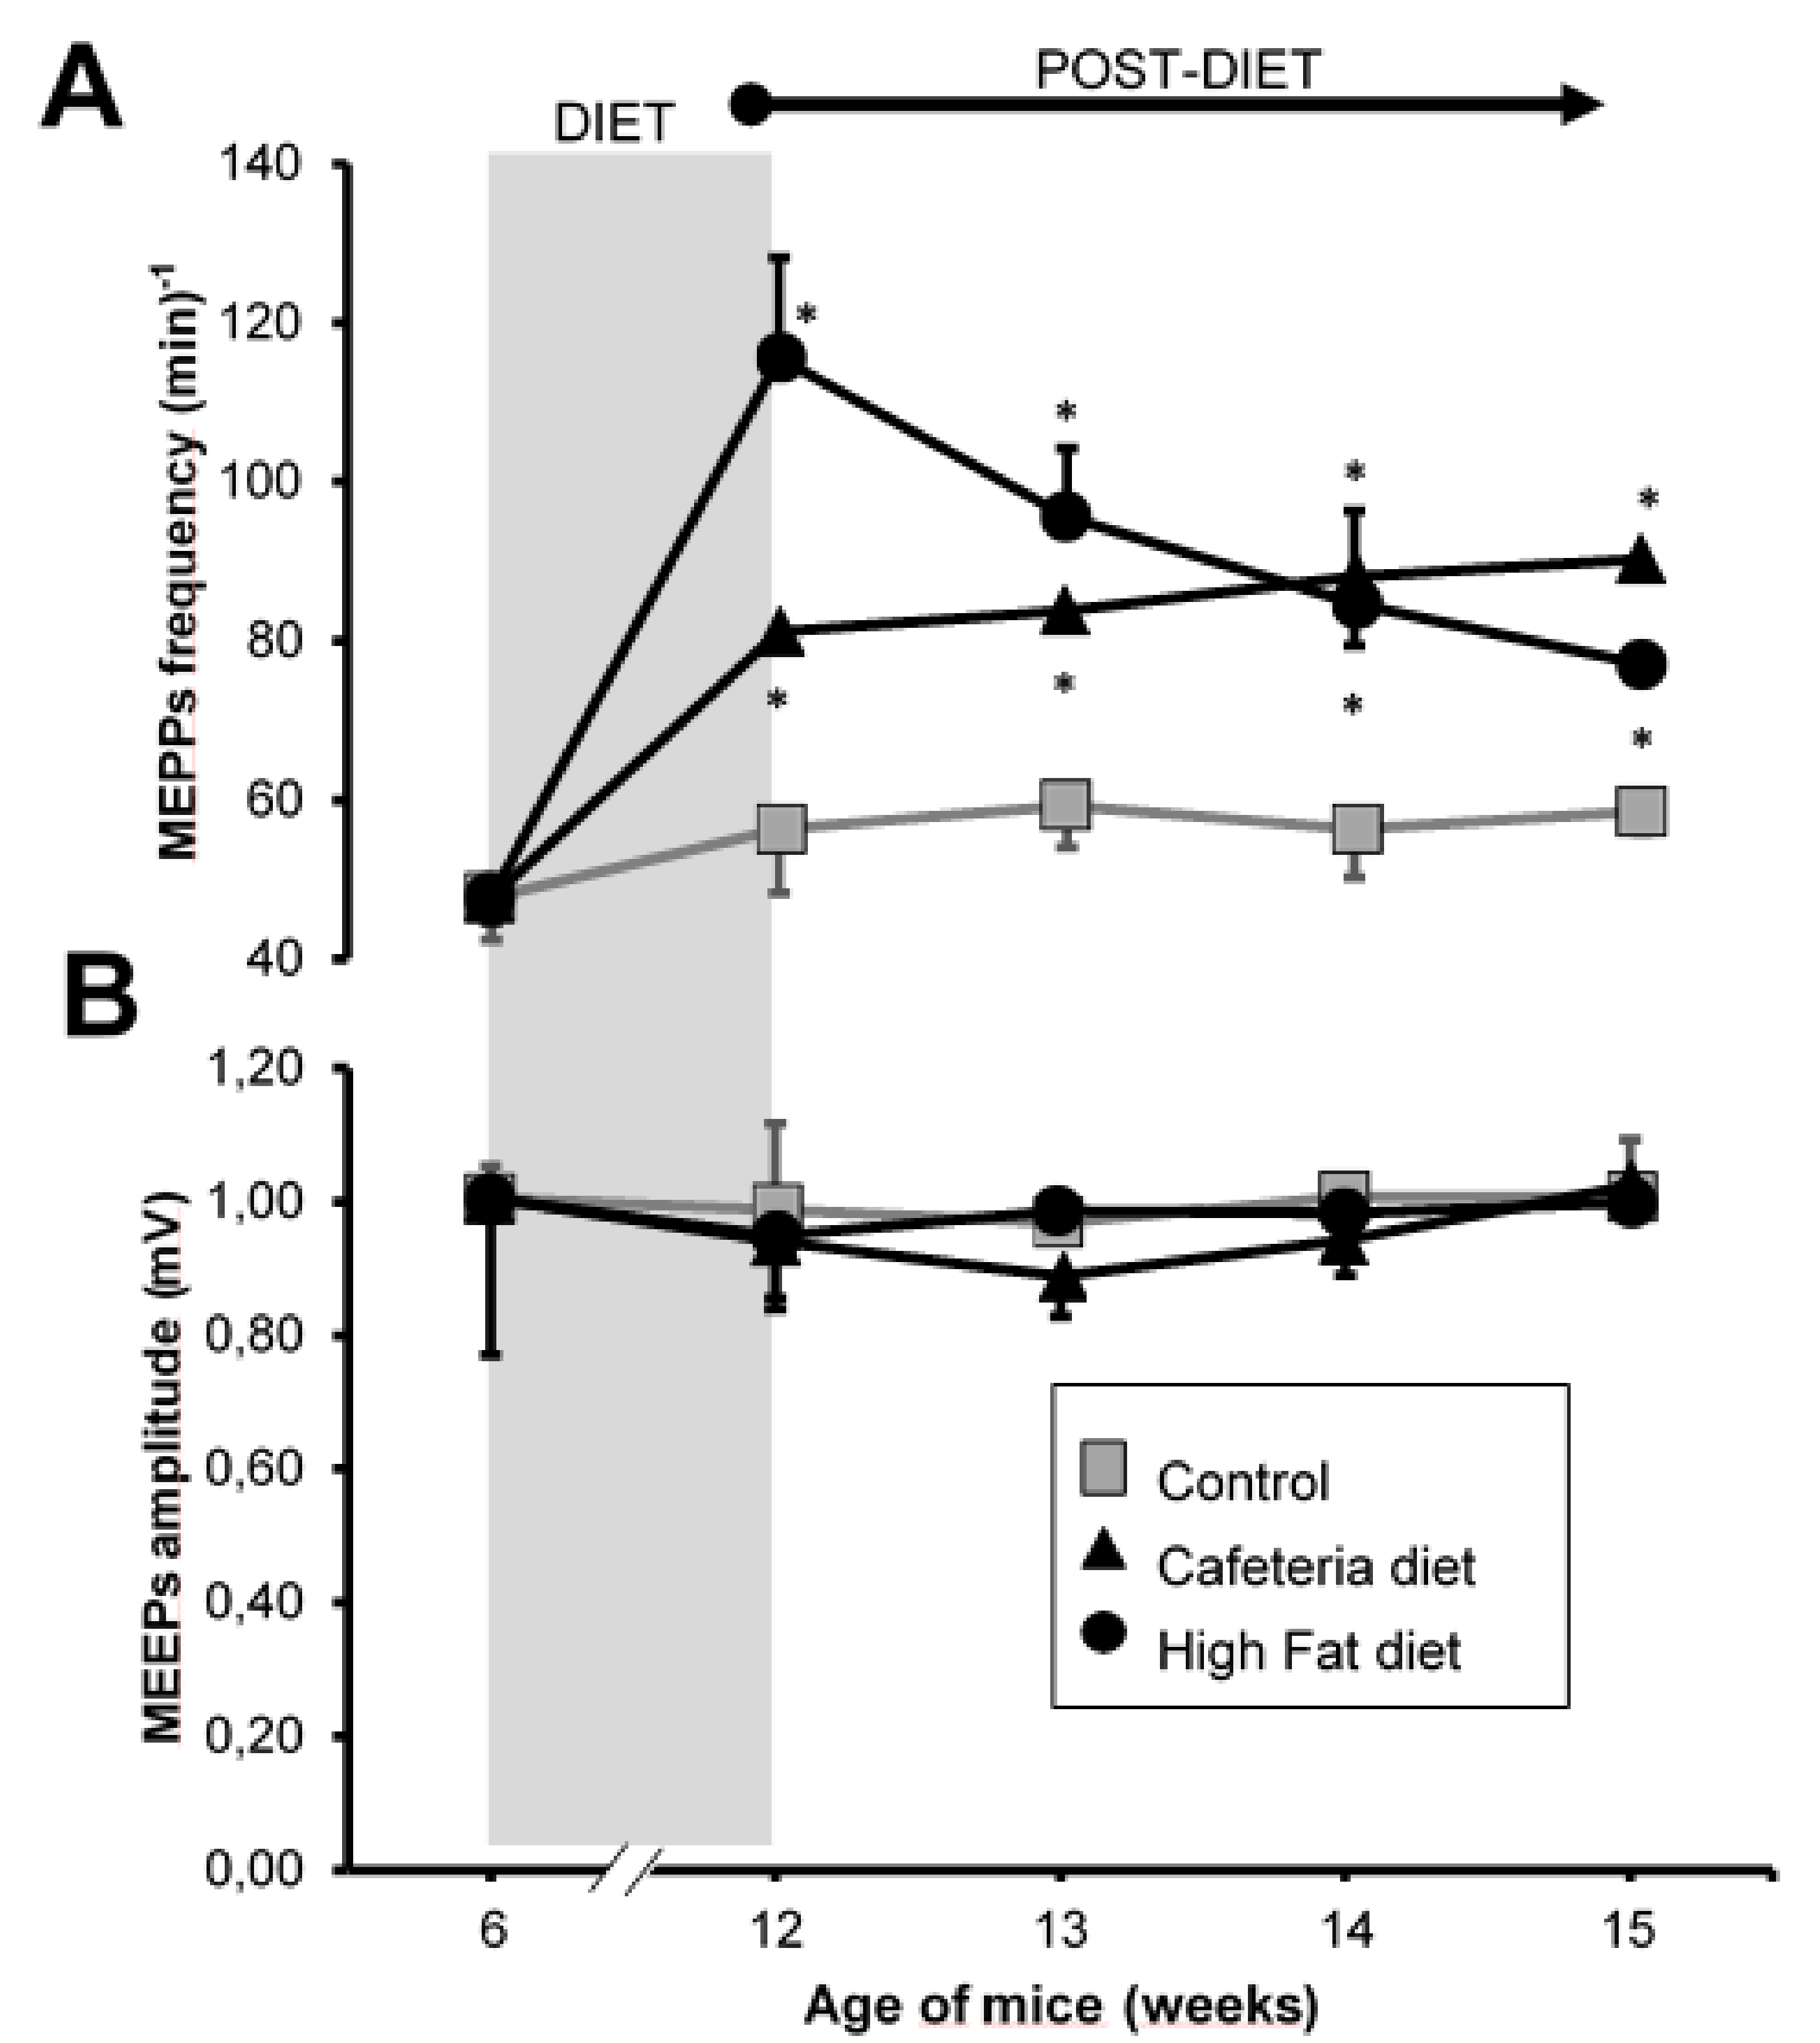
2.5. Electrophysiology: Intracellular Recordings
2.6. Statistical Procedure
3. Results
3.1. Body Weight Evolution
3.2. Muscle Fat
3.3. Electrophysiology: Intracellular Recording
3.4. Electromyography
4. Discussion
4.1. Overweight
4.2. Muscle Fat
4.3. Spontaneous Neurotransmission
5. Conclusions
Supplementary Materials
Author Contributions
Funding
Acknowledgments
Conflicts of Interest
References
- Hruby, A.; Hu, F.B. The epidemiology of obesity: A Big Picture. Pharmacoeconomics 2015, 33, 673–689. [Google Scholar] [CrossRef] [PubMed]
- Obesidad y Sobrepeso. Available online: https://www.who.int/es/news-room/fact-sheets/detail/obesity-and-overweight (accessed on 26 July 2020).
- Kelly, T.; Yang, W.; Chen, C.S.; Reynolds, K.; He, J. Global burden of obesity in 2005 and projections to 2030. Int. J. Obes. 2008, 32, 1431–1437. [Google Scholar] [CrossRef] [PubMed] [Green Version]
- Okifuji, A.; Hare, B. The association between chronic pain and obesity. J. Pain Res. 2015, 8, 399. [Google Scholar] [CrossRef] [Green Version]
- Grotle, M.; Hagen, K.B.; Natvig, B.; Dahl, F.A.; Kvien, T.K. Obesity and osteoarthritis in knee, hipand/or hand: An epidemiological study in the general population with years follow-up. BMC Musculoskelet. Disord. 2008, 9, 132. [Google Scholar] [CrossRef] [PubMed] [Green Version]
- Luime, J.J.; Kuiper, J.I.; Koes, B.W.; Verhaar, J.A.; Miedema, H.S.; Burdorf, A. Work-related risk factorsfor the incidence and recurrence of shoulder and neck complaints among nursing-home andelderly-care workers. Scand. J. Work Environ. Health 2004, 30, 279–286. [Google Scholar] [CrossRef] [PubMed] [Green Version]
- Bigal, M.E.; Lipton, R.B. Obesity is a risk factor for transformed migraine but not chronictension-type headache. Neurology 2006, 67, 252–257. [Google Scholar] [CrossRef] [PubMed]
- Bigal, M.E. Body Mass Index and Episodic Headaches: A Population-Based Study. Arch. Intern. Med. 2007, 167, 1964–1970. [Google Scholar] [CrossRef]
- Hozumi, J.; Sumitani, M.; Matsubayashi, Y.; Abe, H.; Oshima, Y.; Chikuda, H.; Takeshita, K.; Yamada, Y. Relationship between Neuropathic Pain and Obesity. Pain Res. Manag. 2016, 2016, 2487924. [Google Scholar] [CrossRef] [Green Version]
- Bastard, J.P.; Maachi, M.; Lagathu, C.; Kim, M.J.; Caron, M.; Vidal, H.; Capeau, J.; Feve, B. Recent advances in therelationship between obesity, inflammation, and insulin resistance. Eur. Cytokine Netw. 2006, 17, 4–12. [Google Scholar]
- Gandhi, R.; Perruccio, A.V.; Rizek, R.; Dessouki, O.; Evans, H.M.K.; Mahomed, N.N. Obesity-Related Adipokines Predict Patient-Reported Shoulder Pain. Obes. Facts 2013, 6, 536–541. [Google Scholar] [CrossRef]
- Wu, H.; Ballantyne, C.M. Skeletal muscle inflammation and insulin resistance in obesity. J. Clin. Investig. 2017, 127, 43–54. [Google Scholar] [CrossRef]
- Simons, D.G.; Travell, J.G.; Fernández de las Peñas, C.; Finnegan, M.; Freeman, J.L.; Donnelly, J.M. Travell, Simons & Simons’ Myofascial Pain and Dysfunction: The Trigger Point Manual, 3rd ed.; Wolters Kluwer: Philadelphia, PA, USA, 2019. [Google Scholar]
- Mayoral, O.; Salvat, I. Fisioterapia Invasiva del Síndrome de Dolor Myofascial, 1st ed.; Médica Panamericana: Madrid, Spain, 2017. [Google Scholar]
- Gerwin, R.D.; Dommerholt, J.; Shah, J.P. An expansion of Simons’ integrated hypothesis of trigger point formation. Curr. Pain Headache Rep. 2004, 8, 468–475. [Google Scholar] [CrossRef] [PubMed]
- Shah, J.P.; Phillips, T.M.; Danoff, J.V.; Gerber, L.H. An in vivo microanalytical technique for measuring the local biochemical milieu of human skeletal muscle. J. Appl. Physiol. 2005, 99, 1977–1984. [Google Scholar] [CrossRef] [PubMed] [Green Version]
- Margalef, R.; Sisquella, M.; Bosque, M.; Romeu, C.; Mayoral, O.; Monterde, S.; Priego, M.; Guerra-Perez, R.; Ortiz, N.; Tomàs, J.; et al. Experimental myofascial trigger point creation in rodents. J. Appl. Physiol. 2019, 126, 160–169. [Google Scholar] [CrossRef]
- Simons, D.G.; Hong, C.Z.; Simons, L.S. Endplate Potentials Are Common to Midfiber Myofacial Trigger Points. Am. J. Phys. Med. Rehabil. 2002, 81, 212–222. [Google Scholar] [CrossRef]
- Sampey, B.P.; Vanhoose, A.M.; Winfield, H.M.; Freemerman, A.J.; Muehlbauer, M.J.; Fueger, P.T.; Newgard, C.B.; Makowski, L. Cafeteria Diet Is a Robust Model of Human Metabolic Syndrome With Liver and Adipose Inflammation: Comparison to High-Fat Diet. Obesity 2011, 19, 1109–1117. [Google Scholar] [CrossRef] [PubMed]
- Zeeni, N.; Dagher-Hamalian, C.; Dimassi, H.; Faour, W.H. Cafeteria diet-fed mice is a pertinent model of obesity-induced organ damage: A potential role of inflammation. Inflamm. Res. 2015, 64, 501–512. [Google Scholar] [CrossRef] [PubMed]
- Reynés, B.; García-Ruiz, E.; Díaz-Rúa, R.; Palou, A.; Oliver, P. Reversion to a control balanced diet is able to restore body weight and to recover altered metabolic parameters in adult rats long-term fed on a cafeteria diet. Food Res. Int. 2014, 64, 839–848. [Google Scholar] [CrossRef]
- Lalanza, J.F.; Caimari, A.; del Bas, J.M.; Torregrosa, D.; Cigarroa, I.; Pallàs, M. Effects Of A Post-Weaning Cafeteria Diet In Young Rats: Metabolic Syndrome, Reduced Activity And Low Anxiety-Like Behaviour. PLoS ONE 2014, 9, e85049. [Google Scholar] [CrossRef] [Green Version]
- Rogers, P.J. Returning “cafeteria-fed” rats to a chow diet: Negative contrast and effects of obesity on feeding behaviour. Physiol. Behav. 1985, 35, 493–499. [Google Scholar] [CrossRef]
- Winzell, M.S.; Ahren, B. The High-Fat Diet-Fed Mouse: A Model for Studying Mechanisms and Treatment of Impaired Glucose Tolerance and Type 2 Diabetes. Diabetes 2004, 53, S215–S219. [Google Scholar] [CrossRef] [PubMed] [Green Version]
- Fink, L.N.; Costford, S.R.; Lee, Y.S.; Jensen, T.E.; Bilan, P.J.; Oberbach, A.; Blüher, M.; Olefsky, J.M.; Sams, A.; Klip, A. Pro-Inflammatory macrophages increase in skeletal muscle of high fat-Fed mice and correlate with metabolic risk markers in humans: Muscle Macrophages in Obesity and Diabetes. Obesity 2014, 22, 747–757. [Google Scholar] [CrossRef]
- Song, Z.; Xie, W.; Chen, S.; Strong, J.A.; Print, M.S.; Wang, J.I.; Shareef, A.F.; Ulrich-Lai, Y.M.; Zhang, J.M. High-fat diet increases pain behaviors in rats with or without obesity. Sci. Rep. 2017, 7, 1–14. [Google Scholar] [CrossRef]
- Gasparin, F.R.S.; Carreño, F.O.; Mewes, J.M.; Gilglioni, E.H.; Pagadigorria, C.L.S.; Natali, M.R.M.; Utsunomiya, K.S.; Constantin, R.P.; Ouchida, A.T.; Curti, C.; et al. Sex differences in the development of hepatic steatosis in cafeteria diet-induced obesity in young mice. Biochim. Biophys. Acta Mol. Basis Dis. 2018, 1864, 2495–2509. [Google Scholar] [CrossRef] [PubMed]
- McLachlan, E.M.; Martin, A.R. Non-linear summation of end-plate potentials in the frog and mouse. J. Physiol. 1981, 311, 307–324. [Google Scholar] [CrossRef]
- Khan, I.M.; Perrard, X.Y.; Brunner, G.; Lui, H.; Sparks, L.M.; Smith, S.R.; Wang, X.; Shi, Z.Z.; Lewis, D.E.; Wu, H.; et al. Intermuscular and perimuscular fat expansion in obesity correlates with skeletal muscle T cell and macrophage infiltration and insulin resistance. Int. J. Obes. 2015, 39, 1607–1618. [Google Scholar] [CrossRef] [PubMed] [Green Version]
- García, J.; Engelhardt, J.I.; Appel, S.H.; Stefani, E. Increased MEPP frequency as an early sign of experimental immune-mediated motoneuron disease: Early Sign of Experimental MND. Ann. Neurol. 1990, 28, 329–334. [Google Scholar] [CrossRef]
- Smith, M.M.; Minson, C.T. Obesity and adipokines: Effects on sympathetic overactivity: Adipokines and sympathetic outflow. J. Physiol. 2012, 590, 1787–1801. [Google Scholar] [CrossRef]
- Scherrer, U.; Randin, D.; Tappy, L.; Vollenweider, P.; Jéquier, E.; Nicod, P. Body fat and sympathetic nerve activity in healthy subjects. Circulation 1994, 89, 2634–2640. [Google Scholar] [CrossRef] [Green Version]
- Chen, J.T.; Chen, S.M.; Kuan, T.S.; Chung, K.C.; Hong, C.Z. Phentolamine effect on the spontaneous electrical activity of active loci in a myofascial trigger spot of rabbit skeletal muscle. Arch. Phys. Med. Rehabil. 1998, 79, 790–794. [Google Scholar] [CrossRef]
- McNulty, W.H.; Gevirtz, R.N.; Hubbard, D.R.; Berkoff, G.M. Needle electromyographic evaluation of trigger point response to a psychological stressor. Psychophysiology 1994, 31, 313–316. [Google Scholar] [CrossRef] [PubMed]
- Khan, M.M.; Lustrino, D.; Silveira, W.A.; Wild, F.; Straka, T.; Issop, Y.; O’Connor, E.; Cox, D.; Reischl, M.; Marquardt, T.; et al. Sympathetic innervation controls homeostasis of neuromuscular junctions in health and disease. Proc. Natl. Acad. Sci. USA 2016, 113, 746–750. [Google Scholar] [CrossRef] [PubMed] [Green Version]
- Coccurello, R.; Maccarrone, M. Hedonic Eating and the “Delicious Circle”: From Lipid-Derived Mediators to Brain Dopamine and Back. Front. Neurosci. 2018, 12, 271. [Google Scholar] [CrossRef] [Green Version]
- Stice, E.; Figlewicz, D.P.; Gosnell, B.A.; Levine, A.S.; Pratt, W.E. The contribution of brain reward circuits to the obesity epidemic. Neurosci. Biobehav. Rev. 2013, 37, 2047–2058. [Google Scholar] [CrossRef] [Green Version]
- Totsch, S.K.; Waite, M.E.; Sorge, R.E. Dietary Influence on Pain via the Immune System. Prog. Mol. Biol. Transl. Sci. 2015, 131, 435–469. [Google Scholar] [PubMed]
- Totsch, S.K.; Quinn, T.L.; Strath, L.J.; McMeekin, L.J.; Cowell, R.M.; Gower, B.A.; Sorge, R.E. The impact of the Standard American Diet in rats: Effects on behavior, physiology and recovery from inflammatory injury. Scand. J. Pain 2017, 17, 316–324. [Google Scholar] [CrossRef]
- Matikainen-Ankney, B.A.; Kravitz, A.V. Persistent effects of obesity: A neuroplasticity hypothesis: Neuroplasticity hypothesis of obesity. Ann. N. Y. Acad. Sci. 2018, 1428, 221–239. [Google Scholar] [CrossRef]


| CAD | HFD | Regular Chow Diet | |
|---|---|---|---|
| Calories (kcal) | 459 | 532 | 397 |
| Total Fat | 23 | 60.6 | 6.9 |
| Saturated Fat | 11 | 21.7 | - |
| Total Carbohydrate | 56 | 26.3 | 68 |
| Sugars | 24 | 9.7 | - |
| Dietary Fiber | 2.5 | - | - |
| Protein | 5.3 | 13.1 | 25 |
| Sodium | 0.65 | 0.23 | 0.3 |
| Procedure | Age | Control | CAD | HFD |
|---|---|---|---|---|
| 1: 6 weeks of age; 2: 6 weeks with diet | 12 weeks | 38.00 ± 2.85 (n = 20) | 58.03 ± 4.04 * (n = 20) | 55.15 ± 1.39 * (n = 20) |
| 1: 6 weeks of age; 2: 6 weeks with diet; 3: 1 week without diet | 13 weeks | 43.73 ± 0.88 (n = 12) | 45.53 ± 1.03 (n = 12) | 45.11 ± 2.11 (n = 12) |
| 1: 6 weeks of age; 2: 6 weeks with diet; 3: 2 weeks without diet | 14 weeks | 43.24 ± 0.86 (n = 8) | 45.50 ± 0.98 (n = 8) | 43.97 ± 3.09 (n = 8) |
| 1: 6 weeks of age; 2: 6 weeks with diet; 3: 3 weeks without diet | 15 weeks | 42.17 ± 2.85 (n = 4) | 44.67 ± 1.22 (n = 4) | 43.25 ± 2.57 (n = 4) |
Publisher’s Note: MDPI stays neutral with regard to jurisdictional claims in published maps and institutional affiliations. |
© 2020 by the authors. Licensee MDPI, Basel, Switzerland. This article is an open access article distributed under the terms and conditions of the Creative Commons Attribution (CC BY) license (http://creativecommons.org/licenses/by/4.0/).
Share and Cite
Gimenez-Donoso, C.; Bosque, M.; Vila, A.; Vilalta, G.; Santafe, M.M. Effects of a Fat-Rich Diet on the Spontaneous Release of Acetylcholine in the Neuromuscular Junction of Mice. Nutrients 2020, 12, 3216. https://0-doi-org.brum.beds.ac.uk/10.3390/nu12103216
Gimenez-Donoso C, Bosque M, Vila A, Vilalta G, Santafe MM. Effects of a Fat-Rich Diet on the Spontaneous Release of Acetylcholine in the Neuromuscular Junction of Mice. Nutrients. 2020; 12(10):3216. https://0-doi-org.brum.beds.ac.uk/10.3390/nu12103216
Chicago/Turabian StyleGimenez-Donoso, Carlos, Marc Bosque, Anna Vila, Gemma Vilalta, and Manel M Santafe. 2020. "Effects of a Fat-Rich Diet on the Spontaneous Release of Acetylcholine in the Neuromuscular Junction of Mice" Nutrients 12, no. 10: 3216. https://0-doi-org.brum.beds.ac.uk/10.3390/nu12103216