Article

A Comparison of Total Food Intake at a Personalised Buffet in People with Obesity, before and 24 Months after Roux-en-Y-Gastric Bypass Surgery

1
Diabetes Complications Research Centre, School of Medicine, University College Dublin, D04 V1W8 Dublin, Ireland
2
The Nutrition Innovation Centre for Food and Health, Ulster University, Coleraine BT52 1SA, UK
3
Department of Surgery, Bon Secours Hospital, T12 DV56 Cork, Ireland
4
Department of Surgery, Letterkenny University Hospital, F92 AE81 Letterkenny, Ireland
5
Department of Psychology and Program in Neuroscience, Florida State University, Tallahassee, FL 32306, USA
6
Centre for Diabetes, Ulster University, Coleraine BT52 1SA, UK
*
Author to whom correspondence should be addressed.
Submission received: 1 September 2021 / Revised: 27 October 2021 / Accepted: 28 October 2021 / Published: 29 October 2021

Abstract

:
Long-term reductions in the quantity of food consumed, and a shift in intake away from energy dense foods have both been implicated in the potent bariatric effects of Roux-en-Y gastric bypass (RYGB) surgery. We hypothesised that relative to pre-operative assessment, a stereotypical shift to lower intake would be observed at a personalised ad libitum buffet meal 24 months after RYGB, driven in part by decreased selection of high energy density items. At pre-operative baseline, participants (n = 14) rated their preference for 72 individual food items, each of these mapping to one of six categories encompassing high and low-fat choices in combination with sugar, complex carbohydrate or and protein. An 18-item buffet meal was created for each participant based on expressed preferences. Overall energy intake was reduced on average by 60% at the 24-month buffet meal. Reductions in intake were seen across all six food categories. Decreases in the overall intake of all individual macronutrient groups were marked and were generally proportional to reductions in total caloric intake. Patterns of preference and intake, both at baseline and at follow-up appear more idiosyncratic than has been previously suggested by verbal reporting. The data emphasise the consistency with which reductions in ad libitum food intake occur as a sequel of RYGB, this being maintained in the setting of a self-selected ad libitum buffet meal. Exploratory analysis of the data also supports prior reports of a possible relative increase in the proportional intake of protein after RYGB.

1. Introduction

Roux-en-Y Gastric Bypass (RYGB), is one of the most commonly used surgical interventions worldwide for obesity, resulting in 20–30% reductions in body weight within the first post-operative year in the majority of patients [1]. The gradient of weight loss following surgery is not constant; being characterized by a steep period of accelerated weight loss during the first 6 post-operative months tapering thereafter towards weight stability within 18–24 months [2,3,4]. Although in the longer term, many patients experience some degree of weight regain, weight typically remains substantially reduced relative to pre-operative level [5,6]. In this sense, the trajectory of weight loss, prolonged weight-loss maintenance, and attenuated weight regain observed after bariatric surgery stands in contrast to the common finding of weight-loss recidivism within 2 years of follow-up after diet and lifestyle interventions [7,8].
Reductions in energy intake are observed following RYGB, particularly during the first post-operative year [9,10,11,12,13]. Over time following RYGB, whilst energy intake has been reported to increase, it does not typically return to pre-operative levels [12,13,14].
Uncertainty exists regarding the key mechanisms underpinning reductions in energy intake after RYGB. The relative importance of decreased overall portion sizes versus shifts in food preference and intake away from energy-dense foods remains an area of active investigation [15]. Studies in rat models of RYGB demonstrate a shift in preference away from high fat and high sugar foods after surgery [16,17,18,19]. In human clinical research, several studies report that after bariatric surgery, patients shift their preferences from high fat and high sugar foods to healthier options such as fruits and vegetables [9,10,16,20,21,22]. The studies reporting these changes have relied on verbal reporting and food questionnaires [23,24,25].
Various hypotheses have been advanced to explain why food preferences might change post-surgery. Patients do often report post-prandial anxiety and nausea, when foods high in simple sugars are ingested, consistent with early dumping syndrome. This could in turn result in conditioned avoidance of certain foods [26,27,28]. Another potential mechanism involves alterations in taste sensitivity for sugary foods as well as reduced palatability of high fat foods [19]. Reductions in the hedonic value of energy-dense foods could also constitute a reason for a shift to healthier options [26,27,29].
Recently Neilsen et al., used direct measurement of food intake at an investigator defined ad libitum buffet meal before and after surgery [30]. The authors did not observe changes in food preference in patients undergoing RYGB or sleeve gastrectomy (SG) [30] but did report that the magnitude of decrease in energy intake, the selection of less energy dense foods, and increases in protein intake found at 6 months after surgery, predicted the subsequent level of weight loss achieved at 18-month follow-up [31].
The approach used in the present study sought to further validate the impact of RYGB on food intake by asking study participants to consume ad libitum from an 18-item buffet meal, the components of which were personalized to each participant based on their own ratings at baseline of 72 individual food items across 6 categories using a validated food preference questionnaire (FPQ) [32]. Changes in overall food intake were assessed between buffet meal study visits conducted at pre-operative baseline, and at 24 month follow up after surgery. The percentage contribution to energy intake according to macronutrient group was explored in parallel. We hypothesised that directly measured reductions in food intake after RYGB surgery would persist in the context of a self-selected, personal preference based, ad libitum buffet. Through detailed recording of the food selected, we sought to investigate whether the intake of any food category or macronutrient group was consistently altered as a component of overall reductions in intake.

2. Materials and Methods

2.1. Study Population

The study was approved by the Ethics and Medical Research Facility, St. Vincent’s University Hospital. Participants referred to the Bariatric Surgery Service at St Vincent’s University Hospital, St Columcille’s Hospital, Loughlinstown, Letterkenny General Hospital and The Cork Clinic, Ireland were considered for recruitment between June 2016 and July 2019. Inclusion criteria for the study stipulated that to be eligible as participants, study volunteers were to be scheduled to undergo RYGB, be independently mobile, have capacity to consent to participate and be at least 18 years of age. Exclusion criteria included any systemic or gastrointestinal condition which may affect food intake or preference, pregnancy or breast feeding, medications with a documented effect on food intake or food preference, a history of significant food allergy, any specific dietary restrictions or any significant cognitive or communication issues.
RYGB surgery involves the division of the stomach into two parts—an upper stomach pouch and a lower remnant stomach which remains in situ in continuity with the duodenum. The stomach pouch (15–30 mL) is anastomosed to the distal limb of a mid-jejunal transection, created 30 to 75 cm distal to the ligament of Treitz (Roux limb). In order to preserve continuity of the intestine, jejunojejunostomy is then completed by anastomosis of the proximal limb of the jejunotomy to a point 75–150 cm distal to the gastrojejunostomy. Therefore, food transits straight to the small intestine and the biliopancreatic secretions and secretions from the remnant stomach meet with the ingestants in the common channel, which runs distal to the Y-shaped jejunojejunostomy [33].
Informed written consent was obtained from 26 eligible participants and 14 (63%) conducted both baseline and 24-month follow-up study visits We present data drawn from repeated measures analysis of these 14 study completers, formally comparing total and macronutrient specific intake across study visits and exploring underlying patterns of food preference and evidence of any consistent changes therein.

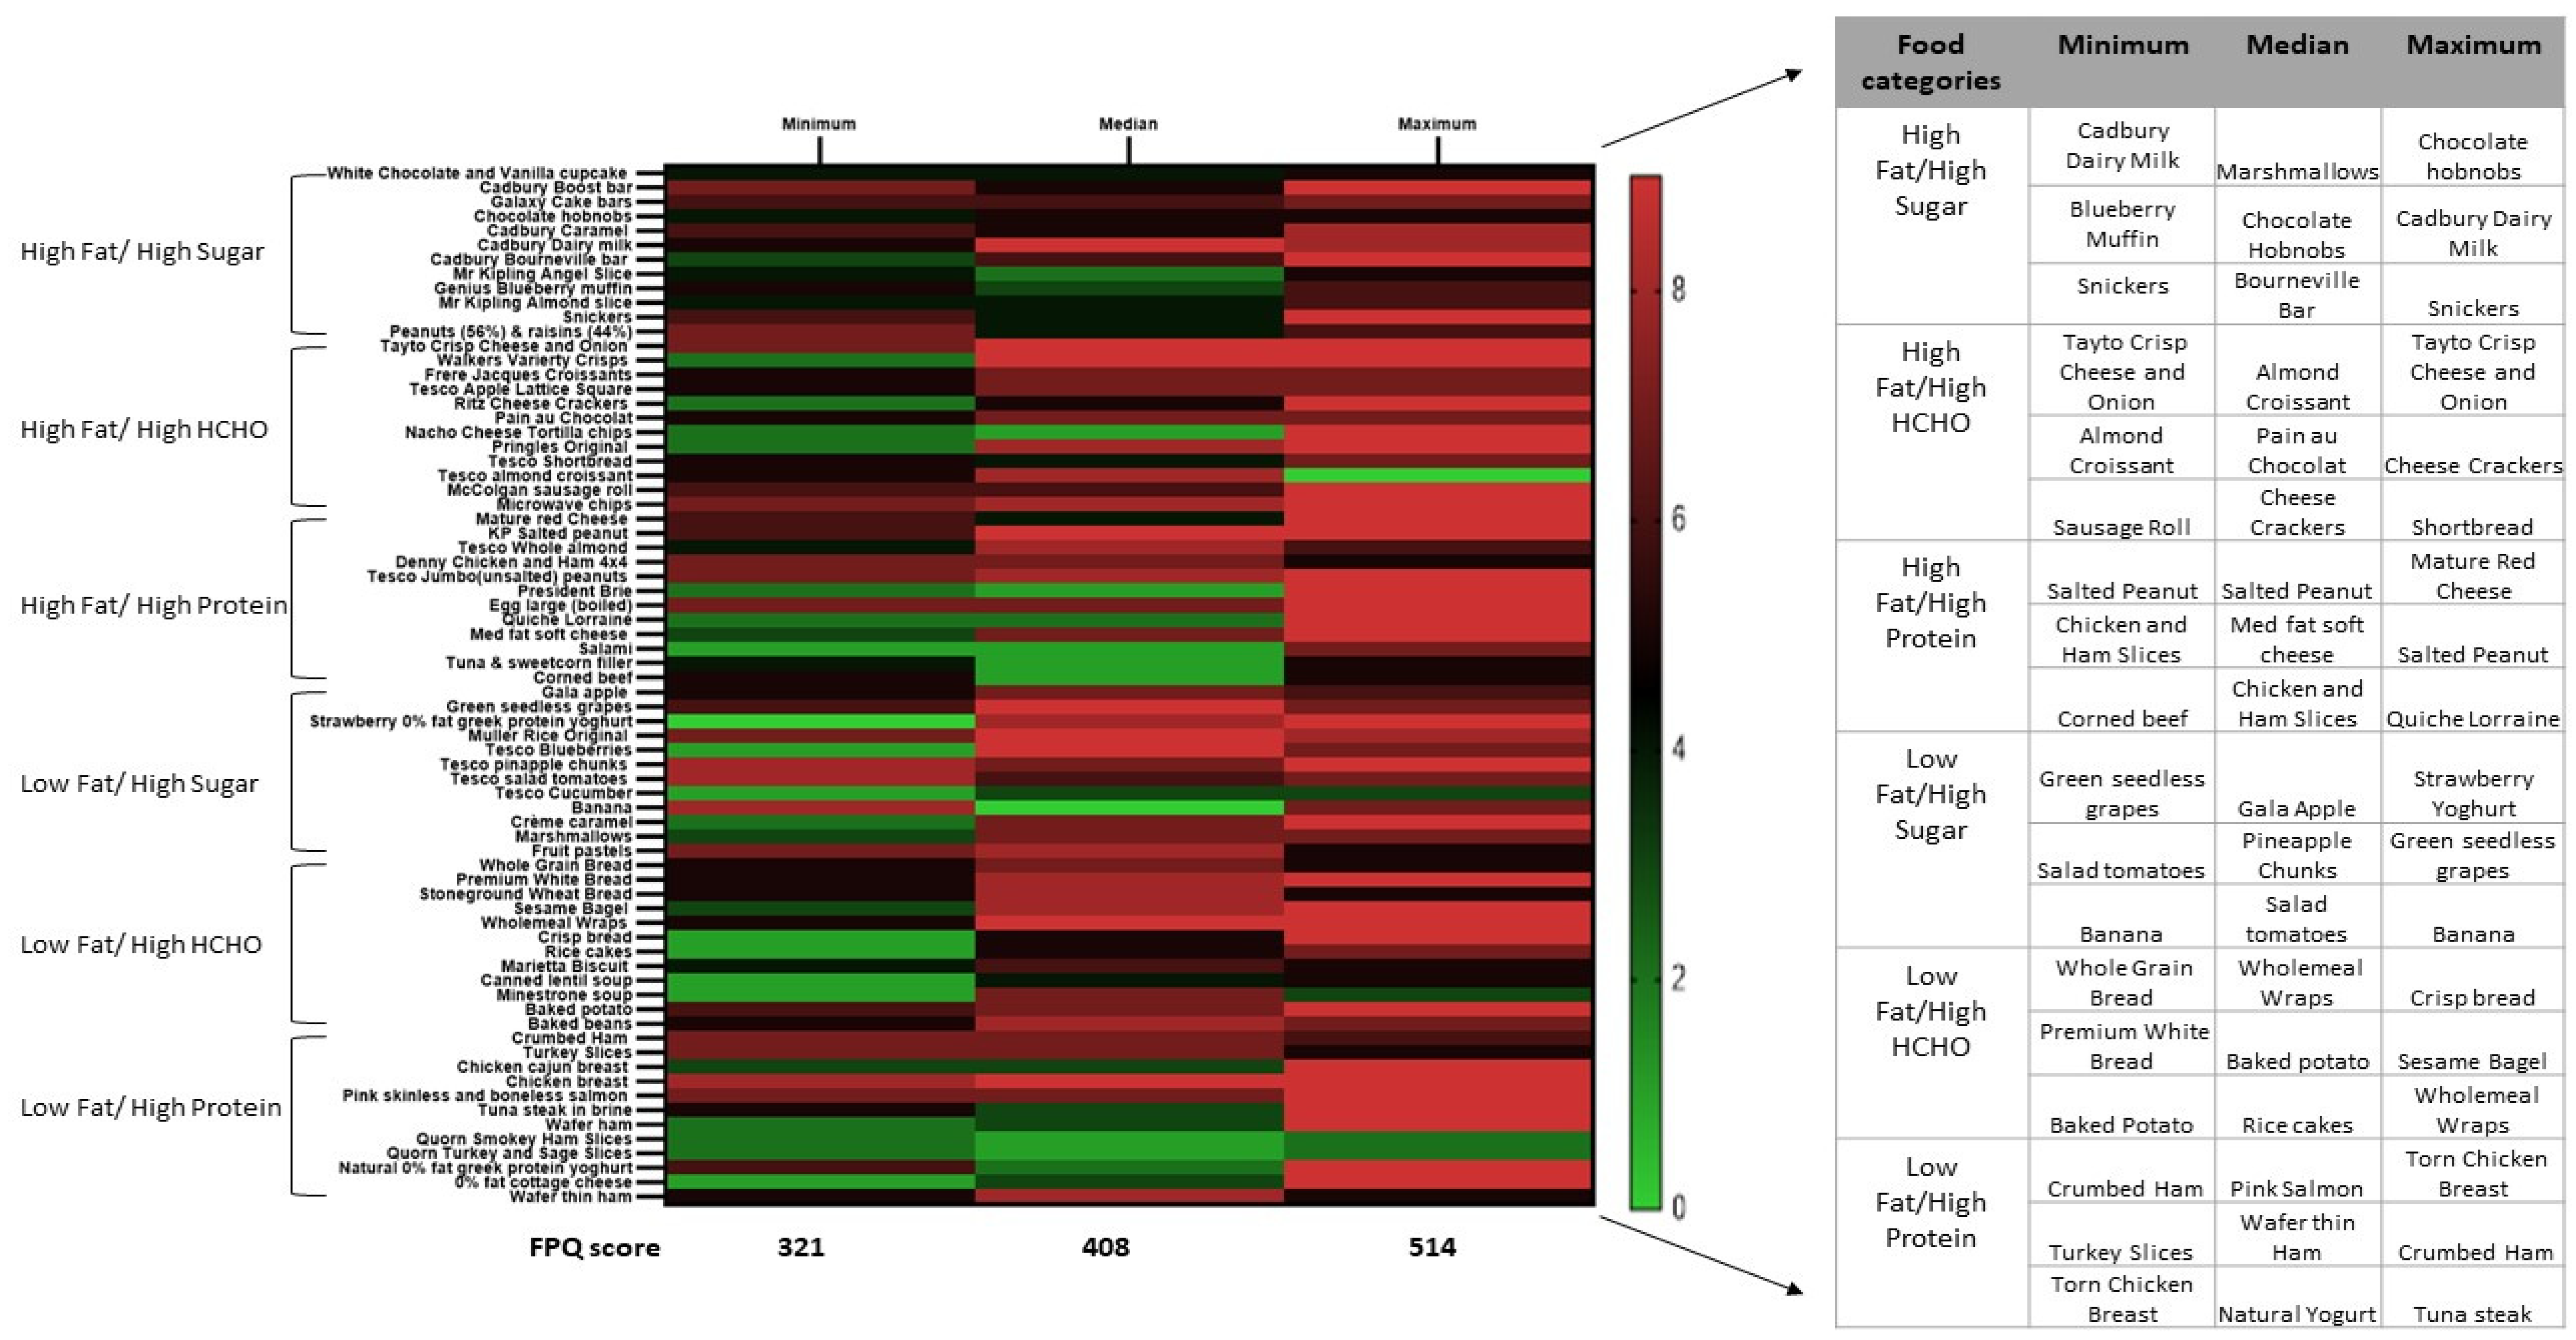
2.2. Food Preference Questionnaire

At the screening visit participants were asked to rate their preferences for 72 different food items from a 72-item FPQ based on the model developed by Geiselman et al., incorporating high and low-fat content items in complex with protein, simple sugar or complex carbohydrates [32]. We refined the questionnaire to suit the Irish population by including common food items widely available in Irish supermarket stores. Items categorised into one of six different groups depending on their macronutrient character were listed in no particular order. Participants were asked to rate each individual item along a 9-point scale with the following anchors: 1 = dislike extremely; 5 = neutral; 9 = like extremely. Responses from the FPQ were used to select appropriate food items from the stock list of 72 items (Appendix A) for use in a personalised 18-item buffet spread. For each participant the total overall score recorded for the FPQ food preference questionnaire was calculated out of 648 (9 highest Likert scale ranking ×72 items of food).

2.3. Study Visits

The baseline study visit was conducted one month before surgery and the comparator study visit took place 24 months after surgery. Variable numbers of participants also attended for study visits at 3- and 12-month follow-up. For each visit the participants arrived at 1030 at the St Vincent’s University Hospital Clinical Research Centre (CRC). All participants were fasting from 2200 the previous evening. Weight, height and waist circumference were recorded. At 1100, a room in the CRC was prepared with an 18-item buffet spread selected based on their FPQ responses at screening. High fat and low-fat options were combined with varying simple sugar, complex carbohydrate and protein content, as depicted in Table 1. The study endeavoured to provide each participant with foods to which he/she had assigned an intermediate hedonic rating of between 5 and 7. High fat foods given to an individual participant were paired with a low-fat variation of the same food, e.g., high- and low-fat meat options, high- and low-fat cheese options. The order in which foods were presented in the buffet spread was randomised at each study visit. Containers of known weight of the 18 test foods were provided to each participant. In addition to this, basic condiments such as mayonnaise, ketchup, peanut butter, butter, spread, strawberry jam, salt, pepper along with drinks such as coke, diet coke, sprite, diet sprite in cans and carton milk were also provided. Two 500 mL bottles of water were also supplied.
Participants were instructed to eat their meal within 60 min and consume as much food as they wished in order to feel “comfortably full”. They were asked to switch off their electronic devices. After 60 min, once the participant had left a member of the research team recorded the exact quantity of each food item chosen by each participant by determining change in test food container weight. The same researcher used the same weighing scale throughout the study to weigh every item. The amount of macronutrient consumed from each food item was recorded and its caloric value calculated based on nutritional information labelling provided by the producer. Percentage contributions of fat, total carbohydrate, simple sugar and protein to overall energy intake were calculated.

2.4. Experimental Power and Inferential Statistics

The study aimed to satisfy requirements for the detection of a reduction of one-third in ad libitum total food intake as the primary outcome, controlling for type 1 and type 2 error rates of 5% and 20% respectively and recruiting at approximately 200% power to mitigate for potential drop out between the baseline visit and 24 months.
Data assessed by inferential statistics were expressed as mean ± standard error of the mean (SEM). Paired t-tests (parametric data-weight, waist circumference and absolute caloric intake) were used to compare baseline vs 24 months data. A two-sided Fisher’s exact test was carried out to compare proportions of participants who did and did not consume a specific food category at baseline vs at 24 months. Results were deemed significant at when p < 0.05.
The data pertaining to preference across macronutrient groups are exploratory in nature and presented as mean difference, standard deviation and associated 95% confidence interval. All data were analysed using GraphPad Prism® software (Version 4) (GraphPad Software, Inc., San Diego, CA, USA).

3. Results

3.1. Study Participants

A total of 14 participants were included in the analysis. Table 2 shows the baseline characteristics of these participants. The study cohort was 70% female with a mean age was 51.0 ± 7.8 years. Mean BMI was 50.1 ± 7.8 kg/m2 at baseline.

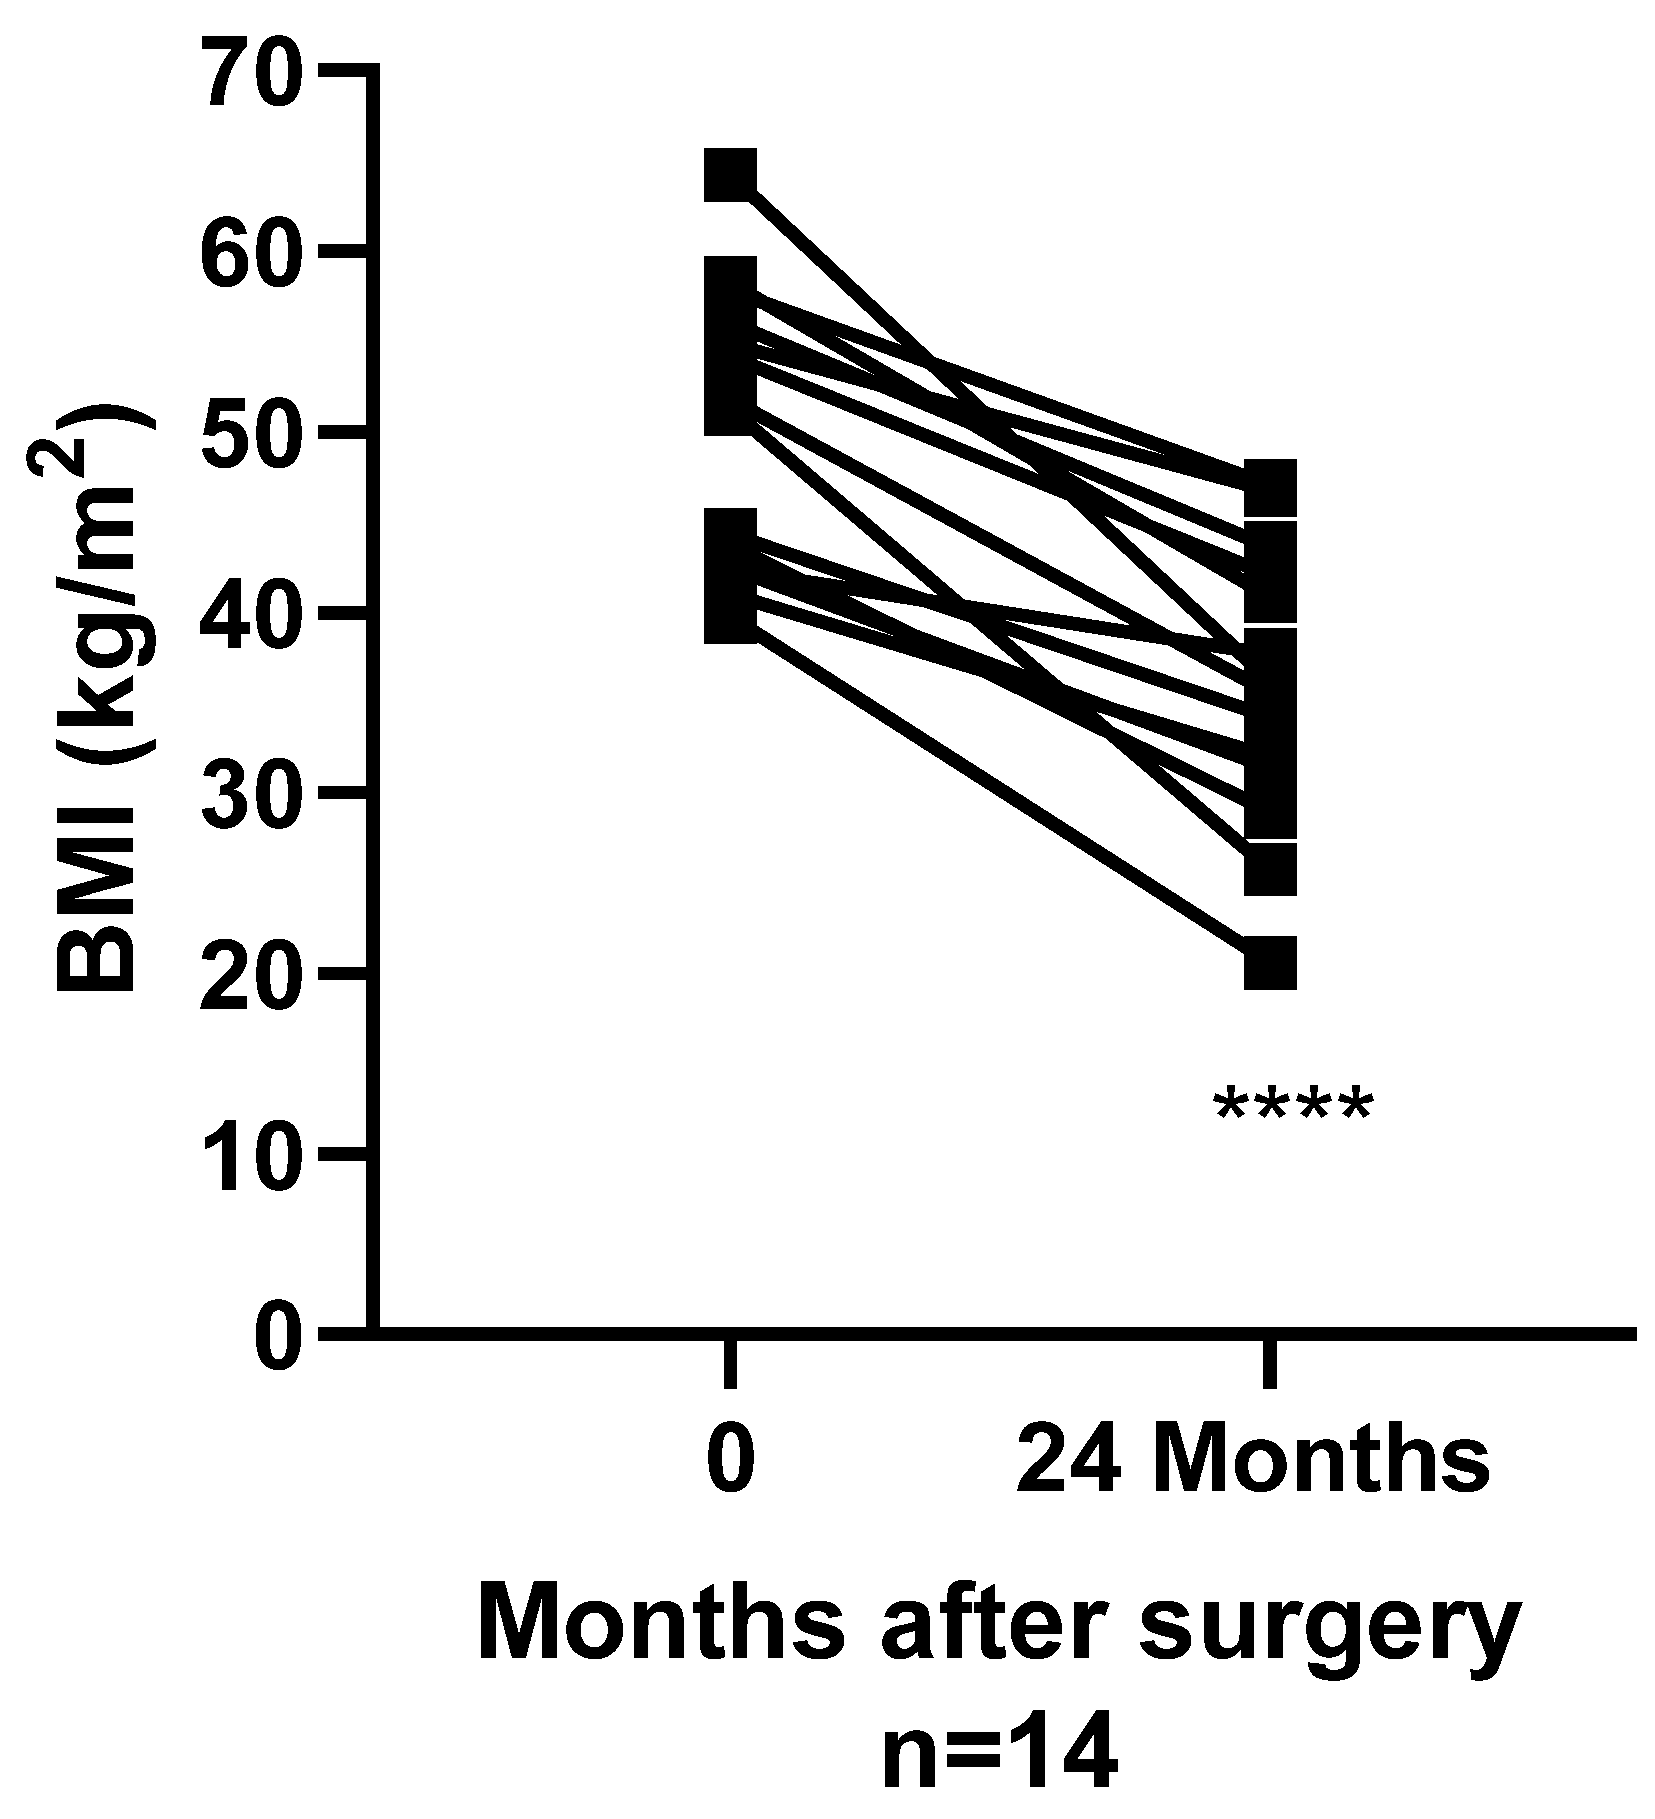
3.2. Surgery Induced Changes in BMI

At 24 months post-RYGB, BMI had decreased from 50.1 ± 7.8 kg/m2 to 35.9 ± 7.8 kg/m2 (p < 0.01) (Figure 1). Waist circumference reduced from 140.5 ± 14.7cm to 114.6 ± 18.4 cm (p < 0.01).

3.3. Questionnaire Based Food Preference Ratings at Baseline

Totals from the pre-operative food preference rating questionnaire showed a range of overall ratings for the 72 items extending from a minimum rating of 321 (49.5%), to a median rating of 406 (62.7%) and a maximum rating of 514 (79.3%) (Figure 2). The Median ratings for the six food categories were: High Fat/ High Sugar—5.75, High Fat/High Complex Carbohydrates—6.5, High Fat/High Protein—5.25, Low Fat/High Sugar—7, Low Fat/High Complex Carbohydrates—7 and Low Fat/High Protein—6.25. The heat map (Figure 2) shows the ratings on the Likert scale and the selections made from the FPQ for each food category for the participant with minimum, median, and maximum rating.

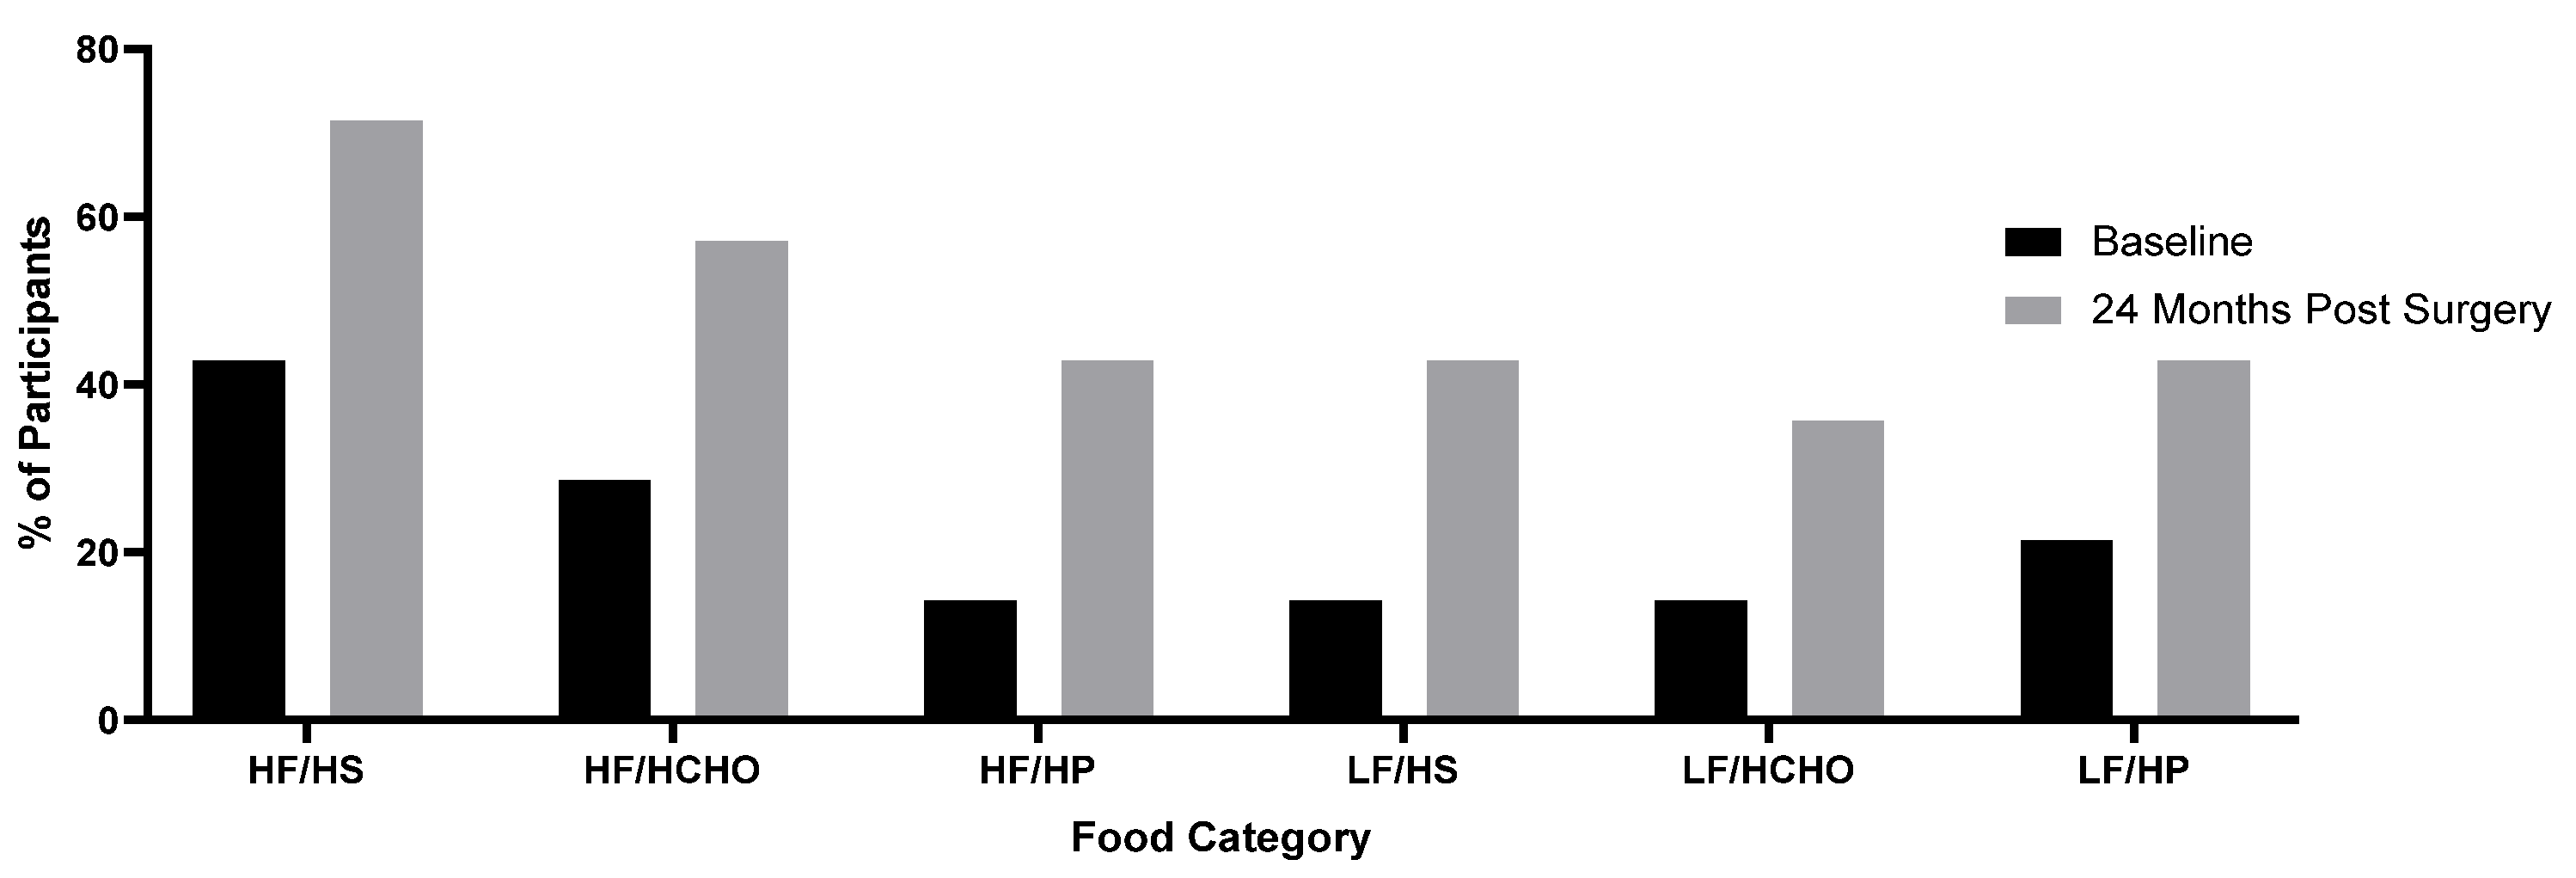
3.4. Changes in Absolute Intake

At 24 months post-surgery, food intake was on average reduced by 60.9% with respect to baseline intake (p < 0.01) (Table 3), exceeding by approximately two-fold conservative a priori estimates of an attenuated reduction in food intake when food items are presented based on self-selection. With respect to individual macronutrients, there was a 59% reduction in fat intake from baseline to 24 months post-surgery (p < 0.01), a 67% reduction in sugar intake from baseline to 24 months post-surgery (p < 0.01), a 67% reduction in total carbohydrate intake from baseline to 24 months post-surgery (p < 0.01) and a 43% reduction in protein intake from baseline to 24 months post-surgery (p < 0.01) (Table 3).
Intake from the 6 food categories varied; and not all categories were consumed by all participants at baseline and 24 months post-surgery (Figure 3). As a general pattern, consumption of all food categories was reduced at follow-up. At baseline, 57% consumed High Fat /High Sugar items and this dropped to 28.5% of participants at follow-up (p < 0.01). High Fat /High Complex Carbohydrates items were consumed by 71% of participants at baseline and by 41% of participants at follow-up. At baseline 85% consumed High Fat/High Protein items, this dropped by 33% to 57% of participants at follow-up (p = 0.03). Low Fat/High Sugar items were consumed by 85% at baseline and by 57% of participants at follow-up. Low Fat/High Complex Carbohydrate items were consumed by 85% baseline, and this dropped by 25% to 64% of participants at follow-up (p = 0.01). Low Fat/High Protein items were consumed by 78% of participants at baseline and by 57% of participants at follow-up (Figure 3).
No consistent trends were observable with respect to changes in the proportional representation of fat, simple sugars or total carbohydrates in food consumption patterns across visits (Table 4). However, the data did demonstrate a consistent trend towards an increased representation of protein as a proportion of overall consumption. Based on the wide-confidence interval, the computed power for detection of this magnitude of effect in the present data set was 75%, and hence we report the result in Table 4 as a trend. However, interrogation of the source of the width of the confidence interval reveals that one particular participant consumed only rice cakes, turkey slices and 0% fat-high protein yoghurt at their 24-month visit, for a total energy intake 895 kJ, this being the lowest among all participants at 24 month follow-up. This consumption pattern corresponds to a protein preference of 73%. The group average protein preference at 24 months when this participant’s data are removed is 20.8% (S.D. 10.8), resulting in a mean difference of +6.8% and a narrowing of the 95% confidence interval to 0.34 to 13.2. This sub-analysis meets 80% power and is significant at a p-value of 0.04 on paired analysis.

4. Discussion

Verbal reporting tools are inherently subjective and can be prone to recall bias in terms of under reporting meal size of foods perceived as unhealthy [23,24,25,34] especially in people with obesity in which there may be issues of stigma [35]. The results from this study are not in complete disagreement with prior findings based on verbal report [9,11,12,16,20,21,36,37,38,39,40,41,42,43], but by using a direct measurement-based approach [30,31] eliminate inaccurate recall as a potential source of error.
An important distinction of the present study relative to recent reports is that by factoring in individual patterns of food preference at pre-operative baseline and using this to inform the creation of personalized buffets, the study was equipped to reveal whether the post-surgical reductions in intake previously described persist in a setting wherein participants are invited to consume ad libitum from an individual preference determined spread of food items. We asked participants to- “eat as much as they like till comfortably full” which proved successful with more than 78% of participants managing to eat over 5000 kJ at baseline, with the highest amount of energy intake consumed being 13,096 kJ.
Whilst the FPQ approach did point to a relatively higher hedonic rating in general for foods containing sugar, there was real diversity in the nature and breadth of expressed preferences. This highlights the likely multifactorial genesis of food preference in humans which may defy its classification according to a reductionist perspective on the relationship between taste, and appetitive and consummatory behaviour. The overall reduction in the quantity of food consumed across all macronutrient categories at 24-month follow-up was the most striking feature of the analysis. It may be argued that participants ate less in order to meet with their perception of what researcher expectations would be of how they should behave after surgery. This cannot be completely discounted but were it the case, a clearer shift in apparent preferences towards calorie sparse and stereotypically healthy choices might have been anticipated There was in fact a reduction in the proportion of participants choosing food items from across the six defined categories, when buffet intake was assessed by macronutrient type, there was no clear evidence of reduced preference for high fat, high sugar items as had been hypothesized. There was, however, some evidence that after RYGB, there is an increase in the percentage contribution of protein to energy intake. The large magnitude reduction in total ad libitum intake is in agreement with the recent findings from researcher defined buffet meals [30,44,45]. None of these studies resolved a proportional change in food preference, but it could be argued that none took into account baseline individualised preferences. It is interesting however to note that increases in the relative contribution of protein to overall intake at a buffet meal 6 months after surgery showed a modest correlation with weight loss at 18 months [31]. This observation in combination with the indication from the present study of a shift towards low-fat, protein enriched food item selection could be suggestive of a link between lean mass loss as a component of total weight loss after surgery and an increase in preference for high protein items in the diet. This concept has not been widely discussed as a potential driver of changes in dietary choices after surgery, which has hitherto focused more on palatability, reward and post-ingestive symptoms as an explanation. In rats, dietary protein restriction conditions animals towards protein seeking behaviour [45]. By analogy, it is tempting to speculate that lean mass loss—an undesirable but well acknowledged consequence of surgery amenable to treatment with amino-acid supplementation [46]—could lead patients to preferentially select protein rich food items as part of a process of physiological compensation after surgery.
The results of the present study differ from findings obtained using a comparable paradigm in preclinical research in rats, Mathes et al., used a cafeteria diet incorporating low fat and high fat options coupled with low sugar and high sugar. The study reported a shift away from fat towards an increase in carbohydrate intake after RYGB which was not seen here. It is worth noting, however, that Mathes et al. [19] also reported a slight but significant increase in relative protein intake after RYGB in rats. However, apparent discrepancy between the findings from animal and human studies employing direct measures of choice and intake may be more apparent than real. Rodents are not subject to nutritional counselling. Moreover, the same cognitive, economic, and social factors that are part and parcel of human feeding are not at play in animal models. Finally, whereas rodents are raised on a single diet, sometimes a choice of two, humans have a lifetime of diverse experiences with a variety of foods. Given that there is evidence in rodent models that learning may play a role in guiding food choices after RYGB [16,18,19,47], the relative lack of experience with food variety might better position them to associate flavour cues with post-ingestive events to subsequently guide their ingestive behaviour. Thus, it is important not to dismiss the translational relevance of the animal model studies as they might reflect the most fundamental processes engaged by RYGB to alter food selection and relative macronutrient intake when other influences specifically affecting human ingestive behavior are stripped away.
In recognizing the limitations of the study, the potential for selection bias arising from sub-optimal retention rate must be acknowledged. All participants had achieved and sustained a significant level of weight loss and hence the patterns of change described in the data are restricted in their relevance to the context of patients achieving a good clinical response to surgery. Unfortunately, we do not have a record of trajectory of body weight in those participants not attending for 24-month study visit. It cannot be definitively excluded that a sub-optimal response to surgery with respect to weight-loss trajectory did not have a bearing upon likelihood of attending. The ad libitum buffet meal, although a novel assessment technique, also has some limitations. We cannot ignore the fact that eating in a clinical research centre is not reflective of actual behavior at home and the power of assessing consumption at a single meal as means of describing patterns of change in eating behaviour is potentially susceptible to day-to-day variation.
Residential studies may mimic more free-living conditions and allow for more sampling and provide more precise estimates of intake patterns. The results of these types of studies are awaited [48]. The ad libitum buffet meal was picked from the 72-items list and a researcher chose 18 items from this list. The items were chosen between 5 and 7 liking on a Likert scale and although all efforts were made there may be subjective researcher bias when selecting these items. During screening there were individuals who ranked all items between 5 and 7, while other subjects ranked all items between 1 and 4 or 7 and 9. This made the decision harder and, therefore, could influence the actual liking and dislike of foods and the 3 items per group that were chosen. Video recording of the buffet would permit reporting of parameters such as meal duration and rate of eating, factors we were unable to report on from our study and the opportunity to assess more comprehensive microstructural features of ingestive behaviour [48].

5. Conclusions

Using direct measurements of ad libitum intake during a buffet meal, this study confirmed that the major reductions in ad libitum food intake seen earlier after surgery are sustained out to 24 months after RYGB. Deselection of high fat and/or high sugar food items was prevalent but not universal, suggesting that after RYGB there may be subgroups of patients differing in their adaptive response to surgery with respect to food selection. Although absolute intake of all macronutrients declined, there was evidence of of a small increase in the proportional intake of protein. Whether this observation can be corroborated in larger more granular studies and whether it truly reflects a change in subjective preference remains an interesting question.

Author Contributions

Conceptualization, R.K.P., A.C.S. and C.W.l.R.; methodology, R.K.P., A.C.S., C.W.l.R.; formal analysis, N.K.; investigation, N.K., Z.B., C.O., C.M., W.a.N. and N.G.D.; data curation, N.K.; writing—original draft preparation, N.K.; writing—review and editing, N.G.D., R.K.P., A.C.S., C.W.l.R., N.K. and W.a.N.; visualization, N.K. and N.G.D.; supervision, C.W.l.R., N.G.D. and W.a.N.; project administration, N.K.; funding acquisition, R.K.P., A.C.S. and C.W.l.R. All authors have read and agreed to the published version of the manuscript.

Funding

Research reported in this publication was supported in part by the US-Ireland Research and Development Partnership program through the National Institute of Diabetes and Digestive and Kidney Diseases of the National Institutes of Health (R01DK106112), the Health and Social Care R&D Division of Northern Ireland (STL/5062/14) and the Medical Research Council (MC_PC_16017), and the Health Research Board of the Republic of Ireland (USIRL-2006). The content is solely the responsibility of the authors and does not necessarily represent the official views of the funding agencies.

Institutional Review Board Statement

The study was conducted according to the guidelines of the Declaration of Helsinki and approved by the Ethics and Medical Research Committee of St. Vincent’s University Hospital, date of approval 25 January 2016.

Informed Consent Statement

Informed consent was obtained from all subjects involved in the study.

Data Availability Statement

The datasets used and/or analysed during the current study are available from the corresponding author on reasonable request.

Conflicts of Interest

C.W.l.R. reports grants from Science Foundation Ireland, Health Research Board, Novo Nordisk, and GI Dynamics outside the permitted work, personal fees from Eli Lilly, Johnson and Johnson, Sanofi Aventis, Astra Zeneca, Janssen, Bristol-Myers Squibb, Boehringer-Ingelheim, outside the submitted work. The funders had no role in the design of the study; in the collection, analyses, or interpretation of data; in the writing of the manuscript, or in the decision to publish.

Appendix A

Table A1. Food preference questionnaire. Adapted from Geiselman et al. [32].
Food Preference Questionnaire
Dislike
Extremely
Dislike
a Lot
DislikeDislike
a Little
NeutralLike a LittleLikeLike
a Lot
Like ExtremelyAllergy
Crème caramel123456789
Marshmallows123456789
Fruit pastels123456789
Hobnob biscuit123456789
Caramel chocolate bar123456789
Dairy milk (milk chocolate)123456789
Bournville (dark chocolate)123456789
Snickers bar123456789
Almond slice123456789
Blueberry cupcake123456789
Peanuts and Raisin mix123456789
Angel slice123456789
Natural yoghurt low fat123456789
Cottage cheese123456789
Croissant123456789
Apple lattice pastry123456789
Pain au chocolat123456789
Salted cheese crackers123456789
Pringles original123456789
Shortbread123456789
Almond croissant123456789
Sausage roll123456789
Chips (fries)123456789
Cheddar cheese123456789
Gala apple123456789
Seedless grapes123456789
Unsalted peanuts123456789
Brie cheese123456789
Egg (boiled)123456789
Quiche Lorraine123456789
Soft cream cheese123456789
Salami123456789
Tuna and sweet corn123456789
Corned beef123456789
Chicken and ham slices123456789
Whole almonds123456789
KP salted peanut123456789
Rice pudding123456789
Blueberries123456789
Pineapple chunks123456789
Tomato’s123456789
Banana123456789
White chocolate cupcake123456789
Boost bar123456789
Chocolate Cake bar123456789
Brown sliced pan123456789
White sliced pan123456789
Brown wheaten bread123456789
Sesame Bagel123456789
Whole meal wrap123456789
Whole meal cracker (Ryvita)123456789
Rice cake123456789
Marietta biscuit123456789
Lentil soup123456789
Minestrone soup123456789
Baked potato123456789
Baked beans123456789
Crumbed ham123456789
Turkey slices123456789
Cheese and Onion crisp123456789
Salt and Vinegar crisp123456789
Skinless salmon123456789
Tuna steak123456789
Smoked ham123456789
Quorn Smokey ham slices123456789
Quorn Turkey and sage slices123456789
Cajun chicken breast123456789
Chicken breast123456789
Cucumber123456789
Tortilla chips123456789
Wafer thin ham123456789
Glenisk Strawberry 0% fat greek protein yoghurt 150 g123456789

References

  1. Buchwald, H.; Oien, D.M. Metabolic/Bariatric Surgery Worldwide 2011. Obes. Surg. 2013, 23, 427–436. [Google Scholar] [CrossRef]
  2. Salminen, P.; Helmiö, M.; Ovaska, J.; Juuti, A.; Leivonen, M.; Peromaa-Haavisto, P.; Hurme, S.; Soinio, M.; Nuutila, P.; Victorzon, M. Effect of Laparoscopic Sleeve Gastrectomy vs Laparoscopic Roux-en-Y Gastric Bypass on Weight Loss at 5 Years among Patients with Morbid Obesity: The SLEEVEPASS Randomized Clinical Trial. JAMA 2018, 319, 241–254. [Google Scholar] [CrossRef] [PubMed]
  3. Peterli, R.; Wölnerhanssen, B.; Peters, T.; Vetter, D.; Kröll, D.; Borbély, Y.; Schultes, B.; Beglinger, C.; Drewe, J.; Schiesser, M.; et al. Effect of Laparoscopic Sleeve Gastrectomy vs Laparoscopic Roux-en-Y Gastric Bypass on Weight Loss in Patients With Morbid Obesity: The SM-BOSS Randomized Clinical Trial. JAMA 2018, 319, 255–265. [Google Scholar] [CrossRef]
  4. Golzarand, M.; Toolabi, K.; Farid, R. The bariatric surgery and weight losing: A meta-analysis in the long- and very long-term effects of laparoscopic adjustable gastric banding, laparoscopic Roux-en-Y gastric bypass and laparoscopic sleeve gastrectomy on weight loss in adults. Surg. Endosc. 2017, 31, 4331–4345. [Google Scholar] [CrossRef] [PubMed]
  5. Gómez-Ambrosi, J.; Andrada, P.; Valentí, V.; Rotellar, F.; Silva, C.; Catalán, V.; Rodríguez, A.; Ramírez, B.; Moncada, R.; Escalada, J.; et al. Dissociation of body mass index, excess weight loss and body fat percentage trajectories after 3 years of gastric bypass: Relationship with metabolic outcomes. Int. J. Obes. 2017, 41, 1379–1387. [Google Scholar] [CrossRef]
  6. Courcoulas, A.P.; Christian, N.J.; Belle, S.H.; Berk, P.D.; Flum, D.R.; Garcia, L.; Horlick, M.; Kalarchian, M.A.; King, W.C.; Mitchell, J.E.; et al. Weight Change and Health Outcomes at 3 Years after Bariatric Surgery among Individuals with Severe Obesity. JAMA 2013, 310, 2416–2425. [Google Scholar] [CrossRef] [Green Version]
  7. Farias, M.M.; Cuevas, A.M.; Rodriguez, F. Set-Point Theory and Obesity. Metab. Syndr. Relat. Disord. 2011, 9, 85–89. [Google Scholar] [CrossRef]
  8. Melby, C.L.; Paris, H.L.; Foright, R.M.; Peth, J. Attenuating the Biologic Drive for Weight Regain Following Weight Loss: Must What Goes Down Always Go Back Up? Nutrients 2017, 9, 468. [Google Scholar] [CrossRef] [Green Version]
  9. Miller, G.D.; Norris, A.; Fernandez, A. Changes in Nutrients and Food Groups Intake Following Laparoscopic Roux-en-Y Gastric Bypass (RYGB). Obes. Surg. 2014, 24, 1926–1932. [Google Scholar] [CrossRef] [PubMed] [Green Version]
  10. Laurenius, A.; Larsson, I.; Bueter, M.; Melanson, K.J.; Bosaeus, I.; Forslund, H.B.; Lönroth, H.; Fändriks, L.; Olbers, T. Changes in eating behaviour and meal pattern following Roux-en-Y gastric bypass. Int. J. Obes. 2011, 36, 348–355. [Google Scholar] [CrossRef] [PubMed] [Green Version]
  11. Laurenius, A.; Larsson, I.; Melanson, K.J.; Lindroos, A.K.; Lönroth, H.; Bosaeus, I.; Olbers, T. Decreased energy density and changes in food selection following Roux-en-Y gastric bypass. Eur. J. Clin. Nutr. 2013, 67, 168–173. [Google Scholar] [CrossRef]
  12. Kruseman, M.; Leimgruber, A.; Zumbach, F.; Golay, A. Dietary, Weight, and Psychological Changes among Patients with Obesity, 8 Years after Gastric Bypass. J. Am. Diet. Assoc. 2010, 110, 527–534. [Google Scholar] [CrossRef]
  13. Giusti, V.; Theytaz, F.; Di Vetta, V.; Clarisse, M.; Suter, M.; Tappy, L. Energy and macronutrient intake after gastric bypass for morbid obesity: A 3-y observational study focused on protein consumption. Am. J. Clin. Nutr. 2015, 103, 18–24. [Google Scholar] [CrossRef] [PubMed] [Green Version]
  14. Sjöström, L.; Lindroos, A.-K.; Peltonen, M.; Torgerson, J.; Bouchard, C.; Carlsson, B.; Dahlgren, S.; Larsson, B.; Narbro, K.; Sjöström, C.D.; et al. Lifestyle, Diabetes, and Cardiovascular Risk Factors 10 Years after Bariatric Surgery. N. Engl. J. Med. 2004, 351, 2683–2693. [Google Scholar] [CrossRef] [PubMed]
  15. Mathes, C.M.; Spector, A.C. Food selection and taste changes in humans after Roux-en-Y gastric bypass surgery: A direct-measures approach. Physiol. Behav. 2012, 107, 476–483. [Google Scholar] [CrossRef] [PubMed]
  16. Le Roux, C.W.; Bueter, M.; Theis, N.; Werling, M.; Ashrafian, H.; Löwenstein, C.; Athanasiou, T.; Bloom, S.R.; Spector, A.C.; Olbers, T.; et al. Gastric bypass reduces fat intake and preference. Am. J. Physiol. Integr. Comp. Physiol. 2011, 301, R1057–R1066. [Google Scholar] [CrossRef] [Green Version]
  17. Shin, A.C.; Zheng, H.; Pistell, P.J.; Berthoud, H.-R. Roux-en-Y gastric bypass surgery changes food reward in rats. Int. J. Obes. 2010, 35, 642–651. [Google Scholar] [CrossRef] [PubMed] [Green Version]
  18. Mathes, C.M.; Bohnenkamp, R.A.; Blonde, G.D.; Letourneau, C.; Corteville, C.; Bueter, M.; Lutz, T.A.; le Roux, C.W.; Spector, A.C. Gastric bypass in rats does not decrease appetitive behavior towards sweet or fatty fluids despite blunting preferential intake of sugar and fat. Physiol. Behav. 2015, 142, 179–188. [Google Scholar] [CrossRef] [PubMed] [Green Version]
  19. Mathes, C.M.; Letourneau, C.; Blonde, G.D.; Le Roux, C.W.; Spector, A.C. Roux-en-Y gastric bypass in rats progressively decreases the proportion of fat calories selected from a palatable cafeteria diet. Am. J. Physiol. Integr. Comp. Physiol. 2016, 310, R952–R959. [Google Scholar] [CrossRef] [Green Version]
  20. Olbers, T.; Björkman, S.; Lindroos, A.; Maleckas, A.; Lönn, L.L.; Sjöström, L.; Lönroth, H. Body Composition, Dietary Intake, and Energy Expenditure After Laparoscopic Roux-en-Y Gastric Bypass and Laparoscopic Vertical Banded Gastroplasty. Ann. Surg. 2006, 244, 715–722. [Google Scholar] [CrossRef]
  21. Ullrich, J.; Ernst, B.; Wilms, B.; Thurnheer, M.; Schultes, B. Roux-en Y Gastric Bypass Surgery Reduces Hedonic Hunger and Improves Dietary Habits in Severely Obese Subjects. Obes. Surg. 2012, 23, 50–55. [Google Scholar] [CrossRef] [PubMed]
  22. Ernst, B.; Thurnheer, M.; Wilms, B.; Schultes, B. Differential Changes in Dietary Habits after Gastric Bypass versus Gastric Banding Operations. Obes. Surg. 2008, 19, 274–280. [Google Scholar] [CrossRef]
  23. Schoeller, D.A. Limitations in the assessment of dietary energy intake by self-report. Metabolism 1995, 44, 18–22. [Google Scholar] [CrossRef]
  24. Hill, R.; Davies, P.S.W. The validity of self-reported energy intake as determined using the doubly labelled water technique. Br. J. Nutr. 2001, 85, 415–430. [Google Scholar] [CrossRef] [PubMed] [Green Version]
  25. Poppitt, S.; Swann, D.; Black, A.; Prentice, A. Assessment of selective under-reporting of food intake by both obese and non-obese women in a metabolic facility. Int. J. Obes. Relat. Metab. Disord. 1998, 22, 303–311. [Google Scholar] [CrossRef] [PubMed] [Green Version]
  26. Kapoor, N.; Al-Najim, W.; Le Roux, C.W.; Docherty, N.G. Shifts in Food Preferences after Bariatric Surgery: Observational Reports and Proposed Mechanisms. Curr. Obes. Rep. 2017, 6, 246–252. [Google Scholar] [CrossRef]
  27. Behary, P.; Miras, A. Food preferences and underlying mechanisms after bariatric surgery. Proc. Nutr. Soc. 2015, 74, 419–425. [Google Scholar] [CrossRef] [PubMed] [Green Version]
  28. Schier, L.A.; Spector, A.C. The Functional and Neurobiological Properties of Bad Taste. Physiol. Rev. 2019, 99, 605–663. [Google Scholar] [CrossRef]
  29. Abdeen, G.; Le Roux, C.W. Mechanism Underlying the Weight Loss and Complications of Roux-en-Y Gastric Bypass. Review. Obes. Surg. 2015, 26, 410–421. [Google Scholar] [CrossRef] [Green Version]
  30. Nielsen, M.S.; Christensen, B.J.; Ritz, C.; Rasmussen, S.; Hansen, T.T.; Bredie, W.L.P.; le Roux, C.W.; Sjödin, A.; Schmidt, J.B. Roux-En-Y Gastric Bypass and Sleeve Gastrectomy Does Not Affect Food Preferences When Assessed by an Ad libitum Buffet Meal. Obes. Surg. 2017, 27, 2599–2605. [Google Scholar] [CrossRef] [PubMed]
  31. Nielsen, M.S.; Rasmussen, S.; Christensen, B.J.; Ritz, C.; le Roux, C.W.; Schmidt, J.B.; Sjödin, A. Bariatric Surgery Does Not Affect Food Preferences, but Individual Changes in Food Preferences May Predict Weight Loss. Obesity 2018, 26, 1879–1887. [Google Scholar] [CrossRef] [Green Version]
  32. Geiselman, P.J.; Anderson, A.M.; Dowdy, M.L.; West, D.B.; Redmann, S.M.; Smith, S.R. Reliability and Validity of a Macronutrient Self-Selection Paradigm and a Food Preference Questionnaire. Physiol. Behav. 1998, 63, 919–928. [Google Scholar] [CrossRef]
  33. Neff, K.J.H.; Le Roux, C. Bariatric surgery: A best practice article. J. Clin. Pathol. 2012, 66, 90–98. [Google Scholar] [CrossRef] [PubMed]
  34. Schaefer, E.J.; Augustin, J.L.; Schaefer, M.M.; Rasmussen, H.; Ordovas, J.; Dallal, G.E.; Dwyer, J. Lack of efficacy of a food-frequency questionnaire in assessing dietary macronutrient intakes in subjects consuming diets of known composition. Am. J. Clin. Nutr. 2000, 71, 746–751. [Google Scholar] [CrossRef]
  35. MacDiarmid, J.; Blundell, J. Assessing dietary intake: Who, what and why of under-reporting. Nutr. Res. Rev. 1998, 11, 231–253. [Google Scholar] [CrossRef] [PubMed] [Green Version]
  36. Coluzzi, I.; Raparelli, L.; Guarnacci, L.; Paone, E.; Del Genio, G.; Le Roux, C.W.; Silecchia, G. Food Intake and Changes in Eating Behavior After Laparoscopic Sleeve Gastrectomy. Obes. Surg. 2016, 26, 2059–2067. [Google Scholar] [CrossRef] [PubMed]
  37. Kenler, H.; E Brolin, R.; Cody, R.P. Changes in eating behavior after horizontal gastroplasty and Roux-en-Y gastric bypass. Am. J. Clin. Nutr. 1990, 52, 87–92. [Google Scholar] [CrossRef]
  38. Netto, B.D.M.; Earthman, C.P.; Farias, G.; Masquio, D.C.L.; Clemente, A.P.G.; Peixoto, P.; Bettini, S.C.; von Der Heyde, M.E.; Dâmaso, A.R. Eating patterns and food choice as determinant of weight loss and improvement of metabolic profile after RYGB. Nutrition 2017, 33, 125–131. [Google Scholar] [CrossRef] [PubMed]
  39. Brolin, R.E.; Gorman, J.H.; Gorman, R.C.; Petschenik, A.J.; Bradley, L.J.; Kenler, H.A.; Cody, R.P. Are vitamin B12 and folate deficiency clinically important after roux-en-Y gastric bypass? J. Gastrointest. Surg. 1998, 2, 436–442. [Google Scholar] [CrossRef]
  40. Halmi, K.; Mason, E.; Falk, J.R.; Stunkard, A. Appetitive behavior after gastric bypass for obesity. Int. J. Obes. 1981, 5, 457–464. [Google Scholar]
  41. Al-Najim, W.; Docherty, N.G.; le Roux, C.W. Food Intake and Eating Behavior after Bariatric Surgery. Physiol. Rev. 2018, 98, 1113–1141. [Google Scholar] [CrossRef] [PubMed] [Green Version]
  42. Trostler, N.; Mann, A.; Zilberbush, N.; Avinoach, E.; Charuzi, I. Weight Loss and Food Intake 18 Months following Vertical Banded Gastroplasty or Gastric Bypass for Severe Obesity. Obes. Surg. 1995, 5, 39–51. [Google Scholar] [CrossRef]
  43. Zoon, H.F.; de Bruijn, S.E.; Smeets, P.A.; de Graaf, C.; Janssen, I.M.; Schijns, W.; Aarts, E.O.; Jager, G.; Boesveldt, S. Altered neural responsivity to food cues in relation to food preferences, but not appetite-related hormone concentrations after RYGB-surgery. Behav. Brain Res. 2018, 353, 194–202. [Google Scholar] [CrossRef] [PubMed]
  44. Nielsen, M.S.; Ritz, C.; Albrechtsen, N.J.W.; Holst, J.J.; le Roux, C.W.; Sjödin, A. Oxyntomodulin and Glicentin May Predict the Effect of Bariatric Surgery on Food Preferences and Weight Loss. J. Clin. Endocrinol. Metab. 2020, 105, e1064–e1074. [Google Scholar] [CrossRef] [PubMed]
  45. Murphy, M.; Peters, K.Z.; Denton, B.S.; Lee, K.A.; Chadchankar, H.; McCutcheon, J.E. Restriction of dietary protein leads to conditioned protein preference and elevated palatability of protein-containing food in rats. Physiol. Behav. 2017, 184, 235–241. [Google Scholar] [CrossRef] [PubMed] [Green Version]
  46. Katsanos, C.S.; Madura, J.A.; Roust, L.R. Essential amino acid ingestion as an efficient nutritional strategy for the preservation of muscle mass following gastric bypass surgery. Nutrition 2015, 32, 9–13. [Google Scholar] [CrossRef] [PubMed] [Green Version]
  47. Mathes, C.M.; Bohnenkamp, R.A.; Le Roux, C.; Spector, A.C. Reduced sweet and fatty fluid intake after Roux-en-Y gastric bypass in rats is dependent on experience without change in stimulus motivational potency. Am. J. Physiol. Integr. Comp. Physiol. 2015, 309, R864–R874. [Google Scholar] [CrossRef]
  48. Spector, A.C.; Kapoor, N.; Price, R.K.; Pepino, M.Y.; Livingstone, M.B.E.; Le Roux, C.W. Proceedings from the 2018 Association for Chemoreception Annual Meeting Symposium: Bariatric Surgery and Its Effects on Taste and Food Selection. Chem. Senses 2018, 44, 155–163. [Google Scholar] [CrossRef] [PubMed]
Figure 1. Body weight change 24 months post-surgery. Change in body weight represented by BMI from baseline to 24 months post-surgery. n = 14, ****: p < 0.0001, BMI Body Mass Index.
Nutrients 13 03873 g001
Figure 2. Questionnaire-derived food preference ratings and meal selection. HCHO, High Complex Carbohydrates; FPQ, Food preference questionnaire. The heatmap shows graded preference of the 72 items for three participants (minimum, median and maximum ratings). The colour intensities vary from green to red where green is a score between 0 and 3 and red between 6 and 9 on the Likert scale.
Nutrients 13 03873 g002
Figure 3. Proportion of Participants Not Consuming Items from Each Category, baseline versus 24 months. Percentage of participants not consuming each category at baseline and at 24 months post-surgery. HF/HS = High Fat/ High Sugar, HF/HCHO = High Fat/High Complex Carbohydrates, HF/HP = High Fat/High Protein, LF/HS = Low Fat/High Sugar, LF/HCHO = Low Fat/High Complex Carbohydrates, LF/HP = Low Fat/High Protein.
Nutrients 13 03873 g003
Table 1. Macronutrient self-selection paradigm.
Macronutrient Self-Selection Paradigm
High Simple SugarHigh Complex CHOLow CHO/High Protein
High FatThree foodsThree foodsThree foods
Fat > 40%Fat > 40%Fat > 40%
Sugar > 30%Comp Carb > 30%Protein > 13%
Low FatThree foodsThree foodsThree foods
Fat < 20%Fat < 20%Fat < 20%
Sugar > 30%Comp Carb > 30%Protein > 13%
Adapted from Geiselman et al. [32].
Table 2. Baseline characteristics of participants (n = 14).
ParameterValues
Male/Female4/10
Age (years)51.0 ± 7.8
Body weight (kg)136 ± 23.8
BMI (kg/m2)50.1 ± 7.8
Waist Circumference (cm)140.5 ± 14.7
Data presented as mean ± standard deviation. BMI: Body Mass Index.
Table 3. Absolute measures of total and macronutrient specific intake at buffet meal. Data presented as mean ± standard error.
Pre-Surgery24 Months
Post-Surgery
Mean Difference
(95% CI)
p-Value
Total food intake (kJ)6510.3 ± 756.52540.1 ± 431.0−3971.8
(−5234.2 to −2707.1)
<0.01
Intake from macronutrients
Fat (kJ)2617.1 ± 318.81066.9 ± 225.5−1548.1
(−524.8 to −216.1)
<0.01
Sugar (kJ)1312.5 ± 288.3421.7 ± 115.9−890.8
(2195.7 to −334.5)
<0.01
Total Carbohydrates (kJ)3102.4 ± 455.61013.8 ± 220.9−2088.7
(−2888.2 to −1289.1)
<0.01
Protein (kJ)833.9 ± 87.0472.8 ± 58.2−558.1
(−558.1 to −163.2)
<0.01
Table 4. Percentage contribution of individual macronutrients to energy intake at buffet meal Data presented as mean ± standard deviation.
Pre-Surgery24 Months
Post-Surgery
Mean
Difference
95% CI
Fat (%)40.6 ± 11.638.3 ± 18.1−2.26−14.1 to 9.5
Sugar (%)18.7 ± 8.715.5 ± 12.1−3.15−13.1 to 6.8
Total Carbohydrates (%)46.4 ± 10.538.4 ± 17.2−8.02−20.9 to 4.9
Protein (%)13.4 ± 3.724.1 ± 17.4+10.720.3 to 21.1
Publisher’s Note: MDPI stays neutral with regard to jurisdictional claims in published maps and institutional affiliations.

