
Meal Patterns and Food Choices of Female Rats Fed a Cafeteria-Style Diet Are Altered by Gastric Bypass Surgery


Abstract
:1. Introduction
2. Materials and Methods
2.1. Subjects
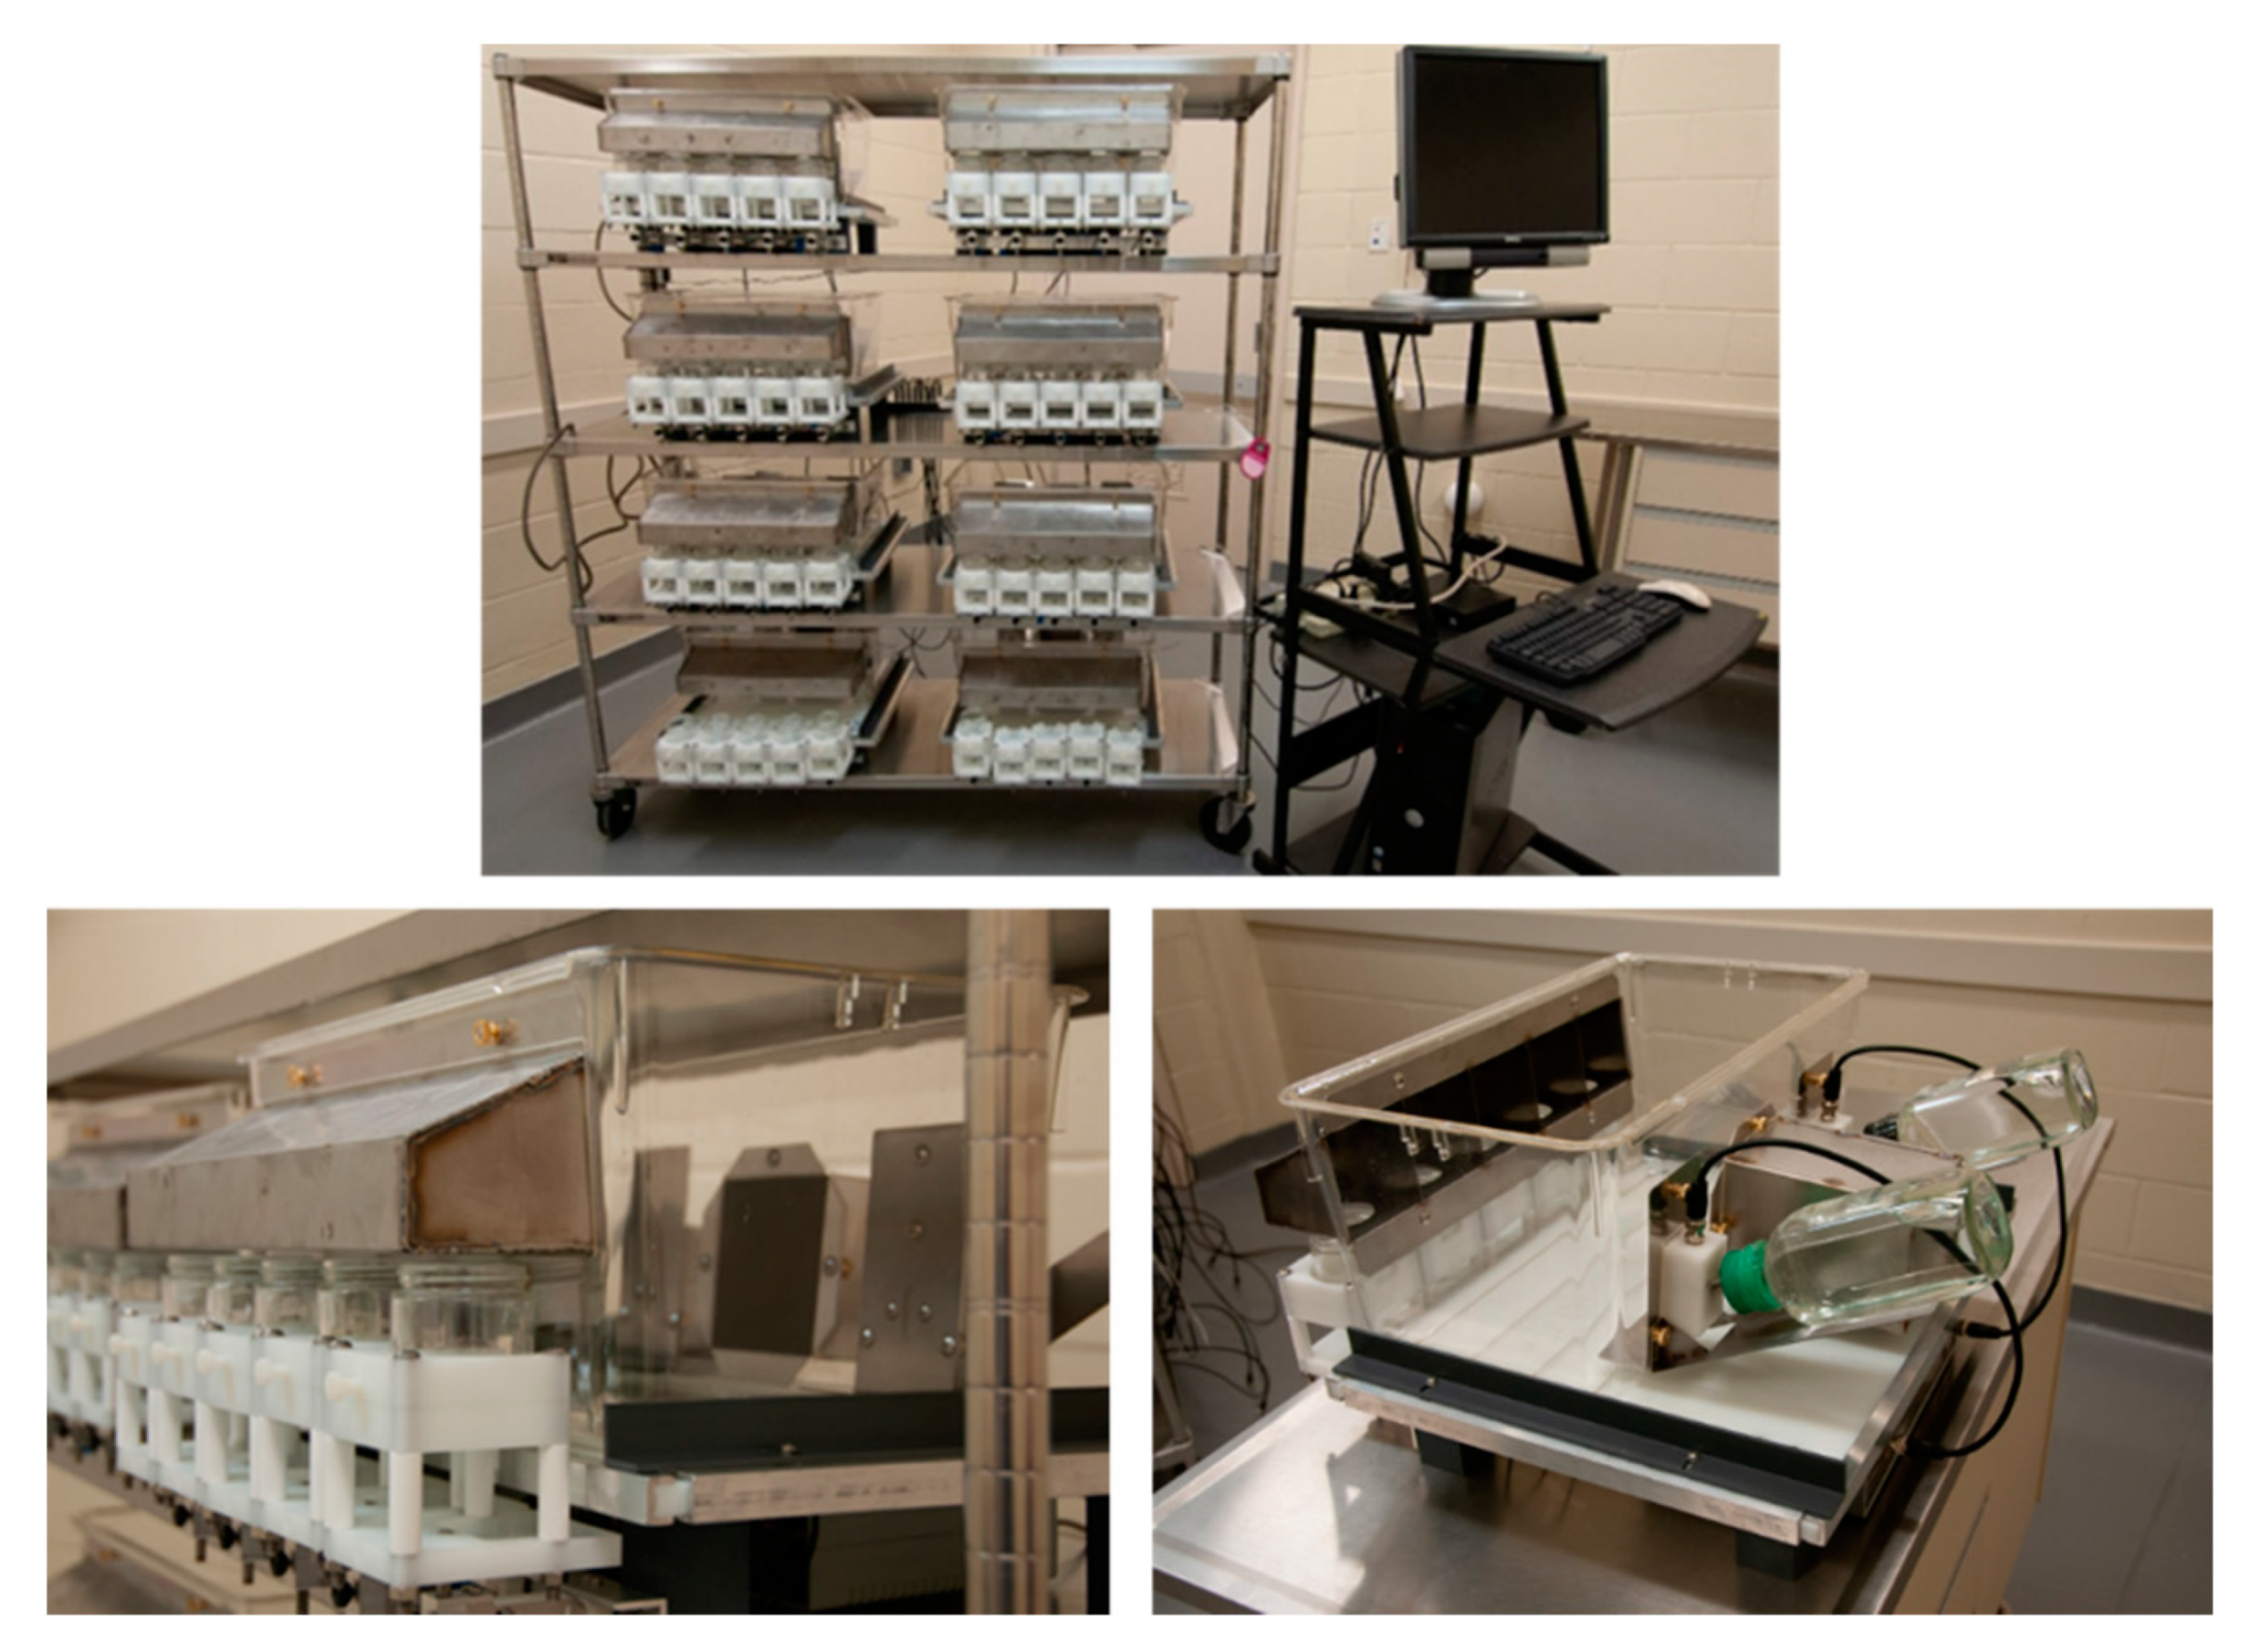
2.2. Apparatus
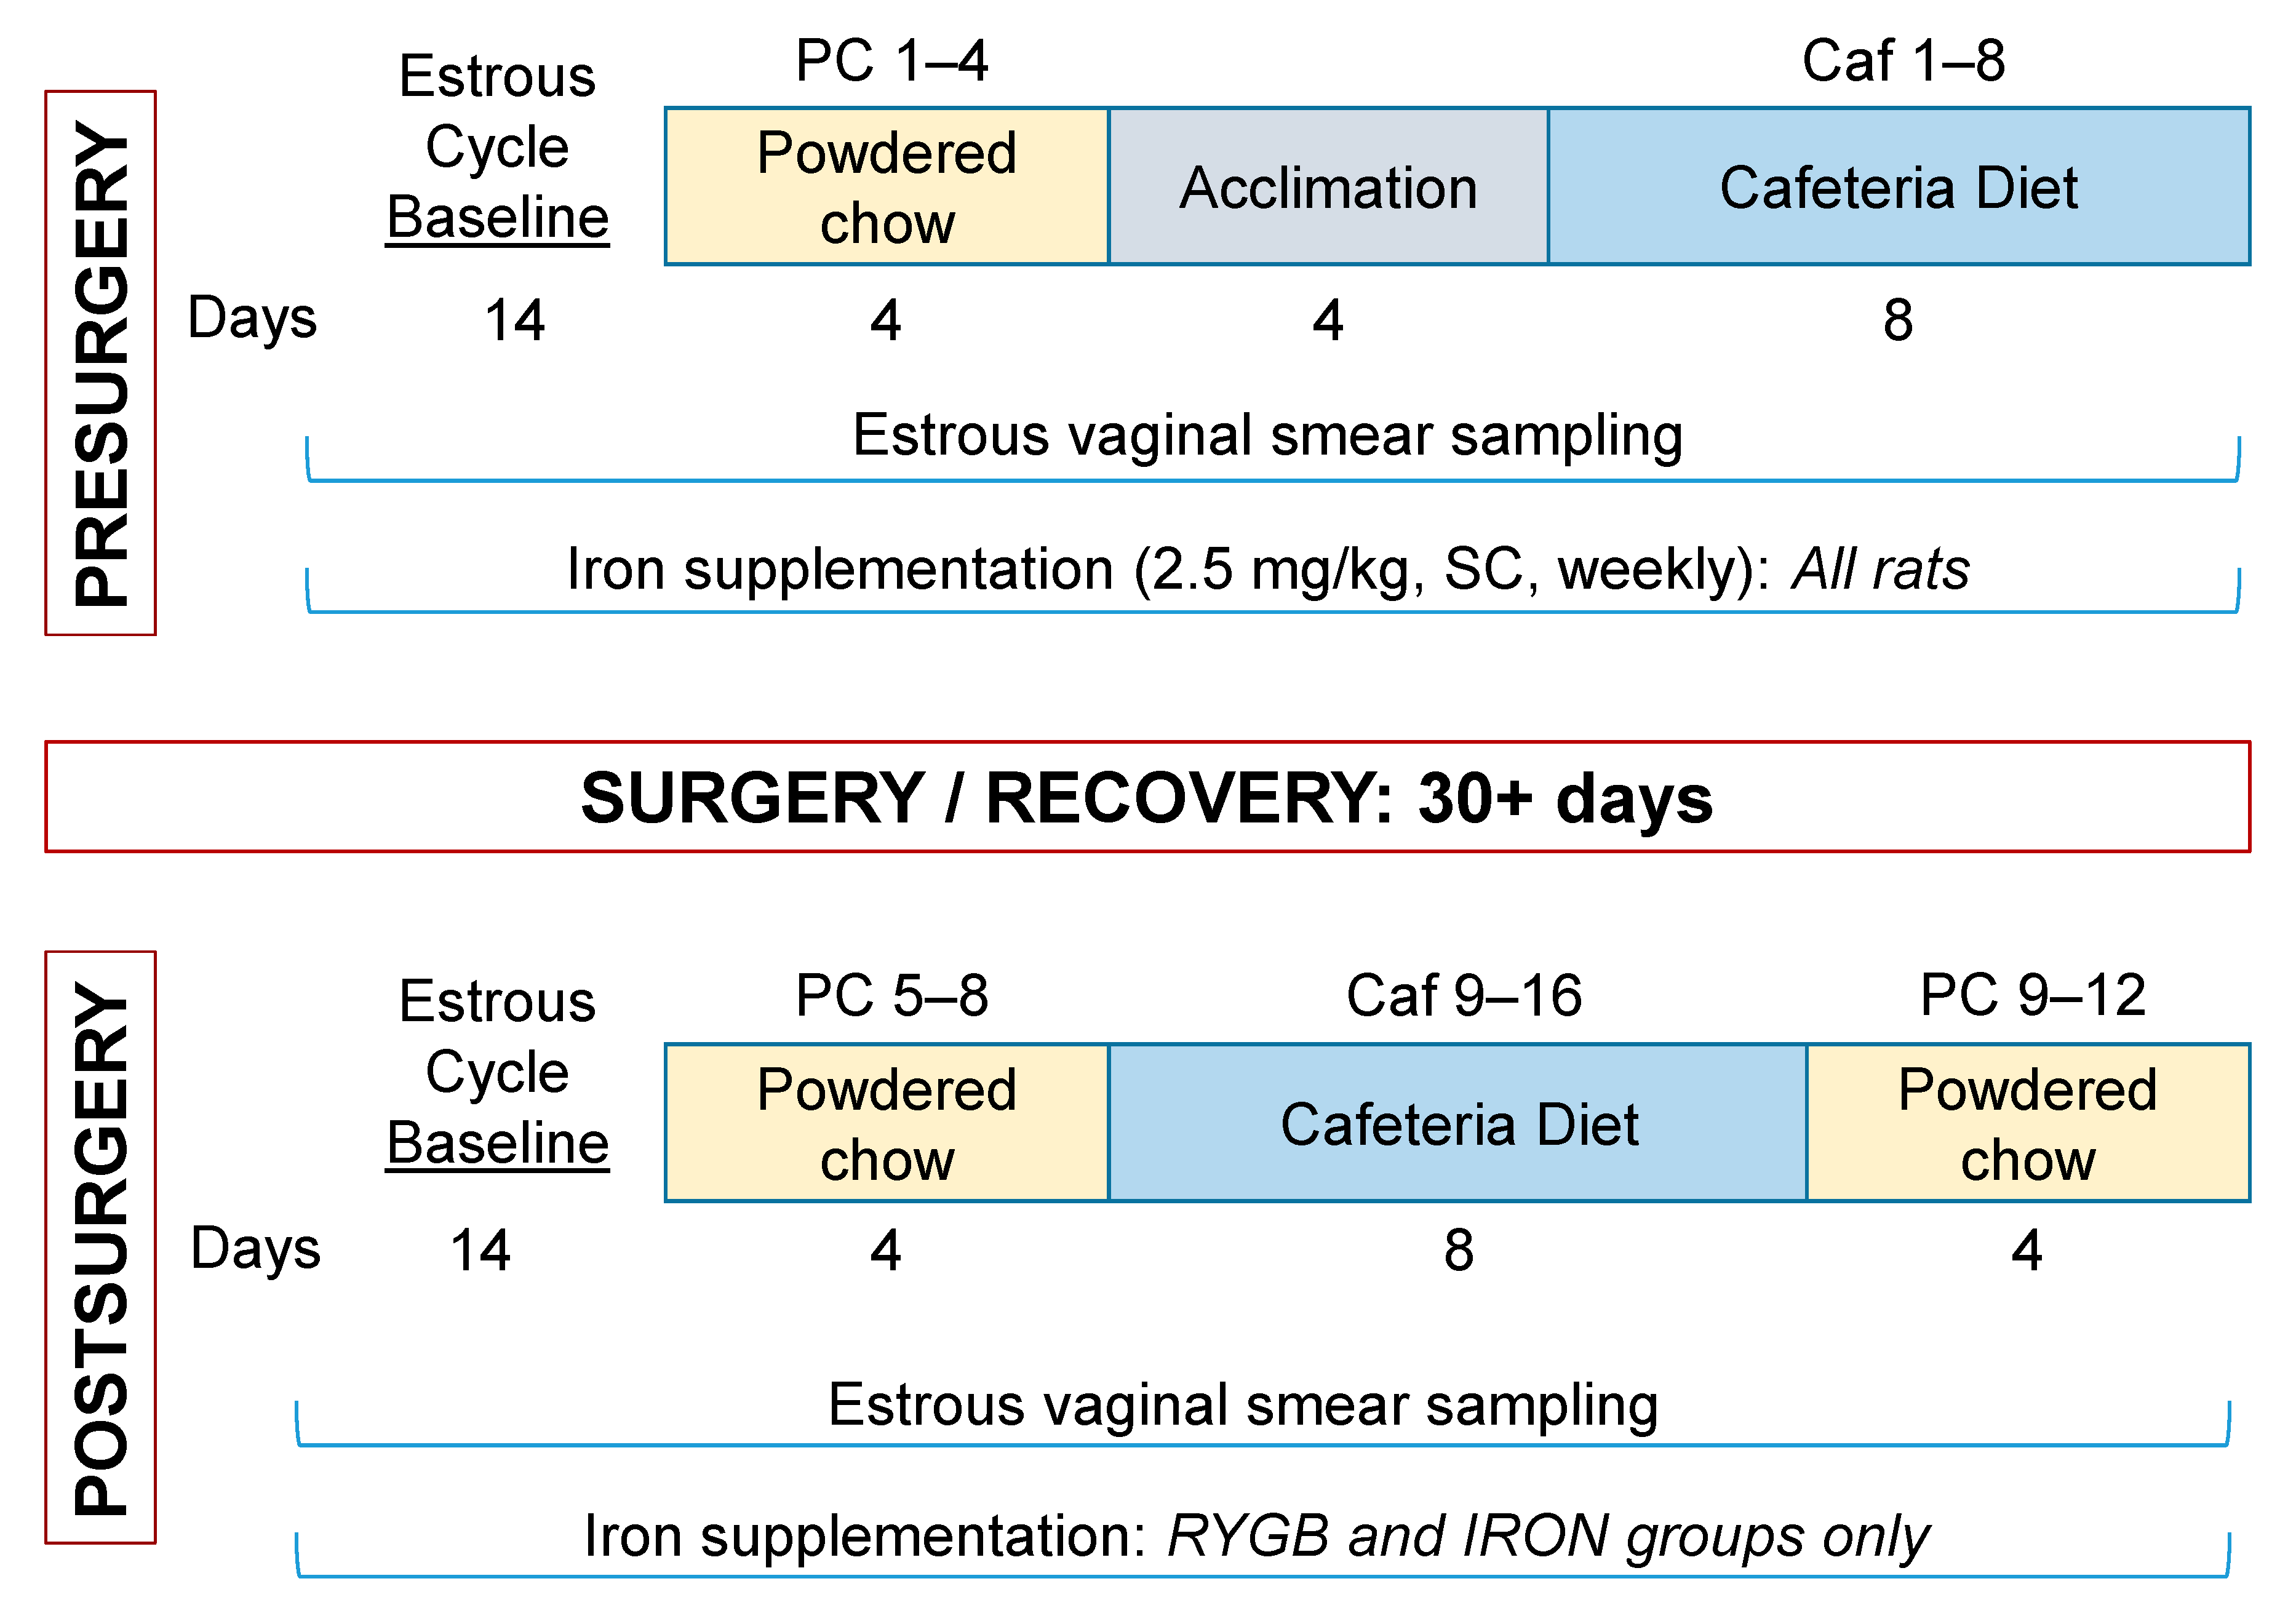
2.3. Presurgical Measurements
2.3.1. Presurgical Estrous Baseline
2.3.2. Presurgical Meal Pattern Monitoring
2.4. Roux-en-Y Gastric Bypass Surgery and Recovery
2.5. Post-Surgical Measurements
2.5.1. Post-Surgical Estrous Baseline
2.5.2. Post-Surgical Meal Pattern Monitoring
2.5.3. Body Composition Scans
2.5.4. Postprandial Cardiac Blood Collection and Protein Analysis
2.6. Data Analysis
3. Results
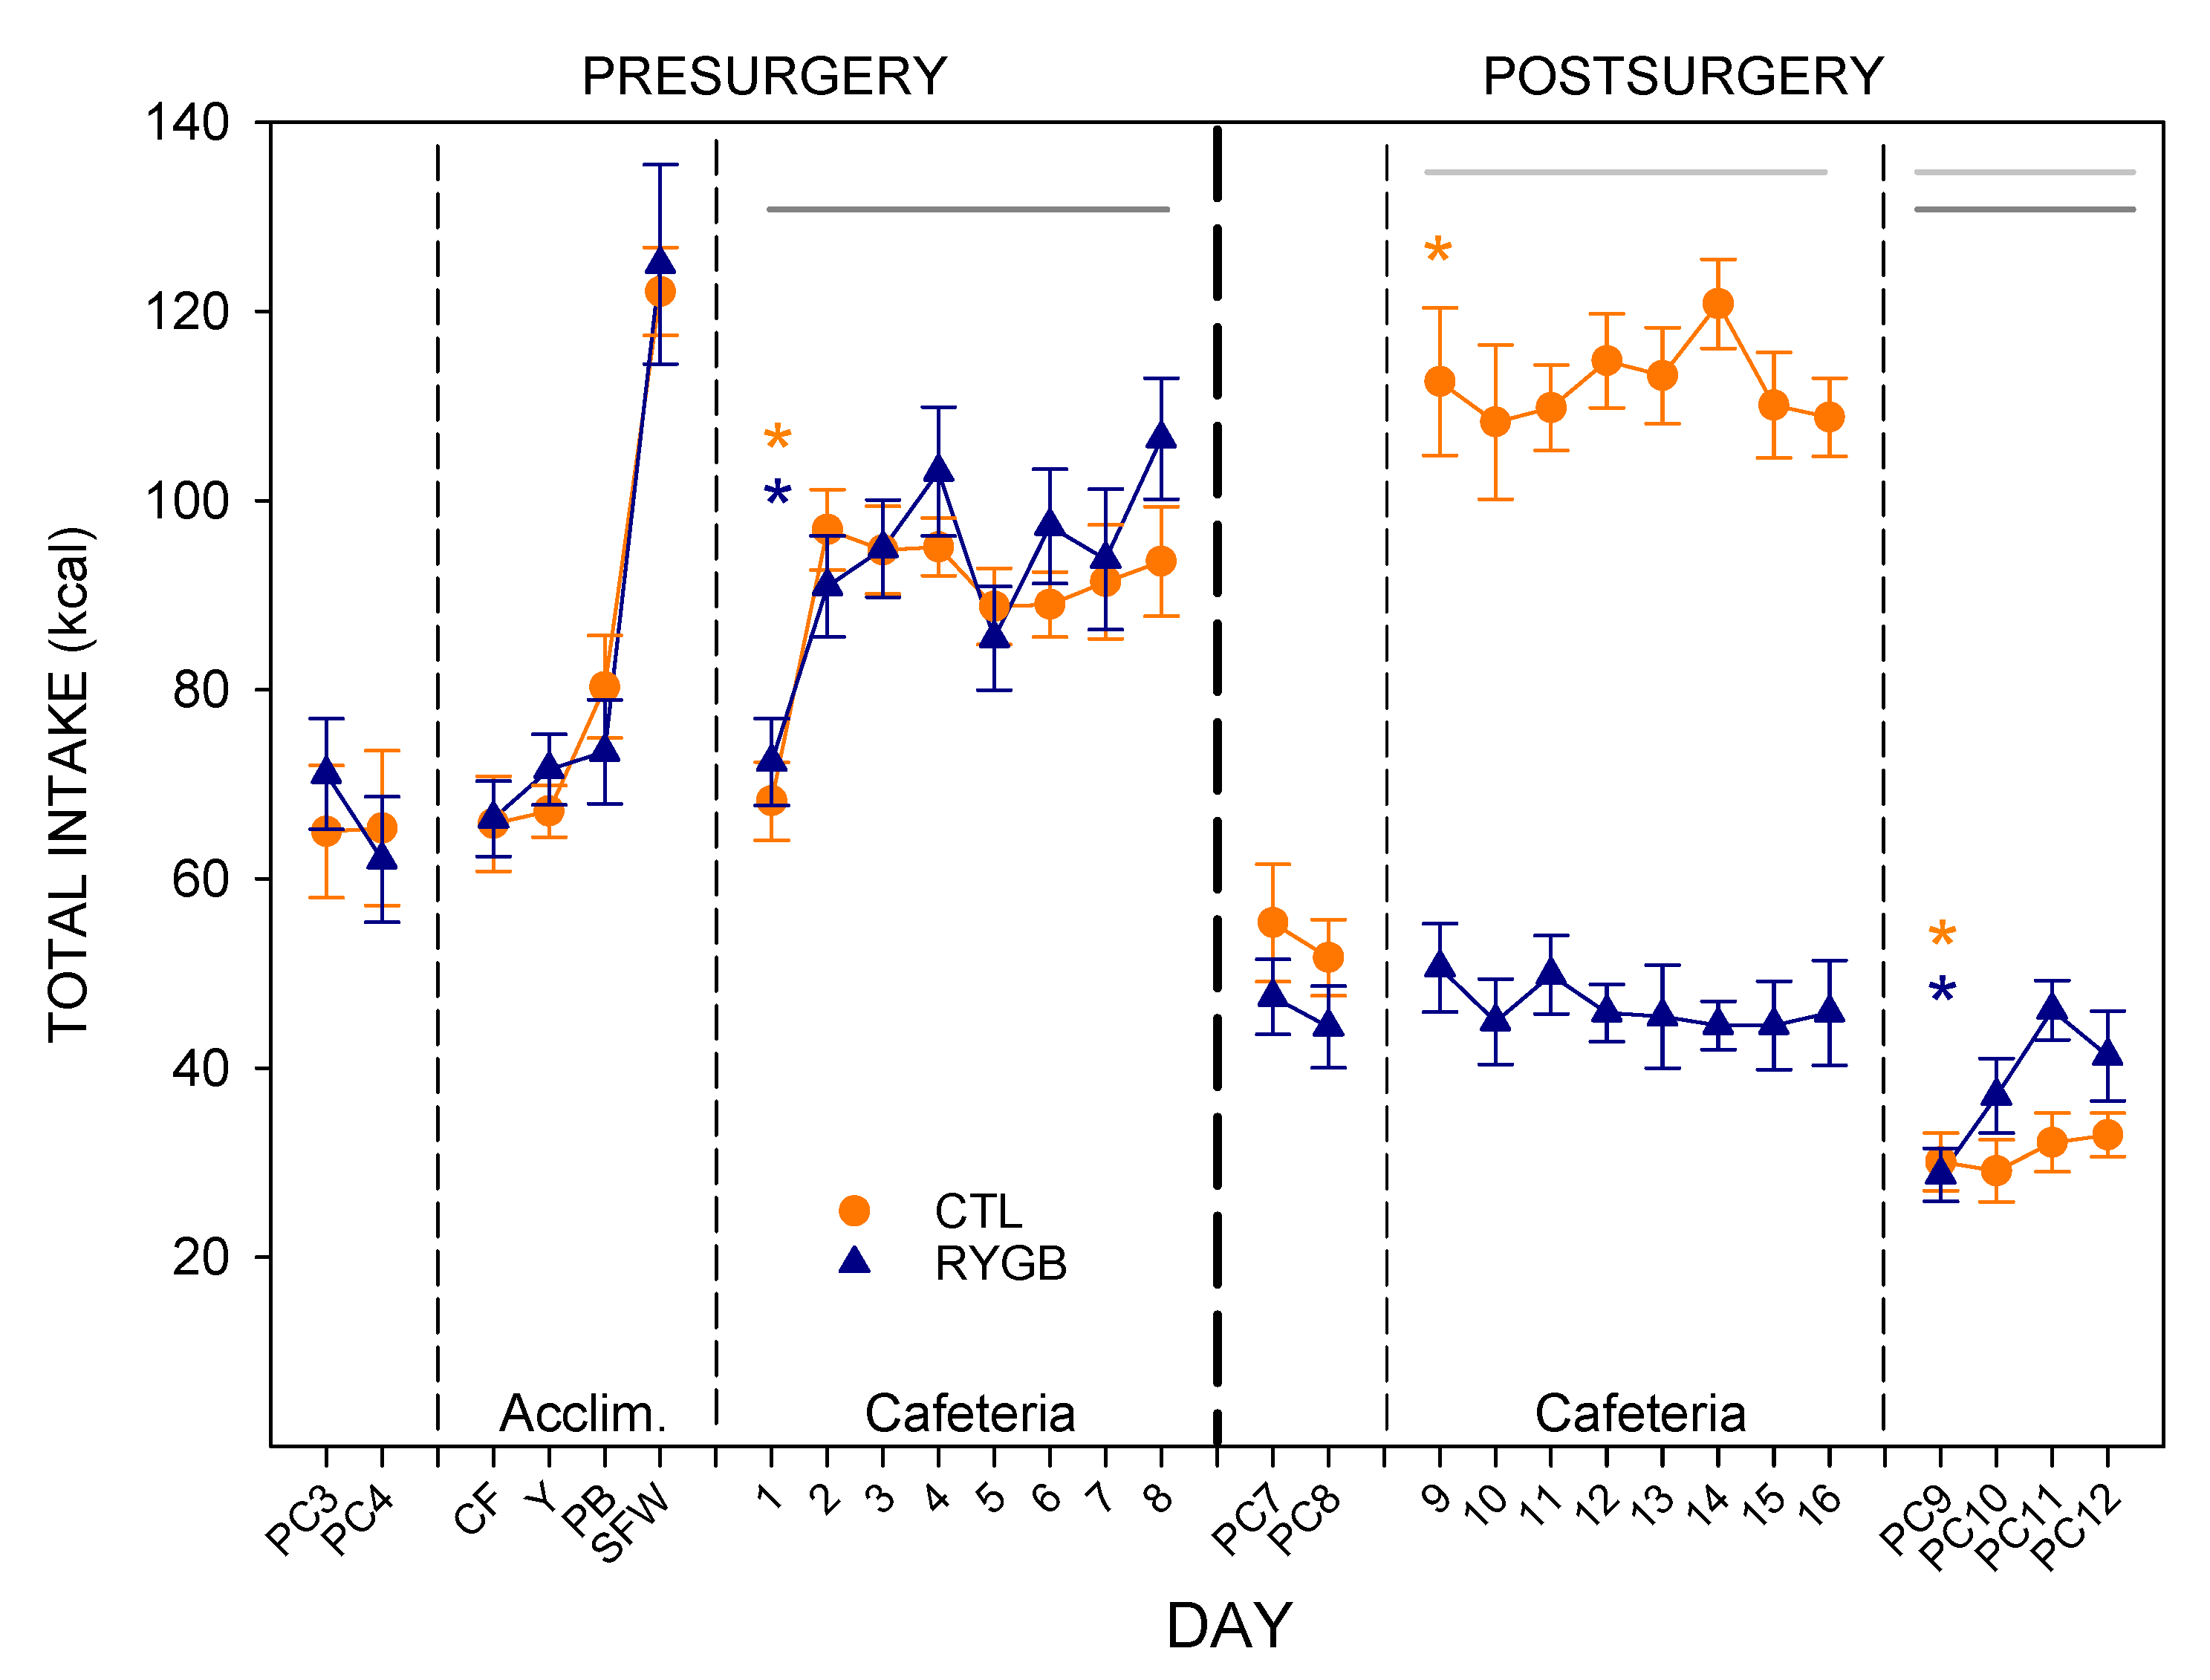
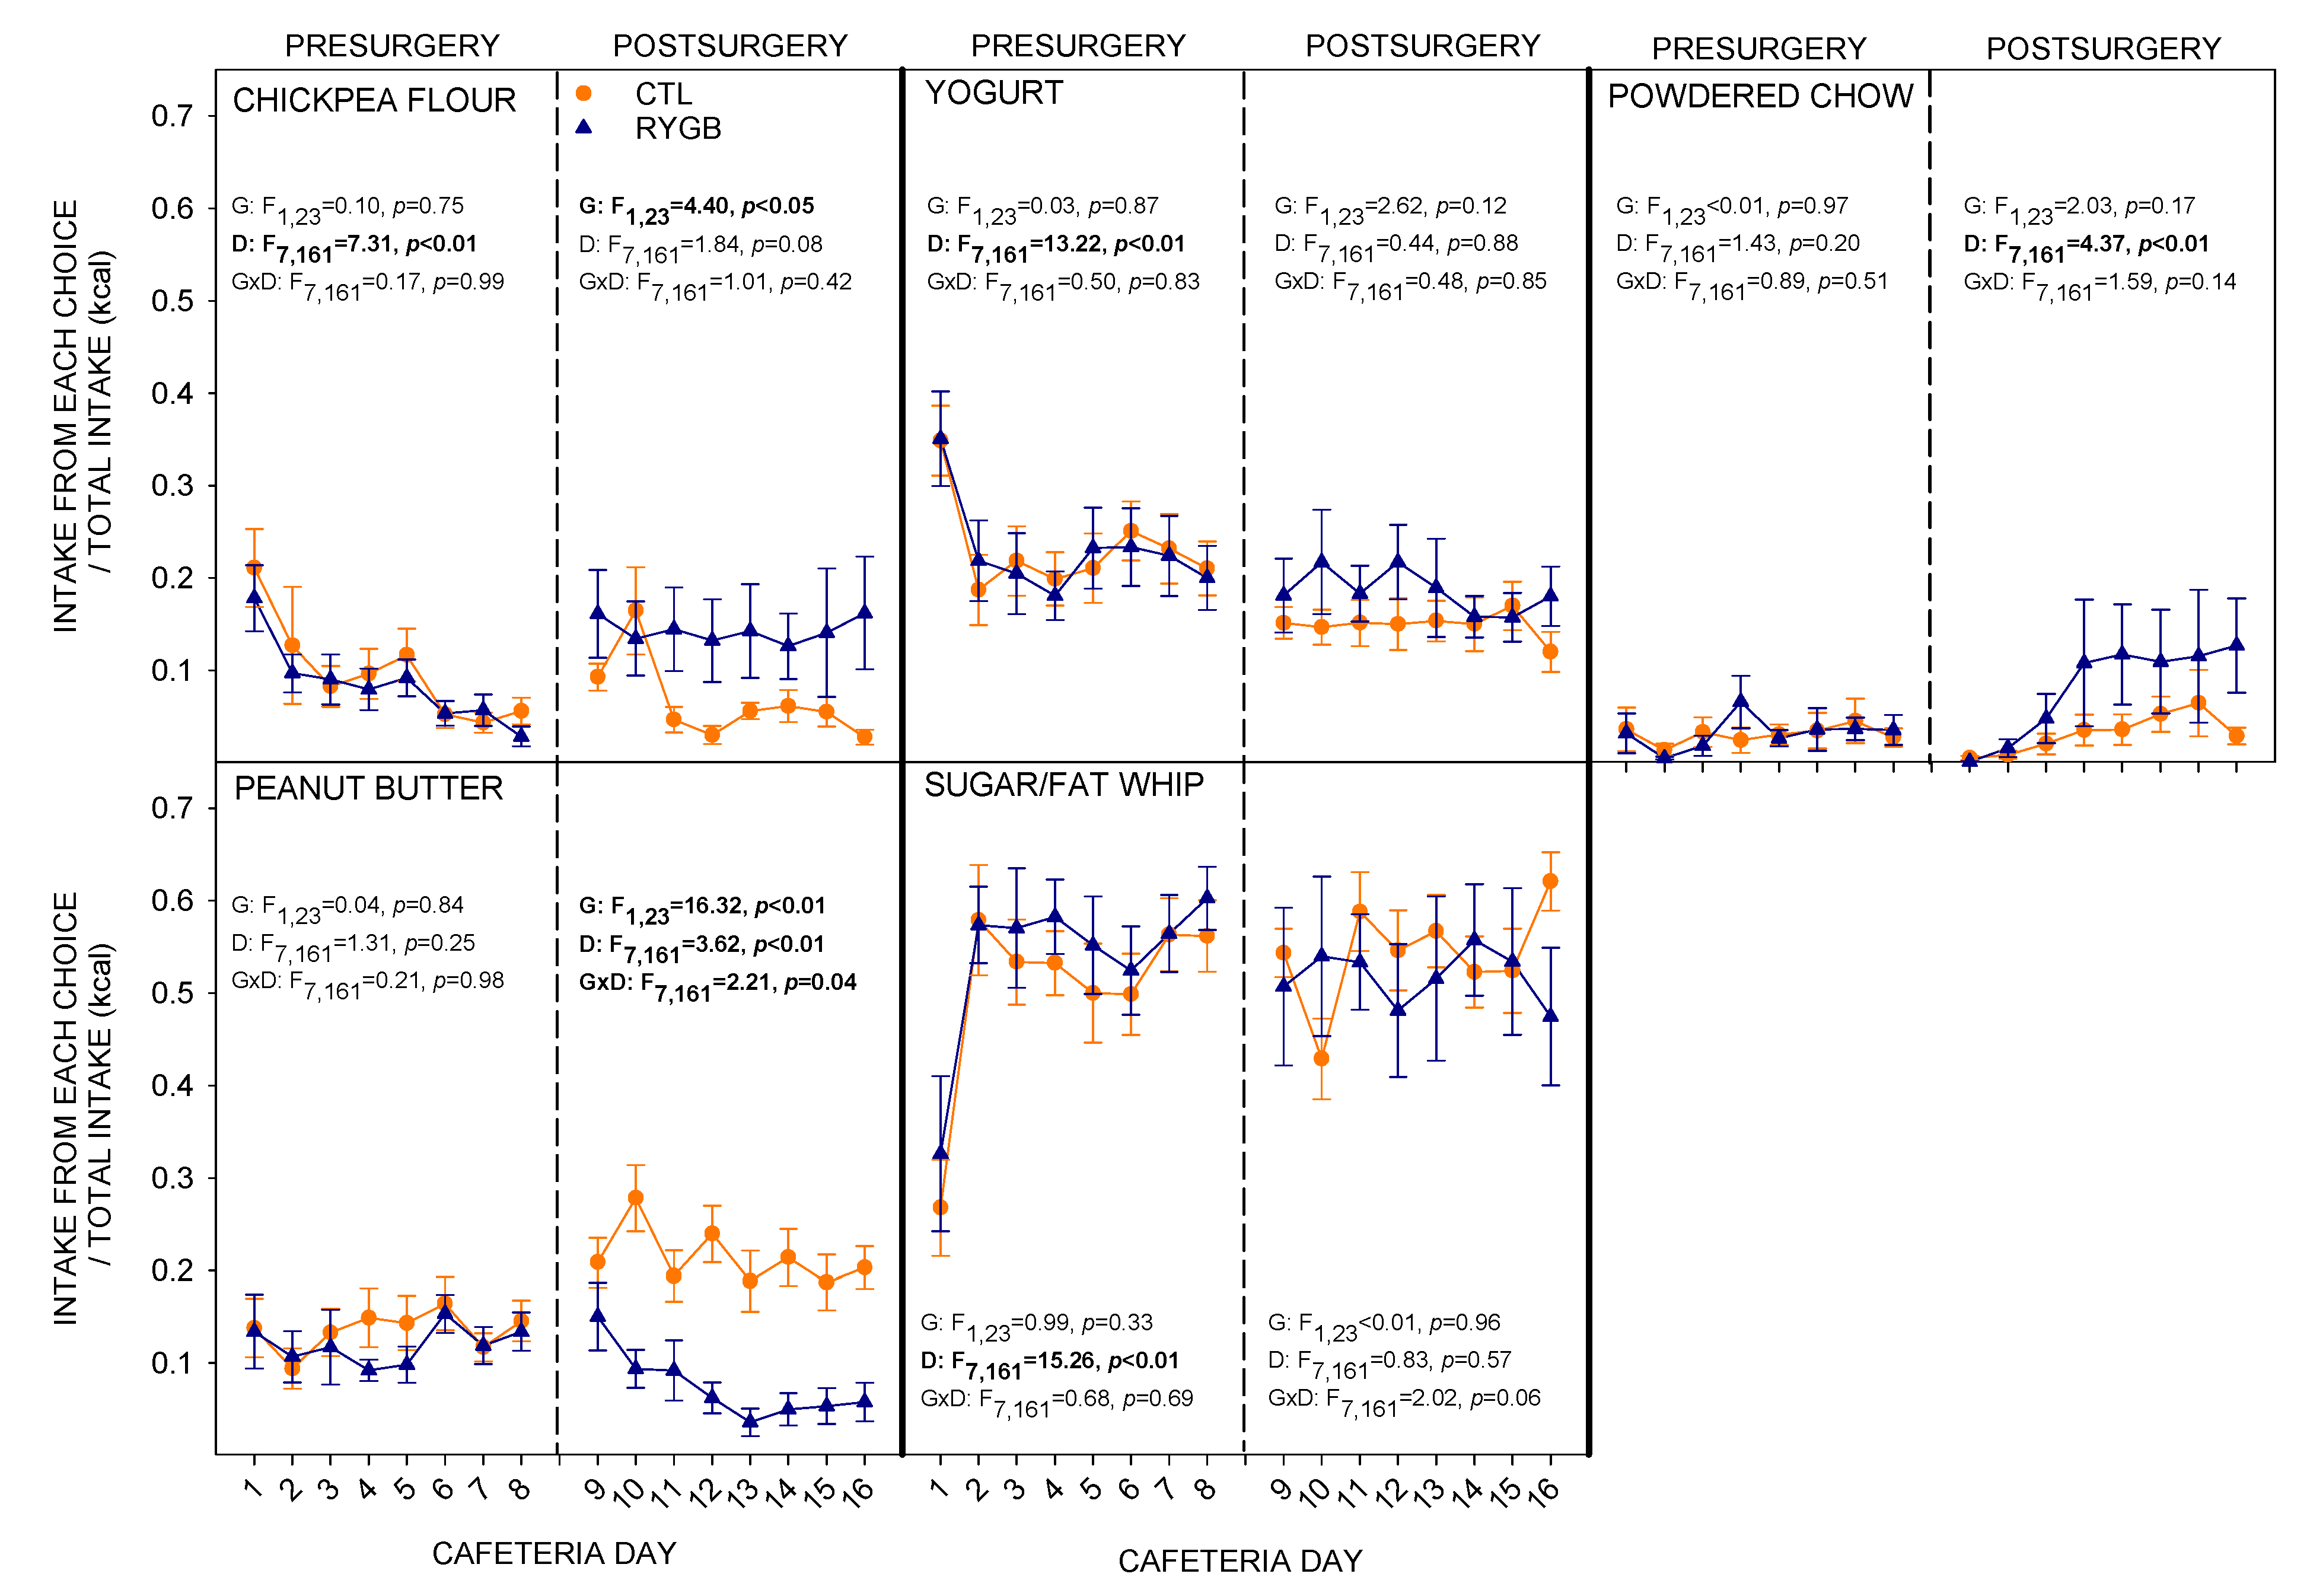
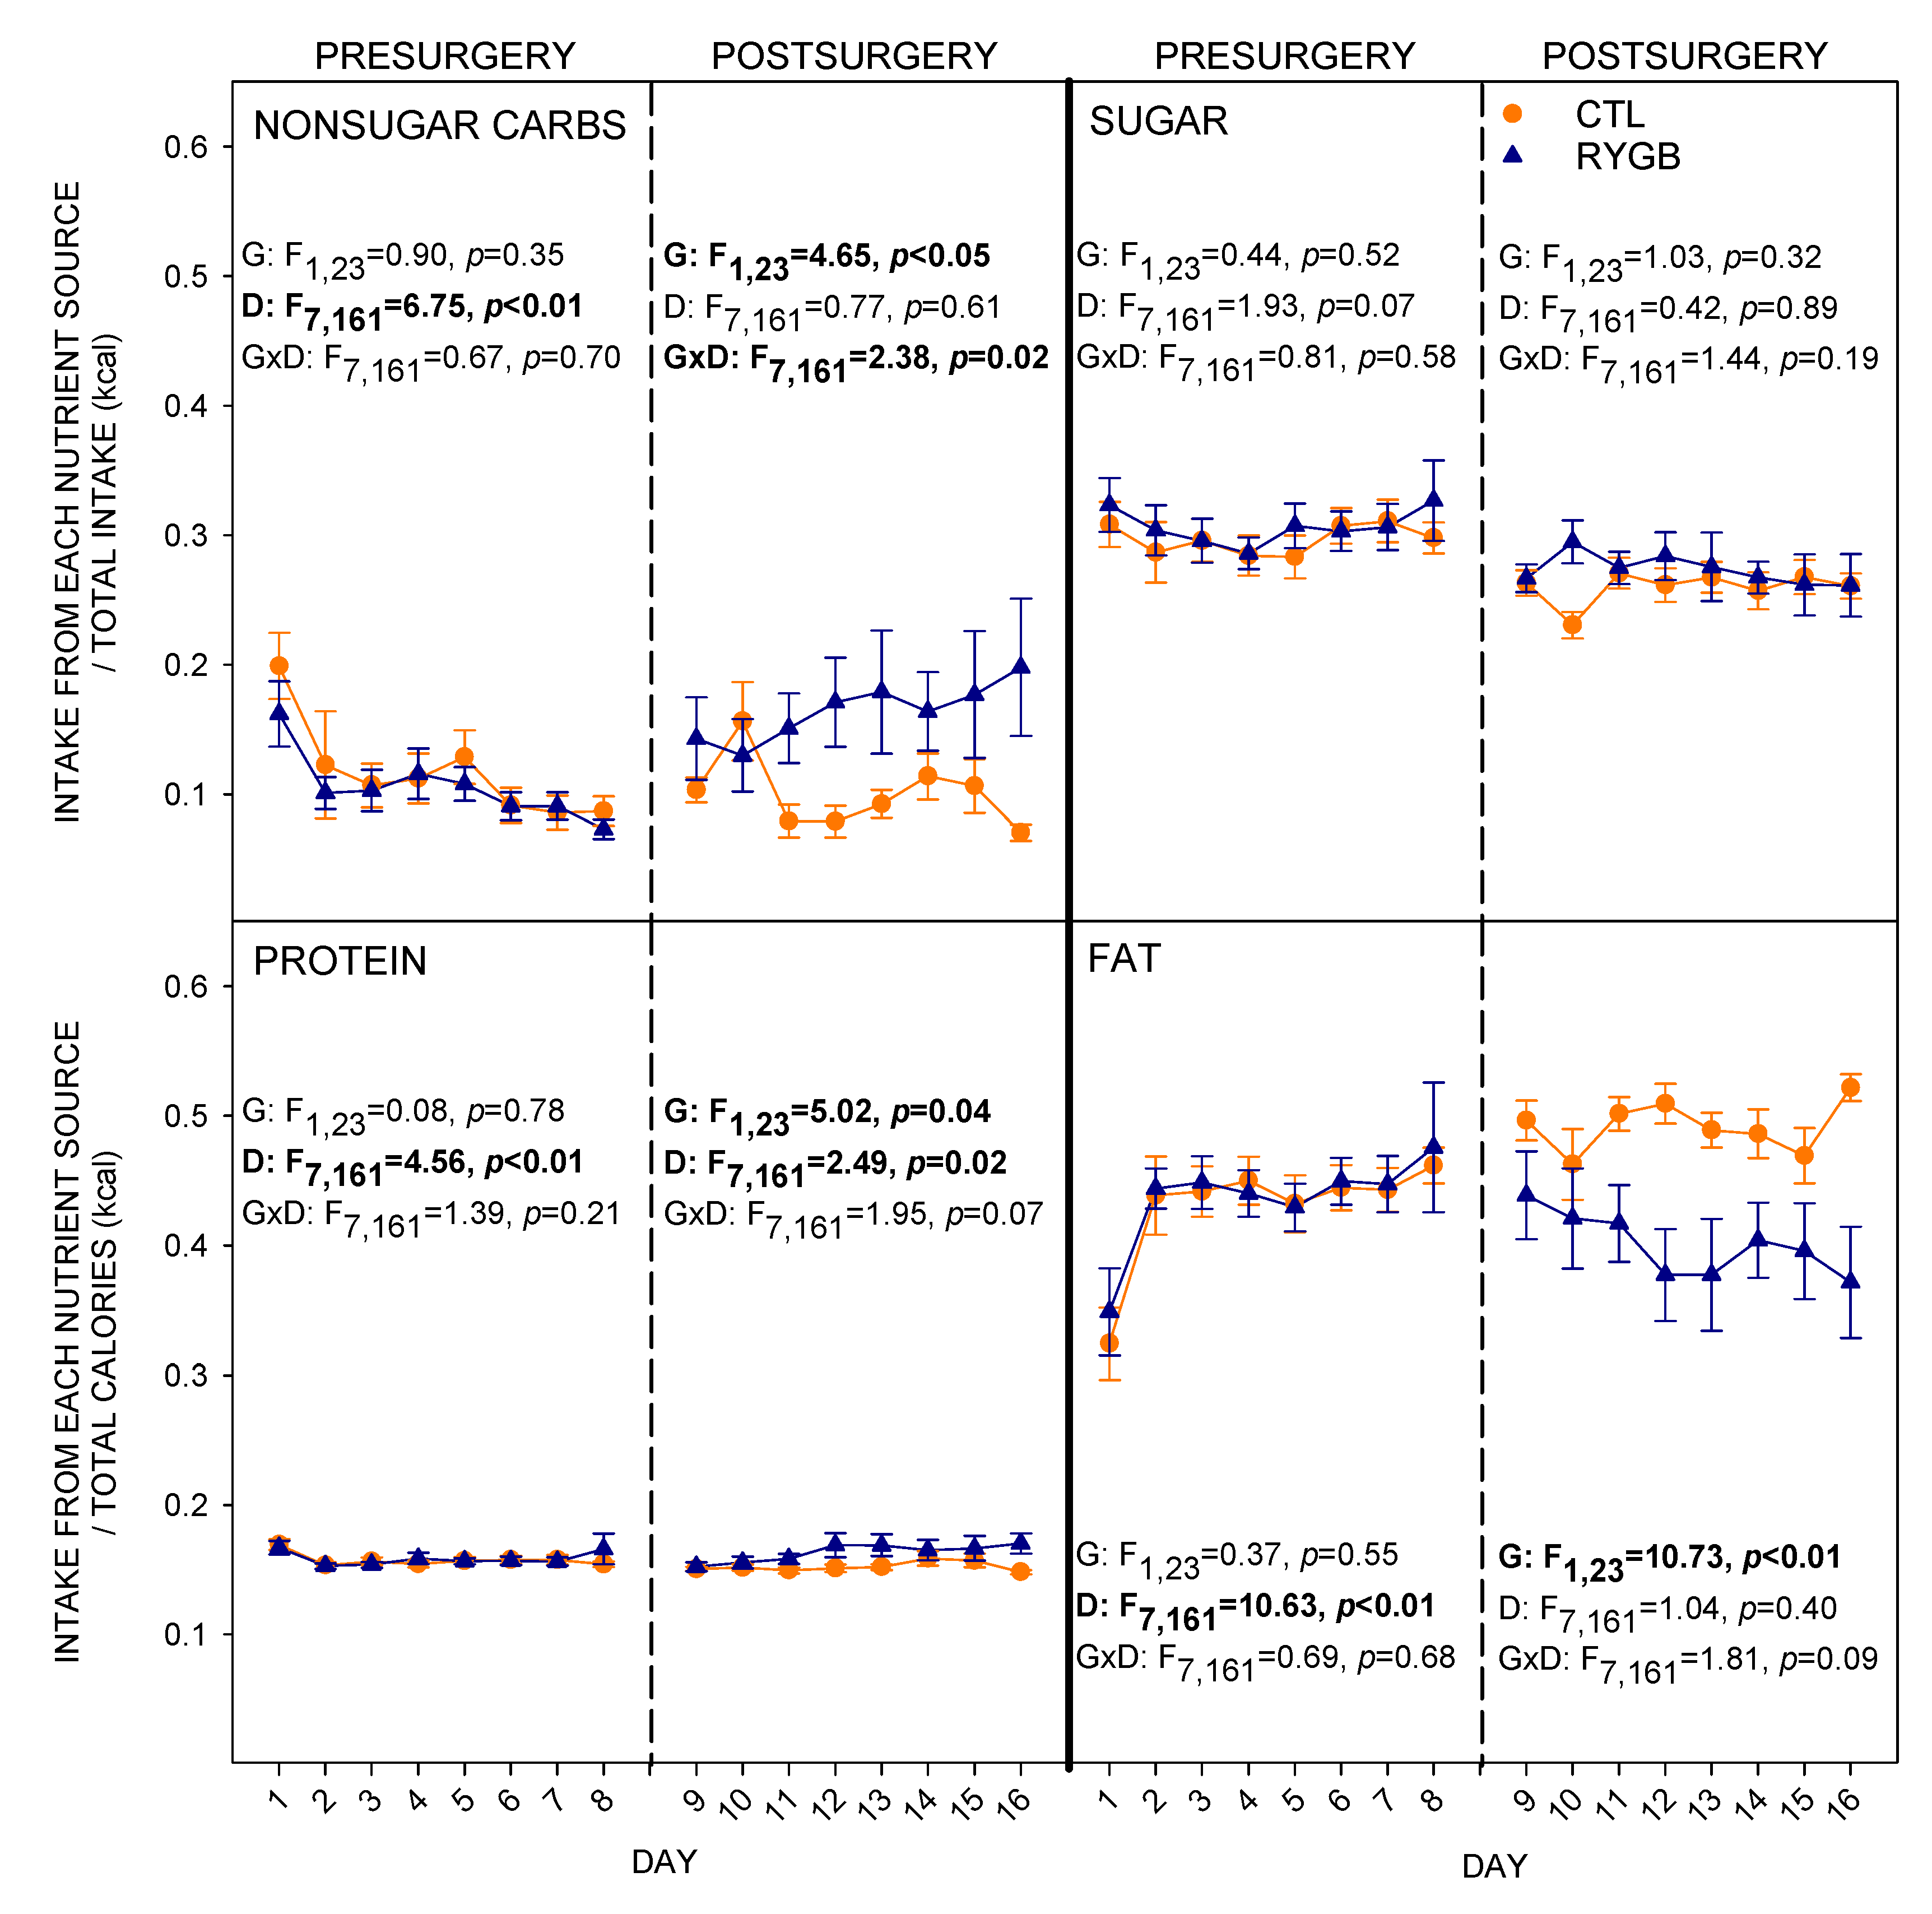
3.1. Total Intake and Food Choices
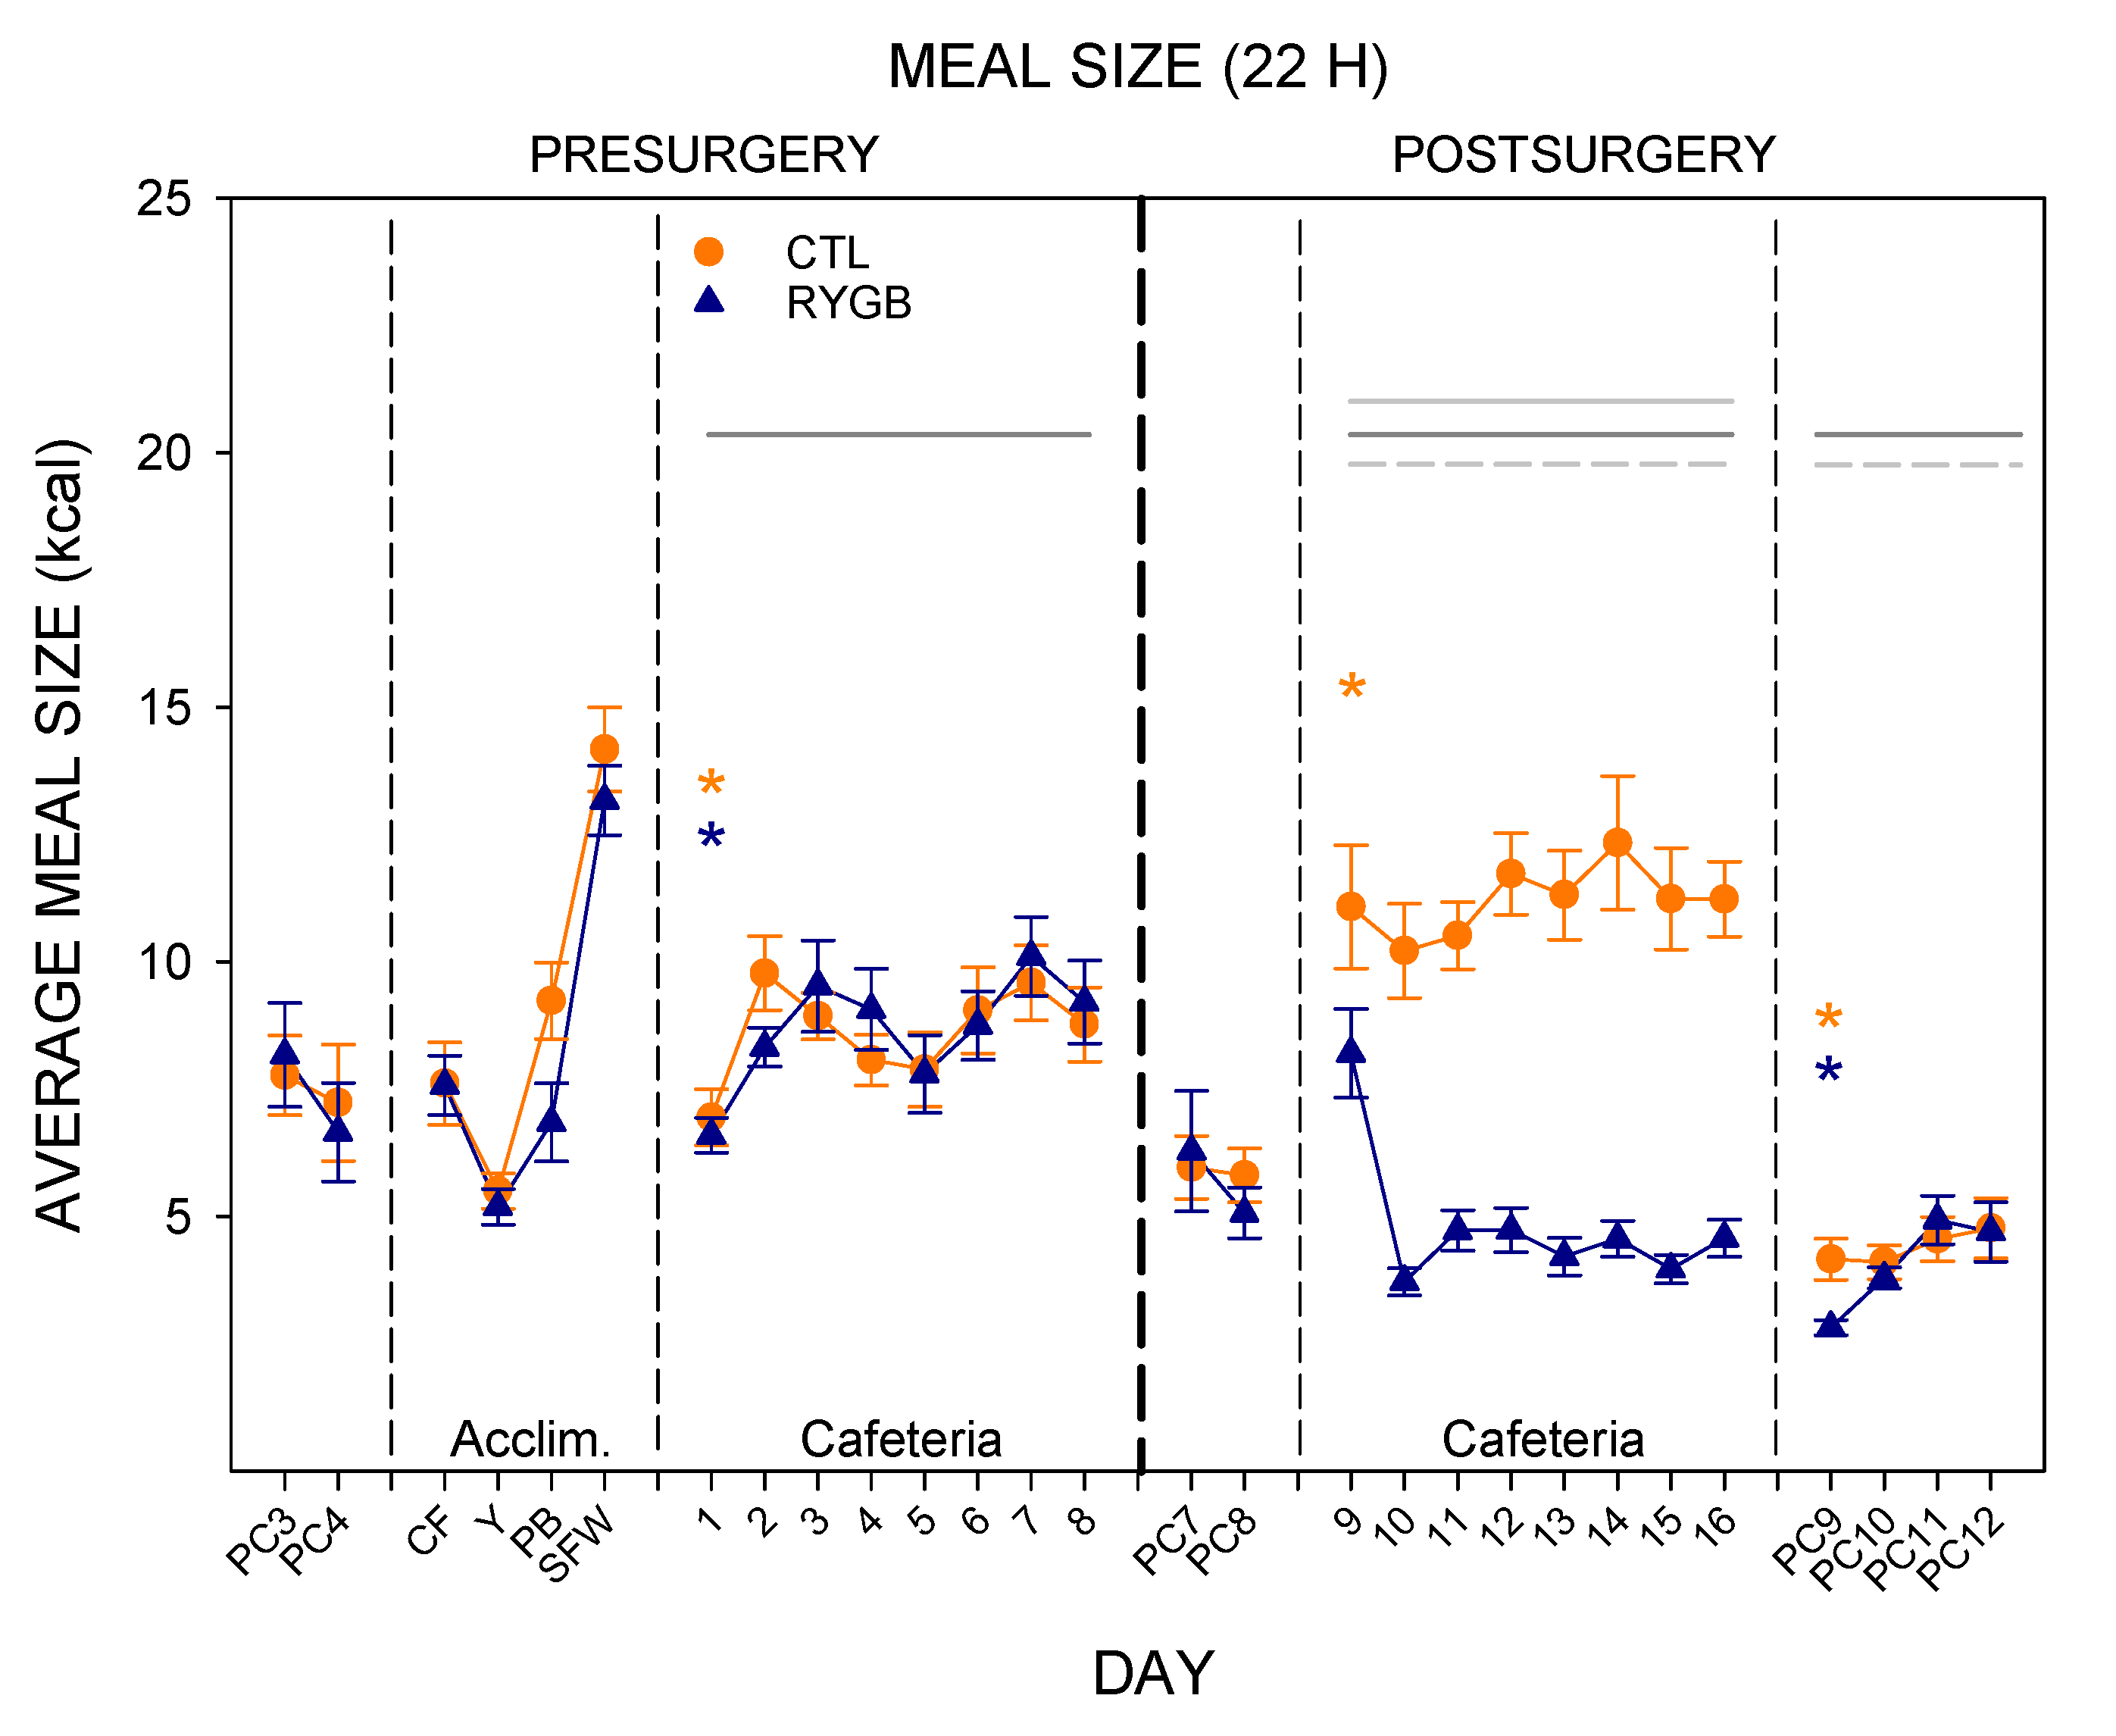
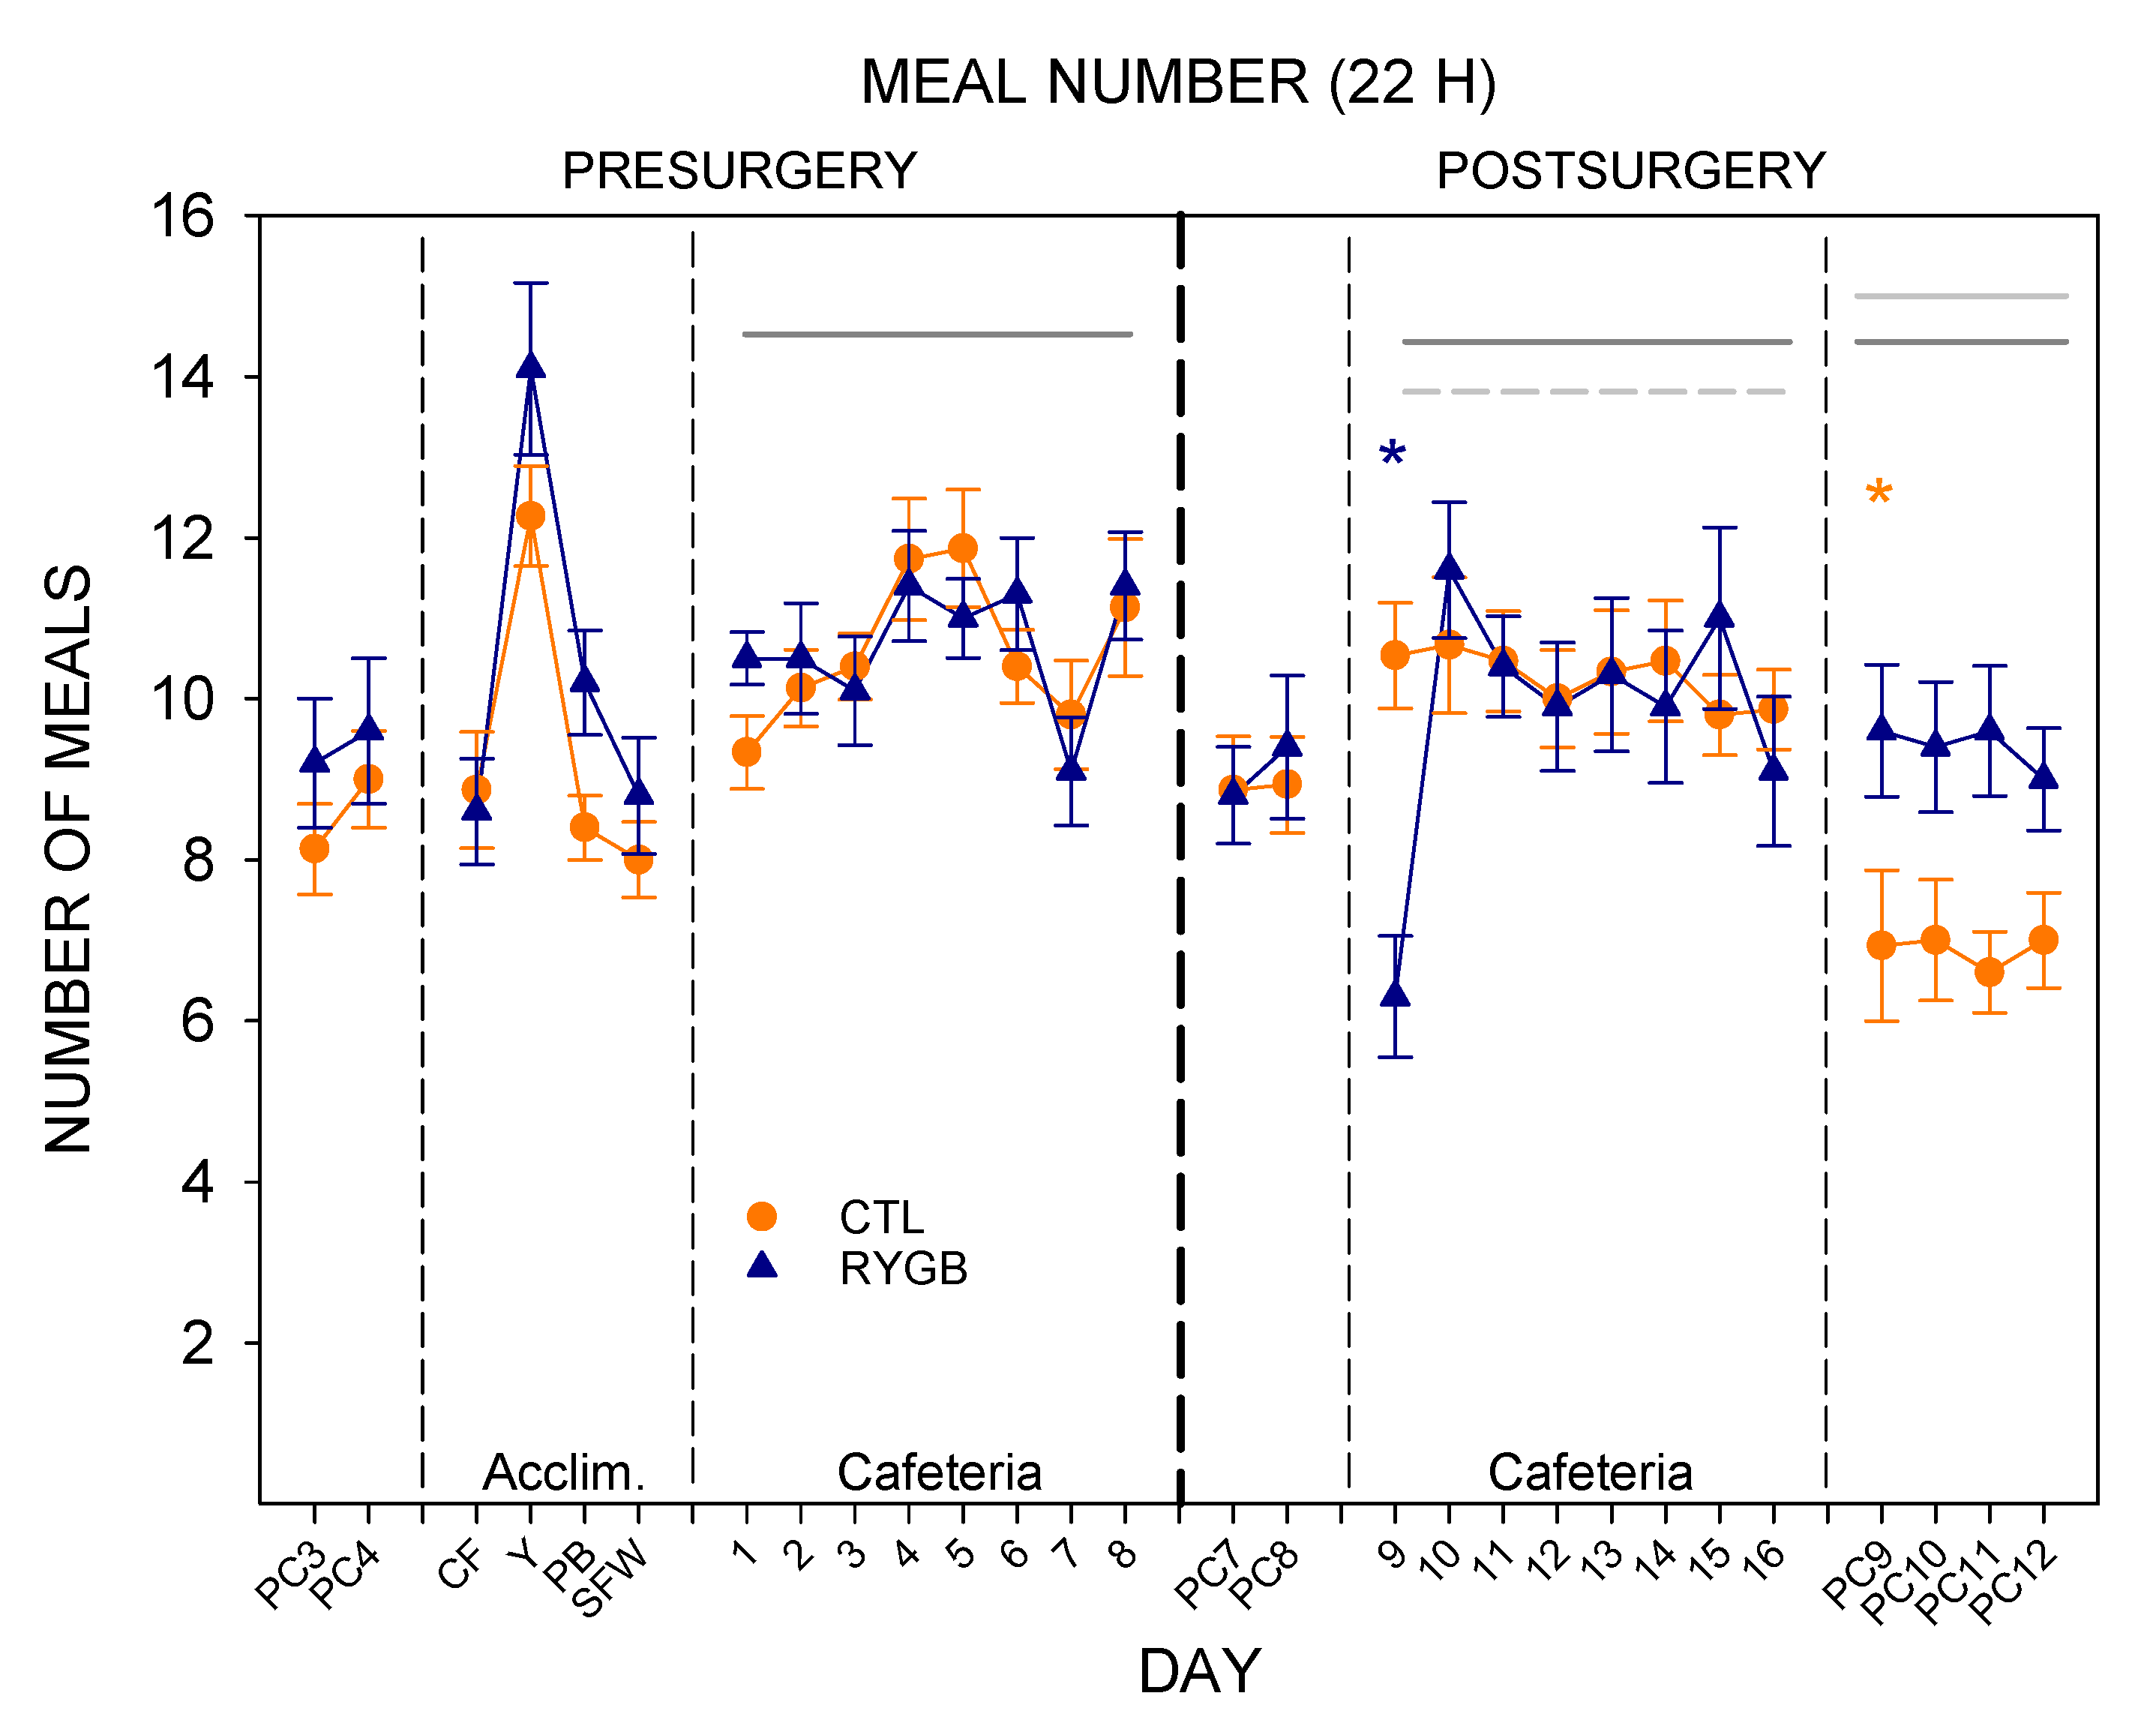
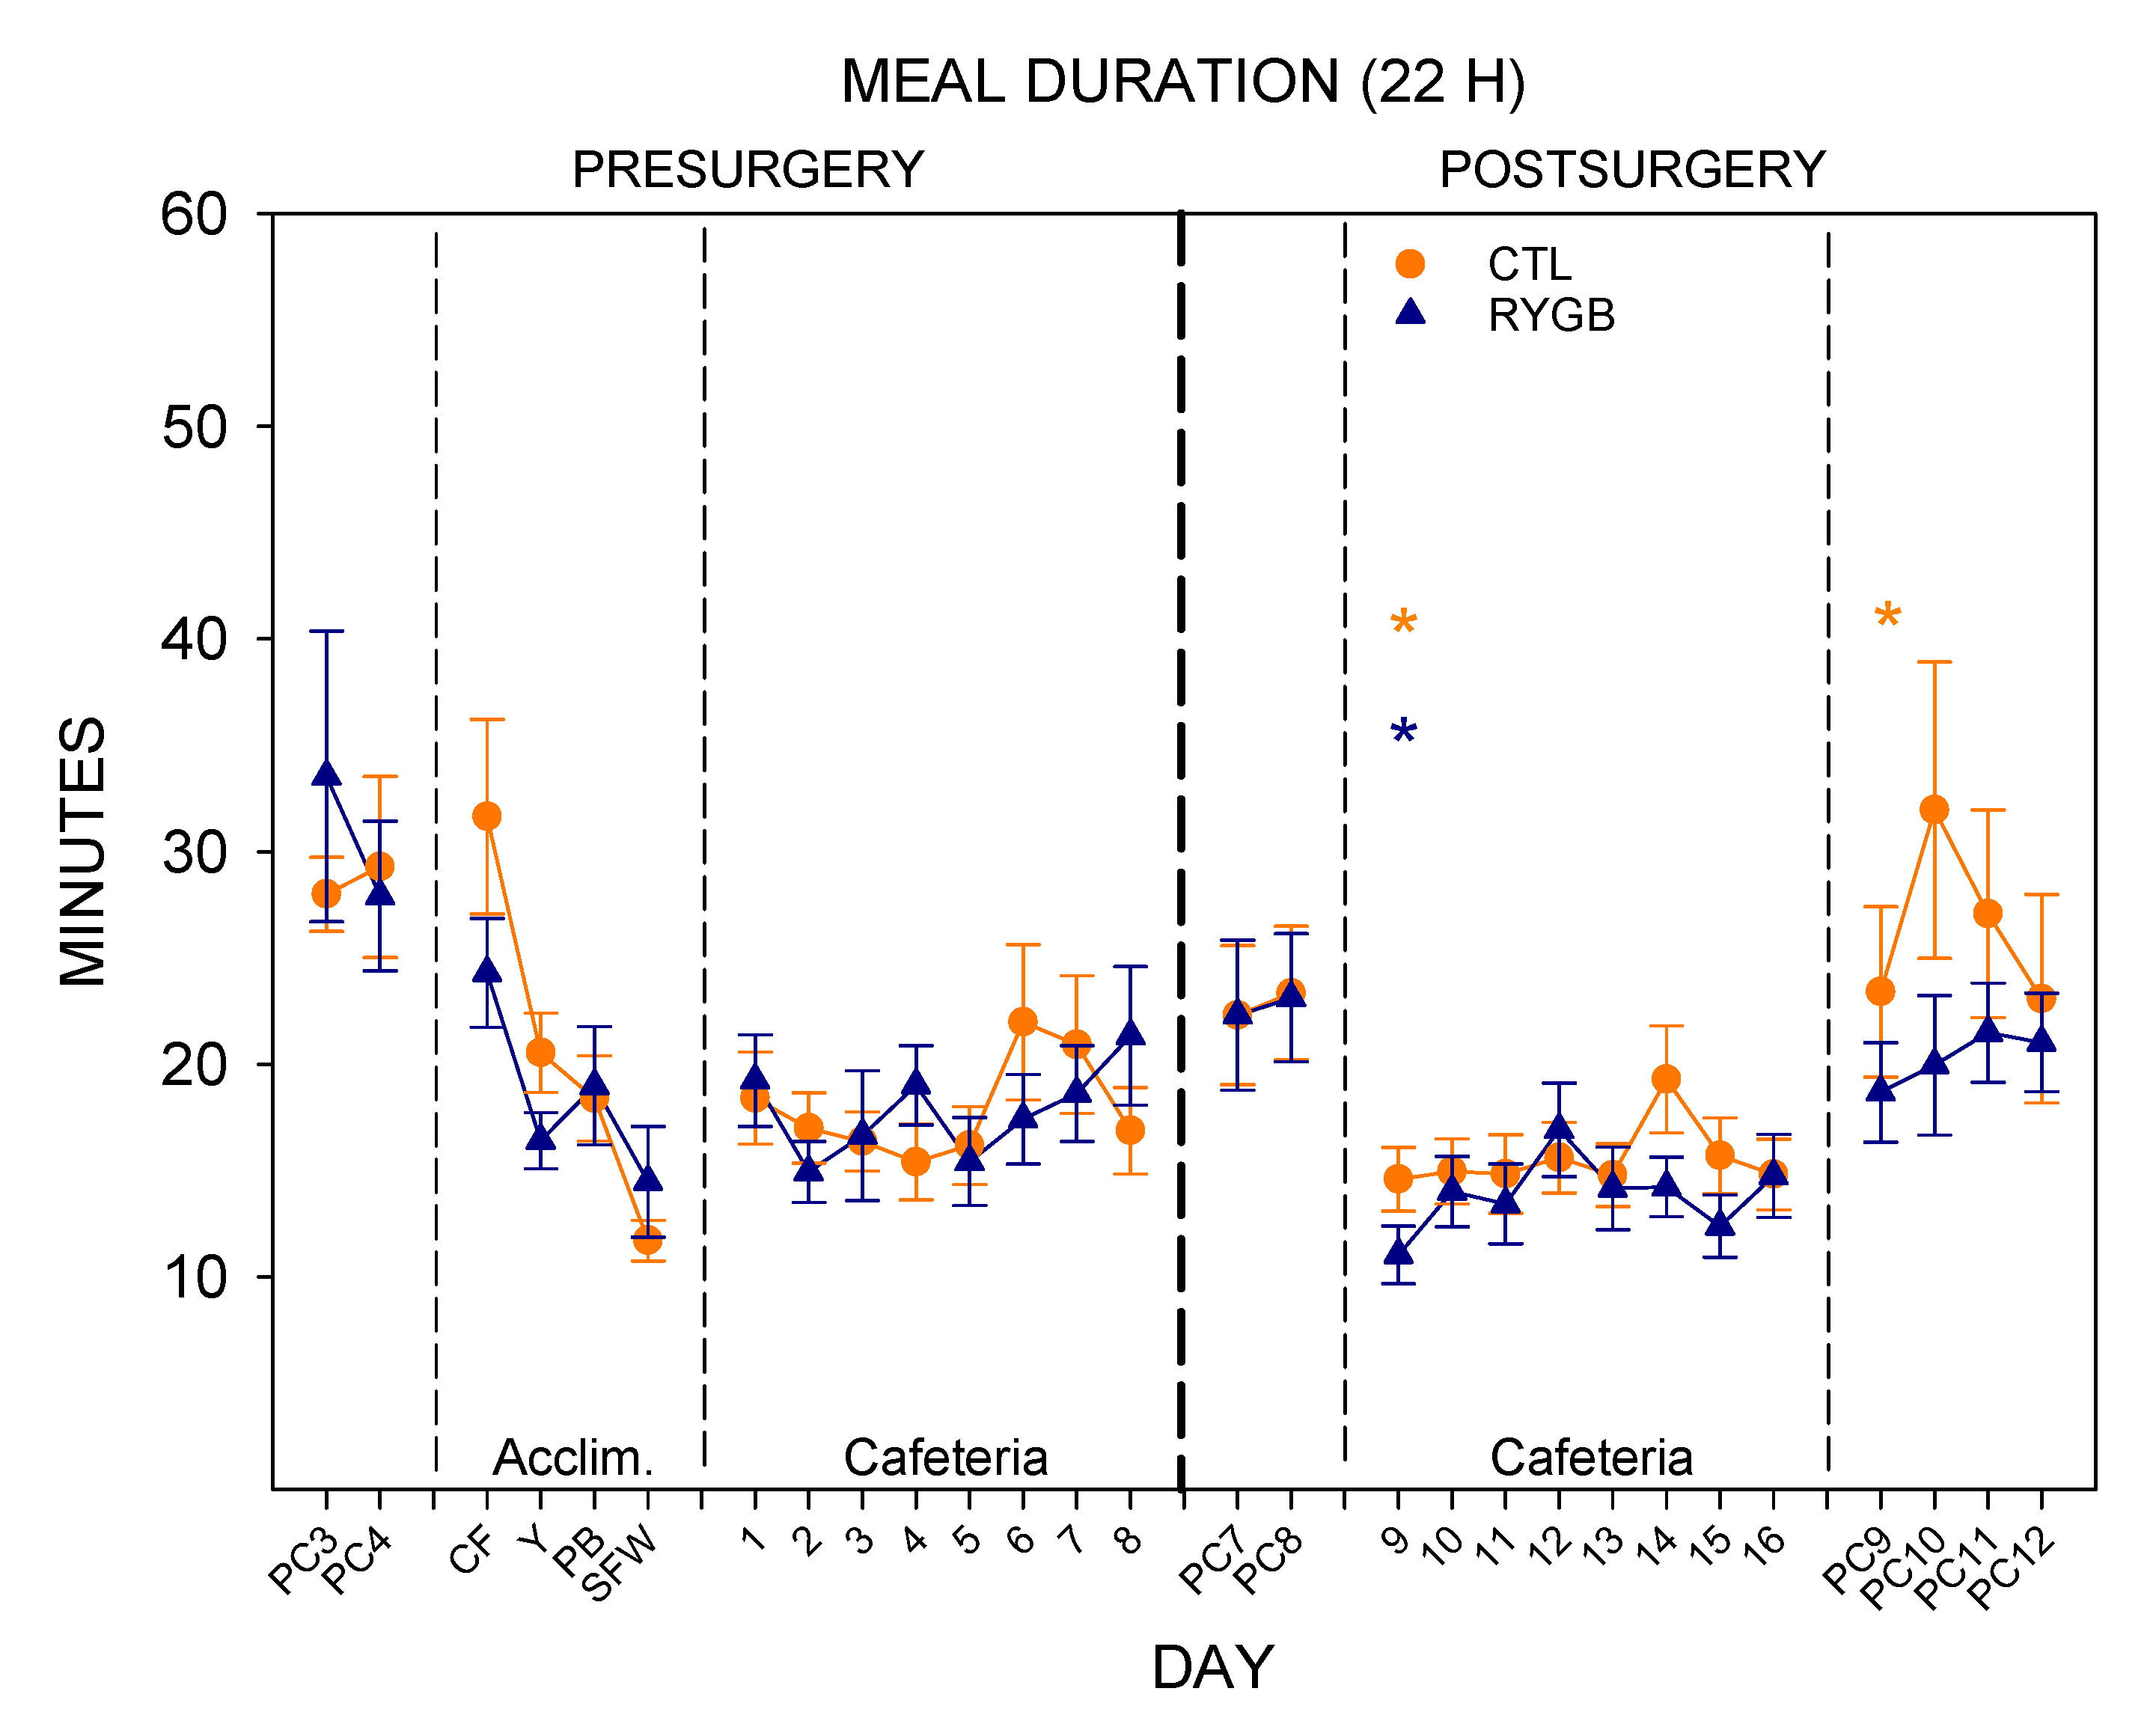
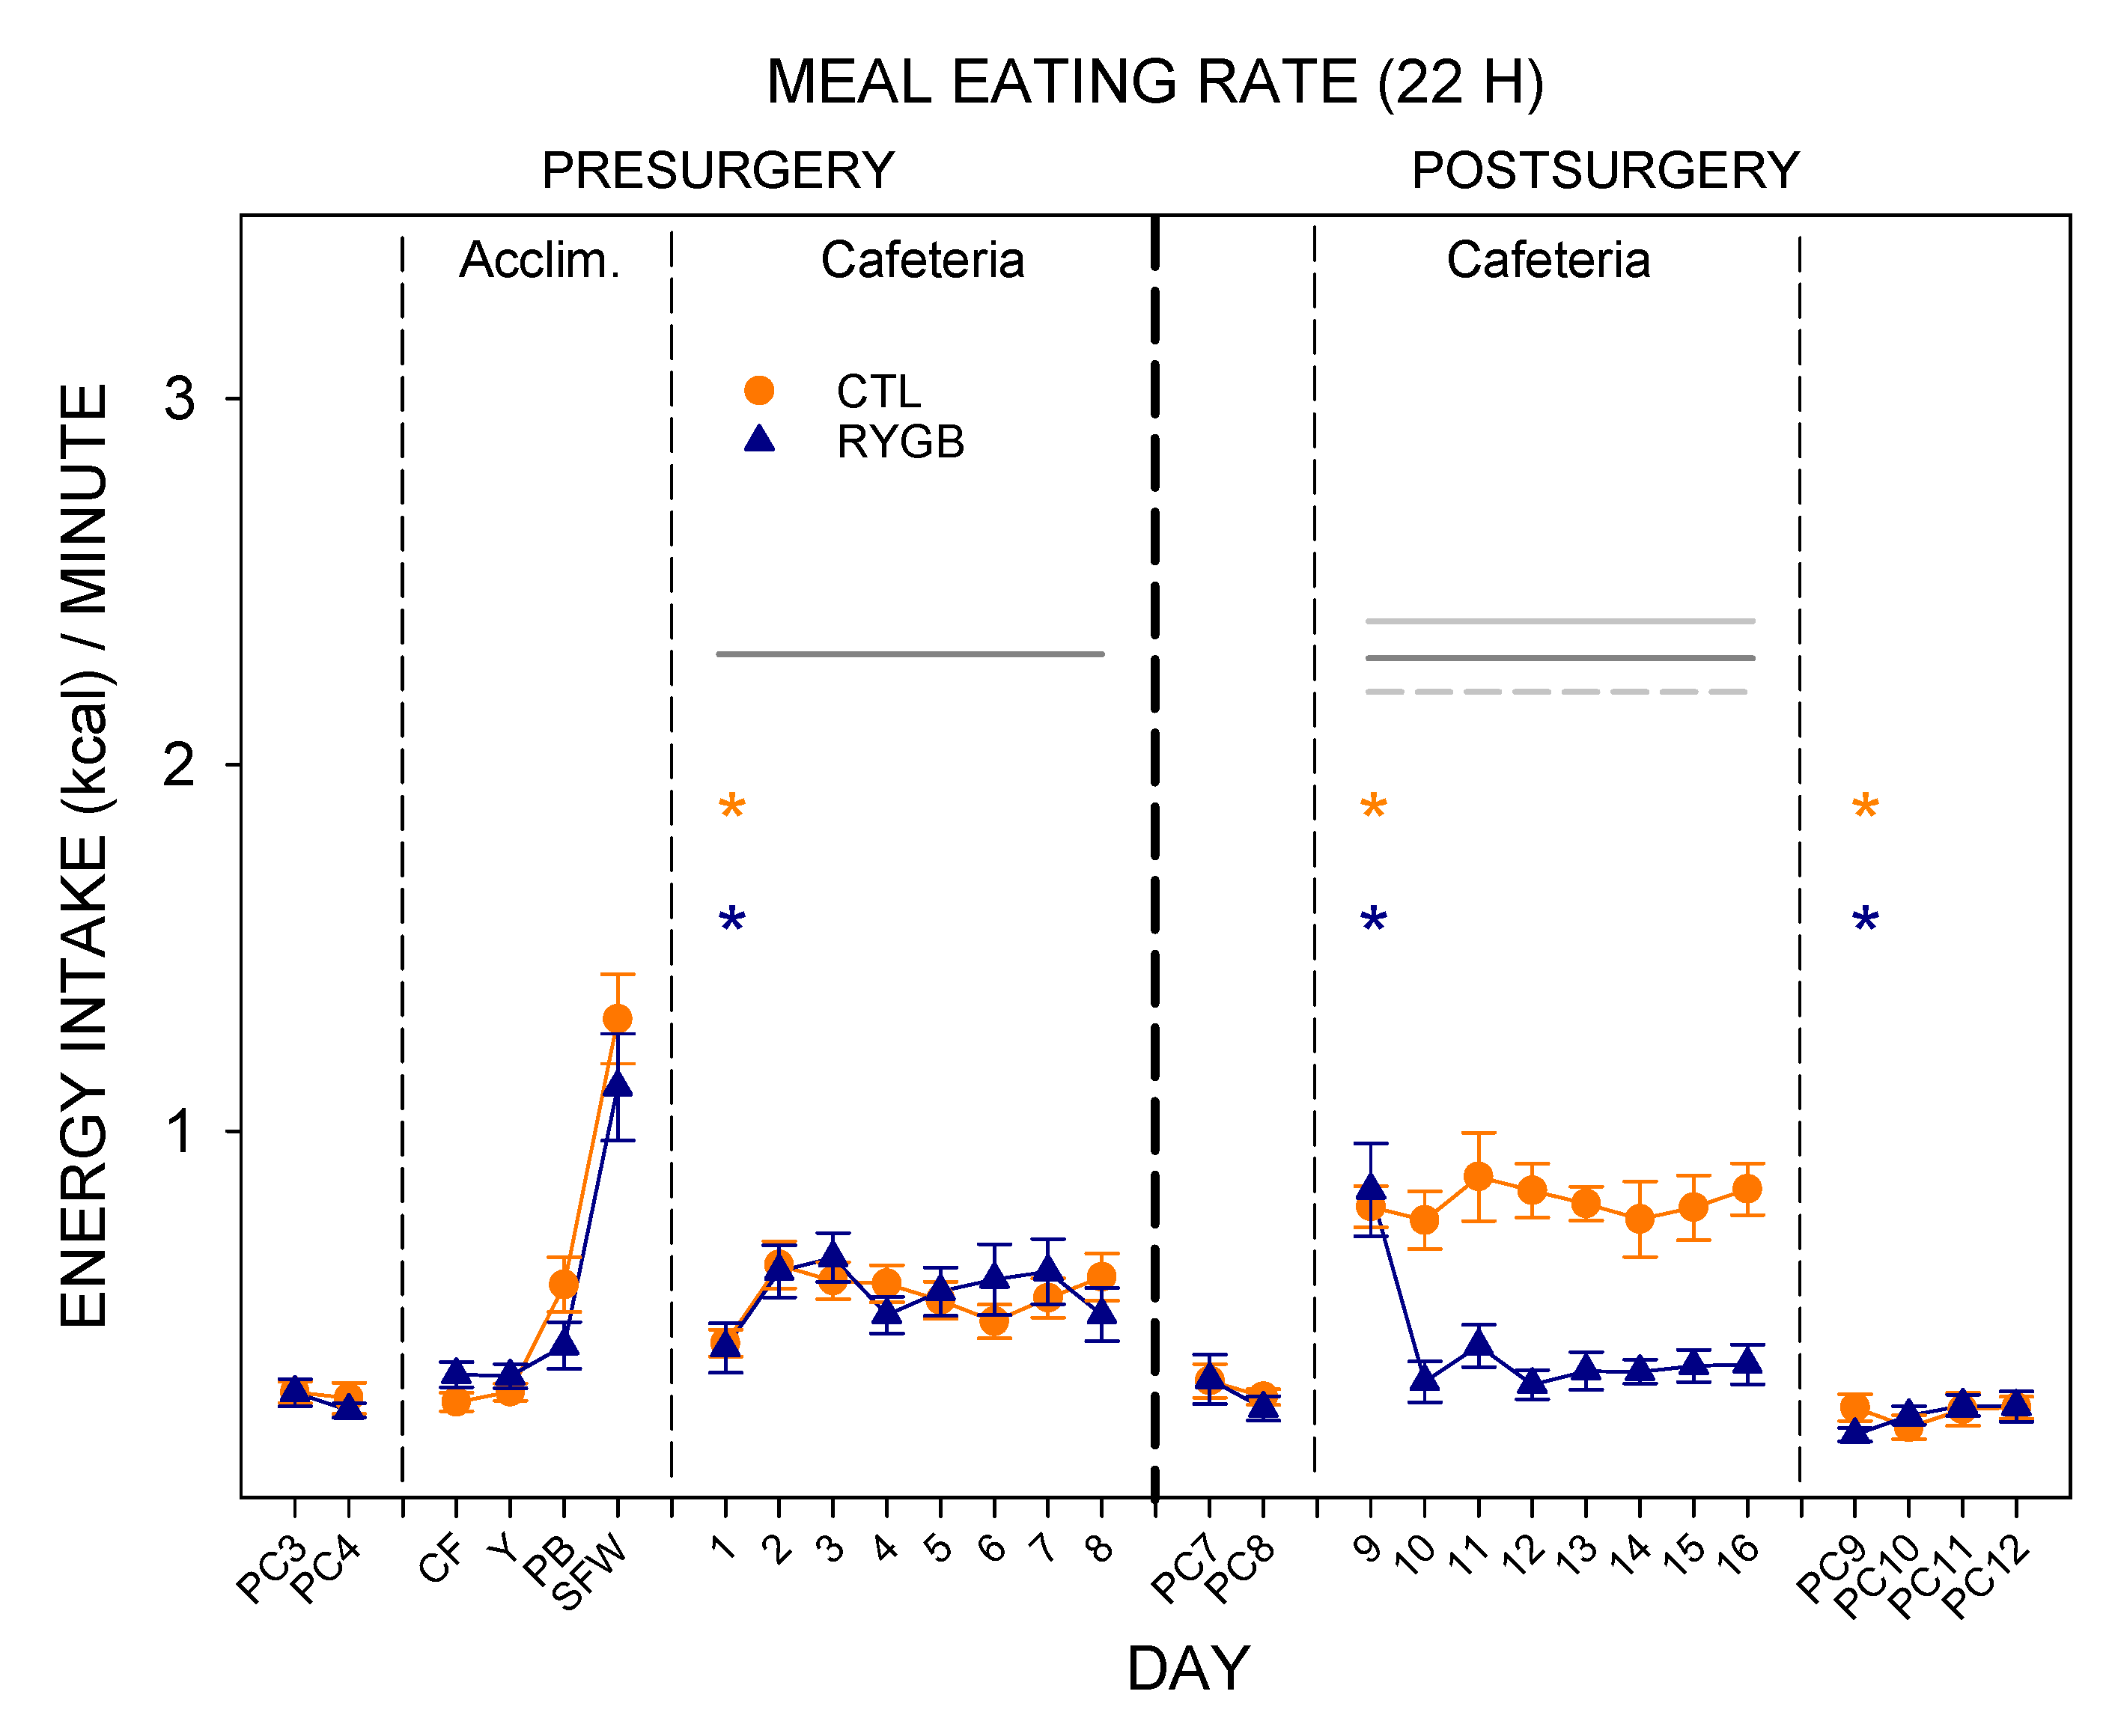
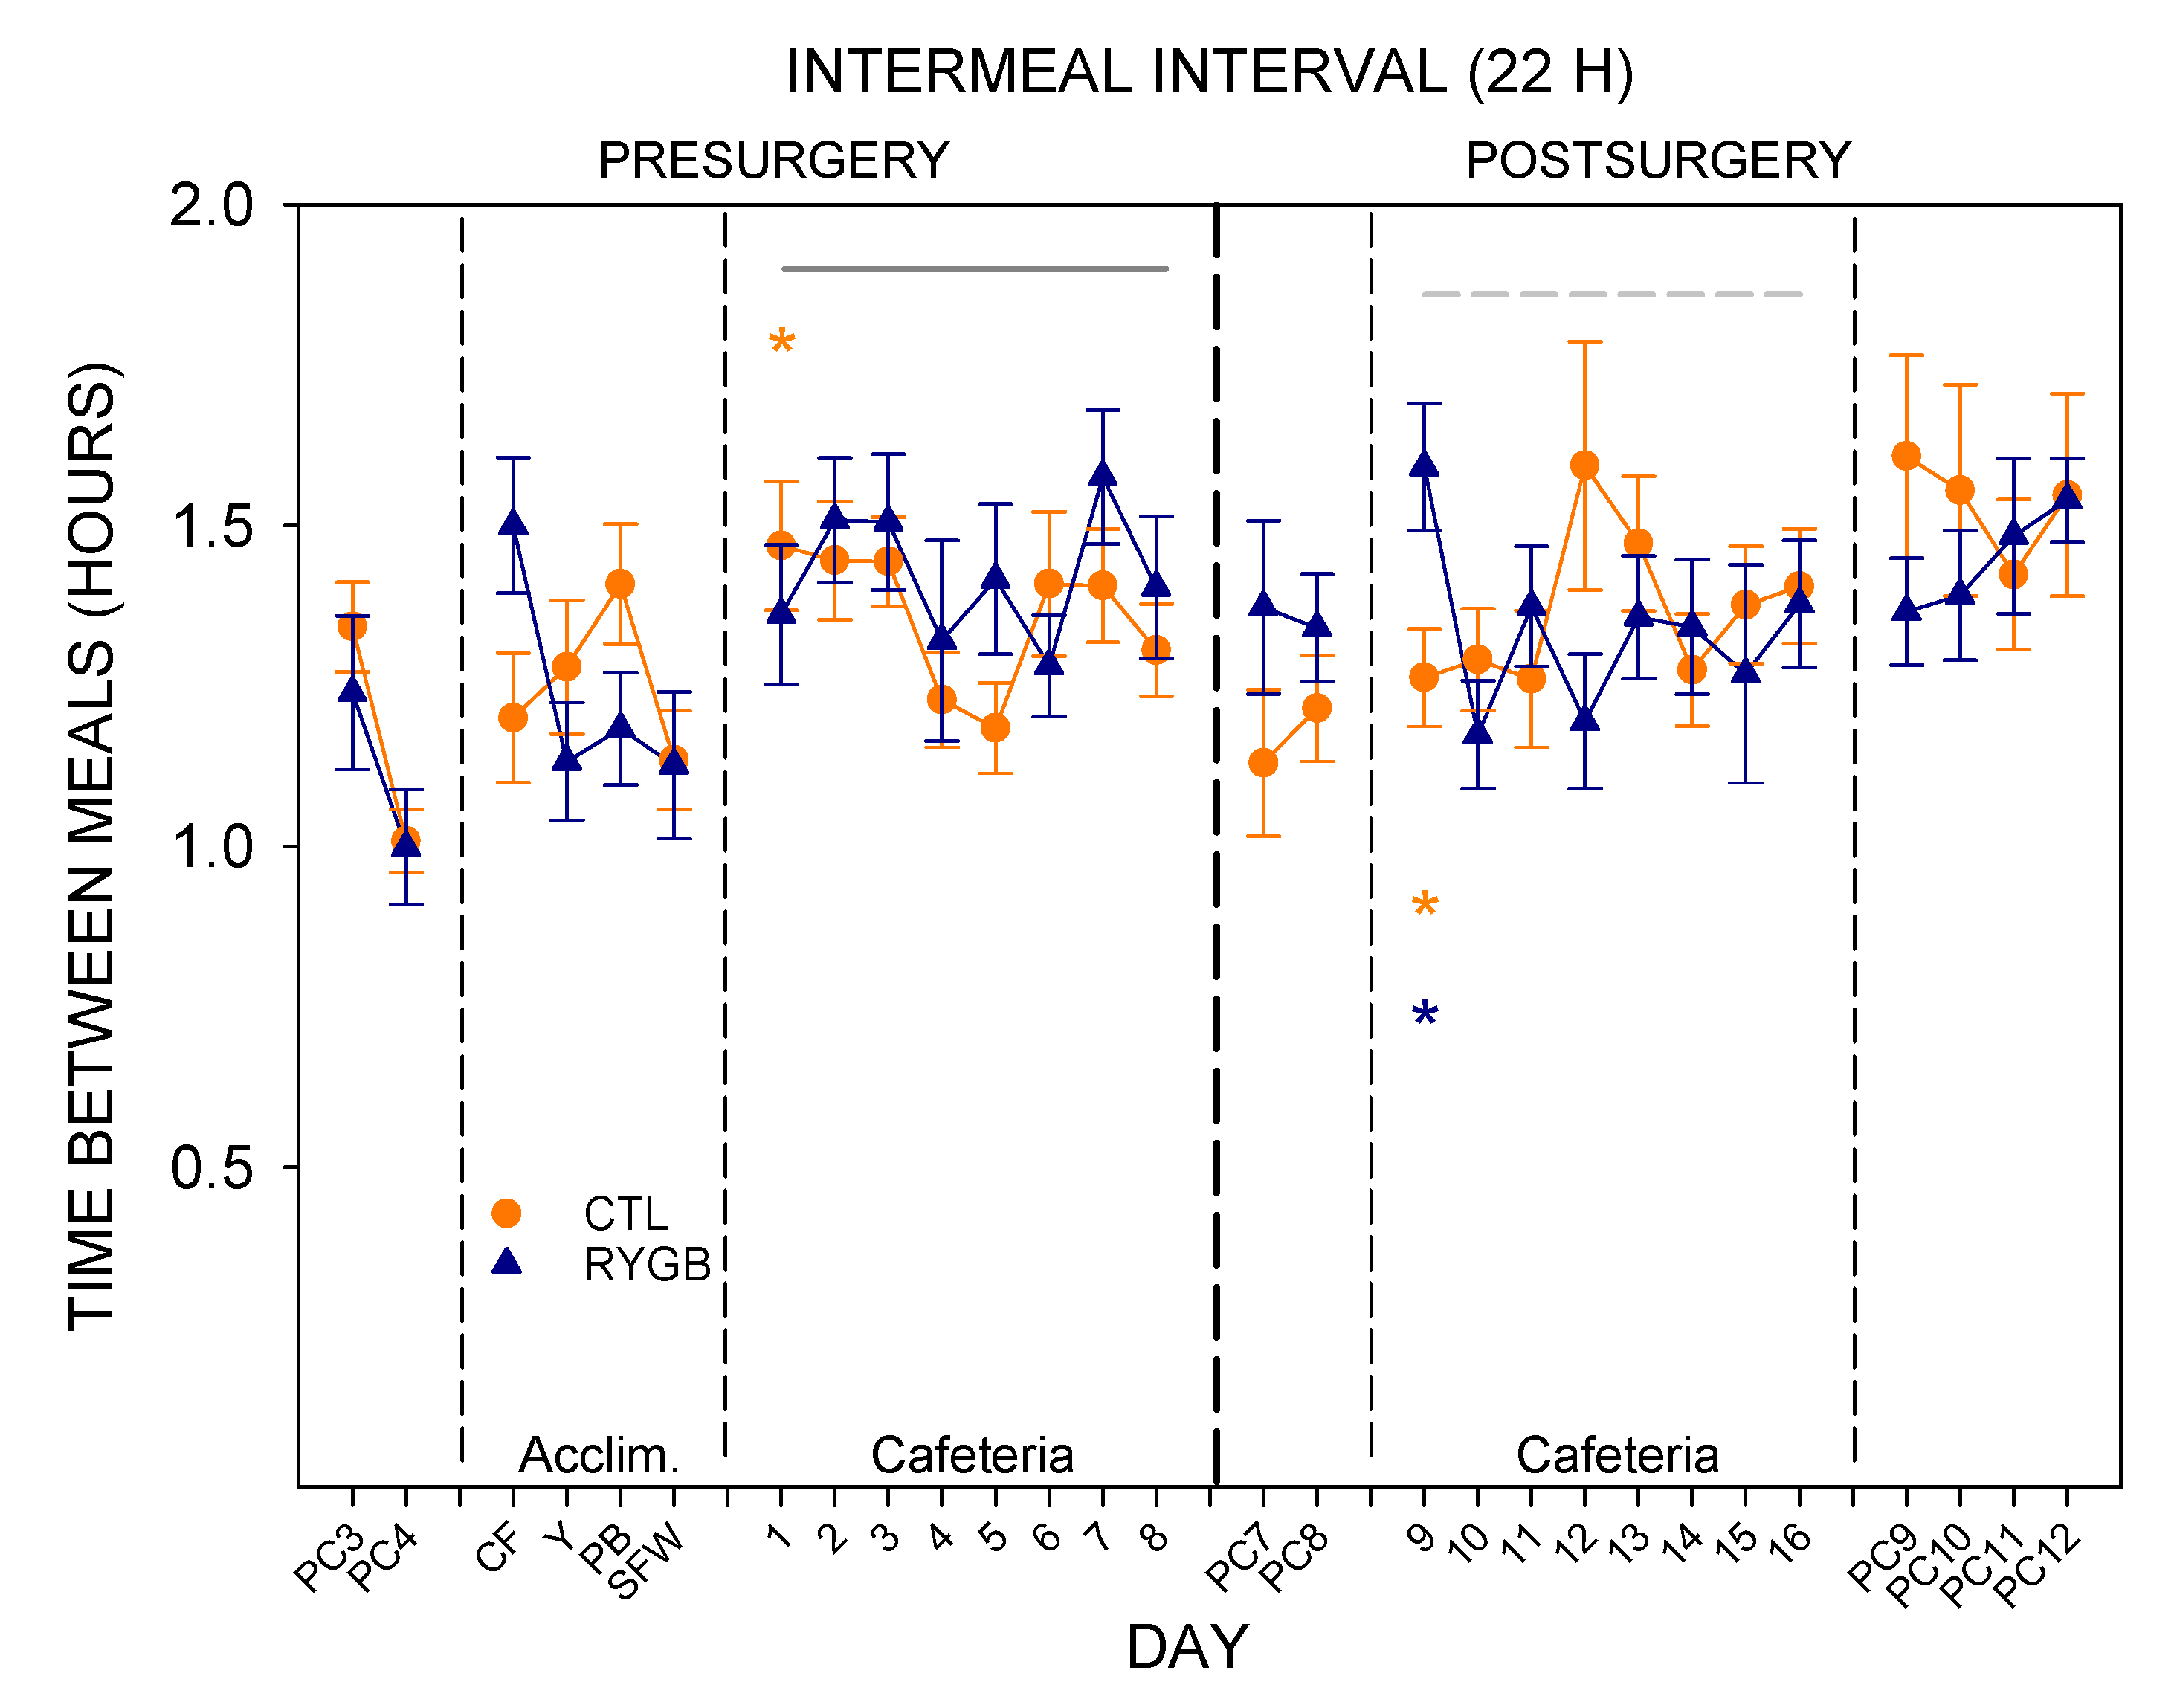
3.2. Meal Patterns across the 22-h Period
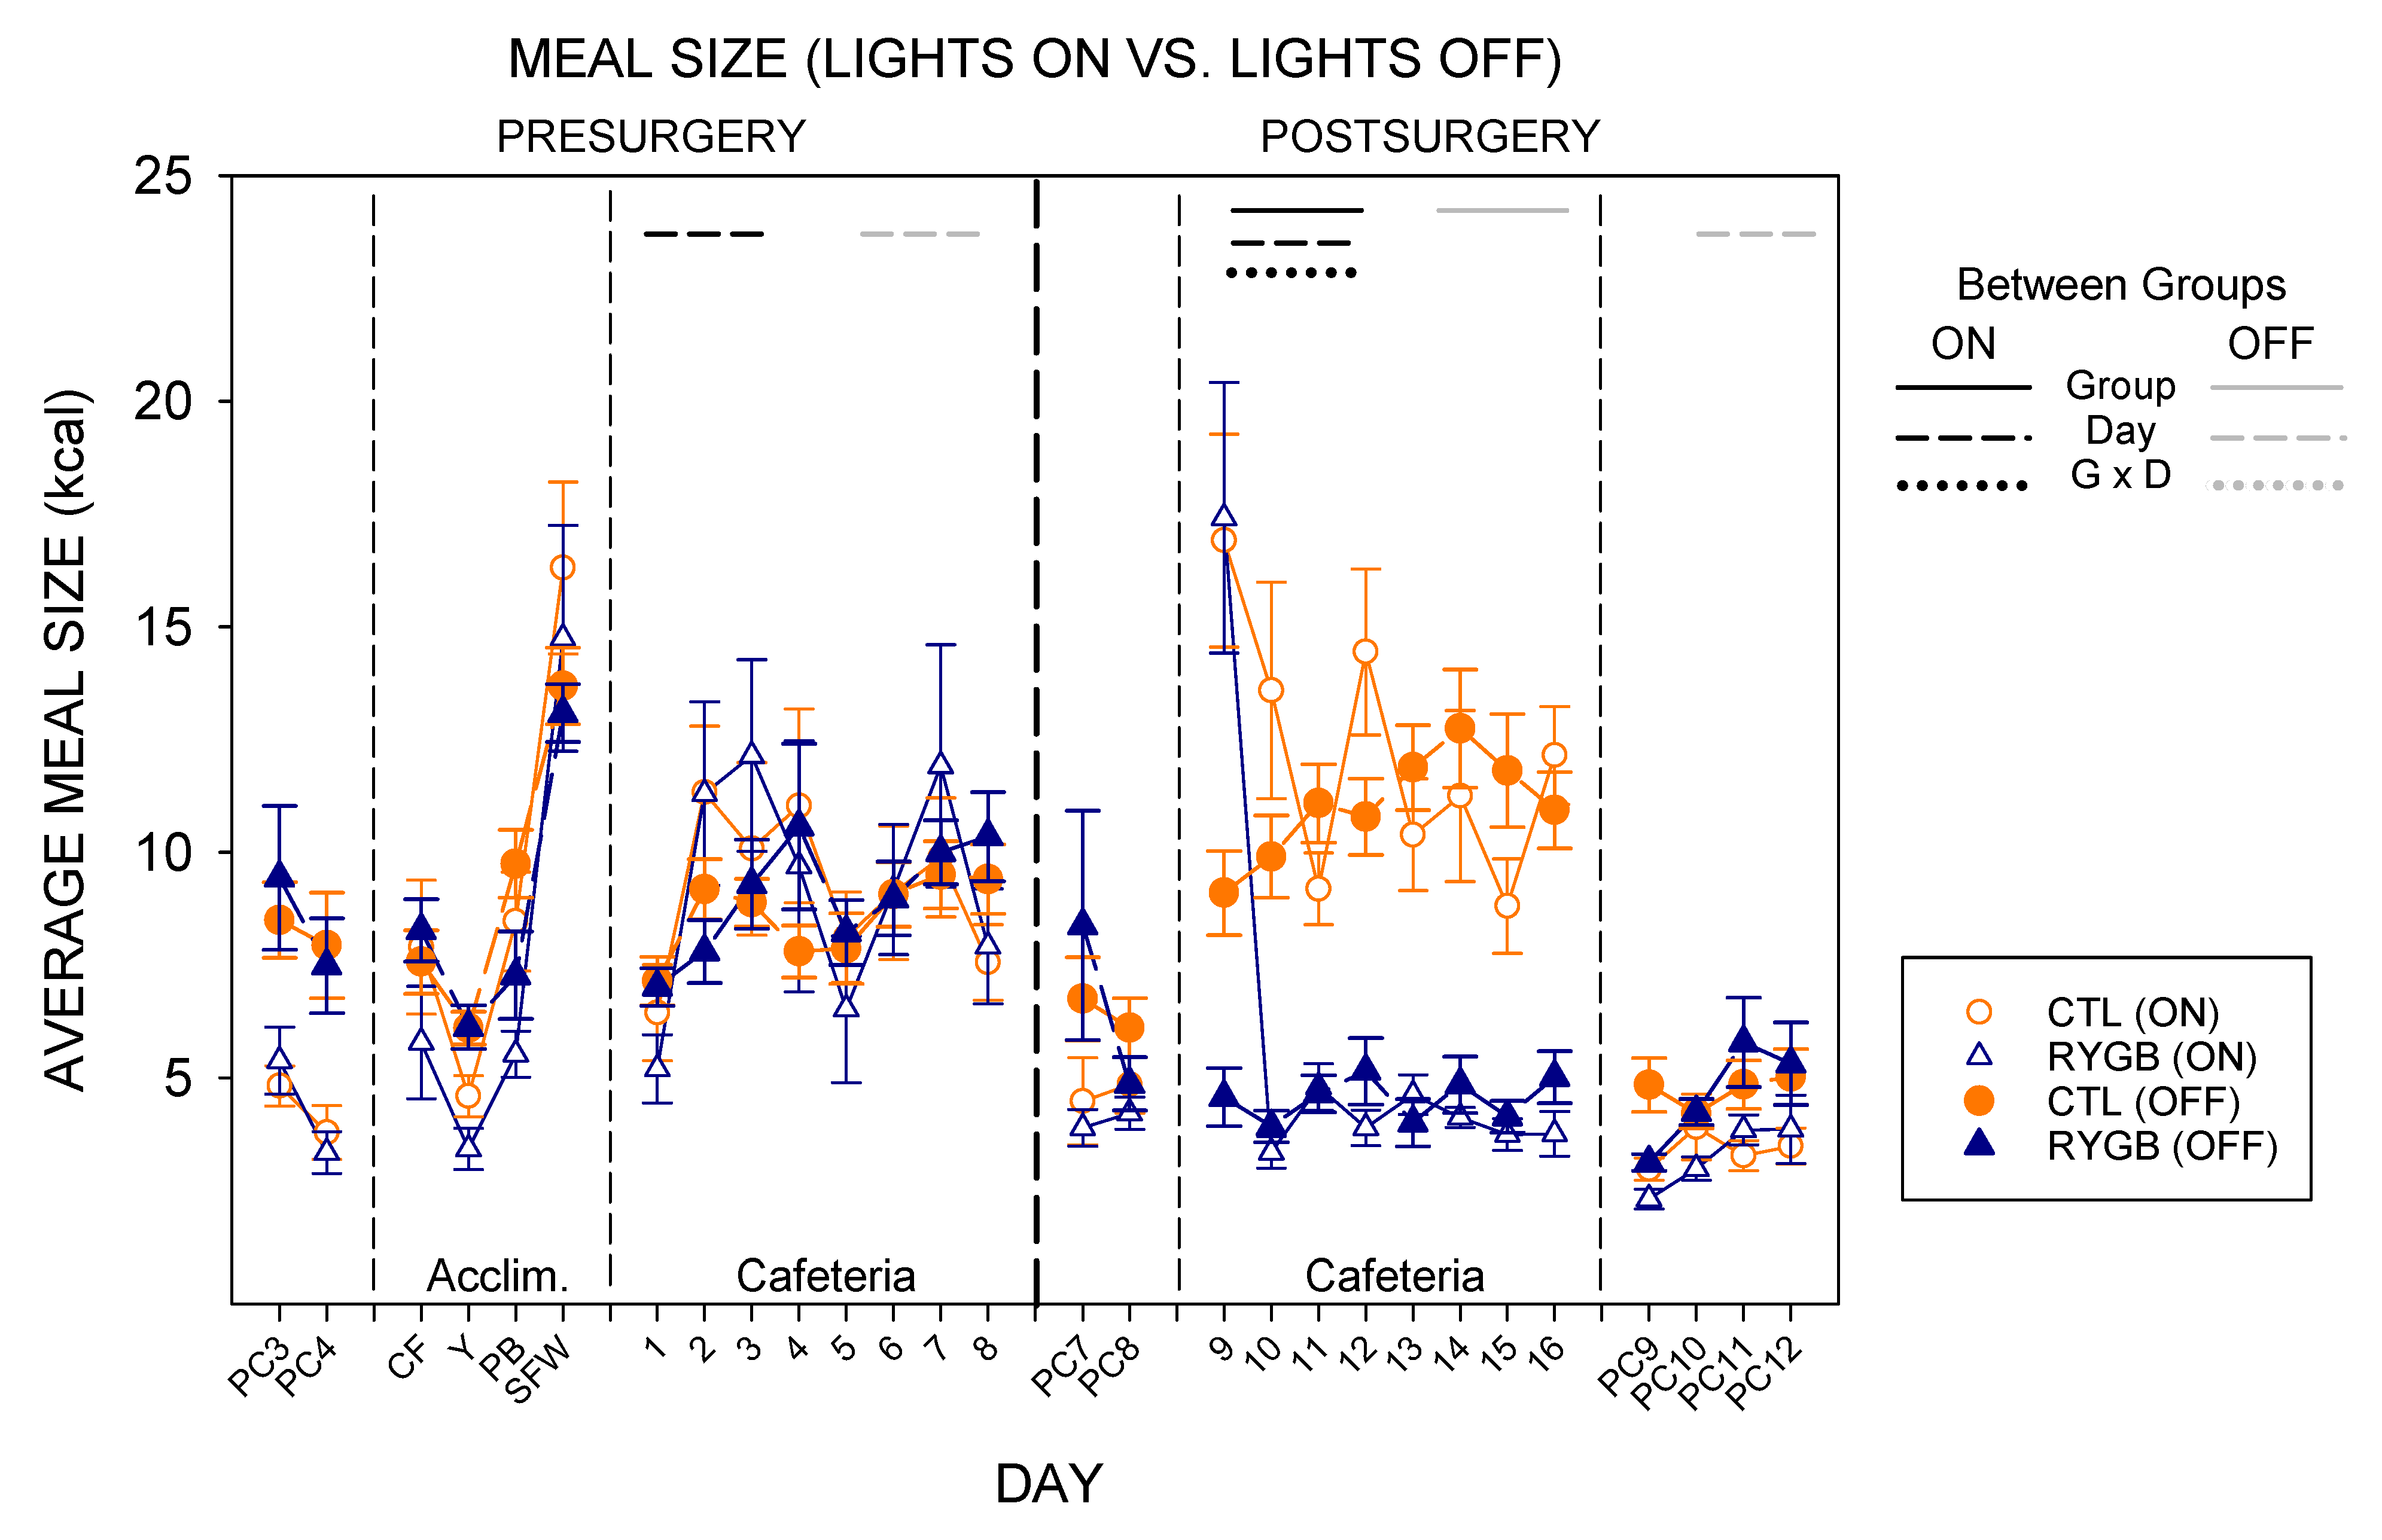
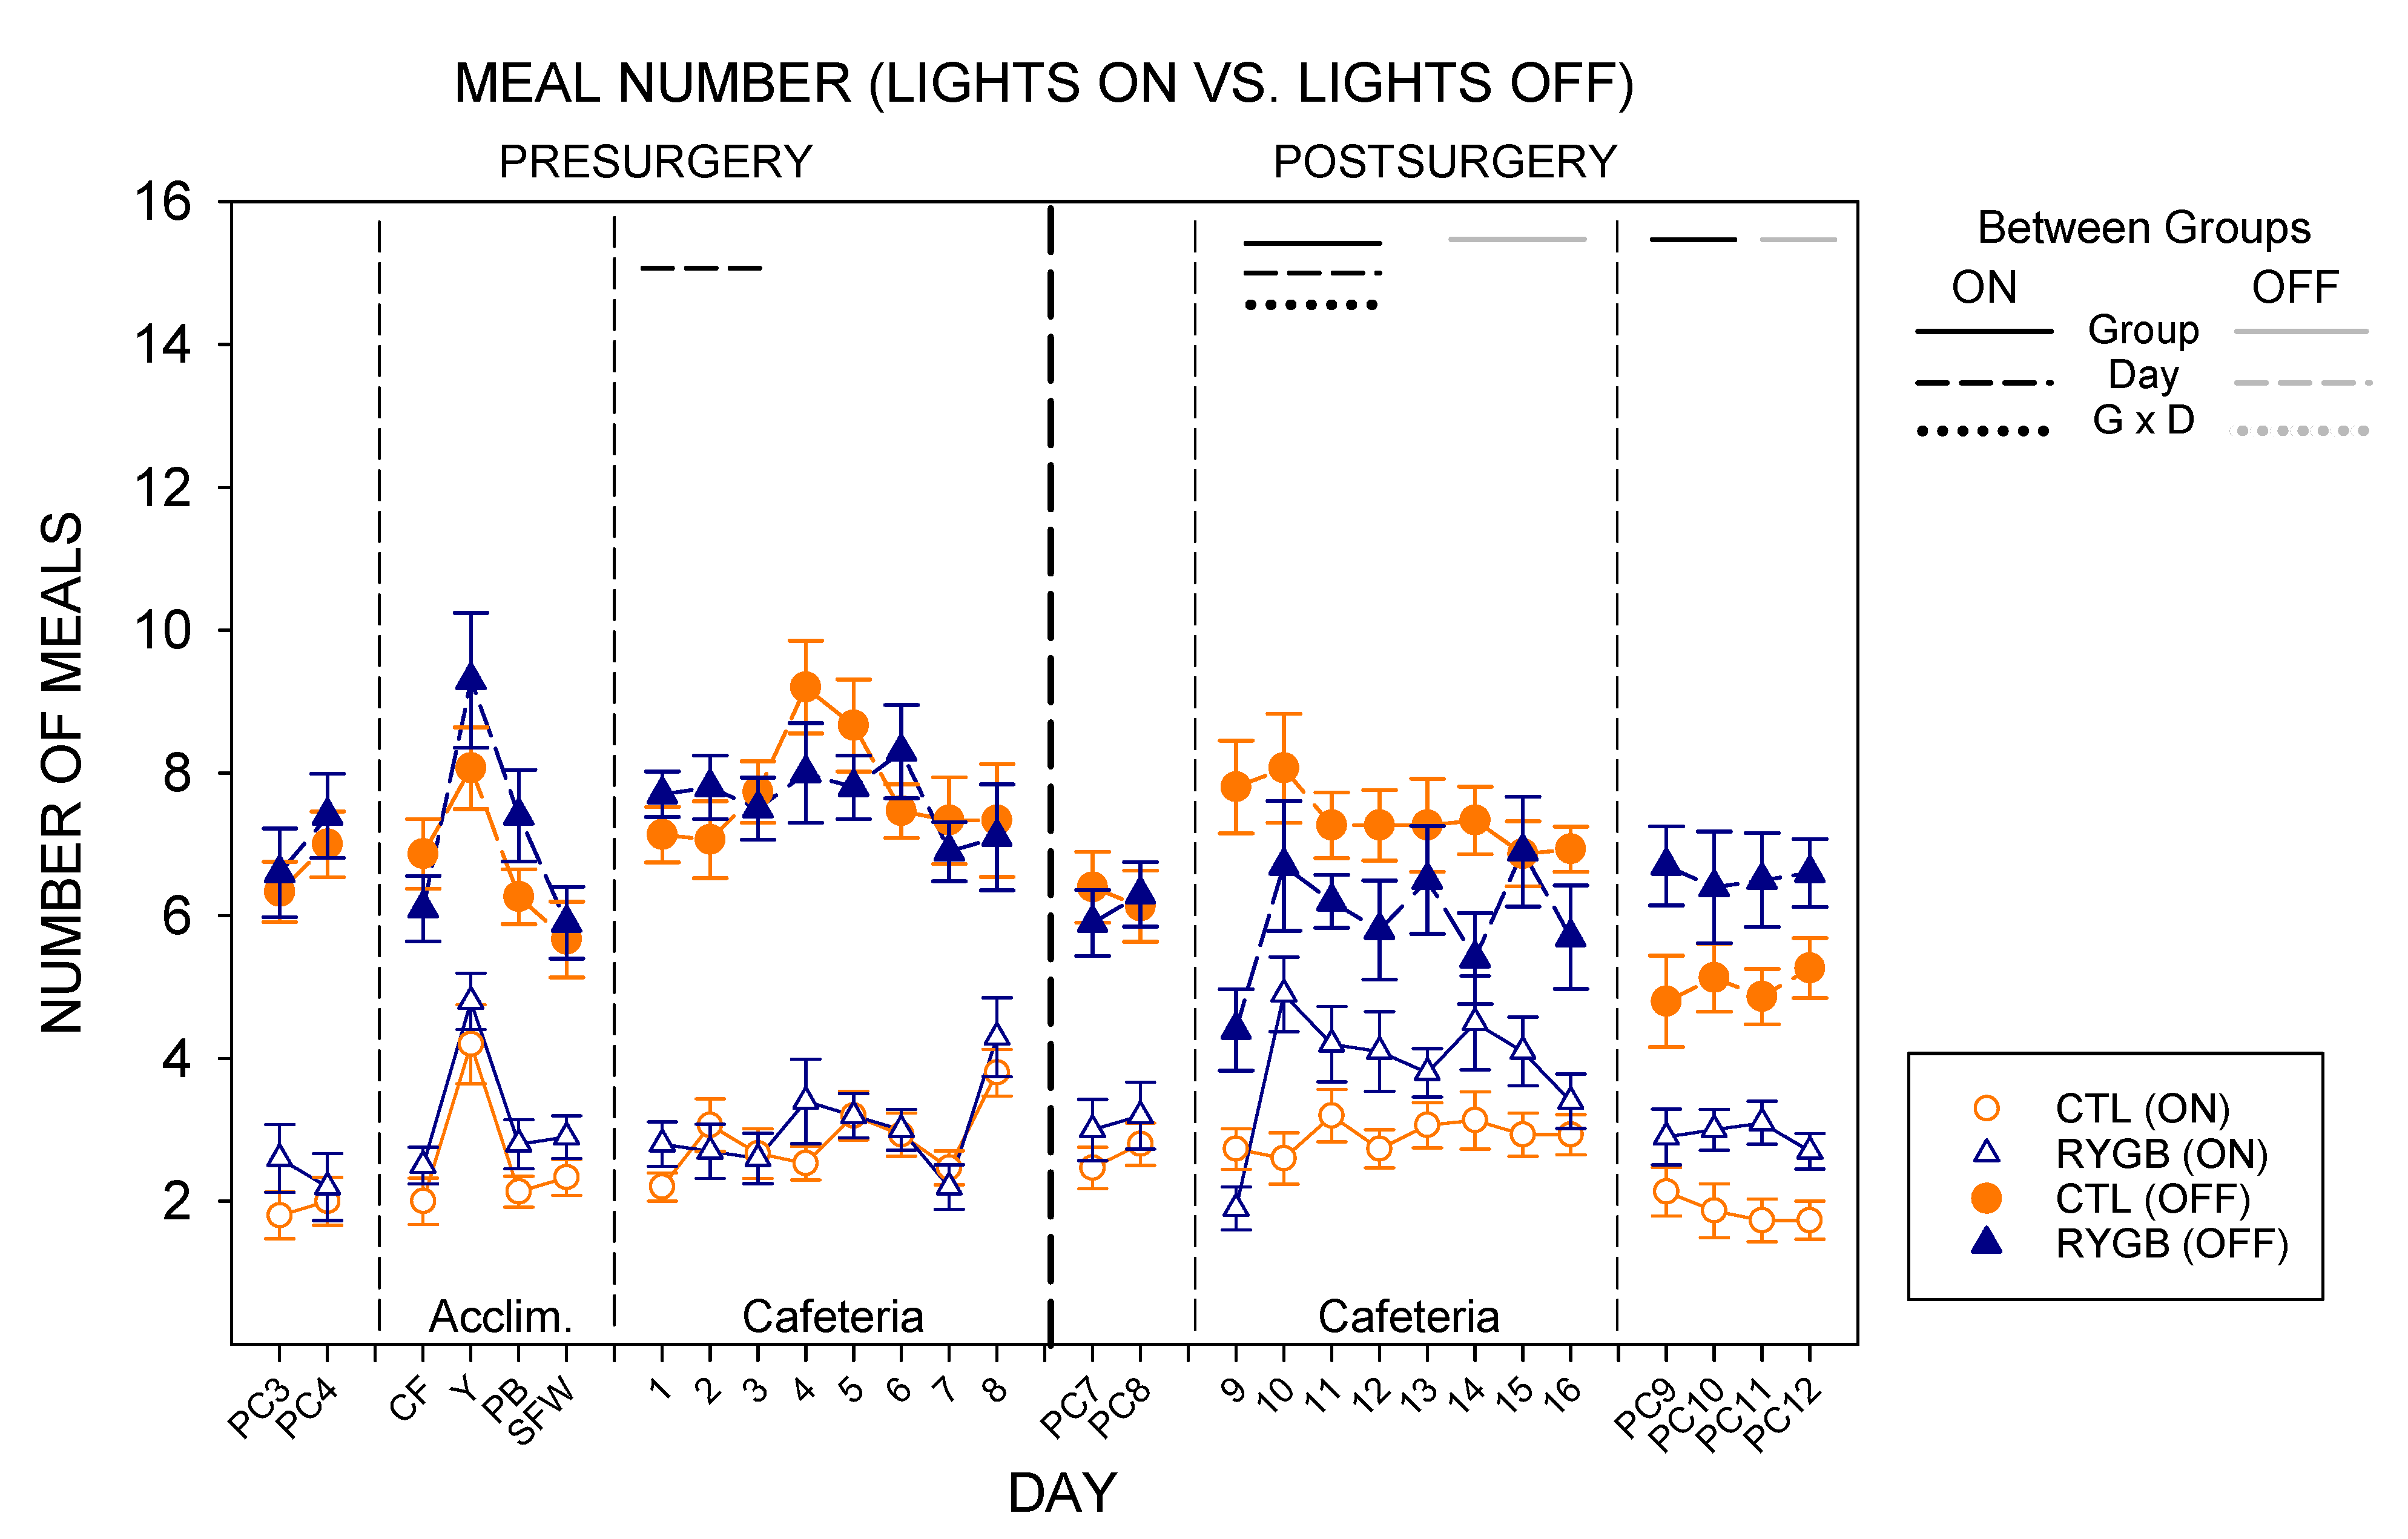
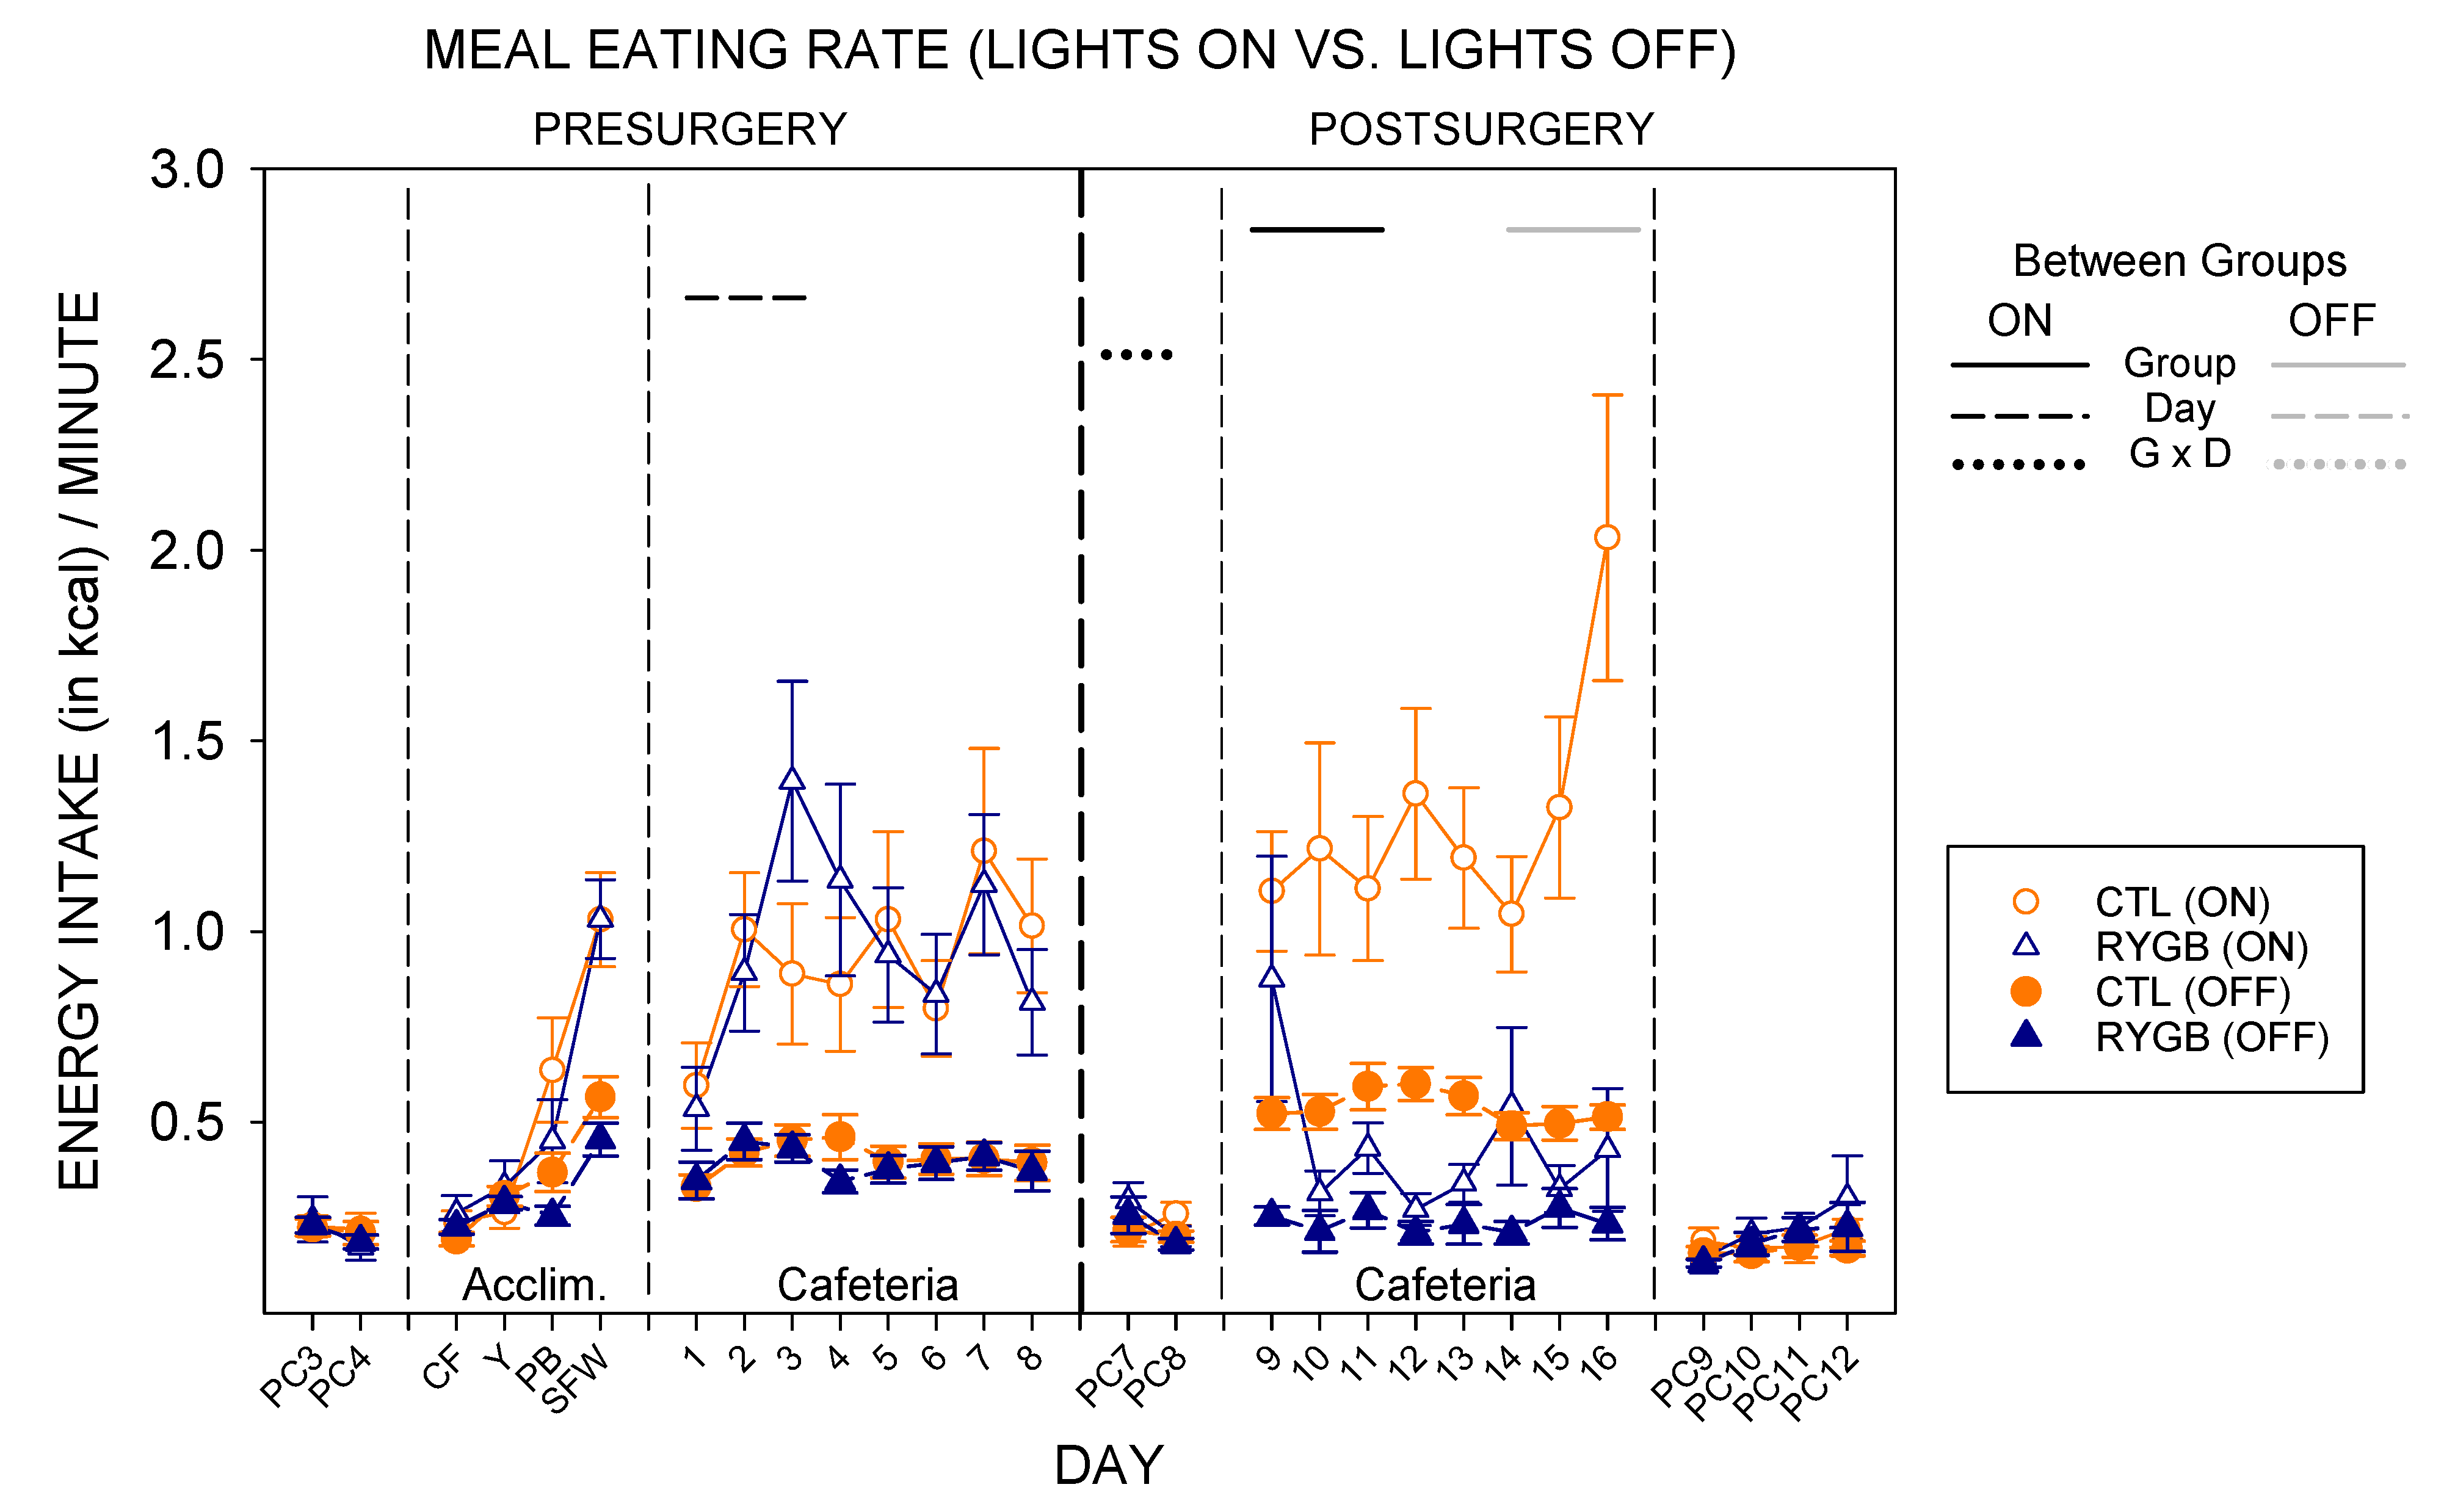
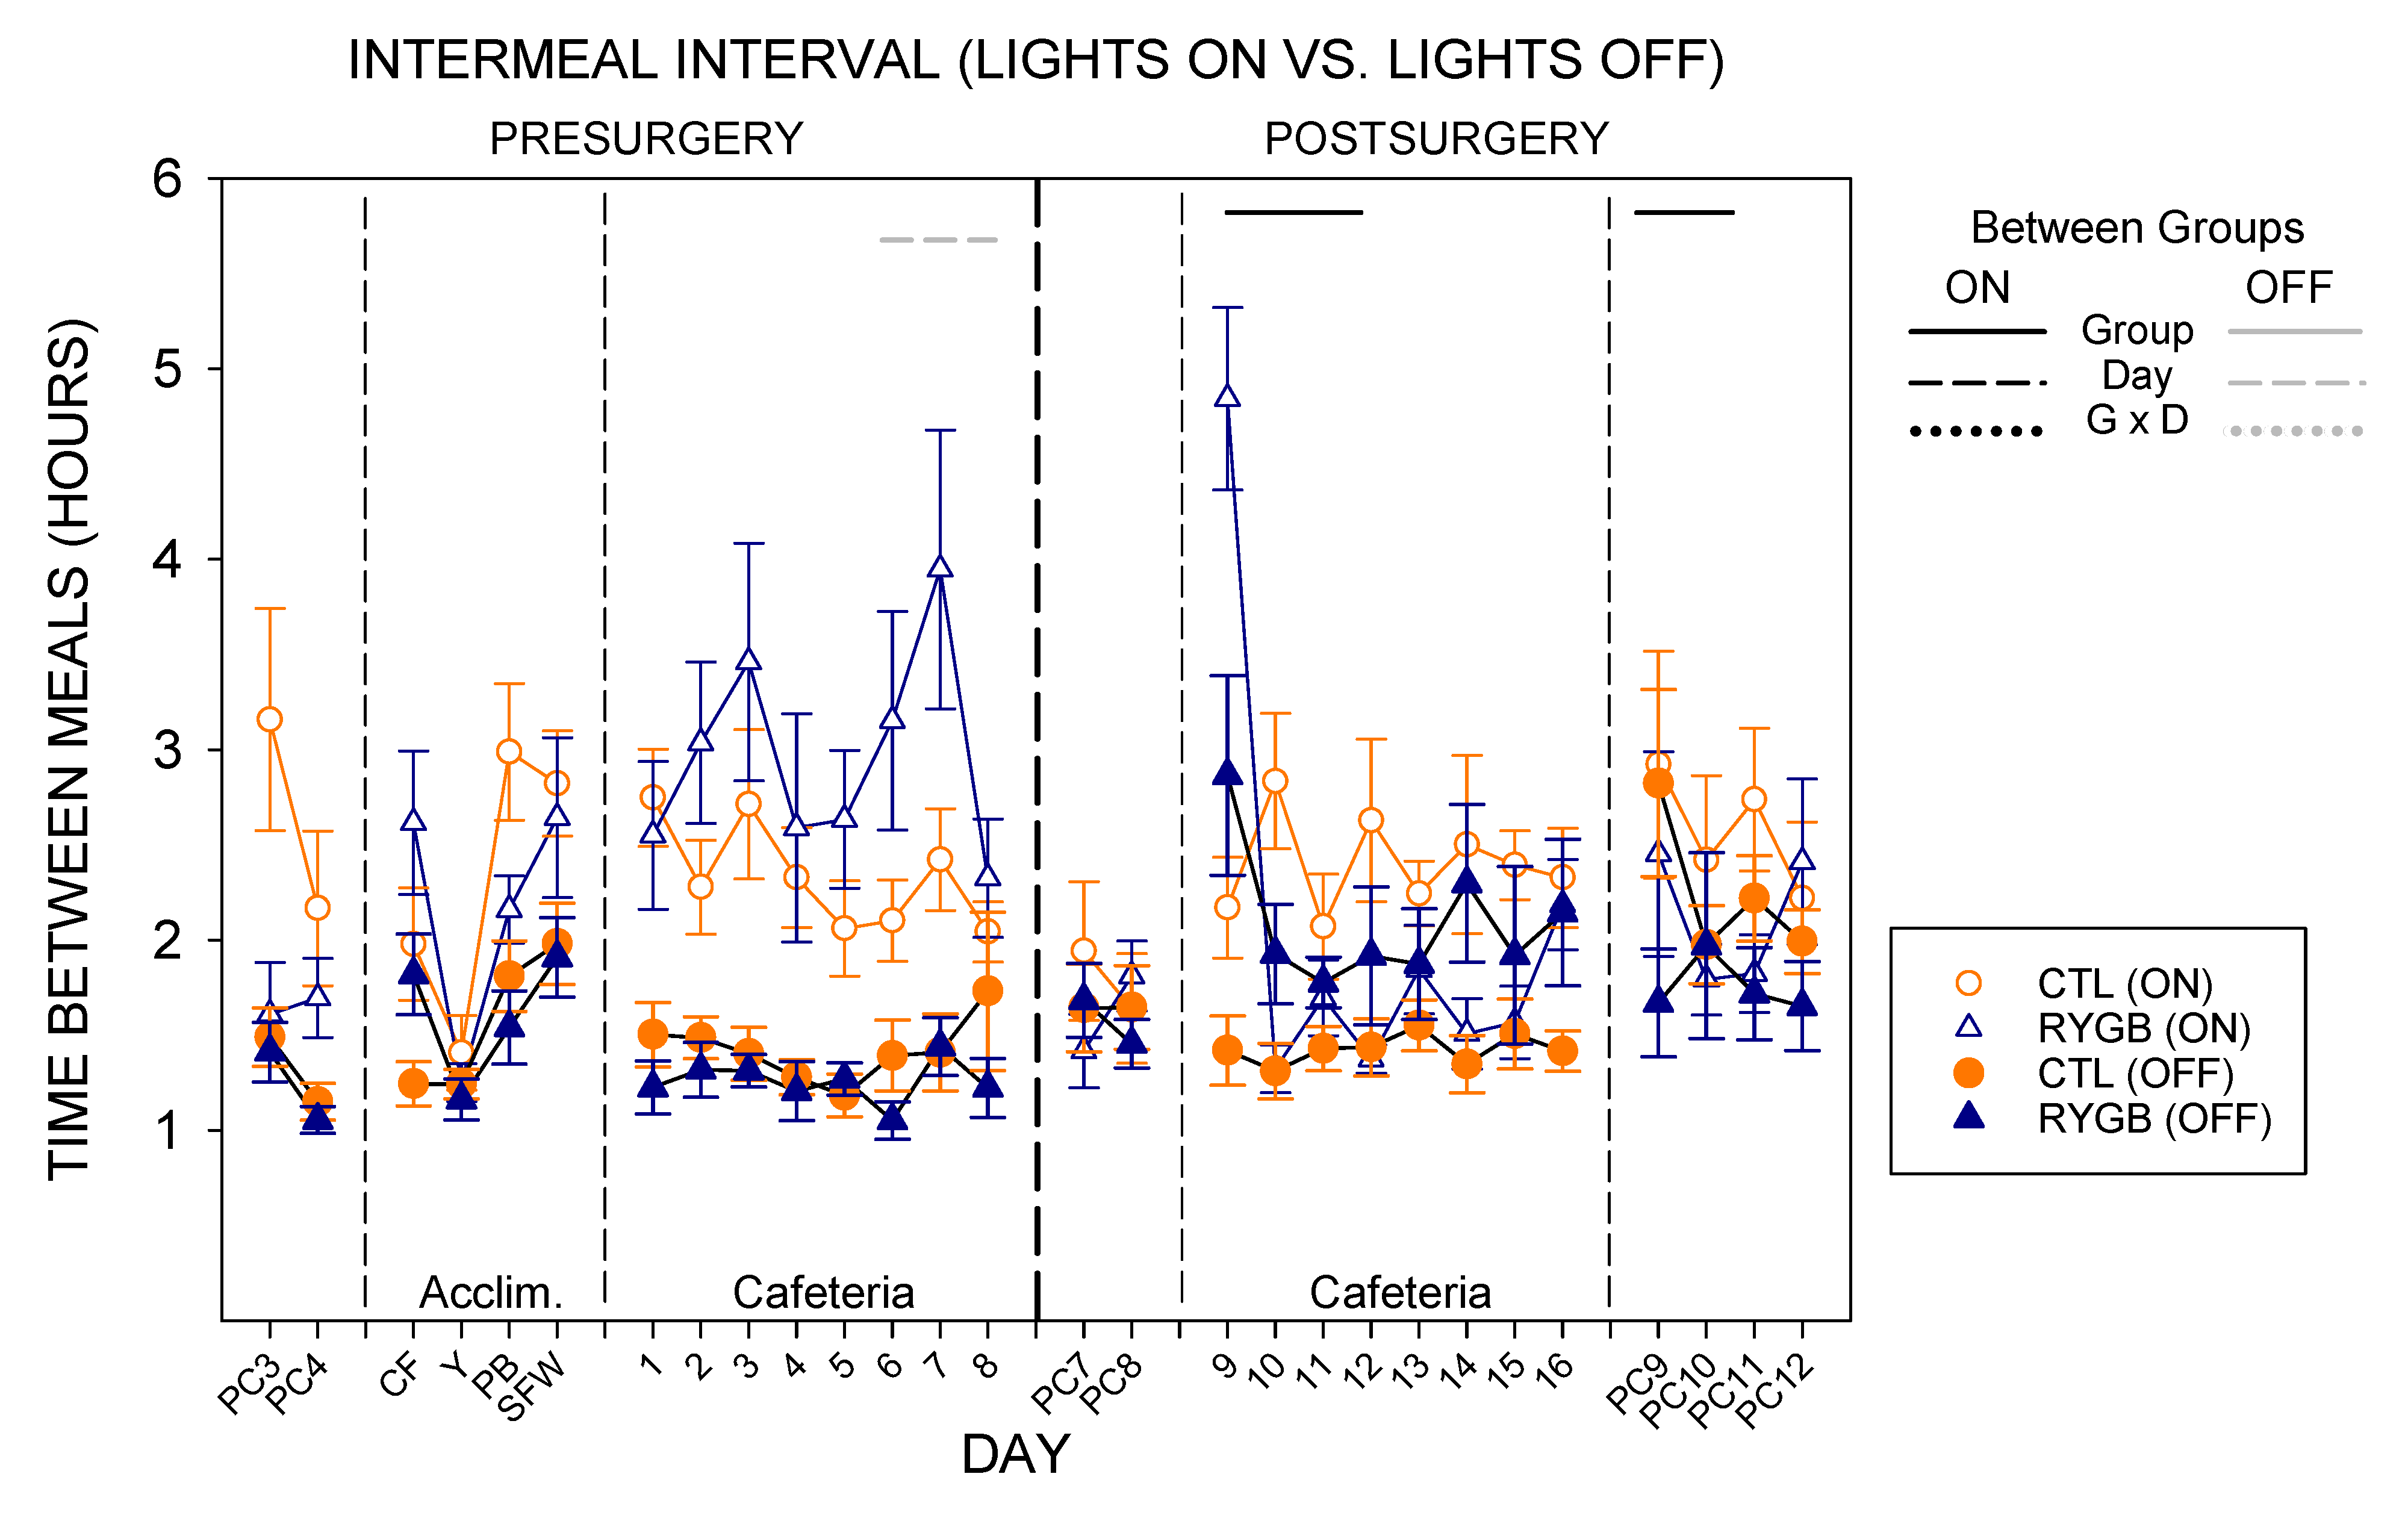
3.3. Nycthemeral Patterns of Intake
3.4. Drinking Behavior
3.5. Estrous Cycle
3.6. Other Physiological Measures
4. Discussion
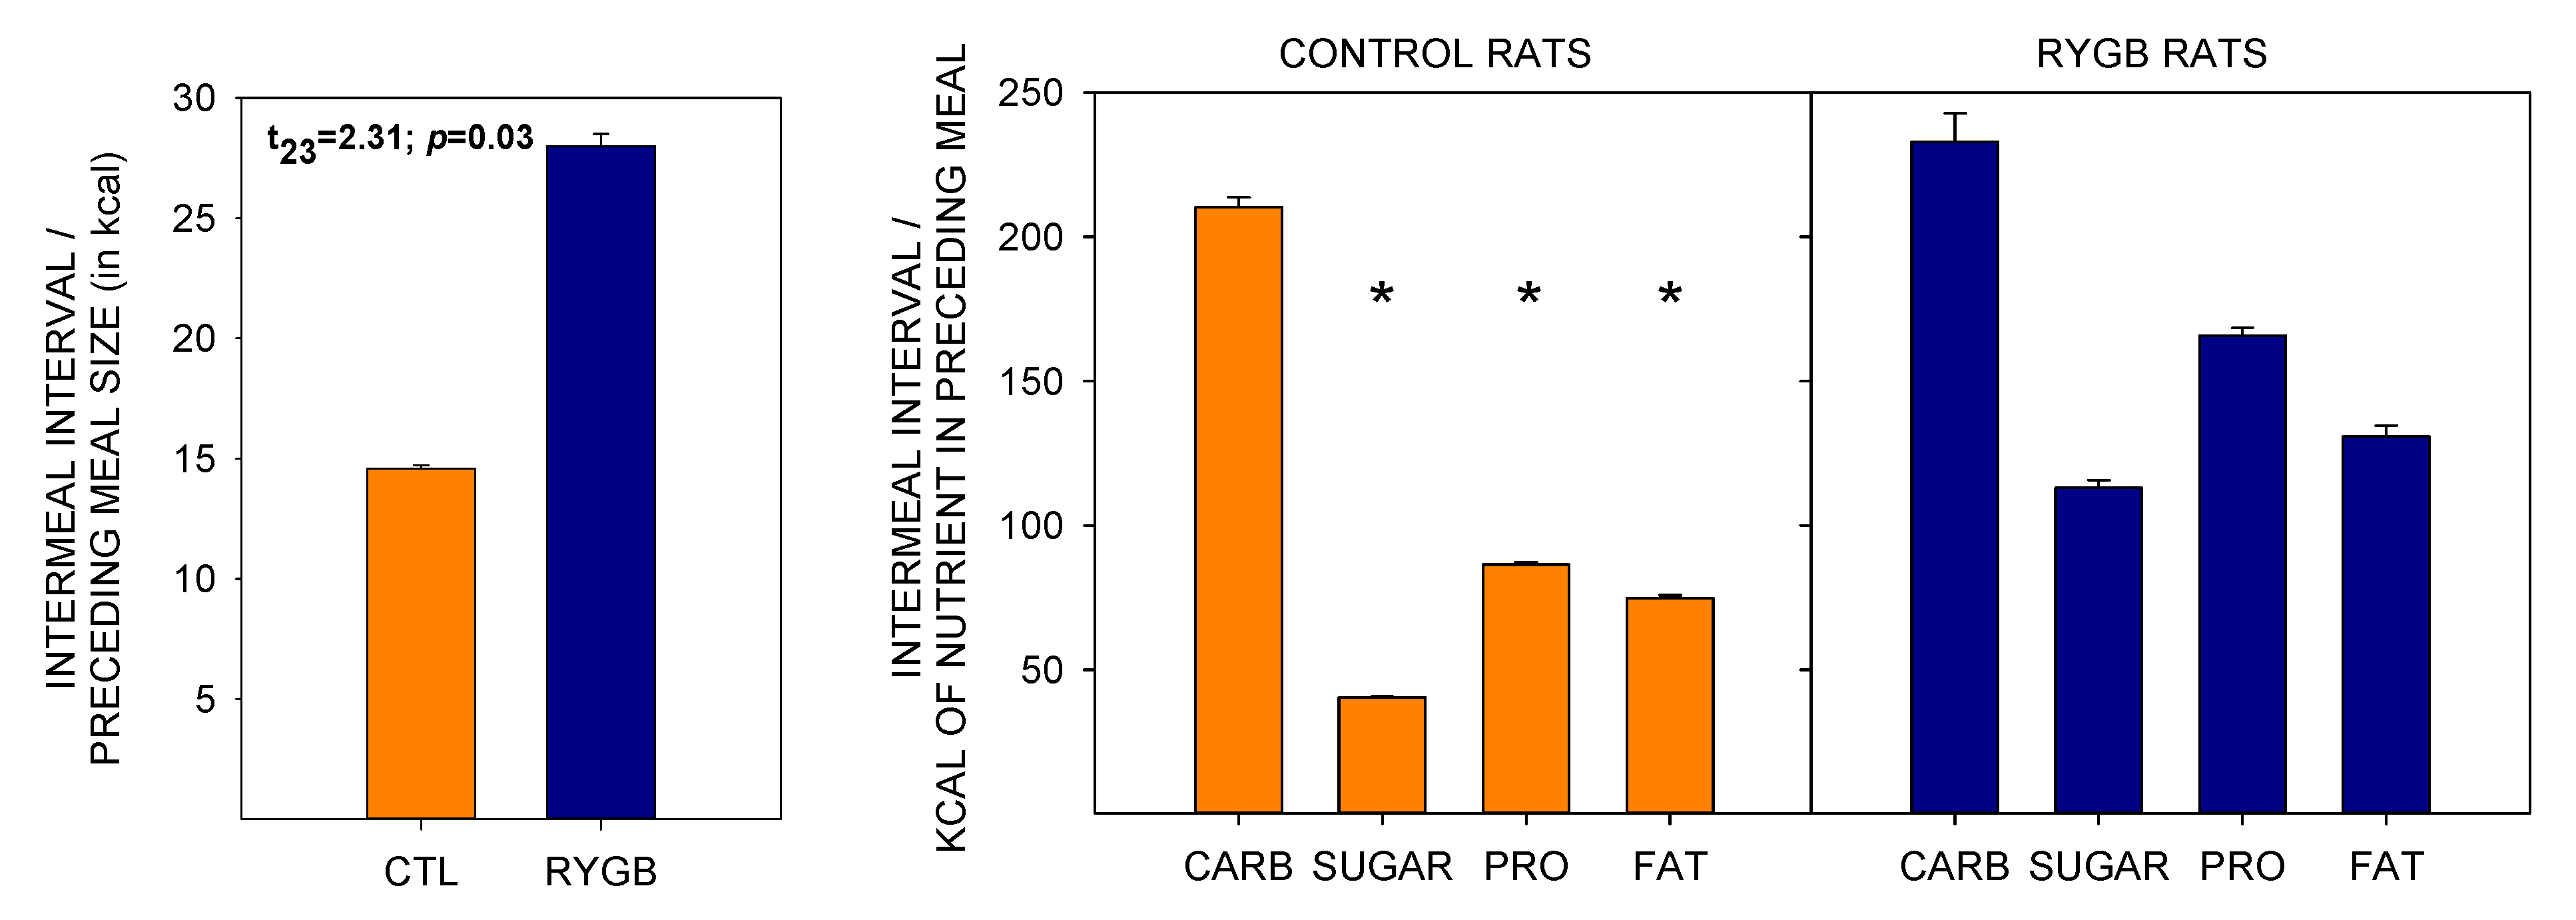
4.1. Roux-en-Y Gastric Bypass Changes Meal Patterns Primarily by Reducing the Size of Meals
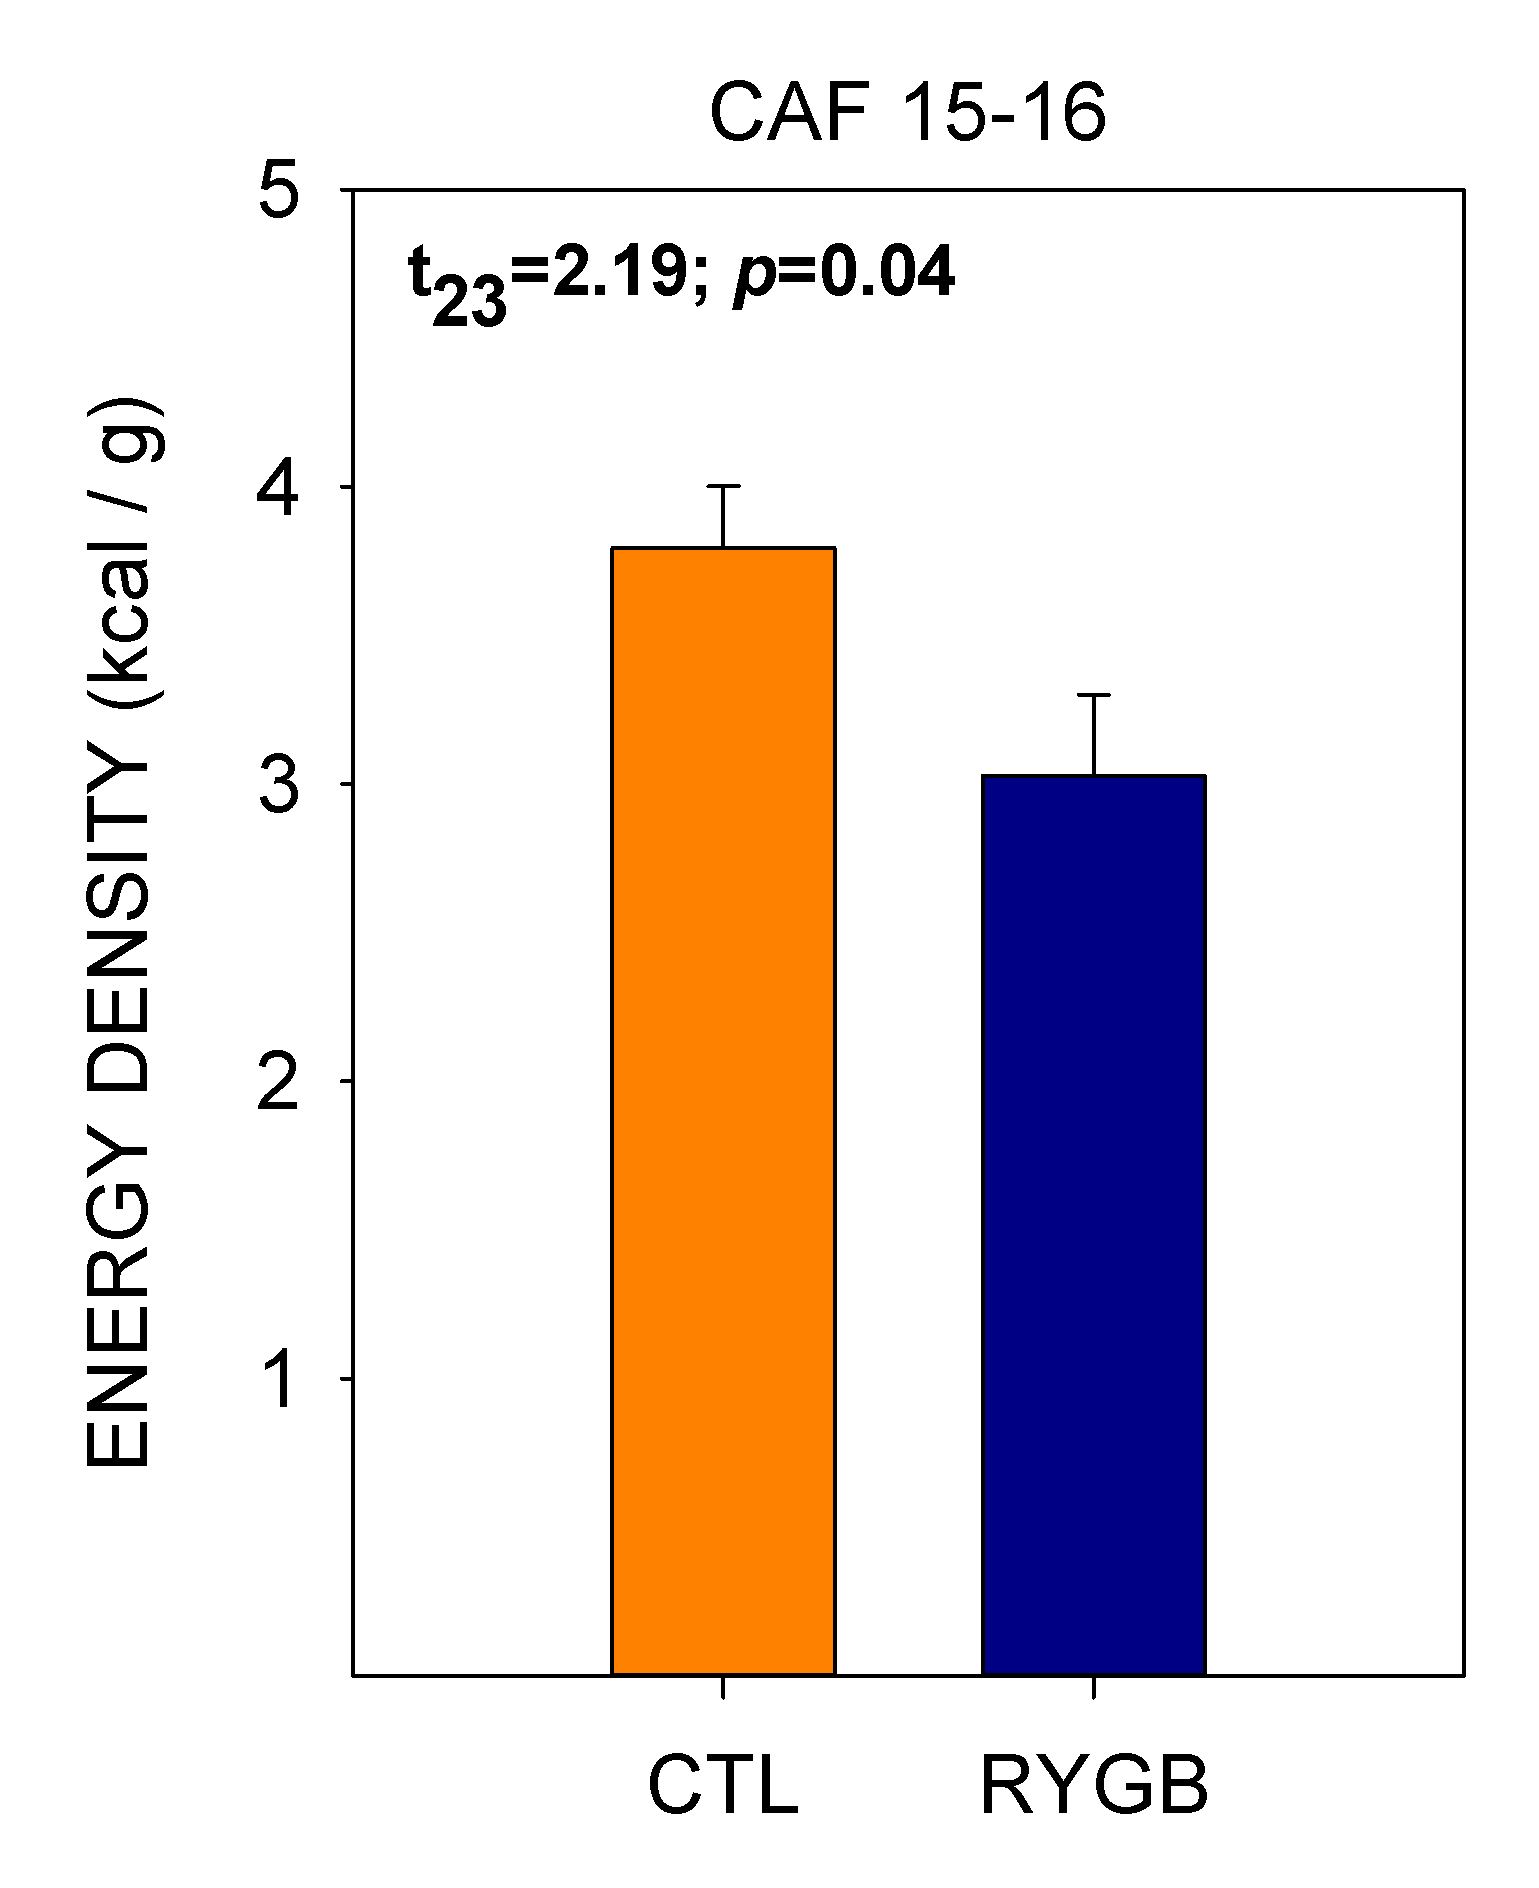
4.2. While Meal Patterns Changed Quickly, the Changes in Food Choices Occur More Slowly across Several Days
4.3. Despite Decreasing Their Relative Fat Intake, RYGB Rats Were Still Motivated to Consume a Large Portion of Energy from Fat and Sugar
4.4. Study Limitations
4.5. Concluding Remarks
Supplementary Materials
Author Contributions
Funding
Institutional Review Board Statement
Informed Consent Statement
Data Availability Statement
Acknowledgments
Conflicts of Interest
References
- Buchwald, H.; Avidor, Y.; Braunwald, E. Bariatric surgery. A systematic review and meta-analysis. ACC Curr. J. Rev. 2005, 14, 13. [Google Scholar] [CrossRef]
- Buchwald, H.; Estok, R.; Fahrbach, K.; Banel, D.; Jensen, M.D.; Pories, W.J.; Bantle, J.P.; Sledge, I. Weight and Type 2 Diabetes after Bariatric Surgery: Systematic Review and Meta-analysis. Am. J. Med. 2009, 122, 248–256.e5. [Google Scholar] [CrossRef]
- Batterham, R.L.; Cummings, D.E. Mechanisms of Diabetes Improvement Following Bariatric/Metabolic Surgery. Diabetes Care 2016, 39, 893–901. [Google Scholar] [CrossRef] [PubMed] [Green Version]
- Sjöström, L.; Lindroos, A.-K.; Peltonen, M.; Torgerson, J.; Bouchard, C.; Carlsson, B.; Dahlgren, S.; Larsson, B.; Narbro, K.; Sjöström, C.D.; et al. Lifestyle, Diabetes, and Cardiovascular Risk Factors 10 Years after Bariatric Surgery. N. Engl. J. Med. 2004, 351, 2683–2693. [Google Scholar] [CrossRef]
- Adams, T.D.; Gress, R.E.; Smith, S.C.; Halverson, R.C.; Simper, S.C.; Rosamond, W.D.; LaMonte, M.J.; Stroup, A.M.; Hunt, S.C. Long-Term Mortality after Gastric Bypass Surgery. N. Engl. J. Med. 2007, 357, 753–761. [Google Scholar] [CrossRef] [PubMed] [Green Version]
- Schauer, P.R.; Burguera, B.; Ikramuddin, S.; Cottam, D.; Gourash, W.; Hamad, G.; Eid, G.M.; Mattar, S.; Ramanathan, R.; Barinas-Mitchel, E.; et al. Effect of Laparoscopic Roux-En Y Gastric Bypass on Type 2 Diabetes Mellitus. Ann. Surg. 2003, 238, 467–485. [Google Scholar] [CrossRef]
- Werling, M.; Fändriks, L.; Björklund, P.; Maleckas, A.; Brandberg, J.; Lönroth, H.; Le Roux, C.; Olbers, T. Long-term results of a randomized clinical trial comparing Roux-en-Y gastric bypass with vertical banded gastroplasty. BJS 2012, 100, 222–230. [Google Scholar] [CrossRef] [PubMed]
- Batsis, J.A.; Romero-Corral, A.; Collazo-Clavell, M.L.; Sarr, M.G.; Somers, V.K.; Lopez-Jimenez, F. Effect of Bariatric Surgery on the Metabolic Syndrome: A Population-Based, Long-term Controlled Study. Mayo Clin. Proc. 2008, 83, 897–906. [Google Scholar] [CrossRef]
- Mosinski, J.D.; Kirwan, J.P. Longer-Term Physiological and Metabolic Effects of Gastric Bypass Surgery. Curr. Diabetes Rep. 2016, 16, 50. [Google Scholar] [CrossRef] [Green Version]
- Bojsen-Møller, K.N. Mechanisms of improved glycaemic control after Roux-en-Y gastric bypass. Dan. Med. J. 2015, 62, B5057. [Google Scholar]
- Bower, G.; Toma, T.; Harling, L.; Jiao, L.R.; Efthimiou, E.; Darzi, A.; Athanasiou, T.; Ashrafian, H. Bariatric Surgery and Non-Alcoholic Fatty Liver Disease: A Systematic Review of Liver Biochemistry and Histology. Obes. Surg. 2015, 25, 2280–2289. [Google Scholar] [CrossRef] [PubMed]
- Laurenius, A.; Larsson, I.; Melanson, K.J.; Lindroos, A.K.; Lönroth, H.; Bosaeus, I.; Olbers, T. Decreased energy density and changes in food selection following Roux-en-Y gastric bypass. Eur. J. Clin. Nutr. 2013, 67, 168–173. [Google Scholar] [CrossRef]
- Berthoud, H.-R.; Lenard, N.R.; Shin, A.C. Food reward, hyperphagia, and obesity. Am. J. Physiol. Integr. Comp. Physiol. 2011, 300, R1266–R1277. [Google Scholar] [CrossRef] [PubMed] [Green Version]
- Zoon, H.; De Bruijn, S.; Jager, G.; Smeets, P.; De Graaf, C.; Janssen, I.; Schijns, W.; Deden, L.; Boesveldt, S. Altered neural inhibition responses to food cues after Roux-en-Y Gastric Bypass. Biol. Psychol. 2018, 137, 34–41. [Google Scholar] [CrossRef] [Green Version]
- Pournaras, D.J.; Le Roux, C.W. Obesity, Gut Hormones, and Bariatric Surgery. World J. Surg. 2009, 33, 1983–1988. [Google Scholar] [CrossRef] [PubMed]
- Schultes, B.; Ernst, B.; Wilms, B.; Thurnheer, M.; Hallschmid, M. Hedonic hunger is increased in severely obese patients and is reduced after gastric bypass surgery. Am. J. Clin. Nutr. 2010, 92, 277–283. [Google Scholar] [CrossRef] [PubMed] [Green Version]
- Ullrich, J.; Ernst, B.; Wilms, B.; Thurnheer, M.; Schultes, B. Roux-en Y Gastric Bypass Surgery Reduces Hedonic Hunger and Improves Dietary Habits in Severely Obese Subjects. Obes. Surg. 2012, 23, 50–55. [Google Scholar] [CrossRef]
- Le Roux, C.W.; Bueter, M.; Theis, N.; Werling, M.; Ashrafian, H.; Löwenstein, C.; Athanasiou, T.; Bloom, S.R.; Spector, A.C.; Olbers, T.; et al. Gastric bypass reduces fat intake and preference. Am. J. Physiol. Integr. Comp. Physiol. 2011, 301, R1057–R1066. [Google Scholar] [CrossRef] [Green Version]
- Kenler, H.A.; Brolin, R.E.; Cody, R.P. Changes in eating behavior after horizontal gastroplasty and Roux-en-Y gastric bypass. Am. J. Clin. Nutr. 1990, 52, 87–92. [Google Scholar] [CrossRef] [PubMed]
- Olbers, T.; Björkman, S.; Lindroos, A.; Maleckas, A.; Lönn, L.; Sjöström, L.; Lönroth, H. Body Composition, Dietary Intake, and Energy Expenditure After Laparoscopic Roux-en-Y Gastric Bypass and Laparoscopic Vertical Banded Gastroplasty. Ann. Surg. 2006, 244, 715–722. [Google Scholar] [CrossRef]
- Nielsen, M.S.; Christensen, B.J.; Ritz, C.; Holm, L.; Lunn, S.; Tækker, L.; Schmidt, J.B.; Bredie, W.L.P.; Albrechtsen, N.J.W.; Holst, J.J.; et al. Factors Associated with Favorable Changes in Food Preferences After Bariatric Surgery. Obes. Surg. 2021, 31, 3514–3524. [Google Scholar] [CrossRef]
- Van Vuuren, M.A.J.; Strodl, E.; White, K.; Lockie, P.D. Taste, Enjoyment, and Desire of Flavors Change After Sleeve Gastrectomy-Short Term Results. Obes. Surg. 2016, 27, 1466–1473. [Google Scholar] [CrossRef] [PubMed] [Green Version]
- Stubbs, R.J.; O’Reilly, L.M.; Whybrow, S.; Fuller, Z.; Johnstone, A.; Livingstone, M.B.E.; Ritz, P.; Horgan, G.W. Measuring the difference between actual and reported food intakes in the context of energy balance under laboratory conditions. Br. J. Nutr. 2014, 111, 2032–2043. [Google Scholar] [CrossRef] [PubMed] [Green Version]
- Livingstone, M.B. Assessment of food intakes: Are we measuring what people eat? Br. J. Biomed. Sci. 1995, 52, 58–67. [Google Scholar]
- Livingstone, M.B.E.; Black, A.E. Markers of the Validity of Reported Energy Intake. J. Nutr. 2003, 133, 895S–920S. [Google Scholar] [CrossRef]
- Nielsen, M.S.; Christensen, B.J.; Ritz, C.; Rasmussen, S.; Hansen, T.T.; Bredie, W.L.P.; le Roux, C.W.; Sjödin, A.; Schmidt, J.B. Roux-En-Y Gastric Bypass and Sleeve Gastrectomy Does Not Affect Food Preferences When Assessed by an Ad libitum Buffet Meal. Obes. Surg. 2017, 27, 2599–2605. [Google Scholar] [CrossRef] [PubMed]
- Pepino, M.Y.; Bradley, D.; Eagon, J.C.; Sullivan, S.; Abumrad, N.A.; Klein, S. Changes in taste perception and eating behavior after bariatric surgery-induced weight loss in women. Obesity 2013, 22, E13–E20. [Google Scholar] [CrossRef] [PubMed]
- Kapoor, N.; Al-Najim, W.; Le Roux, C.W.; Docherty, N.G. Shifts in Food Preferences After Bariatric Surgery: Observational Reports and Proposed Mechanisms. Curr. Obes. Rep. 2017, 6, 246–252. [Google Scholar] [CrossRef]
- Mathes, C.M.; Spector, A.C. Food selection and taste changes in humans after Roux-en-Y gastric bypass surgery: A direct-measures approach. Physiol. Behav. 2012, 107, 476–483. [Google Scholar] [CrossRef]
- Williams, D.L.; Baskin, D.G.; Schwartz, M.W. Evidence that Intestinal Glucagon-Like Peptide-1 Plays a Physiological Role in Satiety. Endocrinology 2008, 150, 1680–1687. [Google Scholar] [CrossRef]
- Gibbs, J.; Young, R.C.; Smith, G.P. Cholecystokinin decreases food intake in rats. J. Comp. Physiol. Psychol. 1973, 84, 488–495. [Google Scholar] [CrossRef] [PubMed]
- Stadlbauer, U.; Arnold, M.; Weber, E.; Langhans, W. Possible Mechanisms of Circulating PYY-Induced Satiation in Male Rats. Endocrinology 2013, 154, 193–204. [Google Scholar] [CrossRef] [PubMed] [Green Version]
- Abdeen, G.; Le Roux, C.W. Mechanism Underlying the Weight Loss and Complications of Roux-en-Y Gastric Bypass. Review. Obes. Surg. 2015, 26, 410–421. [Google Scholar] [CrossRef] [Green Version]
- Bunt, J.C.; Blackstone, R.; Thearle, M.S.; Vinales, K.L.; Votruba, S.; Krakoff, J. Changes in glycemia, insulin and gut hormone responses to a slowly ingested solid low-carbohydrate mixed meal after laparoscopic gastric bypass or band surgery. Int. J. Obes. 2017, 41, 706–713. [Google Scholar] [CrossRef]
- Steinert, R.E.; Feinle-Bisset, C.; Asarian, L.; Horowitz, M.; Beglinger, C.; Geary, N. Ghrelin, CCK, GLP-1, and PYY(3–36): Secretory Controls and Physiological Roles in Eating and Glycemia in Health, Obesity, and After RYGB. Physiol. Rev. 2017, 97, 411–463. [Google Scholar] [CrossRef] [Green Version]
- Zakeri, R.; Batterham, R.L. Potential mechanisms underlying the effect of bariatric surgery on eating behaviour. Curr. Opin. Endocrinol. Diabetes Obes. 2018, 25, 3–11. [Google Scholar] [CrossRef] [PubMed]
- Odstrcil, E.A.; Martinez, J.G.; Ana, C.A.S.; Xue, B.; Schneider, R.E.; Steffer, K.J.; Porter, J.L.; Asplin, J.; Kuhn, J.A.; Fordtran, J.S. The contribution of malabsorption to the reduction in net energy absorption after long-limb Roux-en-Y gastric bypass. Am. J. Clin. Nutr. 2010, 92, 704–713. [Google Scholar] [CrossRef] [PubMed] [Green Version]
- Pournaras, D.J.; Glicksman, C.; Vincent, R.; Kuganolipava, S.; Alaghband-Zadeh, J.; Mahon, D.; Bekker, J.H.; Ghatei, M.A.; Bloom, S.R.; Walters, J.; et al. The Role of Bile after Roux-en-Y Gastric Bypass in Promoting Weight Loss and Improving Glycaemic Control. Endocrinology 2012, 153, 3613–3619. [Google Scholar] [CrossRef] [Green Version]
- Vaughn, A.C.; Cooper, E.M.; DiLorenzo, P.M.; O’Loughlin, L.J.; Konkel, M.E.; Peters, J.H.; Hajnal, A.; Sen, T.; Lee, S.; De La Serre, C.B.; et al. Energy-dense diet triggers changes in gut microbiota, reorganization of gut-brain vagal communication and increases body fat accumulation. Acta Neurobiol. Exp. 2017, 77, 18–30. [Google Scholar] [CrossRef] [Green Version]
- Sánchez-Alcoholado, L.; Gutiérrez-Repiso, C.; Gómez-Pérez, A.M.; García-Fuentes, E.; Tinahones, F.J.; Moreno-Indias, I. Gut microbiota adaptation after weight loss by Roux-en-Y gastric bypass or sleeve gastrectomy bariatric surgeries. Surg. Obes. Relat. Dis. 2019, 15, 1888–1895. [Google Scholar] [CrossRef] [PubMed]
- Mahawar, K.K.; Sharples, A.J. Contribution of Malabsorption to Weight Loss After Roux-en-Y Gastric Bypass: A Systematic Review. Obes. Surg. 2017, 27, 2194–2206. [Google Scholar] [CrossRef] [PubMed]
- Laferrère, B.; Pattou, F. Weight-Independent Mechanisms of Glucose Control After Roux-en-Y Gastric Bypass. Front. Endocrinol. 2018, 9, 1–9. [Google Scholar] [CrossRef]
- Wang, W.; Cheng, Z.; Wang, Y.; Dai, Y.; Zhang, X.; Hu, S. Role of Bile Acids in Bariatric Surgery. Front. Physiol. 2019, 10, 374. [Google Scholar] [CrossRef]
- Le Roux, C.; Welbourn, R.; Werling, M.; Osborne, A.; Kokkinos, A.; Laurenius, A.; Lönroth, H.; Fändriks, L.; Ghatei, M.A.; Bloom, S.R.; et al. Gut Hormones as Mediators of Appetite and Weight Loss After Roux-en-Y Gastric Bypass. Ann. Surg. 2007, 246, 780–785. [Google Scholar] [CrossRef] [PubMed]
- Mulla, C.M.; Middelbeek, R.J.; Patti, M.-E. Mechanisms of weight loss and improved metabolism following bariatric surgery. Ann. N. Y. Acad. Sci. 2017, 1411, 53–64. [Google Scholar] [CrossRef] [PubMed]
- Yousseif, A.; Emmanuel, J.; Karra, E.; Millet, Q.; ElKalaawy, M.; Jenkinson, A.D.; Hashemi, M.; Adamo, M.; Finer, N.; Fiennes, A.G.; et al. Differential Effects of Laparoscopic Sleeve Gastrectomy and Laparoscopic Gastric Bypass on Appetite, Circulating Acyl-ghrelin, Peptide YY3-36 and Active GLP-1 Levels in Non-diabetic Humans. Obes. Surg. 2013, 24, 241–252. [Google Scholar] [CrossRef] [PubMed] [Green Version]
- Liou, A.P.; Paziuk, M.; Luevano, J.-M.; Machineni, S.; Turnbaugh, P.J.; Kaplan, L.M. Conserved Shifts in the Gut Microbiota Due to Gastric Bypass Reduce Host Weight and Adiposity. Sci. Transl. Med. 2013, 5, 178ra41. [Google Scholar] [CrossRef] [Green Version]
- Osto, M.; Abegg, K.; Bueter, M.; le Roux, C.W.; Cani, P.D.; Lutz, T.A. Roux-en-Y gastric bypass surgery in rats alters gut microbiota profile along the intestine. Physiol. Behav. 2013, 119, 92–96. [Google Scholar] [CrossRef] [Green Version]
- Browning, K.N.; Fortna, S.R.; Hajnal, A. Roux-en-Y gastric bypass reverses the effects of diet-induced obesity to inhibit the responsiveness of central vagal motoneurones. J. Physiol. 2013, 591, 2357–2372. [Google Scholar] [CrossRef]
- Dagan, S.S.; Keidar, A.; Raziel, A.; Sakran, N.; Goitein, D.; Shibolet, O.; Zelber-Sagi, S. Do Bariatric Patients Follow Dietary and Lifestyle Recommendations during the First Postoperative Year? Obes. Surg. 2017, 27, 2258–2271. [Google Scholar] [CrossRef]
- Bueter, M.; Abegg, K.; Seyfried, F.; Lutz, T.A.; Le Roux, C.W. Roux-en-Y Gastric Bypass Operation in Rats. J. Vis. Exp. 2012, 64, e3940. [Google Scholar] [CrossRef] [PubMed] [Green Version]
- Saeidi, N.; Meoli, L.; Nestoridi, E.; Gupta, N.K.; Kvas, S.; Kucharczyk, J.; Bonab, A.A.; Fischman, A.J.; Yarmush, M.L.; Stylopoulos, N. Reprogramming of Intestinal Glucose Metabolism and Glycemic Control in Rats After Gastric Bypass. Science 2013, 341, 406–410. [Google Scholar] [CrossRef] [PubMed] [Green Version]
- Shin, A.C.; Zheng, H.; Townsend, R.L.; Sigalet, D.L.; Berthoud, H.-R. Meal-Induced Hormone Responses in a Rat Model of Roux-en-Y Gastric Bypass Surgery. Endocrinology 2010, 151, 1588–1597. [Google Scholar] [CrossRef] [Green Version]
- Seyfried, F.; Le Roux, C.W.; Bueter, M. Lessons Learned from Gastric Bypass Operations in Rats. Obes. Facts 2011, 4, 3–12. [Google Scholar] [CrossRef] [PubMed] [Green Version]
- Bueter, M.; Miras, A.; Chichger, H.; Fenske, W.; Ghatei, M.; Bloom, S.; Unwin, R.; Lutz, T.; Spector, A.; le Roux, C. Alterations of sucrose preference after Roux-en-Y gastric bypass. Physiol. Behav. 2011, 104, 709–721. [Google Scholar] [CrossRef] [PubMed] [Green Version]
- Lutz, T.A.; Bueter, M. The Use of Rat and Mouse Models in Bariatric Surgery Experiments. Front. Nutr. 2016, 3, 25. [Google Scholar] [CrossRef] [Green Version]
- Chambers, A.P.; Jessen, L.; Ryan, K.; Sisley, S.; Wilson–Pérez, H.E.; Stefater, M.A.; Gaitonde, S.G.; Sorrell, J.E.; Toure, M.; Berger, J.; et al. Weight-Independent Changes in Blood Glucose Homeostasis After Gastric Bypass or Vertical Sleeve Gastrectomy in Rats. Gastroenterology 2011, 141, 950–958. [Google Scholar] [CrossRef] [PubMed] [Green Version]
- Fenske, W.K.; Bueter, M.; Miras, A.; Ghatei, M.A.; Bloom, S.R.; Le Roux, C. Exogenous peptide YY3-36 and Exendin-4 further decrease food intake, whereas octreotide increases food intake in rats after Roux-en-Y gastric bypass. Int. J. Obes. 2011, 36, 379–384. [Google Scholar] [CrossRef] [Green Version]
- Mathes, C.M.; Letourneau, C.; Blonde, G.D.; Le Roux, C.W.; Spector, A.C. Roux-en-Y gastric bypass in rats progressively decreases the proportion of fat calories selected from a palatable cafeteria diet. Am. J. Physiol. Integr. Comp. Physiol. 2016, 310, R952–R959. [Google Scholar] [CrossRef] [Green Version]
- Mathes, C.M.; Bohnenkamp, R.A.; Le Roux, C.; Spector, A.C. Reduced sweet and fatty fluid intake after Roux-en-Y gastric bypass in rats is dependent on experience without change in stimulus motivational potency. Am. J. Physiol. Integr. Comp. Physiol. 2015, 309, R864–R874. [Google Scholar] [CrossRef] [PubMed]
- Wilson-Pérez, H.E.; Chambers, A.P.; Sandoval, D.A.; Stefater, M.A.; Woods, S.C.; Benoit, S.C.; Seeley, R.J. The effect of vertical sleeve gastrectomy on food choice in rats. Int. J. Obes. 2012, 37, 288–295. [Google Scholar] [CrossRef] [PubMed] [Green Version]
- Laurenius, A.; Larsson, I.; Bueter, M.; Melanson, K.J.; Bosaeus, I.; Forslund, H.B.; Lönroth, H.; Fändriks, L.; Olbers, T. Changes in eating behaviour and meal pattern following Roux-en-Y gastric bypass. Int. J. Obes. 2011, 36, 348–355. [Google Scholar] [CrossRef] [Green Version]
- Mathes, C.M.; Bohnenkamp, R.A.; Blonde, G.D.; Letourneau, C.; Corteville, C.; Bueter, M.; Lutz, T.A.; le Roux, C.W.; Spector, A.C. Gastric bypass in rats does not decrease appetitive behavior towards sweet or fatty fluids despite blunting preferential intake of sugar and fat. Physiol. Behav. 2015, 142, 179–188. [Google Scholar] [CrossRef] [PubMed] [Green Version]
- Hyde, K.M.; Blonde, G.D.; Bueter, M.; Le Roux, C.W.; Spector, A.C. Gastric bypass in female rats lowers concentrated sugar solution intake and preference without affecting brief-access licking after long-term sugar exposure. Am. J. Physiol. Integr. Comp. Physiol. 2020, 318, R870–R885. [Google Scholar] [CrossRef]
- Hajnal, A.; Kovacs, P.; Ahmed, T.; Meirelles, K.; Lynch, C.J.; Cooney, R.N. Gastric bypass surgery alters behavioral and neural taste functions for sweet taste in obese rats. Am. J. Physiol. Liver Physiol. 2010, 299, G967–G979. [Google Scholar] [CrossRef] [Green Version]
- Shin, A.C.; Zheng, H.; Pistell, P.J.; Berthoud, H.-R. Roux-en-Y gastric bypass surgery changes food reward in rats. Int. J. Obes. 2010, 35, 642–651. [Google Scholar] [CrossRef] [PubMed] [Green Version]
- Markison, S.; Thompson, B.L.; Smith, J.C.; Spector, A.C. Time course and pattern of compensatory ingestive behavioral adjustments to lysine deficiency in rats. J. Nutr. 2000, 130, 1320–1328. [Google Scholar] [CrossRef]
- Stricker, E.M.; Hoffmann, M.L.; Riccardi, C.J.; Smith, J.C. Increased water intake by rats maintained on high NaCl diet: Analysis of ingestive behavior. Physiol. Behav. 2003, 79, 621–631. [Google Scholar] [CrossRef]
- Bolles, R.C. Grooming behavior in the rat. J. Comp. Physiol. Psychol. 1960, 53, 306–310. [Google Scholar] [CrossRef] [PubMed]
- Kissileff, H.R. Free Feeding in normal and “recovered lateral” rats monitored by a pellet-detecting eatometer. Physiol. Behav. 1970, 5, 163–173. [Google Scholar] [CrossRef]
- Spector, A.C.; Smith, J.C. A detailed analysis of sucrose drinking in the rat. Physiol. Behav. 1984, 33, 127–136. [Google Scholar] [CrossRef]
- Castonguay, T.W.; Upton, D.E.; Leung, P.M.; Stern, J.S. Meal patterns in the genetically obese Zucker rat: A reexamination. Physiol. Behav. 1982, 28, 911–916. [Google Scholar] [CrossRef]
- Eckel, L.A. Spontaneous meal patterns in female rats with and without access to running wheels. Physiol. Behav. 2000, 70, 397–405. [Google Scholar] [CrossRef]
- Sanderson, J.D.; VanderWeele, D.A. Analysis of feeding patterns in normal and vagotomized rabbits. Physiol. Behav. 1975, 15, 357–364. [Google Scholar] [CrossRef]
- Donovan, M.J.; Paulino, G.; Raybould, H.E. CCK1 receptor is essential for normal meal patterning in mice fed high fat diet. Physiol. Behav. 2007, 92, 969–974. [Google Scholar] [CrossRef] [PubMed] [Green Version]
- Kersten, A.; Strubbe, J.H.; Spiteri, N.J. Meal patterning of rats with changes in day length and food availability. Physiol. Behav. 1980, 25, 953–958. [Google Scholar] [CrossRef]
- Zheng, H.; Shin, A.C.; Lenard, N.R.; Townsend, R.L.; Patterson, L.M.; Sigalet, D.L.; Berthoud, H.-R. Meal patterns, satiety, and food choice in a rat model of Roux-en-Y gastric bypass surgery. Am. J. Physiol. Integr. Comp. Physiol. 2009, 297, R1273–R1282. [Google Scholar] [CrossRef]
- Mumphrey, M.; Hao, Z.; Townsend, R.L.; Patterson, L.M.; Morrison, C.; Münzberg, H.; Stylopoulos, N.; Ye, J.; Berthoud, H.-R. Reversible hyperphagia and obesity in rats with gastric bypass by central MC3/4R blockade. Obesity 2014, 22, 1847–1853. [Google Scholar] [CrossRef]
- Furnes, M.W.; Tømmerås, K.; Arum, C.-J.; Zhao, C.-M.; Chen, D. Gastric Bypass Surgery Causes Body Weight Loss without Reducing Food Intake in Rats. Obes. Surg. 2008, 18, 415–422. [Google Scholar] [CrossRef] [PubMed]
- Xu, Y.; Ohinata, K.; Meguid, M.; Marx, W.; Tada, T.; Chen, C.; Quinn, R.; Inui, A. Gastric bypass model in the obese rat to study metabolic mechanisms of weight loss. J. Surg. Res. 2002, 107, 56–63. [Google Scholar] [CrossRef]
- Levitsky, D. Feeding patterns of rats in response to fasts and changes in environmental conditions. Physiol. Behav. 1970, 5, 291–300. [Google Scholar] [CrossRef]
- Melhorn, S.J.; Krause, E.; Scott, K.; Mooney, M.; Johnson, J.D.; Woods, S.C.; Sakai, R.R. Acute exposure to a high-fat diet alters meal patterns and body composition. Physiol. Behav. 2010, 99, 33–39. [Google Scholar] [CrossRef] [Green Version]
- Rogers, P.J. Returning ‘cafeteria-fed’ rats to a chow diet: Negative contrast and effects of obesity on feeding behaviour. Physiol. Behav. 1985, 35, 493–499. [Google Scholar] [CrossRef]
- Johnson, D.F.; Ackroff, K.; Peters, J.; Collier, G.H. Changes in rat’s meal patterns as a function of the caloric density of the diet. Physiol. Behav. 1986, 36, 929–936. [Google Scholar] [CrossRef]
- Lalanza, J.F.; Snoeren, E.M. The cafeteria diet: A standardized protocol and its effects on behavior. Neurosci. Biobehav. Rev. 2020, 122, 92–119. [Google Scholar] [CrossRef]
- Young, M.T.; Phelan, M.J.; Nguyen, N.T. A Decade Analysis of Trends and Outcomes of Male vs Female Patients Who Underwent Bariatric Surgery. J. Am. Coll. Surg. 2016, 222, 226–231. [Google Scholar] [CrossRef]
- Trus, T.L.; Pope, G.D.; Finlayson, S.R.G. National trends in utilization and outcomes of bariatric surgery. Surg. Endosc. 2005, 19, 616–620. [Google Scholar] [CrossRef]
- Pickering, C.; Alsiö, J.; Hulting, A.-L.; Schiöth, H.B. Withdrawal from free-choice high-fat high-sugar diet induces craving only in obesity-prone animals. Psychopharmacologia 2009, 204, 431–443. [Google Scholar] [CrossRef]
- Le Magnen, J. The metabolic basis of dual periodicity of feeding in rats. Behav. Brain Sci. 1981, 4, 561–575. [Google Scholar] [CrossRef]
- Siegel, P.S.; Stuckey, H.L. The diurnal course of water and food intake in the normal mature rat. J. Comp. Physiol. Psychol. 1947, 40, 365–370. [Google Scholar] [CrossRef]
- Enns, M.P.; Grinker, J.A. Dietary Self-Selection and Meal Patterns of Obese and Lean Zucker Rats. Appetite 1983, 4, 281–293. [Google Scholar] [CrossRef]
- De Castro, J.M. The Time of Day of Food Intake Influences Overall Intake in Humans. J. Nutr. 2004, 134, 104–111. [Google Scholar] [CrossRef] [PubMed]
- Paschos, G.K. Diurnal rhythms and obesity. Curr. Opin. Clin. Nutr. Metab. Care 2021, 24, 333–338. [Google Scholar] [CrossRef]
- Eckel, L.A. Estradiol: A rhythmic, inhibitory, indirect control of meal size. Physiol. Behav. 2004, 82, 35–41. [Google Scholar] [CrossRef] [PubMed]
- Heisler, L.K.; Kanarek, R.B.; Homoleski, B. Reduction of Fat and Protein Intakes but not Carbohydrate Intake Following Acute and Chronic Fluoxetine in Female Rats. Pharmacol. Biochem. Behav. 1999, 63, 377–385. [Google Scholar] [CrossRef]
- Butera, P.C.; Clough, S.J.; Bungo, A. Cyclic estradiol treatment modulates the orexigenic effects of ghrelin in ovariectomized rats. Pharmacol. Biochem. Behav. 2014, 124, 356–360. [Google Scholar] [CrossRef] [Green Version]
- Asarian, L.; Geary, N. Cyclic estradiol treatment phasically potentiates endogenous cholecystokinin’s satiating action in ovariectomized rats1,2. Peptides 1999, 20, 445–450. [Google Scholar] [CrossRef]
- Maske, C.B.; Jackson, C.M.; Terrill, S.J.; Eckel, L.A.; Williams, D.L. Estradiol modulates the anorexic response to central glucagon-like peptide 1. Horm. Behav. 2017, 93, 109–117. [Google Scholar] [CrossRef] [PubMed]
- Krisai, P.; Leib, S.; Aeschbacher, S.; Kofler, T.; Assadian, M.; Maseli, A.; Todd, J.; Estis, J.; Risch, M.; Risch, L.; et al. Relationships of iron metabolism with insulin resistance and glucose levels in young and healthy adults. Eur. J. Intern. Med. 2016, 32, 31–37. [Google Scholar] [CrossRef]
- Miller, G.D.; Norris, A.; Fernandez, A. Changes in Nutrients and Food Groups Intake Following Laparoscopic Roux-en-Y Gastric Bypass (RYGB). Obes. Surg. 2014, 24, 1926–1932. [Google Scholar] [CrossRef] [Green Version]
- Shah, H.; Shin, A.C. Meal patterns after bariatric surgery in mice and rats. Appetite 2019, 146, 104340. [Google Scholar] [CrossRef] [PubMed]
- Furnes, M.; Stenström, B.; Tømmerås, K.; Skoglund, T.; Dickson, S.; Kulseng, B.; Zhao, C.-M.; Chen, D. Feeding Behavior in Rats Subjected to Gastrectomy or Gastric Bypass Surgery. Eur. Surg. Res. 2008, 40, 279–288. [Google Scholar] [CrossRef] [PubMed]
- Miras, A.D.; le Roux, C.W. Bariatric surgery and taste: Novel mechanisms of weight loss. Curr. Opin. Gastroenterol. 2010, 26, 140–145. [Google Scholar] [CrossRef]
- Berthoud, H.-R.; Shin, A.C.; Zheng, H. Obesity surgery and gut–brain communication. Physiol. Behav. 2011, 105, 106–119. [Google Scholar] [CrossRef] [PubMed] [Green Version]
- Peiris, M.; Aktar, R.; Raynel, S.; Hao, Z.; Mumphrey, M.B.; Berthoud, H.-R.; Blackshaw, L.A. Effects of Obesity and Gastric Bypass Surgery on Nutrient Sensors, Endocrine Cells, and Mucosal Innervation of the Mouse Colon. Nutrients 2018, 10, 1529. [Google Scholar] [CrossRef] [PubMed] [Green Version]
- Bueter, M.; Ashrafian, H.; Le Roux, C.W. Mechanisms of Weight Loss after Gastric Bypass and Gastric Banding. Obes. Facts 2009, 2, 325–331. [Google Scholar] [CrossRef] [PubMed]
- Lim, J.J.; Poppitt, S.D. How Satiating Are the ‘Satiety’ Peptides: A Problem of Pharmacology versus Physiology in the Development of Novel Foods for Regulation of Food Intake. Nutrients 2019, 11, 1517. [Google Scholar] [CrossRef] [Green Version]
- Borg, C.-M.; Le Roux, C.; Ghatei, M.A.; Bloom, S.R.; Patel, A.G.; Aylwin, S.J.B. Progressive rise in gut hormone levels after Roux-en-Y gastric bypass suggests gut adaptation and explains altered satiety. BJS 2006, 93, 210–215. [Google Scholar] [CrossRef]
- Antin, J.; Gibbs, J.; Holt, J.; Young, R.C.; Smith, G.P. Cholecystokinin elicits the complete behavioral sequence of satiety in rats. J. Comp. Physiol. Psychol. 1975, 89, 784–790. [Google Scholar] [CrossRef] [PubMed]
- Williams, D.L. The diverse effects of brain glucagon-like peptide 1 receptors on ingestive behaviour. Br. J. Pharmacol. 2021. [Google Scholar] [CrossRef]
- Lutz, T. Amylin decreases meal size in rats. Physiol. Behav. 1995, 58, 1197–1202. [Google Scholar] [CrossRef]
- Hsu, T.M.; Hahn, J.; Konanur, V.; Lam, A.; Kanoski, S.E. Hippocampal GLP-1 Receptors Influence Food Intake, Meal Size, and Effort-Based Responding for Food through Volume Transmission. Neuropsychopharmacology 2014, 40, 327–337. [Google Scholar] [CrossRef]
- Liebling, D.S.; Eisner, J.D.; Gibbs, J.; Smith, G.P. Intestinal satiety in rats. J. Comp. Physiol. Psychol. 1975, 89, 955–965. [Google Scholar] [CrossRef]
- Bächler, T.; Geary, N.; Bueter, M.; Leeners, B.; Rehfeld, J.F.; Lutz, T.A.; Asarian, L. RYGB increases the satiating effect of intrajejunal lipid infusions in female rats. Appetite 2018, 131, 94–99. [Google Scholar] [CrossRef] [PubMed]
- Dailey, M.J.; Moghadam, A.A.; Moran, T.H. Jejunal linoleic acid infusions require GLP-1 receptor signaling to inhibit food intake: Implications for the effectiveness of Roux-en-Y gastric bypass. Am. J. Physiol. Metab. 2011, 301, E1184–E1190. [Google Scholar] [CrossRef] [PubMed] [Green Version]
- Camastra, S.; Palumbo, M.; Santini, F. Nutrients handling after bariatric surgery, the role of gastrointestinal adaptation. Eat. Weight. Disord.-Stud. Anorex. Bulim. Obes. 2021, 1–13. [Google Scholar] [CrossRef]
- Hammer, H.F. Medical Complications of Bariatric Surgery: Focus on Malabsorption and Dumping Syndrome. Dig. Dis. 2012, 30, 182–186. [Google Scholar] [CrossRef] [PubMed]
- Sugerman, H.J.; Kellum, J.M.; Engle, K.M.; Wolfe, L.; Starkey, J.V.; Birkenhauer, R.; Fletcher, P.; Sawyer, M.J. Gastric bypass for treating severe obesity. Am. J. Clin. Nutr. 1992, 55, 560S–566S. [Google Scholar] [CrossRef] [PubMed] [Green Version]
- Näslund, E.; Melin, I.; Grybäck, P.; Hägg, A.; Hellström, P.M.; Jacobsson, H.; Theodorsson, E.; Rössner, S.; Backman, L. Reduced food intake after jejunoileal bypass: A possible association with prolonged gastric emptying and altered gut hormone patterns. Am. J. Clin. Nutr. 1997, 66, 26–32. [Google Scholar] [CrossRef] [Green Version]
- Laurenius, A.; Werling, M.; Le Roux, C.W.; Fändriks, L.; Olbers, T. Dumping symptoms is triggered by fat as well as carbohydrates in patients operated with Roux-en-Y gastric bypass. Surg. Obes. Relat. Dis. 2017, 13, 1159–1164. [Google Scholar] [CrossRef]
- Emous, M.; Wijma, R.; Van, D.B.M.; De, H.L.; Van, D.G.; Wolthuis, A.; Totte, E.; Laskewitz, A.; Wolffenbuttel, B.; Van, B.A. Prevalence of postprandial hyperinsulinemic hypoglycaemia in a random population after primary Roux-en-Y gastric bypass during a mixed meal tolerance test. Endocr. Abstr. 2019, 63, 969–978. [Google Scholar] [CrossRef]
- Sloth, B.; Holst, J.J.; Flint, A.; Gregersen, N.T.; Astrup, A. Effects of PYY1–36and PYY3–36on appetite, energy intake, energy expenditure, glucose and fat metabolism in obese and lean subjects. Am. J. Physiol. Metab. 2007, 292, E1062–E1068. [Google Scholar] [CrossRef] [PubMed] [Green Version]
- Smith, J.C.; Blumsack, J.T.; Bilek, F.S. Radiation Induced Taste Aversions in Rats and Humans. In Cancer, Nutrition, and Eating Behavior: A Biobehavioral Perspective; Burish, T.C., Levy, S.M., Meyerowitz, B.E., Eds.; Lawrence Erlbaum Associates, Inc.: New York, NY, USA, 1985. [Google Scholar]
- Spector, A.C.; Breslin, P.; Grill, H.J. Taste reactivity as a dependent measure of the rapid formation of conditioned taste aversion: A tool for the neural analysis of taste-visceral associations. Behav. Neurosci. 1988, 102, 942–952. [Google Scholar] [CrossRef] [PubMed]
- Schier, L.A.; Hyde, K.M.; Spector, A.C. Conditioned taste aversion versus avoidance: A re-examination of the separate processes hypothesis. PLoS ONE 2019, 14, e0217458. [Google Scholar] [CrossRef]
- Myers, K.P.; Sclafani, A. Conditioned acceptance and preference but not altered taste reactivity responses to bitter and sour flavors paired with intragastric glucose infusion. Physiol. Behav. 2002, 78, 173–183. [Google Scholar] [CrossRef]
- Ackroff, K.; Sclafani, A. Flavor preferences conditioned by post-oral infusion of monosodium glutamate in rats. Physiol. Behav. 2011, 104, 488–494. [Google Scholar] [CrossRef]
- Rozin, P. Adaptive food sampling patterns in vitamin deficient rats. J. Comp. Physiol. Psychol. 1969, 69, 126–132. [Google Scholar] [CrossRef]
- Davis, J.D.; Smith, G.P.; Singh, B.; McCann, D.P. Increase in intake with sham feeding experience is concentration dependent. Am. J. Physiol. Content 1999, 277, R565–R571. [Google Scholar] [CrossRef]
- Seyfried, F.; Miras, A.D.; Bueter, M.; Prechtl, C.G.; Spector, A.C.; le Roux, C.W. Effects of preoperative exposure to a high-fat versus a low-fat diet on ingestive behavior after gastric bypass surgery in rats. Surg. Endosc. 2013, 27, 4192–4201. [Google Scholar] [CrossRef] [PubMed] [Green Version]
- Johnson, A.W. Dietary manipulations influence sucrose acceptance in diet induced obese mice. Appetite 2012, 58, 215–221. [Google Scholar] [CrossRef]
- Shin, A.C.; Berthoud, H.-R. Obesity surgery: Happy with less or eternally hungry? Trends Endocrinol. Metab. 2013, 24, 101–108. [Google Scholar] [CrossRef] [PubMed] [Green Version]
- Hansen, T.T.; Jakobsen, T.A.; Nielsen, M.S.; Sjödin, A.; Le Roux, C.W.; Schmidt, J.B. Hedonic Changes in Food Choices Following Roux-en-Y Gastric Bypass. Obes. Surg. 2016, 26, 1946–1955. [Google Scholar] [CrossRef] [PubMed]
- Barkholt, P.; Pedersen, P.J.; Hay-Schmidt, A.; Jelsing, J.; Hansen, H.H.; Vrang, N. Alterations in hypothalamic gene expression following Roux-en-Y gastric bypass. Mol. Metab. 2016, 5, 296–304. [Google Scholar] [CrossRef] [PubMed]
- Kaplan, J.M.; Spector, A.C.; Grill, H.J. Ingestion rate as an independent variable in the behavioral analysis of satiation. Am. J. Physiol. Integr. Comp. Physiol. 1990, 258, R662–R671. [Google Scholar] [CrossRef] [PubMed]
- Blundell, J.E. Serotonin Manipulations and the Structure of Feeding Behaviour. Appetite 1986, 7, 39–56. Available online: http://0-www-ncbi-nlm-nih-gov.brum.beds.ac.uk/pubmed/3527061 (accessed on 26 October 2021). [CrossRef]
- de Graaf, C. Texture and satiation: The role of oro-sensory exposure time. Physiol. Behav. 2012, 107, 496–501. [Google Scholar] [CrossRef] [PubMed]
- Treesukosol, Y.; Moran, T.H. Analyses of meal patterns across dietary shifts. Appetite 2013, 75, 21–29. [Google Scholar] [CrossRef] [PubMed] [Green Version]
- Clifton, P.; Popplewell, D.; Burton, M. Feeding rate and meal patterns in the laboratory rat. Physiol. Behav. 1984, 32, 369–374. [Google Scholar] [CrossRef]
- Smith, J.C.; Miller, I.J.; Krimm, R.F.; Nejad, M.S.; Beidler, L.M. A comparison of the effects of bilateral sections of the chorda tympani nerve and extirpation of the submaxillary and sublingual salivary glands on the eating and drinking patterns of the rat. Physiol. Behav. 1988, 44, 435–444. [Google Scholar] [CrossRef]
- Spector, A.C. Behavioral analyses of taste function and ingestion in rodent models. Physiol. Behav. 2015, 152, 516–526. [Google Scholar] [CrossRef] [PubMed] [Green Version]
- Davis, J.D. The Microstructure of Ingestive Behavior. Ann. N. Y. Acad. Sci. 1989, 575, 106–121. [Google Scholar] [CrossRef] [PubMed]
- Cottone, P.; Sabino, V.; Steardo, L.; Zorrilla, E.P. Consummatory, anxiety-related and metabolic adaptations in female rats with alternating access to preferred food. Psychoneuroendocrinology 2009, 34, 38–49. [Google Scholar] [CrossRef] [Green Version]
- Rogers, P.J.; Blundell, J.E. Meal patterns and food selection during the development of obesity in rats fed a cafeteria diet. Neurosci. Biobehav. Rev. 1985, 8, 441–453. [Google Scholar] [CrossRef]
- Martire, S.I.; Westbrook, R.F.; Morris, M.J. Effects of long-term cycling between palatable cafeteria diet and regular chow on intake, eating patterns, and response to saccharin and sucrose. Physiol. Behav. 2015, 139, 80–88. [Google Scholar] [CrossRef] [PubMed]
- Zenténius, E.; Andersson-Assarsson, J.; Carlsson, L.M.; Svensson, P.-A.; Larsson, I. Self-Reported Weight-Loss Methods and Weight Change: Ten-Year Analysis in the Swedish Obese Subjects Study Control Group. Obesity 2018, 26, 1137–1143. [Google Scholar] [CrossRef] [PubMed] [Green Version]
- Lutz, T.; Bueter, M. Physiological Mechanisms behind Roux-en-Y Gastric Bypass Surgery. Dig. Surg. 2014, 31, 13–24. [Google Scholar] [CrossRef] [PubMed] [Green Version]
- Lutz, T.A.; Bueter, M. The physiology underlying Roux-en-Y gastric bypass: A status report. Am. J. Physiol. Integr. Comp. Physiol. 2014, 307, R1275–R1291. [Google Scholar] [CrossRef] [Green Version]
- Werling, M.; Fändriks, L.; Olbers, T.; Bueter, M.; Sjöström, L.; Lönroth, H.; Wallenius, V.; Stenlöf, K.; Le Roux, C. Roux-en-Y Gastric Bypass Surgery Increases Respiratory Quotient and Energy Expenditure during Food Intake. PLoS ONE 2015, 10, e0129784. [Google Scholar] [CrossRef] [PubMed] [Green Version]
- Cavin, J.-B.; Couvelard, A.; Lebtahi, R.; Ducroc, R.; Arapis, K.; Voitellier, E.; Cluzeaud, F.; Gillard, L.; Hourseau, M.; Mikail, N.; et al. Differences in Alimentary Glucose Absorption and Intestinal Disposal of Blood Glucose After Roux-en-Y Gastric Bypass vs Sleeve Gastrectomy. Gastroenterology 2016, 150, 454–464.e9. [Google Scholar] [CrossRef] [PubMed] [Green Version]
- Steinert, R.E.; Ullrich, S.S.; Geary, N.; Asarian, L.; Bueter, M.; Horowitz, M.; Feinle-Bisset, C. Comparative effects of intraduodenal amino acid infusions on food intake and gut hormone release in healthy males. Physiol. Rep. 2017, 5, e13492. [Google Scholar] [CrossRef]
- Athanasiadis, D.I.; Martin, A.; Kapsampelis, P.; Monfared, S.; Stefanidis, D. Factors associated with weight regain post-bariatric surgery: A systematic review. Surg. Endosc. 2021, 35, 4069–4084. [Google Scholar] [CrossRef] [PubMed]
- De Castro, J.M. Socio-cultural determinants of meal size and frequency. Br. J. Nutr. 1997, 77, S39–S55. [Google Scholar] [CrossRef] [PubMed] [Green Version]
- Al-Najim, W.; Docherty, N.G.; Le Roux, C.W. Food Intake and Eating Behavior After Bariatric Surgery. Physiol. Rev. 2018, 98, 1113–1141. [Google Scholar] [CrossRef] [Green Version]
- Kubik, J.F.; Gill, R.S.; Laffin, M.; Karmali, S. The Impact of Bariatric Surgery on Psychological Health. J. Obes. 2013, 2013, 1–5. [Google Scholar] [CrossRef] [PubMed] [Green Version]
- Yen, Y.-C.; Huang, C.-K.; Tai, C.-M. Psychiatric aspects of bariatric surgery. Curr. Opin. Psychiatry 2014, 27, 374–379. [Google Scholar] [CrossRef]
- Snyder, A.G. Psychological Assessment of the Patient Undergoing Bariatric Surgery. Ochsner J. 2009, 9, 144–148. Available online: https://pmc/articles/PMC3096263/ (accessed on 8 June 2021). [PubMed]
- Cella, S.; Fei, L.; D’Amico, R.; Giardiello, C.; Allaria, A.; Cotrufo, P. Binge eating disorder and related features in bariatric surgery candidates. Open Med. 2019, 14, 407–415. [Google Scholar] [CrossRef] [PubMed]
- Conceição, E.; Orcutt, M.; Mitchell, J.; Engel, S.; LaHaise, K.; Jorgensen, M.; Woodbury, K.; Hass, N.; Garcia, L.; Wonderlich, S. Eating disorders after bariatric surgery: A case series. Int. J. Eat. Disord. 2012, 46, 274–279. [Google Scholar] [CrossRef] [PubMed] [Green Version]


| FOODS | DIET TYPE 1 | KCAL/G | % CARB 2 | % SUG 2 | % PRO 2 | % FAT 2 |
|---|---|---|---|---|---|---|
| Powdered rodent chow | LS/LF | 3.34 | 57.9 | 8.9 | 28.7 | 13.4 |
| Chickpea flour | LS/LF | 3.92 | 71.5 | 3.4 | 17.0 | 11.5 |
| Low-fat Yogurt | HS/LF | 0.79 | 67.0 | 65.0 | 19.7 | 13.3 |
| Creamy peanut butter | LS/HF | 6.38 | 15.7 | 5.9 | 13.7 | 70.6 |
| Sugar/Fat Whip | HS/HF | 5.80 | 29.2 | 27.5 | 13.5 | 57.3 |
| PRESURGERY | GROUP | DAY | GROUP × DAY |
| Powdered Chow Days 3–4 | F1,23 = 0.28, p = 0.60 | F1,23 = 1.09, p = 0.31 | F1,23 = 3.40, p = 0.08 |
| Cafeteria Days 1–8 | F1,23 < 0.01, p = 0.99 | F7,161 = 10.79, p < 0.01 | F7,161 = 0.89, p = 0.52 |
| POSTSURGERY | GROUP | DAY | GROUP × DAY |
| Powdered Chow Days 7–8 | F1,23 < 0.01, p = 0.98 | F1,23=2.317, p = 0.14 | F1,23 = 0.66, p = 0.43 |
| Cafeteria Days 9–16 | F1,23 = 82.30, p < 0.01 | F7,161=0.50, p = 0.83 | F7,161 = 0.78, p = 0.61 |
| Powdered Chow Days 9–12 | F1,23 = 7.59, p = 0.01 | F3,69 = 5.07, p < 0.01 | F3,69 = 2.07, p = 0.11 |
| PRESURGERY vs. POSTSURGERY | CONTROL | RYGB | |
| Powdered Chow Day 4 (Pre) | Powdered Chow Day 7 (Post) | t13 = 1.19, p = 0.25 | t10 = 0.19, p = 0.86 |
| Cafeteria Day 8 (Pre) | Cafeteria Day 9 (Post) | t13=1.18, p = 0.26 | t10 = 4.31, p < 0.01 |
| DIET TRANSITIONS WITHIN A PHASE | CONTROL | RYGB | |
| Powdered Chow Day 4 (Pre) | Cafeteria Day 1 (Pre) | t13 = 0.49, p = 0.66 | t10 = 1.14, p = 0.28 |
| Powdered Chow Day 8 (Post) | Cafeteria Day 9 (Post) | t13 = 7.64, p < 0.01 | t10 = 1.07, p = 0.31 |
| Cafeteria Day 16 (Post) | Powdered Chow Day 9 (Post) | t13 = 11.96, p < 0.01 | t10 = 3.42, p < 0.01 |
| PRESURGERY | GROUP | DAY | GROUP × DAY |
| Powdered Chow Days 3–4 | F1,23 < 0.01, p = 0.95 | F1,23 = 2.06, p = 0.17 | F1,23 = 0.47, p = 0.50 |
| Cafeteria Days 1–8 | F1,23 < 0.01, p = 0.94 | F7,161 = 4.68, p < 0.01 | F7,161 = 0.77, p = 0.62 |
| POSTSURGERY | GROUP | DAY | GROUP × DAY |
| Powdered Chow Days 7–8 | F1,23 = 0.06, p = 0.81 | F1,23 = 1.31, p = 0.26 | F1,23 = 0.79, p = 0.38 |
| Cafeteria Days 9–16 | F1,23 = 67.09, p < 0.01 | F7,161 = 2.29, p = 0.03 | F7,161 = 2.14, p = 0.04 |
| Powdered Chow Days 9–12 | F1,23 = 0.49, p = 0.49 | F3,69 = 5.96, p < 0.01 | F3,69 = 2.07, p = 0.11 |
| PRESURGERY vs. POSTSURGERY | CONTROL | RYGB | |
| Powdered Chow Day 4 (Pre) | Powdered Chow Day 7 (Post) | t13 = 1.19, p = 0.25 | t10 = 0.19, p = 0.86 |
| Cafeteria Day 8 (Pre) | Cafeteria Day 9 (Post) | t13 = 2.53, p = 0.06 | t10 = 1.48, p = 0.17 |
| DIET TRANSITIONS WITHIN A PHASE | CONTROL | CONTROL | |
| Powdered Chow Day 4 (Pre) | Cafeteria Day 1 (Pre) | t13 = 0.21, p = 0.84 | t10 = 0.06, p = 0.95 |
| Powdered Chow Day 8 (Post) | Cafeteria Day 9 (Post) | t13 = 5.33, p < 0.01 | t10 = 2.94, p = 0.01 |
| Cafeteria Day 16 (Post) | Powdered Chow Day 9 (Post) | t13 = 10.90, p < 0.01 | t10 = 5.01, p < 0.01 |
| PRESURGERY | GROUP | DAY | GROUP × DAY |
| Powdered Chow Days 3–4 | F1,23 = 0.90, p = 0.35 | F1,23 = 1.54, p = 0.23 | F1,23 = 0.21, p = 0.65 |
| Cafeteria Days 1–8 | F1,23 = 0.01, p = 0.91 | F7,161 = 3.68, p < 0.01 | F7,161 = 0.84, p = 0.56 |
| POSTSURGERY | GROUP | DAY | GROUP × DAY |
| Powdered Chow Days 7–8 | F1,23 = 0.06, p = 0.81 | F1,23 = 0.30, p = 0.59 | F1,23 = 0.19, p = 0.67 |
| Cafeteria Days 9–16 | F1,23 = 0.42, p = 0.52 | F7,161 = 3.07, p < 0.01 | F7,161 = 3.30, p < 0.01 |
| Powdered Chow Days 9–12 | F1,23 = 8.81, p < 0.01 | F3,69 = 0.08, p = 0.97 | F3,69 = 0.28, p = 0.84 |
| PRESURGERY vs. POSTSURGERY | CONTROL | RYGB | |
| Powdered Chow Day 4 (Pre) | Powdered Chow Day 7 (Post) | t13 = 0.14, p = 0.89 | t10 = 0.83, p = 0.43 |
| Cafeteria Day 8 (Pre) | Cafeteria Day 9 (Post) | t13 = 0.76, p = 0.46 | t10 = 5.52, p < 0.01 |
| DIET TRANSITIONS WITHIN A PHASE | CONTROL | CONTROL | |
| Powdered Chow Day 4 (Pre) | Cafeteria Day 1 (Pre) | t13 = 0.43, p = 0.68 | t10 = 0.91, p = 0.39 |
| Powdered Chow Day 8 (Post) | Cafeteria Day 9 (Post) | t13 = 1.57, p = 0.14 | t10 = 2.74, p = 0.02 |
| Cafeteria Day 16 (Post) | Powdered Chow Day 9 (Post) | t13 = 3.20, p < 0.01 | t10 = 0.55, p = 0.60 |
| PRESURGERY | GROUP | DAY | GROUP × DAY |
| Powdered Chow Days 3–4 | F1,23 = 0.17, p = 0.68 | F1,23 = 0.39, p = 0.53 | F1,23 = 0.99, p = 0.33 |
| Cafeteria Days 1–8 | F1,23 < 0.01, p = 0.98 | F7,161 = 1.13, p = 0.35 | F7,161 = 0.93, p = 0.48 |
| POSTSURGERY | GROUP | DAY | GROUP × DAY |
| Powdered Chow Days 7–8 | F1,23 < 0.01, p = 0.98 | F1,23 = 0.16, p = 0.69 | F1,23 < 0.01, p = 0.96 |
| Cafeteria Days 9–16 | F1,23 = 1.23, p = 0.28 | F7,161 = 1.20, p = 0.31 | F7,161 = 0.84, p = 0.56 |
| Powdered Chow Days 9–12 | F1,23 = 2.02, p = 0.17 | F3,69 = 0.50, p = 0.68 | F3,69 = 0.46, p = 0.71 |
| PRESURGERY vs. POSTSURGERY | CONTROL | RYGB | |
| Powdered Chow Day 4 (Pre) | Powdered Chow Day 7 (Post) | t13 = 1.33, p = 0.15 | t10 = 1.10, p = 0.30 |
| Cafeteria Day 8 (Pre) | Cafeteria Day 9 (Post) | t13 = 1.44, p = 0.17 | t10 = 2.39, p = 0.04 |
| DIET TRANSITIONS WITHIN A PHASE | CONTROL | CONTROL | |
| Powdered Chow Day 4 (Pre) | Cafeteria Day 1 (Pre) | t13 = 2.01, p = 0.06 | t10 = 1.94, p = 0.08 |
| Powdered Chow Day 8 (Post) | Cafeteria Day 9 (Post) | t13 = 1.58, p = 0.14 | t10 = 3.05, p = 0.01 |
| Cafeteria Day 16 (Post) | Powdered Chow Day 9 (Post) | t13 = 2.32, p = 0.04 | t10 = 2.00, p = 0.09 |
| PRESURGERY | GROUP | DAY | GROUP × DAY |
| Powdered Chow Days 3–4 | F1,23 = 0.18, p = 0.68 | F1,23 = 1.11, p = 0.30 | F1,23 = 0.27, p = 0.61 |
| Cafeteria Days 1–8 | F1,23 = 0.02, p = 0.91 | F7,161 = 3.16, p < 0.01 | F7,161 = 1.06, p = 0.39 |
| POSTSURGERY | GROUP | DAY | GROUP × DAY |
| Powdered Chow Days 7–8 | F1,23 = 0.10, p = 0.76 | F1,23 = 2.00, p = 0.17 | F1,23 = 0.16, p = 0.69 |
| Cafeteria Days 9–16 | F1,23 = 32.27, p < 0.01 | F7,161 = 3.34, p < 0.01 | F7,161 = 3.41, p < 0.01 |
| Powdered Chow Days 9–12 | F1,23 = 0.04, p = 0.84 | F3,69 = 1.02, p = 0.39 | F3,69 = 1.10, p = 0.36 |
| PRESURGERY vs. POSTSURGERY | CONTROL | RYGB | |
| Powdered Chow Day 4 (Pre) | Powdered Chow Day 7 (Post) | t13 = 0.96, p = 0.36 | t10 = 1.41, p = 0.19 |
| Cafeteria Day 8 (Pre) | Cafeteria Day 9 (Post) | t13 = 3.39, p < 0.01 | t10 = 1.94, p = 0.08 |
| DIET TRANSITIONS WITHIN A PHASE | CONTROL | CONTROL | |
| Powdered Chow Day 4 (Pre) | Cafeteria Day 1 (Pre) | t13 = 2.77, p = 0.02 | t10 = 3.17, p < 0.05 |
| Powdered Chow Day 8 (Post) | Cafeteria Day 9 (Post) | t13 = 10.88, p < 0.01 | t10 = 4.90, p < 0.01 |
| Cafeteria Day 16 (Post) | Powdered Chow Day 9 (Post) | t13 = 9.10, p < 0.01 | t10 = 3.30, p < 0.01 |
| PRESURGERY | GROUP | DAY | GROUP × DAY |
| Powdered Chow Days 3–4 | F1,23 = 0.58, p = 0.46 | F1,23 = 10.19, p < 0.01 | F1,23 = 0.27, p = 0.61 |
| Cafeteria Days 1–8 | F1,23 = 0.72, p = 0.41 | F7,161 = 1.65, p = 0.13 | F7,161 = 0.88, p = 0.52 |
| POSTSURGERY | GROUP | DAY | GROUP × DAY |
| Powdered Chow Days 7–8 | F1,23 = 1.92, p = 0.18 | F1,23 = 0.11, p = 0.74 | F1,23 = 0.53, p = 0.47 |
| Cafeteria Days 9–16 | F1,23 = 0.13, p = 0.72 | F7,161 = 0.83, p = 0.57 | F7,161 = 2.09, p < 0.05 |
| Powdered Chow Days 9–12 | F1,23 = 0.34, p = 0.57 | F3,69 = 0.25, p = 0.86 | F3,69 = 0.80, p = 0.50 |
| PRESURGERY vs. POSTSURGERY | CONTROL | RYGB | |
| Powdered Chow Day 4 (Pre) | Powdered Chow Day 7 (Post) | t13 = 1.09, p = 0.29 | t10 = 0.27, p = 0.79 |
| Cafeteria Day 8 (Pre) | Cafeteria Day 9 (Post) | t13 = 0.48, p = 0.64 | t10 = 1.68, p = 0.13 |
| DIET TRANSITIONS WITHIN A PHASE | CONTROL | CONTROL | |
| Powdered Chow Day 4 (Pre) | Cafeteria Day 1 (Pre) | t13 = 3.7, p < 0.01 | t10 = 2.25, p = 0.05 |
| Powdered Chow Day 8 (Post) | Cafeteria Day 9 (Post) | t13 = 0.50, p = 0.62 | t10 = 1.57, p = 0.15 |
| Cafeteria Day 16 (Post) | Powdered Chow Day 9 (Post) | t13 = 1.27, p = 0.22 | t10 = 0.09, p = 0.93 |
| PRESURGERY | LIGHTS-ON | LIGHTS-OFF | ||||
| GROUP | DAY | G × D | GROUP | DAY | G × D | |
| Powdered Chow Days 3–4 | F1,23 = 0.07, p = 0.80 | F1,23 = 3.88, p = 0.06 | F1,23 = 0.46, p = 0.51 | F1,23 = 0.03, p = 0.87 | F1,23 = 2.13, p = 0.16 | F1,23 = 0.66, p = 0.43 |
| Cafeteria Days 1–8 | F1,23 = 0.02, p = 0.90 | F7,161 = 4.20, p < 0.01 | F7,161 = 0.50, p = 0.83 | F1,23 = 0.43, p = 0.52 | F7,161 = 3.13, p < 0.01 | F7,161 = 1.26, p = 0.27 |
| POSTSURGERY | LIGHTS-ON | LIGHTS-OFF | ||||
| GROUP | DAY | G × D | GROUP | DAY | G × D | |
| Powdered Chow Days 7–8 | F1,23 = 0.45, p = 0.51 | F1,23 = 0.30, p = 0.59 | F1,23<0.01, p = 0.99 | F1,23 = 0.02, p = 0.89 | F1,23 = 3.10, p = 0.09 | F1,23 = 1.48, p = 0.24 |
| Cafeteria Days 9–16 | F1,23 = 28.20, p < 0.01 | F7,161 = 9.88, p < 0.01 | F7,161 = 2.71, p = 0.01 | F1,23 = 60.54, p < 0.01 | F7,161 = 1.35, p = 0.23 | F7,161 = 1.25, p = 0.28 |
| Powdered Chow Days 9–12 | F1,23 = 0.08, p = 0.78 | F3,69 = 2.05, p = 0.12 | F3,69 = 1.28, p = 0.29 | F1,23 = 0.03, p = 0.86 | F3,69 = 3.77, p = 0.01 | F3,69 = 2.72, p > 0.05 |
| PRESURGERY | CONTROL | RYGB | ||||
| LIGHTS | DAY | L × D | LIGHTS | DAY | L × D | |
| Powdered Chow Days 3–4 | F1,13 = 32.51, p < 0.01 | F1,13 = 2.21, p = 0.17 | F1,13 = 0.10, p = 0.76 | F1,10 = 14.32, p < 0.01 | F1,10 = 1.55, p = 0.25 | F1,10 = 0.97, p = 0.36 |
| Cafeteria Days 1–8 | F1,13 = 1.213, p = 0.29 | F7,98 = 2.19, p = 0.04 | F7,98 = 1.70, p = 0.12 | F1,10 = 0.02, p = 0.90 | F7,63 = 3.73, p < 0.01 | F7,63 = 1.56, p = 0.16 |
| POSTSURGERY | CONTROL | RYGB | ||||
| LIGHTS | DAY | L × D | LIGHTS | DAY | L × D | |
| Powdered Chow Days 7–8 | F1,13 = 4.45, p < 0.05 | F1,13 = 0.05, p = 0.83 | F1,13 = 0.43, p = 0.53 | F1,10 = 4.63, p = 0.04 | F1,10 = 1.85, p = 0.21 | F1,10 = 2.01, p = 0.19 |
| Cafeteria Days 9–16 | F1,13 = 1.54, p = 0.24 | F7,98 = 1.17, p = 0.33 | F7,98 = 5.33, p < 0.01 | F1,10 = 5.79, p = 0.04 | F7,63 = 12.95, p < 0.01 | F7,63 = 11.75, p < 0.01 |
| Powdered Chow Days 9–12 | F1,23 = 6.44, p = 0.03 | F3,42 = 0.37, p = 0.78 | F3,42 = 0.44, p = 0.73 | F1,23 = 3.91, p = 0.08 | F3,27 = 6.09, p < 0.01 | F3,27 = 0.57, p = 0.64 |
| PRESURGERY | LIGHTS-ON | LIGHTS-OFF | ||||
| GROUP | DAY | G × D | GROUP | DAY | G × D | |
| Powdered Chow Days 3–4 | F1,23 = 1.28, p = 0.27 | F1,23 = 0.08, p = 0.79 | F1,23 = 0.68, p = 0.42 | F1,23 = 1.33, p = 0.29 | F1,23 = 3.19, p = 0.09 | F1,23 = 0.03, p = 0.87 |
| Cafeteria Days 1–8 | F1,23 = 0.36, p = 0.55 | F7,161 = 5.54, p < 0.01 | F7,161 = 0.96, p = 0.50 | F1,23 = 0.04, p = 0.84 | F7,161 = 2.04, p > 0.05 | F7,161 = 1.08, p = 0.38 |
| POSTSURGERY | LIGHTS-ON | LIGHTS-OFF | ||||
| GROUP | DAY | G × D | GROUP | DAY | G × D | |
| Powdered Chow Days 7–8 | F1,23 = 1.15, p = 0.30 | F1,23 = 0.84, p = 0.37 | F1,23 = 0.05, p = 0.82 | F1,23 = 0.09, p = 0.77 | F1,23 = 0.02, p = 0.87 | F1,23 = 0.52, p = 0.48 |
| Cafeteria Days 9–16 | F1,23 = 13.25, p < 0.01 | F7,161 = 3.10, p < 0.01 | F7,161 = 2.71, p = 0.01 | F1,23 = 5.18, p = 0.03 | F7,161 = 1.35, p = 0.30 | F7,161 = 2.01, p > 0.05 |
| Powdered Chow Days 9–12 | F1,23 = 10.76, p < 0.01 | F3,69 = 0.40, p = 0.76 | F3,69 = 0.40, p = 0.76 | F1,23 = 6.19, p = 0.02 | F3,69 = 0.13, p = 0.94 | F3,69 = 0.24, p = 0.87 |
| PRESURGERY | CONTROL | RYGB | ||||
| LIGHTS | DAY | L × D | LIGHTS | DAY | L × D | |
| Powdered Chow Days 3–4 | F1,13 = 149.42, p < 0.01 | F1,13 = 2.33, p = 0.15 | F1,13 = 0.46, p = 0.51 | F1,10 = 211.60, p < 0.01 | F1,10 = 0.19, p = 0.67 | F1,10 = 1.48, p = 0.26 |
| Cafeteria Days 1–8 | F1,13 = 137.38, p < 0.01 | F7,98 = 2.86, p < 0.01 | F7,98 = 2.89, p < 0.01 | F1,10 = 182.12, p < 0.01 | F7,63 = 1.96, p = 0.07 | F7,63 = 1.17, p = 0.33 |
| POSTSURGERY | CONTROL | RYGB | ||||
| LIGHTS | DAY | L × D | LIGHTS | DAY | L × D | |
| Powdered Chow Days 7–8 | F1,13 = 258.26, p < 0.01 | F1,13 = 0.15, p = 0.71 | F1,13 = 0.19, p = 0.67 | F1,10 = 202.50, p < 0.01 | F1,10 = 0.37, p = 0.56 | F1,10 = 0.38, p = 0.56 |
| Cafeteria Day 9–16 | F1,13 = 411.04, p < 0.01 | F7,98 = 0.24, p = 0.97 | F7,98 = 0.84, p = 0.56 | F1,10 = 129.36, p < 0.01 | F7,63 = 4.531, p < 0.01 | F7,63 = 2.23, p = 0.04 |
| Powdered Chow Days 9–12 | F1,23 = 167.47, p < 0.01 | F3,42 = 0.18, p = 0.91 | F3,42 = 0.40, p = 0.75 | F1,23 = 147.65, p < 0.01 | F3,27 = 0.25, p = 0.86 | F3,27 = 0.13, p = 0.94 |
| PRESURGERY | LIGHTS-ON | LIGHTS-OFF | ||||
| GROUP | DAY | G × D | GROUP | DAY | G × D | |
| Powdered Chow Days 3–4 | F1,23 = 0.02, p = 0.90 | F1,23 = 0.38, p = 0.55 | F1,23 = 1.39, p = 0.25 | F1,23 = 0.07, p = 0.79 | F1,23 = 2.82, p = 0.11 | F1,23 = 0.73, p = 0.40 |
| Cafeteria Days 1–8 | F1,23 = 0.04, p = 0.85 | F7,161 = 2.81, p < 0.01 | F7,161 = 1.08, p = 0.38 | F1,23 = 0.15, p = 0.70 | F7,161 = 1.61, p = 0.14 | F7,161 = 0.76, p = 0.62 |
| POSTSURGERY | LIGHTS-ON | LIGHTS-OFF | ||||
| GROUP | DAY | G × D | GROUP | DAY | G × D | |
| Powdered Chow Days 7–8 | F1,23 = 0.05, p = 0.82 | F1,23 = 0.56, p = 0.46 | F1,23 = 5.54, p = 0.03 | F1,23 = 0.08, p = 0.78 | F1,23 = 3.03, p = 0.10 | F1,23 = 1.11, p = 0.30 |
| Cafeteria Day 9–16 | F1,23 = 34.06, p < 0.01 | F7,161 = 0.97, p = 0.46 | F7,161 = 1.89, p = 0.08 | F1,23 = 45.91, p < 0.01 | F7,161 = 0.90, p = 0.51 | F7,161 = 0.46, p = 0.44 |
| Powdered Chow Days 9–12 | F1,23 = 1.95, p = 0.18 | F3,69 = 1.38, p = 0.26 | F3,69 = 0.77, p = 0.51 | F1,23 = 0.59, p = 0.45 | F3,69 = 2.50, p = 0.07 | F3,69 = 1.27, p = 0.29 |
| PRESURGERY | CONTROL | RYGB | ||||
| LIGHTS | DAY | L × D | LIGHTS | DAY | L × D | |
| Powdered Chow Days 3–4 | F1,13 = 0.11, p = 0.74 | F1,13 = 0.01, p = 0.92 | F1,13 = 1.26, p = 0.29 | F1,10 = 0.03, p = 0.87 | F1,10 = 1.30, p = 0.29 | F1,10 = 0.27, p = 0.62 |
| Cafeteria Days 1–8 | F1,13 = 36.65, p < 0.01 | F7,98 = 2.00, p = 0.06 | F7,98 = 1.32, p = 0.25 | F1,10 = 35.89, p < 0.01 | F7,63 = 1.45, p = 0.06 | F7,63 = 2.03, p = 0.07 |
| POSTSURGERY | CONTROL | RYGB | ||||
| LIGHTS | DAY | L × D | LIGHTS | DAY | L × D | |
| Powdered Chow Days 7–8 | F1,13 = 0.24, p = 0.63 | F1,13 = 0.32, p = 0.58 | F1,13 = 0.74, p = 0.41 | F1,10 = 0.01, p = 0.91 | F1,10 = 0.08, p = 0.79 | F1,10 = 1.73, p = 0.23 |
| Cafeteria Day 9-16 | F1,13 = 55.31, p < 0.01 | F7,98 = 0.49, p = 0.84 | F7,98 = 0.92, p = 0.50 | F1,10 = 0.59, p = 0.46 | F7,63 = 9.89, p < 0.01 | F7,63 = 3.83, p < 0.01 |
| Powdered Chow Days 9–12 | F1,23 = 1.26, p = 0.29 | F3,42 = 2.30, p = 0.10 | F3,42 = 0.41, p = 0.75 | F1,23 = 1.42, p = 0.26 | F3,27 = 0.27, p = 0.85 | F3,27 = 1.99, p = 0.14 |
| PRESURGERY | LIGHTS-ON | LIGHTS-OFF | ||||
| GROUP | DAY | G × D | GROUP | DAY | G × D | |
| Powdered Chow Days 3–4 | F1,23 = 0.24, p = 0.63 | F1,23 = 1.09, p = 0.31 | F1,23 = 0.11, p = 0.75 | F1,23 = 0.08, p = 0.79 | F1,23 < 0.01, p = 0.93 | F1,23 = 0.06, p = 0.81 |
| Cafeteria Days 1–8 | F1,23 = 0.16, p = 0.69 | F7,161 = 1.79, p = 0.09 | F7,161 = 0.23, p = 0.98 | F1,23 = 0.11, p = 0.74 | F7,161 = 2.49, p = 0.02 | F7,161 = 1.30, p = 0.25 |
| POSTSURGERY | LIGHTS-ON | LIGHTS-OFF | ||||
| GROUP | DAY | G × D | GROUP | DAY | G × D | |
| Powdered Chow Days 7–8 | F1,23 = 0.12, p = 0.73 | F1,23 = 0.08, p = 0.78 | F1,23 = 0.91, p = 0.35 | F1,23 = 0.46, p = 0.41 | F1,23 = 0.79, p = 0.39 | F1,23 = 0.09, p = 0.77 |
| Cafeteria Day 9–16 | F1,23 = 5.33, p = 0.03 | F7,161 = 1.67, p = 0.12 | F7,161 = 1.23, p = 0.29 | F1,23 = 0.22, p = 0.65 | F7,161 = 1.79, p = 0.09 | F7,161 = 1.27, p = 0.27 |
| Powdered Chow Days 9–12 | F1,23 = 6.37, p = 0.02 | F3,69 = 2.03, p = 0.12 | F3,69 = 1.73, p = 0.17 | F1,23 = 1.23, p = 0.28 | F3,69 = 0.25, p = 0.86 | F3,69 = 0.45, p = 0.72 |
| PRESURGERY | CONTROL | RYGB | ||||
| LIGHTS | DAY | L × D | LIGHTS | DAY | L × D | |
| Powdered Chow Days 3–4 | F1,13 = 1.42, p = 0.26 | F1,13 = 0.38, p = 0.55 | F1,13 = 0.29, p = 0.60 | F1,10 = 0.10, p = 0.76 | F1,10 = 0.25, p = 0.63 | F1,10 = 1.18, p = 0.31 |
| Cafeteria Days 1–8 | F1,13 = 0.80, p = 0.39 | F7,98 = 0.67, p = 0.70 | F7,98 = 1.13, p = 0.35 | F1,10 = 5.96, p>0.05 | F7,63 = 1.08, p = 0.39 | F7,63 = 1.57, p = 0.16 |
| POSTSURGERY | CONTROL | RYGB | ||||
| LIGHTS | DAY | L × D | LIGHTS | DAY | L × D | |
| Powdered Chow Days 7–8 | F1,13 = 0.07, p = 0.80 | F1,13 = 0.56, p = 0.47 | F1,13 = 0.27, p = 0.61 | F1,10 = 0.42, p = 0.53 | F1,10 = 0.27, p = 0.62 | F1,10 = 0.62, p = 0.45 |
| Cafeteria Day 9–16 | F1,13 = 19.91, p < 0.01 | F7,98 = 1.18, p = 0.32 | F7,98 = 1.76, p = 0.10 | F1,10 = 4.21, p = 0.07 | F7,63 = 0.79, p = 0.60 | F7,63 = 2.40, p = 0.03 |
| Powdered Chow Days 9–12 | F1,23 = 4.70, p = 0.06 | F3,42 = 2.00, p = 0.13 | F3,42 = 2.14, p = 0.12 | F1,23 = 22.05, p < 0.01 | F3,27 = 0.74, p = 0.69 | F3,27 = 0.75, p = 0.53 |
Publisher’s Note: MDPI stays neutral with regard to jurisdictional claims in published maps and institutional affiliations. |
© 2021 by the authors. Licensee MDPI, Basel, Switzerland. This article is an open access article distributed under the terms and conditions of the Creative Commons Attribution (CC BY) license (https://creativecommons.org/licenses/by/4.0/).
Share and Cite
Blonde, G.D.; Price, R.K.; le Roux, C.W.; Spector, A.C. Meal Patterns and Food Choices of Female Rats Fed a Cafeteria-Style Diet Are Altered by Gastric Bypass Surgery. Nutrients 2021, 13, 3856. https://0-doi-org.brum.beds.ac.uk/10.3390/nu13113856
Blonde GD, Price RK, le Roux CW, Spector AC. Meal Patterns and Food Choices of Female Rats Fed a Cafeteria-Style Diet Are Altered by Gastric Bypass Surgery. Nutrients. 2021; 13(11):3856. https://0-doi-org.brum.beds.ac.uk/10.3390/nu13113856
Chicago/Turabian StyleBlonde, Ginger D., Ruth K. Price, Carel W. le Roux, and Alan C. Spector. 2021. "Meal Patterns and Food Choices of Female Rats Fed a Cafeteria-Style Diet Are Altered by Gastric Bypass Surgery" Nutrients 13, no. 11: 3856. https://0-doi-org.brum.beds.ac.uk/10.3390/nu13113856