
High-Protein or Low Glycemic Index Diet—Which Energy-Restricted Diet Is Better to Start a Weight Loss Program?


Abstract
:1. Introduction
2. Materials and Methods
2.1. Subjects
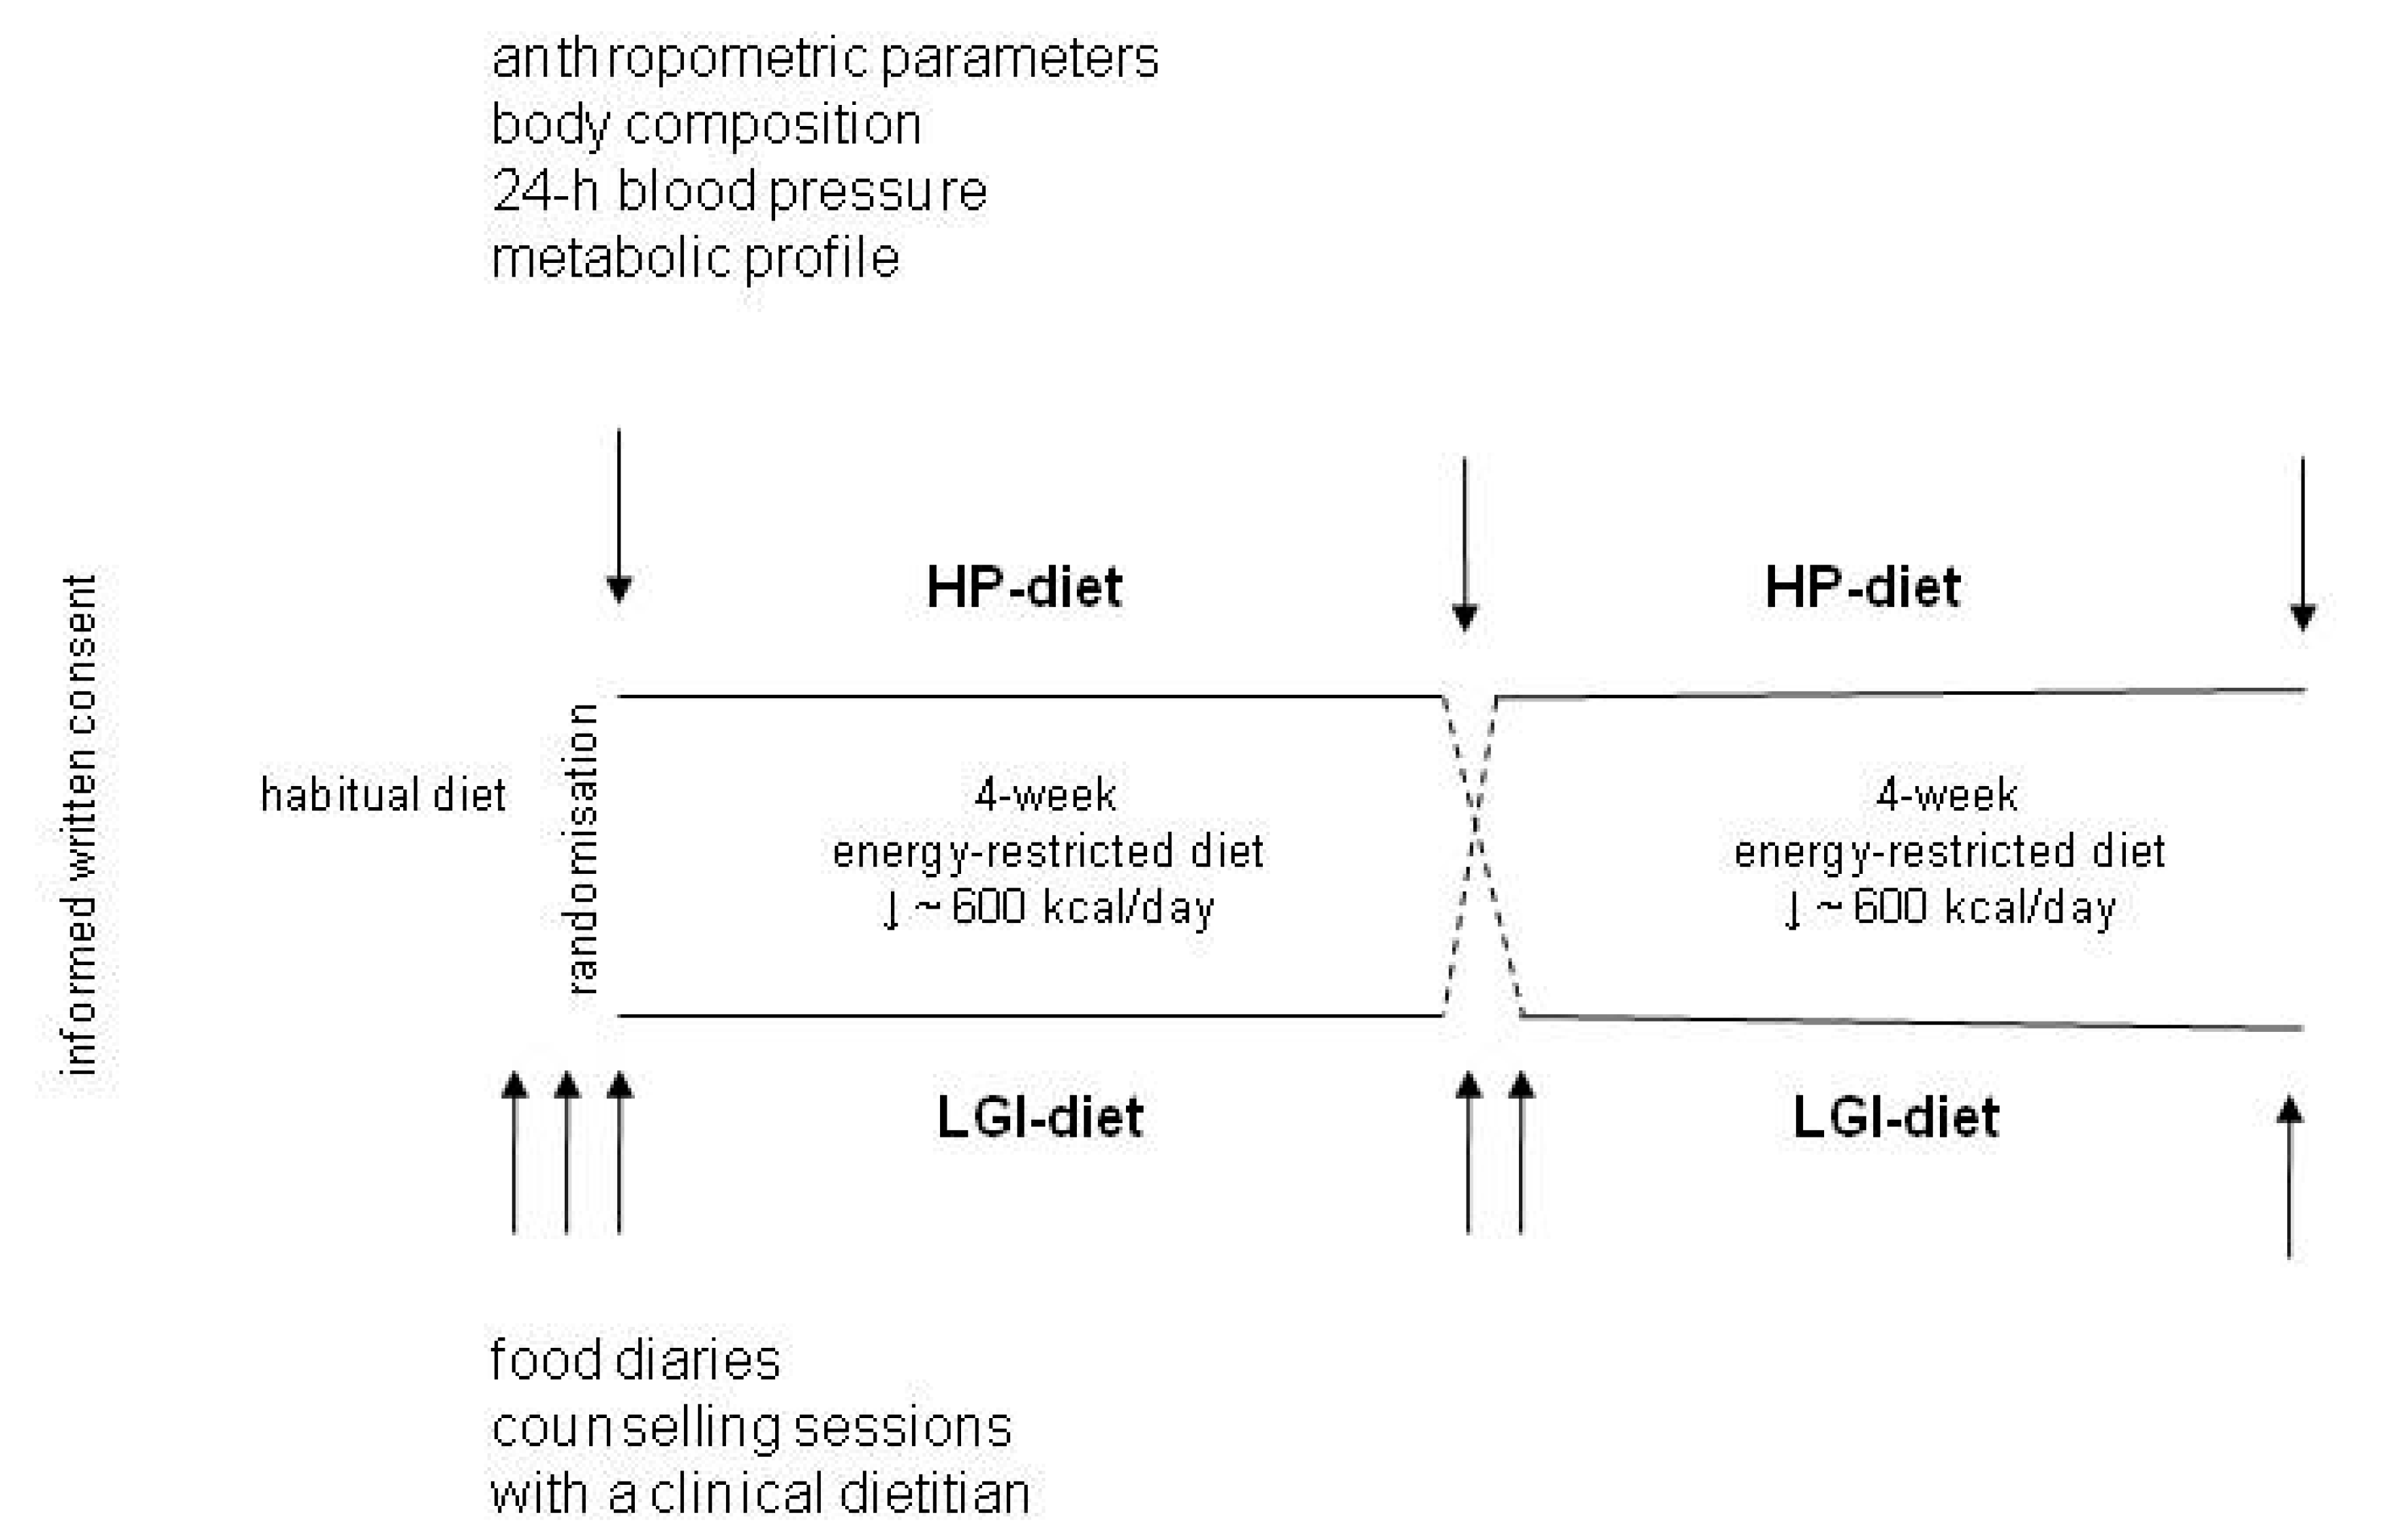
2.2. Study Protocol
2.3. Assessment of the Effects of Dietary Intervention
2.4. Anthropometric Data, Blood Pressure, and Laboratory Parameters at Baseline
2.5. Diet Control
2.6. Statistical Analysis
3. Results
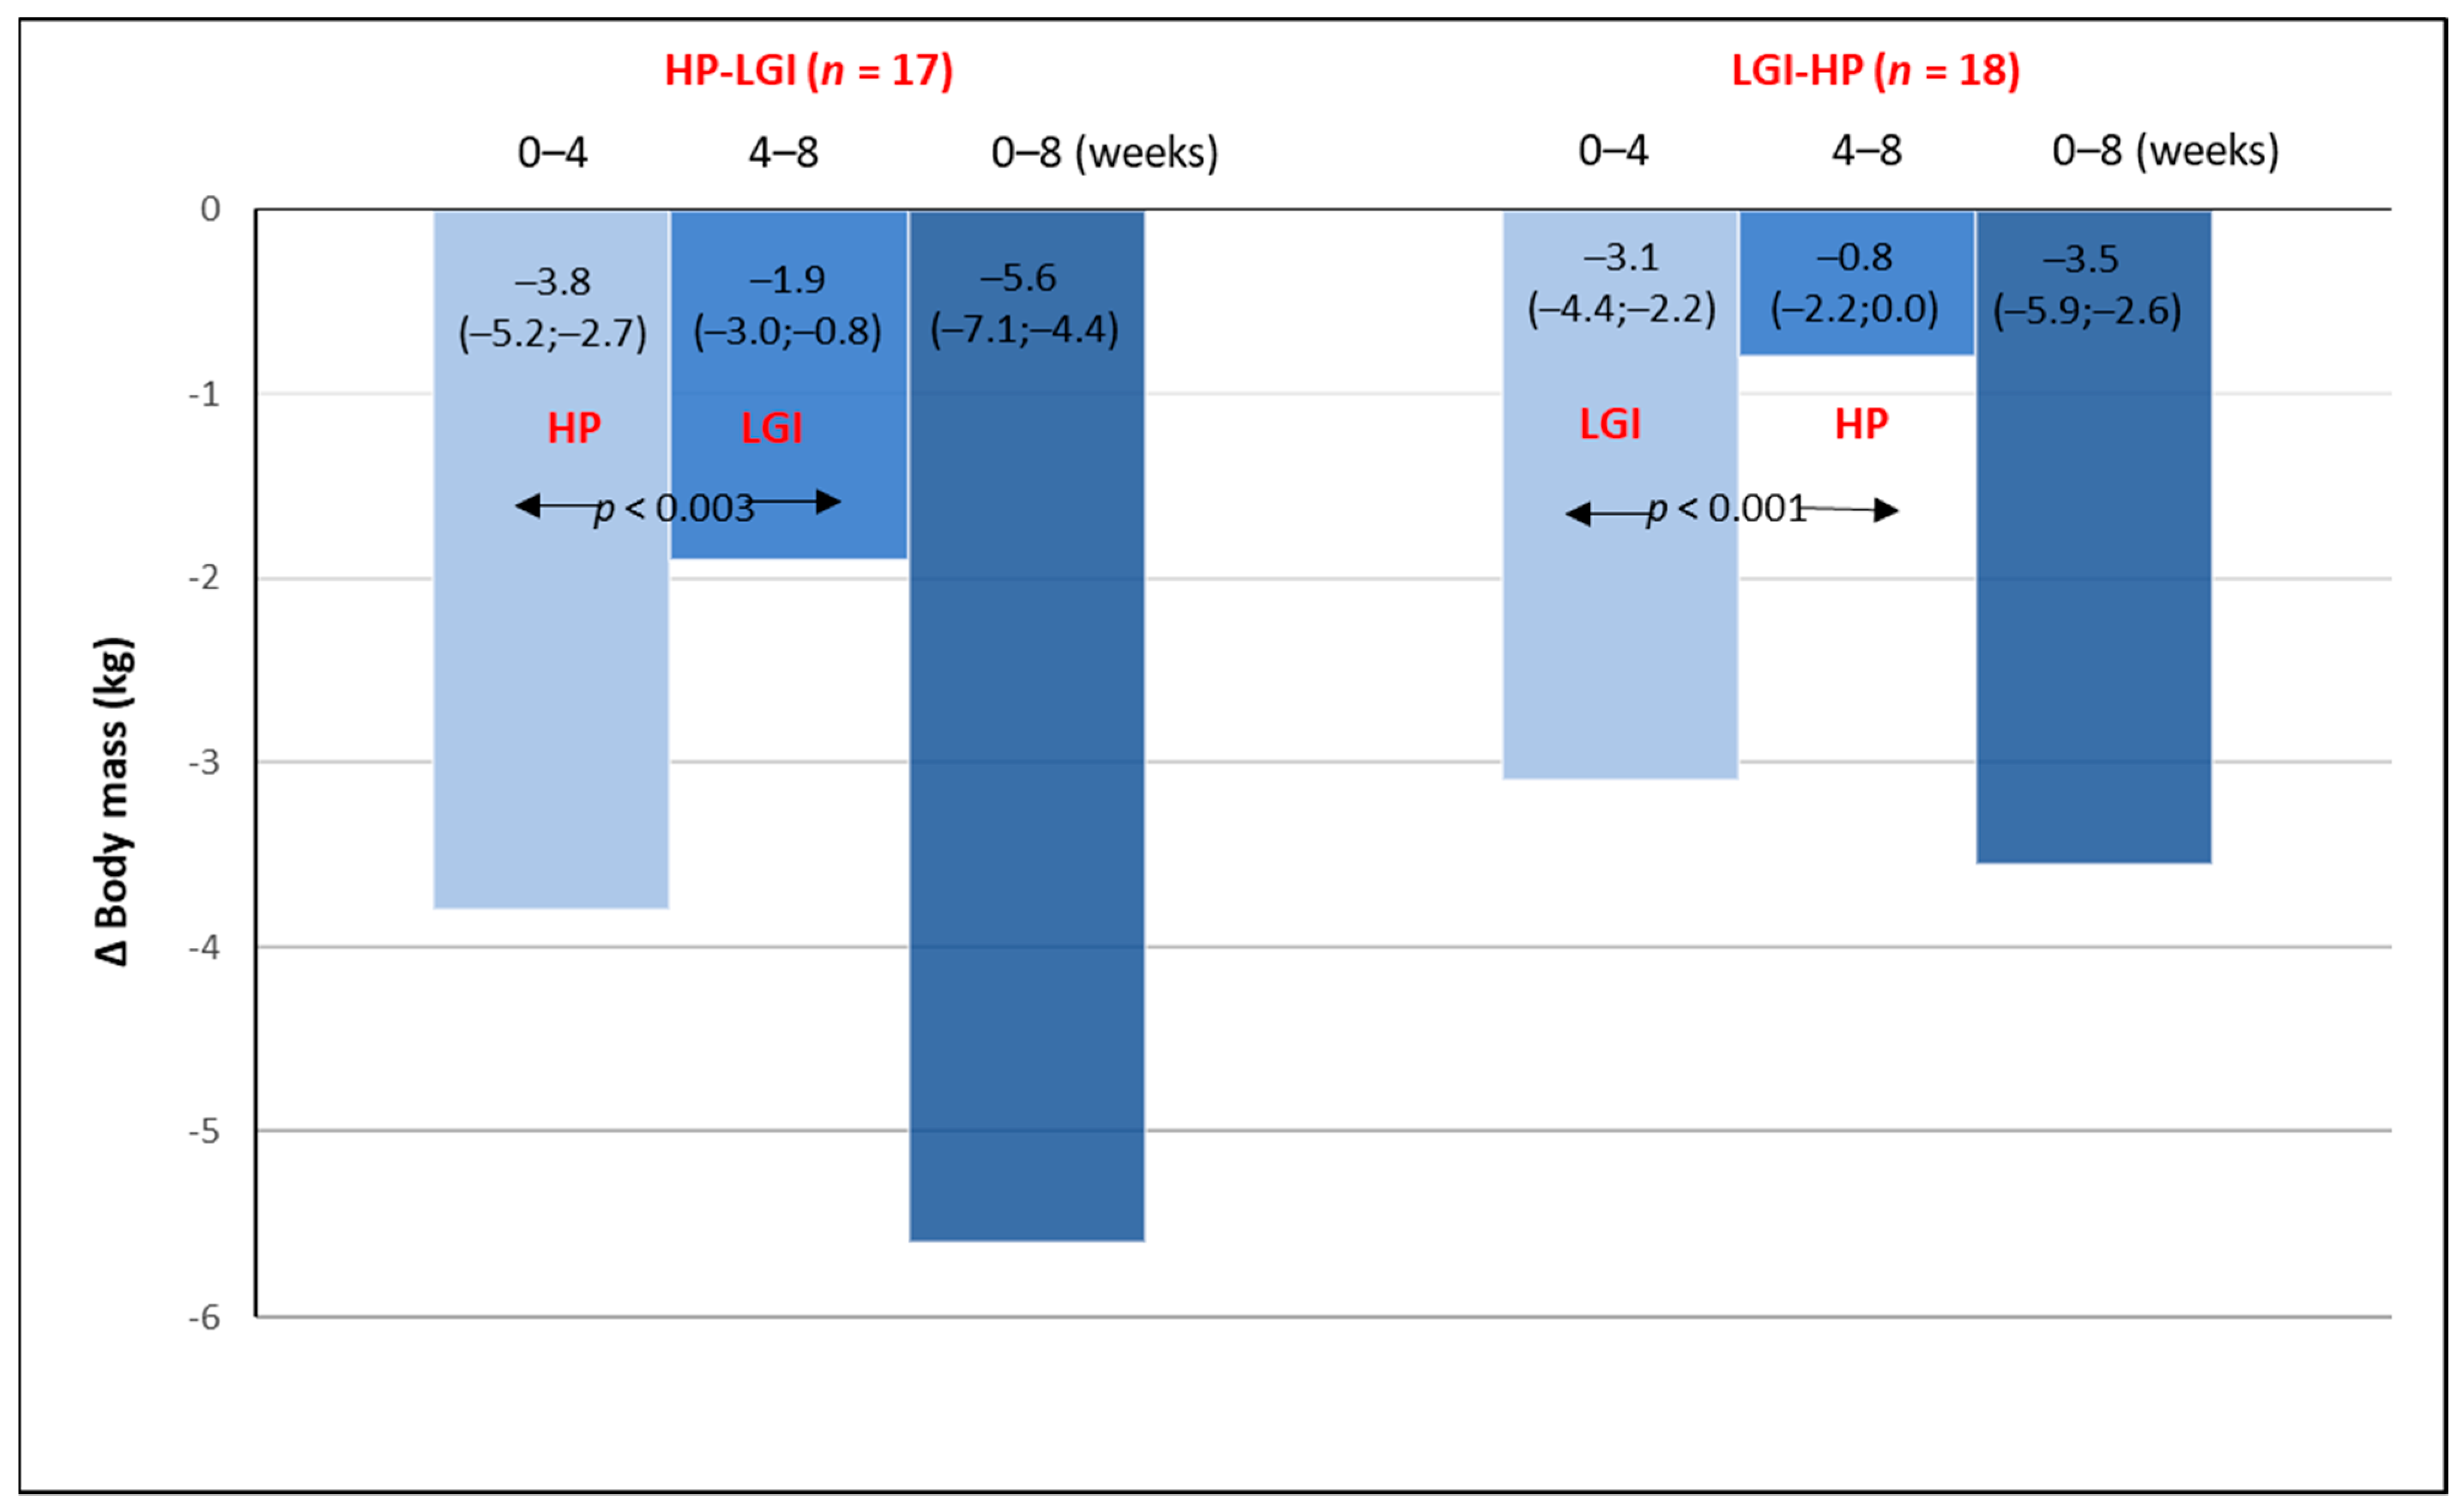
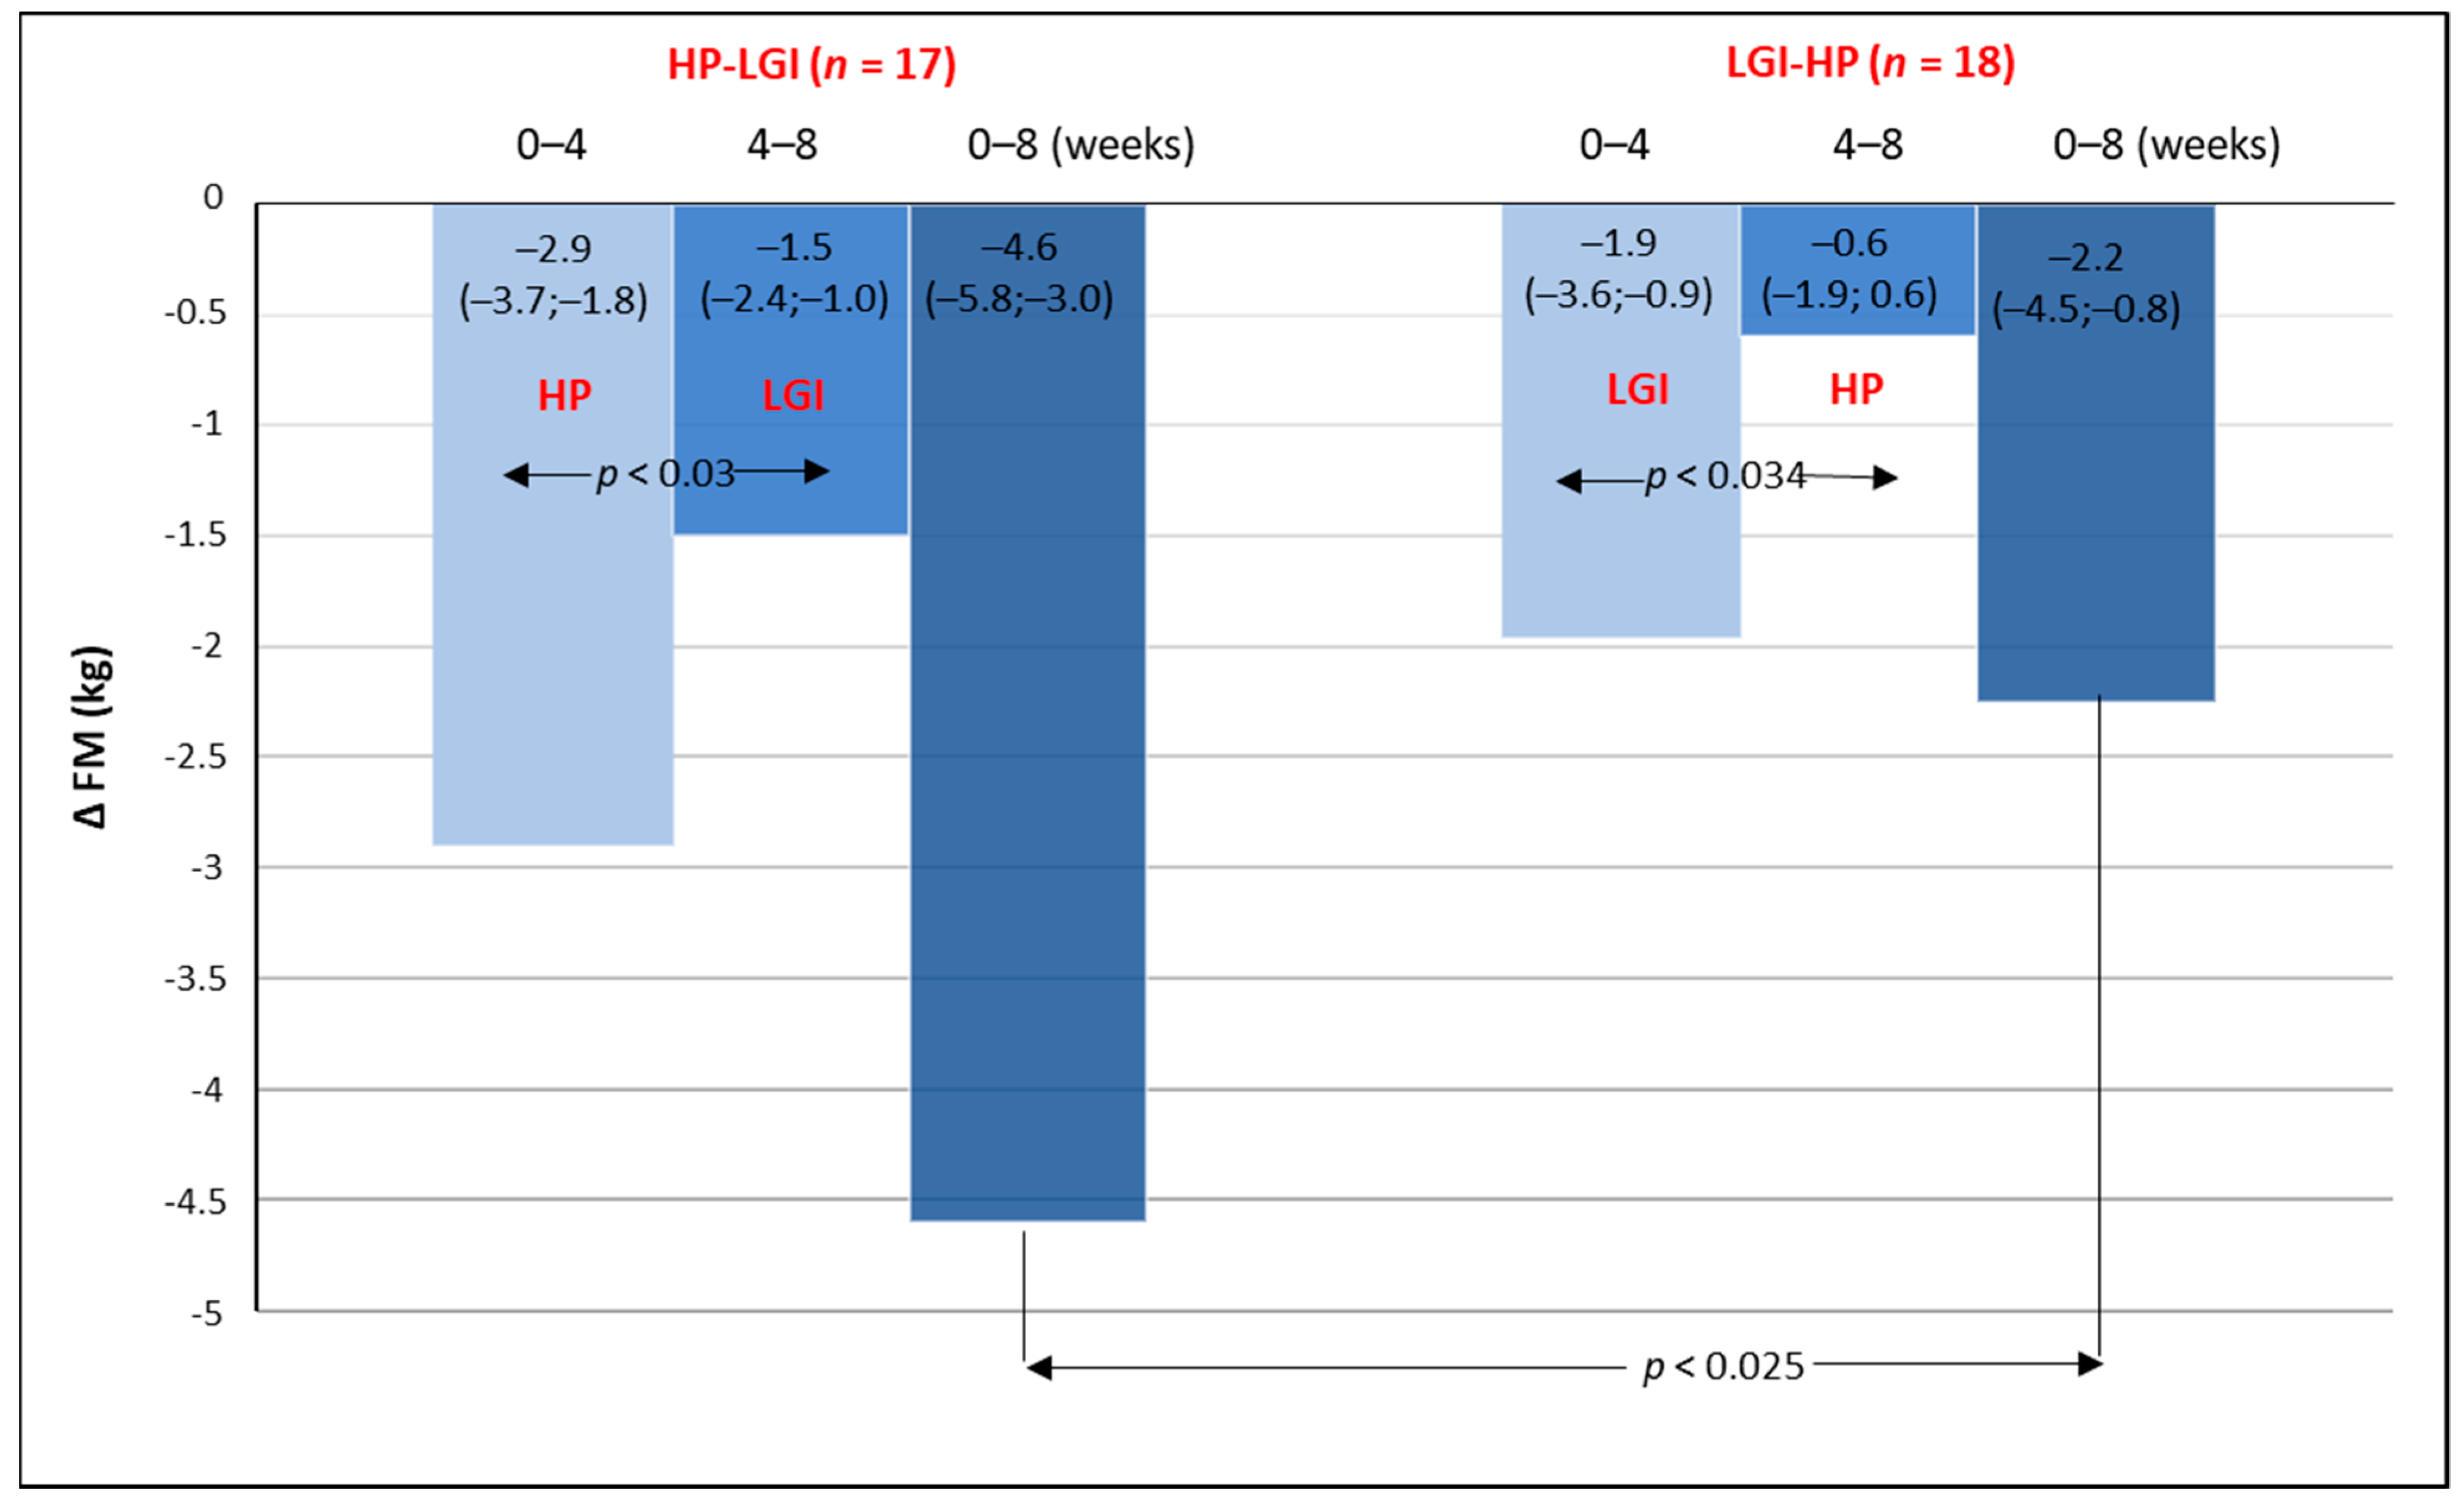
3.1. Body Mass and Body Composition on Energy-Restricted Diets
3.2. Twenty-Four Hour Blood Pressure Monitoring on Energy-Restricted Diets
3.3. The Metabolic Profile on Energy-Restricted Diets
4. Discussion
5. Conclusions
Author Contributions
Funding
Institutional Review Board Statement
Informed Consent Statement
Data Availability Statement
Acknowledgments
Conflicts of Interest
References
- Raynor, H.A.; Champagne, C.M. Position of the Academy of Nutrition and Dietetics: Interventions for the Treatment of Overweight and Obesity in Adults. J. Acad. Nutr. Diet. 2016, 116, 129–147. [Google Scholar] [CrossRef]
- Freire, R. Scientific evidence of diets for weight loss: Different macronutrient composition, intermittent fasting, and popular diets. Nutrition 2020, 69, 110549. [Google Scholar] [CrossRef]
- Yumuk, V.; Tsigos, C.; Fried, M.; Schindler, K.; Busetto, L.; Micic, D.; Toplak, H.; Obesity Management Task Force of the European Association for the Study of Obesity. European Guidelines for Obesity Management in Adults. Obes. Facts 2015, 8, 402–424. [Google Scholar] [CrossRef]
- Institute of Medicine. Dietary Reference Intakes for Energy, Carbohydrate, Fiber, Fat, Fatty Acids, Cholesterol, Protein, and Amino Acids (Macronutrients); The National Academies Press: Washington, DC, USA, 2005. [Google Scholar]
- EFSA Panel on Dietetic Products, Nutrition, and Allergies (NDA). Scientific opinion on dietary reference values for carbohydrates and dietary fibre. EFSA J. 2010, 8, 1462. [Google Scholar]
- EFSA Panel on Dietetic Products, Nutrition, and Allergies (NDA). Scientific opinion on dietary reference values for protein. EFSA J. 2010, 10, 2557. [Google Scholar]
- Brinkworth, G.D.; Noakes, M.; Buckley, J.D.; Keogh, J.B.; Clifton, P.M. Long-term effects of a very-low-carbohydrate weight loss diet compared with an isocaloric low-fat diet after 12 mo. Am. J. Clin. Nutr. 2009, 90, 23–32. [Google Scholar] [CrossRef] [PubMed] [Green Version]
- Zhang, X.; Qin, J.; Zhao, Y.; Shi, J.; Lan, R.; Gan, Y.; Ren, H.; Zhu, B.; Qian, M.; Du, B. Long-term ketogenic diet contributes to glycemic control but promotes lipid accumulation and hepatic steatosis in type 2 diabetic mice. Nutr. Res. 2016, 36, 349–358. [Google Scholar] [CrossRef]
- Soenen, S.; Bonomi, A.G.; Lemmens, S.G.; Scholte, J.; Thijssen, M.A.; van Berkum, F.; Westerterp-Plantenga, M.S. Relatively high-protein or ‘low-carb’ energy-restricted diets for body weight loss and body weight maintenance? Physiol. Behav. 2012, 107, 374–380. [Google Scholar] [CrossRef]
- Papakonstantinou, E.; Triantafillidou, D.; Panagiotakos, D.B.; Koutsovasilis, A.; Saliaris, M.; Manolis, A.; Melidonis, A.; Zampelas, A. A high-protein low-fat diet is more effective in improving blood pressure and triglycerides in calorie-restricted obese individuals with newly diagnosed type 2 diabetes. Eur. J. Clin. Nutr. 2010, 64, 595–602. [Google Scholar] [CrossRef] [PubMed]
- Wycherley, T.P.; Moran, L.J.; Clifton, P.M.; Noakes, M.; Brinkworth, G.D. Effects of energy-restricted high-protein, low-fat compared with standard-protein, low-fat diets: A meta-analysis of randomized controlled trials. Am. J. Clin. Nutr 2012, 96, 1281–1298. [Google Scholar] [CrossRef] [Green Version]
- Damsgaard, C.T.; Papadaki, A.; Jensen, S.M.; Ritz, C.; Dalskov, S.M.; Hlavaty, P.; Saris, W.H.; Martinez, J.A.; Handjieva-Darlenska, T.; Andersen, M.R.; et al. Higher protein diets consumed ad libitum improve cardiovascular risk markers in children of overweight parents from eight European countries. J. Nutr. 2013, 143, 810–817. [Google Scholar] [CrossRef] [PubMed] [Green Version]
- Westerterp-Plantenga, M.S.; Lemmens, S.G.; Westerterp, K.R. Dietary protein—Its role in satiety, energetics, weight loss and health. Br. J. Nutr. 2012, 108, 105–112. [Google Scholar] [CrossRef] [PubMed] [Green Version]
- Pesta, D.H.; Samuel, V.T. A high-protein diet for reducing body fat: Mechanisms and possible caveats. Nutr. Metab. 2014, 11, 53. [Google Scholar] [CrossRef] [Green Version]
- Paddon-Jones, D.; Westman, E.; Mattes, R.D.; Wolfe, R.R.; Astrup, A.; Westerterp-Plantenga, M. Protein, weight management, and satiety. Am. J. Clin. Nutr. 2008, 87, 1558S–1561S. [Google Scholar] [CrossRef] [Green Version]
- Liu, L.; Ikeda, K.; Sullivan, D.H.; Ling, W.; Yamori, Y. Epidemiological evidence of the association between dietary protein intake and blood pressure: A meta-analysis of published data. Hypertens. Res. 2002, 25, 689–695. [Google Scholar] [CrossRef] [Green Version]
- Hall, K.D.; Guo, J. Obesity Energetics: Body weight regulation and the effects of diet composition. Gastroenterology 2017, 152, 1718–1727. [Google Scholar] [CrossRef] [Green Version]
- Morales, F.E.; Tinsley, G.M.; Gordon, P.M. Acute and Long-Term Impact of High-Protein Diets on Endocrine and Metabolic Function, Body Composition, and Exercise-Induced Adaptations. J. Am. Coll. Nutr. 2017, 36, 295–305. [Google Scholar] [CrossRef]
- Sacks, F.M.; Bray, G.A.; Carey, V.J.; Smith, S.R.; Ryan, D.H.; Anton, S.D.; McManus, K.; Champagne, C.M.; Bishop, L.M.; Laranjo, N.; et al. Comparison of weight-loss diets with different compositions of fat, protein, and carbohydrates. N. Engl. J. Med. 2009, 360, 859–873. [Google Scholar] [CrossRef] [Green Version]
- Galgani, J.; Aguirre, C.; Díaz, E. Acute effect of meal glycemic index and glycemic load on blood glucose and insulin responses in humans. Nutr. J. 2006, 5, 22. [Google Scholar] [CrossRef] [PubMed] [Green Version]
- Sigal, R.J.; El-Hashimy, M.; Martin, B.C.; Soeldner, J.S.; Krolewski, A.S.; Warram, J.H. Acute postchallenge hyperinsulinemia predicts weight gain: A prospective study. Diabetes 1997, 46, 1025–1029. [Google Scholar] [CrossRef] [PubMed]
- Kolb, H.; Stumvoll, M.; Kramer, W.; Kempf, K.; Martin, S. Insulin translates unfavourable lifestyle into obesity. BMC Med. 2018, 16, 232. [Google Scholar] [CrossRef] [PubMed] [Green Version]
- Kopp, W. Development of Obesity: The Driver and the Passenger. Diabetes Metab. Syndr. Obes. 2020, 13, 4631–4642. [Google Scholar] [CrossRef]
- Chang, K.T.; Lampe, J.W.; Schwarz, Y.; Breymeyer, K.L.; Noar, K.A.; Song, X.; Neuhouser, M.L. Low glycemic load experimental diet more satiating than high glycemic load diet. Nutr. Cancer. 2012, 64, 666–673. [Google Scholar] [CrossRef] [PubMed] [Green Version]
- Kristensen, M.; Jensen, M.G.; Riboldi, G.; Petronio, M.; Bügel, S.; Toubro, S.; Tetens, I.; Astrup, A. Wholegrain vs. refined wheat bread and pasta. Effect on postprandial glycemia, appetite, and subsequent ad libitum energy intake in young healthy adults. Appetite 2010, 54, 163–169. [Google Scholar] [CrossRef] [PubMed]
- Sloth, B.; Due, A.; Larsen, T.M.; Holst, J.J.; Heding, A.; Astrup, A. The effect of a high-MUFA, low-glycaemic index diet and a low-fat diet on appetite and glucose metabolism during a 6-month weight maintenance period. Br. J. Nutr. 2009, 101, 1846–1858. [Google Scholar] [CrossRef]
- Malin, S.K.; Niemi, N.; Solomon, T.P.; Haus, J.M.; Kelly, K.R.; Filion, J.; Rocco, M.; Kashyap, S.R.; Barkoukis, H.; Kirwan, J.P. Exercise training with weight loss and either a high- or low-glycemic index diet reduces metabolic syndrome severity in older adults. Ann. Nutr. Metab. 2012, 61, 135–141. [Google Scholar] [CrossRef] [Green Version]
- Zafar, M.I.; Mills, K.E.; Zheng, J.; Peng, M.M.; Ye, X.; Chen, L.L. Low glycaemic index diets as an intervention for obesity: A systematic review and meta-analysis. Obes. Rev. 2019, 20, 290–315. [Google Scholar] [CrossRef]
- An, J.; Yoon, S.R.; Lee, J.H.; Kim, H.; Kim, O.Y. Importance of Adherence to Personalized Diet Intervention in Obesity Related Metabolic Improvement in Overweight and Obese Korean Adults. Clin. Nutr. Res. 2019, 8, 171–183. [Google Scholar] [CrossRef]
- Jospe, M.R.; Roy, M.; Brown, R.C.; Haszard, J.J.; Meredith-Jones, K.; Fangupo, L.J.; Osborne, H.; Fleming, E.A.; Taylor, R.W. Intermittent fasting, Paleolithic, or Mediterranean diets in the real world: Exploratory secondary analyses of a weight-loss trial that included choice of diet and exercise. Am. J. Clin. Nutr. 2020, 111, 503–514. [Google Scholar] [CrossRef]
- Dansinger, M.L.; Gleason, J.A.; Griffith, J.L.; Selker, H.P.; Schaefer, E.J. Comparison of the Atkins, Ornish, Weight Watchers, and Zone diets for weight loss and heart disease risk reduction: A randomized trial. JAMA 2005, 293, 43–53. [Google Scholar] [CrossRef]
- Atkinson, F.S.; Foster-Powell, K.; Brand-Miller, J.C. International tables of glycemic index and glycemic load values: 2008. Diabetes Care 2008, 31, 2281–2283. [Google Scholar] [CrossRef] [Green Version]
- Jarosz, M. Nutrition Norms for the Polish Population; Institute of Food and Nutrition: Warsaw, Poland, 2017. [Google Scholar]
- Astrup, A.; Raben, A.; Geiker, N. The role of higher protein diets in weight control and obesity-related comorbidities. Int. J. Obes. 2015, 39, 721–726. [Google Scholar] [CrossRef] [Green Version]
- Stiegler, P.; Cunliffe, A. The role of diet and exercise for the maintenance of fat-free mass and resting metabolic rate during weight loss. Sports Med. 2006, 36, 239–262. [Google Scholar] [CrossRef] [PubMed]
- Wolfe, R.R. The underappreciated role of muscle in health and disease. Am. J. Clin. Nutr. 2006, 84, 475–482. [Google Scholar] [CrossRef] [PubMed]
- Soenen, S.; Martens, E.A.; Hochstenbach-Waelen, A.; Lemmens, S.G.; Westerterp-Plantenga, M.S. Normal protein intake is required for body weight loss and weight maintenance, and elevated protein intake for additional preservation of resting energy expenditure and fat free mass. J. Nutr. 2013, 143, 591–596. [Google Scholar] [CrossRef] [PubMed] [Green Version]
- Oliveira, C.L.P.; Boulé, N.G.; Sharma, A.M.; Elliott, S.; Siervo, M.; Ghosh, S.; Berg, A.; Prado, C.M. Examining the effects of a high-protein total diet replacement on energy metabolism, metabolic blood markers, and appetite sensations in healthy adults: Protocol for two complementary, randomized, controlled, crossover trials. Trials 2019, 20, 787. [Google Scholar] [CrossRef] [PubMed]
- Giacco, R.; Costabile, G.; Della Pepa, G.; Anniballi, G.; Griffo, E.; Mangione, A.; Cipriano, P.; Viscovo, D.; Clemente, G.; Landberg, R.; et al. A whole-grain cereal-based diet lowers postprandial plasma insulin and triglyceride levels in individuals with metabolic syndrome. Nutr. Metab. Cardiovasc. Dis. 2014, 24, 837–844. [Google Scholar] [CrossRef]


| Variable | Total Group n = 35 | HP-LGI Croup n = 17 | LGI-HP Group n = 18 | Statistics |
|---|---|---|---|---|
| Anthropometric Parameters | ||||
| Age (years) | 41.5 ± 11.0 | 40.7 ± 12.7 | 42.1 ± 9.4 | ns |
| Body mass (kg) | 92.9 ± 15.3 | 94.1 ± 13.6 | 91.7 ± 17.1 | ns |
| BMI (kg/m2) | 33.6 ± 4.2 | 33.8 ± 4.0 | 33.4 ± 4.5 | ns |
| WHR | 0.80 ± 0.0 | 0.80 ± 0.0 | 0.80 ± 0.0 | ns |
| FM (kg) | 36.2 ± 8.8 | 37.1 ± 8.5 | 35.4 ± 9.3 | ns |
| FFM (kg) | 56.6 ± 12.6 | 57.0 ± 12.6 | 56.3 ± 12.9 | ns |
| MM (kg) | 52.9 ± 13.9 | 52.2 ± 15.7 | 53.5 ± 12.4 | ns |
| TBW (%) | 44.4 ± 5.2 | 43.9 ± 5.8 | 45.0 ± 6.4 | ns |
| 24 h Blood Pressure | ||||
| SBP (mmHg) | 119 ± 10 | 118 ± 9 | 121 ± 12 | ns |
| DBP (mmHg) | 73 ± 8 | 72 ± 8 | 74 ± 9 | ns |
| MAP (mmHg) | 89 ± 9 | 88 ± 8 | 91 ± 9 | ns |
| Laboratory parameters | ||||
| Glucose (mmol/L) | 5.4 ± 0.5 | 5.3 ± 0.5 | 5.6 ± 0.5 | ns |
| TG (mmol/L) | 1.5 ± 1.0 | 1.5 ± 1.1 | 1.6 ± 0.9 | ns |
| CHOL tot. (mmol/L) | 5.4 ± 1.0 | 5.4 ± 1.2 | 5.4 ± 0.9 | ns |
| LDL (mmol/L) | 3.2 ± 0.9 | 3.3 ± 0.9 | 3.1 ± 0.9 | ns |
| HDL (mmol/L) | 1.6 ± 0.4 | 1.6 ± 0.4 | 1.6 ± 0.3 | ns |
| ALAT (U/L) | 31 ± 23 | 30 ± 29 | 31 ± 18 | ns |
| ASPAT (U/L) * | 20 (16; 24) | 22 (17; 23) | 19 (16; 27) | ns |
| Creatinine (µmol/L) | 53.0 ± 8.8 | 61.9 ± 17.7 | 53.0 ± 8.8 | ns |
| Uric acid (µmol/L) | 309 ± 71 | 303 ± 48 | 315 ± 89 | ns |
| Nutrients Daily Intake | Habitual Diet | LGI Diet | HP Diet | Norms Recommended for the Polish Population [33] |
|---|---|---|---|---|
| Energy intake (KJ) | 7503 ± 2215 | 5134 ± 768 | 5087 ± 966 | Individual, depending on different factors |
| Energy intake (Kcal) | 1792 ± 528 | 1225 ± 184 | 1213 ± 231 | |
| Protein (g) | 82 ± 27 | 74 ± 11 | 91 ± 13 | |
| Protein (%) Protein (g/kg b.m.) | 18 ± 4 0.88 ± 0.3 | 24 ± 3 0.83 ± 0.3 * | 30 ± 4 1.02 ± 0.3 * | 10–20% 0.9 g/kg/b.m. |
| Fat (g) | 78 ± 31 | 42 ± 9 | 42 ± 14 | |
| Fat % | 39 ± 7 | 31 ± 4 | 31 ± 4 | 20–35% |
| Carbohydrates (g) | 192 ± 69 | 137 ± 29 | 118 ± 26 | |
| Carbohydrates% | 43 ± 10 | 45± 5 | 39 ± 3 | 45–67% |
| Fatty acids saturated (g) | 27 ± 10 | 16 ± 6 | 15 ± 6 | not specified |
| Fatty acids monosaturated (g) | 32 ± 14 | 15 ± 4 | 16 ± 5 | |
| Fatty acids polyunsaturated (g) | 12 ± 7 | 8 ± 2 | 8 ± 3 | |
| Cholesterol (mg) | 369 ± 186 | 242 ± 97 | 290 ± 123 | 300 mg/d |
| Variable | HP-LGI Group (n = 17) | LGI-HP Group (n = 18) | Statistics |
|---|---|---|---|
| Body mass (kg) week 0 | 94.1 ± 13.6 | 91.7 ± 17.1 | ns |
| Body mass (kg) week 4 | 90.2 ± 13.1 a | 88.0 ± 16.0 a | ns |
| Body mass (kg) week 8 | 88.1 ± 12.7 a, b | 86.9 ± 15.6 a, b | ns |
| FM (kg) week 0 | 37.1 ± 8.5 | 35.4 ± 9.3 | ns |
| FM (kg) week 4 | 34.2 ± 7.7 a | 33.1 ± 8.9 a | ns |
| FM (kg) week 8 | 32.4 ± 7.9 a, b | 32.3 ± 9.6 | ns |
| FFM (kg) week 0 | 57.0 ± 12.6 | 56.3 ± 12.9 | ns |
| FFM (kg) week 4 | 54.2 ± 15.3 | 54.8 ± 12.1 a | ns |
| FFM (kg) week 8 | 55.7 ± 11.7 a | 54.5 ± 12.7 a | ns |
| MM (kg) week 0 | 52.2 ± 15.7 | 53.5 ± 12.4 | ns |
| MM (kg) week 4 | 53.2 ± 12.0 | 52.0 ± 11.7 a | ns |
| MM (kg) week 8 | 53.0 ± 11.3 | 51.9 ± 12.3 a | ns |
| TBW (%) week 0 | 43.9 ± 5.8 | 45.0 ± 4.6 | ns |
| TBW (%) week 4 | 45.2 ± 5.4 a | 45.6 ± 4.9 | ns |
| TBW (%) week 8 | 46.2 ± 5.2 a, b | 46.0 ± 5.6 c | ns |
| Variable | HP-LGI Group (n = 17) | LGI-HP Group (n = 18) | Statistics |
|---|---|---|---|
| Glucose (mmol/L) week 0 | 5.3 ± 0.5 | 5.6 ± 0.5 | ns |
| Glucose (mmol/L) week 4 | 5.2 ± 0.8 | 5.2 ± 0.4 | ns |
| Glucose (mmol/L) week 8 | 5.4 ± 0.7 | 5.4 ± 0.9 | ns |
| TG (mmol/L) week 0 | 1.5 ± 1.1 | 1.6 ± 0.9 | ns |
| TG * (mmol/L) week 4 | 0.8 (0.7; 1.2) | 1.5 ± 1.3 | ns |
| TG (mmol/L) week 8 | 1.1 ± 0.3 | 1.5 ± 0.9 | ns |
| CHOL. total (mmol/L) week 0 | 5.4 ± 1.2 | 5.4 ± 0.9 | ns |
| CHOL. total. (mmol/L) week 4 | 4.9 ± 1.3 a | 5.0 ± 1.0 a | ns |
| CHOL. total (mmol/L) week 8 | 5.0 ± 1.3 | 5.1 ± 1.1 a | ns |
| LDL (mmol/L) week 0 | 3.3 ± 0.9 | 3.1 ± 0.9 | ns |
| LDL (mmol/L) week 4 | 2.8 ± 0.8 a | 2.9 ± 0.3 | ns |
| LDL (mmol/L) week 8 | 3.0 ± 1.0 b | 2.9 ± 0.3 | ns |
| HDL (mmol/L) week 0 | 1.6 ± 0.4 | 1.6 ± 0.3 | ns |
| HDL (mmol/L) week 4 | 1.5 ± 0.5 | 1.5 ± 0.3 | ns |
| HDL (mmol/L) week 8 | 1.5 ± 0.4 | 1.6 ± 0.3 | ns |
| ALAT (U/L) week 0 | 30 ± 29 | 31 ± 18 | ns |
| ALAT (U/L) week 4 | 29 ± 19 | 26 ± 13 | ns |
| ALAT * (U/L) week 8 | 19 (16; 29) | 27 ± 15 | ns |
| ASPAT * (U/L) week 0 | 22 (17; 23) | 19 (16; 27) | ns |
| ASPAT * (U/L) week 4 | 23 (20; 26) | 20 ± 5 | ns |
| ASPAT * (U/L) week 8 | 20 (16; 25) | 20 ± 5 | ns |
| Creatinine (µmol/L) week 0 | 61.9 ± 17.7 | 53.0 ± 8.8 | ns |
| Creatinine (µmol/L) week 4 | 61.9 ± 17.7 | 53.0 ± 8.8 | ns |
| Creatinine (µmol/L) week 8 | 61.9 ± 3.5 | 53.0 ± 3.5 | ns |
| Uric acid (µmol/L) week 0 | 303 ± 48 | 315 ± 89 | ns |
| Uric acid * (µmol/L) week 4 | 291 (243; 321) | 303 (262; 381) a’ | ns |
| Uric acid * (µmol/L) week 8 | 303 ± 54 | 268 ± 83 b’ | ns |
Publisher’s Note: MDPI stays neutral with regard to jurisdictional claims in published maps and institutional affiliations. |
© 2021 by the authors. Licensee MDPI, Basel, Switzerland. This article is an open access article distributed under the terms and conditions of the Creative Commons Attribution (CC BY) license (http://creativecommons.org/licenses/by/4.0/).
Share and Cite
Waliłko, E.; Napierała, M.; Bryśkiewicz, M.; Fronczyk, A.; Majkowska, L. High-Protein or Low Glycemic Index Diet—Which Energy-Restricted Diet Is Better to Start a Weight Loss Program? Nutrients 2021, 13, 1086. https://0-doi-org.brum.beds.ac.uk/10.3390/nu13041086
Waliłko E, Napierała M, Bryśkiewicz M, Fronczyk A, Majkowska L. High-Protein or Low Glycemic Index Diet—Which Energy-Restricted Diet Is Better to Start a Weight Loss Program? Nutrients. 2021; 13(4):1086. https://0-doi-org.brum.beds.ac.uk/10.3390/nu13041086
Chicago/Turabian StyleWaliłko, Ewa, Małgorzata Napierała, Marta Bryśkiewicz, Aneta Fronczyk, and Liliana Majkowska. 2021. "High-Protein or Low Glycemic Index Diet—Which Energy-Restricted Diet Is Better to Start a Weight Loss Program?" Nutrients 13, no. 4: 1086. https://0-doi-org.brum.beds.ac.uk/10.3390/nu13041086