Article

Roles of Nutrient Limitation on Western Lake Erie CyanoHAB Toxin Production

1
Institute of Marine Sciences, University of North Carolina at Chapel Hill, Morehead City, NC 28557, USA
2
Stone Laboratory and Ohio Sea Grant, The Ohio State University, Put-In-Bay, OH 43456, USA
3
Department of Chemistry, State University of New York College of Environmental Science and Forestry Campus, Syracuse, NY 13210, USA
4
Department of Microbiology, University of Tennessee at Knoxville, Knoxville, TN 37996, USA
5
Department of Biological Sciences, Bowling Green State University, Bowling Green, OH 43403, USA
6
Lake Erie Center, University of Toledo, Oregon, OH 43616, USA
7
Key Laboratory of Integrated Regulation and Resource Development on Shallow Lakes, Ministry of Education, College of Environment, Hohai University, Nanjing 210098, China
*
Authors to whom correspondence should be addressed.
Submission received: 10 December 2020 / Revised: 4 January 2021 / Accepted: 6 January 2021 / Published: 9 January 2021

Abstract

:
Cyanobacterial harmful algal bloom (CyanoHAB) proliferation is a global problem impacting ecosystem and human health. Western Lake Erie (WLE) typically endures two highly toxic CyanoHABs during summer: a Microcystis spp. bloom in Maumee Bay that extends throughout the western basin, and a Planktothrix spp. bloom in Sandusky Bay. Recently, the USA and Canada agreed to a 40% phosphorus (P) load reduction to lessen the severity of the WLE blooms. To investigate phosphorus and nitrogen (N) limitation of biomass and toxin production in WLE CyanoHABs, we conducted in situ nutrient addition and 40% dilution microcosm bioassays in June and August 2019. During the June Sandusky Bay bloom, biomass production as well as hepatotoxic microcystin and neurotoxic anatoxin production were N and P co-limited with microcystin production becoming nutrient deplete under 40% dilution. During August, the Maumee Bay bloom produced microcystin under nutrient repletion with slight induced P limitation under 40% dilution, and the Sandusky Bay bloom produced anatoxin under N limitation in both dilution treatments. The results demonstrate the importance of nutrient limitation effects on microcystin and anatoxin production. To properly combat cyanotoxin and cyanobacterial biomass production in WLE, both N and P reduction efforts should be implemented in its watershed.
Key Contribution: Nutrient limitation of cyanobacterial harmful algal blooms (CyanoHABs) was investigated with respect to the production of the cyanotoxins microcystin and anatoxin in Maumee Bay and Sandusky Bay in Western Lake Erie. This is one of the first studies investigating nutrient limitation effects on anatoxin production in Lake Erie and one of the first studies to evaluate the effects of nutrient reduction on Western Lake Erie CyanoHABs using nutrient dilution assays. To reduce CyanoHABs and their toxicity, both N and P reductions are needed in the Western Lake Erie watershed.

1. Introduction

Freshwater ecosystems are critical for sustaining life and supporting civilizations throughout history [1]. As the global human population grows, increased urbanization, agricultural and industrial productions, combined with insufficient wastewater treatment practices, have led to a widespread increase in nutrient pollution of these ecosystems, threatening clean and safe water supplies [2]. Excessive inputs of nitrogen (N) and phosphorus (P) have accelerated eutrophication, the process of increasing organic enrichment, which is largely attributable to increased microalgal and aquatic macrophyte growth [3]. The major detrimental impacts of eutrophication include harmful algal bloom (HAB) formation, decreased water transparency (increased turbidity), O2 depletion, and reduced biodiversity [3,4]. HAB formation has been a major water quality issue in the U.S. since the 1960s, as noted in a 1965 White House Report indicating HABs as a major source of environmental degradation [5]. Furthermore, nutrient-driven eutrophication of lakes and rivers is one the most significant causes of water quality decline globally [3,6,7,8]. In particular, there are growing concerns about the proliferation and diversification of N- and P-based fertilizers, as they are potent stimulants of aquatic primary production along the freshwater to marine continuum [9,10]. Additionally, climate change (e.g., warming and changing precipitation patterns) is increasing the likelihood of more expansive blooms, exposing human and animal populations (e.g., pets, wildlife, cattle, fish, birds) to water-borne and aerosolized toxins [7,11,12,13,14]. Despite CyanoHAB toxicity being a major human and ecosystem health hazard, the causes and controls of underlying toxicity mechanisms remain poorly understood [15].
Blooms of cyanobacteria in Lake Erie, largely dominated by filamentous heterocystous (N2-fixing) forms (Anabaena/Dolichospermum, Aphanizomenon), were common in the late 1950s through to the 1970s. These blooms dissipated following the signing in of the Great Lakes Water Quality Agreement of 1972, which was updated in 2012. However, the blooms returned as non-N2 fixing Microcystis blooms in the early 2000s, which have continued and perhaps worsened [16,17], leading to major environmental degradation and increased human health risks [7]. In August 2014, a toxic Microcystis spp. bloom in Western Lake Erie (WLE) created a water crisis, forcing public water supplies to be shut down for over 400,000 people in Toledo, OH, USA [7,18]. Nutrient runoff from agricultural nonpoint sources has been a major factor promoting CyanoHABs in WLE [7]. Primary production in Maumee Bay of Lake Erie (largely dominated by Microcystis spp. in the summer) shifts from P-limitation to N-limitation with spatial nutrient limitation heterogeneity with N- and P-limitation occurring several km apart [19,20,21]. Prior studies revealed that during the summer months, N was often depleted in embayments such as Sandusky and Maumee Bay [22,23,24,25,26], where summertime molar N:P ratios for Sandusky Bay remained below the canonical Redfield ratio (16:1) [26,27,28]. This suggests the presence of strong N sinks, mediated by denitrification and/or active N cycling and N uptake by high amounts of algal biomass [28,29,30]. The primary fertilizers used in the agriculturally dominated drainage basin of Lake Erie are inorganic fertilizers (ammonium nitrate, urea, and phosphate) and manure, which has low N:P ratios (~5:1), is about 20% [31,32,33,34]. There is an urgent need to determine the linkage between different bioreactive forms of N and P and the promotion of toxic CyanoHABs, to establish the necessary reduction in these nutrient forms to ensure the security of surface potable water. Nutrient reduction will likely need to be even greater as climate change increases the N and P reduction thresholds required for CyanoHAB mitigation [35,36]. The in situ bioassay-based study reported here is among the first to use an experimental approach to investigate the response of a natural CyanoHAB community dominated by either Microcystis (Maumee Bay) or Planktothrix (Sandusky Bay) to actual reductions in N, P or both, under natural conditions in Lake Erie. Satellite and field images of the 2019 WLE blooms can be seen in Figure 1.
A recent review suggested that management efforts to reduce P pollution without controlling N inputs have caused nutrient imbalances in eutrophic systems, which may favor toxic CyanoHABs incapable of fixing atmospheric N2 gas, i.e., requiring combined N sources [24]. Prior to P load reductions in the 1970s, CyanoHABs in Lake Erie were mostly the N2-fixers Aphanizomenon and Dolichospermum, formerly Anabaena [38]; now, CyanoHABs are primarily non-N2-fixing Microcystis and Planktothrix [16]. In WLE, molecular analysis of the Microcystis community indicates a shift from toxic to non-toxic strains that correlates with NO3 availability [39], although there appears to be a temporal disconnect as a multiyear analysis found no correlation between the proportion of microcystin-producing genotypes of Microcystis and the concentration of microcystin [40]. Recent work has strengthened links between N availability, dominant strain shifts, and toxicity by showing seasonal trends in these patterns [24]. The inability of these cyanobacteria to fix atmospheric N2, and their strong affinity for reduced N forms (e.g., NH4 and urea), suggests that N delivered through agricultural runoff and internal N recycling mechanisms play critical roles in modulating total phytoplankton biomass, CyanoHAB community composition, and toxicity [39,41].
The prominent cyanotoxins, microcystin and anatoxin, have molecular structures containing N, suggesting that their syntheses may be linked to N availability; hence, there is a need to investigate the potential roles N fertilizers (i.e., NH4, NO3, and urea) play in bloom dynamics and toxin production in Lake Erie [23,36,42]. A recent study showed that there are N concentration reduction thresholds at which bloom microcystin levels will decrease, leading to further evidence that N limitation may play a role in controlling cyanotoxin production in the WLE blooms [41]. Due to the shift to non-N2-fixing CyanoHABs, a major unknown concerning this shift in nutrient limitation is how specific microcystin and anatoxin production potentials are linked to nutrient input reductions.
The US Environmental Protection Agency (EPA) and Environment and Climate Change Canada have recommended a 40% reduction in springtime P loading into WLE to help control the blooms [43,44,45,46]. The 40% P load reduction was the result of a multiple modeling exercise included in the Great Lakes Water Quality Agreement between the US and Canada [47]. As both N and P have been shown to influence the WLE CyanoHABs, it is crucial to investigate the effects of both 40% reductions in both N and P in addition to the investigations of the effects of N and P addition. Here, we addressed the following questions: (1) how do nutrients influence WLE microcystin and anatoxin production? (2) Do the same nutrients limit toxin production and CyanoHAB biomass? (3) Will the 40% P reduction as recommended by the US EPA be effective in reducing CyanoHAB microcystin and anatoxin and biomass production in WLE? (4) Is P reduction alone enough to decrease WLE CyanoHAB biomass and microcystin and anatoxin production, or is a combined N and P reduction strategy needed? Given the relatively high content of N in the cyanotoxins microcystin and anatoxin, we predicted that cyanotoxin production is N-limited and that excessive N inputs promote toxicity of these non-N2-fixing CyanoHABs.

2. Results

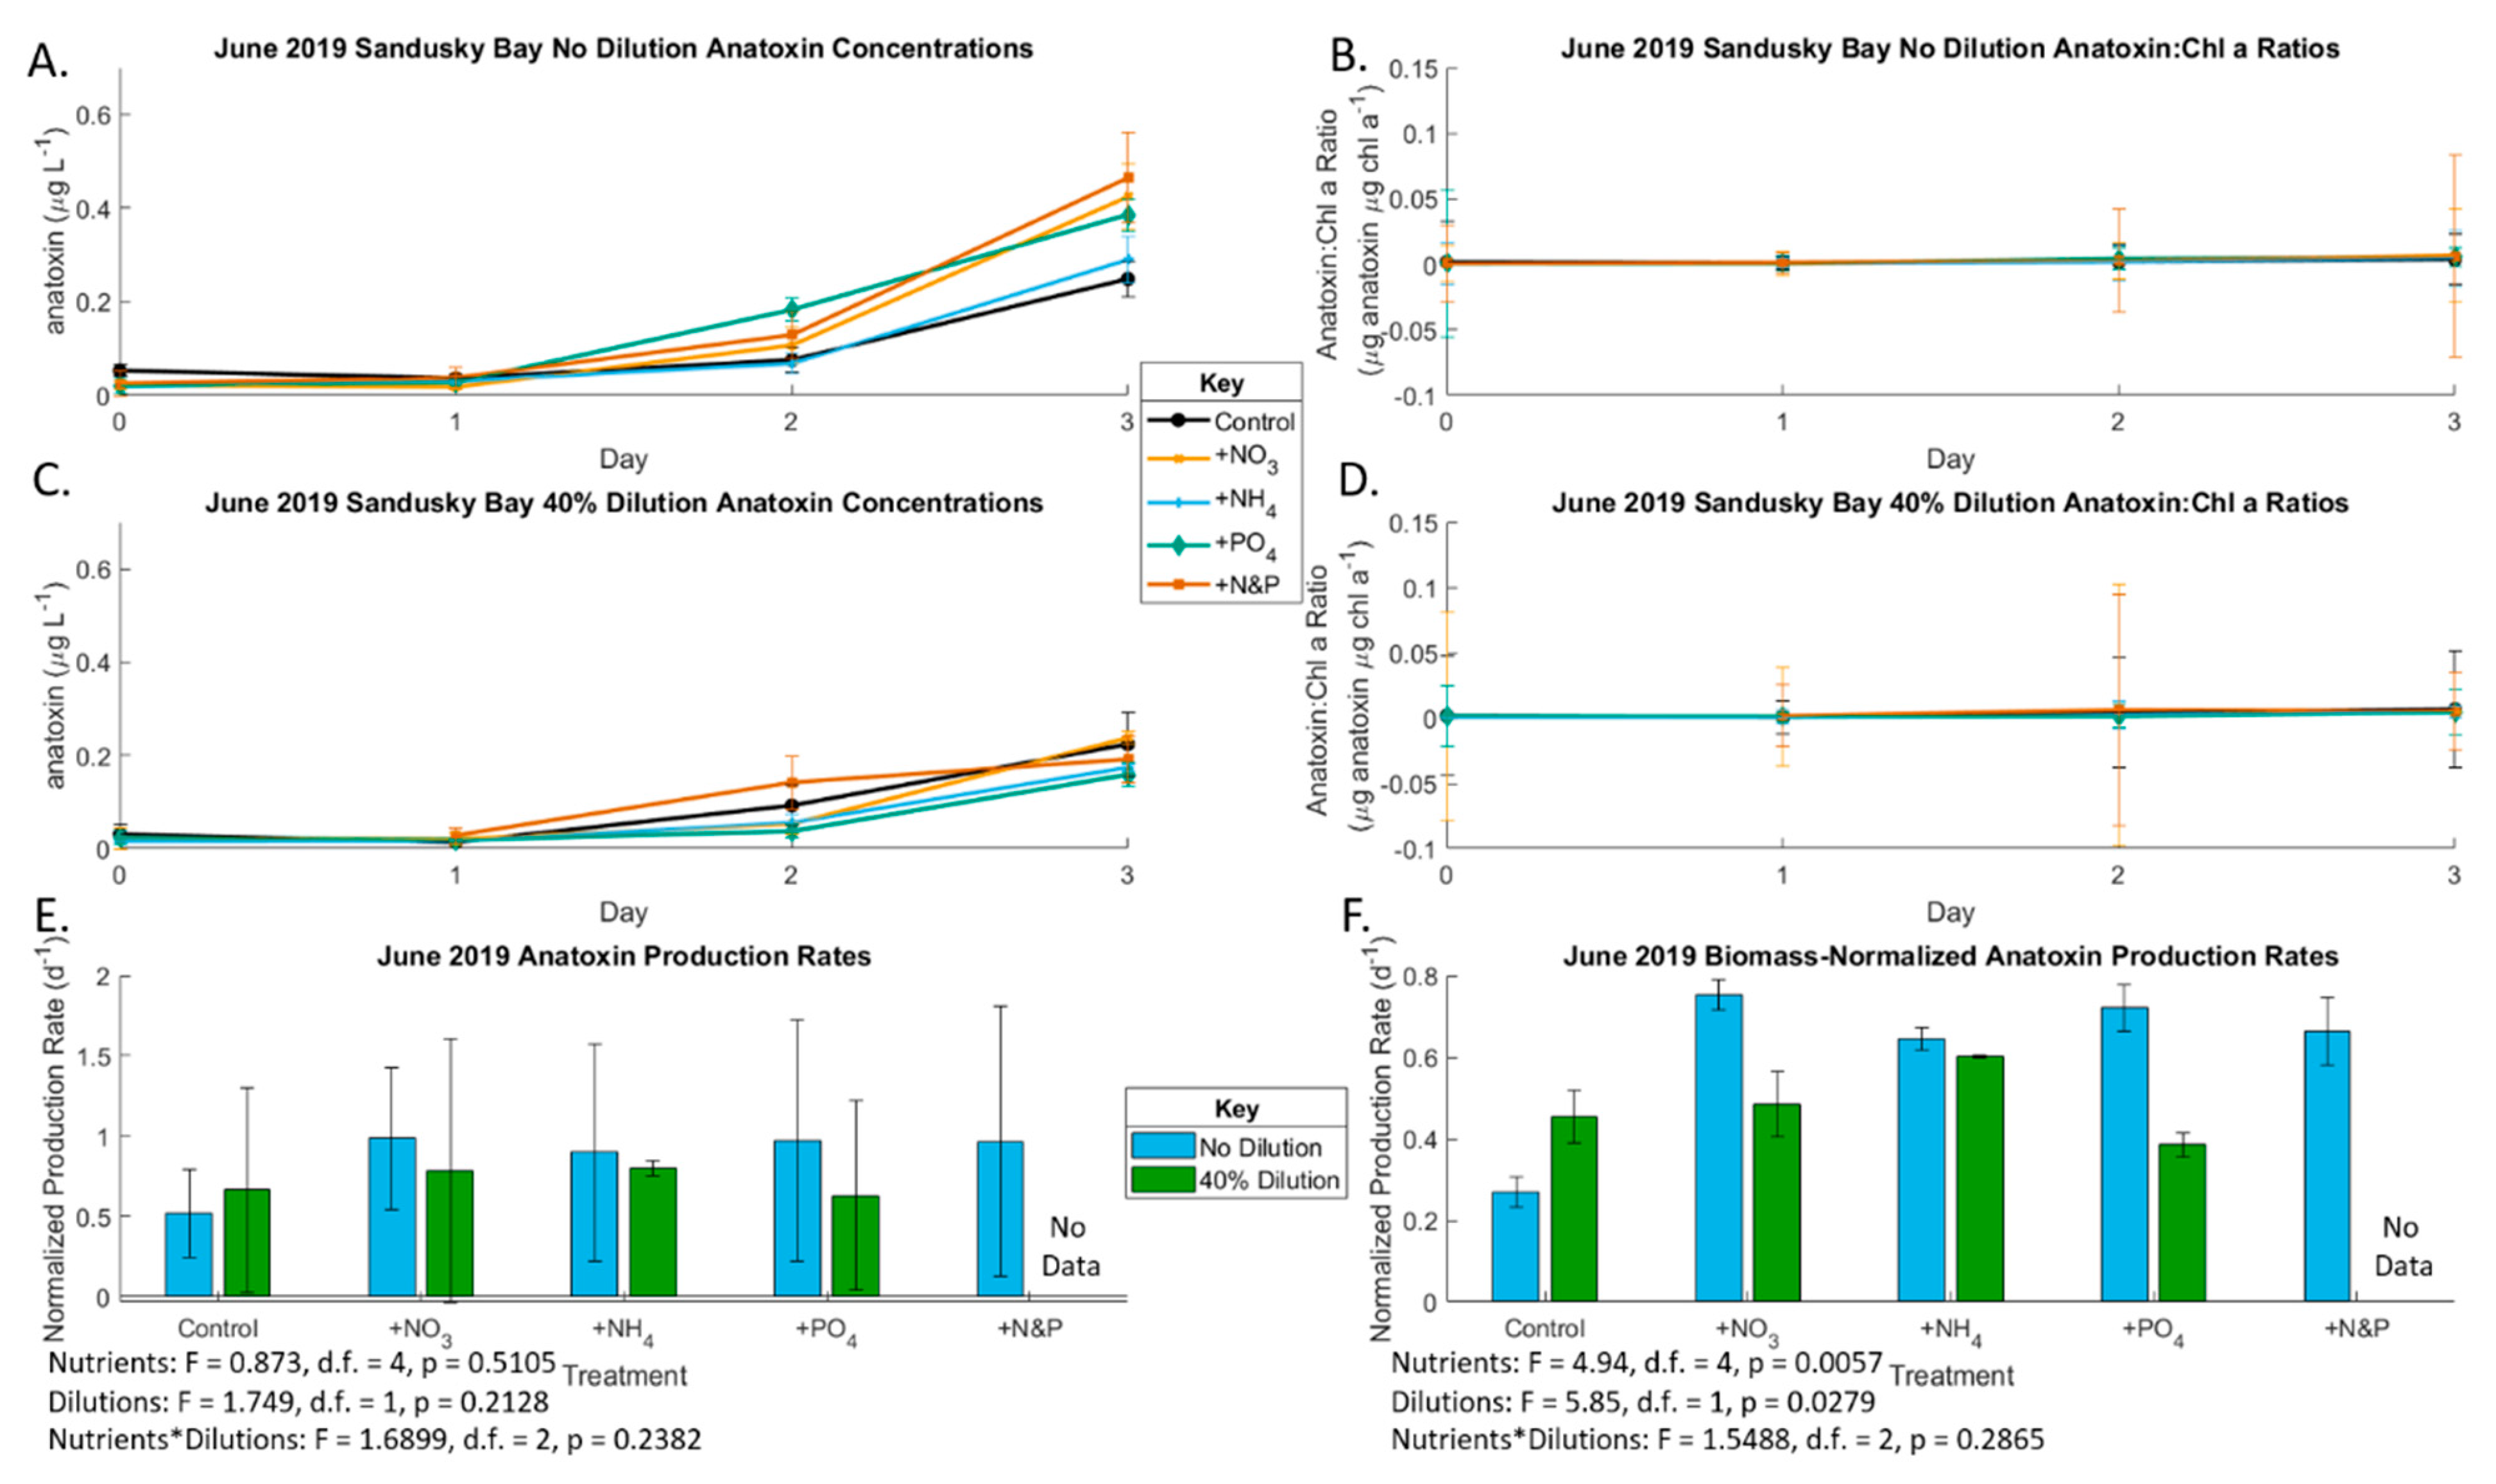
2.1. June 2019 Experiement

June 2019 bioassay experiments were characterized by a late spring diatom bloom shortly before the onset of a summer Microcystis bloom in Maumee Bay and the very early Planktothrix bloom in Sandusky Bay. In both Maumee and Sandusky Bays, there were high N concentrations—over 200 µmol L−1 nitrate plus nitrite in Maumee Bay and over 100 µmol L−1 nitrate plus nitrite in Sandusky Bay and relatively low P concentrations of 1–2 µmol L−1 dissolved reactive phosphorus (DRP) (Table 1).
In the June Maumee Bay experiment, growth rates significantly differed (p < 0.001) among nutrient treatments, but there was no difference between the undiluted and diluted treatments (p = 0.76). The +P and +P&N treatments resulted in a higher growth rate than the control and +N treatments, indicating P-limited growth, in both the undiluted and 40% dilution treatments, likely due to the high concentrations of N in the bay (Figure 2; Table 1, Tables S1 and S2). Cyanotoxins were not detected in the June Maumee Bay experiment.
In the June Sandusky Bay experiment, nutrient enrichment did not impact growth rates (p = 0.68), but growth rates were lower in the 40% diluted treatments (p = 0.013); Figure 2; Tables S1 and S2), which indicates nutrient-replete conditions. The initial undiluted total microcystin concentration was 0.136 µg/L and total anatoxin concentration was 0.053 µg/L (Tables S3 and S5). Microcystin concentrations increased throughout the experiment in the no dilution treatments but not the 40% dilution (Figure 3). The Sandusky Bay microcystin production rate was slightly yet not significantly affected by nutrient enrichment (p = 0.067), becoming significant in the biomass-normalized analyses (p < 0.001). However, the production rate was lower in the 40% diluted treatments (Figure 3 and Tables S3—S6). The June 2019 Sandusky Bay anatoxin production rate was not affected by dilution treatment with a slight nutrient effect in the biomass-normalized analyses (p < 0.01) (Figure 4).

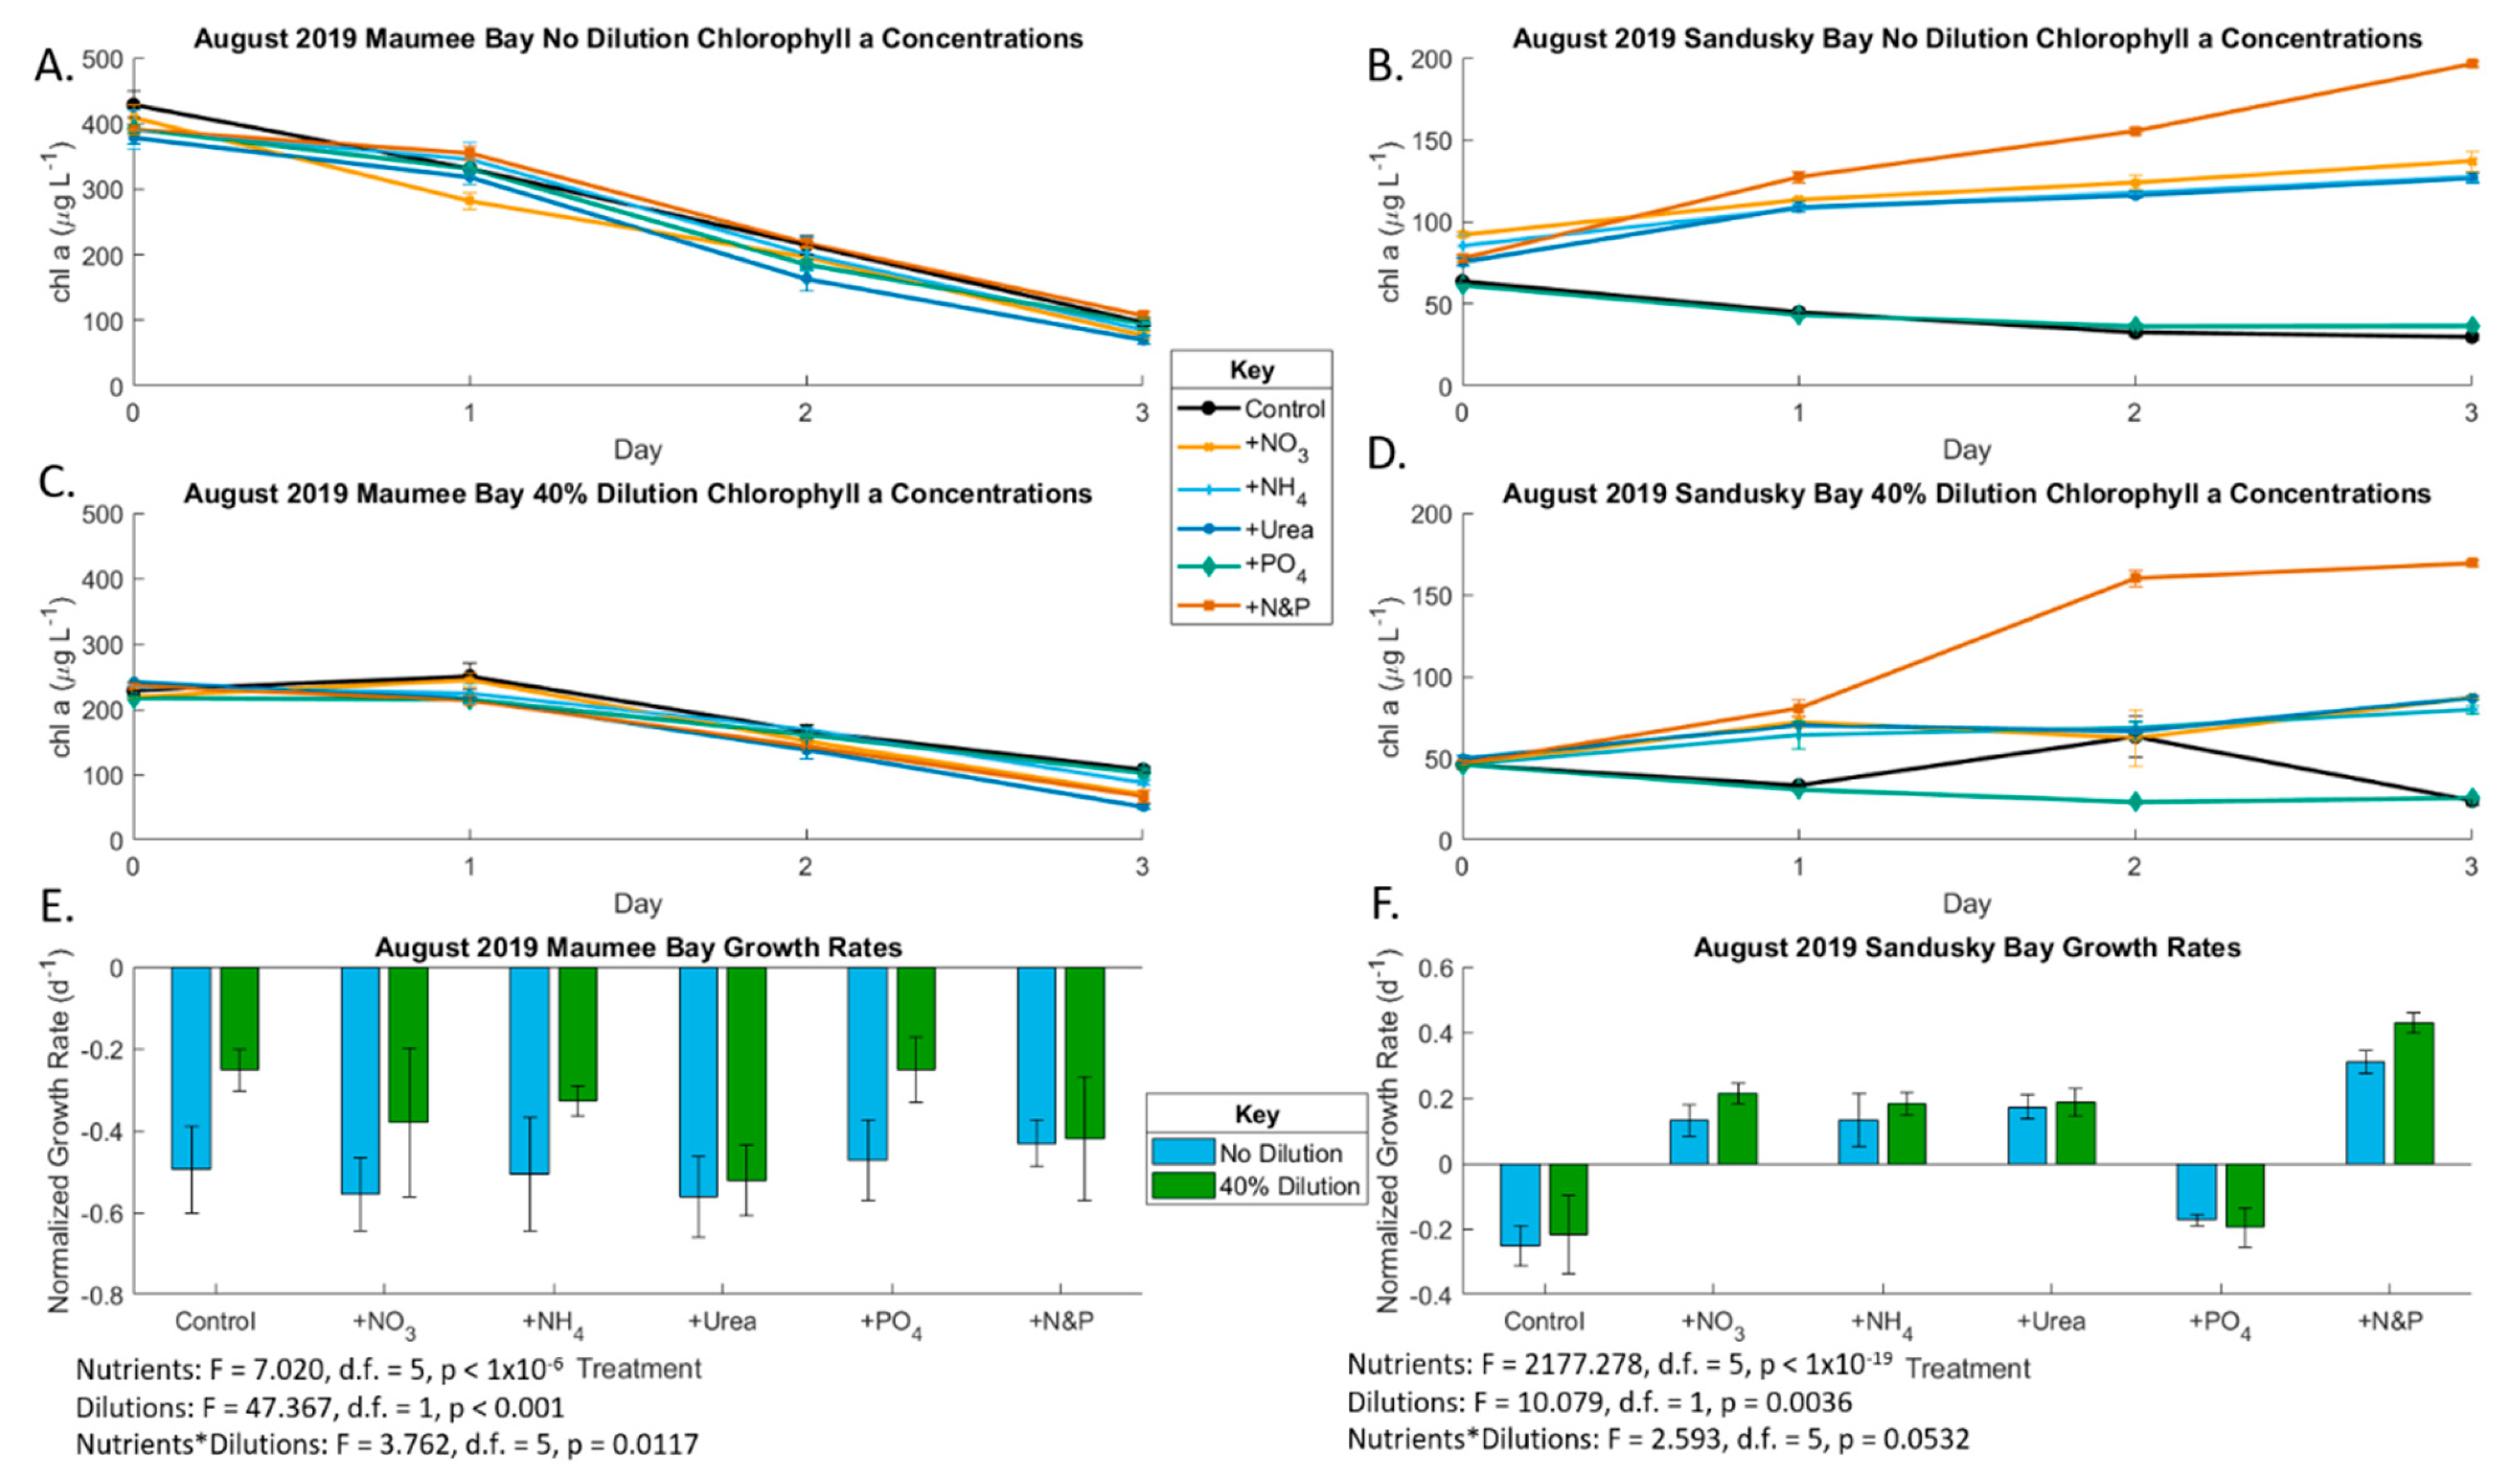
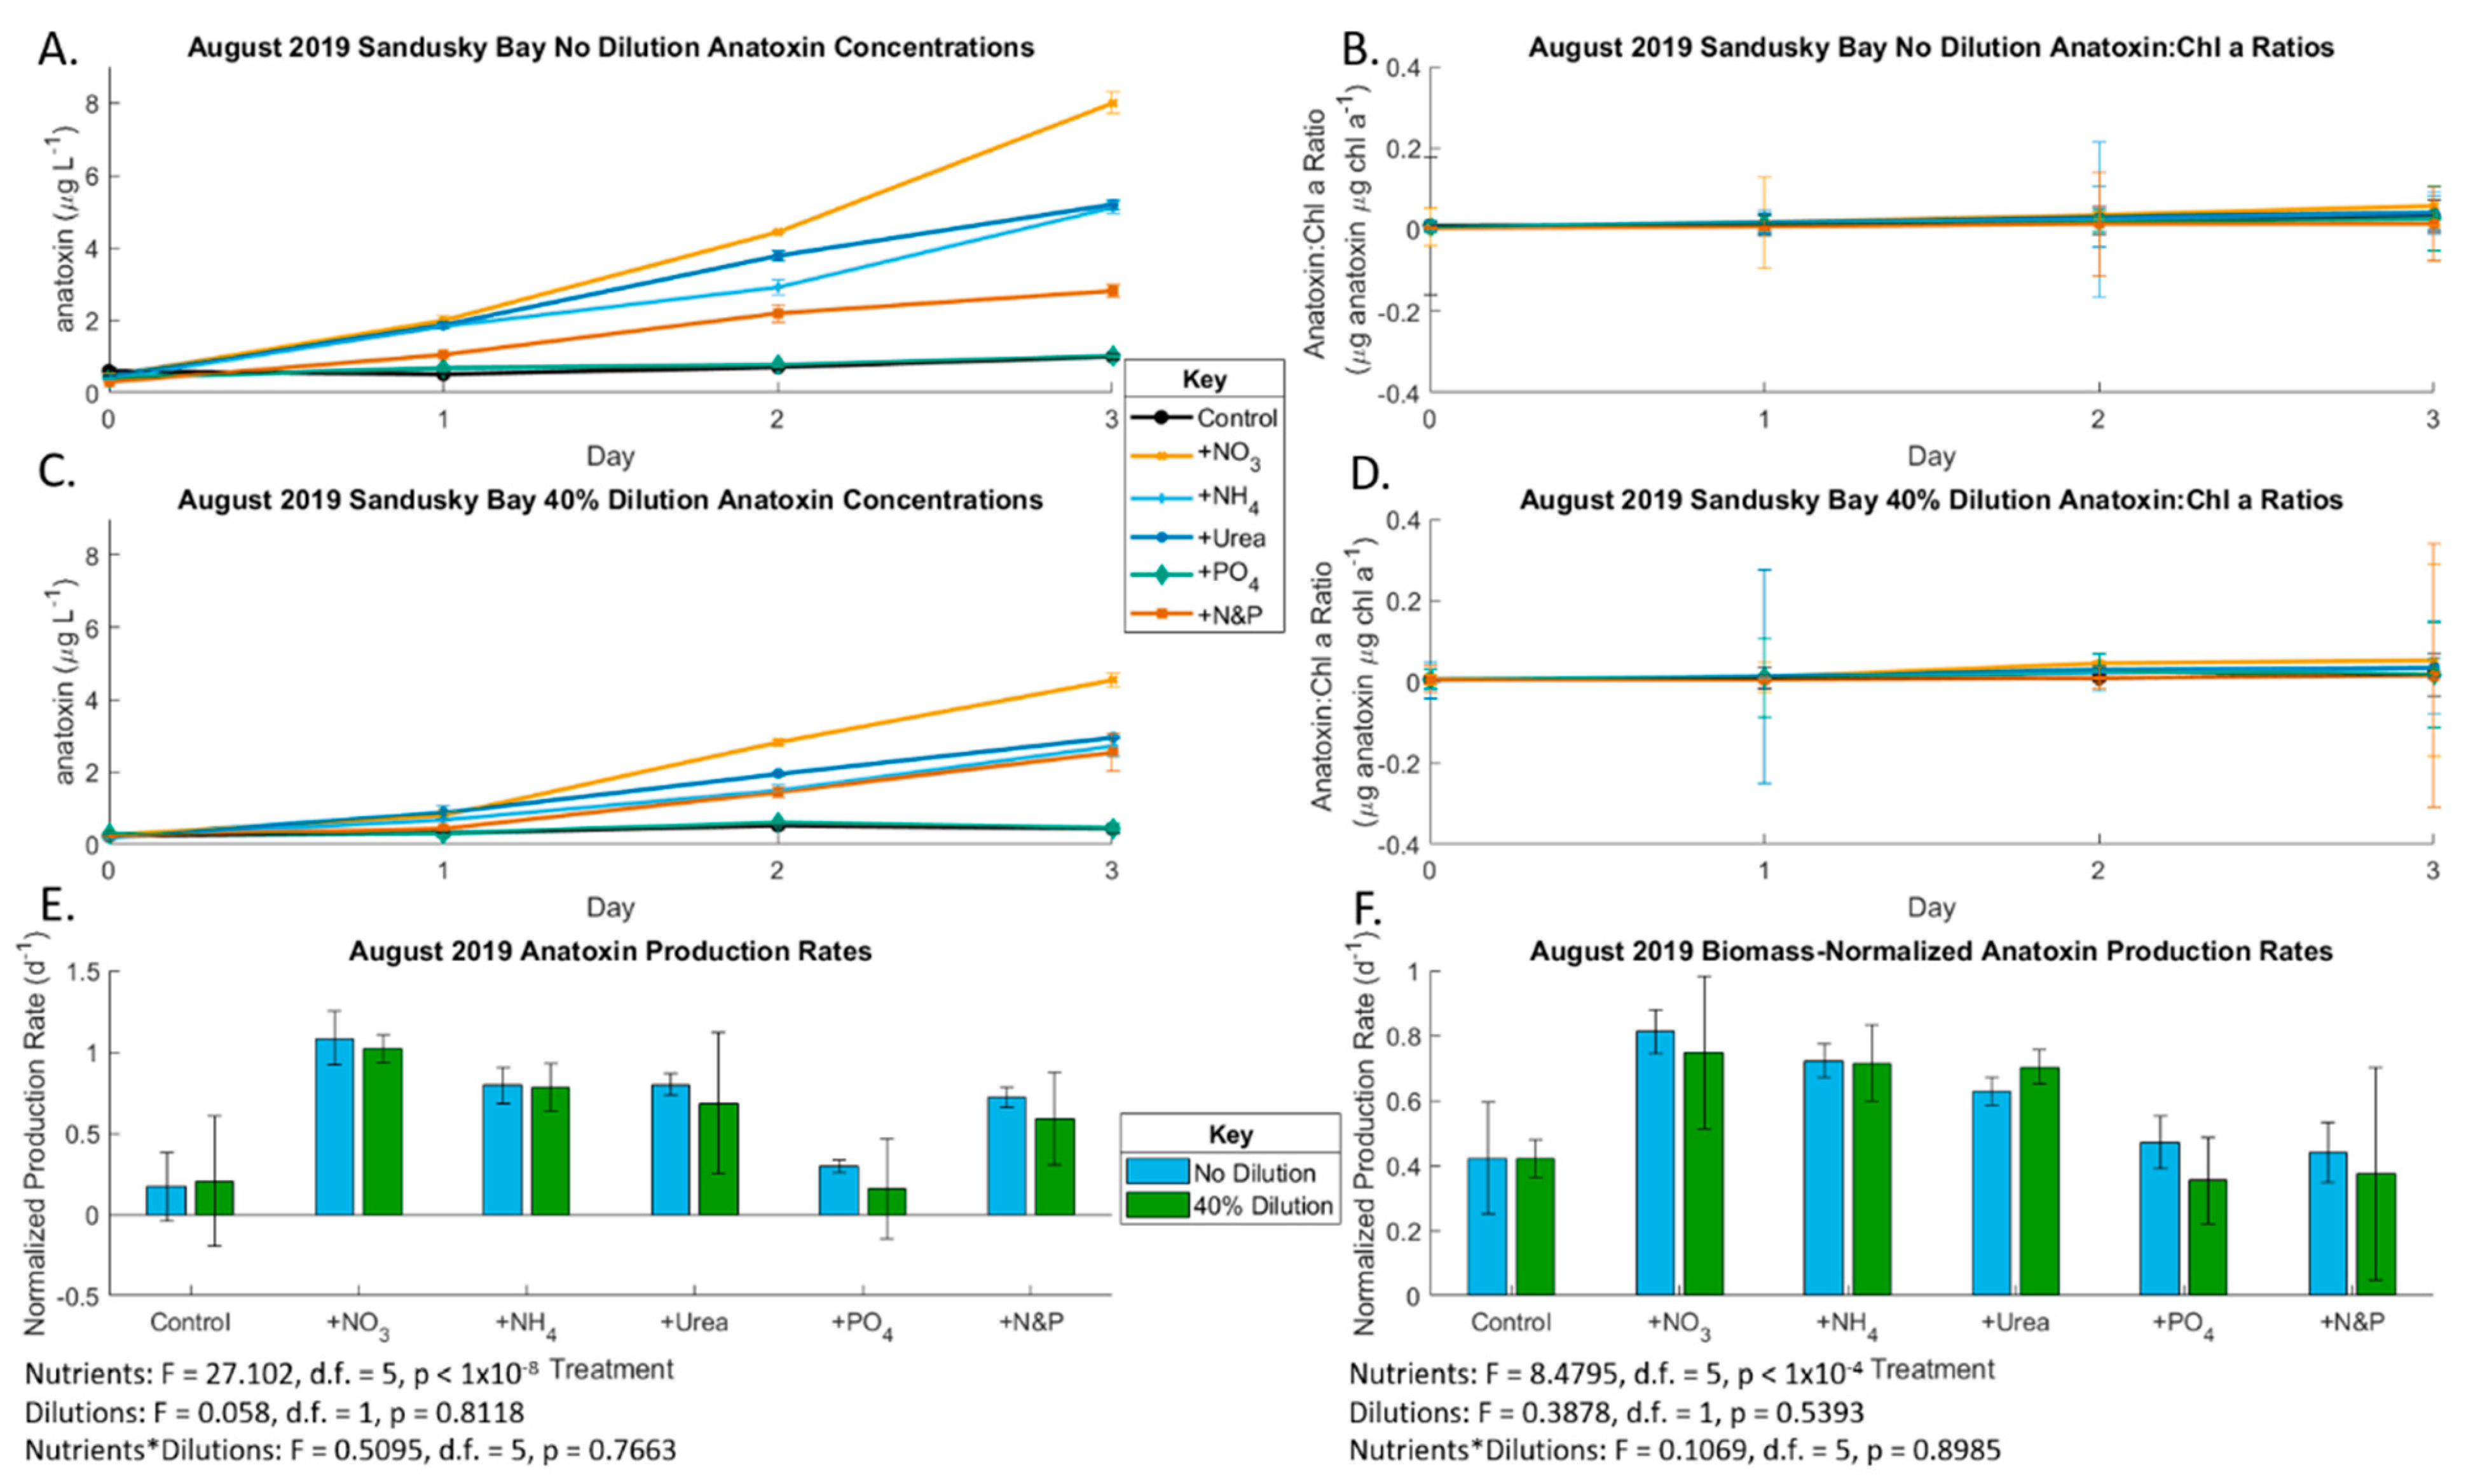
2.2. August 2019 Experiment

August experiments were characterized by dense blooms of Microcystis in Maumee Bay and Planktothrix in Sandusky Bay. Maumee Bay had high N concentrations—over 100 µmol L−1 nitrate plus nitrite—but Sandusky Bay had low N concentrations with 6.5 µmol L−1 nitrate plus nitrite (Table 2). Both Maumee and Sandusky Bay had low P concentrations of 0.03 to 0.20 µmol L−1 DRP (Table 2).
Chlorophyll a concentrations decreased throughout incubation of the very dense bloom in the August Maumee Bay experiment, coinciding with negative growth rates (Figure 5). The diluted treatments had reduced algal mortality compared to the undiluted treatments likely due to lower initial starting biomass (p < 0.001). The growth rate was significantly affected by nutrients (p < 0.001) and the interaction between nutrients and dilution (p = 0.012), but there was no discernable pattern, leading to a lack of ecological significance. The initial undiluted total microcystin concentration in the August Maumee Bay experiment was 18.06 µg/L. Microcystin concentration and production rates (Figure 6) followed a similar pattern to chlorophyll with a non-significant nutrient effect (p = 0.14) and significant dilution effect without biomass-normalization (p < 0.001) and a non-significant effect in biomass-normalized analysis (p = 0.5452). Anatoxin was not detected in the Maumee Bay August experiment.
In the August Sandusky Bay experiment, chlorophyll concentration increased throughout the incubation in the three N-only treatments and the + N&P treatment, while it declined in the control and P-only treatment in both the diluted and non-diluted treatments (Figure 5), which indicates N was the primary limiting nutrient. The various forms of N did not exert a discernable difference on growth rates. The highest growth rates were measured in the +N&P treatments, which indicates a secondary P limitation. The dilution effect was also significant (p = 0.004). The initial undiluted anatoxin concentration was 0.596 µg/L (Figure 7). Anatoxin production was primarily N-limited both with and without biomass normalization (p < 0.001), like growth rates, but P was not secondarily limiting. Unlike chlorophyll, which decreased throughout incubation in the control and P-only treatment, anatoxin concentrations in the control and P-only treatment remained constant throughout the incubation due to production rates of anatoxin increasing throughout the incubation.

3. Discussion

Given that CyanoHABs and their associated cyanotoxins have led to adverse human and ecosystem health outcomes in WLE [18], it is important to clarify the major driver(s) of CyanoHAB toxicity. This study investigated nutrient limitation on biomass production and cyanotoxin production, focusing on microcystin and anatoxin. We found that high concentrations of both major nutrients, P and N, drove CyanoHAB growth and microcystin and anatoxin production in WLE. We also found times when the 40% reduction in nutrients could slow microcystin production during nutrient replete conditions (Figure 3E,F).
We found that the June 2019 late spring diatom bloom in Maumee Bay was P-limited, which was induced in both the undiluted and 40% dilution samples due to high ambient N concentrations (>100 µmol/L), while the June 2019 Sandusky Bay Planktothrix bloom was not affected by nutrient addition, but growth was slowed following a 40% reduction in nutrients. This is possibly explained by the rapid growth associated with the early bloom, with the 40% reduction in nutrients dropping below the threshold needed to support this bloom [48]. During the bloom maxima in August 2019, the Maumee Bay Microcystis bloom was nutrient replete under both undiluted and 40% dilution treatments, with less of a decline in the biomass due to the 40% lower starting biomass following dilution. Additionally, ammonium concentration was higher in the initial 40% dilution than the undiluted sample in both the June and August 2019 Maumee Bay, likely due to an initial die off in the subsample, leading to increased regenerated N as ammonium. These results are likely due to bottle effects attributable to the very high biomass; restricted exchange of gases and nutrients [49,50,51]. The August Sandusky Bay Planktothrix bloom was N-limited in both the 40% reduction and the undiluted samples. All nutrient concentrations in the August 2019 Sandusky Bay 40% dilution were higher than concentrations in the undiluted treatment, likely due to the rapid growth of the Planktothrix bloom using up more nutrients in the undiluted control group prior to sample filtration, when compared to the reduced biomass in the 40% dilution. Differences between the effects of the different N species were not significant at either location during either experimental period, which has been seen previously in strongly N-limited blooms in WLE [52], but differs from past findings in WLE during periods of weaker N-limitation [22,53,54,55]. This could be due to the high ambient concentrations of NO3 paired with low NH4 (Table 1 and Table 2). Our findings of N limitation contradict the previous assumption that P availability exclusively controls CyanoHABs [56,57,58,59]. Instead, these findings support the paradigm shift to also consider N input reductions to mitigate CyanoHABs [19,29,60,61].
During the early Sandusky Bay Planktothrix bloom (June 2019), microcystin production shifted from between N and P co-limitation in the undiluted samples to nutrient deplete conditions in the 40% dilution samples. This is likely due to the bloom’s use of nutrient resources early on to support biomass production rather than produce secondary metabolites, e.g., cyanotoxins, possibly due to the genetic inability of the June populations to produce the microcystin as seen in prior years [62,63]. Alternatively, the cells could have lysed due to viral or other processes and the dissolved microcystin was not captured on the 0.7 µm porosity GF/F filters or degraded [64,65]. At its peak in August 2019, the Microcystis bloom in Maumee Bay was the only bloom that produced microcystin. This production of microcystin occurred under nutrient replete conditions, with less of a decline in microcystin concentrations with slight P limitation in the diluted samples and no apparent nutrient limitation in the undiluted samples. Neither experiments showed significant effects of the various forms of N.
Even though cyanobacteria require N to produce N-rich microcystin, P is also required for cellular growth to allow for higher microcystin concentrations. As the ratio of microcystin to chlorophyll a in both June and August was nearly linear (Figure 3 and Figure 6), we conclude that the primary bloomers—Planktothrix in Sandusky Bay and Microcystis in Maumee Bay—were the primary producers of microcystin. The P requirement for microcystin production has been observed in prior studies in Lake Erie, and in several German lakes [66]. This deviates from previous studies that clearly demonstrated links between N availability and higher N:P and bloom toxicity in microcystin-producing blooms [7,67,68,69]. This could be due to microcystin being an “N bargain” with a C:N ratio of 4.9:1 compared to the average of 3.6:1 in a survey of 2000 proteins [69]. However, P-limitation of microcystin production has been shown to occur in chemostat experiments [70] and in a transcriptome experiment on Lake Erie blooms [40]. The microcystin congener pattern observed in these experiments followed what was expected for North American lakes, including Lake Erie, with microcystin LR, YR, RR being the dominant congeners [18].
We observed anatoxin production in the Sandusky Bay Planktothrix bloom during both early and peak blooms. This is the first study showing anatoxin production in Lake Erie, although it has been shown that anatoxin production can occur during Planktothrix blooms accompanied by other cyanobacteria, including Cuspidothrix issatschenkoi, which has previously been identified in Sandusky Bay [23,71,72,73,74,75]. This was likely the case, as the biomass normalized anatoxin production mirrors the anatoxin production in the non-normalized analysis (Figure 4 and Figure 7), meaning that secondary cyanobacterial species may be driving the anatoxin production in Sandusky Bay. During the early Planktothrix bloom in June 2019, there was no apparent nutrient limitation in the undiluted treatments. However, there was co-limitation by both N and P in the diluted treatments. During the peak bloom in August 2019, anatoxin production was N-limited in both the undiluted and 40% diluted samples. While no differences were found between forms of N added in the June bioassay, during the peak bloom in August, NO3 additions led to higher concentrations of anatoxin compared to NH4 and urea additions. Additionally, N limitation of anatoxin production has been shown previously [76]. As observed in this experiment, higher overall N concentrations lead to higher anatoxin concentrations, with NO3 enrichment leading to the largest increase in anatoxin production, which parallels results from other limnetic anatoxin-producing CyanoHABs [77,78,79,80,81]. Anatoxin production in Sandusky Bay and other Planktothrix-dominated bodies of water needs further examination, given the neurotoxicity and potential developmental toxicity of anatoxin [82,83] as well as its multiple deleterious environmental effects [84,85].
Nutrient concentrations were very high during both the early and peak 2019 bloom in Maumee Bay with 223.67 ± 25.43 µg L−1 NO3 and 2.224 ± 1.008 µg L−1 DRP in June and 127.12 ± 10.82 µg L−1 combined NO3 and NO2 in August and 0.203 ± 0.199 µg L−1 DRP. Similar to Maumee Bay, Sandusky Bay exhibited high nutrient concentrations in June with 101.45 ± 5.95 µg L−1 NO3 and 0.203 ± 0.138 µg L−1 DRP in June, but had lower nutrient concentrations in August with 127.12 ± 10.82 µg L−1 NO3 in August and 0.032 ± 0.012 µg L−1 DRP. This is likely due to larger nutrient loads from the Maumee River than from the Sandusky River, as seen previously in 2007 [86]. The high nutrient loads were exacerbated by elevated precipitation associated with a very wet winter in 2019 [87], which will likely continue to be an issue as high precipitation events are predicted to continue in the future [88,89,90]. Denitrification and assimilation draw down nitrate to concentrations below the threshold of detection (<0.5 µmol/L) throughout summer and fall in western Lake Erie and Sandusky Bay [28,91], which is a pattern that occurs independent of tributary nutrient loads [19]. Our Maumee Bay experiments occurred before nitrate depletion, and therefore, we would expect to have observed N-limited growth and microcystin production following the N depletion [25]. However, it remains to be seen how a 40% dilution in nutrients (N and P) would affect N-limited Microcystis in late summer. Therefore, nutrient input reductions need to target both N and P rather than just P as recommended by the US EPA and Environment and Climate Change Canada [43,44,45,92]. While P reduction is actively pursued [93], N management strategies are required as well [35,94,95].

4. Conclusions

Our results suggest that nutrient dynamics play a crucial role in the WLE CyanoHABs for both biomass production as well as microcystin and anatoxin production in the eutrophic Sandusky and Maumee Bays. During the peak bloom periods when microcystin and anatoxin concentrations are highest, microcystin production was nutrient deplete and anatoxin production was N-limited. Maumee Bay biomass shifted from P-limited immediately prior to the Microcystis bloom to nutrient deplete during peak bloom, while the Sandusky Bay Planktothrix bloom shifted from nutrient deplete to N-limited from early bloom to peak bloom. A 40% reduction in N and P led to a slight reduction in biomass and microcystin and anatoxin production. However, further studies are needed to investigate the long-term nutrient reduction thresholds needed to control CyanoHABs. With N and P enrichment stimulating the WLE CyanoHABs, there is a need to constrain external loads of both N and P, and impose stricter nutrient-limited conditions in order to help mitigate the CyanoHAB problem in WLE [52,96,97,98]. Our study took place only in eutrophic bays and we showed that a 40% reduction might not be enough in Maumee and Sandusky Bay because growth and toxin production could still be nutrient-saturated. Future studies are needed to determine if a 40% reduction is adequate for the open waters of WLE. Furthermore, an adaptive management approach is needed to determine if the 40% reduction goal needs to be adjusted with changes in land use practices and climate change [99]. Additionally, future studies should focus on drawing direct functional links between nutrient enrichment and cyanotoxin production, e.g., Krausfeldt et al. [36]. Lastly, anatoxin should be more closely monitored in WLE, as it is a potent neurotoxin with human health-associated implications [100].

5. Materials and Methods

5.1. Bioassay Methods

We performed experimental manipulations of natural Maumee Bay (Oregon, OH, USA) and Sandusky Bay (Sandusky, OH, USA) phytoplankton communities that were collected from nearshore docks (Figure 8; Table S11). Water was pumped from 1 m below the surface into pre-cleaned (flushed with lake water) 20 L carboys using a non-destructive diaphragm pump and was transported to The Ohio State University Stone Laboratory on South Bass Island (Put-in-Bay, OH, USA) (Figure 8).
This experiment deployed in situ bioassays, using 4 L pre-cleaned polyethylene Cubitainers to which natural lake water was added from Maumee and Sandusky Bays using the methodology described in Paerl et al. [101] and Xu et al. [102]. Microcosm treatments were individually amended with either 100 μM N of NO3 (as KNO3), 100 µM N of NH4 (as NH4Cl), 6 µM PO4 (as KH2PO4), 100 µM N and 6 µMP added as a combined addition of 50 µM NO3, 50 µM NH4, and 6 µM PO4, and, in August 2019, urea (50 µM urea to achieve 100 µM N), yielding similar total dissolved nutrient concentrations (for each treatment) and falling within a range matching riverine dissolved inorganic nutrient discharge into Lake Erie nearshore waters. To avoid silica or dissolved inorganic carbon limitation in Cubitainers during the incubation period, we added 50 µM Si as Na2SiO3 and 10 mg L−1 (83.25 µM) DIC as NaHCO3 based on previous Si and DIC values from Hanson et al. [103] and Rockwell et al. [104]. We used a major ion solution (MIS) specific to WLE to provide 40% dilutions to mimic the EPA-recommended reductions in P inputs to WLE as well as a parallel 40% reduction in N, as both N and P have been shown to influence WLE CyanoHAB bloom dynamics [22,39,43]. The 40% dilution control investigated a 40% reduction in both N and P. Incubations were run for 72 h at a lake site near the Stone Laboratory at ambient lake water temperatures and light conditions [23,101,102]. Based on previous work on eutrophic Lake Taihu, China [95], a 72 h maximum incubation period was chosen to minimize “bottle effects”, while having ample time to examine phytoplankton growth, microcystin, and anatoxin production responses.
To perform nutrient dilutions, we developed a major ion solution (MIS) for WLE, which provided a N- and P-free dilution media to minimize hypertonic and hypotonic effects on the organisms in the samples by balancing major dissolved ions in the system (Table 3). As an example, artificial seawater is the MIS for the open ocean. For WLE, we based the ambient ion concentrations on a past study by Chapra et al. [105]. As there is substantial natural variability due to rainfall and evaporative effects and the ions in the MIS are in micromolar concentrations and pulse events change the ions in WLE, these deviations are considered reasonable. The compounds used in the MIS are found in Table S12.

5.2. Phytoplankton Biomass Determination

Chlorophyll a, as an indicator of phytoplankton biomass, was measured on subsampled samples by filtering 50 mL of sample water onto Whatman glass fiber filters (GF/F). Filters were frozen at −20 °C and subsequently extracted using a tissue grinder in 90% acetone [107,108]. Chlorophyll a in extracts was measured using the non-acidification method of Welschmeyer [109] on a Turner Designs Trilogy fluorometer calibrated with pure Chlorophyll a standards (Turner Designs, Sunnyvale, CA, USA).

5.3. Nutrient Concentration Determination

Nutrient samples were collected in 50 mL Falcon tubes by collecting the GF/F filtered water from the chlorophyll a sample collection and frozen at −20 °C. A continuous segmented flow auto-analyzer (QuAAtro SEAL Analytical Inc., Mequon, WI, USA) was used to quantify nitrate, nitrite, ammonium, dissolved reactive P, and silicate using standard U.S. EPA methods [110]. Urea concentration (as urea-N) was determined spectrophotometrically [52,111,112].

5.4. Anatoxin and Microcystin Determinations

Cyanotoxins were measured on subsampled samples by filtering 50 mL of the sample water onto Whatman GF/F. Filters were frozen at −20 °C until extraction with ultrasonic sonication in 5 mL of 50% methanol and 1% acetic acid. Samples were centrifuged at 14,000× g for 10 min at 4 °C. The supernatants were filtered through 0.45 µm pore-size nylon syringe filters (Corning, CLS431225) and stored at −20 °C until analysis. Microcystin was quantified via coupled liquid chromatography/mass spectrometry using methods modified from Boyer [113] and Peng et al. [114]. Reverse-phase liquid chromatography using a Waters 2695 solvent delivery system (Waters, Milford, MA, USA) coupled to a Waters ZQ4000 mass spectrometer (Waters, Milford, MA, USA) (m/z 500–1250 amu) and a 2996 photodiode array detector (Waters, Milford, MA, USA) (210 to 400 nm wavelength) was used to screen for molecular ions of 22 common microcystin congeners (RR, dRR, mRR, H4YR, hYR, YR, LR, mLR, zLR. dLR, meLR, AR, FR, WR, LA, dLA, mLA, LL, LY, LW, LF, WR). Separation conditions used an ACE 5 C18, 150 × 3.0 mm column and a 30–70% aqueous acetonitrile gradient containing 0.1% formic acid at a flow rate of 0.3 mL min. Individual congener concentrations were quantified using the peak area of the extracted ion relative to standards of microcystin-LR (Enzo Life Sciences, Ann Arbor, MI, USA). This allows quantification of congeners where standards are not available. Detection of congeners was validated by co-occurring presence of the diagnostic UV signature from the ADDA group. Full methodological details and the standard operating protocols are available from Protocols.io [115].
Anatoxin-a, dihydro-anatoxin-a and homoanatoxin-a were determined by LC-MS/MS using one quantification ion and two confirmation ions for each compound. Separation was achieved with an ACE 5 4.6 × 150 mm column (MacMod Analytical, Chadds Ford, PA, USA) assembly with solvent flow of 0.5 mL/min from a Waters Alliance 2695 solvent system (Waters, Milford, MA, USA). The solvent system was: A, 0.1% formic acid in water; B, 0.1% formic acid in acetonitrile. The separation gradient was: 0 to 20% B from 0 to 10 min, 20% to 80% B from 10 to 20 min, and 80% to 100% B from 20 to 23 min, followed by equilibration back to 0% B for 7 min. Toxins were identified using a Waters Acquity TQD mass spectrometer (Waters, Milford, MA, USA) operated in positive mode with capillary voltage 3.5 kV, desolvation and cone gasses at 30 and 800 Lh−1, respectively, desolvation and source temperatures of 400 and 150 °C, respectively. Retention times and fragmentation patterns were determined using anatoxin-a (BioMOL International, Farmingdale, NY, USA), homoanatoxin-a isolated from natural sources and α and β dihydroanatoxin synthesized by catalytic hydrogenation/reduction of anatoxin-a [116]. Calibration was performed with anatoxin-a; dihydro-anatoxin-a and homoanatoxin-a concentrations were estimated using the anatoxin-a standard curve. A phenylalanine standard was run with each set to confirm the baseline resolution between anatoxin-a and phenylalanine. Multiple reaction monitoring quantitation transitions were: anatoxin-a (166.09 > 131.00, collision energy (CE) 15 eV), dihydro-anatoxin-a (168.20 > 43.10, CE 23 eV), homoanatoxin-a (180.10 > 163.10, CE 15 eV). Confirmation transitions were: anatoxin-a (166.09 > 148.90, CE 15 eV; 166.09 > 90.90, CE 17 eV), dihydro-anatoxin-a (168.20 > 55.90, CE 22 eV; 168.20 > 67.00, CE 26 eV), homoanatoxin-a (180.10 > 145.10, CE 15 eV; 180.10 > 105.00, CE 17 eV).

5.5. Data Transformation and Analysis

To remove biomass effects on toxin to better measure nutrient effects on microcystin and anatoxin production, microcystin and anatoxin concentrations are normalized to biomass as proxied by chlorophyll a. Microcystin:chl a and anatoxin:chl a ratios are calculated using Equation (1):
t o x i n : c h l   a   r a t i o   ( μ g   m i c r o c y s t i n   o r   a n a t o x i n   μ g   c h l o r o p h y l l   a 1 ) =   [ t o x i n ] [ b i o m a s s ]
where [toxin] is the concentration of either microcystin or anatoxin (in µg L−1) and [biomass] is the concentration of chlorophyll a (in µg L−1).
For comparison between dilution treatments, we calculated production rates from the chlorophyll a and biomass-normalized microcystin and biomass-normalized anatoxin concentrations. Production rate (d−1) is a method to ln normalize the changes in concentrations, where a production of 0.693 d−1 is a doubling of the concentration per day, a production of 0.0 d−1 indicates no change, and a production of −0.693 d−1 represents a halving of the concentration. Production is calculated using Equation (2):
P r o d u c t i o n   ( d 1 ) =   ln ( μ T 3 μ T 0 ) 1 t
where µT0 is the average value of the measurement for the initial time point (T0), µT3 is the average value of the measurement for the time point of 3 days (T3), and t is the time difference between the samplings (in days), which in this case is t = 3 days. To calculate the standard deviation for the production, propagated standard deviation is used, as calculated by Equation (3):
P r o p a g a t e d   S t a n d a r d   D e v i a t i o n =   ( σ T 0 μ T 0 ) 2 + ( σ T 3 μ T 3 ) 2
where µT0 is the average value of the measurement for T0, σT0 is the standard deviation for the measurement at T0, µT3 is the average value of the measurement for T3, and σT3 is the standard deviation for the measurement at T3. For error bars, standard error is used, which is calculated using Equation (4):
S t a n d a r d   E r r o r =   σ n
where σ is the standard deviation for Figure 2a–d, Figure 3a–d, Figure 4a–d, Figure 5a–d, Figure 6a–d, and Figure 7a–d, σ is the propagated standard deviation for Figure 2e–f, Figure 3e–f, Figure 4e–f, Figure 5e–f, Figure 6e–f, and Figure 7e–f, and n is the number of data points. The standard errors are available in the WLE_Barnard_et_al_Toxins GitHub repository [117].

5.6. Statistical Analysis

To evaluate the source of the variation between the treatments, ANOVA analyses were performed. For this experiment, two-factor ANOVA analyses were run on balanced data sets (all data n = 3), and n-factor ANOVA analyses were run on unbalanced data sets (one or more treatments were characterized as n = 1 or n = 2) using MATLAB ver. R2018b [118]. Both the two-factor and n-factor ANOVA analyses calculate degrees of freedom (d.f.) as the number of treatments (n) minus one (d.f. = n−1). The homogeneity of variances was tested for with Levene’s Absolute test using MATLAB ver. R2018b [118]. All data and corresponding n-values are in Tables S1, S3, S4, S7, and S8.

Supplementary Materials

The following are available online at https://0-www-mdpi-com.brum.beds.ac.uk/2072-6651/13/1/47/s1, Table S1: Chlorophyll a data, Table S2: Chlorophyll a production rates, Table S3: Microcystin data, Table S4: Biomass-normalized microcystin data, Table S5: Microcystin production rates, Table S6: Biomass-normalized microcystin production rates, Table S7: Anatoxin data, Table S8: Biomass-normalized anatoxin data, Table S9: Anatoxin production rates, Table S10: Biomass-normalized anatoxin production rates, Table S11: GPS coordinates of the Western Lake Erie sampling sites, Table S12: Compounds comprising the major ion solution. The following are available online at www.doi.org/10.5281/zenodo.4281127, Code used to produce Figure 2, Figure 3, Figure 4, Figure 5, Figure 6 and Figure 7, importable data file formatted for the code, Key to the importable data file.

Author Contributions

Conceptualization, M.A.B. and H.W.P.; data curation, M.A.B.; formal analysis, M.A.B., G.L.B. and B.W.; funding acquisition, M.A.B., J.D.C., G.L.B., S.W.W., G.S.B., T.B.B. and T.W.D.; investigation, M.A.B., J.D.C., H.E.P., G.L.B., B.W., S.W.W., K.L.R., J.S.B., G.S.B., T.B.B., T.W.D., J.W., M.B. and H.W.P.; methodology, M.A.B., J.D.C., H.E.P., G.L.B., B.W., K.L.R., J.S.B., G.S.B., T.B.B., T.W.D., J.W., M.B. and H.W.P.; project administration, G.S.B.; supervision, J.D.C., G.L.B., S.W.W., G.S.B., T.B.B., T.W.D. and H.W.P.; writing-original draft, M.A.B.; writing-review and editing, J.D.C., H.E.P., G.L.B., B.W., S.W.W., K.L.R., J.S.B., G.S.B., T.B.B., T.W.D., J.W., M.B. and H.W.P.; all authors have read and agreed to the published version of the manuscript. All authors have read and agreed to the published version of the manuscript.

Funding

This research was funded by the United States National Science Foundation (OCE 0812913, OCE 0825466, OCE 1840715, CBET 0826819, IOS 1451528 and DEB 1831096), the United States National Institutes of Health (NIEHS P01ES028939), a Grant-in-Aid of Research from Sigma Xi, The Scientific Research Society (G201903158412545) [MAB], a Kenan Graduate Student Award from the University of North Carolina at Chapel Hill Department of Marine Sciences [MAB], and the NOAA/North Carolina Sea Grant Program R/MER-43, R/MER-47 [MAB, HEP, KLR, JSB, HWP].

Institutional Review Board Statement

Not applicable.

Informed Consent Statement

Not applicable.

Data Availability Statement

The data formatted for analysis and executable MATLAB code used to produce Figure 2, Figure 3, Figure 4, Figure 5, Figure 6 and Figure 7 can be found on GitHub at www.doi.org/10.5281/zenodo.4281127 [117]. The data presented in this study are also available in table form in the accompanying supplementary material: https://0-www-mdpi-com.brum.beds.ac.uk/2072-6651/13/1/47/s1.

Acknowledgments

We thank R. Sloup, N. Hall, and B. Abare of the UNC Institute of Marine Sciences, as well as laboratory technicians and students from The Ohio State University and University of Toledo Lake Erie Center at the for their help with experimental work.

Conflicts of Interest

The authors declare no conflict of interest. The funders had no role in the design of the study; in the collection, analyses, or interpretation of data; in the writing of the manuscript, or in the decision to publish the results.

References

  1. Haas, M.; Baumann, F.; Castella, D.; Haghipour, N.; Reusch, A.; Strasser, M.; Eglinton, T.I.; Dubois, N. Roman-driven cultural eutrophication of Lake Murten, Switzerland. Earth Planet. Sci. Lett. 2019, 505, 110–117. [Google Scholar] [CrossRef]
  2. Mohamed, M.N.; Wellen, C.; Parsons, C.T.; Taylor, W.D.; Arhonditsis, G.; Chomicki, K.M.; Boyd, D.; Weidman, P.; Mundle, S.O.C.; Van Cappellen, P.; et al. Understanding and managing the re-eutrophication of Lake Erie: Knowledge gaps and research priorities. Freshw. Sci. 2019, 38, 675–691. [Google Scholar] [CrossRef]
  3. Smith, V.H.; Tilman, G.D.; Nekola, J.C. Eutrophication: Impacts of excess nutrient inputs on freshwater, marine, and terrestrial ecosystems. Environ. Pollut. 1999, 100, 179–196. [Google Scholar] [CrossRef]
  4. Conley, D.J.; Paerl, H.W.; Howarth, R.W.; Boesch, D.F.; Seitzinger, S.P.; Havens, K.E.; Lancelot, C.; Likens, G.E. Controlling eutrophication: Nitrogen and phosphorus. Science 2009, 323, 1014–1015. [Google Scholar] [CrossRef] [PubMed]
  5. Environmental Pollution Panel President’s Science Advisory Committee in Restoring the Quality of Our Environment; White House Publishing: Cottage Grove, OR, USA, 1965.
  6. Sharpley, A.N.; Herron, S.; Daniel, T. Overcoming the challenges of phosphorus-based management in poultry farming. J. Soil Water Conserv. 2007, 62, 375–389. [Google Scholar]
  7. Bullerjahn, G.S.; McKay, R.M.; Davis, T.W.; Baker, D.B.; Boyer, G.L.; D’Anglada, L.V.; Doucette, G.J.; Ho, J.C.; Irwin, E.G.; Kling, C.L.; et al. Global solutions to regional problems: Collecting global expertise to address the problem of harmful cyanobacterial blooms. A Lake Erie case study. Harmful Algae 2016, 54, 223–238. [Google Scholar] [CrossRef] [PubMed] [Green Version]
  8. Harke, M.J.; Steffen, M.M.; Gobler, C.J.; Otten, T.G.; Wilhelm, S.W.; Wood, S.A.; Paerl, H.W. A review of the global ecology, genomics, and biogeography of the toxic cyanobacterium, Microcystis spp. Harmful Algae 2016, 54, 4–20. [Google Scholar] [CrossRef] [Green Version]
  9. Paerl, H.W.; Scott, J.T.; McCarthy, M.J.; Newell, S.E.; Gardner, W.S.; Havens, K.E.; Hoffman, D.K.; Wilhelm, S.W.; Wurtsbaugh, W.A. It takes two to tango: when and where dual nutrient (N & P) reductions are needed to protect lakes and downstream ecosystems. Environ. Sci. Technol. 2016, 50, 10805–10813. [Google Scholar] [CrossRef] [Green Version]
  10. Paerl, H.W.; Otten, T.G.; Kudela, R. Mitigating the expansion of harmful algal blooms across the freshwater-to-marine continuum. Environ. Sci. Technol. 2018, 52, 5519–5529. [Google Scholar] [CrossRef]
  11. Paerl, H.W.; Huisman, J. Climate change: A catalyst for global expansion of harmful cyanobacterial blooms. Environ. Microbiol. Rep. 2009, 1, 27–37. [Google Scholar] [CrossRef]
  12. Chapra, S.C.; Boehlert, B.; Fant, C.; Bierman, V.J.; Henderson, J.; Mills, D.; Mas, D.M.L.; Rennels, L.; Jantarasami, L.; Martinich, J.; et al. Climate change impacts on harmful algal blooms in U.S. freshwaters: a screening-level assessment. Environ. Sci. Technol. 2017, 51, 8933–8943. [Google Scholar] [CrossRef] [PubMed]
  13. Backer, L.C.; McNeel, S.V.; Barber, T.; Kirkpatrick, B.; Williams, C.; Irvin, M.; Zhou, Y.; Johnson, T.B.; Nierenberg, K.; Aubel, M.; et al. Recreational exposure to microcystins during algal blooms in two California lakes. Toxicon 2010, 55, 909–921. [Google Scholar] [CrossRef] [PubMed]
  14. Plaas, H.E.; Paerl, H.W. Toxic cyanobacteria: a growing threat to water and air quality. Environ. Sci. Technol. 2021, 55, 44–64. [Google Scholar] [CrossRef] [PubMed]
  15. Smith, Z.; Martin, R.; Wei, B.; Wilhelm, S.; Boyer, G. Spatial and temporal variation in paralytic shellfish toxin production by benthic Microseira (Lyngbya) wollei in a freshwater New York lake. Toxins (Basel) 2019, 11, 44. [Google Scholar] [CrossRef] [Green Version]
  16. Steffen, M.M.; Belisle, B.S.; Watson, S.B.; Boyer, G.L.; Wilhelm, S.W. Status, causes and controls of cyanobacterial blooms in Lake Erie. J. Great Lakes Res. 2014, 40, 215–225. [Google Scholar] [CrossRef]
  17. Pauer, J.J.; Anstead, A.M.; Melendez, W.; Taunt, K.W.; Kreis, R.G. Revisiting the Great Lakes Water Quality Agreement phosphorus targets and predicting the trophic status of Lake Michigan. J. Great Lakes Res. 2011, 37, 26–32. [Google Scholar] [CrossRef]
  18. Steffen, M.M.; Davis, T.W.; McKay, R.M.L.; Bullerjahn, G.S.; Krausfeldt, L.E.; Stough, J.M.A.; Neitzey, M.L.; Gilbert, N.E.; Boyer, G.L.; Johengen, T.H.; et al. Ecophysiological examination of the Lake Erie Microcystis bloom in 2014: linkages between biology and the water supply shutdown of Toledo, OH. Environ. Sci. Technol. 2017, 51, 6745–6755. [Google Scholar] [CrossRef]
  19. Chaffin, J.D.; Bridgeman, T.B.; Bade, D.L.; Mobilian, C.N. Summer phytoplankton nutrient limitation in Maumee Bay of Lake Erie during high-flow and low-flow years. J. Great Lakes Res. 2014, 40, 524–531. [Google Scholar] [CrossRef]
  20. Belisle, B.S.; Steffen, M.M.; Pound, H.L.; Watson, S.B.; DeBruyn, J.M.; Bourbonniere, R.A.; Boyer, G.L.; Wilhelm, S.W. Urea in Lake Erie: Organic nutrient sources as potentially important drivers of phytoplankton biomass. J. Great Lakes Res. 2016, 42, 599–607. [Google Scholar] [CrossRef] [Green Version]
  21. Wilhelm, S.; DeBruyn, J.; Gillor, O.; Twiss, M.; Livingston, K.; Bourbonniere, R.; Pickell, L.; Trick, C.; Dean, A.; McKay, R. Effect of phosphorus amendments on present day plankton communities in pelagic Lake Erie. Aquat. Microb. Ecol. 2003, 32, 275–285. [Google Scholar] [CrossRef]
  22. Chaffin, J.D.; Bridgeman, T.B.; Bade, D.L. Nitrogen constrains the growth of late summer cyanobacterial blooms in Lake Erie. Adv. Microbiol. 2013, 3, 16–26. [Google Scholar] [CrossRef] [Green Version]
  23. Davis, T.W.; Bullerjahn, G.S.; Tuttle, T.; McKay, R.M.; Watson, S.B. Effects of increasing nitrogen and phosphorus concentrations on phytoplankton community growth and toxicity during Planktothrix Blooms in Sandusky Bay, Lake Erie. Environ. Sci. Technol. 2015, 49, 7197–7207. [Google Scholar] [CrossRef] [PubMed]
  24. Gobler, C.J.; Burkholder, J.A.M.; Davis, T.W.; Harke, M.J.; Johengen, T.; Stow, C.A.; Van de Waal, D.B. The dual role of nitrogen supply in controlling the growth and toxicity of cyanobacterial blooms. Harmful Algae 2016, 54, 87–97. [Google Scholar] [CrossRef] [PubMed]
  25. Chaffin, J.D.; Davis, T.W.; Smith, D.J.; Baer, M.M.; Dick, G.J. Interactions between nitrogen form, loading rate, and light intensity on Microcystis and Planktothrix growth and microcystin production. Harmful Algae 2018, 73, 84–97. [Google Scholar] [CrossRef] [PubMed]
  26. Conroy, J.D.; Kane, D.D.; Quinlan, E.L.; Edwards, W.J.; Culver, D.A. Abiotic and biotic controls of phytoplankton biomass dynamics in a freshwater tributary, estuary, and large lake ecosystem: Sandusky Bay (lake Erie) chemostat. Inland Waters 2017, 7, 473–492. [Google Scholar] [CrossRef]
  27. Redfield, A.C.; Ketchum, B.H.; Richards, F.A. The influence of organisms on the composition of sea-water. In The Sea: Ideas and Observations on Progress in the Study of the Seas; Interscienc Publishers: New York, NY, USA, 1963. [Google Scholar]
  28. Salk, K.R.; Bullerjahn, G.S.; McKay, R.M.L.; Chaffin, J.D.; Ostrom, N.E. Nitrogen cycling in Sandusky Bay, Lake Erie: Oscillations between strong and weak export and implications for harmful algal blooms. Biogeosciences 2018, 15, 2891–2907. [Google Scholar] [CrossRef] [Green Version]
  29. Hampel, J.J.; McCarthy, M.J.; Neudeck, M.; Bullerjahn, G.S.; McKay, R.M.L.; Newell, S.E. Ammonium recycling supports toxic Planktothrix blooms in Sandusky Bay, Lake Erie: Evidence from stable isotope and metatranscriptome data. Harmful Algae 2019, 81, 42–52. [Google Scholar] [CrossRef] [Green Version]
  30. Shen, Y.; Huang, Y.; Hu, J.; Li, P.; Zhang, C.; Li, L.; Xu, P.; Zhang, J.; Chen, X. The nitrogen reduction in eutrophic water column driven by Microcystis blooms. J. Hazard. Mater. 2020, 385, 121578. [Google Scholar] [CrossRef]
  31. Muenich, R.L.; Kalcic, M.; Scavia, D. Evaluating the impact of legacy p and agricultural conservation practices on nutrient loads from the Maumee River watershed. Environ. Sci. Technol. 2016, 50, 8146–8154. [Google Scholar] [CrossRef]
  32. Cousino, L.K.; Becker, R.H.; Zmijewski, K.A. Modeling the effects of climate change on water, sediment, and nutrient yields from the Maumee River watershed. J. Hydrol. Reg. Stud. 2015, 4, 762–775. [Google Scholar] [CrossRef]
  33. Michalak, A.M.; Anderson, E.J.; Beletsky, D.; Boland, S.; Bosch, N.S.; Bridgeman, T.B.; Chaffin, J.D.; Cho, K.; Confesor, R.; Daloglu, I.; et al. Record-setting algal bloom in Lake Erie caused by agricultural and meteorological trends consistent with expected future conditions. Proc. Natl. Acad. Sci. USA 2013, 110, 6448–6452. [Google Scholar] [CrossRef] [PubMed] [Green Version]
  34. Smith, D.R.; Owens, P.R.; Leytem, A.B.; Warnemuende, E.A. Nutrient losses from manure and fertilizer applications as impacted by time to first runoff event. Environ. Pollut. 2007, 147, 131–137. [Google Scholar] [CrossRef] [PubMed]
  35. Paerl, H.W.; Barnard, M.A. Mitigating the global expansion of harmful cyanobacterial blooms: Moving targets in a human- and climatically-altered world. Harmful Algae 2020, 96, 101845. [Google Scholar] [CrossRef] [PubMed]
  36. Krausfeldt, L.E.; Farmer, A.T.; Castro, H.F.; Boyer, G.L.; Campagna, S.R.; Wilhelm, S.W. Nitrogen flux into metabolites and microcystins changes in response to different nitrogen sources in Microcystis aeruginosa NIES-843. Environ. Microbiol. 2020, 1462–2920. [Google Scholar] [CrossRef] [PubMed]
  37. NOAA MODIS. Algal Bloom in Lake Erie. Available online: https://modis.gsfc.nasa.gov/gallery/individual.php?db_date=2019-08-19 (accessed on 19 August 2019).
  38. Wacklin, P.; Hoffmann, L.; Komarek, J. Nomenclatural validation of the genetically revised cyanobacterial genus Dolichospermum (RALFS ex BORNET et FLAHAULT) comb. nova. Fottea 2009, 9, 59–64. [Google Scholar] [CrossRef] [Green Version]
  39. Davis, T.W.; Berry, D.L.; Boyer, G.L.; Gobler, C.J. The effects of temperature and nutrients on the growth and dynamics of toxic and non-toxic strains of Microcystis during cyanobacteria blooms. Harmful Algae 2009, 8, 715–725. [Google Scholar] [CrossRef]
  40. Rinta-Kanto, J.M.; Konopko, E.A.; DeBruyn, J.M.; Bourbonniere, R.A.; Boyer, G.L.; Wilhelm, S.W. Lake Erie Microcystis: Relationship between microcystin production, dynamics of genotypes and environmental parameters in a large lake. Harmful Algae 2009, 8, 665–673. [Google Scholar] [CrossRef]
  41. Newell, S.E.; Davis, T.W.; Johengen, T.H.; Gossiaux, D.; Burtner, A.; Palladino, D.; McCarthy, M.J. Reduced forms of nitrogen are a driver of non-nitrogen-fixing harmful cyanobacterial blooms and toxicity in Lake Erie. Harmful Algae 2019, 81, 86–93. [Google Scholar] [CrossRef]
  42. Osswald, J.; Rellán, S.; Gago, A.; Vasconcelos, V. Toxicology and detection methods of the alkaloid neurotoxin produced by cyanobacteria, anatoxin-a. Environ. Int. 2007, 33, 1070–1089. [Google Scholar] [CrossRef]
  43. U.S. Action Plan for Lake Erie; United States Environmental Protection Agency: Washington, DC, USA, 2018.
  44. Phosphorus Loading Targets For Lake Erie; Annex 4 Objectives and Targets Task Team Final Report to the Nutrients Annex Subcommittee; United States Environmental Protection Agency: Washington, DC, USA, 2015.
  45. Environment and Climate Change Canada. Canada-Ontario Lake Erie Action Plan Partnering on Achieving Phosphorus Loading Reductions to Lake Erie from Canadian Sources; Ontario Ministry of the Environment and Climate Change: Toronto, ON, Canada, 2018.
  46. Maccoux, M.J.; Dove, A.; Backus, S.M.; Dolan, D.M. Total and soluble reactive phosphorus loadings to Lake Erie: A detailed accounting by year, basin, country, and tributary. J. Great Lakes Res. 2016, 42, 1151–1165. [Google Scholar] [CrossRef] [Green Version]
  47. Scavia, D.; DePinto, J.V.; Bertani, I. A multi-model approach to evaluating target phosphorus loads for Lake Erie. J. Great Lakes Res. 2016, 42, 1139–1150. [Google Scholar] [CrossRef]
  48. Yan, P.; Guo, J.S.; Zhang, P.; Xiao, Y.; Li, Z.; Zhang, S.Q.; Zhang, Y.X.; He, S.X. The role of morphological changes in algae adaptation to nutrient stress at the single-cell level. Sci. Total Environ. 2021, 754, 142076. [Google Scholar] [CrossRef] [PubMed]
  49. Spivak, A.C.; Vanni, M.J.; Mette, E.M. Moving on up: Can results from simple aquatic mesocosm experiments be applied across broad spatial scales? Freshw. Biol. 2011, 56, 279–291. [Google Scholar] [CrossRef]
  50. Del Giorgio, P.; Williams, P. Respiration in Aquatic Ecosystems; Oxford University Press: Oxford, UK, 2005; ISBN 9780191713347. [Google Scholar]
  51. Nogueira, P.; Domingues, R.B.; Barbosa, A.B. Are microcosm volume and sample pre-filtration relevant to evaluate phytoplankton growth? J. Exp. Mar. Bio. Ecol. 2014, 461, 323–330. [Google Scholar] [CrossRef]
  52. Chaffin, J.D.; Bridgeman, T.B. Organic and inorganic nitrogen utilization by nitrogen-stressed cyanobacteria during bloom conditions. J. Appl. Phycol. 2014, 26, 299–309. [Google Scholar] [CrossRef]
  53. Chaffin, J.D.; Bridgeman, T.B.; Heckathorn, S.A.; Mishra, S. Assessment of Microcystis growth rate potential and nutrient status across a trophic gradient in western Lake Erie. J. Great Lakes Res. 2011, 37, 92–100. [Google Scholar] [CrossRef]
  54. North, R.L.; Guildford, S.J.; Smith, R.E.H.; Havens, S.M.; Twiss, M.R. Evidence for phosphorus, nitrogen, and iron colimitation of phytoplankton communities in Lake Erie. Limnol. Oceanogr. 2007, 52, 315–328. [Google Scholar] [CrossRef] [Green Version]
  55. Moon, J.; Carrick, H. Seasonal variation of phytoplankton nutrient limitation in Lake Erie. Aquat. Microb. Ecol. 2007, 48, 61–71. [Google Scholar] [CrossRef]
  56. Likens, G.E. Nutrients and Eutrophication: The Limiting-Nutrient Controversy: Proceedings; American Society of Limnology and Oceanography: Waco, TX, USA, 1972. [Google Scholar]
  57. Motew, M.; Chen, X.; Booth, E.G.; Carpenter, S.R.; Pinkas, P.; Zipper, S.C.; Loheide, S.P.; Donner, S.D.; Tsuruta, K.; Vadas, P.A.; et al. The Influence of Legacy P on Lake Water Quality in a Midwestern Agricultural Watershed. Ecosystems 2017, 20, 1468–1482. [Google Scholar] [CrossRef]
  58. Schindler, D.W. The dilemma of controlling cultural eutrophication of lakes. Proc. R. Soc. B Biol. Sci. 2012, 279, 4322–4333. [Google Scholar] [CrossRef] [Green Version]
  59. Schindler, D.W.; Hecky, R.E.; Findlay, D.L.; Stainton, M.P.; Parker, B.R.; Paterson, M.J.; Beaty, K.G.; Lyng, M.; Kasian, S.E.M. Eutrophication of lakes cannot be controlled by reducing nitrogen input: Results of a 37-year whole-ecosystem experiment. Proc. Natl. Acad. Sci. USA 2008, 105, 11254–11258. [Google Scholar] [CrossRef] [PubMed] [Green Version]
  60. Scott, J.T.; McCarthy, M.J.; Paerl, H.W. Nitrogen transformations differentially affect nutrient-limited primary production in lakes of varying trophic state. Limnol. Oceanogr. Lett. 2019. [Google Scholar] [CrossRef] [Green Version]
  61. Davis, T.; Harke, M.; Marcoval, M.; Goleski, J.; Orano-Dawson, C.; Berry, D.; Gobler, C. Effects of nitrogenous compounds and phosphorus on the growth of toxic and non-toxic strains of Microcystis during cyanobacterial blooms. Aquat. Microb. Ecol. 2010, 61, 149–162. [Google Scholar] [CrossRef] [Green Version]
  62. Jankowiak, J.; Hattenrath-Lehmann, T.; Kramer, B.J.; Ladds, M.; Gobler, C.J. Deciphering the effects of nitrogen, phosphorus, and temperature on cyanobacterial bloom intensification, diversity, and toxicity in western Lake Erie. Limnol. Oceanogr. 2019, 64, 1347–1370. [Google Scholar] [CrossRef] [Green Version]
  63. Stucken, K.; John, U.; Cembella, A.; Murillo, A.A.; Soto-Liebe, K.; Fuentes-Valdés, J.J.; Friedel, M.; Plominsky, A.M.; Vásquez, M.; Glöckner, G. the smallest known genomes of multicellular and toxic cyanobacteria: comparison, minimal gene sets for linked traits and the evolutionary implications. PLoS ONE 2010, 5, e9235. [Google Scholar] [CrossRef] [Green Version]
  64. McKindles, K.M.; Manes, M.A.; DeMarco, J.R.; McClure, A.; McKay, R.M.; Davis, T.W.; Bullerjahn, G.S. Dissolved microcystin release coincident with lysis of a Microcystis-dominated bloom in western Lake Erie attributed to a novel cyanophage. Appl. Environ. Microbiol. 2020. [Google Scholar] [CrossRef]
  65. Thees, A.; Atari, E.; Birbeck, J.; Westrick, J.A.; Huntley, J.F. Isolation and characterization of Lake Erie bacteria that degrade the cyanobacterial microcystin toxin MC-LR. J. Great Lakes Res. 2019, 45, 138–149. [Google Scholar] [CrossRef]
  66. Dolman, A.M.; Rücker, J.; Pick, F.R.; Fastner, J.; Rohrlack, T.; Mischke, U.; Wiedner, C. Cyanobacteria and cyanotoxins: the influence of nitrogen versus phosphorus. PLoS ONE 2012, 7, e38757. [Google Scholar] [CrossRef]
  67. Beversdorf, L.J.; Miller, T.R.; McMahon, K.D. Long-term monitoring reveals carbon-nitrogen metabolism key to microcystin production in eutrophic lakes. Front. Microbiol. 2015, 6, 456. [Google Scholar] [CrossRef] [Green Version]
  68. Harris, T.D.; Smith, V.H.; Graham, J.L.; de Waa, D.B.V.; Tedesco, L.P.; Clercin, N. Combined effects of nitrogen to phosphorus and nitrate to ammonia ratios on cyanobacterial metabolite concentrations in eutrophic Midwestern USA reservoirs. Inl. Waters 2016, 6, 199–210. [Google Scholar] [CrossRef] [Green Version]
  69. Jover, L.F.; Effler, T.C.; Buchan, A.; Wilhelm, S.W.; Weitz, J.S. The elemental composition of virus particles: Implications for marine biogeochemical cycles. Nat. Rev. Microbiol. 2014, 12, 519–528. [Google Scholar] [CrossRef] [PubMed]
  70. Oh, H.M.; Lee, S.J.; Jang, M.H.; Yoon, B.D. Microcystin production by Microcystis aeruginosa in a phosphorus-limited chemostat. Appl. Environ. Microbiol. 2000, 66, 176–179. [Google Scholar] [CrossRef] [PubMed] [Green Version]
  71. Viaggiu, E.; Melchiorre, S.; Volpi, F.; Di Corcia, A.; Mancini, R.; Garibaldi, L.; Crichigno, G.; Bruno, M. Anatoxin-a toxin in the cyanobacterium Planktothrix rubescens from a fishing pond in northern Italy. Environ. Toxicol. 2004, 19, 191–197. [Google Scholar] [CrossRef] [PubMed]
  72. Carrasco, D.; Moreno, E.; Paniagua, T.; de Hoyos, C.; Wormer, L.; Sanchis, D.; Cirés, S.; Martín-del-Pozo, D.; Codd, G.A.; Quesada, A. Anatoxin-a occurrence and potential cyanobacterial anatoxin-a producers in Spanish reservoirs. J. Phycol. 2007, 43, 1120–1125. [Google Scholar] [CrossRef]
  73. Toporowska, M.; Pawlik-Skowrońska, B.; Kalinowska, R. Mass development of diazotrophic cyanobacteria (Nostocales) and production of neurotoxic anatoxin-a in a Planktothrix (Oscillatoriales) dominated temperate lake. Water Air Soil Pollut. 2016, 227, 1–13. [Google Scholar] [CrossRef] [Green Version]
  74. Smith, Z.J.; Conroe, D.E.; Schulz, K.L.; Boyer, G.L. Limnological differences in a two-basin lake help to explain the occurrence of anatoxin-a, paralytic shellfish poisoning toxins, and microcystins. Toxins (Basel) 2020, 12, 559. [Google Scholar] [CrossRef]
  75. Mahmood, N.A.; Carmichael, W.W. The pharmacology of anatoxin-a(s), a neurotoxin produced by the freshwater cyanobacterium Anabaena flos-aquae NRC 525-17. Toxicon 1986, 24, 425–434. [Google Scholar] [CrossRef]
  76. Gagnon, A.; Pick, F.R. Effect of nitrogen on cellular production and release of the neurotoxin anatoxin-a in a nitrogen-fixing cyanobacterium. Front. Microbiol. 2012, 3, 211. [Google Scholar] [CrossRef] [Green Version]
  77. Boopathi, T.; Ki, J.-S. Impact of environmental factors on the regulation of cyanotoxin production. Toxins (Basel) 2014, 6, 1951–1978. [Google Scholar] [CrossRef] [Green Version]
  78. Osswald, J.; Rellán, S.; Gago-Martinez, A.; Vasconcelos, V. Production of anatoxin-a by cyanobacterial strains isolated from Portuguese fresh water systems. Ecotoxicology 2009, 18, 1110–1115. [Google Scholar] [CrossRef]
  79. Neilan, B.A.; Pearson, L.A.; Muenchhoff, J.; Moffitt, M.C.; Dittmann, E. Environmental conditions that influence toxin biosynthesis in cyanobacteria. Environ. Microbiol. 2013, 15, 1239–1253. [Google Scholar] [CrossRef] [PubMed]
  80. Heath, M.; Wood, S.A.; Young, R.G.; Ryan, K.G. The role of nitrogen and phosphorus in regulating Phormidium sp. (cyanobacteria) growth and anatoxin production. FEMS Microbiol. Ecol. 2016, 92, 21. [Google Scholar] [CrossRef] [PubMed] [Green Version]
  81. Rapala, J.; Sivonen, K.; Luukkainen, R.; Niemelä, S.I. Anatoxin-a concentration in Anabaena and Aphanizomenon under different environmental conditions and comparison of growth by toxic and non-toxic Anabaena-strains—A laboratory study. J. Appl. Phycol. 1993, 5, 581–591. [Google Scholar] [CrossRef]
  82. Stolerman, I.P.; Albuquerque, E.X.; Garcha, H.S. Behavioural effects of anatoxin, a potent nicotinic agonist, in rats. Neuropharmacology 1992, 31, 311–314. [Google Scholar] [CrossRef]
  83. Rogers, E.H.; Hunter, E.S.; Moser, V.C.; Phillips, P.M.; Herkovits, J.; Muñoz, L.; Hall, L.L.; Chernoff, N. Potential developmental toxicity of anatoxin-a, a cyanobacterial toxin. J. Appl. Toxicol. 2005, 25, 527–534. [Google Scholar] [CrossRef]
  84. Anderson, B.; Voorhees, J.; Phillips, B.; Fadness, R.; Stancheva, R.; Nichols, J.; Orr, D.; Wood, S.A. Extracts from benthic anatoxin-producing Phormidium are toxic to 3 macroinvertebrate taxa at environmentally relevant concentrations. Environ. Toxicol. Chem. 2018, 37, 2851–2859. [Google Scholar] [CrossRef]
  85. Lovin, L.M.; Brooks, B.W. Global scanning of anatoxins in aquatic systems: Environment and health hazards, and research needs. Mar. Freshw. Res. 2020, 71, 689. [Google Scholar] [CrossRef]
  86. Richards, R.P.; Baker, D.B.; Crumrine, J.P.; Stearns, A.M. Unusually large loads in 2007 from the Maumee and Sandusky Rivers, tributaries to Lake Erie. J. Soil Water Conserv. 2010, 65, 450–462. [Google Scholar] [CrossRef] [Green Version]
  87. Ma, C.G.; Chang, E.K.M.; Wong, S.; Zhang, R.; Zhang, M.; Del Genio, A. Impacts of storm track variations on wintertime extreme precipitation and moisture budgets over the Ohio Valley and northwestern United States. J. Clim. 2020, 33, 5371–5391. [Google Scholar] [CrossRef] [Green Version]
  88. Paerl, H.W.; Hall, N.S.; Hounshell, A.G.; Rossignol, K.L.; Barnard, M.A.; Luettich, R.A.; Rudolph, J.C.; Osburn, C.L.; Bales, J.; Harding, L.W. Recent increases of rainfall and flooding from tropical cyclones (TCs) in North Carolina (USA): Implications for organic matter and nutrient cycling in coastal watersheds. Biogeochemistry 2020, 4. [Google Scholar] [CrossRef]
  89. Paerl, H.W.; Havens, K.E.; Hall, N.S.; Otten, T.G.; Zhu, M.; Xu, H.; Zhu, G.; Qin, B. Mitigating a global expansion of toxic cyanobacterial blooms: Confounding effects and challenges posed by climate change. Mar. Freshw. Res. 2019. [Google Scholar] [CrossRef] [Green Version]
  90. Trenberth, K.E. The impact of climate change and variability on heavy precipitation, floods, and droughts. In Encyclopedia of Hydrological Sciences; American Cancer Society: Atlanta, GA, USA, 2008; ISBN 978-0-470-84894-4. [Google Scholar]
  91. Boedecker, A.R.; Niewinski, D.N.; Newell, S.E.; Chaffin, J.D.; McCarthy, M.J. Evaluating sediments as an ecosystem service in western Lake Erie via quantification of nutrient cycling pathways and selected gene abundances. J. Great Lakes Res. 2020. [Google Scholar] [CrossRef]
  92. Preventing Eutrophication: Scientific Support for Dual Nutrient Criteria Fact sheet; US EPA Office of Water: Washington, DC, USA, 2015.
  93. Baker, D.B.; Johnson, L.T.; Confesor, R.B.; Crumrine, J.P.; Guo, T.; Manning, N.F. Needed: Early-term adjustments for Lake Erie phosphorus target loads to address western basin cyanobacterial blooms. J. Great Lakes Res. 2019, 45, 203–211. [Google Scholar] [CrossRef]
  94. Levy, S. Microcystis Rising: Why Phosphorus Reduction Isn’t Enough to Stop CyanoHABs. Environ. Health Perspect. 2017, 125, A34–A39. [Google Scholar] [CrossRef] [PubMed] [Green Version]
  95. Xu, H.; Paerl, H.W.; Qin, B.; Zhu, G.; Hall, N.S.; Wu, Y. Determining critical nutrient thresholds needed to control harmful cyanobacterial blooms in eutrophic Lake Taihu, China. Environ. Sci. Technol. 2015, 49, 1051–1059. [Google Scholar] [CrossRef] [PubMed]
  96. Müller, S.; Mitrovic, S.M. Phytoplankton co-limitation by nitrogen and phosphorus in a shallow reservoir: Progressing from the phosphorus limitation paradigm. Hydrobiologia 2015, 744, 255–269. [Google Scholar] [CrossRef]
  97. Zohary, T.; Herut, B.; Krom, M.D.; Fauzi, C.; Mantoura, R.; Pitta, P.; Psarra, S.; Rassoulzadegan, F.; Stambler, N.; Tanaka, T.; et al. P-limited bacteria but N and P co-limited phytoplankton in the Eastern Mediterranean—A microcosm experiment. Deep Sea Res. Part II Top. Stud. Oceanogr. 2005, 52, 3011–3023. [Google Scholar] [CrossRef]
  98. Wilhelm, S.W.; Bullerjahn, G.S.; McKay, R.M.L. The complicated and confusing ecology of Microcystis blooms. mBio 2020, 11, e00529-20. [Google Scholar] [CrossRef]
  99. Stow, C.A.; Glassner-Shwayder, K.; Lee, D.; Wang, L.; Arhonditsis, G.; DePinto, J.V.; Twiss, M.R. Lake Erie phosphorus targets: An imperative for active adaptive management. J. Great Lakes Res. 2020, 46, 672–676. [Google Scholar] [CrossRef]
  100. Testai, E.; Scardala, S.; Vichi, S.; Buratti, F.M.; Funari, E. Risk to human health associated with the environmental occurrence of cyanobacterial neurotoxic alkaloids anatoxins and saxitoxins. Crit. Rev. Toxicol. 2016, 46, 385–419. [Google Scholar] [CrossRef]
  101. Paerl, H.W.; Hall, N.S.; Calandrino, E.S. Controlling harmful cyanobacterial blooms in a world experiencing anthropogenic and climatic-induced change. Sci. Total Environ. 2011, 409, 1739–1745. [Google Scholar] [CrossRef]
  102. Xu, H.; Paerl, H.W.; Qin, B.; Zhu, G.; Gaoa, G. Nitrogen and phosphorus inputs control phytoplankton growth in eutrophic Lake Taihu, China. Limnol. Oceanogr. 2010, 55, 420–432. [Google Scholar] [CrossRef] [Green Version]
  103. Hanson, P.C.; Carpenter, S.R.; Armstrong, D.E.; Stanley, E.H.; Kratz, T.K. Lake dissolved inorganic carbon and dissolved oxygen: Changing drivers from days to decades. Ecol. Monogr. 2006, 76, 343–363. [Google Scholar] [CrossRef]
  104. Rockwell, D.C.; Warren, G.J.; Bertram, P.E.; Salisbury, D.K.; Burns, N.M. The U.S. EPA Lake Erie indicators monitoring program 1983-2002: Trends in phosphorus, silica, and chlorophyll a in the central basin. J. Great Lakes Res. 2005, 31, 23–34. [Google Scholar] [CrossRef]
  105. Chapra, S.C.; Dove, A.; Warren, G.J. Long-term trends of Great Lakes major ion chemistry. J. Great Lakes Res. 2012, 38, 550–560. [Google Scholar] [CrossRef]
  106. Shorthouse, D.P. SimpleMappr. Available online: https://www.simplemappr.net (accessed on 14 September 2020).
  107. Arar, E.J.; Collins, G.B. Method 445.0 In Vitro Determination of Chlorophyll a and Pheophytin in Marine and Freshwater Algae by Fluorescence; United States Environmental Protection Agency: Washington, DC, USA, 1997.
  108. Arar, E.J.; Collins, G.B. Using the Turner Designs Model 10 Analog, The 10AU Field, or the TD-700 Laboratory Fluorometer with EPA Method 445.0; United States Environmental Protection Agency: Washington, DC, USA, 2001.
  109. Welschmeyer, N.A. Fluorometric analysis of chlorophyll a in the presence of chlorophyll b and pheopigments. Limnol. Oceanogr. 1994, 39, 1985–1992. [Google Scholar] [CrossRef]
  110. Chaffin, J.D.; Mishra, S.; Kane, D.D.; Bade, D.L.; Stanislawczyk, K.; Slodysko, K.N.; Jones, K.W.; Parker, E.M.; Fox, E.L. Cyanobacterial blooms in the central basin of Lake Erie: Potentials for cyanotoxins and environmental drivers. J. Great Lakes Res. 2019, 45, 277–289. [Google Scholar] [CrossRef]
  111. Goeyens, L.; Kindermans, N.; Abu Yusuf, M.; Elskens, M. A room temperature procedure for the manual determination of urea in seawater. Estuar. Coast. Shelf Sci. 1998, 47, 415–418. [Google Scholar] [CrossRef] [Green Version]
  112. Mulvenna, P.F.; Savidge, G. A modified manual method for the determination of urea in seawater using diacetylmonoxime reagent. Estuar. Coast. Shelf Sci. 1992, 34, 429–438. [Google Scholar] [CrossRef]
  113. Boyer, G.L. The occurrence of cyanobacterial toxins in New York lakes: Lessons from the MERHAB-Lower Great Lakes program. In Lake and Reservoir Management; Taylor & Francis Group: Abingdon, UK, 2007; Volume 23, pp. 153–160. [Google Scholar]
  114. Peng, G.; Martin, R.M.; Dearth, S.P.; Sun, X.; Boyer, G.L.; Campagna, S.R.; Lin, S.; Wilhelm, S.W. Seasonally relevant cool temperatures interact with N chemistry to increase microcystins produced in lab cultures of Microcystis aeruginosa NIES-843. Environ. Sci. Technol. 2018, 52, 4127–4136. [Google Scholar] [CrossRef]
  115. Boyer, G.L. LCMS-SOP Determination of microcystins in water samples by high performance liquid chromatography (HPLC) with single quadrupole mass spectrometry (MS). Protocols 2020. [Google Scholar] [CrossRef]
  116. Yang, X. Occurrence of the Cyanobacterial Neurotoxin, Anatoxin-A, in New York State Waters; State University of New York: Syracuse, NY, USA, 2007. [Google Scholar]
  117. Barnard, M.A. GitHub: malcolmbarnard/WLE_Barnard_et_al_Toxins. Zenodo 2021. [Google Scholar] [CrossRef]
  118. Mathworks MATLAB, version 9.5.0.1049112 (R2018b); The MathWorks: Natick, MA, USA, 2018.
Figure 1. Images of the 2019 WLE CyanoHABs. (A) Satellite imagery from the NASA Terra satellite of the WLE CyanoHAB on 19 August 2019 as provided by NOAA MODIS [37]; (B) Maumee Bay Microcystis-dominated cyanobacterial harmful algal bloom (CyanoHAB) on 4 August 2019 during sampling for the August 2019 bioassays. Photo by H. Plaas; (C) Sandusky Bay Planktothrix-dominated bloom on 4 August 2019 during sampling for the August 2019 bioassays. Photo by H. Plaas.
Toxins 13 00047 g001
Figure 2. Growth rates of phytoplankton, as determined by chlorophyll a accumulation during the course of incubation in the June 2019 bioassays. (A) Undiluted Maumee Bay water (also see Table S1); (B) undiluted Sandusky Bay water (also see Table S1); (C) 40% dilution Maumee Bay water (also see Table S1); (D) 40% dilution Sandusky Bay water (also see Table S1); (E) Maumee Bay growth rates under the various nutrient addition treatments at the two locations of T3 compared to T0 (also see Table S2). Error bars are standard error; (F) Maumee Bay growth rates under the various nutrient addition treatments at the two locations of T3 compared to T0 (also see Table S2). Error bars are standard error. Significances between treatments for (E,F) are from two-factor ANOVAs.
Toxins 13 00047 g002
Figure 3. Production rates of microcystin during the June 2019 bioassays. Only Sandusky Bay produced microcystin in June. (A) Undiluted Sandusky Bay microcystin concentrations (also see Table S3); (B) undiluted Sandusky Bay biomass-normalized microcystin concentrations (also see Table S4); (C) 40% dilution Sandusky Bay microcystin concentrations (also see Table S3); (D) 40% dilution Sandusky Bay biomass-normalized microcystin concentrations (also see Table S4); (E) Maumee Bay microcystin production rates under the various nutrient addition treatments at the two locations of T3 compared to T0 (also see Table S5); (F) Maumee Bay biomass-normalized microcystin production rates under the various nutrient addition treatments at the two locations of T3 compared to T0 (also see Table S6). Error bars are standard error. Significance for (E,F) is from n-factor ANOVA analysis due to unbalanced data sets.
Toxins 13 00047 g003
Figure 4. Chlorophyll a-based production rates of anatoxin during the June 2019 bioassays. Only Sandusky Bay produced anatoxin in June. (A) Undiluted Sandusky Bay anatoxin concentrations (also see Table S7); (B) undiluted Sandusky Bay biomass-normalized anatoxin concentrations (also see Table S8); (C) 40% dilution Sandusky Bay anatoxin concentrations (also see Table S7); (D) 40% dilution Sandusky Bay biomass-normalized anatoxin concentrations (also see Table S8); (E) Maumee Bay anatoxin production rates under the various nutrient addition treatments at the two locations of T3 compared to T0 (also see Table S9); (F) Maumee Bay biomass-normalized anatoxin production rates under the various nutrient addition treatments at the two locations of T3 compared to T0 (also see Table S10). Error bars are standard error. Significance for (E,F) is from n-factor ANOVA analysis due to unbalanced data sets.
Toxins 13 00047 g004
Figure 5. Growth rates of phytoplankton in the August 2019 bioassays. (A) Undiluted Maumee Bay Chlorophyll a (also see Table S1); (B) undiluted Sandusky Bay Chlorophyll a (also see Table S1); (C) undiluted Maumee Bay Chlorophyll a (also see Table S1); (D) 40% dilution Sandusky Bay Chlorophyll a (also see Table S1); (E) Maumee Bay growth rates under the various nutrient addition treatments at the two locations at T3 compared to T0 (also see Table S2). Error bars are standard error. Significance for (E) is from two-factor ANOVA analysis; (F) Maumee Bay growth rates under the various nutrient addition treatments at the two locations at T3 compared to T0 (Table S2). Error bars are standard error. Significance for (F) is from n-factor ANOVA analysis due to unbalanced data sets.
Toxins 13 00047 g005
Figure 6. Production rates of microcystin during the August 2019 bioassays. Only Maumee Bay produced microcystin in all samples. (A) Undiluted Maumee Bay microcystin concentrations (also see Table S3); (B) undiluted Maumee Bay biomass-normalized microcystin concentrations (also see Table S4); (C) 40% dilution Maumee Bay microcystin concentrations (also see Table S3); (D) 40% dilution Maumee Bay biomass-normalized microcystin concentrations (also see Table S4); (E) Maumee Bay microcystin production rates under the various nutrient addition treatments at the two locations of T3 compared to T0 (also see Table S5); (F) Maumee Bay biomass-normalized microcystin production rates under the various nutrient addition treatments at the two locations of T3 compared to T0 (also see Table S6). Error bars are standard error. Significance for (E,F) is from 2-factor ANOVA analysis.
Toxins 13 00047 g006
Figure 7. Production rates of anatoxin during the August 2019 bioassays. Only Sandusky Bay produced anatoxin in August. (A) Undiluted Sandusky Bay anatoxin concentrations (also see Table S7); (B) undiluted Sandusky Bay biomass-normalized anatoxin concentrations (also see Table S8); (C) 40% dilution Sandusky Bay anatoxin concentrations (also see Table S7); (D) 40% dilution Sandusky Bay biomass-normalized anatoxin concentrations (also see Table S8); (E) Maumee Bay anatoxin production rates under the various nutrient addition treatments at the two locations of T3 compared to T0 (also see Table S9); (F) Maumee Bay biomass-normalized anatoxin production rates under the various nutrient addition treatments at the two locations of T3 compared to T0 (also see Table S10). Error bars are standard error. Significance for (E,F) is from 2-factor ANOVA analysis.
Toxins 13 00047 g007
Figure 8. Map of the sampling sites and the location of the incubation. Maumee Bay water was collected off a bulkhead dock near the University of Toledo Lake Erie Center in Oregon, OH, USA. Sandusky Bay sampling took place at a dock outside the Paper District Marina in Sandusky, OH, USA. Incubation took place at The Ohio State Stone Laboratory on South Bass Island (Put-In-Bay, OH, USA). GPS coordinates for the sampling and incubation sites can be found in Table S11. This figure was created with www.simplemappr.net [106].
Toxins 13 00047 g008
Table 1. Initial nutrient concentrations in the June 2019 bioassay water collected from control Cubitainers. All data are n = 3.
Nutrient ParameterMaumee BaySandusky Bay
No Dilution40% DilutionNo Dilution40% Dilution
NO3 + NO2 (µmol L−1)223.67 ± 25.43137.64 ± 35.00101.45 ± 5.9558.46 ± 8.46
NH4
(µmol L−1)
1.34 ± 1.013.67 ± 0.6024.28 ± 0.6617.14 ± 0.85
DRP
(µmol L−1)
2.24 ± 0.231.50 ± 0.071.20 ± 0.140.85 ± 0.05
Silicate
(µmol L−1)
139.14 ± 12.23100.46 ± 2.53130.42 ± 19.5078.88 ± 16.20
Table 2. Initial concentrations of nutrients in the August 2019 bioassay water taken from T0 control Cubitainers. All data are n = 3.
Nutrient ParameterMaumee BaySandusky Bay
No Dilution40% DilutionNo Dilution40% Dilution
NO3 + NO2
(µmol L−1)
127.12 ± 10.8260.10 ± 12.94 6.59 ± 0.296.61 ± 0.05
NH4
(µmol L−1)
0.70 ± 0.421.74 ± 1.581.05 ± 0.691.04 ± 0.06
Urea
(µmol L−1)
3.45 ± 0.611.59 ± 1.152.91 ± 1.463.99 ± 1.09
DRP
(µmol L−1)
0.20 ± 0.200.05 ± 0.010.03 ± 0.010.10 ± 0.07
Silicate
(µmol L−1)
124.33 ± 7.1395.44 ± 6.2451.12 ± 12.2364.91 ± 18.52
Table 3. Concentrations of major ions in the ambient Lake Erie water and the major ion solution (MIS) used for the dilutions in the bioassays.
Ion 1Average Ambient
Concentration (mg/L) [105]
MIS 1
Concentration
(mg/L)
MIS 1
Concentration
(µM)
Percent Difference between Chapra et al. [105] and MIS Concentrations
Ca 2+32.1132800− 0.34%
Mg 2+8.898.88370− 0.11%
Na +8.584.6200− 46.39% 2
K +1.4311.56409.01% 3
Cl -14.5816.3346012.00% 3
SO4 2-22.8143.245089.39% 3
1 Constituents of MIS can be found in Table S12; 2 lower concentration compared to ambient concentration; 3 higher concentration compared to average ambient concentrations.
Publisher’s Note: MDPI stays neutral with regard to jurisdictional claims in published maps and institutional affiliations.

