
Investigation on Ultrasonic Cavitation Erosion of Aluminum–Titanium Alloys in Sodium Chloride Solution


1
School of Materials Science and Engineering, Northeastern University, Shenyang 110004, China
2
Key Laboratory of Lightweight Structural Materials, Northeastern University, Shenyang 110819, China
*
Author to whom correspondence should be addressed.
Crystals 2021, 11(11), 1299; https://0-doi-org.brum.beds.ac.uk/10.3390/cryst11111299
Submission received: 19 September 2021
/
Revised: 20 October 2021
/
Accepted: 22 October 2021
/
Published: 26 October 2021
(This article belongs to the Special Issue Solid State Chemistry: Memorial Issue for Professor Emilio Morán)
Abstract
:Two kinds of Ti-alloys, i.e., Al–5Ti and Al–10Ti alloys, were manufactured in this study, and their ultrasonic cavitation erosion behaviors in 3.5 wt.% NaCl solution were evaluated by the cumulative mass loss, scanning electronic micrograph, and three-dimensional morphology. The results show that mass loss and surface damage of the Al, Al–5Ti, and Al–10Ti alloys obviously increased with the increasing cavitation erosion time. Compared with the pure Al, the cavitation resistance of the Al–5Ti and Al–10Ti alloys was improved because of the presence of the TiAl3 phase. In addition, the synergistic effect between cavitation and corrosion of the Al–Ti alloy in 3.5 wt.% NaCl solution was studied according to the polarization curve of the moving electrode. The mass loss caused by the synergistic effect between cavitation erosion and corrosion accounted for a large percentage, 23.59%, indicating that corrosion has a critical impact on the cavitation erosion of the Al–Ti alloys. Compared with corrosion promoted by cavitation erosion, the cavitation erosion promoted by corrosion had a larger promoting effect.
1. Introduction
Cavitation erosion refers to surface damage caused by cavitation in a hydrodynamic environment, which is a common damage form of flow handling propellers, such as turbines, propellers, hydraulic machines, and other flow parts [1,2,3,4,5]. Cavitation erosion has attracted extensive attention from researchers because of the corresponding huge economic losses and potential safety hazards [6]. The ultrasonic cavitation process contains many disciplines, such as material science, thermodynamics, mechanics, and acoustics, and there is no effective technology that can completely solve the cavitation erosion problem [7]. Cavitation bubbles grow and burst under the alternating action of positive and negative pressures, forming high-speed microjets and strong shock waves [8]. Microjets and shock waves repeatedly impact the material surface, resulting in pits, plastic deformation, and cracks on the material surface, which eventually leads to the spalling of the material surface [9]. In the initial stage of ultrasonic cavitation erosion, the erosion is insignificant and the mass loss of materials can be ignored, which is known as the incubation period [10]. Subsequently, the exposed material is subjected to the repeated action of cavitation bubbles, resulting in the accumulation of deformation until their micro-destruction occurs, causing material loss [11].
Generally, the surface properties of alloys have a great influence on the cavitation resistance. In order to improve the cavitation erosion resistance of alloys, a series of surface engineering processes are used to improve their surface properties, such as plasma enhanced magnetron sputtering, high temperature gas nitriding, and laser surface modification [12,13,14]. Santos [15] reported that high temperature gas nitriding can improve the cavitation erosion resistance of an AlSi 304L austenitic stainless steel. In addition, Chiu [16] adopted the laser surface-modified with NiTi for improving the cavitation erosion resistance of AlSi 316L stainless steel. Szala et. al. [17] successfully prepared Al/Al2O3 and Cu/Al2O3 composites by the low-pressure cold spray (LPCS) technique, and found that surface morphology plays an essential role in cavitation erosion resistance. Man et al. [18] studied the cavitation corrosion behavior of laser surface alloying of Si3N4 on AA6061, and found that the cavitation corrosion resistance of 100% Si3N4 alloys was three times higher than that of AA6061 alloys.
With the increased applications of aluminum alloys in the shipping industry, the cavitation resistance of aluminum alloys has also been studied [7]. Generally, when sailing in seawater, ships will suffer from cavitation erosion and seawater erosion [19]. Moreover, the Cl ions in seawater destroy the passive state film on the surface of aluminum alloys [20]. When cavitation erosion occurs, shock waves and microjets generated by bubble collapse impact the surface of the material in the form of stress pulses and destroy the passivation film on the surface of the material, which can accelerate the process of electrochemical corrosion. Aluminum alloy, as a common material for hull structures, pressure vessels, and hydrofoils, also faces the problem of electrochemical corrosion and cavitation erosion [21]. Over the past years, several researchers have mainly studied the cavitation erosion resistance of titanium alloys, cobalt alloys, and bronze materials to solve the cavitation erosion problem [6,22]. In particular, titanium alloys and stainless steel have been widely studied for cavitation erosion resistance, often in corrosive environments [23,24,25,26]. Research on the cavitation corrosion resistance of aluminum alloys mostly focuses on electrochemical corrosion behavior in different corrosive media, but the influence factors of cavitation corrosion on corrosion are not considered. The effect of the interaction between cavitation erosion and electrochemical corrosion on the cavitation corrosion resistance of aluminum alloys is rarely studied.
Aluminum–titanium alloy is a common material with good mechanical properties and corrosion resistance. The study on the cavitation–electrochemical corrosion behavior of Al–Ti alloys in 3.5 wt.% NaCl solution has a certain reference value for its application in a NaCl corrosion environment. In this paper, the surface morphologies of Al–Ti alloys after different cavitation erosion times were observed by scanning electron microscopy, and the effects of erosion time on the change of surface characteristics were systematically analyzed. Furthermore, the electrochemical parameters of the Al–Ti alloy in 3.5 wt.% NaCl solution were detected by potentiodynamic polarization curves. Combined with the mass loss and roughness in each cavitation stage of the sample, the cavitation erosion and electrochemical corrosion behavior of the Al–Ti alloys in 3.5 wt.% NaCl solution were also analyzed, which provides a better understanding for the damage mechanism of cavitation erosion.
2. Materials and Methods
2.1. Materials
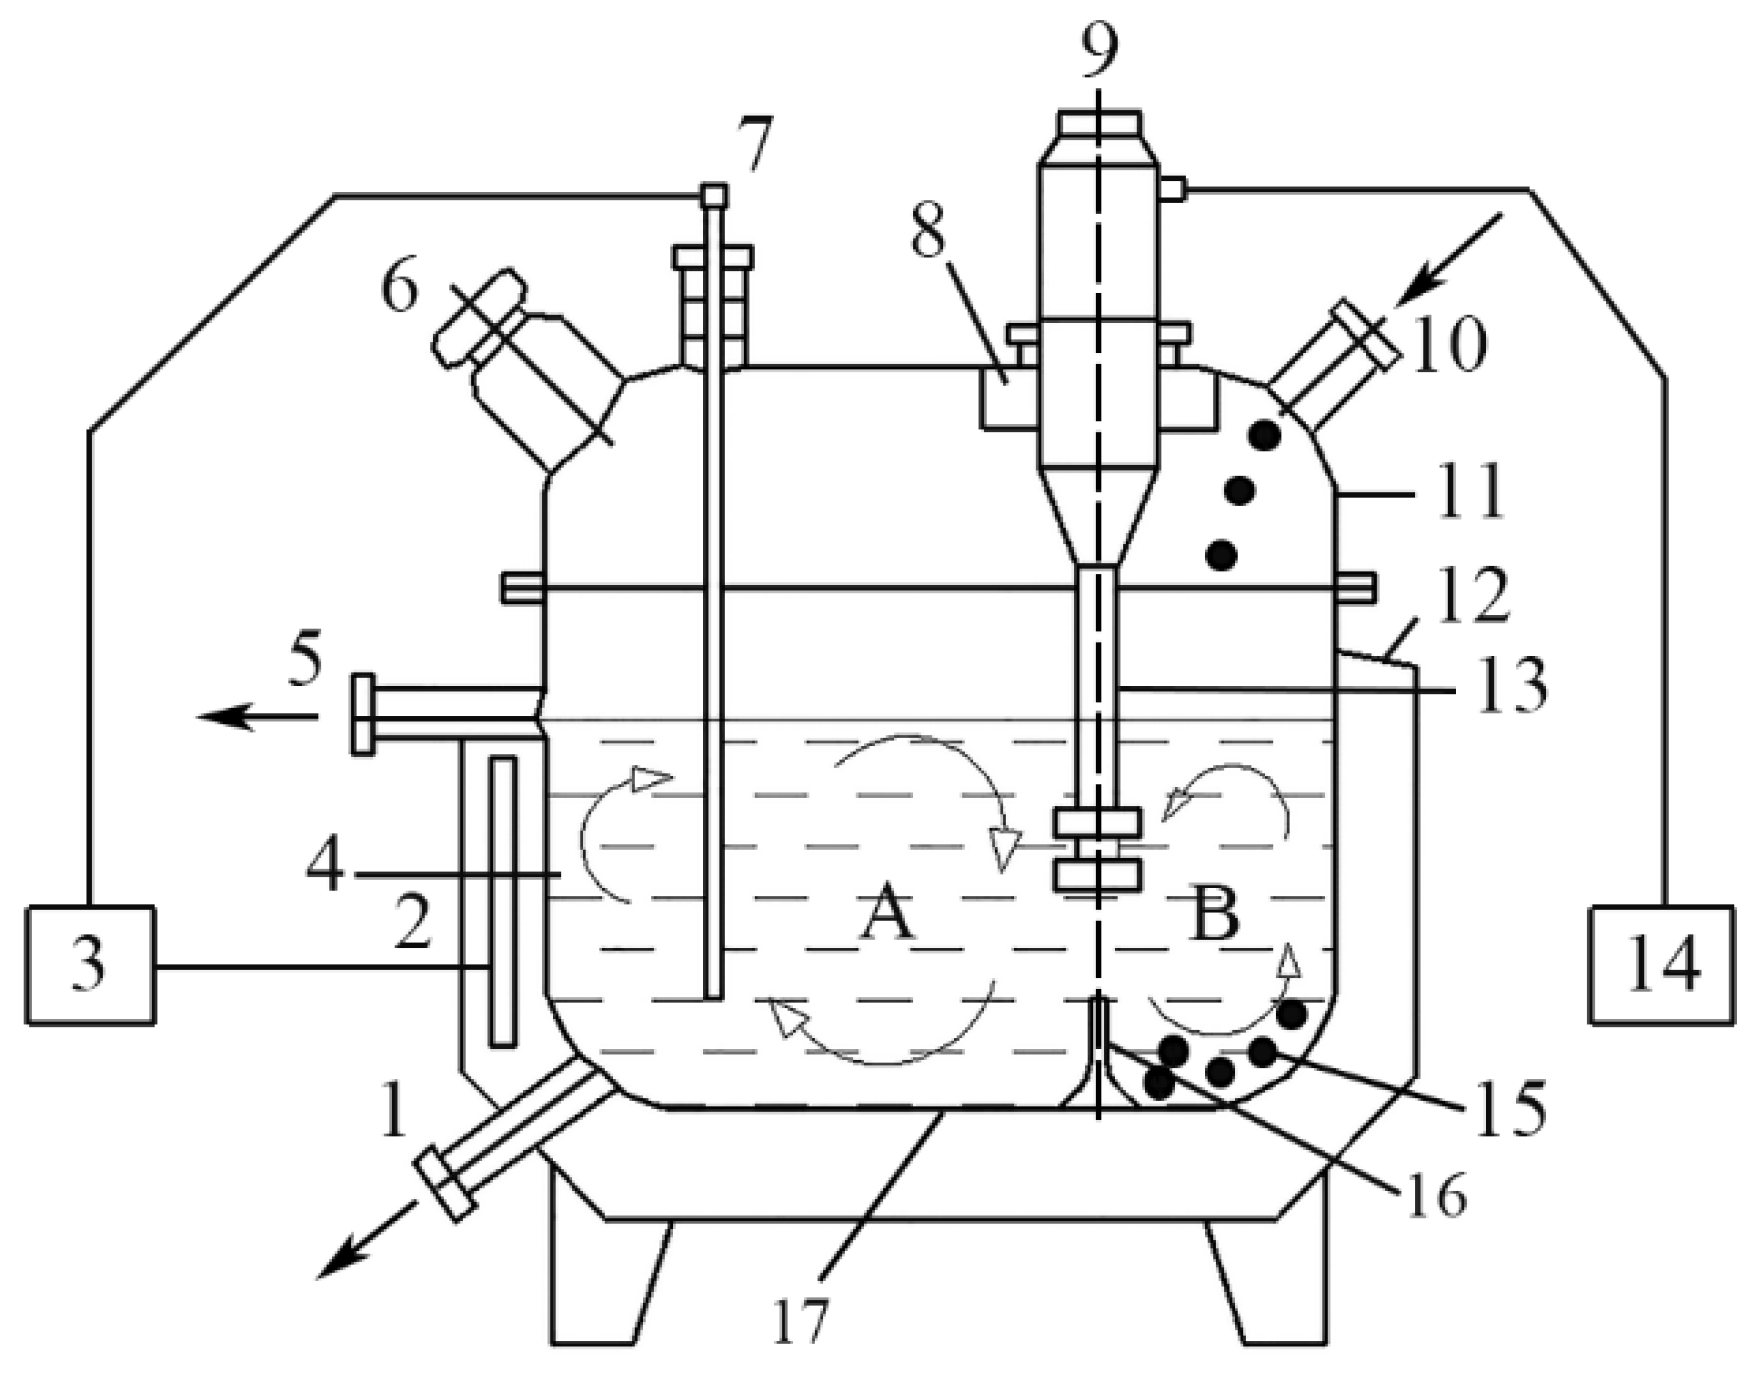
The commercial pure Al, Al–5Ti, and Al–10Ti alloys were used as the cavitation materials. High purity Al–5Ti and Al–10Ti alloys were prepared by direct reaction of pure Al and pure titanium powders, and the ultrasonic coupling device was used as shown in Figure 1. The specific preparation process was described in the previous literature [27]. The chemical composition of each material was measured by an optical emission spectrometer is shown in Table 1. Subsequently, the experimental samples (φ10 × 8 mm) were cut from the obtained ingot with a wire cutting machine. Before the experiment, the surface of the sample was polished smooth with diamond grinding paste, and the sample was polished to an average roughness (Ra) of 0.2 mm [28]. The samples were ultrasonically cleaned in a beaker of absolute ethanol, and the cleaning time for each sample was 10 min.
2.2. Cavitation Erosion Methods
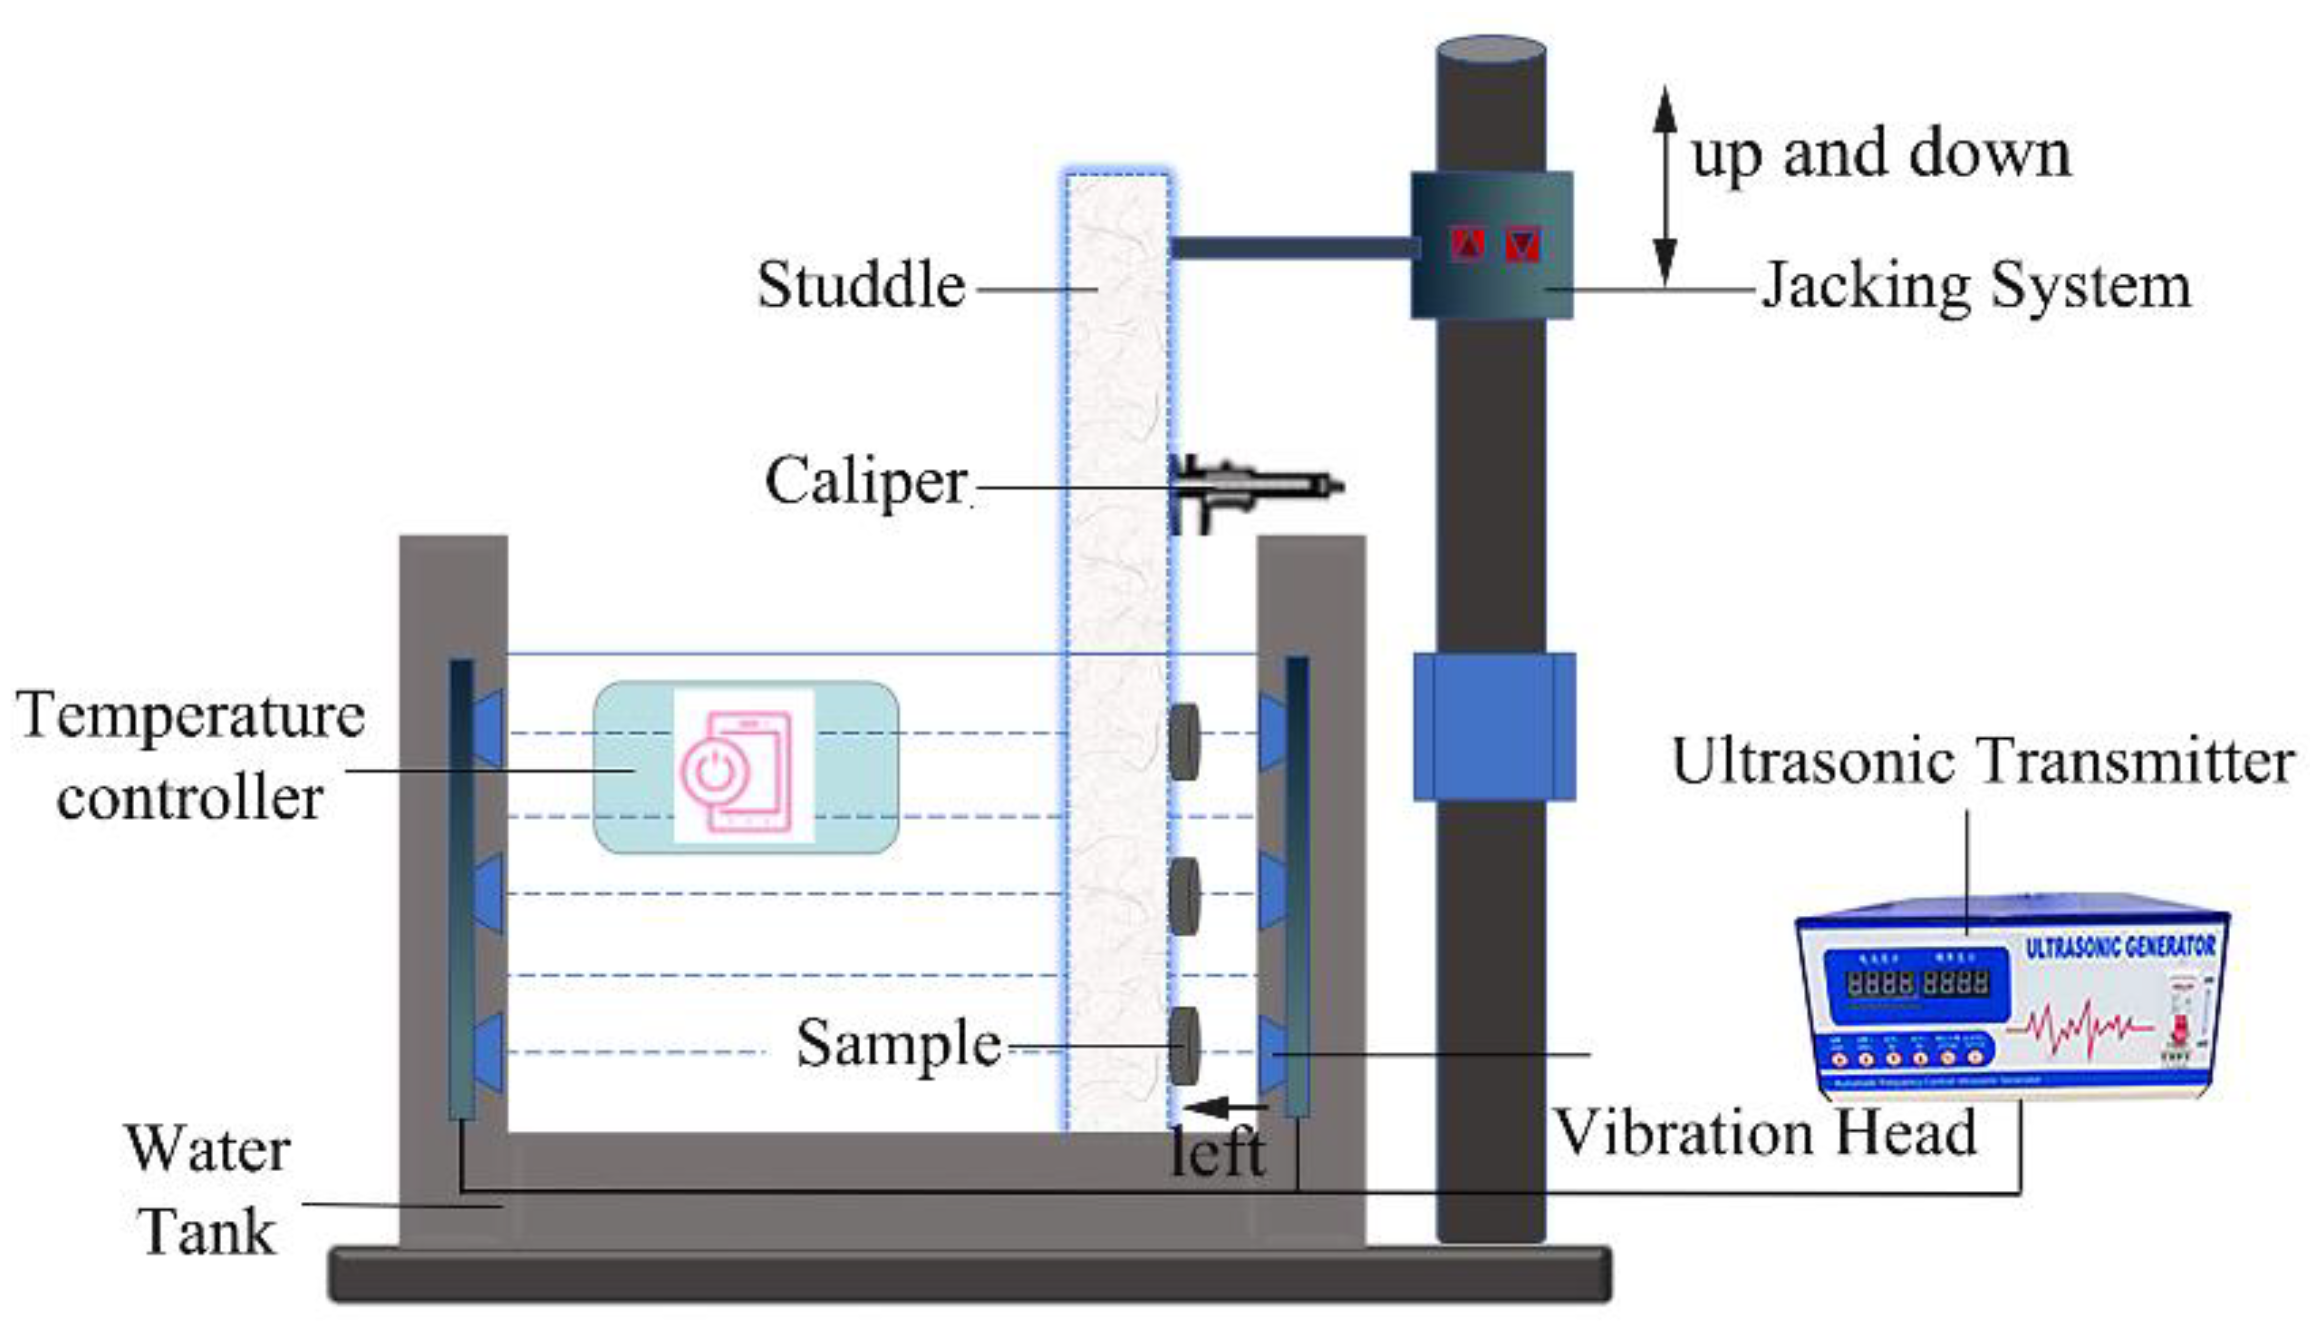
The ultrasonic cavitation erosion tests were conducted using an ultrasonic vibratory device according to ASTM Standard G32-10, and the device was shown in Figure 2. The ultrasonic vibratory frequency was 20 kHz, the peak-to-peak amplitude was 60 μm, and the distance between the samples surface and ultrasonic probe was 0.5 mm. The medium used in the ultrasonic cavitation experiment was 3.5 wt.% NaCl solution, and the distance between the liquid level and the top of the water tank was 8 ± 2 mm. The sample was fixed at the reserved position of the support rod, and the position of the support rod and the jacking system was adjusted to align the sample with the ultrasonic vibration head. Then, the temperature controller was adjusted to keep the temperature of the liquid medium at 25 ± 2 °C. After the temperature of the solution medium reached the preset value, the ultrasonic transmitter was turned on to perform the ultrasonic cavitation erosion experiment. The mass loss of samples with cavitation erosion time increasing from 5 min to 200 min was measured by an electronic balance with a sensitivity of 0.01 mg. Three parallel samples were used for the cavitation erosion experiment of each material, and the test average values of the three samples were selected as the final experimental results during data collection.
The electrochemical test system consisted of a CS310H electrochemical workstation, a computer, and a three-electrode test system. The potentiodynamic curves were tested under the conditions of cavitation and non-cavitation, and the AC impedance before and after cavitation erosion was tested. During the potentiodynamic curve test, the scanning range of the relative corrosion potential was −0.8 V to 0.8 V, and the scanning speed was 2 mV/S. The surface microhardness of the samples after cavitation erosion were measured by an MH-5L digital display Vickers hardness tester with a 50 g load for 10 s. Five measurement points were randomly selected for each sample, and finally the average of the five microhardness values was used.
3. Results and Discussion
3.1. Mass Loss
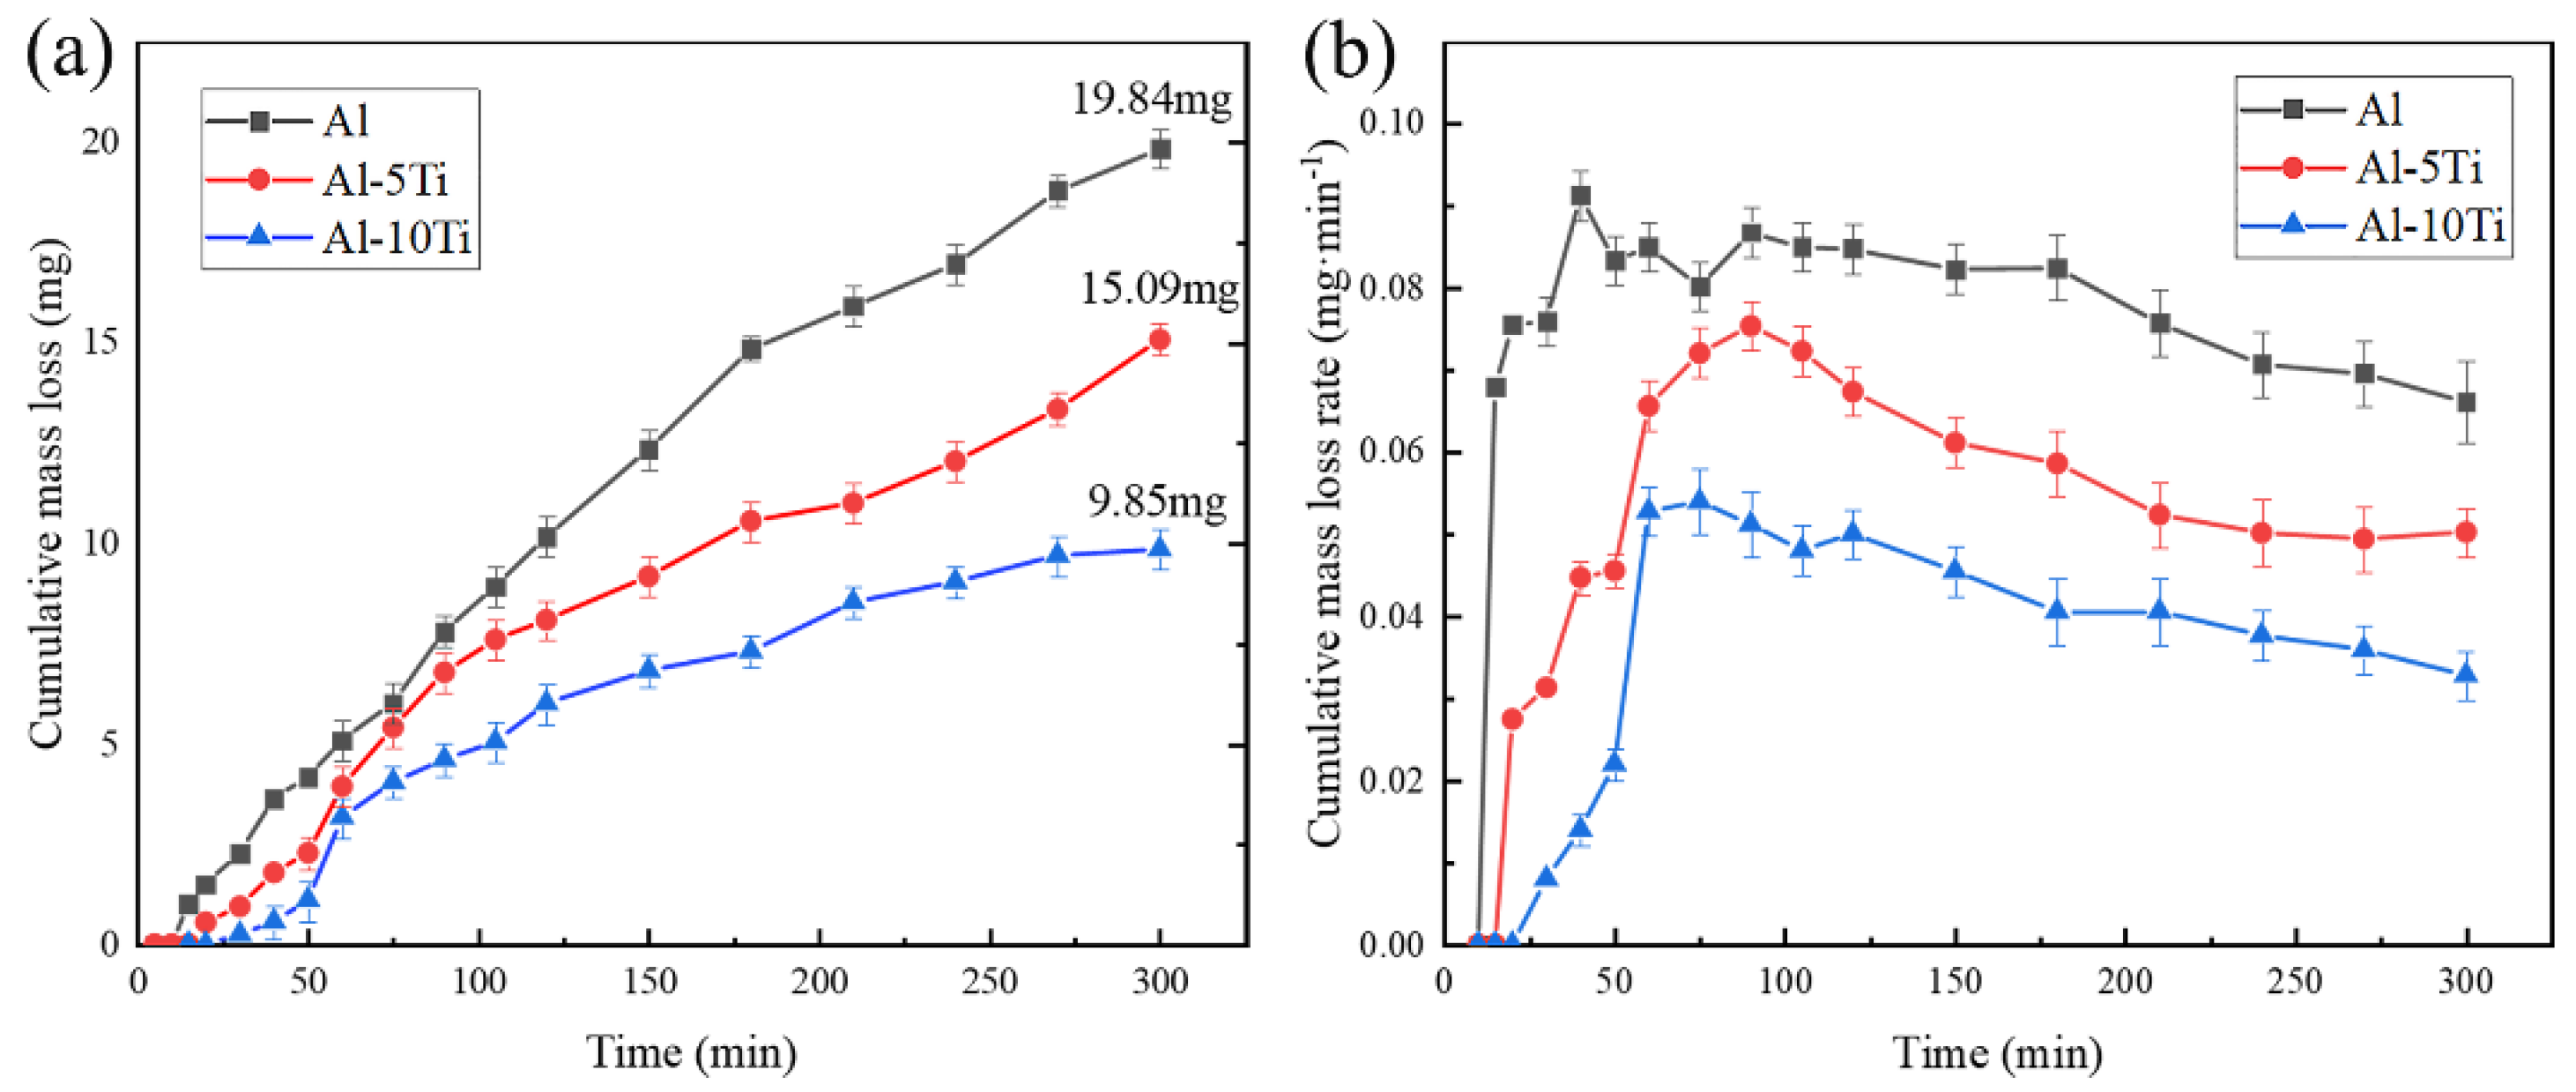
Figure 3a shows the curves of the cumulative mass loss of the Al, Al–5Ti, and Al–10Ti alloy samples with cavitation time in 3.5 wt.% NaCl solution. It is obvious that the cumulative mass loss of the three materials in the 3.5 wt.% NaCl solution was increased with the increase of cavitation time. In the early stage of cavitation, there was a period of cavitation incubation with extremely small mass changes. The incubation time of the Al, Al–5Ti, and Al–10Ti alloys was about 10 min, 20 min, and 30 min, respectively. During the progress of ultrasonic cavitation, the cumulative mass loss of the three materials increased rapidly, and the increase rate slowed down after a period of time. After cavitation erosion for 30 min, the cumulative mass loss of the Al, Al–5Ti, and Al–10Ti alloys was 19.84 mg, 15.09 mg, and 9.85 mg, respectively. Figure 3b displays the curves of the cumulative mass loss rate of the Al, Al–5Ti, and Al–10Ti alloys. When the cumulative mass loss rate of the Al–5Ti and Al–10Ti alloys was maintained at a very low constant value, the cavitation time was 10 min and 20 min, respectively. However, the cavitation erosion experiment of the Al sample almost had no such process, but quickly entered the rising period of cavitation erosion. After cavitation erosion for 50 min, the cumulative mass loss rate of the Al sample reached the maximum and maintained stability for a period of time. The Al–5Ti and Al–10Ti alloys entered the rising period of the cavitation erosion relatively late. The cumulative mass loss rates reached the maximum and remained stable at about 100 min and 70 min, respectively, and then decreased slightly. After cavitation erosion for 300 min, the ultrasonic cavitation erosion damage of the Al sample in 3.5 wt.% NaCl solution was more serious than that of the Al–10Ti sample.
Table 1 shows the weight loss, incubation period, and cavitation erosion resistance of the Al, Al–5Ti, and Al–10Ti alloys in 3.5 wt.% NaCl solution. The cavitation resistance coefficients (Re) of the Al, Al–5Ti, and Al–10Ti alloys in 3.5 wt.%NaCl solution were 0.53 h/μm, 0.73 h/μm, and 1.12 h/μm, respectively. The results shows that the Al–10Ti sample had the best cavitation corrosion resistance, and the Al sample had the worst cavitation corrosion resistance.
3.2. Cavitation Erosion Morphology
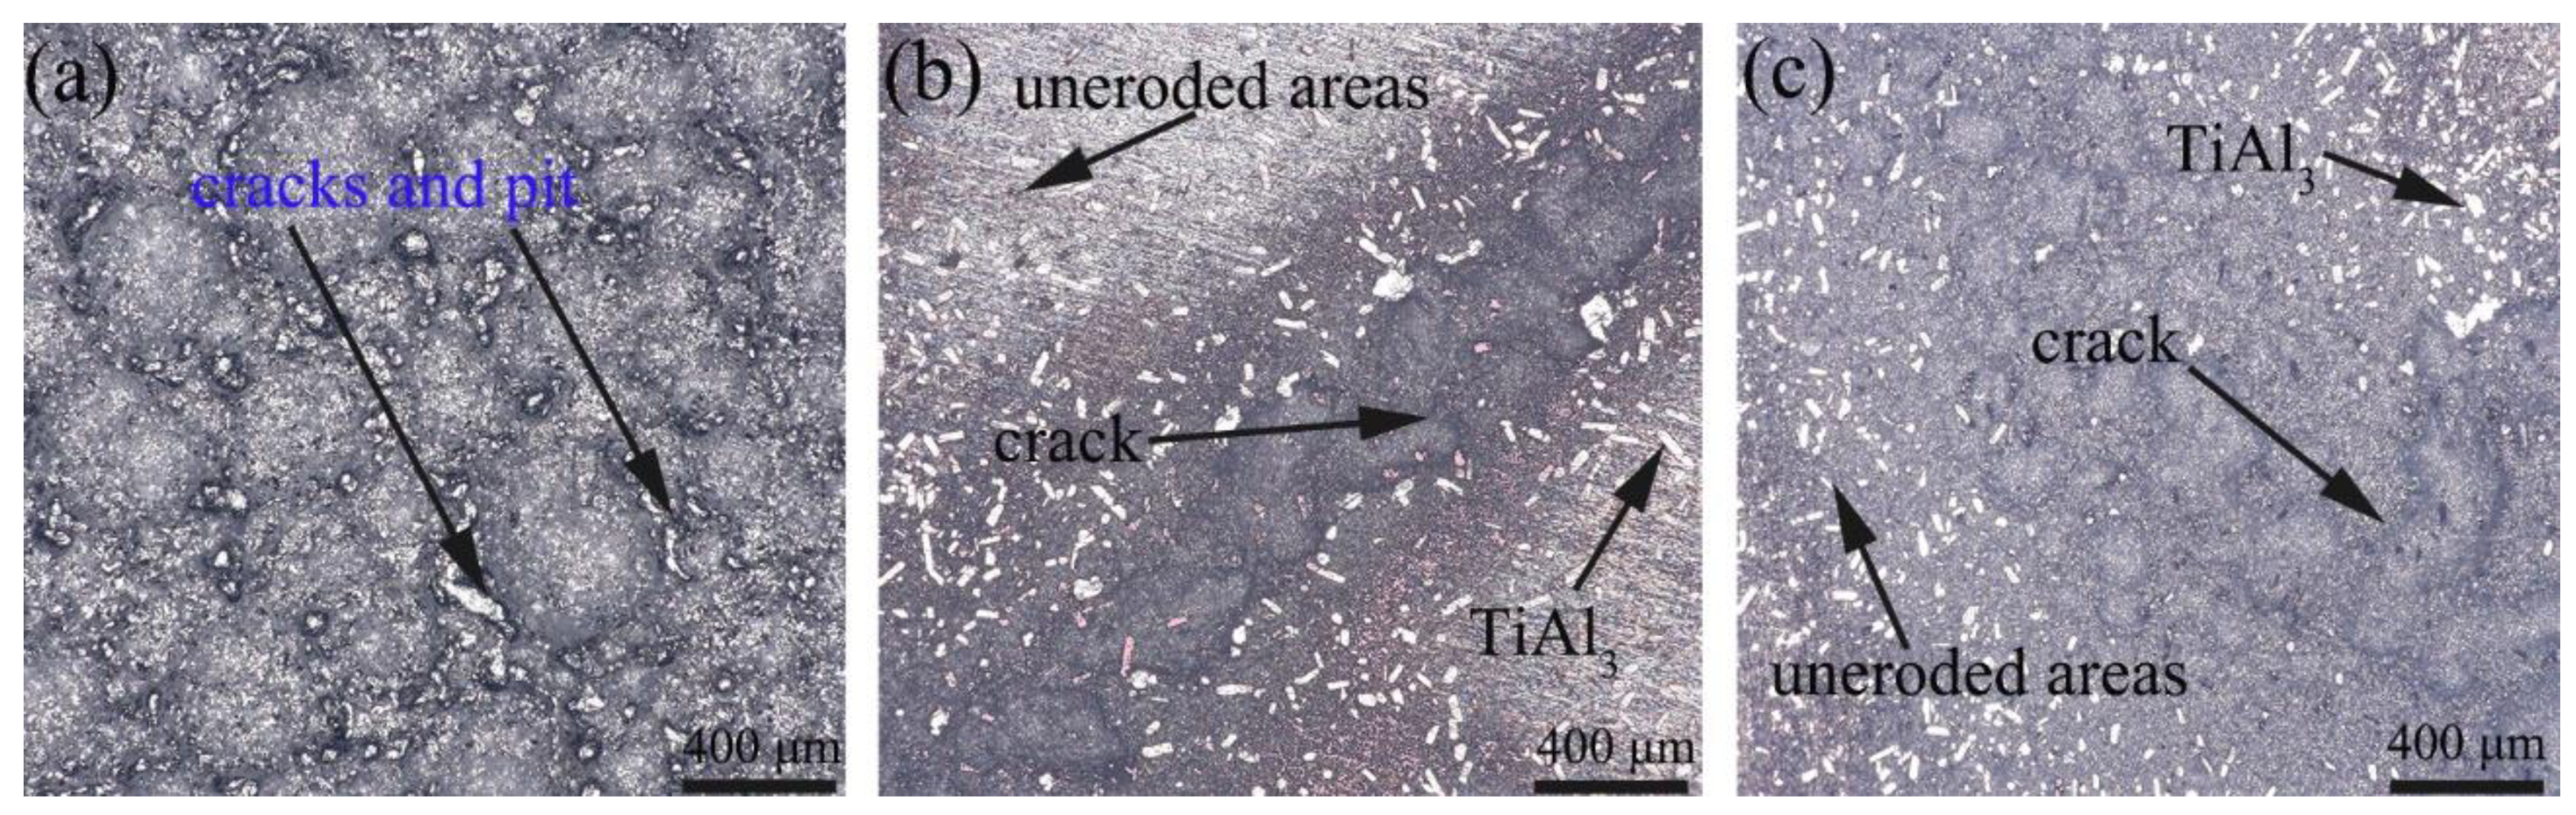
Figure 4 shows the metallurgical structure images of the Al, Al–5Ti, and Al–10Ti samples after cavitation erosion for 60 min in 3.5 wt.% NaCl solution. Obviously, the surface erosion of the Al sample was relatively serious, and many cavitation pits appeared on the whole sample surface. The difference among them is that there were uneroded areas on the surface of the Al–5Ti and Al–10Ti samples, and the surface erosion of the Al–5Ti samples was more serious.
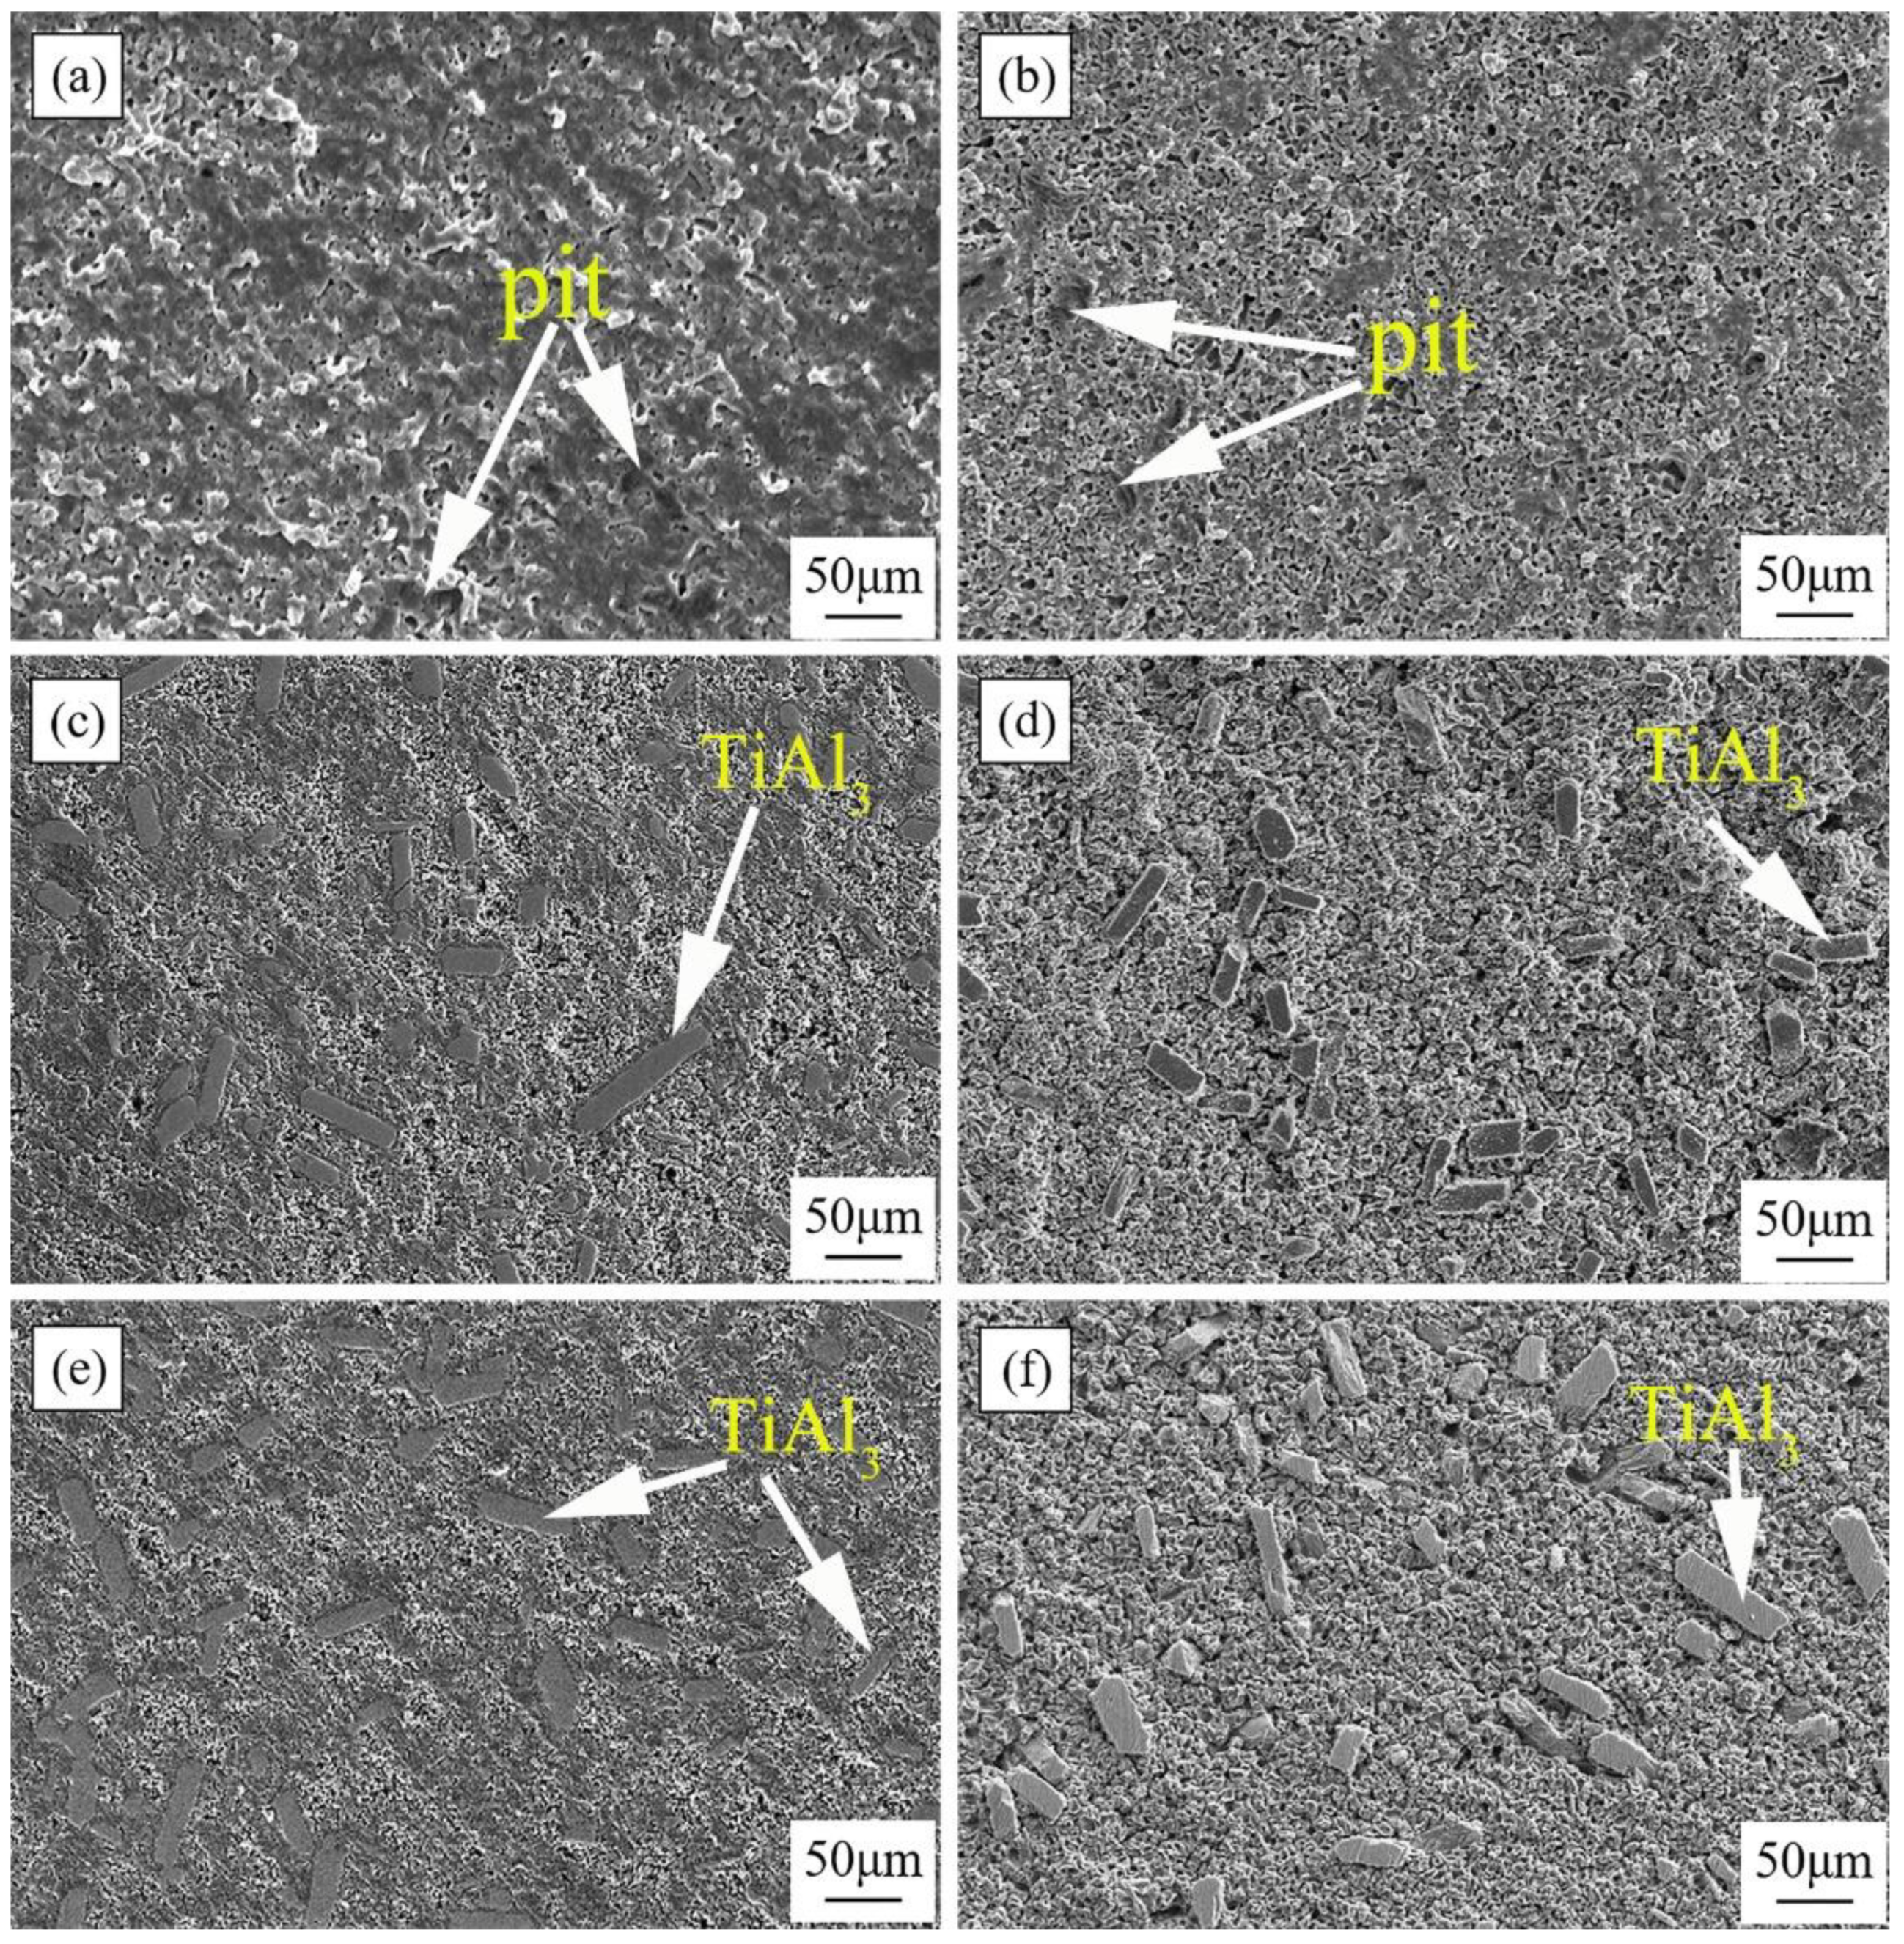
Figure 5 shows the surface morphologies of the Al, Al–5Ti, and Al–10Ti alloy samples after cavitation erosion for 10 min and 30 min in 3.5 wt.% NaCl solution. Obviously, the cavitation erosion occurred on the surface of the three materials after cavitation erosion for 10 min. This is because the high-frequency oscillations in the ultrasonic cavitation experiment produced positive and negative sound pressures, resulting in the growth, contraction, and even collapse of cavitation nuclei in the solution. The energy impact generated when the cavitation bubble collapsed made the surface of the sample uneven. Cavitation pits can be observed on the surface of the Al sample after cavitation erosion for 30 min, and the sample surface became very coarse, implying the heavy damage of the Al sample (Figure 5b). Compared with cavitation erosion for 10 min, the TiAl3 phase was obviously exposed on the surface of the Al–5Ti and Al–10Ti samples, indicating that cavitation erosion aggravated the peeling of the material surface, as shown in Figure 5d,f. Moreover, the surface damage degree of the Al–5Ti and Al–10Ti samples was less than that of the Al samples with the same cavitation time; the main reason for this phenomenon may be the existence of TiAl3 and its improvement of the cavitation resistance, as similar reports are mentioned in the literature [27].
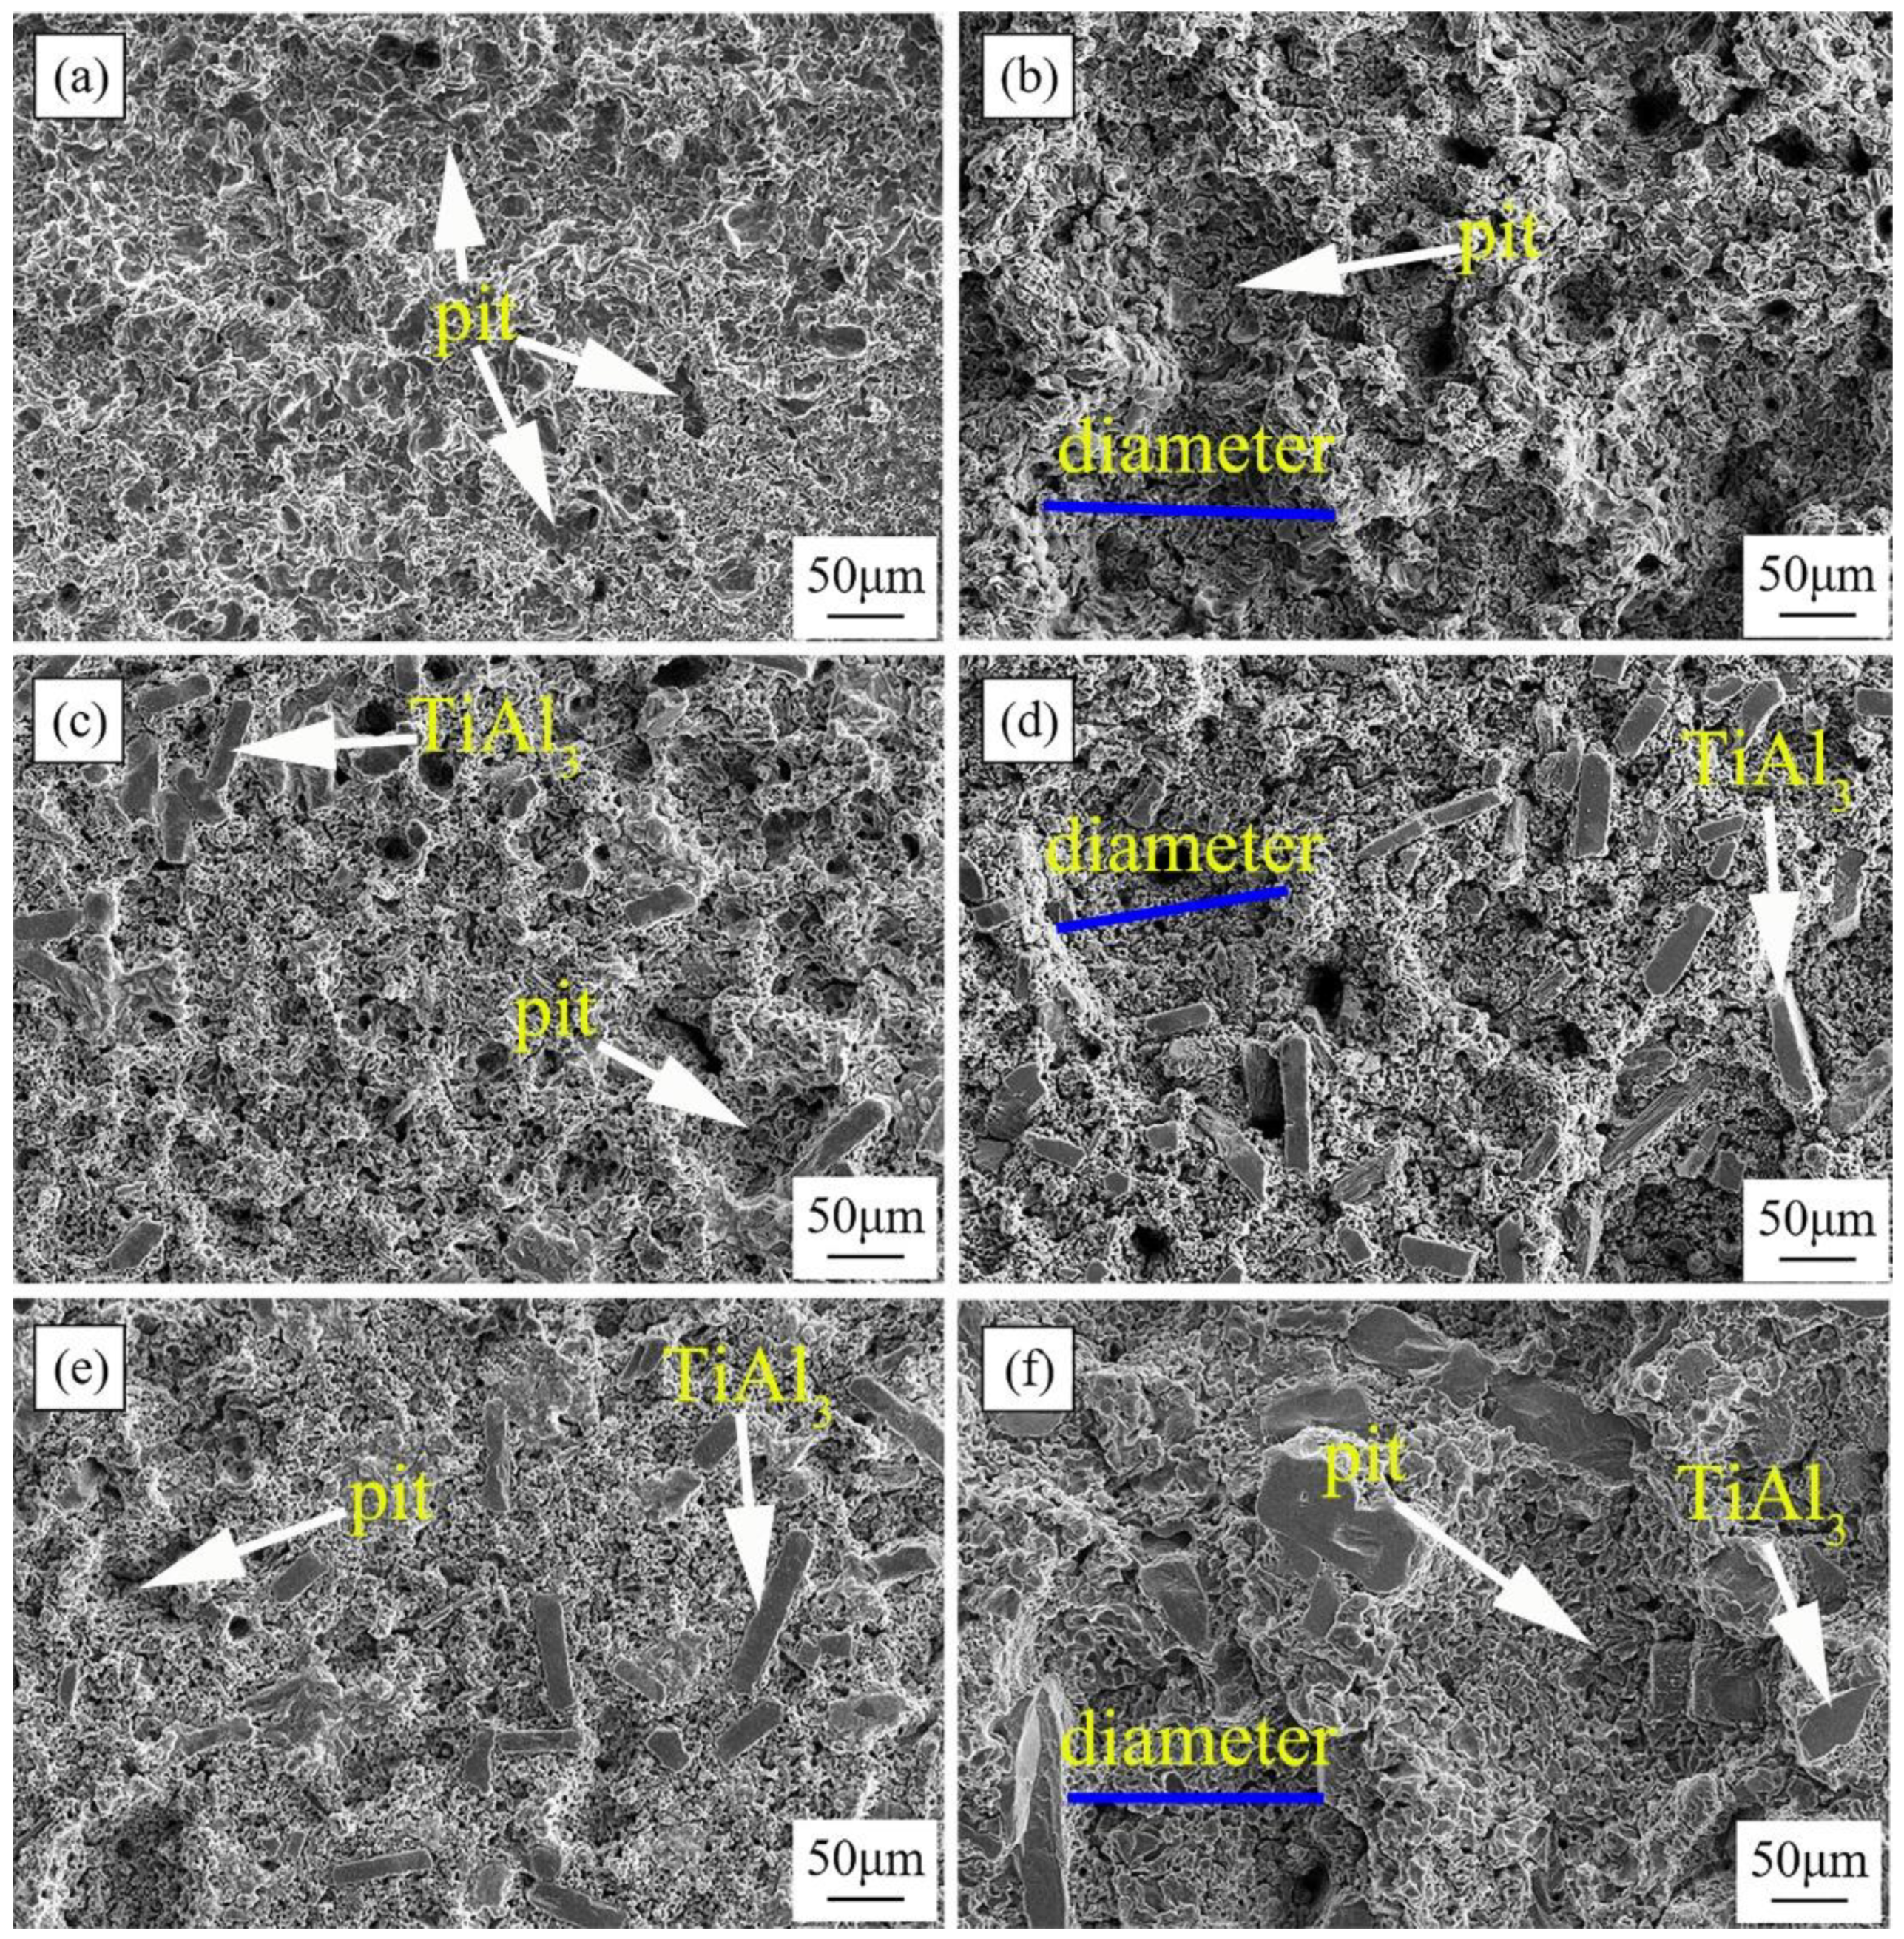
Figure 6a,c,e shows the SEM results of the Al, Al–5Ti, and Al–10Ti samples after cavitation erosion for 120 min, and Figure 6b,d,f shows the SEM results of the Al, Al–5Ti, and Al–10Ti samples after cavitation erosion for 300 min. Compared with cavitation erosion for 30 min, the surface roughness of the three materials increased after cavitation erosion for 120 min, and the cavitation damage was more serious. Cavitation pits were formed under the repeated action of high-speed microjets and shock waves, and the material surface was gradually damaged and slowly peeled off. The diameter of the cavitation pit was about 20 μm, and some cavitation pits reached 50 μm. Compared with the Al samples, the surface damage of the Al–5Ti and Al–10Ti samples was smaller due to the presence of TiAl3, which prevented the development of cavitation pits and cracks. This is a confirmation that intermetallic particles improve the cavitation resistance of materials, as Tocci [29] reported in previous studies. After cavitation erosion for 300 min, the cavitation pits on the surface of the material gathered and developed into an irregular cavitation pit group. The maximum diameter of the cavitation pit group exceeded 100 μm. The TiAl3 on the surface of the Al–5Ti and Al–10Ti samples fell off, exposing the TiAl3 phase in the matrix, as shown in Figure 6f.
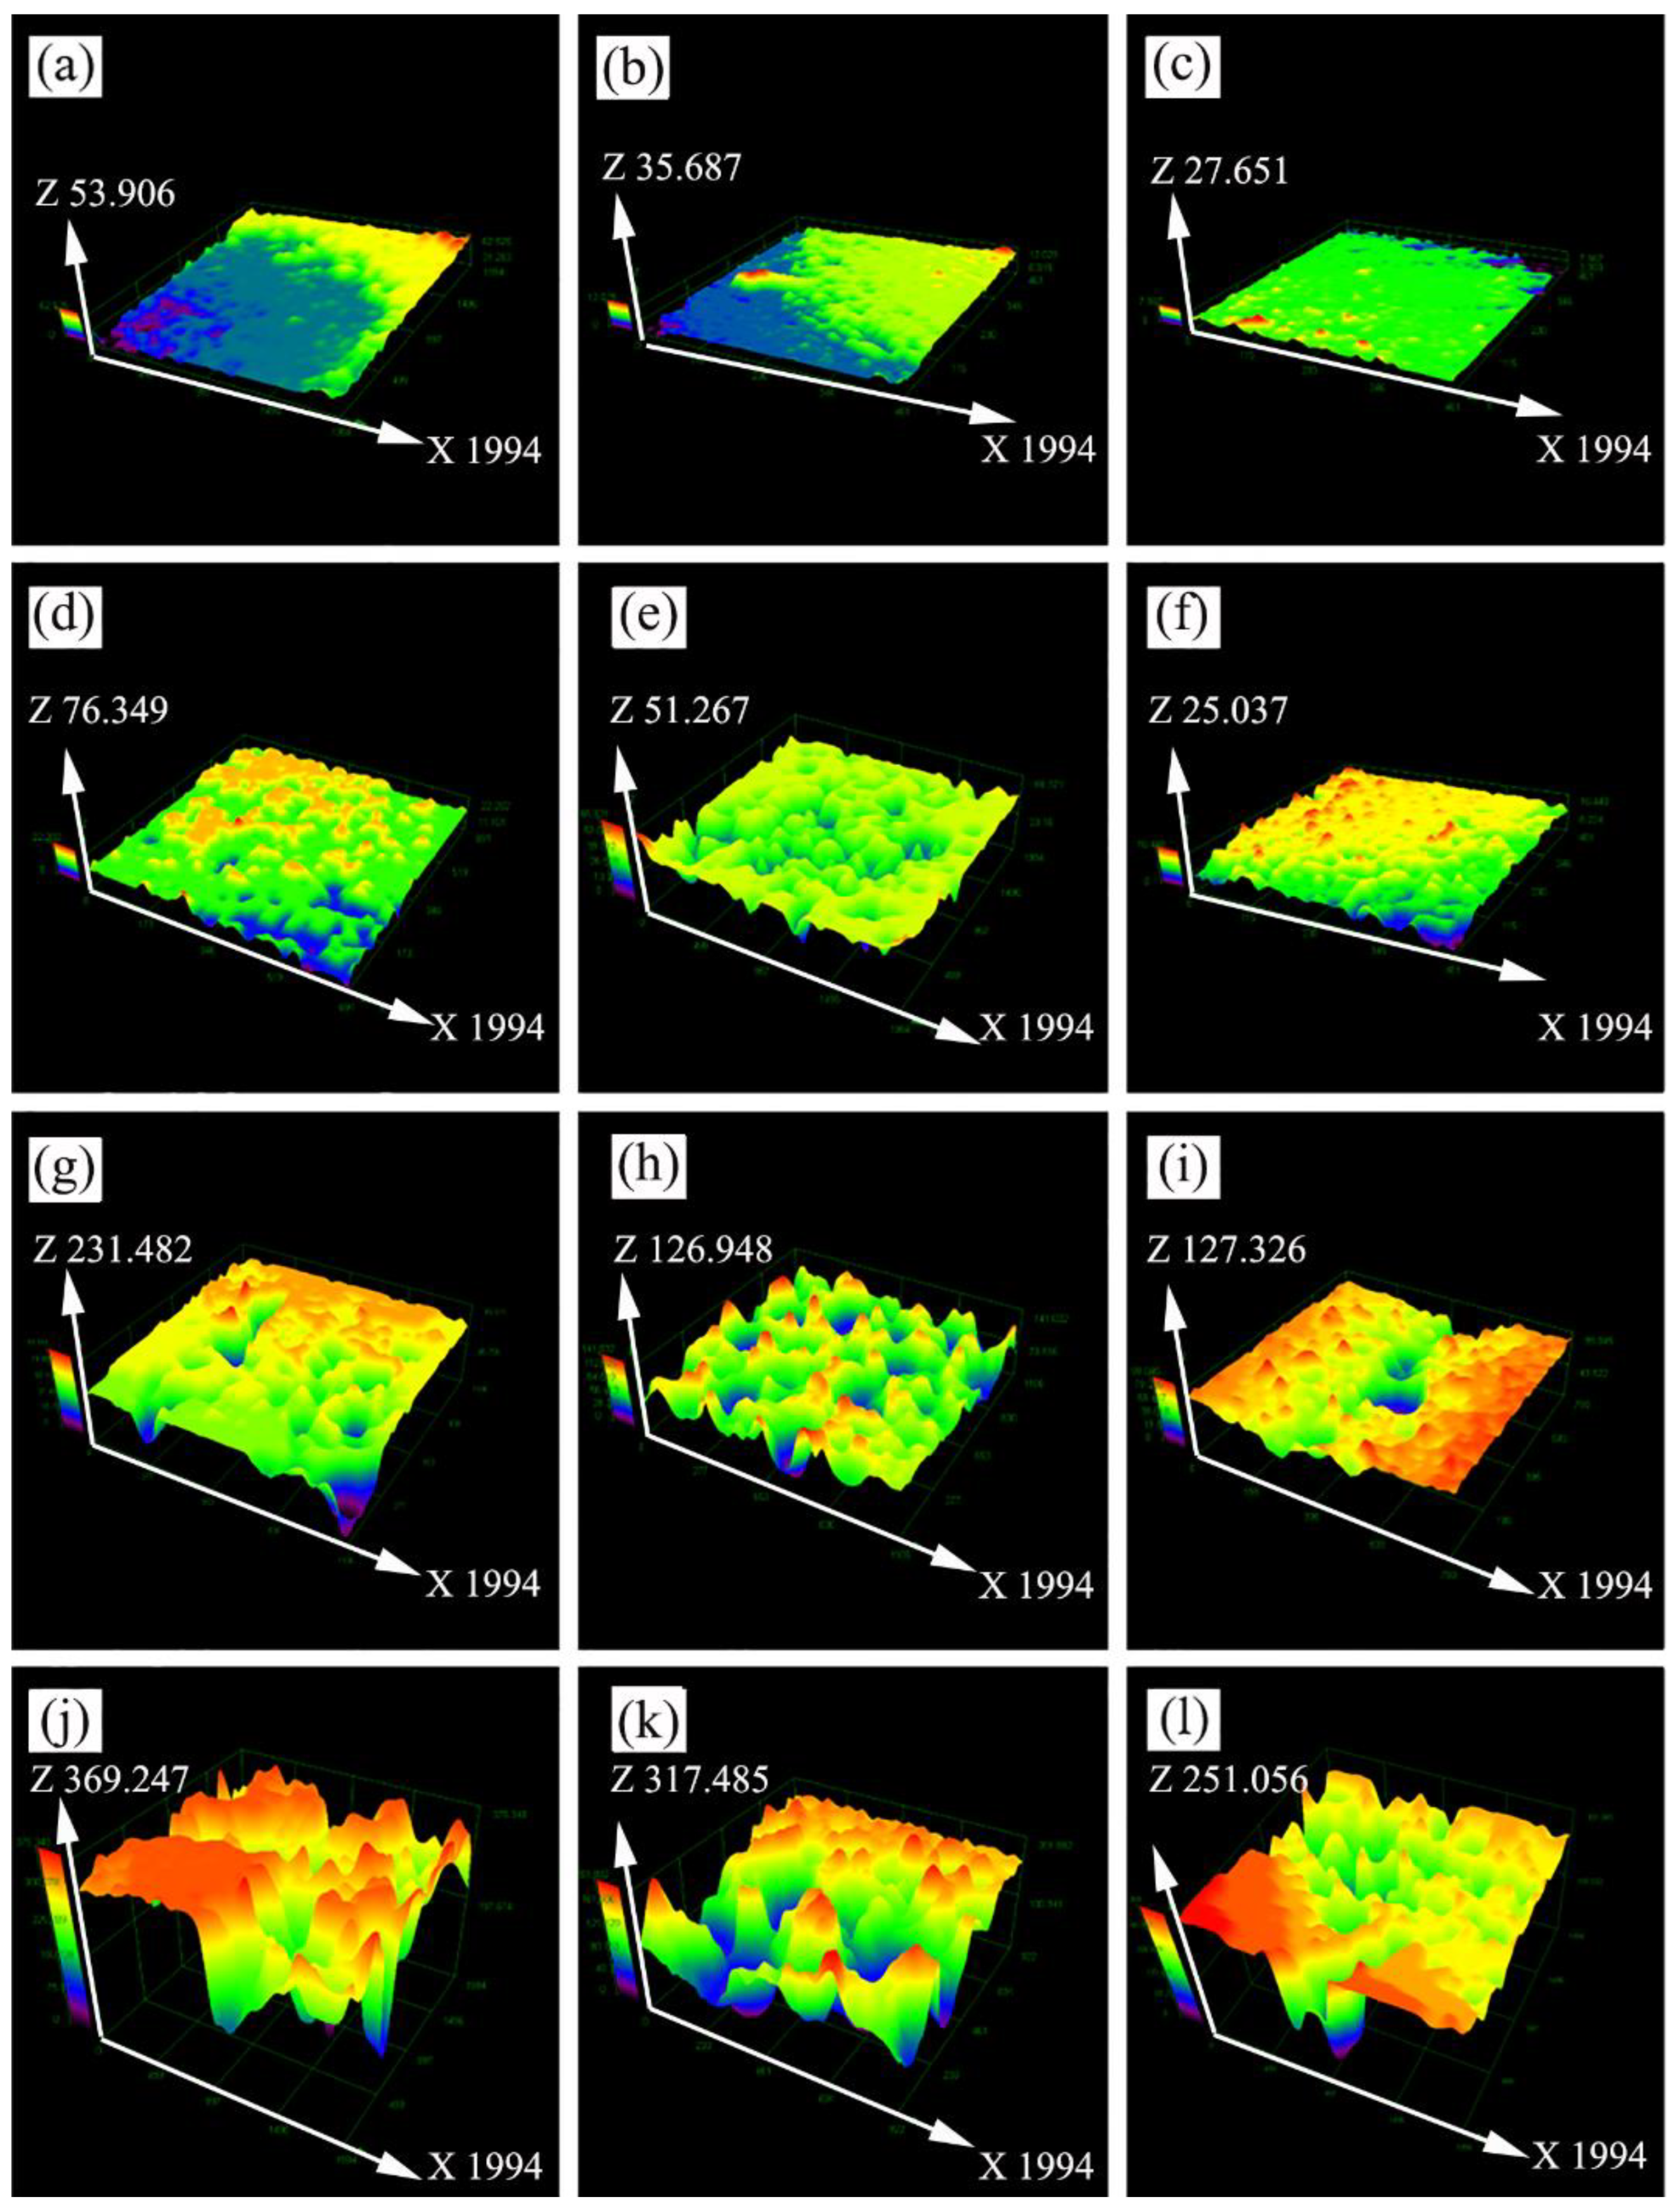
To further analyze the surface damage, the three-dimensional morphologies of the Al, Al–5Ti, and Al–10Ti samples after different cavitation erosion times are shown in Figure 7. It should be noted that the Z-axis scale of the three-dimensional morphology is enlarged by 2.3 times. After cavitation erosion for 10 min, the surface of the three materials remained basically intact (only local unevenness and small pits appeared), which was attributed to the cavitation erosion resistance of the material being weaker than the high intensity energy caused by a single near-wall cavitation bubble collapse, as shown in Figure 7a–c. However, the surface fluctuation of the pure Al was more obvious, as the number of pits was significantly larger than that of the Al–5Ti and Al–10Ti alloys, implying the cavitation damage was more serious. Figure 7d–f shows the three-dimensional morphologies of the Al, Al–5Ti, and Al–10Ti samples after cavitation erosion for 30 min in 3.5 wt.% NaCl solution. Obviously, the original part of the material surface was partially damaged, with some orange bulges and dark blue low-lying areas. After cavitation erosion for 120 min, cavitation pits with larger surface areas were formed in these areas under the repeated impact of ultrasonic cavitation bubbles and microjet action, as shown in Figure 7g–i. In addition, the surface roughness of the three materials was significantly increased, and the enlarged cavitation pits were gathered to form a honeycomb feature. After cavitation erosion for 300 min, the damage of the material surface became very serious, and the size and depth of cavitation pits were further expanded under the continuous collapse of a large number of cavitation bubbles, as shown in Figure 7j–l.
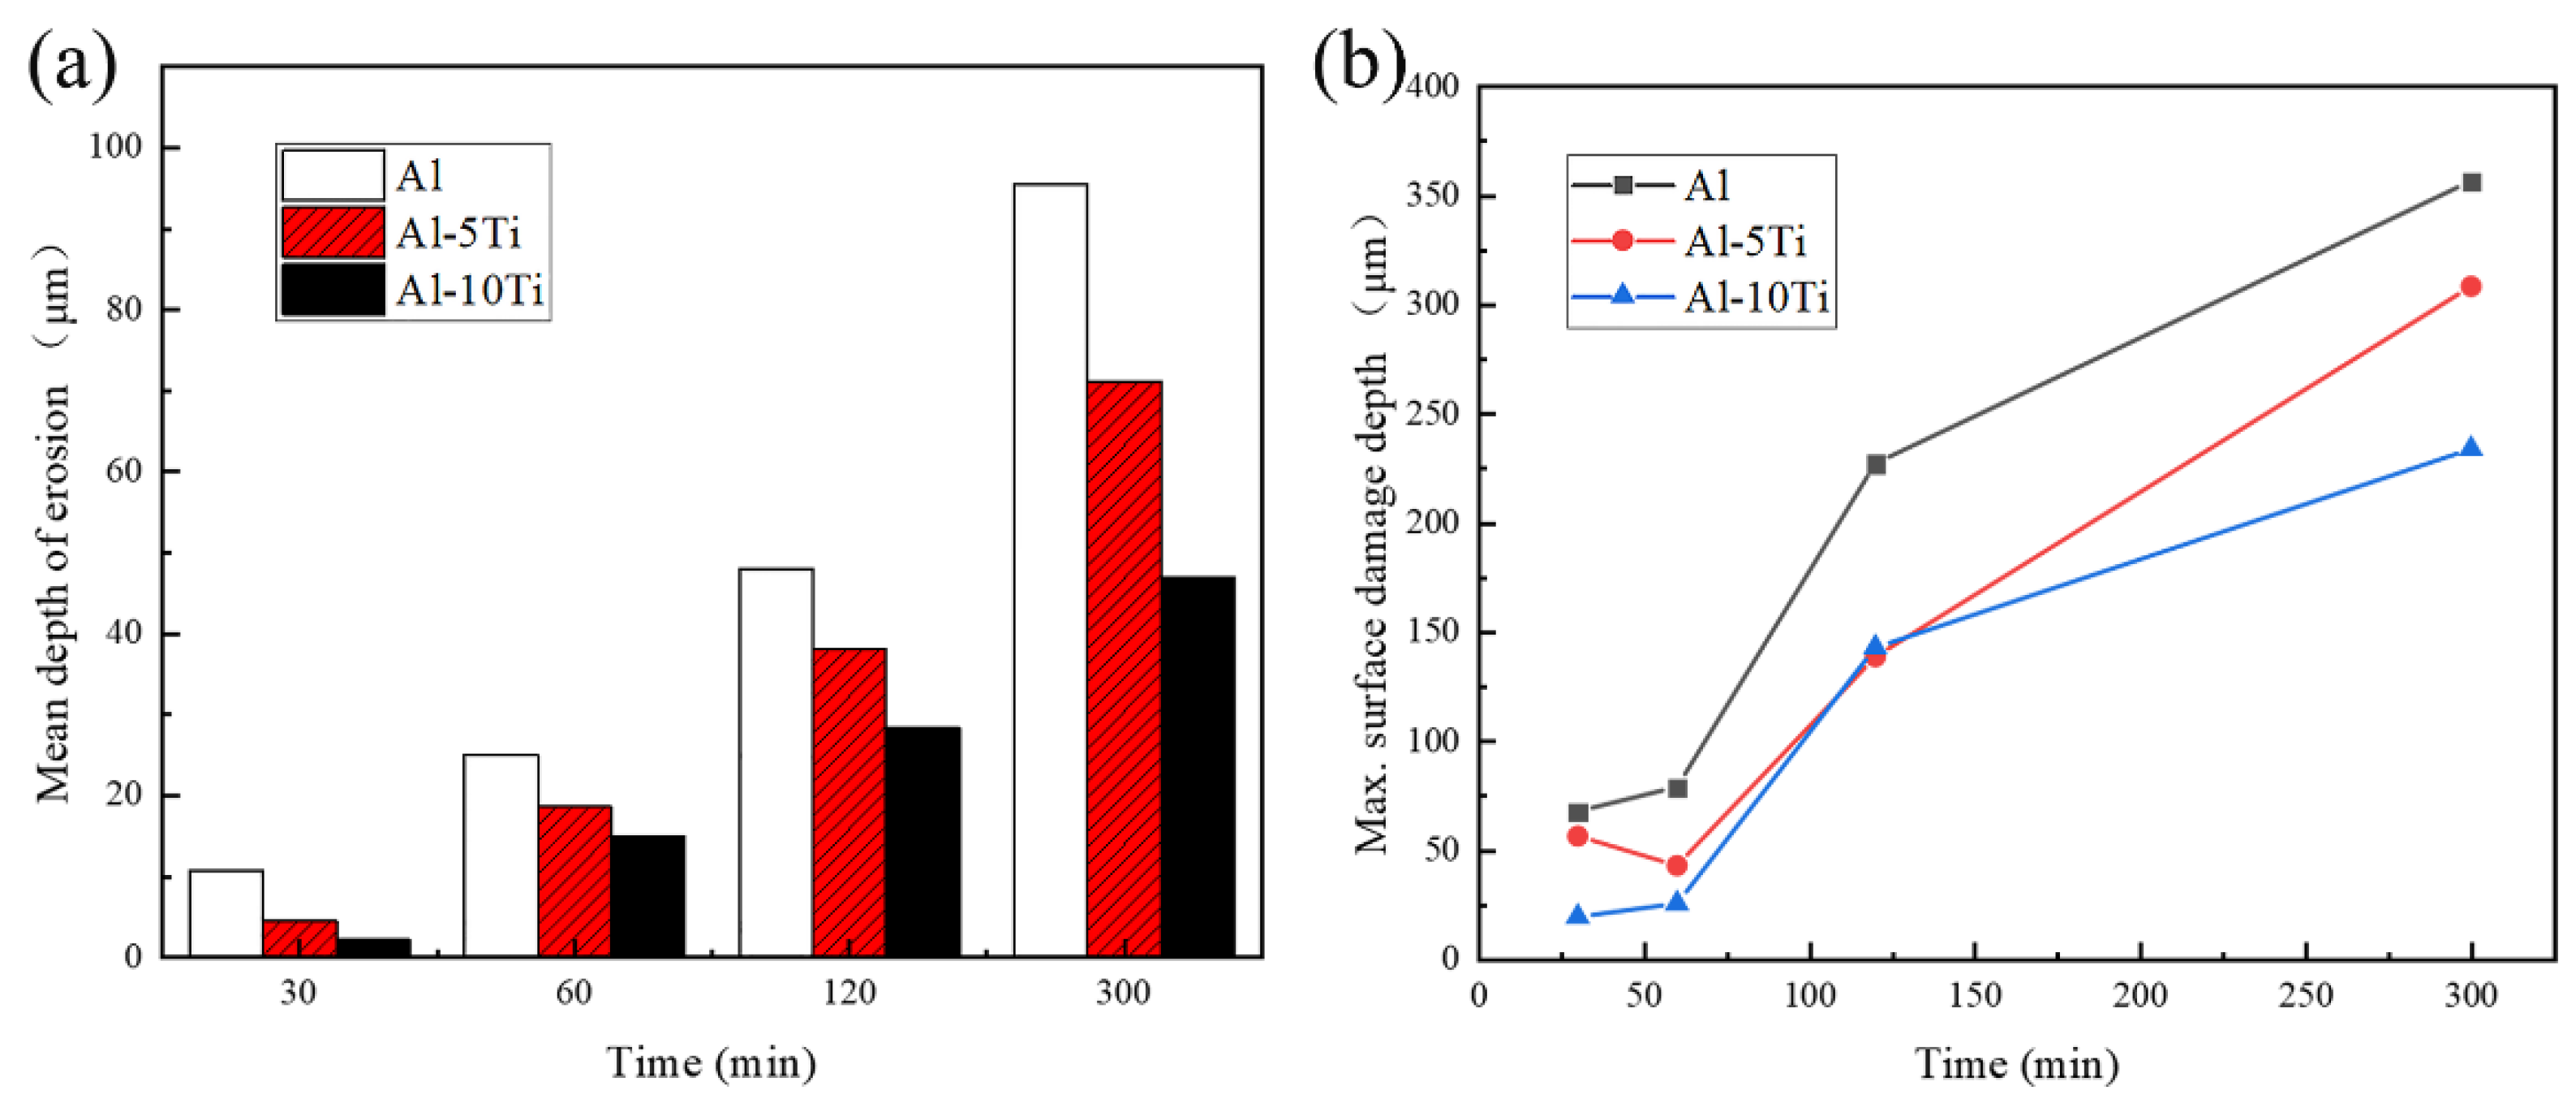
Figure 8a shows the mean depth of erosion of the Al, Al–5Ti, and Al–10Ti alloy samples after cavitation erosion for different times, and Figure 8b shows the maximum surface damage depth of the samples. Obviously, the variation trend of the mean depth of erosion and the maximum surface damage depth of the three materials was consistent, and all of them increased with the increase of cavitation erosion time. In each cavitation cycle, the Al sample had the largest cavitation depth, and the Al–10Ti sample had the smallest cavitation depth. After cavitation erosion for 30 min, the Al–5Ti and Al–10Ti samples were still in the incubation period. After cavitation erosion for 60 min, the growth rate of the mean depth of erosion and the maximum surface damage depth of the sample suddenly increased. This is because the three materials entered the cavitation steady stage, and localized erosion caused the surface damage depth to increase. It has been reported that the localized erosion occurs by the concentration of the core of cavitation in deep pits [30]. After cavitation erosion for 300 min, the maximum surface damage depth of the Al, Al–5Ti, and Al–10Ti samples reached the maximum value, which indicates that the Al–10Ti samples had the best cavitation resistance. The cavitation erosion depth of the sample after cavitation erosion for different times is consistent with that reported in previous research [27].
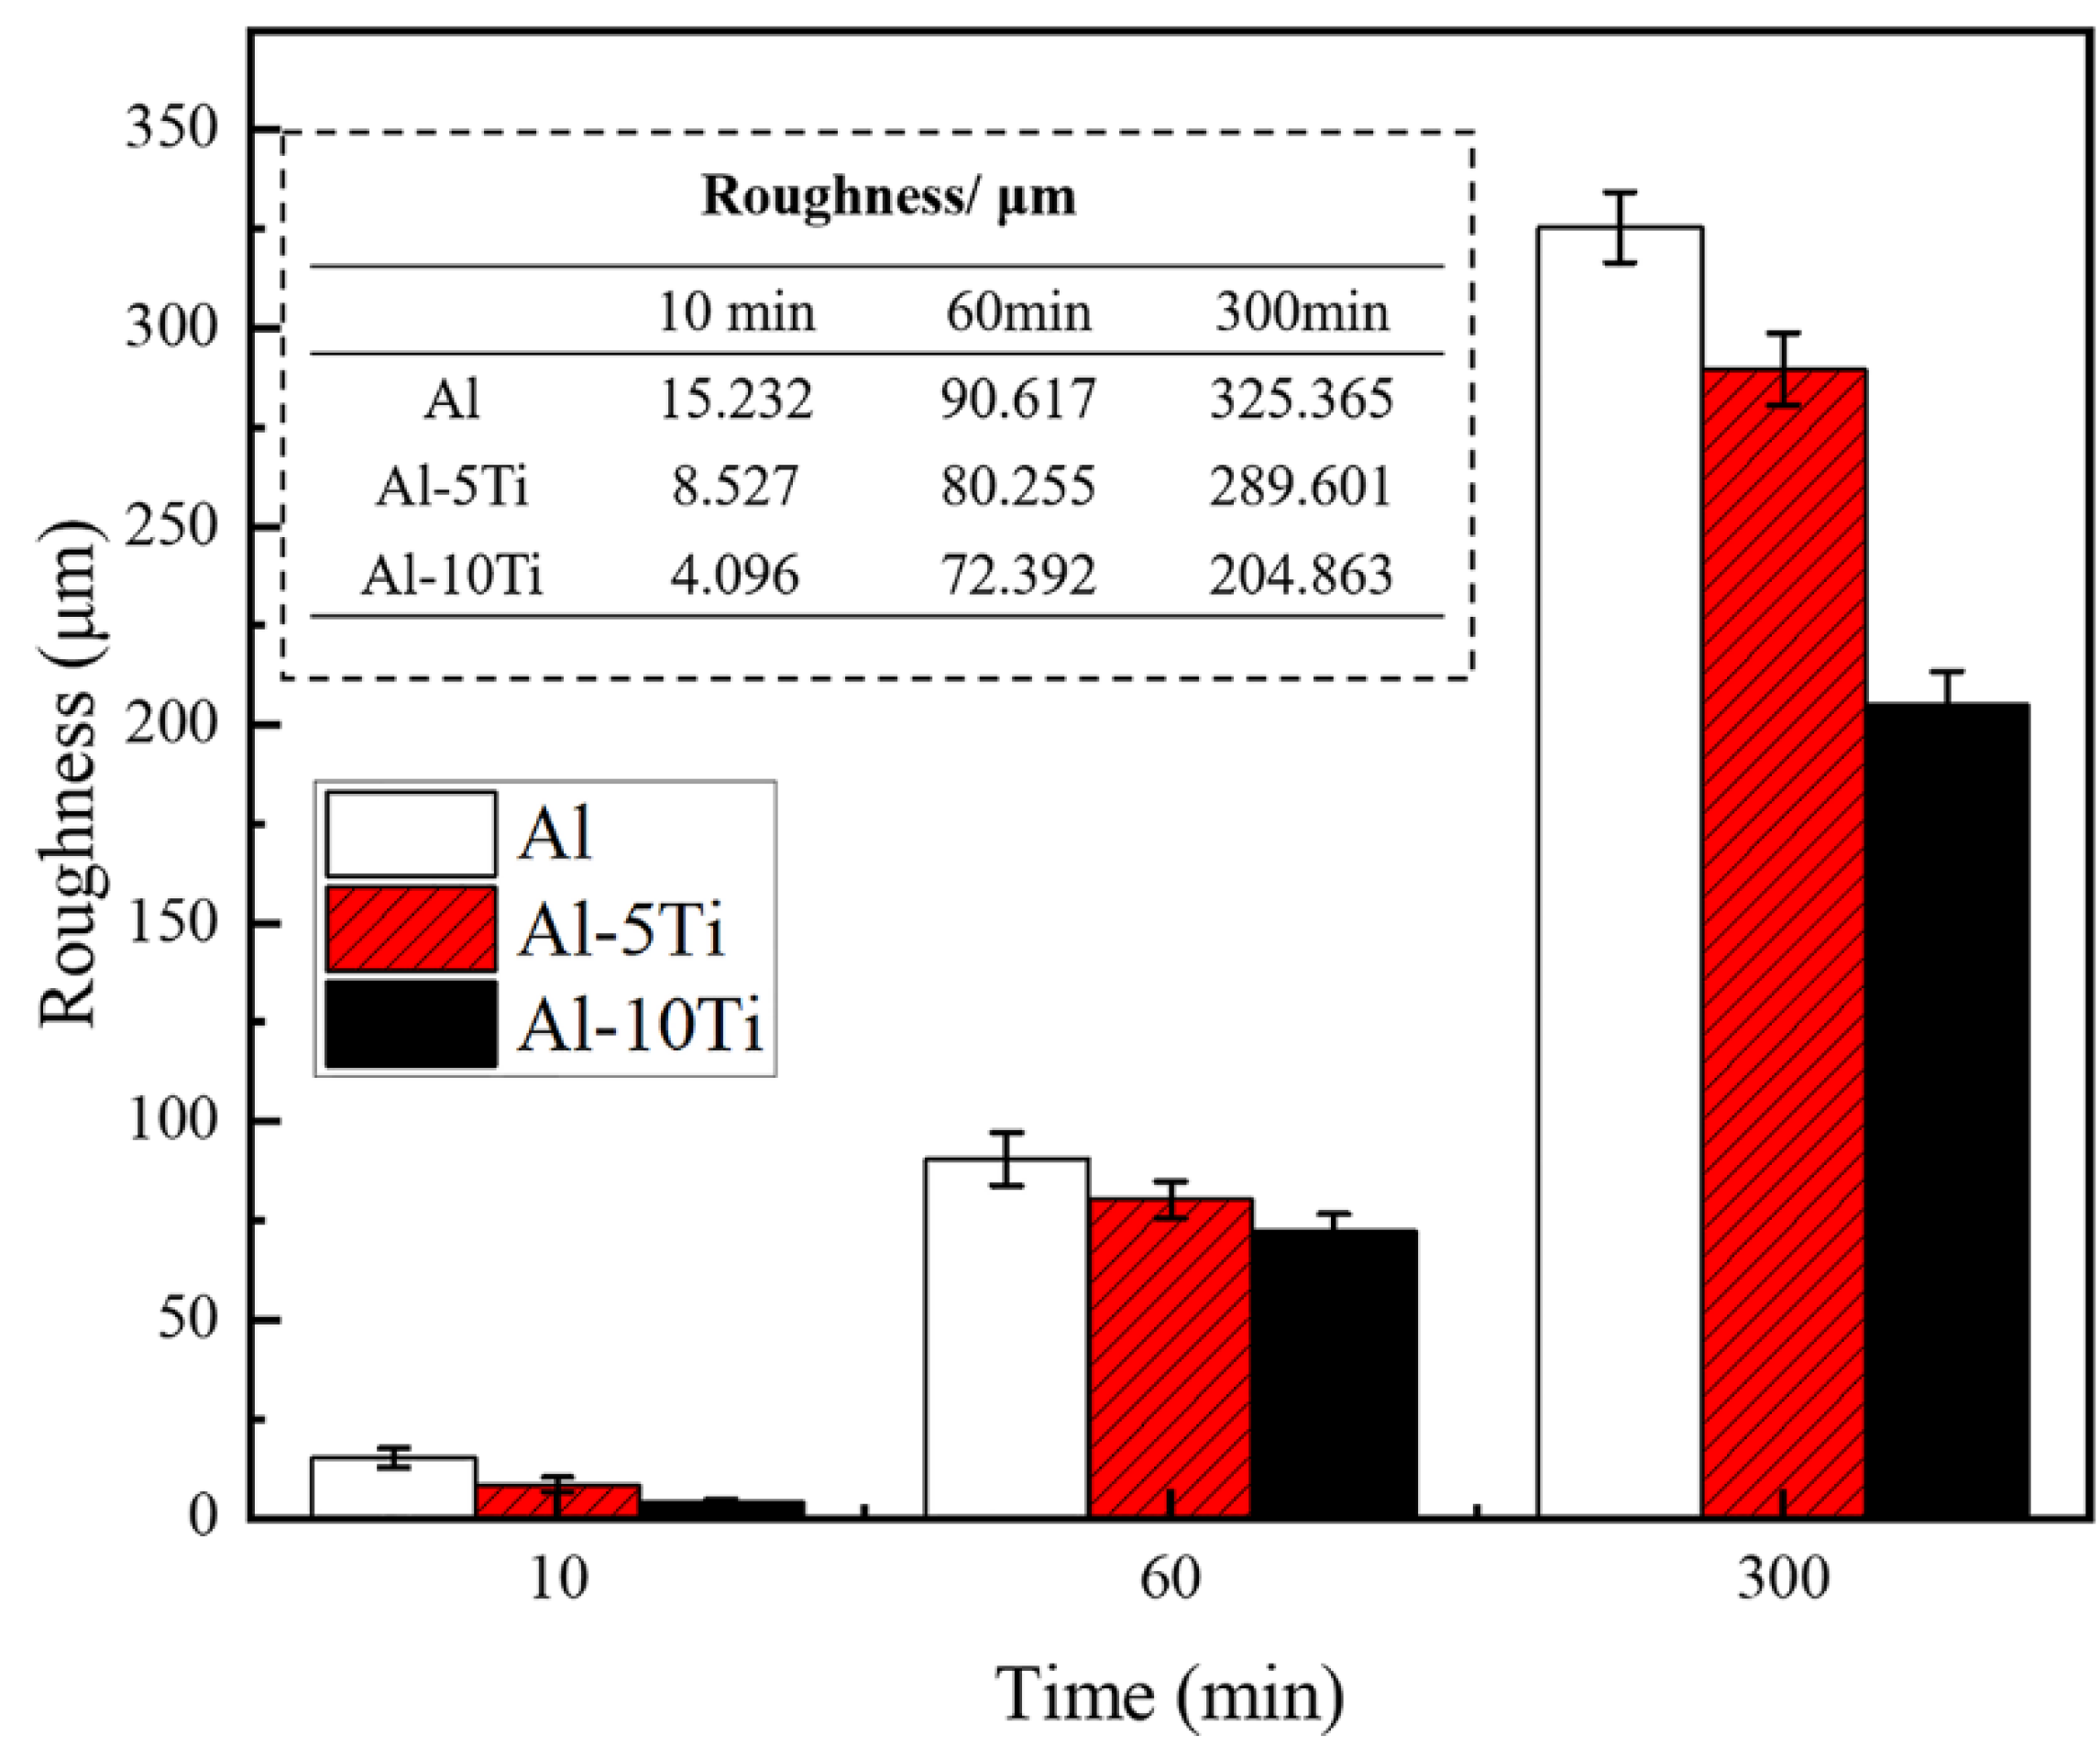
Figure 9 shows the average surface roughness of the Al, Al–5Ti, and Al–10Ti samples after cavitation erosion for different times in 3.5 wt.%NaCl solution. The surface roughness of materials could directly reflect the damage degree caused by cavitation erosion. The change trend of the surface roughness was similar to that of the erosion depth, and the roughness of the three materials increased with the cavitation erosion time. The results of the surface roughness indicate that the Al sample had serious surface damage and the worst cavitation resistance among the three alloys.
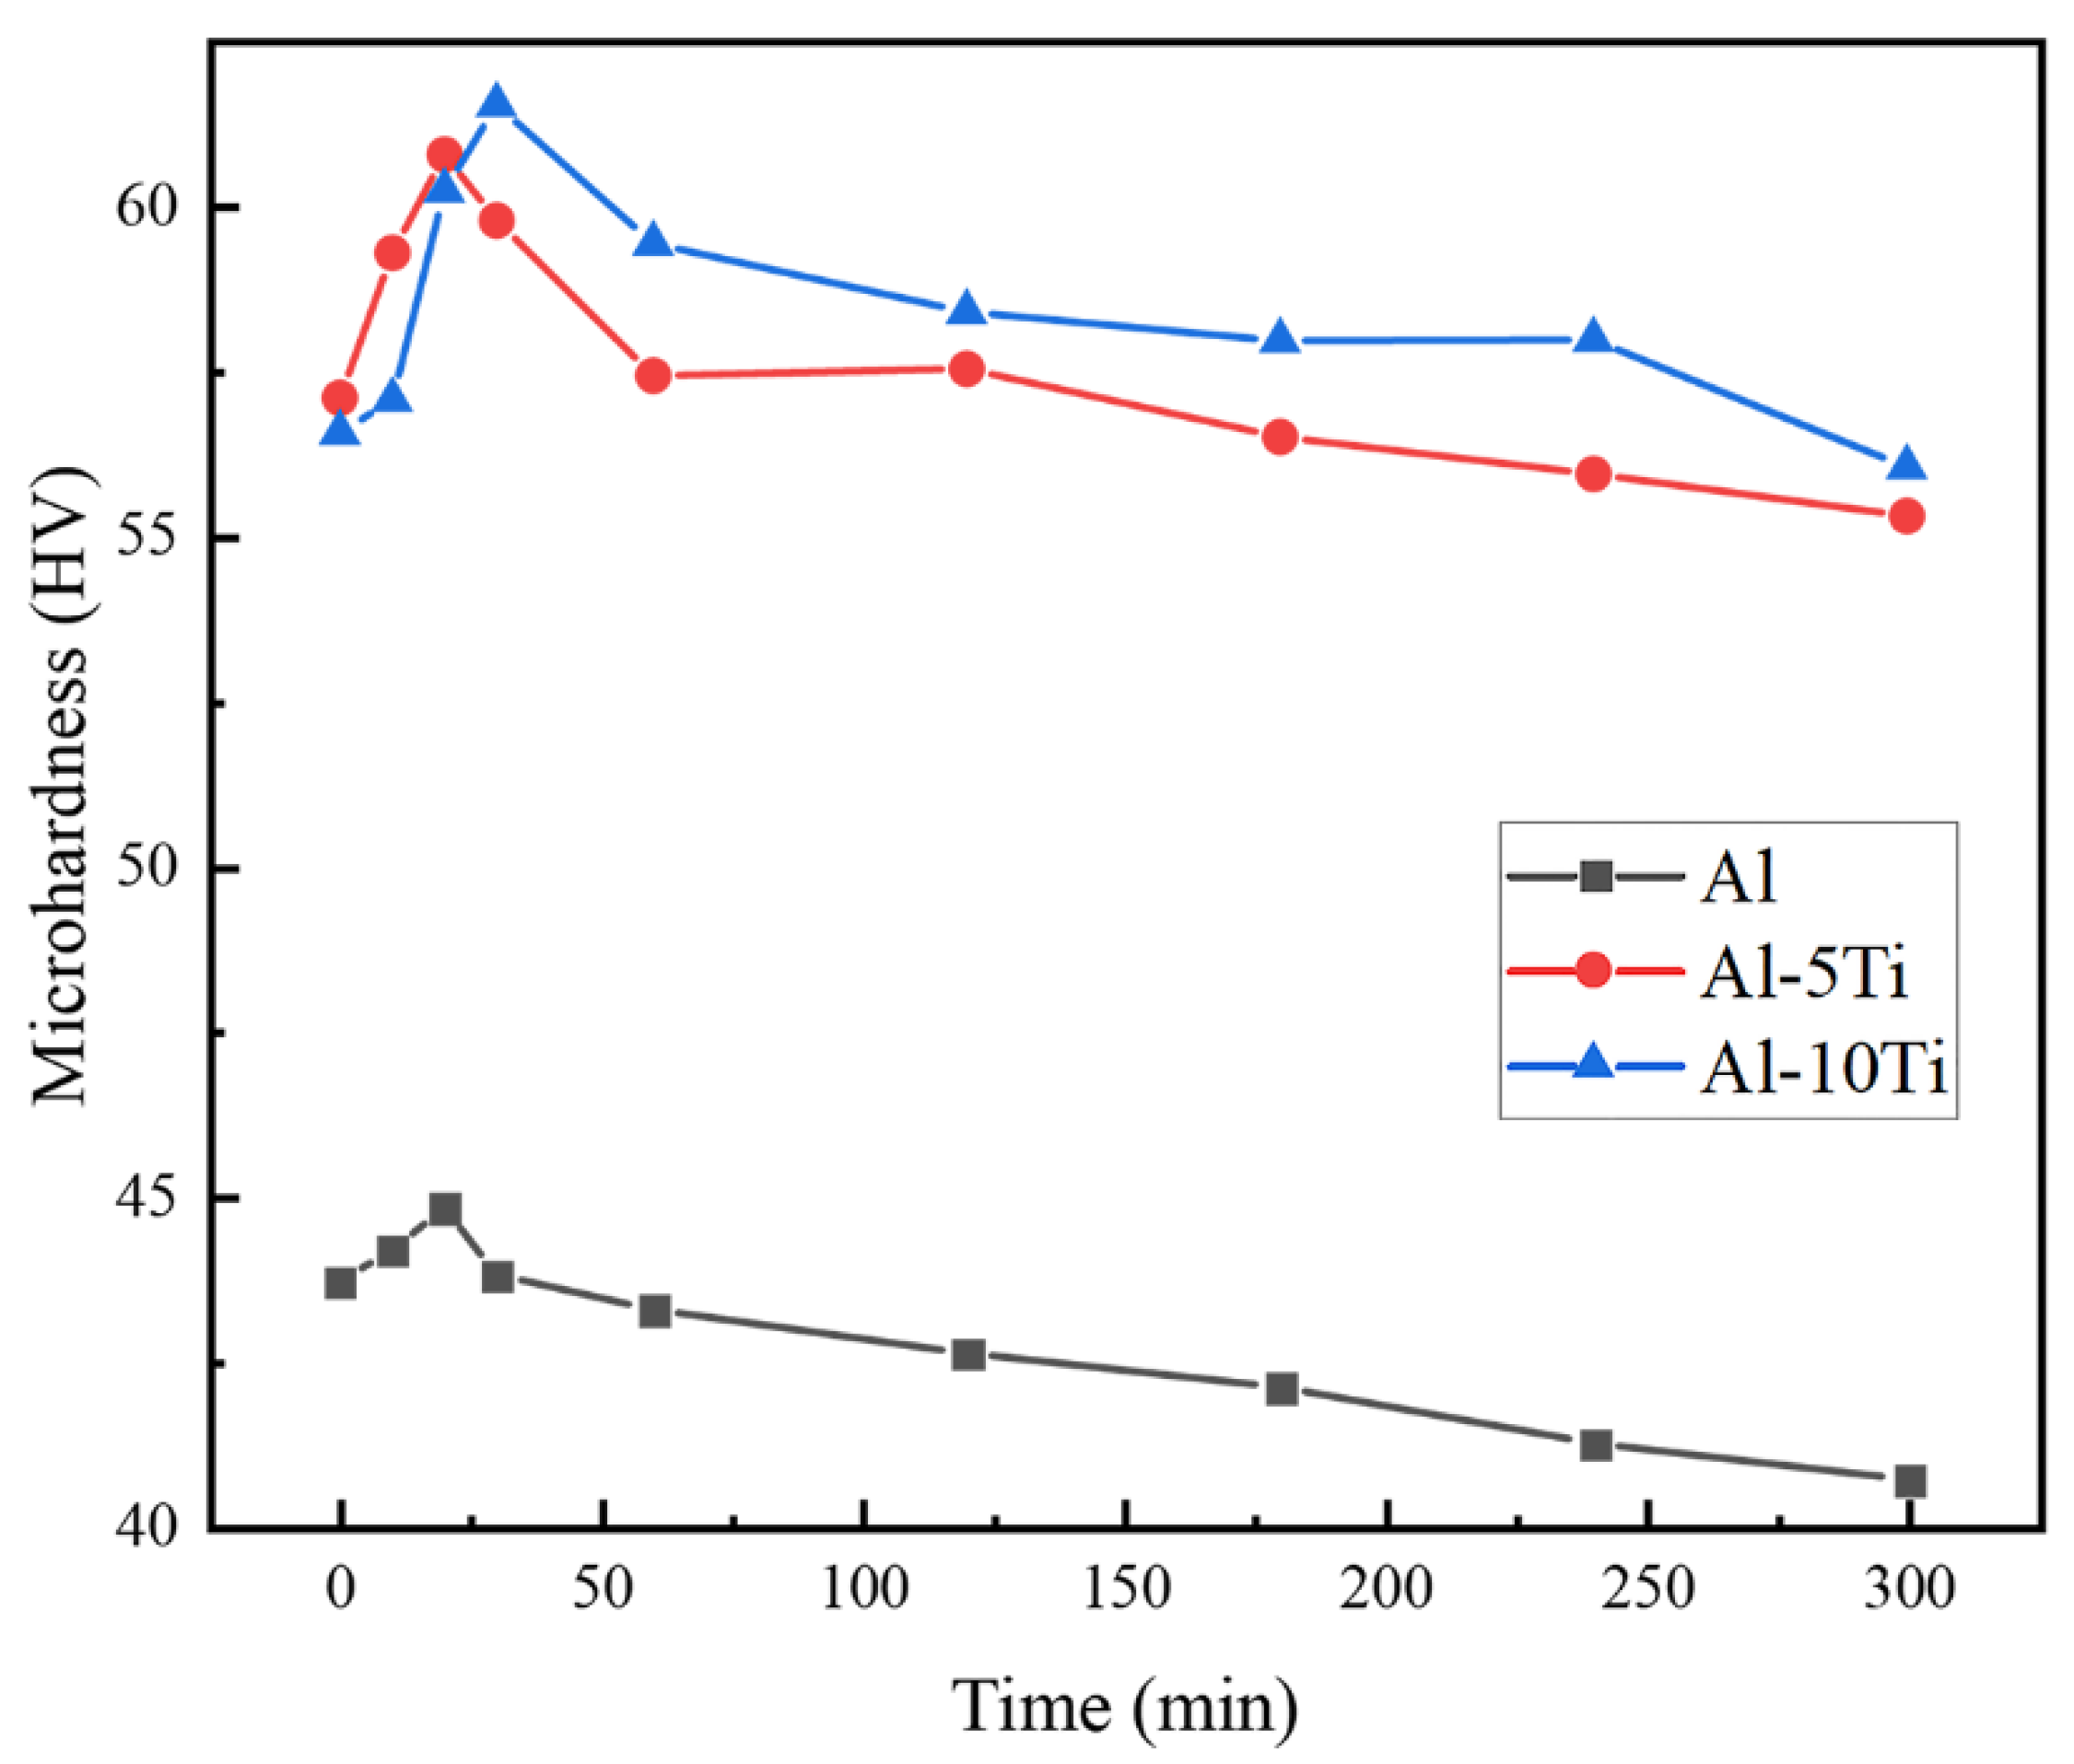
The microhardness of samples after different cavitation erosion time in 3.5 wt.% NaCl solution are shown in Figure 10. Clearly, in the early stage of the cavitation test, the surface microhardness of Al–5Ti and Al–10Ti was larger than that of Al. After cavitation erosion for 25 min, the surface microhardness of the samples increased, indicating the work hardening layer appeared on the surface of the samples [22]. With the increase of cavitation erosion time, the surface microhardness of the sample began to decrease, indicating that the material surface began to soften. The work hardening ability of the material has a certain influence on the cavitation resistance of the material. The shock wave generated by the collapse of the cavitation bubble acts on the surface of the material in the cavitation erosion process, which will inevitably cause severe deformation of the material surface. In turn, the extrusion of adjacent grain boundaries hinders the continuation of the deformation, and the work hardening occurs on the surface. With the progress of cavitation erosion, the hardening layer moves to the inner part of the material, and the initiation and expansion of cracks on the surface of the material makes the surface hardness no longer rise but begin to decline, resulting in the softening phenomenon appearing on the surface of the material.
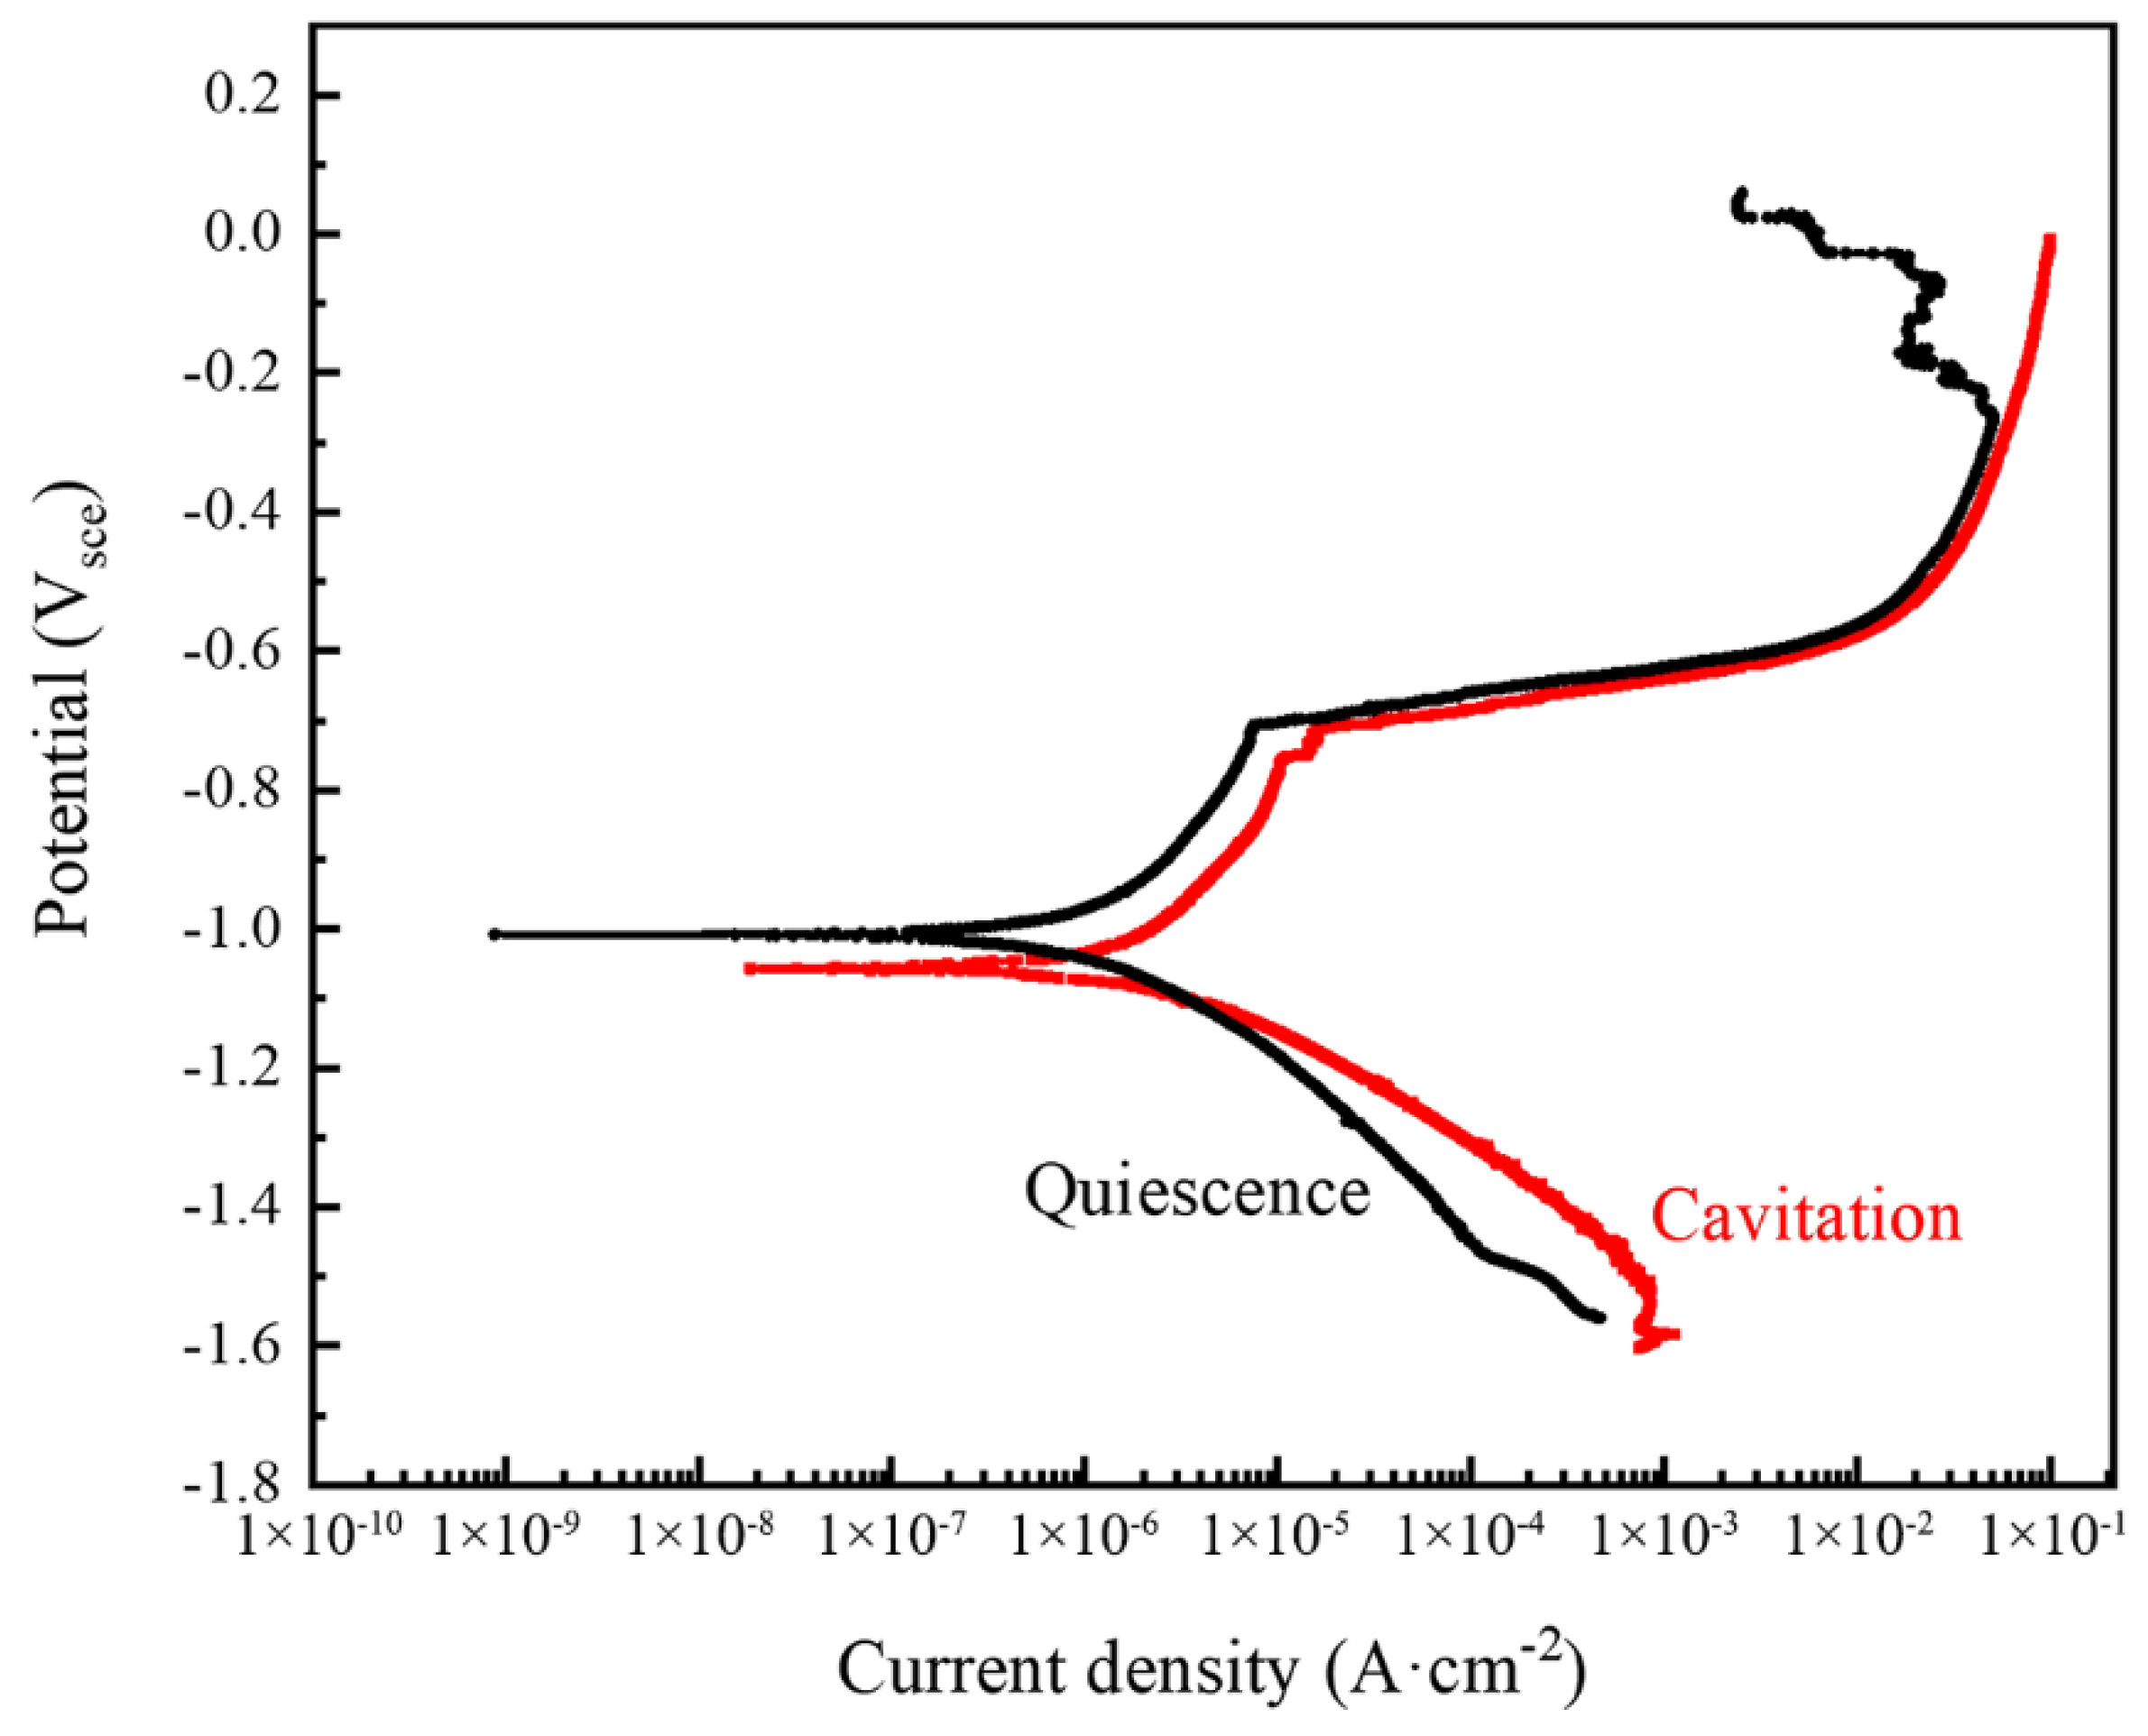
Figure 11 shows the potentiodynamic curves of the Al–5Ti alloy under quiescent and cavitation erosion conditions in 3.5 wt.%NaCl solution, and the corresponding electrochemical corrosion parameters are shown in Table 2. It can be clearly seen from Figure 11 that the shape of the potentiodynamic curves is similar under quiescent and cavitation erosion conditions, and samples are in the passive state within the anode region. Both the corrosion processes under cavitation erosion and quiescent conditions are controlled by the anode reaction, and cavitation erosion dramatically accelerates the anode reaction. As shown in Table 2, the corrosion potential of the Al–5Ti sample in quiescent and cavitation erosion conditions was −1.1495 V and −1.1626 V, respectively, indicating that the corrosion potential under the cavitation condition was slightly negative compared to that of the quiescent condition. However, the corrosion current density (icorr) under the cavitation erosion condition was larger than that of the quiescent condition, 1.6947 × 10⁻⁶ mA and 9.0027 × 10⁻⁷ mA, respectively. The increased icorr under the cavitation condition should be ascribed to the formation and collapse of cavitation bubbles, which can accelerate the diffusion of oxygen, and this is consistent with the cavitation erosion phenomenon of Ni–Al bronze in seawater reported by L.M. Zhang [22]. In addition, the high temperature and high pressure owing to the collapse of bubbles can also be an important reason for the accelerated corrosion [31]. When the corrosion potential was about −0.3 V, the anode curve under quiescent condition began to activate the passive state, and the icorr oscillation decreased. However, the icorr did not show such a phenomenon under the cavitation erosion condition, and the icorr increased slowly with the potential. This indicates that the oxide film on the surface of Al–5Ti alloys was damaged by the impact of cavitation bubbles under the cavitation erosion condition, and the passive state of the material changed with the progress of cavitation. In conclusion, the electrochemical corrosion of the Al alloys was more serious, and the corrosion process was accelerated under the action of ultrasonic cavitation erosion.
According to the results of potentiodynamic polarization and mass loss, each mass loss (per unit area) of ME, MC, ΔME, and ΔMC can be calculated out, as shown in Table 3. For the Al–5Ti sample, the total mass loss (MT) was 7.90 times and 1.57 times that of pure corrosion mass loss (MC) and pure cavitation erosion mass loss (ME), respectively, indicating that the synergistic effect between cavitation erosion and corrosion plays an important role in the cavitation erosion process [22]. Although the effect of pure corrosion was small (12.66%), the cavitation erosion promoted by corrosion effect was significantly enhanced (18.49%), which can be attributed to the roughened material surface and the accelerated cavitation erosion crack propagation caused by corrosion. The other main reason is that cavitation bubbles tend to concentrate on the concave and convex surface of the material, caused by corrosion, which accelerates the generation and propagation of cracks [32,33]. Compared with the cavitation erosion promoted by corrosion (ΔMCE), the mass loss caused by corrosion promoted by cavitation erosion (ΔMEC) was only 5.10%. In addition, the mass loss caused by the pure cavitation erosion accounted for the largest percentage (63.75%), and the material destruction process was mainly dominated by the mechanical action of cavitation erosion. Simultaneously, the mass loss caused by the synergistic effect between cavitation erosion and corrosion accounted for a large percentage, 23.59%, which also had a critical impact on the cavitation erosion of the Al alloys. The parameters variation of the Al–10Ti sample was similar to that of the Al–5Ti sample, indicating that the interaction mechanism of cavitation–corrosion is consistent. However, in terms of the MT, the MT of the Al–5Ti sample was 1.53 times that of the Al–10Ti sample, indicating the Al–10Ti sample has better cavitation corrosion resistance. In the cavitation–corrosion interactive experiment of the Al sample, the percentage of ME reached 86.19%, and the mass loss caused by the synergistic effect between cavitation erosion and corrosion accounted for only 4.64%. This may be attributed to the low hardness of the Al sample, which is susceptible to the impact of cavitation bubbles, resulting in the dominant role of cavitation damage.
4. Conclusions
(1) During the ultrasonic cavitation erosion experiment of the Al, Al–5Ti, and Al–10Ti samples in 3.5 wt.% NaCl solution, the cumulative mass loss of the Al, Al–5Ti, and Al–10Ti samples were 19.84 mg, 15.09 mg, and 9.85 mg, respectively.
(2) In the same ultrasonic cavitation period, the surface damage degree obeyed the following order: Al > Al–5Ti > Al–10Ti. The main reason for the excellent cavitation resistance of the Al–10Ti samples was that the existence of the TiAl3 phase prevents the expansion of cavitation pits and cracks.
(3) The mass loss caused by the pure cavitation erosion in 3.5 wt.% NaCl solution accounted for the largest percentage, and the material destruction process was mainly dominated by the mechanical action of cavitation erosion. In addition, the mass loss caused by the synergistic effect between cavitation erosion and corrosion accounted for a large percentage, which indicated its critical impact on the cavitation erosion of Al–Ti alloys. Compared with corrosion promoted by cavitation erosion, the cavitation erosion promoted by corrosion has a larger promoting effect.
Author Contributions
Conceptualization, Y.L. and J.Z. (Jingtao Zhao); methodology, J.Z. (Jingtao Zhao) and J.Z. (Jingwen Zhu); validation, Y.L., J.Z. (Jingtao Zhao), and L.N.; formal analysis, J.Z. (Jingtao Zhao); investigation, L.N. and J.Z. (Jingwen Zhu); resources, Y.L.; data curation, Y.L. and J.Z. (Jingtao Zhao); writing—original draft preparation, J.Z. (Jingtao Zhao); writing—review and editing, Y.L. and J.Z. (Jingtao Zhao); visualization, J.Z. (Jingwen Zhu) and L.N.; supervision, Y.L.; project administration, Y.L.; funding acquisition, Y.L. All authors have read and agreed to the published version of the manuscript.
Funding
This research was funded by the National Nature Science Foundation of China, grant number 11574043.
Institutional Review Board Statement
Not applicable.
Informed Consent Statement
Not applicable.
Data Availability Statement
Not applicable.
Acknowledgments
The authors acknowledge the instrumental/date analysis from Analytical and Testing Center, Northeastern University.
Conflicts of Interest
The authors declare no conflict of interest.
References
- Zheng, D.; Ju, C.; Zhao, Q.; Wang, X. Ammonium Tetrathiomolybdate Enhancing the Lubricity of Choline Ricinoleate Ionic Liquid in Water–Glycerol Mixture. Tribol. Lett. 2019, 67, 1–10. [Google Scholar] [CrossRef]
- Yanagida, H.; Masubuchi, Y.; Minagawa, K.; Ogata, T.; Takimoto, J.; Koyama, K. A Reaction Kinetics Model of Water Sonolysis in the Presence of a Spin-Trap. Ultrason. Sonochemistry 1999, 5, 133–139. [Google Scholar] [CrossRef]
- Bhat, R.; Kamaruddin, N.S.B.C.; Min-Tze, L.; Karim, A.A. Sonication Improves Kasturi Lime (Citrus Microcarpa) Juice Quality. Ultrason. Sonochemistry 2011, 18, 1295–1300. [Google Scholar] [CrossRef] [PubMed]
- Xu, W.; Wang, Q.; Wei, W.; Luo, J.; Chen, S. Effects of Air Bubble Quantity on the Reduction of Cavitation Erosion. Wear 2021, 482–483, 203937. [Google Scholar] [CrossRef]
- Liu, Q.; Li, Z.; Du, S.; He, Z.; Han, J.; Zhang, Y. Cavitation Erosion Behavior of GH 4738 Nickel-Based Superalloy. Tribol. Int. 2021, 156, 106833. [Google Scholar] [CrossRef]
- Xian, W.H.; Li, D.G.; Chen, D.R. Investigation on Ultrasonic Cavitation Erosion of TiMo and TiNb Alloys in Sulfuric Acid Solution. Ultrason. Sonochemistry 2020, 62, 104877. [Google Scholar] [CrossRef] [PubMed]
- Csavina, J.; Field, J.; Félix, O.; Corral-Avitia, A.Y.; Sáez, A.E.; Betterton, E.A. Effect of Wind Speed and Relative Humidity on Atmospheric Dust Concentrations in Semi-Arid Climates. Sci. Total Environ. 2014, 487, 82–90. [Google Scholar] [CrossRef] [PubMed] [Green Version]
- Hajian, M.; Abdollah-zadeh, A.; Rezaei-Nejad, S.S.; Assadi, H.; Hadavi, S.M.M.; Chung, K.; Shokouhimehr, M. Improvement in Cavitation Erosion Resistance of AISI 316L Stainless Steel by Friction Stir Processing. Appl. Surf. Sci. 2014, 308, 184–192. [Google Scholar] [CrossRef]
- Hanke, S.; Fischer, A.; Beyer, M.; dos Santos, J. Cavitation Erosion of NiAl-Bronze Layers Generated by Friction Surfacing. Wear 2011, 273, 32–37. [Google Scholar] [CrossRef]
- Pola, A.; Montesano, L.; Tocci, M.; La Vecchia, G. Influence of Ultrasound Treatment on Cavitation Erosion Resistance of AlSi7 Alloy. Materials 2017, 10, 256. [Google Scholar] [CrossRef]
- Li, X.Y.; Yan, Y.G.; Ma, L.; Xu, Z.M.; Li, J.G. Cavitation Erosion and Corrosion Behavior of Copper–Manganese–Aluminum Alloy Weldment. Mater. Sci. Eng. A 2004, 382, 82–89. [Google Scholar] [CrossRef]
- Qin, C.P.; Zheng, Y.G.; Wei, R. Cavitation Erosion Behavior of Nanocomposite Ti–Si–C–N and Ti/Ti–Si–C–N Coatings Deposited on 2Cr13 Stainless Steel Using a Plasma Enhanced Magnetron Sputtering Process. Surf. Coat. Technol. 2010, 204, 3530–3538. [Google Scholar] [CrossRef]
- Li, H.; Cui, Z.; Li, Z.; Zhu, S.; Yang, X. Surface Modification by Gas Nitriding for Improving Cavitation Erosion Resistance of CP-Ti. Appl. Surf. Sci. 2014, 298, 164–170. [Google Scholar] [CrossRef]
- Kaspar, J.; Bretschneider, J.; Jacob, S.; Bonß, S.; Winderlich, B.; Brenner, B. Microstructure, Hardness and Cavitation Erosion Behaviour of Ti–6Al–4V Laser Nitrided under Different Gas Atmospheres. Surf. Eng. 2007, 23, 99–106. [Google Scholar] [CrossRef]
- Gurumoorthy, K.; Kamaraj, M.; Rao, K.P.; Rao, A.S.; Venugopal, S. Microstructural Aspects of Plasma Transferred Arc Surfaced Ni-Based Hardfacing Alloy. Mater. Sci. Eng. A 2007, 456, 11–19. [Google Scholar] [CrossRef]
- Chiu, K.Y.; Cheng, F.T.; Man, H.C. Hydrogen Effect on the Cavitation Erosion Resistance of AISI 316L Stainless Steel Laser Surface-Modified with NiTi. Mater. Lett. 2007, 61, 239–243. [Google Scholar] [CrossRef]
- Szala, M.; Łatka, L.; Walczak, M.; Winnicki, M. Comparative Study on the Cavitation Erosion and Sliding Wear of Cold-Sprayed Al/Al2O3 and Cu/Al2O3 Coatings, and Stainless Steel, Aluminium Alloy, Copper and Brass. Metals 2020, 10, 856. [Google Scholar] [CrossRef]
- Man, H.C.; Kwok, C.T.; Yue, T.M. Cavitation Erosion and Corrosion Behaviour of Laser Surface Alloyed MMC of SiC and Si3N4 on Al Alloy AA6061. Surf. Coat. Technol. 2000, 132, 11–20. [Google Scholar] [CrossRef]
- Vignal, V.; Krawiec, H.; Szklarz, Z. Influence of Plastic Deformation on the Corrosion Behaviour of As-Cast AlMg2 and AlCu4Mg1 Aluminium Alloys in NaCl Solution. SSP 2015, 227, 15–18. [Google Scholar] [CrossRef]
- Kim, S.-J.; Hyun, K.-Y.; Jang, S.-K. Effects of Water Cavitation Peening on Electrochemical Characteristic by Using Micro-Droplet Cell of Al–Mg Alloy. Curr. Appl. Phys. 2012, 12, S24–S30. [Google Scholar] [CrossRef]
- Gottardi, G.; Tocci, M.; Montesano, L.; Pola, A. Cavitation Erosion Behaviour of an Innovative Aluminium Alloy for Hybrid Aluminium Forging. Wear 2018, 394–395, 1–10. [Google Scholar] [CrossRef]
- Zhang, L.M.; Ma, A.L.; Yu, H.; Umoh, A.J.; Zheng, Y.G. Correlation of Microstructure with Cavitation Erosion Behaviour of a Nickel-Aluminum Bronze in Simulated Seawater. Tribol. Int. 2019, 136, 250–258. [Google Scholar] [CrossRef]
- Bregliozzi, G.; Schino, A.D.; Ahmed, S.I.-U.; Kenny, J.M.; Haefke, H. Cavitation Wear Behaviour of Austenitic Stainless Steels with Different Grain Sizes. Wear 2005, 258, 503–510. [Google Scholar] [CrossRef]
- Kwok, C.T.; Cheng, F.T.; Man, H.C. Synergistic Effect of Cavitation Erosion and Corrosion of Various Engineering Alloys in 3.5% NaCl Solution. Mater. Sci. Eng. A 2000, 290, 145–154. [Google Scholar] [CrossRef]
- Wu, S.K.; Lin, H.C.; Yeh, C.H. A Comparison of the Cavitation Erosion Resistance of TiNi Alloys, SUS304 Stainless Steel and Ni-Based Self-Fluxing Alloy. Wear 2000, 244, 85–93. [Google Scholar] [CrossRef]
- Mochizuki, H.; Yokota, M.; Hattori, S. Effects of Materials and Solution Temperatures on Cavitation Erosion of Pure Titanium and Titanium Alloy in Seawater. Wear 2007, 262, 522–528. [Google Scholar] [CrossRef]
- Zhao, J.; Jiang, Z.; Zhu, J.; Zhang, J.; Li, Y. Investigation on Ultrasonic Cavitation Erosion Behaviors of Al and Al-5Ti Alloys in the Distilled Water. Metals 2020, 10, 1631. [Google Scholar] [CrossRef]
- Ijiri, M.; Shimonishi, D.; Nakagawa, D.; Yoshimura, T. New Water Jet Cavitation Technology to Increase Number and Size of Cavitation Bubbles and Its Effect on Pure Al Surface. Int. J. Lightweight Mater. Manuf. 2018, 1, 12–20. [Google Scholar] [CrossRef]
- Tocci, M.; Pola, A.; Montesano, L.; Marina La Vecchia, G. Evaluation of Cavitation Erosion Resistance of Al-Si Casting Alloys: Effect of Eutectic and Intermetallic Phases. Frat. Ed Integrità Strutt. 2017, 12, 218–230. [Google Scholar] [CrossRef] [Green Version]
- Crase, S.J.; Hockaday, C.; Cooper McCarville, P. Brief Report: Perceptions of Positive and Negative Support: Do They Differ for Pregnant/Parenting Adolescents and Nonpregnant, Nonparenting Adolescents? J. Adolesc. 2007, 30, 505–512. [Google Scholar] [CrossRef]
- Neppiras, E.A. Acoustic Cavitation. Phys. Rep. 1980, 61, 159–251. [Google Scholar] [CrossRef]
- Song, Q.N.; Zheng, Y.G.; Jiang, S.L.; Ni, D.R.; Ma, Z.Y. Comparison of Corrosion and Cavitation Erosion Behaviors Between the As-Cast and Friction-Stir-Processed Nickel Aluminum Bronze. Corrosion 2013, 69, 1111–1121. [Google Scholar] [CrossRef]
- Al-Hashem, A.; Riad, W. The Role of Microstructure of Nickel–Aluminium–Bronze Alloy on Its Cavitation Corrosion Behavior in Natural Seawater. Mater. Charact. 2002, 48, 37–41. [Google Scholar] [CrossRef]
Figure 1.
Schematic diagram of device for preparing high-purity Al–Ti alloys by direct reaction of Ti powder and Al melt. 1—Bottom liquid outlet, 2—heating pipe, 3—temperature controller, 4—melt, 5—upper liquid outlet, 6—observation hole, 7—thermocouple, 8—cooling water jacket, 9—transducer, 10—feed inlet, 11—furnace cover, 12—furnace body, 13—horn, 14—ultrasonic transmitter, 15—Ti powder, 16—vertical partition plate, 17—ceramic crucible, A—composition homogenization zone, B—alloying reaction zone.

Figure 2.
Schematic of the ultrasonic cavitation erosion device.

Figure 3.
The cumulative mass loss curves (a) and the cumulative mass loss rate curves (b) in 3.5 wt.% NaCl solution.
Figure 3.
The cumulative mass loss curves (a) and the cumulative mass loss rate curves (b) in 3.5 wt.% NaCl solution.

Figure 4.
Metallurgical structure images of Al, Al–5Ti, and Al–10Ti samples after cavitation erosion for 60 min in 3.5 wt.% NaCl solution; (a) Al; (b) Al-5Ti; (c) Al-10Ti.
Figure 4.
Metallurgical structure images of Al, Al–5Ti, and Al–10Ti samples after cavitation erosion for 60 min in 3.5 wt.% NaCl solution; (a) Al; (b) Al-5Ti; (c) Al-10Ti.

Figure 5.
Surface morphologies of Al, Al–5Ti, and Al–10Ti alloys after cavitation erosion for 10 min and 30 min in 3.5 wt.% NaCl solution; (a,c,e) are the morphologies of Al, Al–5Ti, and Al–10Ti alloys after cavitation erosion for 10 min, respectively; (b,d,f) are the morphologies of Al, Al–5Ti, and Al–10Ti alloys after cavitation erosion for 30 min, respectively.

Figure 6.
Surface morphology of Al, Al–5Ti, and Al–10Ti alloys after cavitation erosion for 120 min and 300 min; (a,c,e) are the morphologies of Al, Al–5Ti, and Al–10Ti alloys after cavitation erosion for 120 min, respectively; (b,d,f) are the morphologies of Al, Al–5Ti, and Al–10Ti alloys after cavitation erosion for 300 min, respectively.

Figure 7.
Three-dimensional surface morphology of Al, Al–5Ti, and Al–10Ti samples after cavitation erosion for different times: (a–c) 10 min; (d–f) 30 min; (g–i) 120 min; and (j–l) 300 min.
Figure 7.
Three-dimensional surface morphology of Al, Al–5Ti, and Al–10Ti samples after cavitation erosion for different times: (a–c) 10 min; (d–f) 30 min; (g–i) 120 min; and (j–l) 300 min.

Figure 8.
The cavitation erosion depth of Al, Al–5Ti, and Al–10Ti alloy samples after cavitation erosion for different times: (a) mean depth of erosion and (b) maximum surface damage depth.
Figure 8.
The cavitation erosion depth of Al, Al–5Ti, and Al–10Ti alloy samples after cavitation erosion for different times: (a) mean depth of erosion and (b) maximum surface damage depth.

Figure 9.
Average surface roughness of Al, Al–5Ti, and Al–10Ti samples after cavitation erosion for different times in 3.5 wt.% NaCl solution.
Figure 9.
Average surface roughness of Al, Al–5Ti, and Al–10Ti samples after cavitation erosion for different times in 3.5 wt.% NaCl solution.

Figure 10.
The microhardness of samples after different cavitation erosion time in 3.5 wt.% NaCl solution.
Figure 10.
The microhardness of samples after different cavitation erosion time in 3.5 wt.% NaCl solution.

Figure 11.
Potentiodynamic polarization curves of Al–5Ti alloy under quiescence and cavitation condition in 3.5 wt. % NaCl solution.
Figure 11.
Potentiodynamic polarization curves of Al–5Ti alloy under quiescence and cavitation condition in 3.5 wt. % NaCl solution.


Table 1.
Weight loss, incubation period, and cavitation erosion resistance of Al, Al–5Ti, and Al–10Ti alloys in 3.5 wt.% NaCl solution.
Table 1.
Weight loss, incubation period, and cavitation erosion resistance of Al, Al–5Ti, and Al–10Ti alloys in 3.5 wt.% NaCl solution.
| Parameters | Al | Al–5Ti | Al–10Ti |
|---|---|---|---|
| Cumulative mass loss (mg) | 19.84 | 15.09 | 9.85 |
| Incubation period (min) | 10 | 20 | 50 |
| Re (h/μm) | 0.53 | 0.73 | 1.12 |
Table 2.
Electrochemical parameters of polarization behavior of Al–5Ti alloy in 3.5 wt.% NaCl.
| Condition | Ecorr (V vs. SCE) | Icorr (mA·cm−2) | ba (mV/dec) | bc (mV/dec) |
|---|---|---|---|---|
| Quiescent | −1.008 | 9.0027 × 10⁻⁷ | 224.37 | −154.86 |
| Cavitation erosion | −1.015 | 1.6947 × 10⁻⁶ | 196.77 | −164.96 |
Table 3.
Mass loss of Al, Al–5Ti, and Al–10Ti sample caused by pure cavitation erosion (ME), pure corrosion (MC), corrosion promoted by cavitation erosion (ΔMEC), cavitation erosion promoted by corrosion (ΔMCE), and the total mass loss (MT) after 300 min in 3.5 wt.% NaCl solution.
Table 3.
Mass loss of Al, Al–5Ti, and Al–10Ti sample caused by pure cavitation erosion (ME), pure corrosion (MC), corrosion promoted by cavitation erosion (ΔMEC), cavitation erosion promoted by corrosion (ΔMCE), and the total mass loss (MT) after 300 min in 3.5 wt.% NaCl solution.
| Parameters | MT | ME | MC | ΔMEC | ΔMCE |
|---|---|---|---|---|---|
| Al, Mass loss (mg) | 19.84 | 17.10 | 1.82 | 0.29 | 0.63 |
| Al, Percentage (%) | 100 | 86.19 | 9.17 | 1.46 | 3.18 |
| Al–5Ti, Mass loss (mg) | 15.09 | 9.62 | 1.91 | 0.77 | 2.79 |
| Al–5Ti, Percentage (%) | 100 | 63.75 | 12.66 | 5.10 | 18.49 |
| Al–10Ti, Mass loss (mg) | 9.85 | 6.29 | 1.14 | 0.56 | 1.86 |
| Al–10Ti, Percentage (%) | 100 | 63.86 | 11.57 | 5.69 | 18.88 |
Publisher’s Note: MDPI stays neutral with regard to jurisdictional claims in published maps and institutional affiliations. |
© 2021 by the authors. Licensee MDPI, Basel, Switzerland. This article is an open access article distributed under the terms and conditions of the Creative Commons Attribution (CC BY) license (https://creativecommons.org/licenses/by/4.0/).
Share and Cite
MDPI and ACS Style
Zhao, J.; Ning, L.; Zhu, J.; Li, Y. Investigation on Ultrasonic Cavitation Erosion of Aluminum–Titanium Alloys in Sodium Chloride Solution. Crystals 2021, 11, 1299. https://0-doi-org.brum.beds.ac.uk/10.3390/cryst11111299
AMA Style
Zhao J, Ning L, Zhu J, Li Y. Investigation on Ultrasonic Cavitation Erosion of Aluminum–Titanium Alloys in Sodium Chloride Solution. Crystals. 2021; 11(11):1299. https://0-doi-org.brum.beds.ac.uk/10.3390/cryst11111299
Chicago/Turabian StyleZhao, Jingtao, Liping Ning, Jingwen Zhu, and Yinglong Li. 2021. "Investigation on Ultrasonic Cavitation Erosion of Aluminum–Titanium Alloys in Sodium Chloride Solution" Crystals 11, no. 11: 1299. https://0-doi-org.brum.beds.ac.uk/10.3390/cryst11111299
Note that from the first issue of 2016, this journal uses article numbers instead of page numbers. See further details here.