Article

Influence of Hydroxyapatite Nanospheres in Dentin Adhesive on the Dentin Bond Integrity and Degree of Conversion: A Scanning Electron Microscopy (SEM), Raman, Fourier Transform-Infrared (FTIR), and Microtensile Study

1
Department of Restorative Dental Sciences, College of Dentistry, King Saud University, 60169, Riyadh 11545, Saudi Arabia
2
Preventive Dental Science Department, Princess Nourah bint Abdulrahman University, Riyadh 11545, Saudi Arabia
3
School of Dentistry, Riyadh Elm University, Riyadh 12395, Saudi Arabia
4
Faculty of Dentistry, University of Toronto, Toronto, ON M5S 1A1, Canada
5
Department of Prosthetic Dental Science, College of Dentistry, King Saud University, Riyadh 11545, Saudi Arabia
6
Research Chair for Biological Research in Dental Health, College of Dentistry, Riyadh 11545, Saudi Arabia
*
Author to whom correspondence should be addressed.
Submission received: 27 October 2020 / Revised: 1 December 2020 / Accepted: 4 December 2020 / Published: 10 December 2020
(This article belongs to the Special Issue Polymers for Dental Restorative and Oral Tissue Engineering)

Abstract

:
An experimental adhesive incorporated with different nano-hydroxyapatite (n-HA) particle concentrations was synthesized and analyzed for dentin interaction, micro-tensile bond strength (μTBS), and degree of conversion (DC). n-HA powder (5 wt % and 10 wt %) were added in adhesive to yield three groups; gp-1: control experimental adhesive (CEA, 0 wt % HA), gp-2: 5 wt % n-HA (HAA-5%), and gp-3: 10 wt % n-HA (HAA-10%). The morphology of n-HA spheres was evaluated using Scanning Electron Microscopy (SEM). Their interaction in the adhesives was identified with SEM, Energy-Dispersive X-ray (EDX), and Micro-Raman spectroscopy. Teeth were sectioned, divided in study groups, and assessed for μTBS and failure mode. Employing Fourier Transform-Infrared (FTIR) spectroscopy, the DC of the adhesives was assessed. EDX mapping revealed the occurrence of oxygen, calcium, and phosphorus in the HAA-5% and HAA-10% groups. HAA-5% had the greatest μTBS values followed by HAA-10%. The presence of apatite was shown by FTIR spectra and Micro-Raman demonstrated phosphate and carbonate groups for n-HA spheres. The highest DC was observed for the CEA group followed by HAA-5%. n-HA spheres exhibited dentin interaction and formed a hybrid layer with resin tags. HAA-5% demonstrated superior μTBS compared with HAA-10% and control adhesive. The DC for HAA-5% was comparable to control adhesive.

Graphical Abstract

1. Introduction

Dentin is a calcified tissue that forms the majority of the tooth structure; it is comprised of microscopic channels called dentinal tubules and an intra-tubular matrix [1,2]. Dentin hypersensitivity (DH) results from the exposure of these tubules due to erosion, abrasion, attrition, abfraction, and dental caries [3,4,5]. To restore dental caries, multiple restorative materials are available; however, dental composites are among the most popular and widely indicated [6]. These dental composites are polymers combined with inorganic fillers that mimic natural teeth aesthetically, although their long-term mechanical and chemical stability is debatable [7]. The failure rates of composite ranges between 15% and 50%, which commonly occurs due to secondary caries, surface wear, marginal discrepancies, and fractures [8]. Moreover, it is suggested that while bonding to enamel is easily achieved due to mechanical interlocking, the bonding of adhesive with dentin is more puzzling (due to the lower inorganic content) [9]. Furthermore, the depth of dentin tissue has a direct impact on the bond strength, and decreased bond strength could be observed in deeper dentin compared with superficial dentin [10].
Biomaterials have the ability to control stem cell behavior and their development for regenerative purposes [11]. In an earlier study, it was reported that hydroxyapatite (HA) nanoparticles of various sizes could promote stem cell differentiation with smaller sized HA particles being more effective [12]. The local microbiome under certain conditions can cause local inflammation [13], and here, the role of biomaterials again becomes important. Biomaterials that are tested for various parameters such as cell adhesion, cell support, and cell differentiation do better under in vivo conditions in terms of preventing diseases and promoting regeneration [14]. In order to improve the properties of dental resins, the incorporation of nanoparticles including metal oxides, fluorides, and antimicrobial agents in the polymer matrix was introduced [15,16,17]. A similar nanoparticle in the form of a non-toxic, chemically stable, and bioactive material is HA [18]. HA constitutes the majority of the inorganic part of the tooth tissue, and owing to HA’s admirable remineralization properties, its use for different dental applications has increased recently [19]. In the presence of the partial demineralization of the collagen matrix, the presence of HA particles could ensure remineralization by the precipitation of calcium and phosphate ions (provided by HA crystals) [20].
Adhesion is the property of a material that is directly dependent on the quality of the polymer formed, and dentin adhesives stimulate bonding between the treated dentin and the resin composites by linking the hydrophilic primer and hydrophobic composite resin [21,22]. Since dental adhesive comes in direct contact with the tooth, the incorporation of HA could stimulate effective and durable remineralization in teeth with demineralized dentin [23]. In addition, the inclusion of nano-HA (n-HA) particles in the adhesive resin applied to dentin could positively enhance the strength and structure of the tooth, along with improving the mechanical properties of the resin adhesive [24]. Adhesives with remineralization potential can trap matrix metalloproteinases (MMPs) in crystals, fossilizing MMPs and cathepsins in the dentin tissues, thus protecting collagen from degradation [20]. It is narrated that mechanical properties of dental composites are critical for its longevity, and the inclusion of HA particles in the adhesive has shown to bring enhancement in the adhesive’s bulk mechanical properties [21]. However, n-HA addition to the dentin adhesive may compromise its dentin penetration, dentin bond integrity, and degree of conversion (DC) [25].
In a study by Sadat-Shojai et al., it was suggested that HA nanorods potentially biomineralize the tooth by bonding between COOH, OH, and NH2 of the collagen and OH of HA particles for remineralization at the dentin–resin interface [26]. In another study, the addition of 7 wt % of HA nanorods improved the bond strength of adhesive to tooth dentin [27]. However, in a study by Leitune et al., the addition of higher content of n-HA particles showed a significant loss of shear bond strength of resin adhesive to dentin [21]. Therefore, the specific amount of HA added in the adhesive that could result in optimum bond integrity, strength, and DC is still debatable. It is hypothesized that the incorporation of an increasing content of n-HA will compromise the bond strength and degree of conversion of experimental dentin adhesive. Therefore, the purpose of the study was to synthesize an experimental adhesive incorporated with different n-HA particles concentrations and analyze its dentin interaction, micro-tensile bond strength (μTBS), and DC.

2. Materials and Methods

2.1. Synthesis of Experimental and HA Resin Adhesives

Employing the methods from the study by Ye et al., the experimental adhesive was synthesized [28]. A combination of monomers including bisphenol A glycol dimethacrylate (BisGMA), triethylene glycol dimethacrylate (TEGDMA), 2-hydroxyethyl methacrylate (HEMA), and ethyl 4- dimethylamino benzoate and camphorquinone (Esstech Inc., Essington, PA, USA) were used. The formulation included a mixture of 50% Bis-GMA, 25% TEGDMA, and 25% HEMA (60%) by weight with ethanol as a solvent (30%—m/m). First, 0.5% (n/n) ethyl 4-dimethylamino benzoate and 0.5% camphorquinone photo-initiators were incorporated according to the monomer moles. In addition, as an electron initiator, 1.0% (n/n) diphenyliodonium hexafluorophosphate (DPIHP) was also added to the adhesive mixture. The mixture was prepared in a three-necked flask with a magnetic stirrer and condenser (SA300; Sansyo, Tokyo, Japan). To prevent photo-polymerization, the prepared adhesive was kept in an isolated dark chamber covered with foil. This adhesive was regarded as control experimental adhesive (CEA).
Nano-spheres of HA (hydroxyapatitie, Sigma Aldrich, St. Louis, MO, USA) were obtained and silanized. In order to enhance the adhesion of n-HA to the adhesive, 5% silane was added to the solvent of 95% acetone for silanization. Silanized n-HA spheres were added in 10% and 20% concentrations (m/m) to the control adhesive to produce HA adhesive 5 wt % (HAA-5%) and HAA 10 wt % (HAA-10%). To achieve the homogenization of n-HA spheres in the adhesive components, the dispersion of HA using sonication in a centrifuge was performed. The formulated adhesives were stored at 37 °C for 24 h for allowing solvent evaporation. The adhesives were stored at 4°C and were to be used in 20 days due to having a limited shelf life.

2.2. Characterization of HA and Synthesized Adhesive

The morphology of n-HA spheres was evaluated using Scanning Electron Microscopy (SEM). The presence of n-HA spheres within the experimental adhesives was identified with SEM, Energy-Dispersive X-ray spectroscopy (EDX), and Micro-Raman spectroscopy. EDX identified the elements and chemical groups within the adhesives. Prior to assessment, the HA adhesive was placed on a glass slide and photo-polymerized using a light-curing unit (Eliphar S10; 600–800 mW·cm−2 output; 3M ESPE, St. Paul, MN, USA) for 20 s. Polymerized specimens were mounted on aluminum stubs and sputter-coated with gold for 100 s (Baltec sputter, Scotia, NY, USA). SEM evaluations were performed at different magnifications (FEI Quanta 250, Scanning Electron Microscope, Hillsboro, OR, USA), at 10 kV accelerating voltage.

2.3. Tooth Preparation and Bonding Procedure

Ninety extracted teeth were cleansed using an ultrasonic scaler (Superior Instruments Co, New York, NY, USA) and were treated with chloramine trihydrate solution (Merck, Darmstadt, Germany) for 48 h. Teeth were mounted in orthodontic resin (Opti-Cryl, South Carolina, Columbia) at the cement–enamel junction (CEJ) level within 15 mm (height) sections of polyvinyl pipes (4 mm) and stored in distilled water. Tooth dentin was exposed by removing occlusal enamel with a slow speed diamond saw (Buehler Isomet 2000 Precision saw, Lake Bluff, IL, USA). Dentin was conditioned with 35% phosphoric acid (Ultra etch Econo Kit- Optident- Yorkshire, UK) for 10 s followed by washing and drying with cotton pellets. Thirty teeth each were treated with CEA (Gp:1, control), HAA-5% (Gp:2), and HAA-10% (Gp:3) adhesives. Adhesives were dispensed on a paper pad and using a micro-brush smeared on a dentin surface with agitation for 10 s followed by air thinning for 3 s. Following another similar adhesive application, polymerization was done with a light-curing device (Eliphar S10; 600 mW·cm−2 output; 3M ESPE, St. Paul, MN, USA) for 20 sec at 10 mm distance. For each specimen, a resin composite build-up was performed on the bonded adhesive using a resin mold and metal condenser in 2 mm increments (Filtek Universal; 3M ESPE, St. Paul, MN, USA). The composite build-up was light cured for 20 s each side after the removal of excess. All bonded specimens in each adhesive group were stored in distilled water for 24 h at 37 °C. Twenty specimens in each adhesive group (CEA, HAA-5%, and HAA-10%) were used for the μTBS testing. Five (out of ten remaining) specimens in each group were assessed for bond integrity of the resin–dentin interface using SEM, and the last five bonded specimens in each adhesive group were utilized for Micro-Raman spectroscopy analysis.

2.4. Micro-Tensile Bond Strength (μTBS)

Prior to specimen sectioning, 10 bonded specimens in each adhesive group (CEA, HAA-5%, and HAA-10%) were thermo cycled (TC) in water baths at 5 °C and 55 °C for 30 s each and 5 s dwelling time (THE-1100, SD Mechatronik GmbH, Germany). However, the other 10 specimens remained non-thermocycled (NTC) in each adhesive group and were stored in distilled water for 1 week. The sectioning of all bonded specimens in the study was performed with a slow speed diamond saw (Buehler Isomet 2000 Precision saw, Lake Bluff, IL, USA) to form 1 mm × 1 mm, composite–dentin bonded beams. Six beams from each tooth were used for μTBS assessment (sixty) in each adhesive subgroup (CEA-TC, CEA-NTC, HAA-5%-TC; HAA-5%-NTC, HAA-10%-TC, HAA-10%-NTC). Bonded beams were secured to the micro-tensile tester (Bisco Inc., Richmond, VA, USA) jaws with cyanoacrylate (Superglue, Minneapolis, MN, USA) and were assessed under tension at a crosshead speed of 0.5 mm/minute until failure. Failure modes were evaluated among the groups, classified as adhesive, cohesive, and mixed types using a digital microscope (Hirox KH 7700, Tokyo, Japan). Means and standard deviations of μTBS among the groups were analyzed using ANOVA and a post hoc multiple comparisons test.

2.5. Micro-Raman Spectroscopy of Dentin–Adhesive Bonded Specimen

Five bonded specimens in each adhesive group were assessed using Micro-Raman. Using a Raman spectrometer (ProRaman-L Analyzer; TSI, Shoreview, MN, USA) and Raman microscopic software (Ramanreader), Raman spectra were identified. The specimen positioning was adjusted to target dentin, n-HA spheres, and the interface, and correction for dark counts was done to obtain adequate signals. By using a laser beam with 0.9 objective lens and 600 mW power, the interface was observed. Specimens were divided into zones of interest (1 mm sections), and 3 scans of 60 s were performed for each zone. The details of the spectra were obtained between the range of 800 cm−1 and 2000 cm−1 with noise filtration.

2.6. SEM Observation of Bonded Adhesive/Dentin Interface

Bonded beam specimens of CEA, HAA-5%, and HAA-10% (n = 5) were polished (Beuhler Polisher, Lake Bluff, IL, USA) and cleaned in an ultrasonic bath (Bandelin Digital- Sigma-Aldrich Darmstadt, Berlin, Germany) for 4 min. Bonded beams were further conditioned at the interface with 35% phosphoric acid gel (Ultra etch Econo Kit- Optident- Yorkshire, UK) for 10 s and washed with distilled water (15 s). Specimens were immersed in 5.25% of sodium hypochlorite (NaOCl) solution (5 min) and washed. An ethanol treatment at 80%, 90%, and 100% concentration was performed to desiccate the specimens. The specimens were mounted on aluminum stubs and sputter-coated with gold under vacuum (Baltec SCD sputter, Scotia, NY, USA) and visualized at multiple magnifications under SEM (FEI Quanta 250, Scanning Electron Microscope, Hillsboro, OR, USA) at 10 kV voltage.

2.7. Degree of Conversion (DC)

Employing transmission Fourier Transform-Infrared Spectroscopy (FTIR) the degree of conversion (DC) of the adhesives was assessed. Adhesives including, CEA, HAA-5%, and HAA-10% were evaluated before and after polymerization. Homogenized adhesive was smeared on the potassium bromide disc of the spectroscope (Shimadzu, Kyoto, Japan). The absorbance peaks for the C–C double bonds were recorded for the uncured resin, as the adhesives remained in contact with the FTIR sensors (Thermo Scientific Nicolet iS20 FTIR spectrometer, Waltham, MA, USA). The adhesive resins were polymerized using a dental light curing unit for 40 s, and the FTIR peaks were recorded again. Using a standardized baseline method [29], the C–C (aromatic) reference peaks (1607 cm−1) and C=C (aliphatic) absorbance peak (1638 cm−1) were obtained. The FTIR spectra were observed between 400 and 4000 cm−1 for determining the DC. The conversion rate for adhesives was identified by calculating the ratios of (C=C and C–C) absorbance intensities (percentage of unreacted double bonds) prior to and post photo-polymerization using the below equation [30].
DC = [1 − (Caliphatic/Caromatic)/(Ualiphatic/Uaromatic)] × 100%
where
  • Caliphatic is 1638 cm−1 absorption peak of polymerized resin,
  • Caromatic is 1607 cm−1 absorption peak of polymerized resin,
  • Ualiphatic is 1638 cm−1 absorption peak of unpolymerized resin and
  • Uaromatic is 1607 cm−1 absorption peak of unpolymerized resin.

3. Results

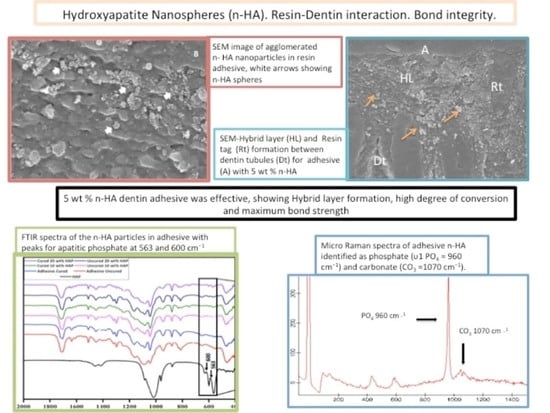
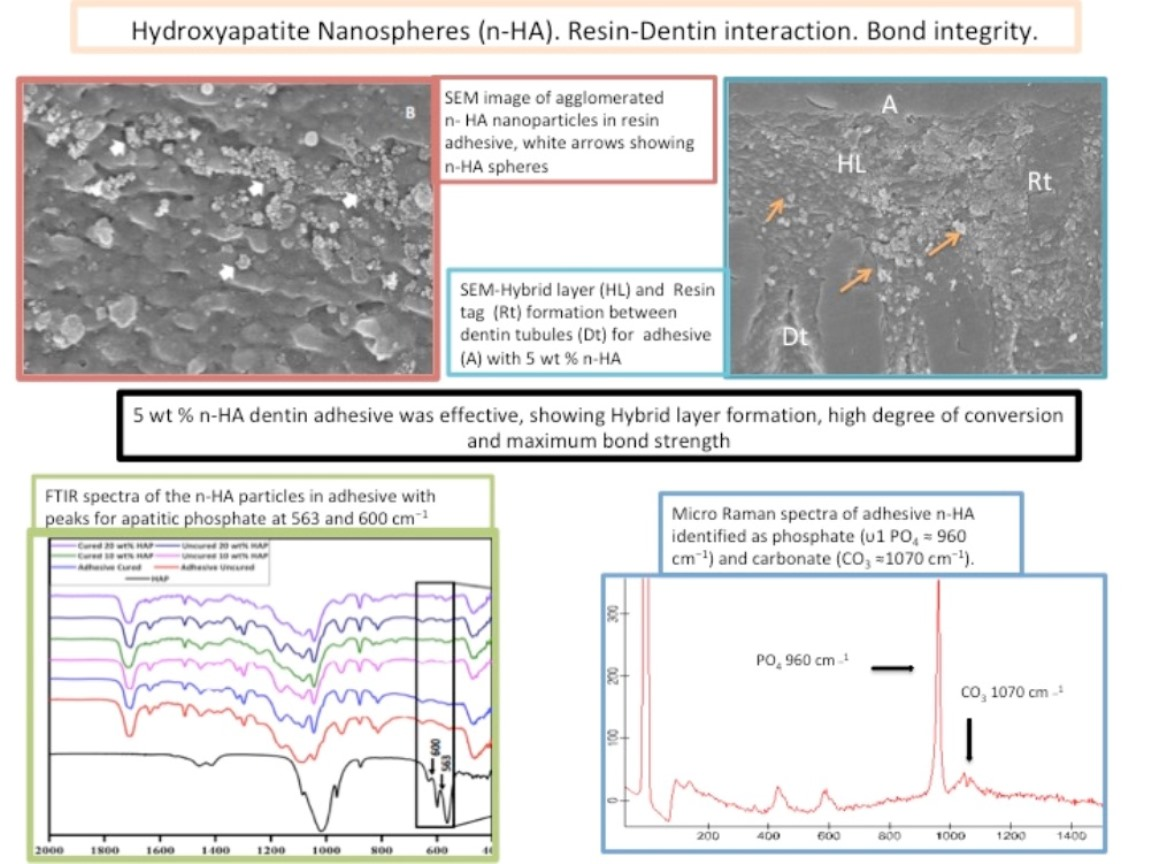
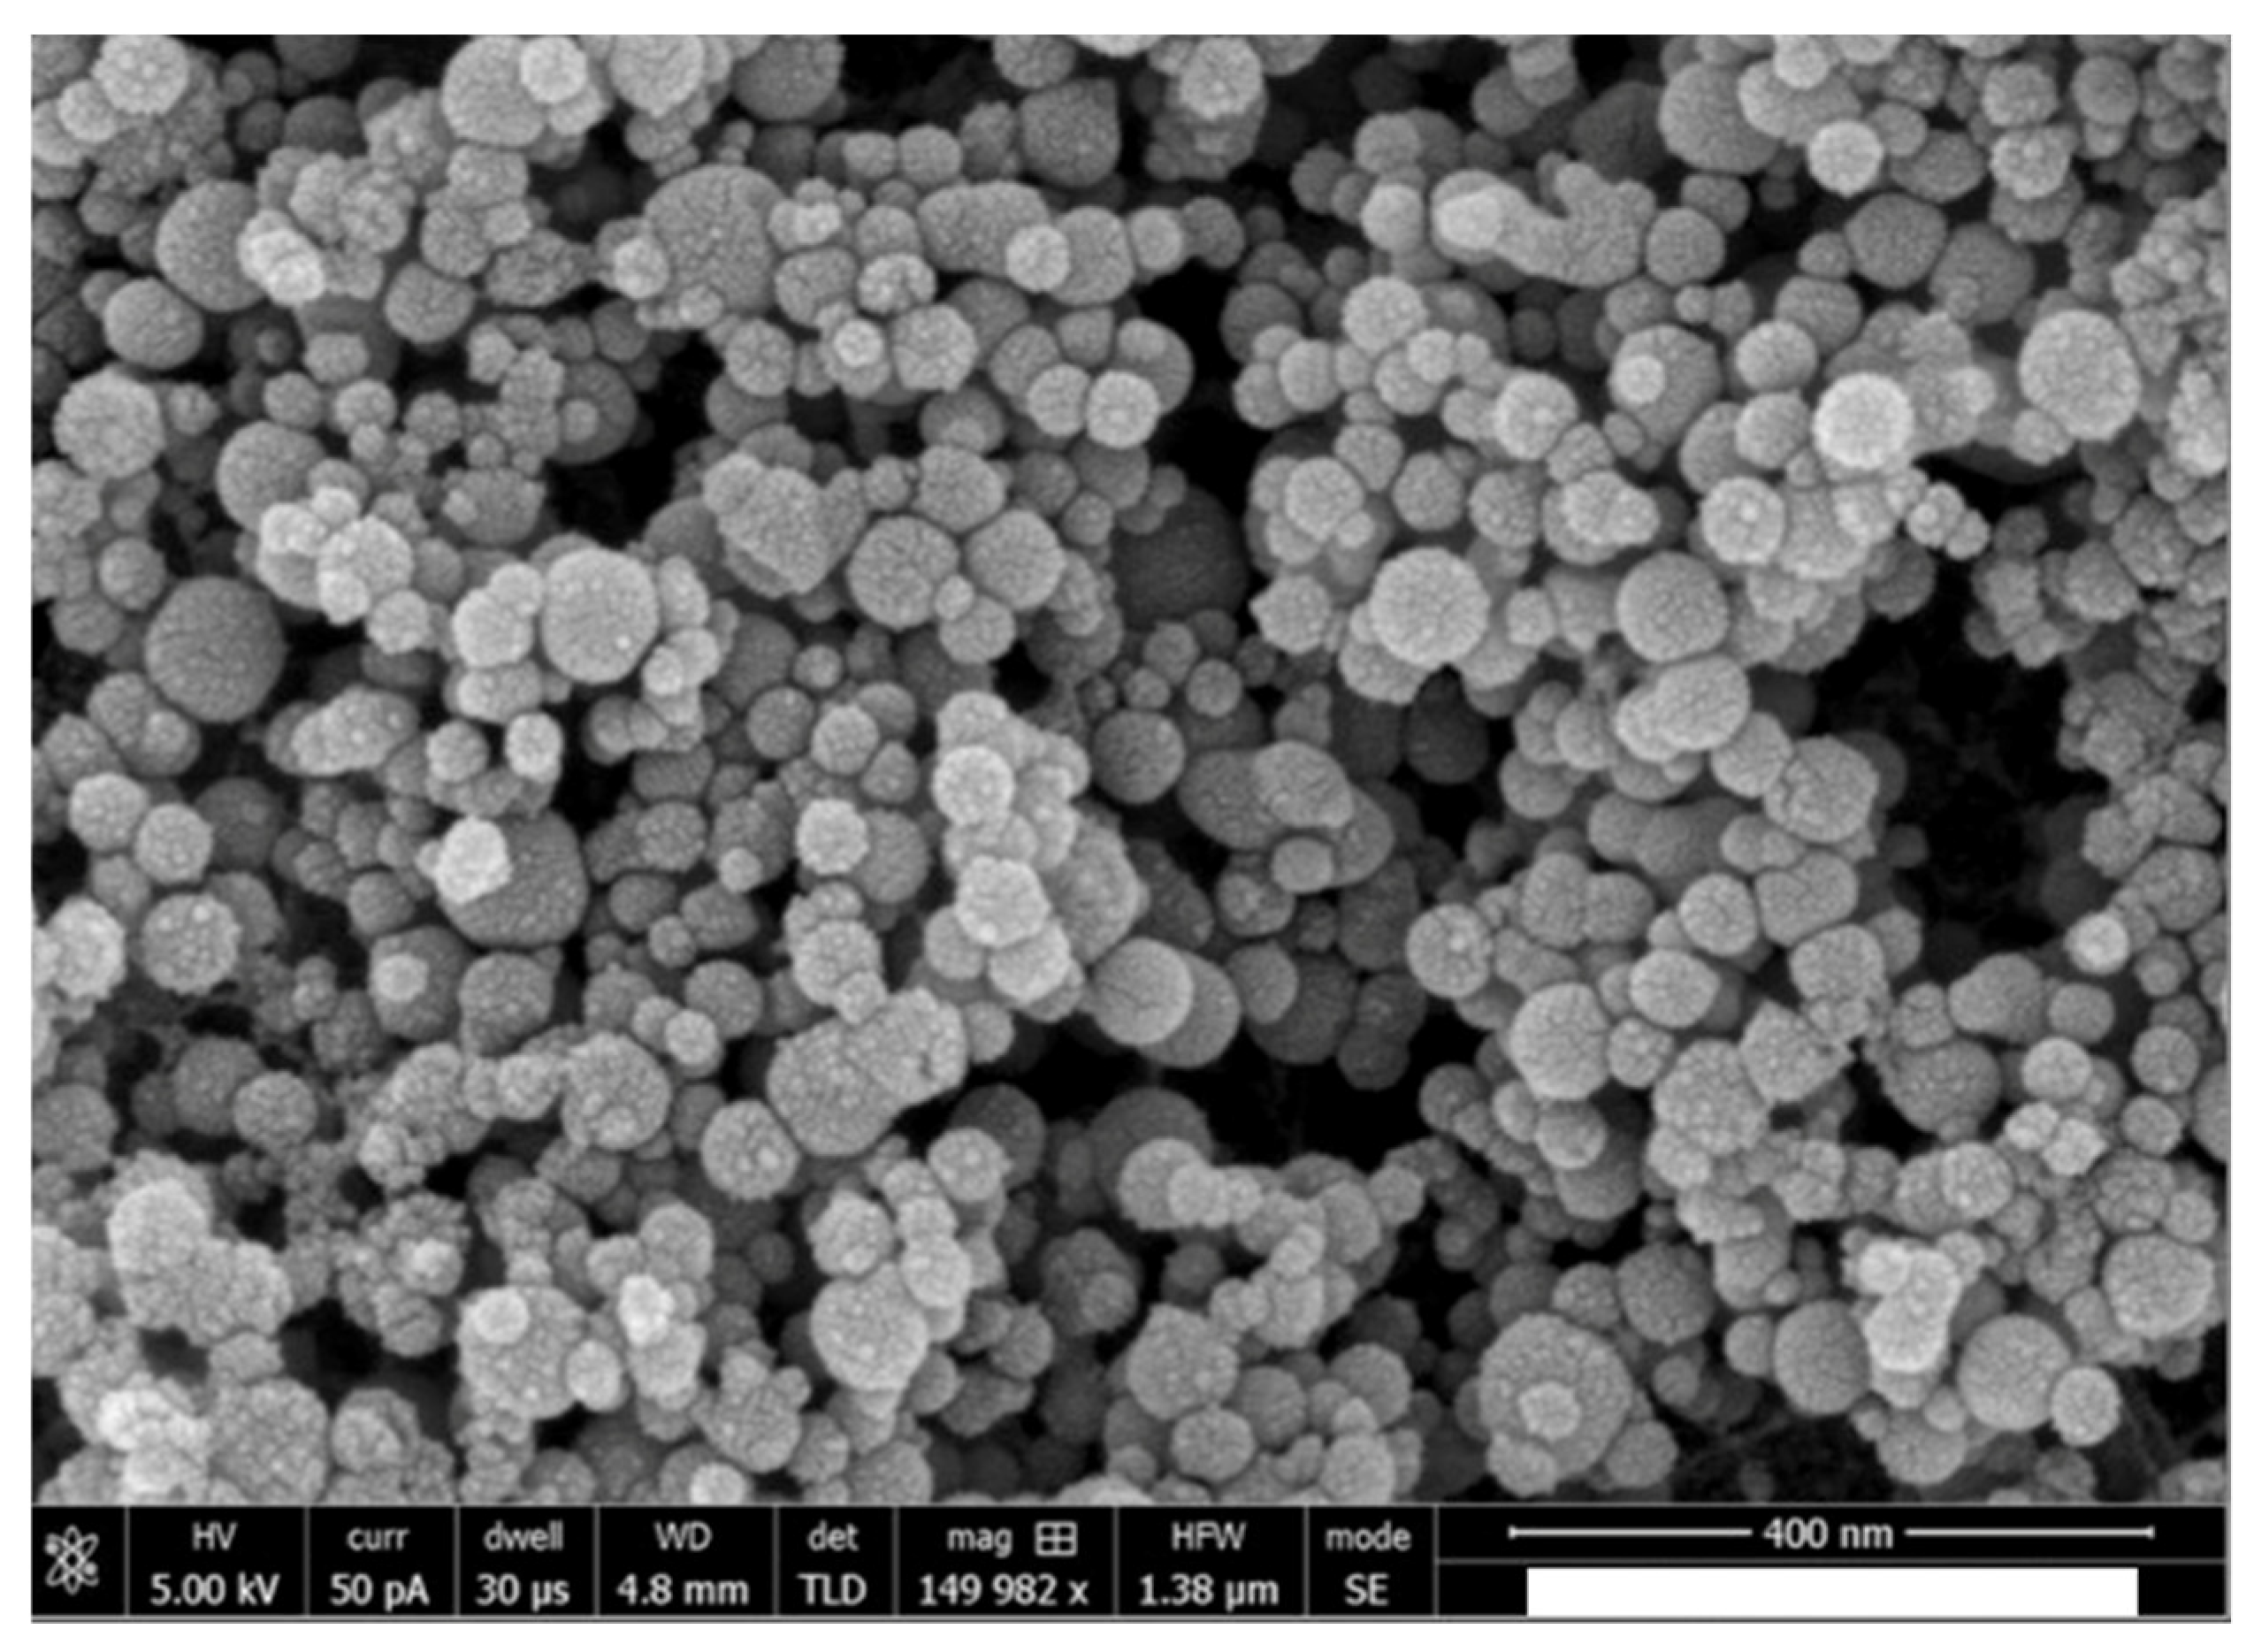
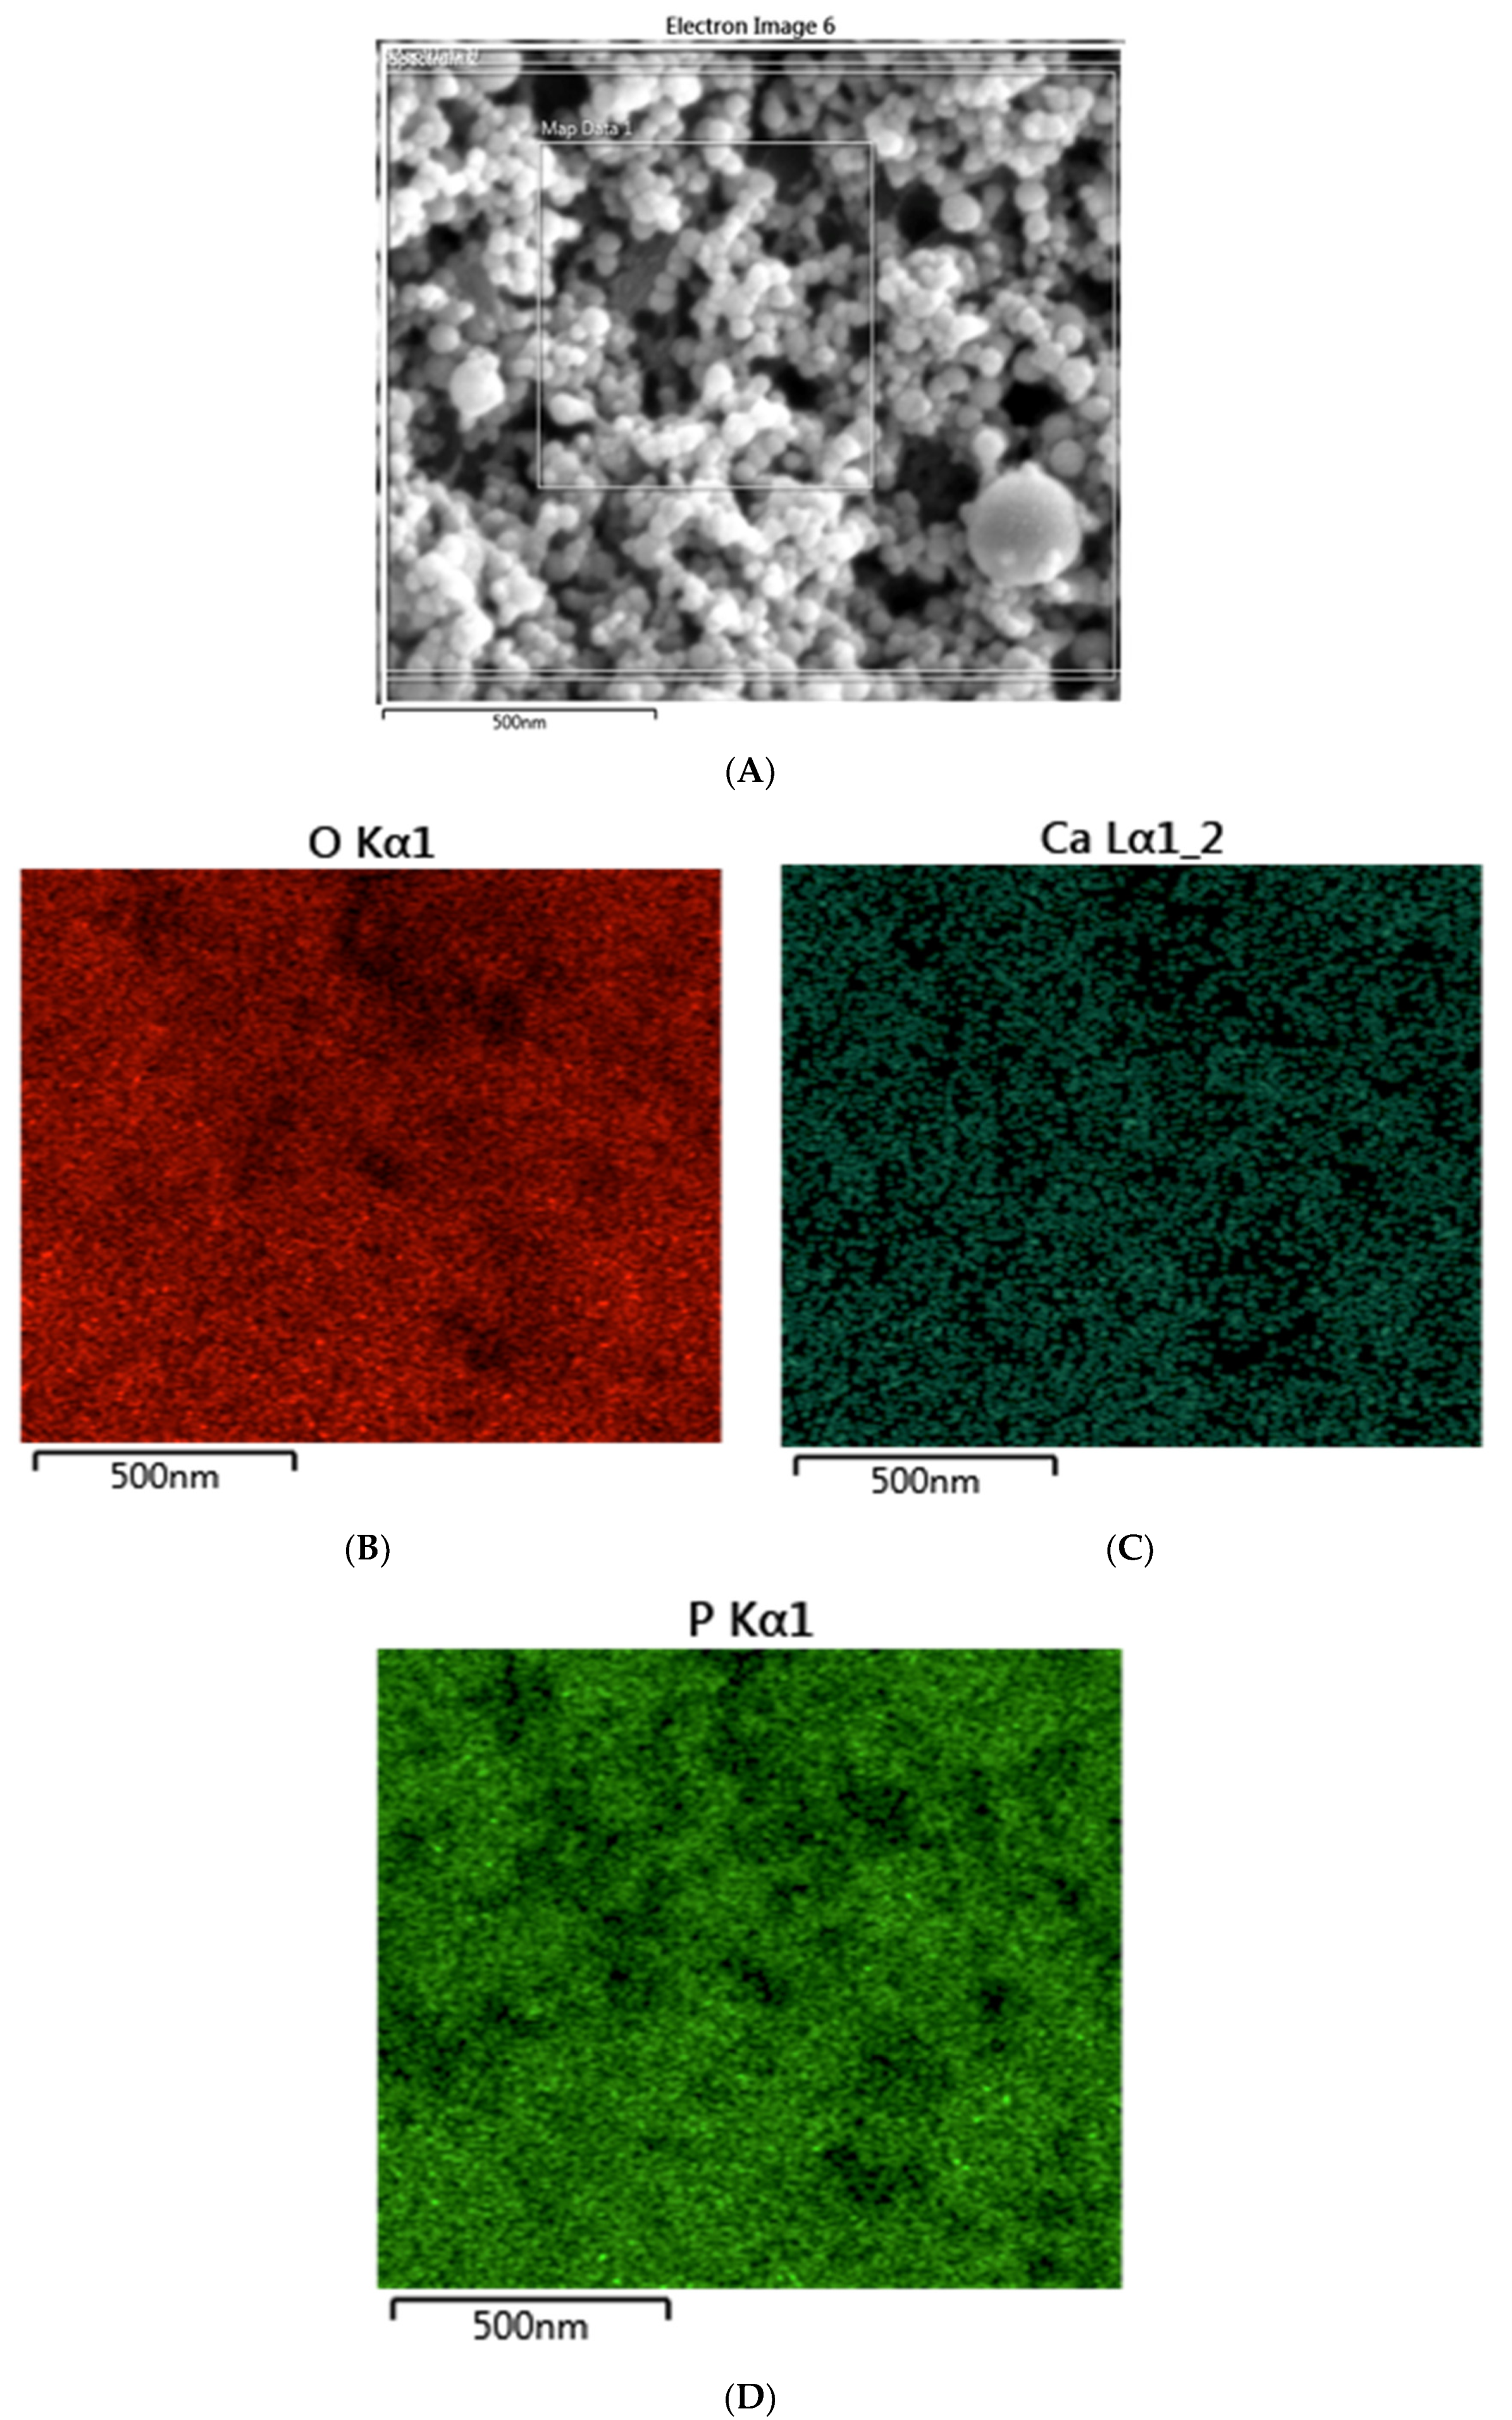
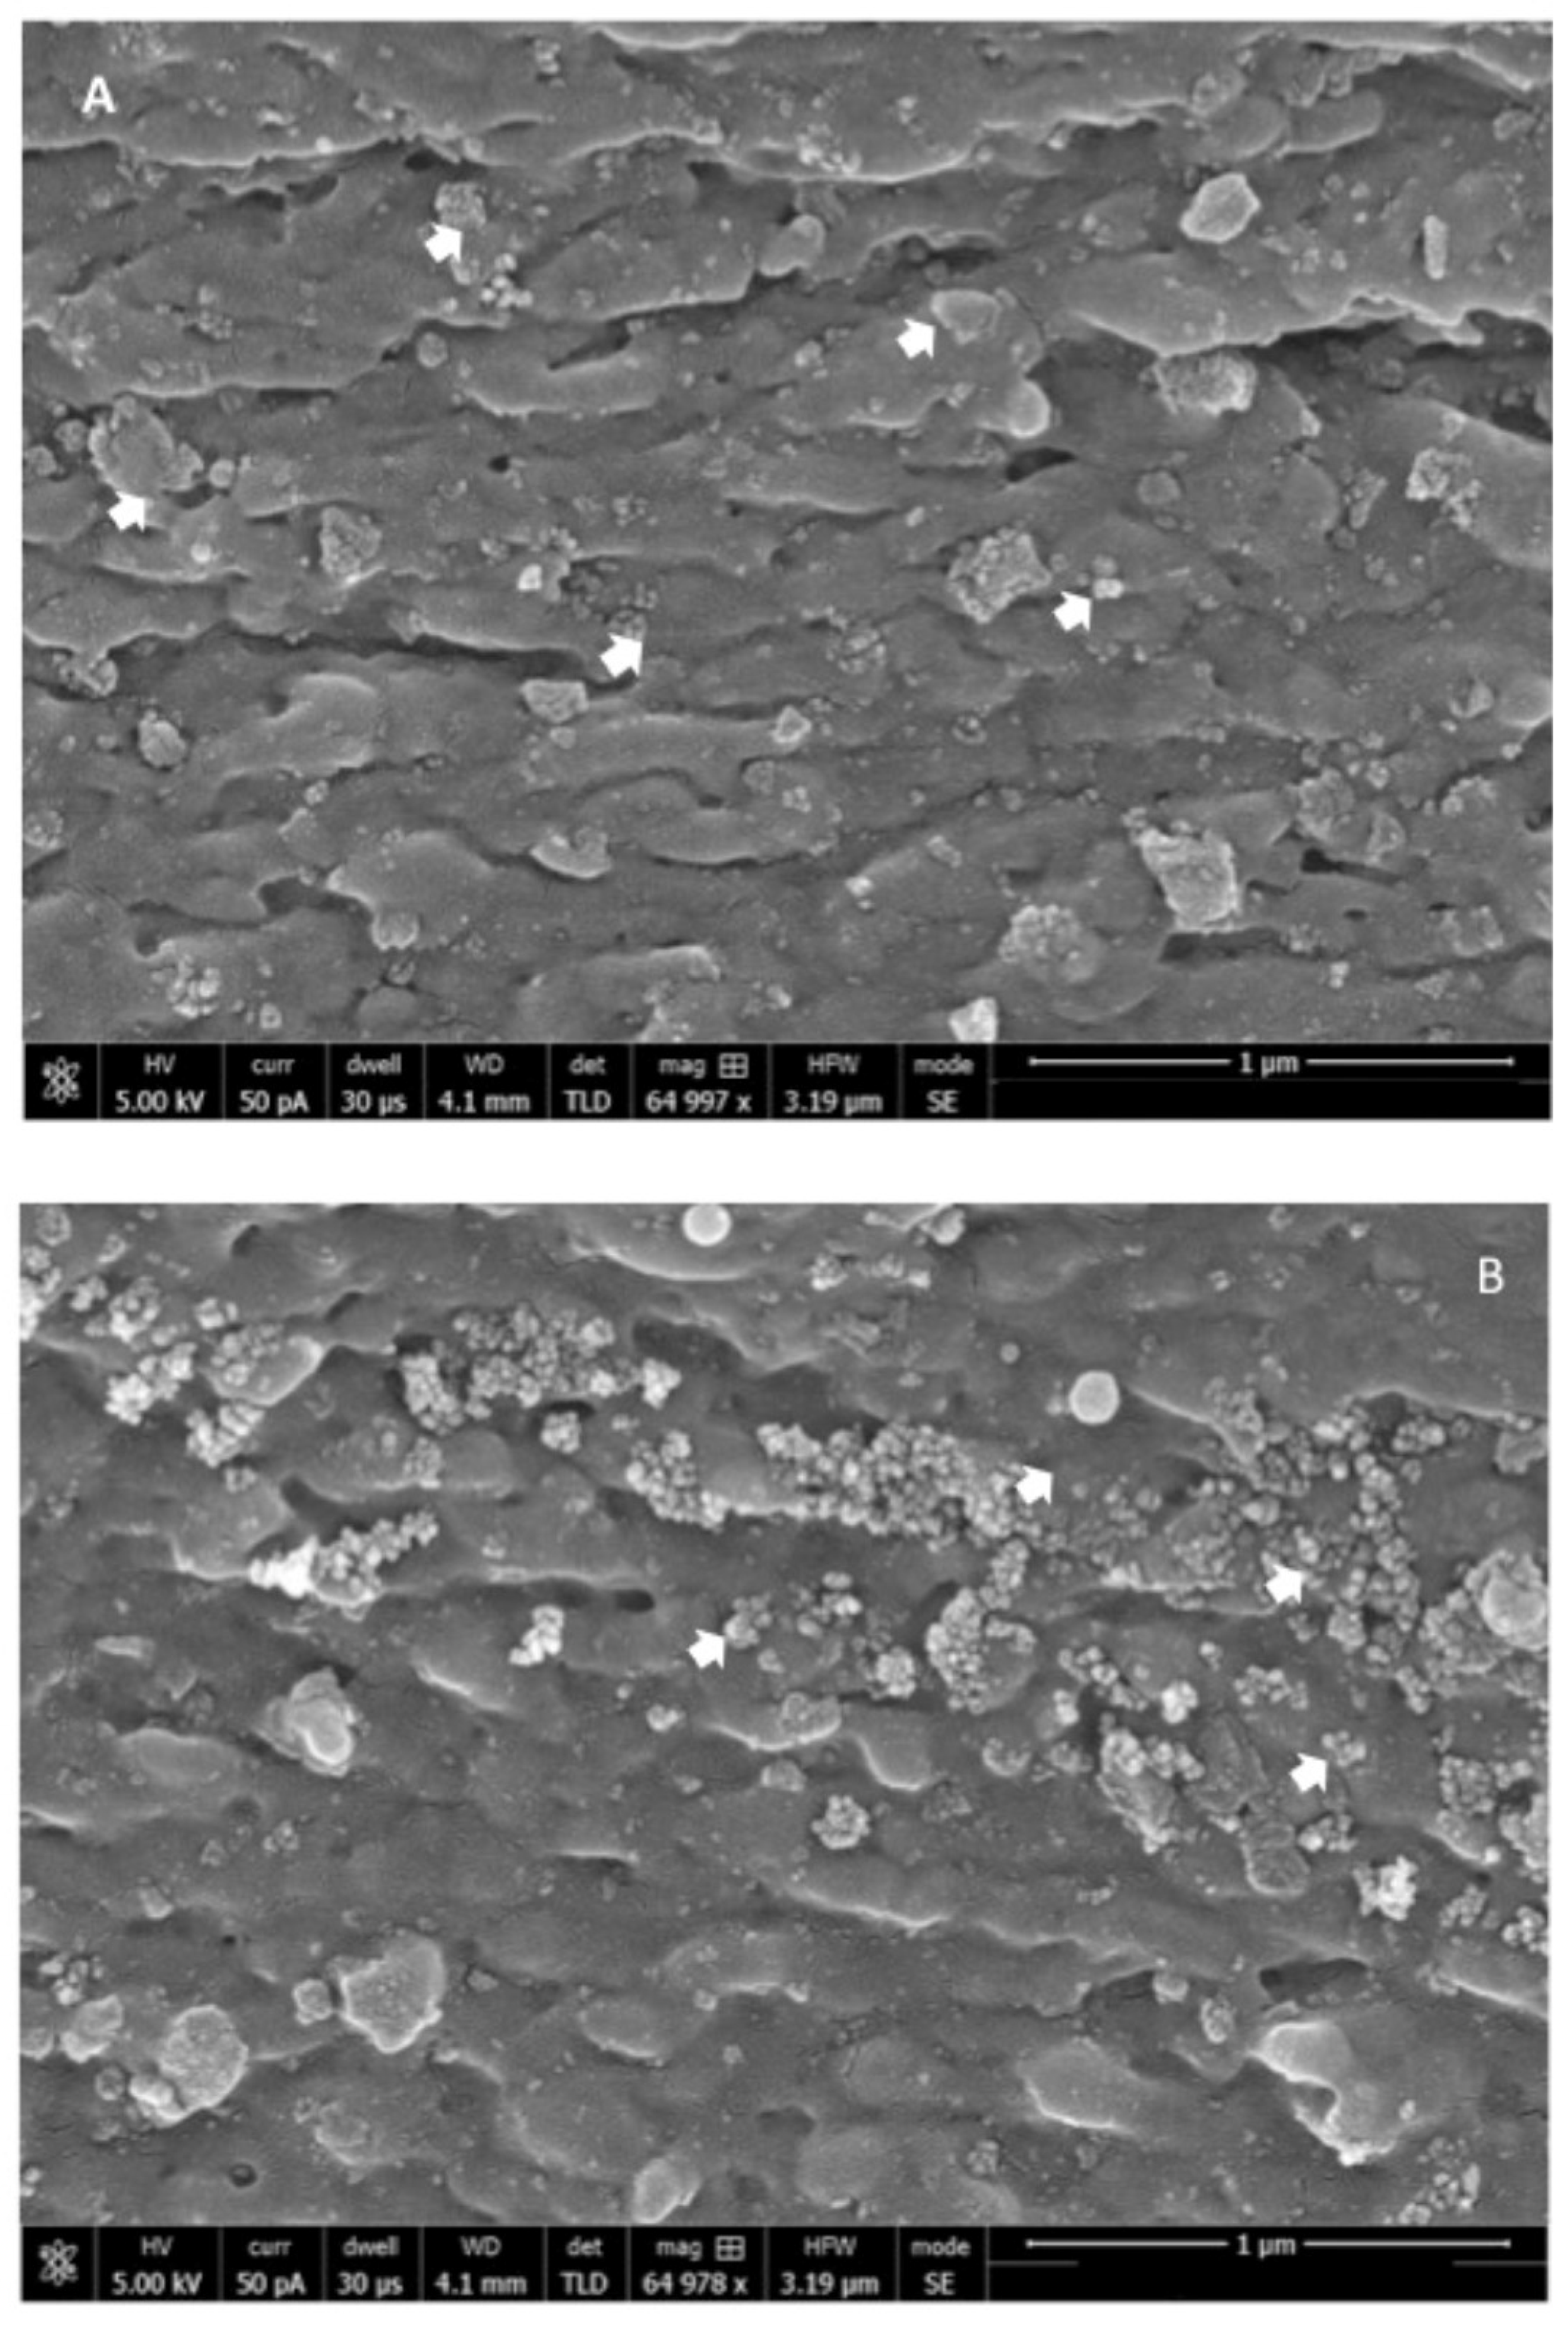
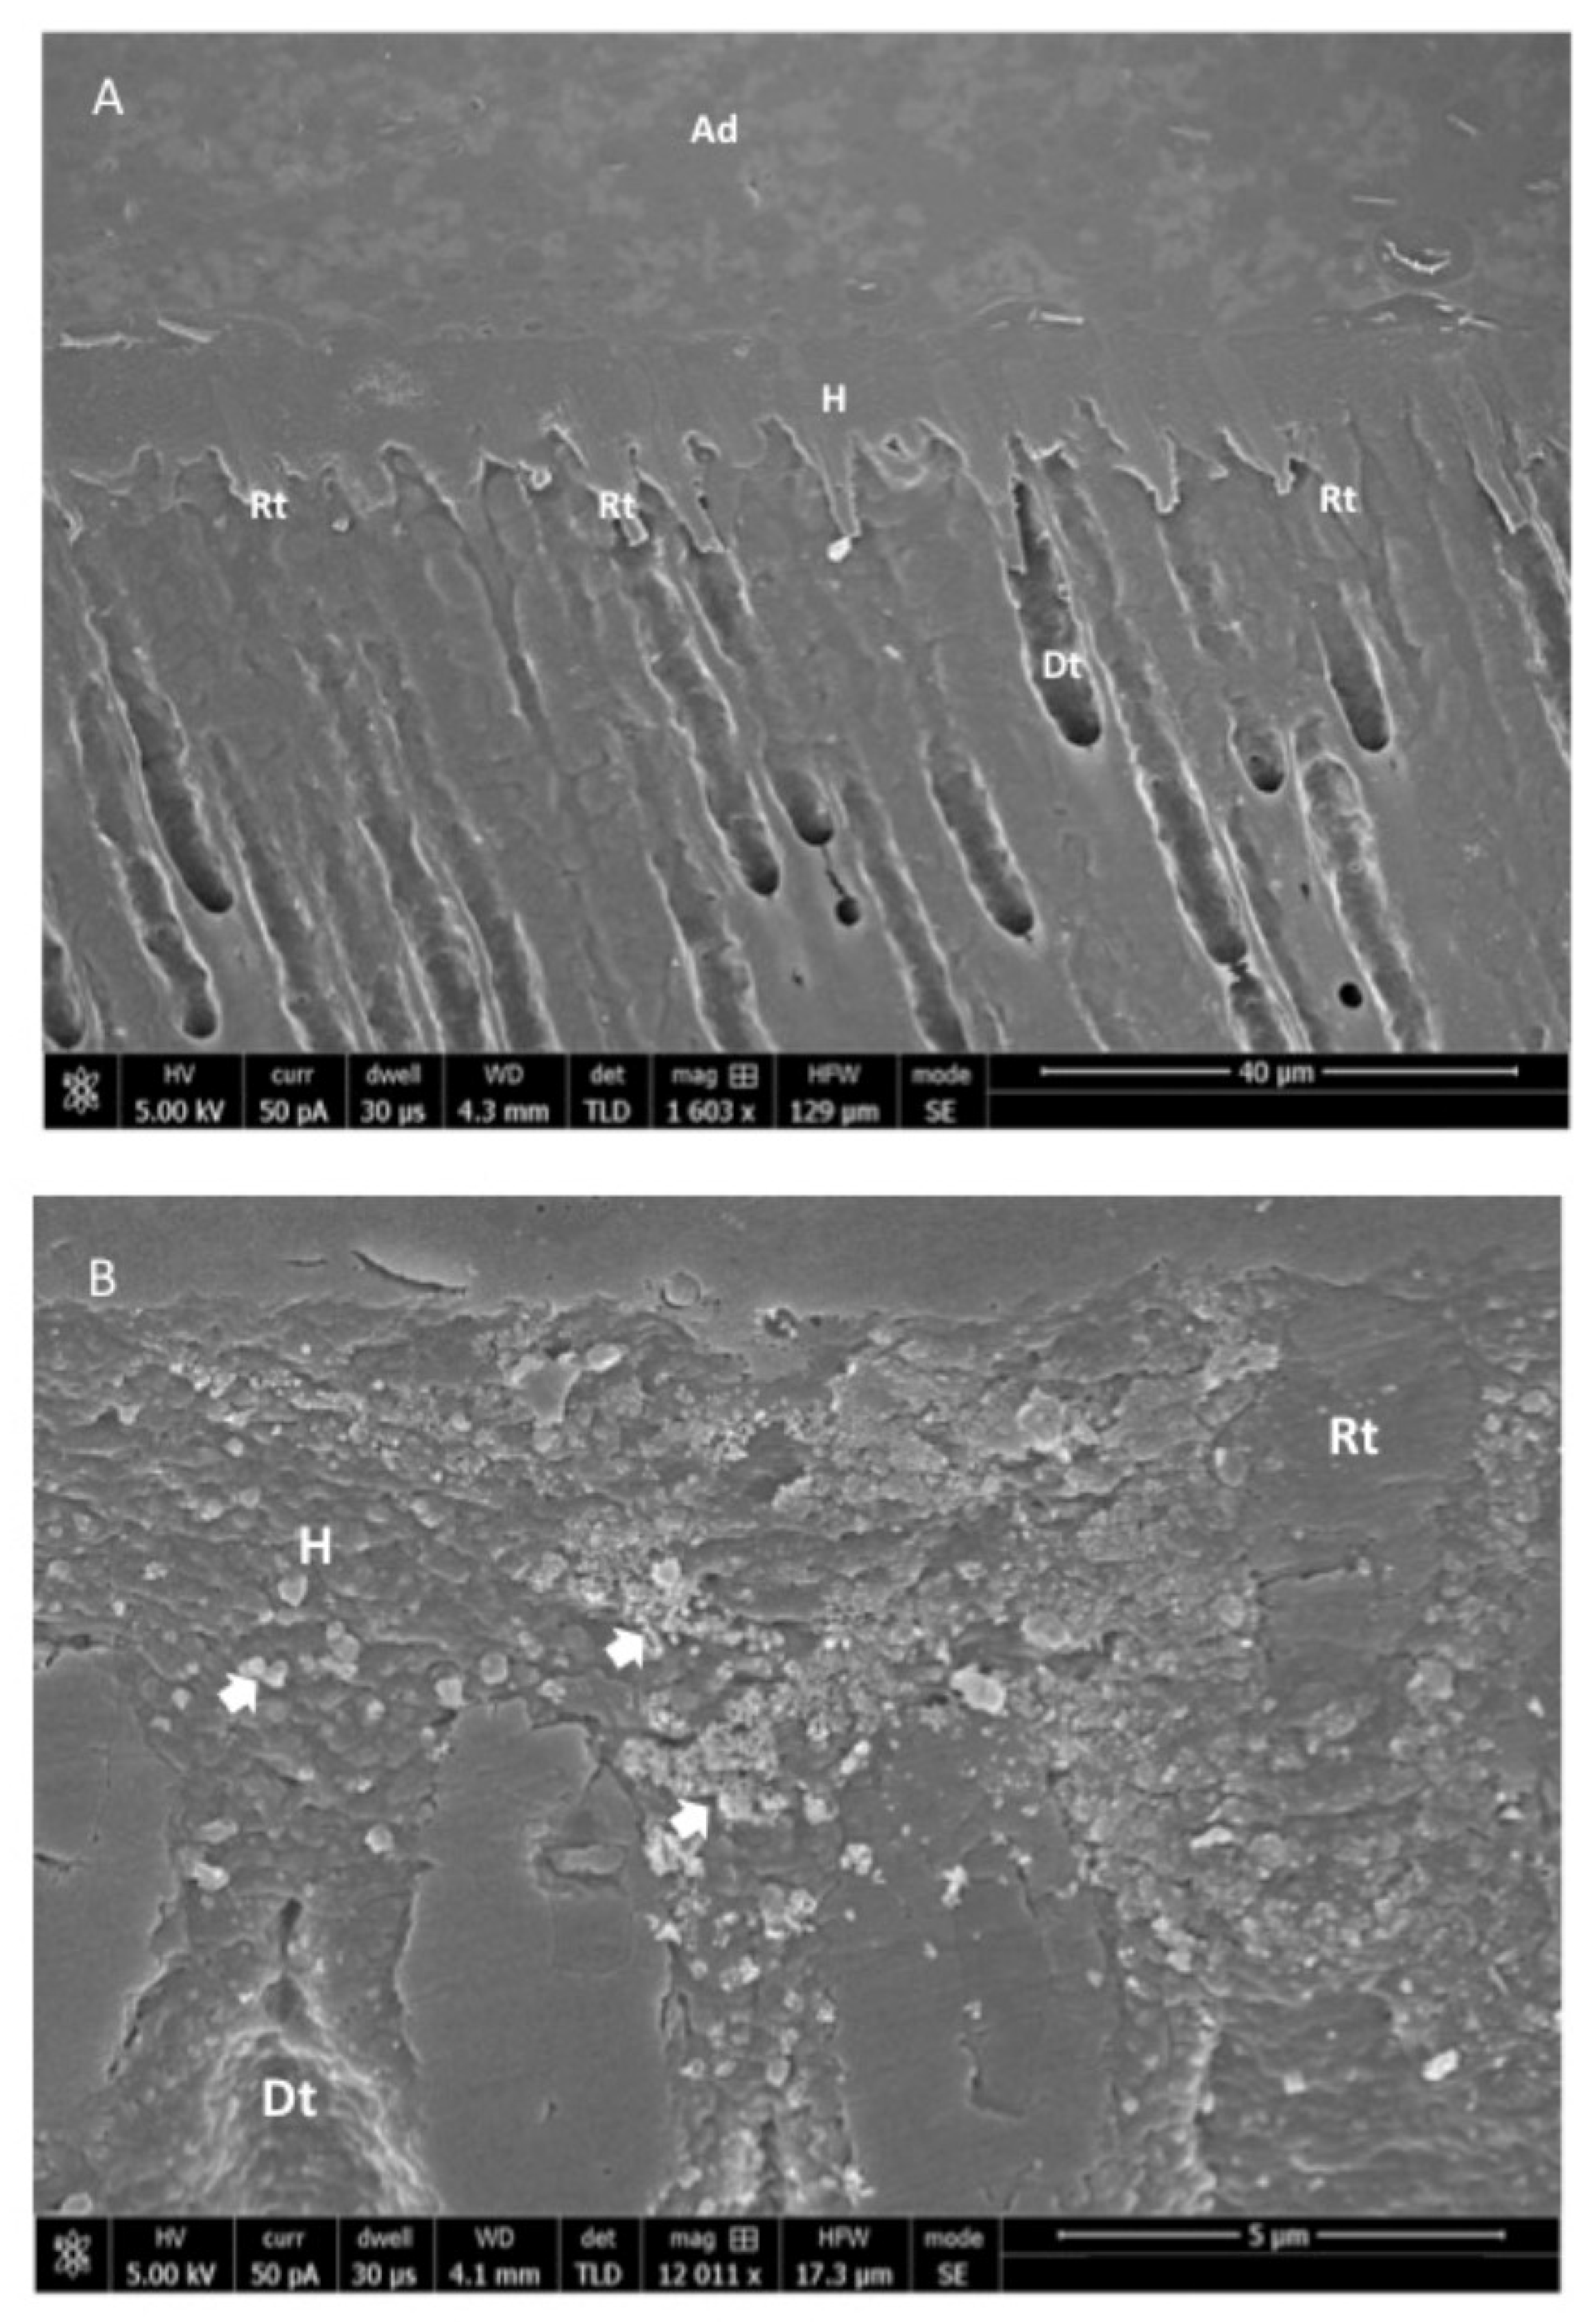
3.1. SEM/EDX Outcomes

On SEM analysis, the n-HA powder demonstrated an average powder size of <100 nm (Figure 1). With regard to the morphology, the n-HA powder particles were spherical in shape without any coarse edges (Figure 1). The EDX mapping analysis revealed the presence of oxygen, calcium, and phosphorus in the 5 wt % (Gp: 2) and 10 wt % (Gp: 3) HA samples (Figure 2). It was also observed that upon the mixing of n-HA powder in the experimental adhesive, a uniform distribution showing a homogenous dispersion of HA particles in the adhesive for HAA-5% (Figure 3A) and HAA-10% with agglomerates (Figure 3B) was observed. The Field Emission (FE)-SEM micrograph demonstrated the formation of a hybrid layer, and an admirable integration was observed between the dentin and HAA-5% (Figure 4A). Upon further magnification, widely distributed n-HA particles were seen in the newly formed hybrid layer as well (Figure 4B).

3.2. Microtensile Bond Strength (μTBS)
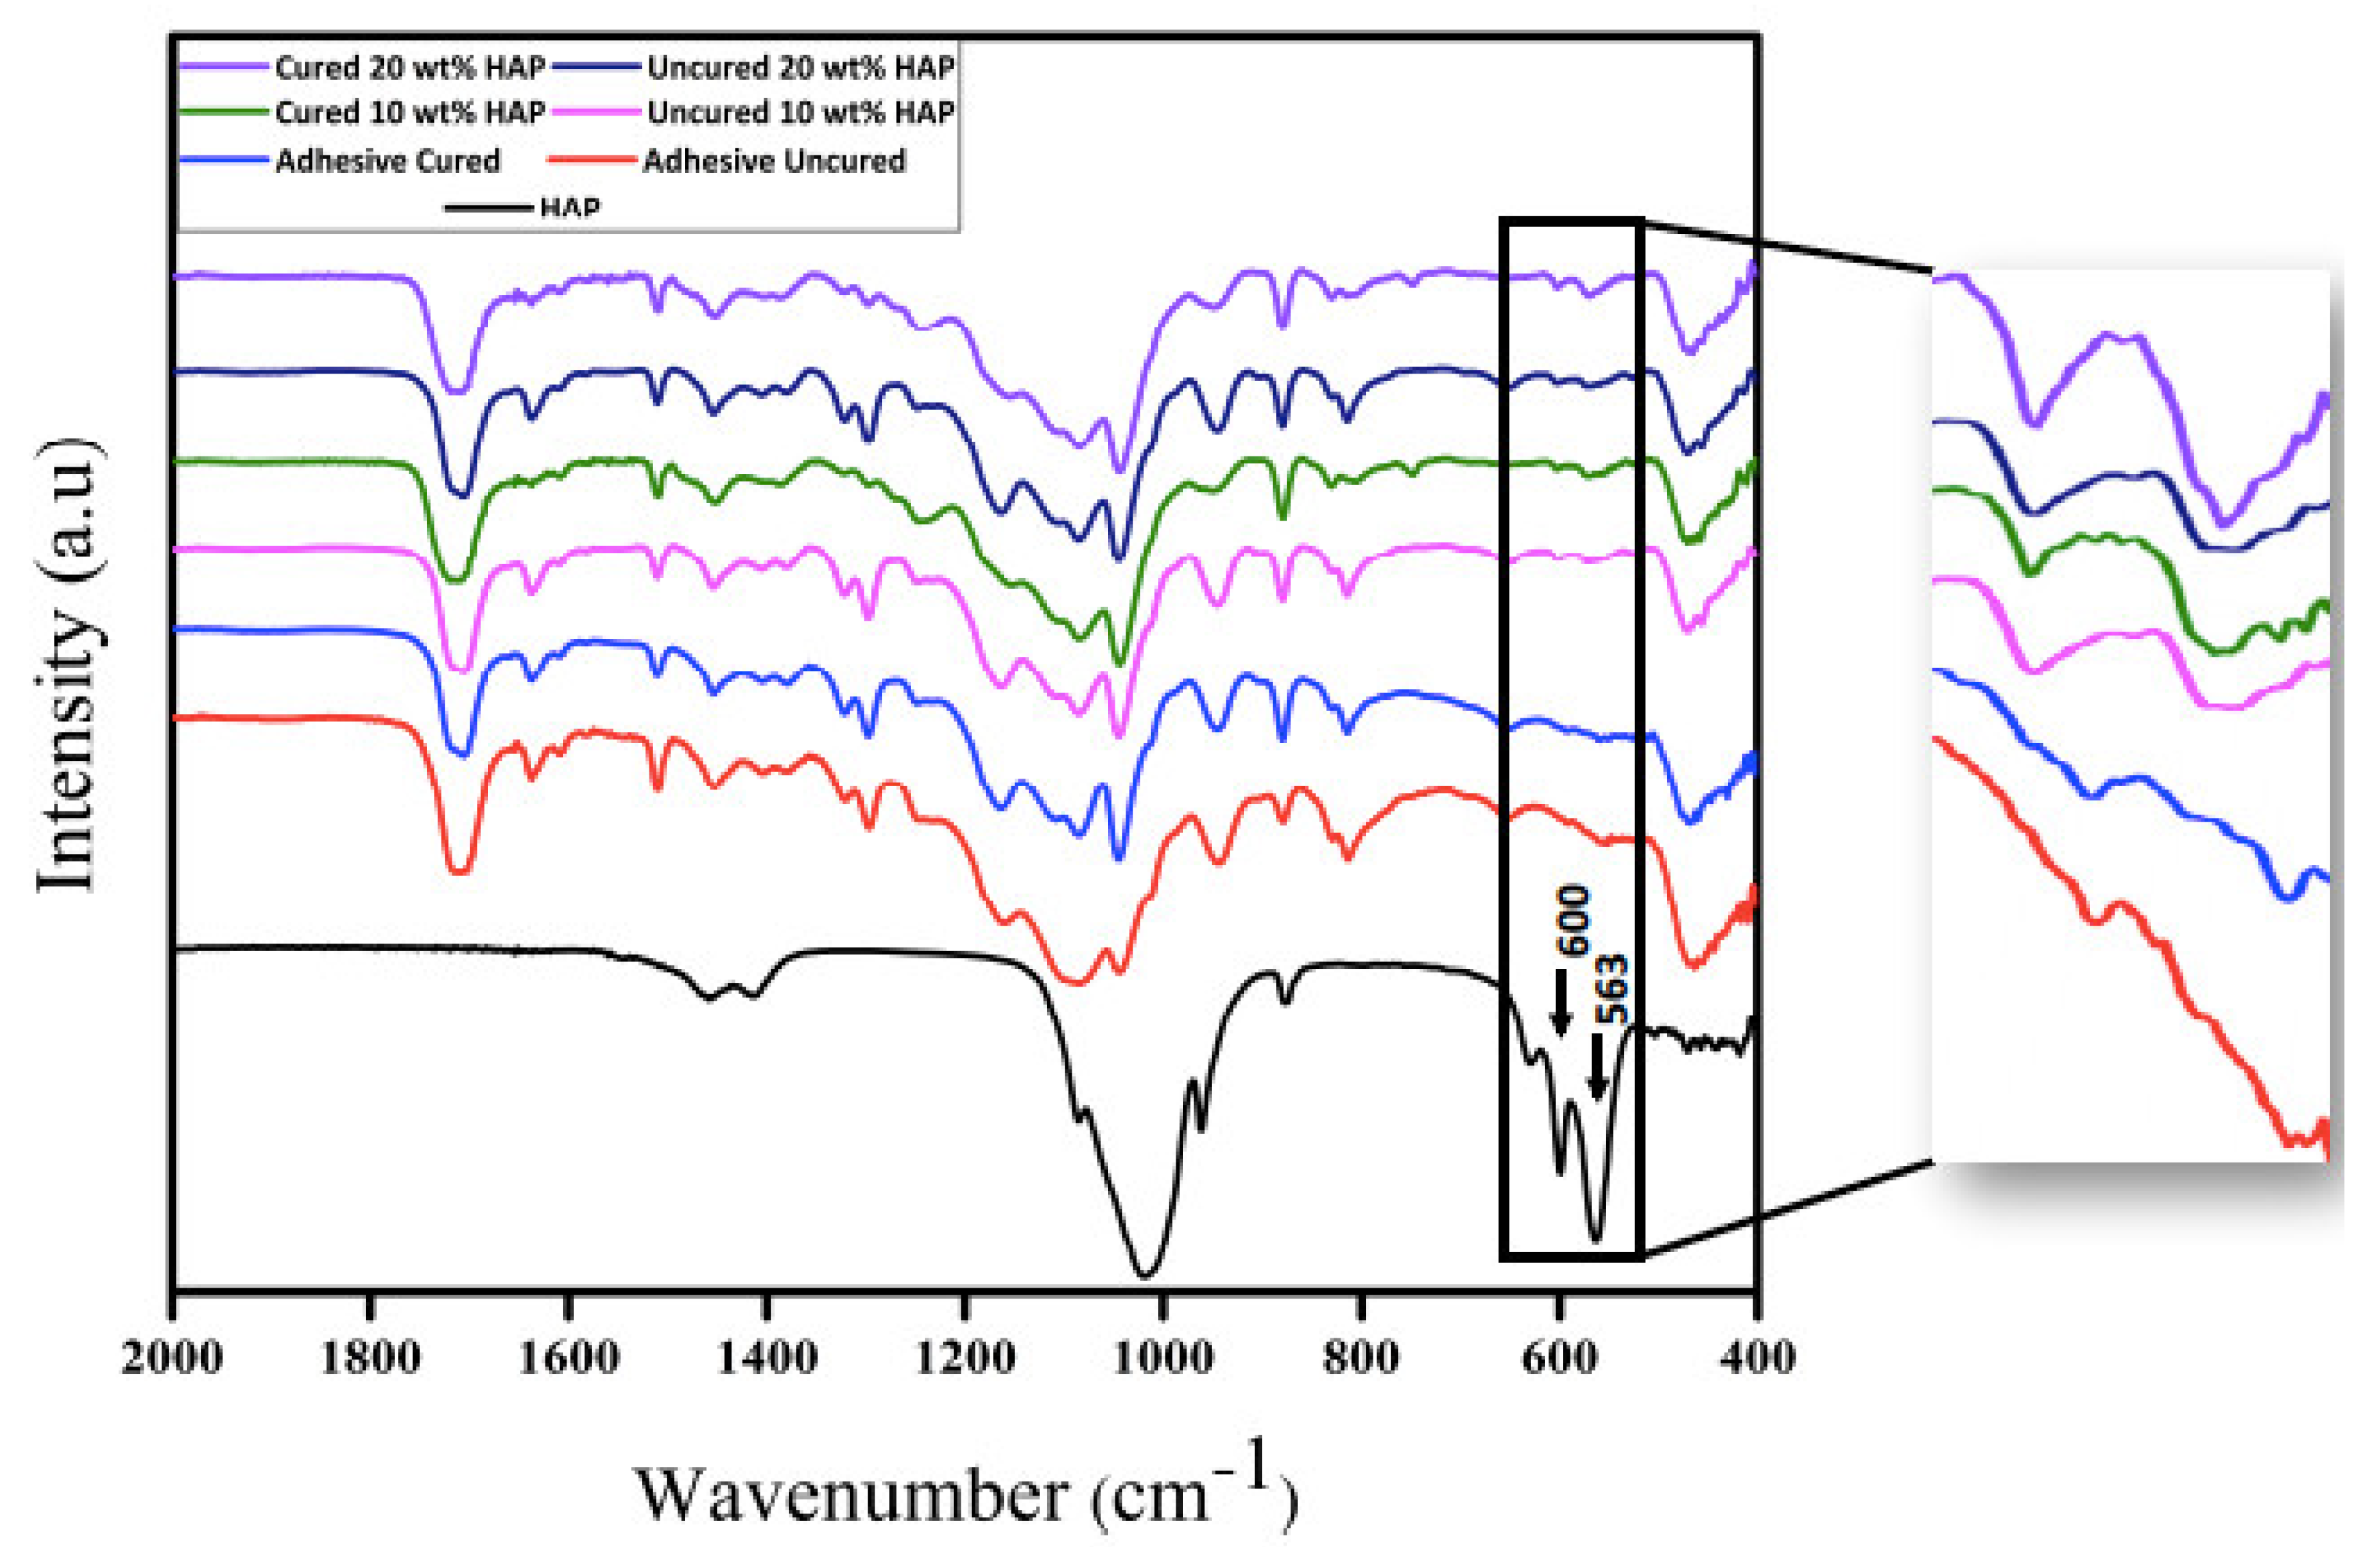
The μTBS MPa values (Mean ± SD) observed for the samples (both TC and NTC) of three groups in this study along with their respective failure modes are shown in Table 1. It can be observed that for the NTC samples, the HAA-5% group had the greatest mean μTBS values (32.50 ± 3.47) followed by CEA (27.36 ± 2.80) and HAA-10% (24.41 ± 3.72) groups. For the TC samples, the same pattern of μTBS values as observed with NTC samples was detected, and HAA-5% again had the greatest values (25.31 ± 3.84). On an intergroup comparison for NTC samples, the differences observed for CEA (27.36 ± 2.80) compared with HAA-5% (32.50 ± 3.47) and HAA-5% (32.50 ± 3.47) compared with HAA-10% (24.41 ± 3.72) were statistically significant (p < 0.01). For the intergroup comparison of TC samples, only the differences observed between CEA (21.71 ± 3.85) and HAA-10% (17.60 ± 4.36), and HAA-5% (25.31 ± 3.84) matched with HAA-10% (17.60 ± 4.36) were statistically significant (p < 0.01). On intragroup comparison for TC and NTC samples, differences between all groups were statistically significant (p < 0.01). Overall, if the μTBS values of TC and NTC specimens are compared, the NTC samples revealed higher mean values than the TC samples. There was no clear distribution pattern observed for the failure modes observed for the three groups; however, the majority of the failures observed were of adhesive type. Adhesive failure depicts a failure in adhesion with fractures, which are not observed in dentin or the resin [31]. In our study, although adhesive type failures were the most common, among them, the smallest percentage of adhesive-type failures was observed in NTC-HAA-5% followed by NTC-HAA-10%.

3.3. FTIR Analysis

The representative FTIR spectra of n-HA particles, CEA, HAA-5% (cured and uncured), and HAA-10% (cured and uncured) are shown in Figure 5. The characteristic peaks at 563 and 600 cm−1 show the evidence of the presence of apatite in the HAA. The apatitic phosphate groups usually demonstrate a characteristic split band at 560 and 600 cm−1, as observed for HAA in our study [32]. In addition, the presence of apatite could also be confirmed by the presence of a sharp single phosphate band [33], observed at 1040 cm−1 for HAA in our study.

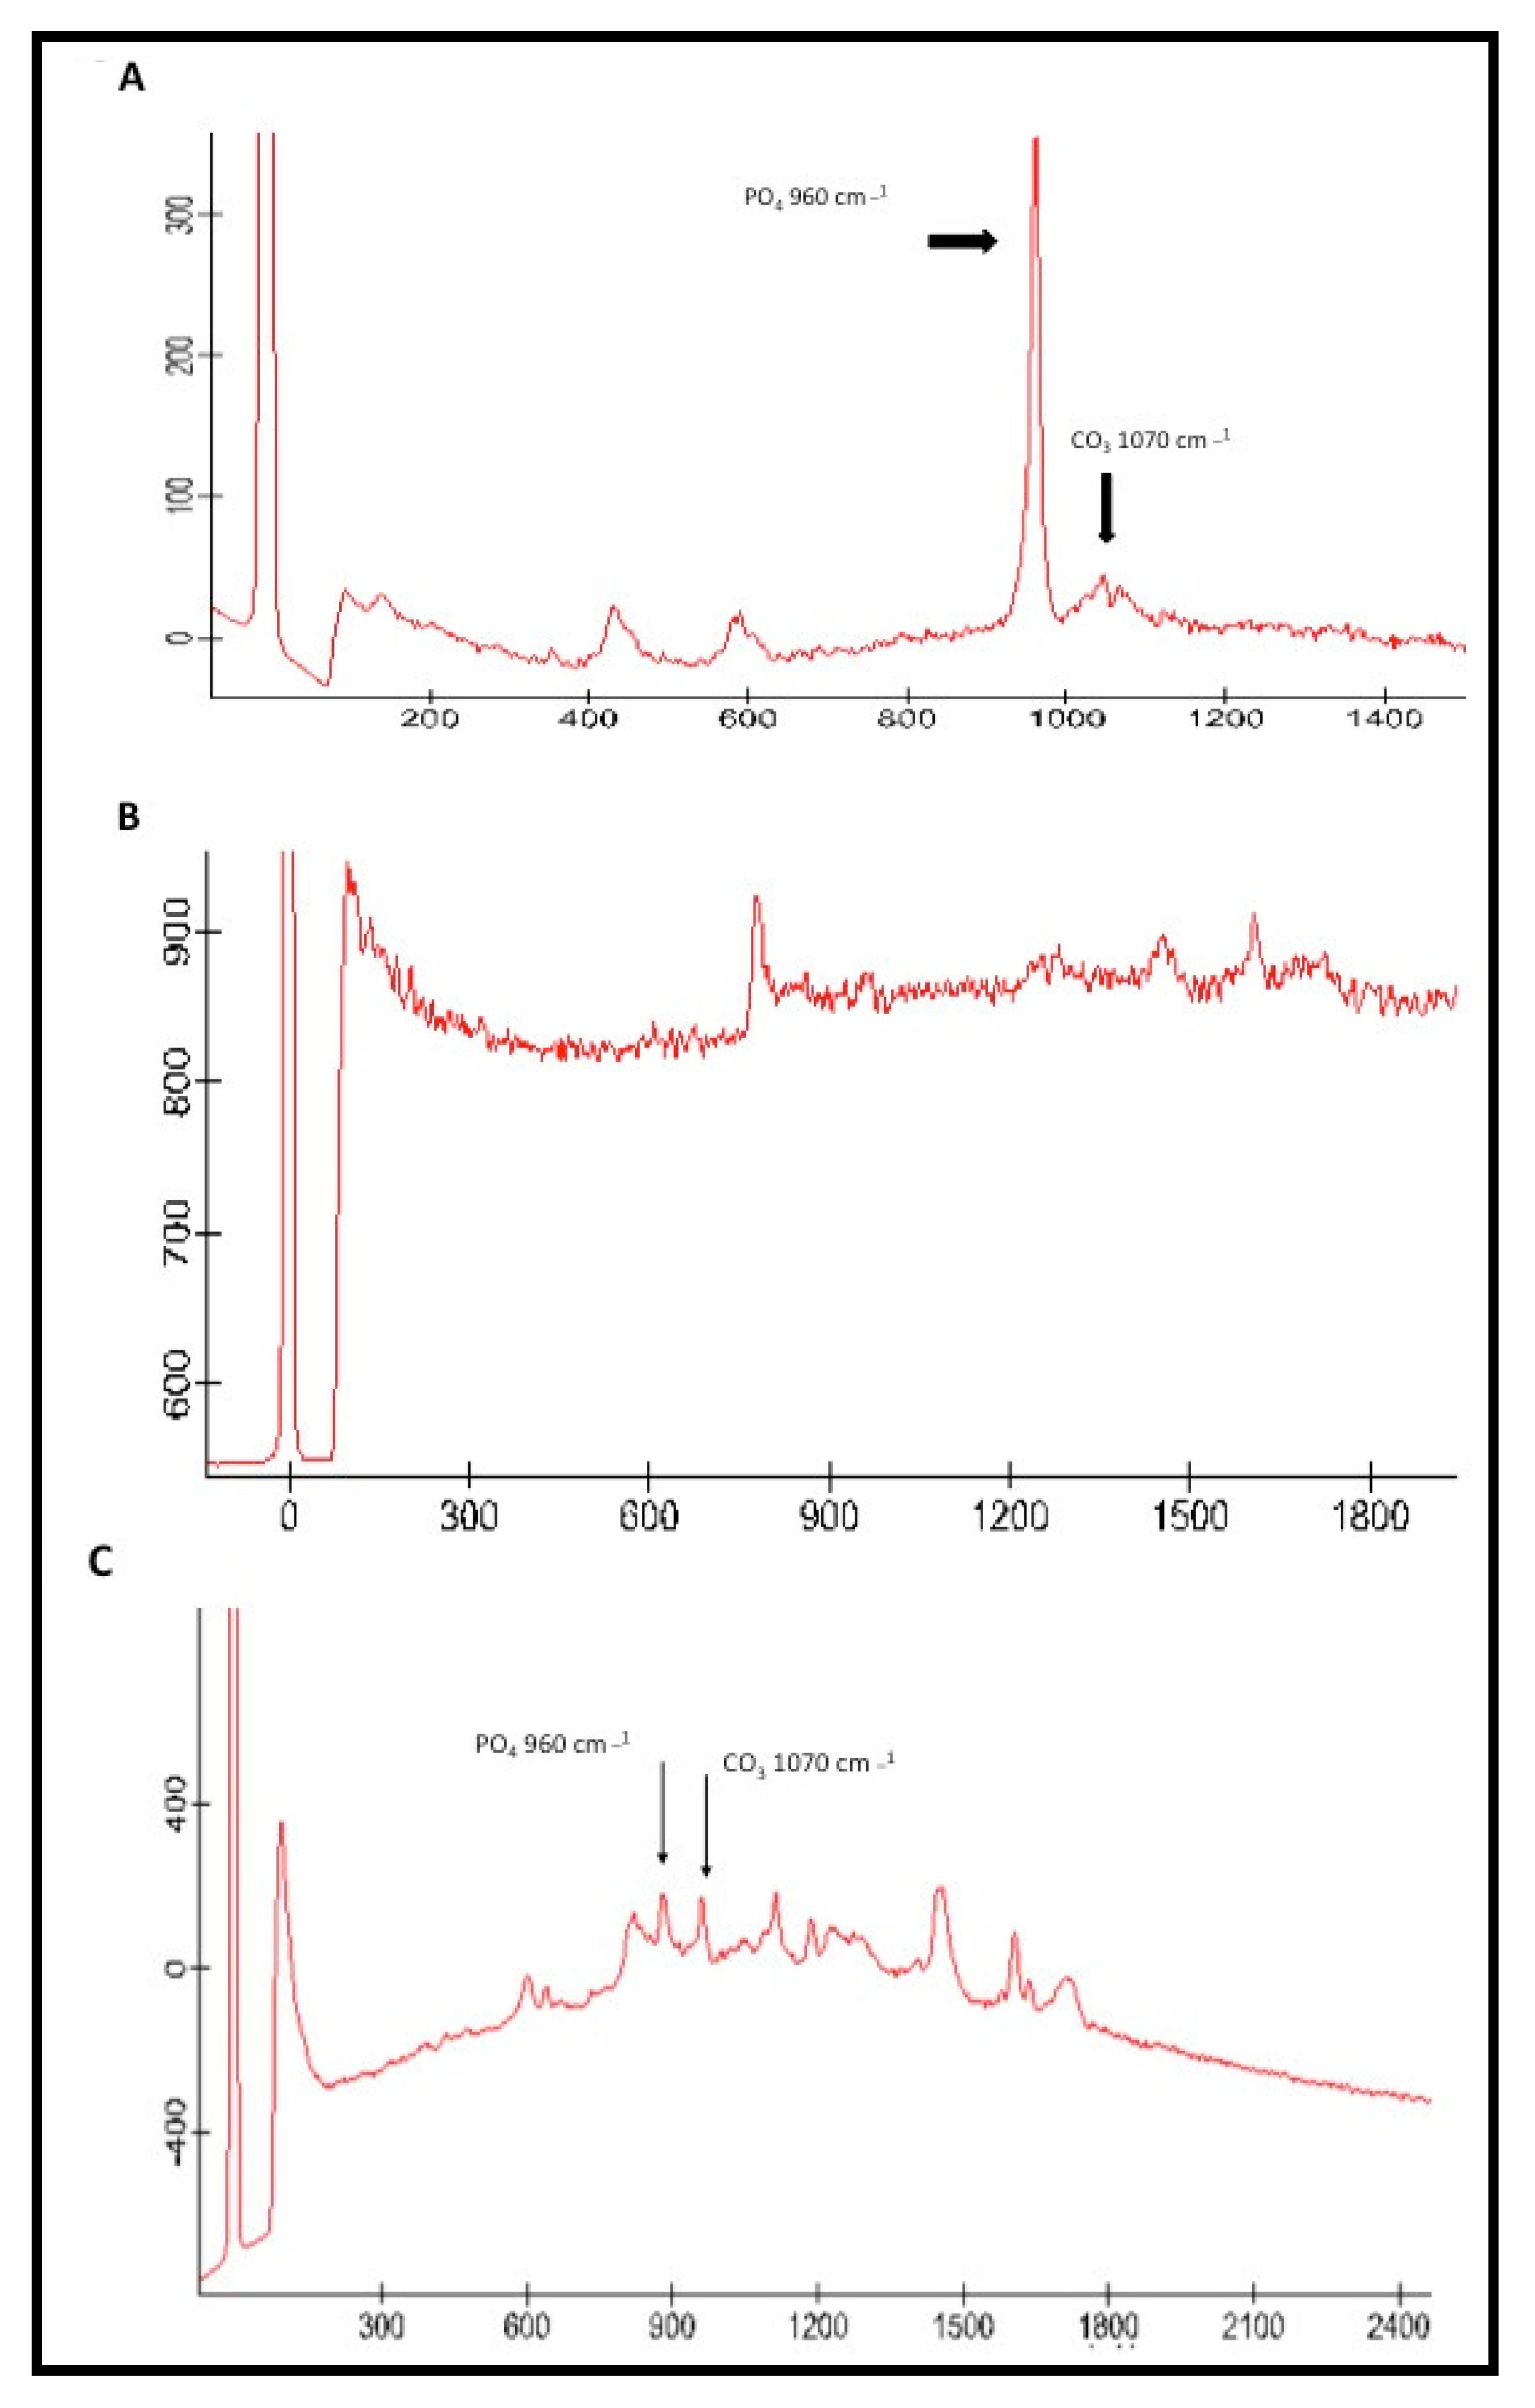
3.4. Micro-Raman Spectroscopy Outcomes

The representative Micro-Raman spectra of n-HA particles, CEA, and HAA-5% is shown in Figure 6A–C, respectively. The phosphate and carbonate groups could be identified in Figure 6A at 960 cm−1 and 1070 cm−1 correspondingly. For CEA, the presence of phosphate and carbonate groups is not clear (Figure 6B). The Micro-Raman spectra of HAA-5% group again demonstrates the presence of the phosphate group at 960 cm−1 and carbonate group at 1070 cm−1 (Figure 6C).

3.5. Degree of Conversion (DC)

The highest DC was observed for the group CEA (62.3 ± 5.2) followed by HAA-5% (58.1 ± 4.8) and then HAA-10% (51.8 ± 5.6). The intergroup DC result comparisons were significantly different (p < 0.01), for groups CEA and HAA-10%; and HAA-5% equated with HAA-10% respectively (Table 2). No statistically significant (p > 0.01) results were observed when the DC results for CEA were compared with HAA-5% groups.

4. Discussion

The present study investigated the effect of inclusion of n-HA spheres and its different content levels (5 wt % and 10 wt %) in an experimental resin adhesive on its bond strength and DC. Based on the outcomes, 5 wt % n-HA showed higher μTBS and comparable DC to controls. However, μTBS and DC of 10 wt % n-HA adhesive (HAA-10%) was significantly lower than control and 5 wt % n-HA (HAA-5%) adhesive. Therefore, the hypothesis was partly rejected. A multitude of explanations including HA particle size, opacity, chemical composition, and adhesive viscosity can be attributed to the current observations.
Dental adhesives are critical in the clinical success of restorations, as a compromised res-adhesive bond is associated with microleakage, DH, and secondary caries development [9]. The use of nanoparticles as reinforcing filler improves the mechanical, physical, and working properties of dental composites, as opposed to macro or micro-sized fillers [34]. The researchers have incorporated various therapeutic ions including silver nanoparticles (AgNPs) [35], zirconium oxide–titanium dioxide (ZrO2-TiO2) nanoparticles [36], copper-doped bioactive glass nanoparticles (CuBGn) [37], and n-HA to improve the properties of adhesives [38]. The n-HA offers superior biocompatibility to act as a source of calcium and phosphate, in addition to possessing a strong ability to bond with tooth proteins [38,39]. It is also evidenced that n-HA particles are a better source of free calcium ions, which are required for remineralization [39]. These benefits of n-HA encouraged its incorporation to the experimental dental adhesive and its further influence on resin–dentin bond integrity, DC, and μTBS.
The μTBS test was employed in the present study, as it shows better discriminative competence [40], precise estimation of bond strength, and standardized relatable measurements [41]. It is suggested that the lower n-HA particle size (<100 nm) with spherical morphology, in comparison to micro HA, increases the exposed surface area for adhesion and mineral release [42]. In addition, a lower n-HA particle size also ensures adequate calcium and phosphate ion release (essential for remineralization) while retaining excellent mechanical properties [43], although this particular aspect was not investigated in our study. In the present study, <100 nm n-HA particles enhanced the μTBS of HAA-5% group as compared with the CEA group (without n-HA particles). Another probable reason for the improved μTBS for HAA-5% is its ability to biomineralize with the collagen network of tooth tissue [44], resulting in enhanced remineralization and bond integrity. However, it should be noted that the μTBS of HAA-10% was lowest among all groups, suggesting a compromise in dentin interaction and penetration, hybrid layer formation, mechanical properties, and dentin wetting. A study by Wagner et al. reported a decrease in adhesive bond strength with an increase in filler wt % of >10%, which was due to an increase in the viscosity of the material [45]. In the present study, agglomerate formation in HAA-10% specimens was detected in SEM micrographs; such clusters can lead to defects in the bonding complex concentrating applied stresses, decreasing bond strength [34]. The μTBS outcomes for HAA-5% are in agreement with the findings of Leitune et al., as they demonstrated an improvement in bond strength with the inclusion of n-HA in the experimental adhesive resin in comparison to control group [21]. In order to mimic the oral cavity’s dynamic conditions, bonded dentin–adhesive beams were thermocycled to depict bond durability with temperature changes encountered in an in vivo environment. Earlier, Helvatjoglu-Antoniades et al. demonstrated that thermocycling could reduce the bond strength of dentin adhesives [46]. Their findings are in conformity with the present study, as all adhesive specimens (CEA, HAA-5%, and HAA-10%) showed a decrease in μTBS due to TC [46].
In the present study, the uniform mixing and dispersion of n-HA particles within the experimental adhesive, as shown by the SEM images, is critical to positively alter the properties of dentin adhesive. If the particles are not properly diffused in the adhesive, it could lead toward observation of gaps or cracks, hindering the optimal performance of the adhesive [47]. It should also be noted that numerous resin tags with varying depths were observed on SEM micrographs with a similar distribution for CEA and HAA specimens, indicating an optimal removal of smear layer and adequate adhesive penetration at the dentin interface. This is usually the case when the performed etching is sufficient to remove the smear layer [47]. However, it should be noted that the resin tag depth in the tubules does not necessarily impact the bond strength and intactness of the adhesive, as reported by Anchieta et al. [48].
Micro-Raman spectroscopy is considered to be a vibrational spectroscopic diagnostic technique used to study the polarization of molecules [49]. We employed Micro-Raman spectroscopy to study n-HA as a bonding component in the hybrid layer, as this technique involves scattering instead of absorption; therefore, specimen of any thickness can be visualized without any destruction [50]. In our study, n-HA demonstrated intense phosphate and carbonate peaks, whereas for the HAA-5% group, although these peaks were visible, their intensity was decreased. The plausible reason of this particular finding could be that there is a transitional change in the intensity of the Micro-Raman bands when the minerals are replaced with resin, as reported previously [46]. Our study results are in line with a previous study as the peak intensity for phosphate and carbonate groups decreased for HAA-5% group [51].
The representative FTIR spectra in our study demonstrated a characteristic split band and sharp phosphate band for n-HA particles. Then, the same particles were added to the experimental adhesive to achieve HAA-5% and HAA-10% adhesive. There was a linear inverse relationship between the addition of n-HA particles and DC observed in the study. The DC of HAA-5% and HAA-10% group decreased compared with CEA group, and this finding is contradictory to Zhang and Wang, who reported that the DC increases when HA particles are added to the experimental adhesive [52]. The possible reason for this finding could be attributed to the fact that they used low HA concentration (1–4 wt %) in their study [52], in contrast to the 5-10 wt % used in the present study. The n-HA particles are opaque in nature to the visible light and can affect polymerization adversely [53]. Therefore, a high n-HA concentration in experimental adhesive could provide a less favorable medium for the light penetration and polymerization of the monomers to polymers, hence, leading toward less DC. Therefore, it is suggested that n-HA should be added to the adhesive with a diluent that could regulate its increased viscosity, leading toward more DC. Another reason could be that the addition of a higher amount of HA in the adhesive causes higher viscosity, leading toward a resultant low DC [21], although in the present study, the viscosity of the adhesives was not investigated.
In the present study 10 wt % HAA incorporation in experimental adhesive showed an agglomeration of particles with lower μTBS and DC, and these findings could critically compromise the dentin adhesion overtime. Treatments are available to improve the interface between the nanoparticles and the surrounding polymer to improve filer dispersion, including the addition of reactive groups, silane modifications, and polymer grafting Moreover, the addition of diverse ratios of n-HA in the adhesive could assist in establishing precise μTBS values in the dentin [27]. Therefore, further studies investigating the influence of incorporating surface-modified HA nano-spheres at higher concentrations and diverse ratios on mechanical properties, adhesive bonding, and the degree of conversion are recommended. In addition, the leaching of HA particles with possible cytotoxic effects such as free radical generation is a possible concern. As the biological interaction of HA nanoparticles with cell types and tissues were not assessed in the present study, future studies on the organic response of surface-modified HA particles would be revealing.

5. Conclusions

Within the limitations of the study, incorporated n-HA spheres uniformly dispersed in the experimental adhesive to exhibit dentin interaction and the formation of a hybrid layer with resin tags at varying dentin depths. HAA-5% demonstrated superior μTBS as compared with HAA-10% and control adhesive. The degree of conversion for HAA-5% was comparable to the control adhesive; however, HAA-10% was the lowest. Therefore, the inclusion of 5 wt % n-HA could improve the adhesive’s mechanical properties as it proved to be promising filler in our study and could have practical applications in clinical dentistry.

Author Contributions

R.SA.-H., N.A.A. and H.FK.: Data collection, study design, data assessment, and manuscript writing, final manuscript approval. B.A., I.F.: Data inference, experiments performance (SEM and RS), study design, manuscript drafting, data analysis, and manuscript approval. F.V. and T.A.: Experiment (MTBS and DC), Data collection, data interpretation, writing, revise, and editing and final manuscript approval. All authors have read and agreed to the published version of the manuscript.

Funding

The authors are grateful to the Deanship of Scientific Research, King Saud University for funding through Vice Deanship of Scientific Research Chairs, Research Chair for Biological Research in Dental Health.

Acknowledgments

The authors are grateful to the Deanship of Scientific Research, King Saud University for funding through Vice Deanship of Scientific Research Chairs, Research Chair for Biological Research in Dental Health.

Conflicts of Interest

The authors declare that they have no conflict of interest and all authors have read and approved the final draft.

References

  1. Farooq, I.; Moheet, I.A.; AlShwaimi, E. In vitro dentin tubule occlusion and remineralization competence of various toothpastes. Arch. Oral Biol. 2015, 60, 1246–1253. [Google Scholar] [CrossRef] [PubMed]
  2. Khan, A.S.; Farooq, I.; Alakrawi, K.M.; Khalid, H.; Saadi, O.W.; Hakeem, A.S. Dentin tubule occlusion potential of novel dentifrices having fluoride containing bioactive glass and zinc oxide nanoparticles. Med. Princ. Pract. 2020, 29, 338–346. [Google Scholar] [CrossRef]
  3. Rikame, V.; Doshi, Y.; Horowitz, R.A.; Kevadia-Shah, V.; Shah, M. Comparative evaluation of fluoridated mouthwash and sodium bicarbonate in management of dentin hypersensitivity: An in vitro SEM study. Compend. Contin. Educ. Dent. 2018, 39, e5–e8. [Google Scholar] [PubMed]
  4. Warreth, A.; Abuhijleh, E.; Almaghribi, M.A.; Mahwal, G.; Ashawish, A. Tooth surface loss: A review of literature. Saudi Dent. J. 2020, 32, 53–60. [Google Scholar] [CrossRef] [PubMed]
  5. Davari, A.; Ataei, E.; Assarzadeh, H. Dentin hypersensitivity: Etiology, diagnosis and treatment; a literature review. J. Dent. 2013, 14, 136–145. [Google Scholar]
  6. Balhaddad, A.A.; Kansara, A.A.; Hidan, D.; Weir, M.D.; Xu, H.H.; Melo, M.A.S. Toward dental caries: Exploring nanoparticle-based platforms and calcium phosphate compounds for dental restorative materials. Bioact. Mater. 2019, 4, 43–55. [Google Scholar] [CrossRef] [PubMed]
  7. Ferracane, J.L. Models of caries formation around dental composite restorations. J. Dent. Res. 2017, 96, 364–371. [Google Scholar] [CrossRef] [Green Version]
  8. Yu, H.H.; Zhang, L.; Yu, F.; Li, F.; Liu, Z.-Y.; Chen, J.-H. Epigallocatechin-3-gallate and Epigallocatechin-3-O-(3-O-methyl)-gallate Enhance the bonding stability of an etch-and-rinse adhesive to dentin. Materials 2017, 10, 183. [Google Scholar] [CrossRef]
  9. Perdigão, J. Current perspectives on dental adhesion: (1) Dentin adhesion–not there yet. Jpn. Dent. Sci. Rev. 2020. [Google Scholar] [CrossRef]
  10. Kumari, R.V.; Siddaraju, K.; Nagraj, H.; Poluri, R.K. Evaluation of shear bond strength of newer bonding systems on superficial and deep dentin. J. Int. Oral. Health 2015, 7, 31–35. [Google Scholar]
  11. Zhang, Z.; Gupte, M.J.; Ma, P.X. Biomaterials and stem cells for tissue engineering. Expert Opin. Biol. Ther. 2013, 13, 527–540. [Google Scholar] [CrossRef] [PubMed] [Green Version]
  12. Yang, X.; Li, Y.; Liu, X.; Zhang, R.; Feng, Q. In vitro uptake of hydroxyapatite nanoparticles and their effect on osteogenic differentiation of human mesenchymal stem cells. Stem Cells Int. 2018, 2018, 2036176. [Google Scholar] [CrossRef] [PubMed] [Green Version]
  13. Cantore, S.; Ballini, A.; Mori, G.; Dibello, V.; Tatullo, M. Anti-plaque and antimicrobial efficiency of different oral rinses in a 3-day plaque accumulation model. J. Biol. Regul. Homeost. Agents 2016, 30, 1173–1178. [Google Scholar] [PubMed]
  14. Marrelli, M.; Pujia, A.; Palmieri, F.; Gatto, R.; Falisi, G.; Gargari, M.; Caruso, S.; Apicella, D.; Rastelli, C.; Nardi, G.M. Innovative approach for the in vitro research on biomedical scaffolds designed and customized with CAD-CAM technology. Int. J. Immunopathol. Pharmacol. 2016, 29, 778–783. [Google Scholar] [CrossRef] [PubMed]
  15. Makvandi, P.; Gu, J.T.; Zare, E.N.; Ashtari, B.; Niu, L.N. Polymeric and inorganic nanoscopical antimicrobial fillers in dentistry. Acta Biomater. 2020, 101, 69–101. [Google Scholar] [CrossRef]
  16. Makvandi, P.; Corcione, C.E.; Paladini, F.; Gallo, A.L.; Montagna, F.; Jamaledin, R.; Pollini, M.; Maffezzoli, A. Antimicrobial modified hydroxyapatite composite dental bite by stereolithography. Polym. Adv. Technol. 2018, 29, 364–371. [Google Scholar] [CrossRef]
  17. Wang, C.-Y.; Makvandi, P.; Zare, E.N.; Tay, F.R.; Niu, L.N. Advances in antimicrobial organic and inorganic nanocompounds in biomedicine. Adv. Ther. 2020, 3, 2000024. [Google Scholar] [CrossRef]
  18. Mahmoodi, M.; Hashemi, P.M.; Imani, R. Characterization of a novel nanobiomaterial fabricated from HA, TiO2 and Al2O3 powders: An in vitro study. Prog. Biomater. 2014, 3, 25. [Google Scholar] [CrossRef] [Green Version]
  19. Amaechi, B.T.; AbdulAzees, P.A.; Alshareif, D.O.; Shehata, M.A.; Evans, V. Comparative efficacy of a hydroxyapatite and a fluoride toothpaste for prevention and remineralization of dental caries in children. BDJ Open 2019, 5, 18. [Google Scholar] [CrossRef]
  20. Liu, Y.; Tjaderhane, L.; Breschi, L.; Mazzoni, A.; Li, N.; Mao, J.; Pashley, D.H.; Tay, F.R. Limitations in bonding to dentin and experimental strategies to prevent bond degradation. J. Dent. Res. 2011, 90, 953–968. [Google Scholar] [CrossRef]
  21. Leitune, V.C.; Collares, F.M.; Trommer, R.M.; Andrioli, D.G.; Bergmann, C.P.; Samuel, S.M.W. The addition of nanostructured hydroxyapatite to an experimental adhesive resin. J. Dent. 2013, 41, 321–327. [Google Scholar] [CrossRef] [PubMed] [Green Version]
  22. Sofan, E.; Sofan, A.; Palaia, G.; Tenore, G.; Romeo, U.; Migliau, G. Classification review of dental adhesive systems: From the IV generation to the universal type. Ann. Stomatol. 2017, 8, 1–17. [Google Scholar] [PubMed]
  23. Liang, K.; Wang, S.; Tao, S.; Xiao, S.; Zhou, H. Dental remineralization via poly(amido amine) and restorative materials containing calcium phosphate nanoparticles. Int. J. Oral. Sci. 2019, 11, 15. [Google Scholar] [CrossRef] [PubMed] [Green Version]
  24. Allaker, R.P.; Ren, G. Potential impact of nanotechnology on the control of infectious diseases. Trans. R. Soc. Trop. Med. Hyg. 2008, 102, 1–2. [Google Scholar] [CrossRef] [Green Version]
  25. Skrtic, D.; Antonucci, J.M. Polymeric dental composites based on remineralizing amorphous calcium phosphate fillers. Curr. Trends Polym. Sci. 2016, 17, 1–31. [Google Scholar]
  26. Sadat-Shojai, A.M.; Nodehi, A.; Khanlar, L.N. Hydroxyapatite nanorods as novel fillers for improving the properties of dental adhesives: Synthesis and application. Dent. Mater. 2010, 26, 471–482. [Google Scholar] [CrossRef]
  27. Kavrik, F.; Kucukyilmaz, E. The effect of different ratios of nano-sized hydroxyapatite fillers on the micro-tensile bond strength of an adhesive resin. Microsc. Res. Tech. 2019, 82, 538–543. [Google Scholar] [CrossRef]
  28. Ye, Q.; Spencer, P.; Wang, Y.; Misra, A. Relationship of solvent to the photopolymerization process, properties, and structure in model dentin adhesives. J. Biomed. Mater. Res. A 2007, 80, 342–350. [Google Scholar] [CrossRef] [Green Version]
  29. Yoshida, T.; Yamaguchi, K.; Tsubota, K.; Takamizawa, T.; Kurokawa, H.; Rikuta, A.; Ando, S.; Miyazaki, M. Effect of metal conditioners on polymerization behavior of bonding agents. J. Oral. Sci. 2005, 47, 171–175. [Google Scholar] [CrossRef] [Green Version]
  30. Jose, P.; Sakhamuri, S.; Sampath, V.; Kavitha, S.; Mahalaxmi, S. Degree of conversion of two dentin bonding agents with and without a desensitizing agent using fourier transform infrared spectroscopy: An in vitro study. J. Conserv. Dent. 2011, 14, 302–305. [Google Scholar]
  31. Can-Karabulut, D.C.; Oz, F.T.; Karabulut, B.; Batmaz, I.; Ilk, O. Adhesion to primary and permanent dentin and a simple model approach. Eur. J. Dent. 2009, 3, 32–41. [Google Scholar] [CrossRef] [PubMed] [Green Version]
  32. LeGeros, R.Z.; Trautz, O.R.; Klein, E.; LeGeros, J.P. Two types of carbonate substitution in the apatite structure. Experientia 1969, 25, 5–7. [Google Scholar] [CrossRef] [PubMed]
  33. Jones, J.R.; Sepulveda, P.; Hench, L.L. Dose-dependent behavior of bioactive glass dissolution. J. Biomed. Mater. Res. 2001, 58, 720–726. [Google Scholar] [CrossRef] [PubMed]
  34. Solhi, L.; Atai, M.; Nodehi, A.; Mohammad, I. A novel dentin bonding system containing poly(methacrylic acid) grafted nanoclay: Synthesis, characterization and properties. Dent. Mater. 2012, 28, 1041–1050. [Google Scholar] [CrossRef]
  35. Eslamian, L.; Borzabadi-Farahani, A.; Karimi, S.; Saadat, S.; Badiee, M.R. Evaluation of the Shear Bond Strength and Antibacterial Activity of Orthodontic Adhesive Containing Silver Nanoparticle, an In-Vitro Study. Nanomater 2020, 10, 1466. [Google Scholar] [CrossRef]
  36. Felemban, N.H.; Ebrahim, M.I. The influence of adding modified zirconium oxide-titanium dioxide nano-particles on mechanical properties of orthodontic adhesive: An in vitro study. BMC Oral. Health 2017, 17, 43. [Google Scholar] [CrossRef] [Green Version]
  37. Jun, S.K.; Yang, S.A.; Kim, Y.J.; El-Fiqi, A.; Mandakhbayar, N.; Kim, D.-S.; Roh, J.; Sauro, S.; Kim, H.-W.; Lee, J.-H. Multi-functional nano-adhesive releasing therapeutic ions for MMP-deactivation and remineralization. Sci. Rep. 2018, 8, 5663. [Google Scholar] [CrossRef] [Green Version]
  38. Nobre, C.M.G.; Putz, N.; Hannig, M. Adhesion of hydroxyapatite nanoparticles to dental materials under oral conditions. Scanning 2020, 2020, 6065739. [Google Scholar] [CrossRef]
  39. Pepla, E.; Besharat, L.K.; Palaia, G.; Tenore, G.; Migliau, G. Nano-hydroxyapatite and its applications in preventive, restorative and regenerative dentistry: A review of literature. Ann. Stomatol. 2014, 5, 108–114. [Google Scholar] [CrossRef]
  40. Sano, H.; Chowdhury, A.; Saikaew, P.; Matsumoto, M.; Hoshika, S.; Yamauti, M. The microtensile bond strength test: Its historical background and application to bond testing. Jpn. Dent. Sci. Rev. 2020, 56, 24–31. [Google Scholar] [CrossRef]
  41. Sirisha, K.; Rambabu, T.; Ravishankar, Y.R.; Ravikumar, P. Validity of bond strength tests: A critical review-Part II. J. Conserv. Dent. 2014, 17, 420–426. [Google Scholar] [CrossRef] [PubMed] [Green Version]
  42. Melo, M.A.; Cheng, L.; Zhang, K.; Weir, M.D.; Rodrigues, L.K.A.; Xu, H.H.K. Novel dental adhesives containing nanoparticles of silver and amorphous calcium phosphate. Dent. Mater. 2013, 29, 199–210. [Google Scholar] [CrossRef] [PubMed] [Green Version]
  43. Xu, H.H.K.; Sun, L.; Weir, M.D.; Antonucci, J.M.; Takagi, S.; Chow, L.C.; Peltz, M. Nano dicalcium phosphate anhydrous-whisker composites with high strength and Ca and PO4 release. J. Dent. Res. 2006, 85, 722–727. [Google Scholar] [CrossRef] [PubMed] [Green Version]
  44. Zhou, W.; Liu, S.; Zhou, X.; Hannig, M.; Rupf, S.; Feng, J.; Peng, X.; Cheng, L. Modifying adhesive materials to improve the longevity of resinous restorations. Int. J. Mol. Sci. 2019, 20, 723. [Google Scholar] [CrossRef] [PubMed] [Green Version]
  45. Wagner, A.; Belli, R.; Stotzel, C.; Hilpert, A.; Müller, F.A.; Lohbauer, U. Biomimetically- and hydrothermally-grown HAp nanoparticles as reinforcing fillers for dental adhesives. J. Adhes. Dent. 2013, 15, 413–422. [Google Scholar] [PubMed]
  46. Helvatjoglu-Antoniades, M.; Koliniotou-Kubia, E.; Dionyssopoulos, P. The effect of thermal cycling on the bovine dentine shear bond strength of current adhesive systems. J. Oral. Rehab. 2004, 31, 911–917. [Google Scholar] [CrossRef]
  47. Mortazavi, V.; Fathi, M.; Ataei, E.; Khodaeian, N.; Askari, N. Shear bond strengths and morphological evaluation of filled and unfilled adhesive interfaces to enamel and dentine. Int. J. Dent. 2012, 2012, 858459. [Google Scholar] [CrossRef] [Green Version]
  48. Anchieta, R.B.; Oliveira, F.G.; Sundfeld, R.H.; Rahal, V.; Rocha, E.P. Analysis of hybrid layer thickness, resin tag length and their correlation with microtensile bond strength using a total etch adhesive to intact dentin. Acta Odontol. Latinoam. 2011, 24, 272–278. [Google Scholar]
  49. Rangan, S.; Schulze, H.G.; Vardaki, M.Z.; Blades, M.W.; Piret, J.M.; Turner, R.F.B. Applications of Raman spectroscopy in the development of cell therapies: State of the art and future perspectives. Analyst 2020, 145, 2070–2105. [Google Scholar] [CrossRef]
  50. Miyazaki, M.; Onose, H.; Iida, N.; Kazama, H. Determination of residual double bonds in resin-dentin interface by Raman spectroscopy. Dent. Mater. 2003, 19, 245–251. [Google Scholar] [CrossRef]
  51. Van-Meerbeek, B.; Mohrbacher, H.; Celis, J.P.; Roos, J.R.; Vanherle, G. Chemical characterization of the resin-dentin interface by micro-Raman spectroscopy. J. Dent. Res. 1993, 72, 1423–1428. [Google Scholar] [CrossRef] [PubMed]
  52. Zhang, Y.; Wang, Y. The effect of hydroxyapatite presence on the degree of conversion and polymerization rate in a model self-etching adhesive. Dent. Mater. 2012, 28, 237–244. [Google Scholar] [CrossRef] [PubMed] [Green Version]
  53. Utneja, S.; Talwar, S.; Nawal, R.R.; Sapra, S.; Mittal, M.; Rajain, A.; Verma, M. Evaluation of remineralization potential and mechanical properties of pit and fissure sealants fortified with nano-hydroxyapatite and nano-amorphous calcium phosphate fillers: An in vitro study. J. Conserv. Dent. 2018, 21, 681–690. [Google Scholar] [CrossRef] [PubMed]
Figure 1. The morphological shape and size of the nanoparticles is depicted. It is noted that the size of the nano-hydroxyapatite (n-HA) particles are in nanoscale with a mean average size of <100 nm in diameter.
Polymers 12 02948 g001
Figure 2. Energy-Dispersive X-ray (EDX) elemental mapping of the n-HA nanoparticles (A) showing evidence of oxygen (B), calcium (C), and phosphorus (D) in the hydroxyapatite samples.
Polymers 12 02948 g002
Figure 3. (A) Distribution of n-HA (white arrows) along the resin matrix showing homogenous dispersion of the low percentage weight (5 wt %) hydroxyapatite nanoparticles. (B) Distribution of n-HA (white arrows) in the resin matrix, showing dispersion of high percentage (10 wt %) with agglomerations.
Polymers 12 02948 g003
Figure 4. (A) Field emission scanning electron microscopic (FE-SEM) micrograph of resin-bonded sample showing the formation of a hybrid layer and integration between dentin and modified experimental gp-2: 5 wt % n-HA (HAA-5%) adhesive. Ad: adhesive, H: hybrid layer, Rt: resin tags; Dt: Dentin tubule. (B) Magnified image of the hybrid layer showing widely distributed n-HA particles within the hybrid layer (HAA-5%). Ad: adhesive, H: hybrid layer, Rt: resin tags; Dt: Dentin tubule.
Polymers 12 02948 g004
Figure 5. Fourier Transform-Infrared (FTIR) spectra of the n-HA particles, unmodified and modified experimental adhesives having low (5 wt %) and high (10 wt %) percentage of n-HA. The characteristic peaks at 563 and 600 cm−1 showing evidence of the presence of hydroxyapatite in the uncured and cured dentin adhesive.
Polymers 12 02948 g005
Figure 6. (A) Typical Raman spectra of the fabricated hydroxyapatite showing chemical groups identified by micro Raman analysis that could be identified as phosphate (υ1 PO4 ≈ 960 cm−1) and carbonate (CO3 ≈ 1070 cm−1). (B) Raman spectra of control adhesive and (C) HA-modified adhesive. The inclusion of HA nanoparticles in the adhesive is evidenced by the spectrum at 960 cm−1 for phosphate and 1070 cm−1 for carbonate.
Polymers 12 02948 g006
Table 1. Mean and SD of microtensile bond strength and failure modes among the tested study groups.
μTBS (MPa) (Mean ± SD)Failure Mode Analysis (%)
Group (n = 10)NTCTCp-Value *AdhesiveCohesiveMixed
CEA27.36 ± 2.80 a A-<0.0180020
-21.71 ± 3.85 a B10000
HA (5%)32.50 ± 3.47 bA602020
-25.31 ± 3.84 a B80020
HA (10%)24.41 ± 3.72 a A70030
-17.60 ± 4.36 b B10000
TC: thermocycling, NTC: no thermocycling, GOA: graphene oxide adhesive, CA: control adhesive, * ANOVA. Dissimilar small alphabets in same column indicate statistical significance. Dissimilar capital alphabets in row (same group) indicate statistical significance.
Table 2. Degree of conversion (%) of hydroxyapatite-modified experimental adhesives and control specimens.
GroupDegree of Conversion
(Mean ± SD)
Tukey
(p < 0.05)
CEA62.3 ± 5.2A
HA (5 %)58.1 ± 4.8A
HA (10 %)51.8 ± 5.6C
HA: hydroxyapatite-modified experimental adhesive, CEA: control experimental adhesive. Dissimilar uppercase letters indicate statistical significance.
Publisher’s Note: MDPI stays neutral with regard to jurisdictional claims in published maps and institutional affiliations.

