Compatibilization of Poly(Lactic Acid) (PLA) and Bio-Based Ethylene-Propylene-Diene-Rubber (EPDM) via Reactive Extrusion with Different Coagents


Abstract
:
1. Introduction
2. Materials and Methods
2.1. Materials
2.2. Sample Preparation
2.3. Characterization
2.3.1. Surface and Interfacial Properties
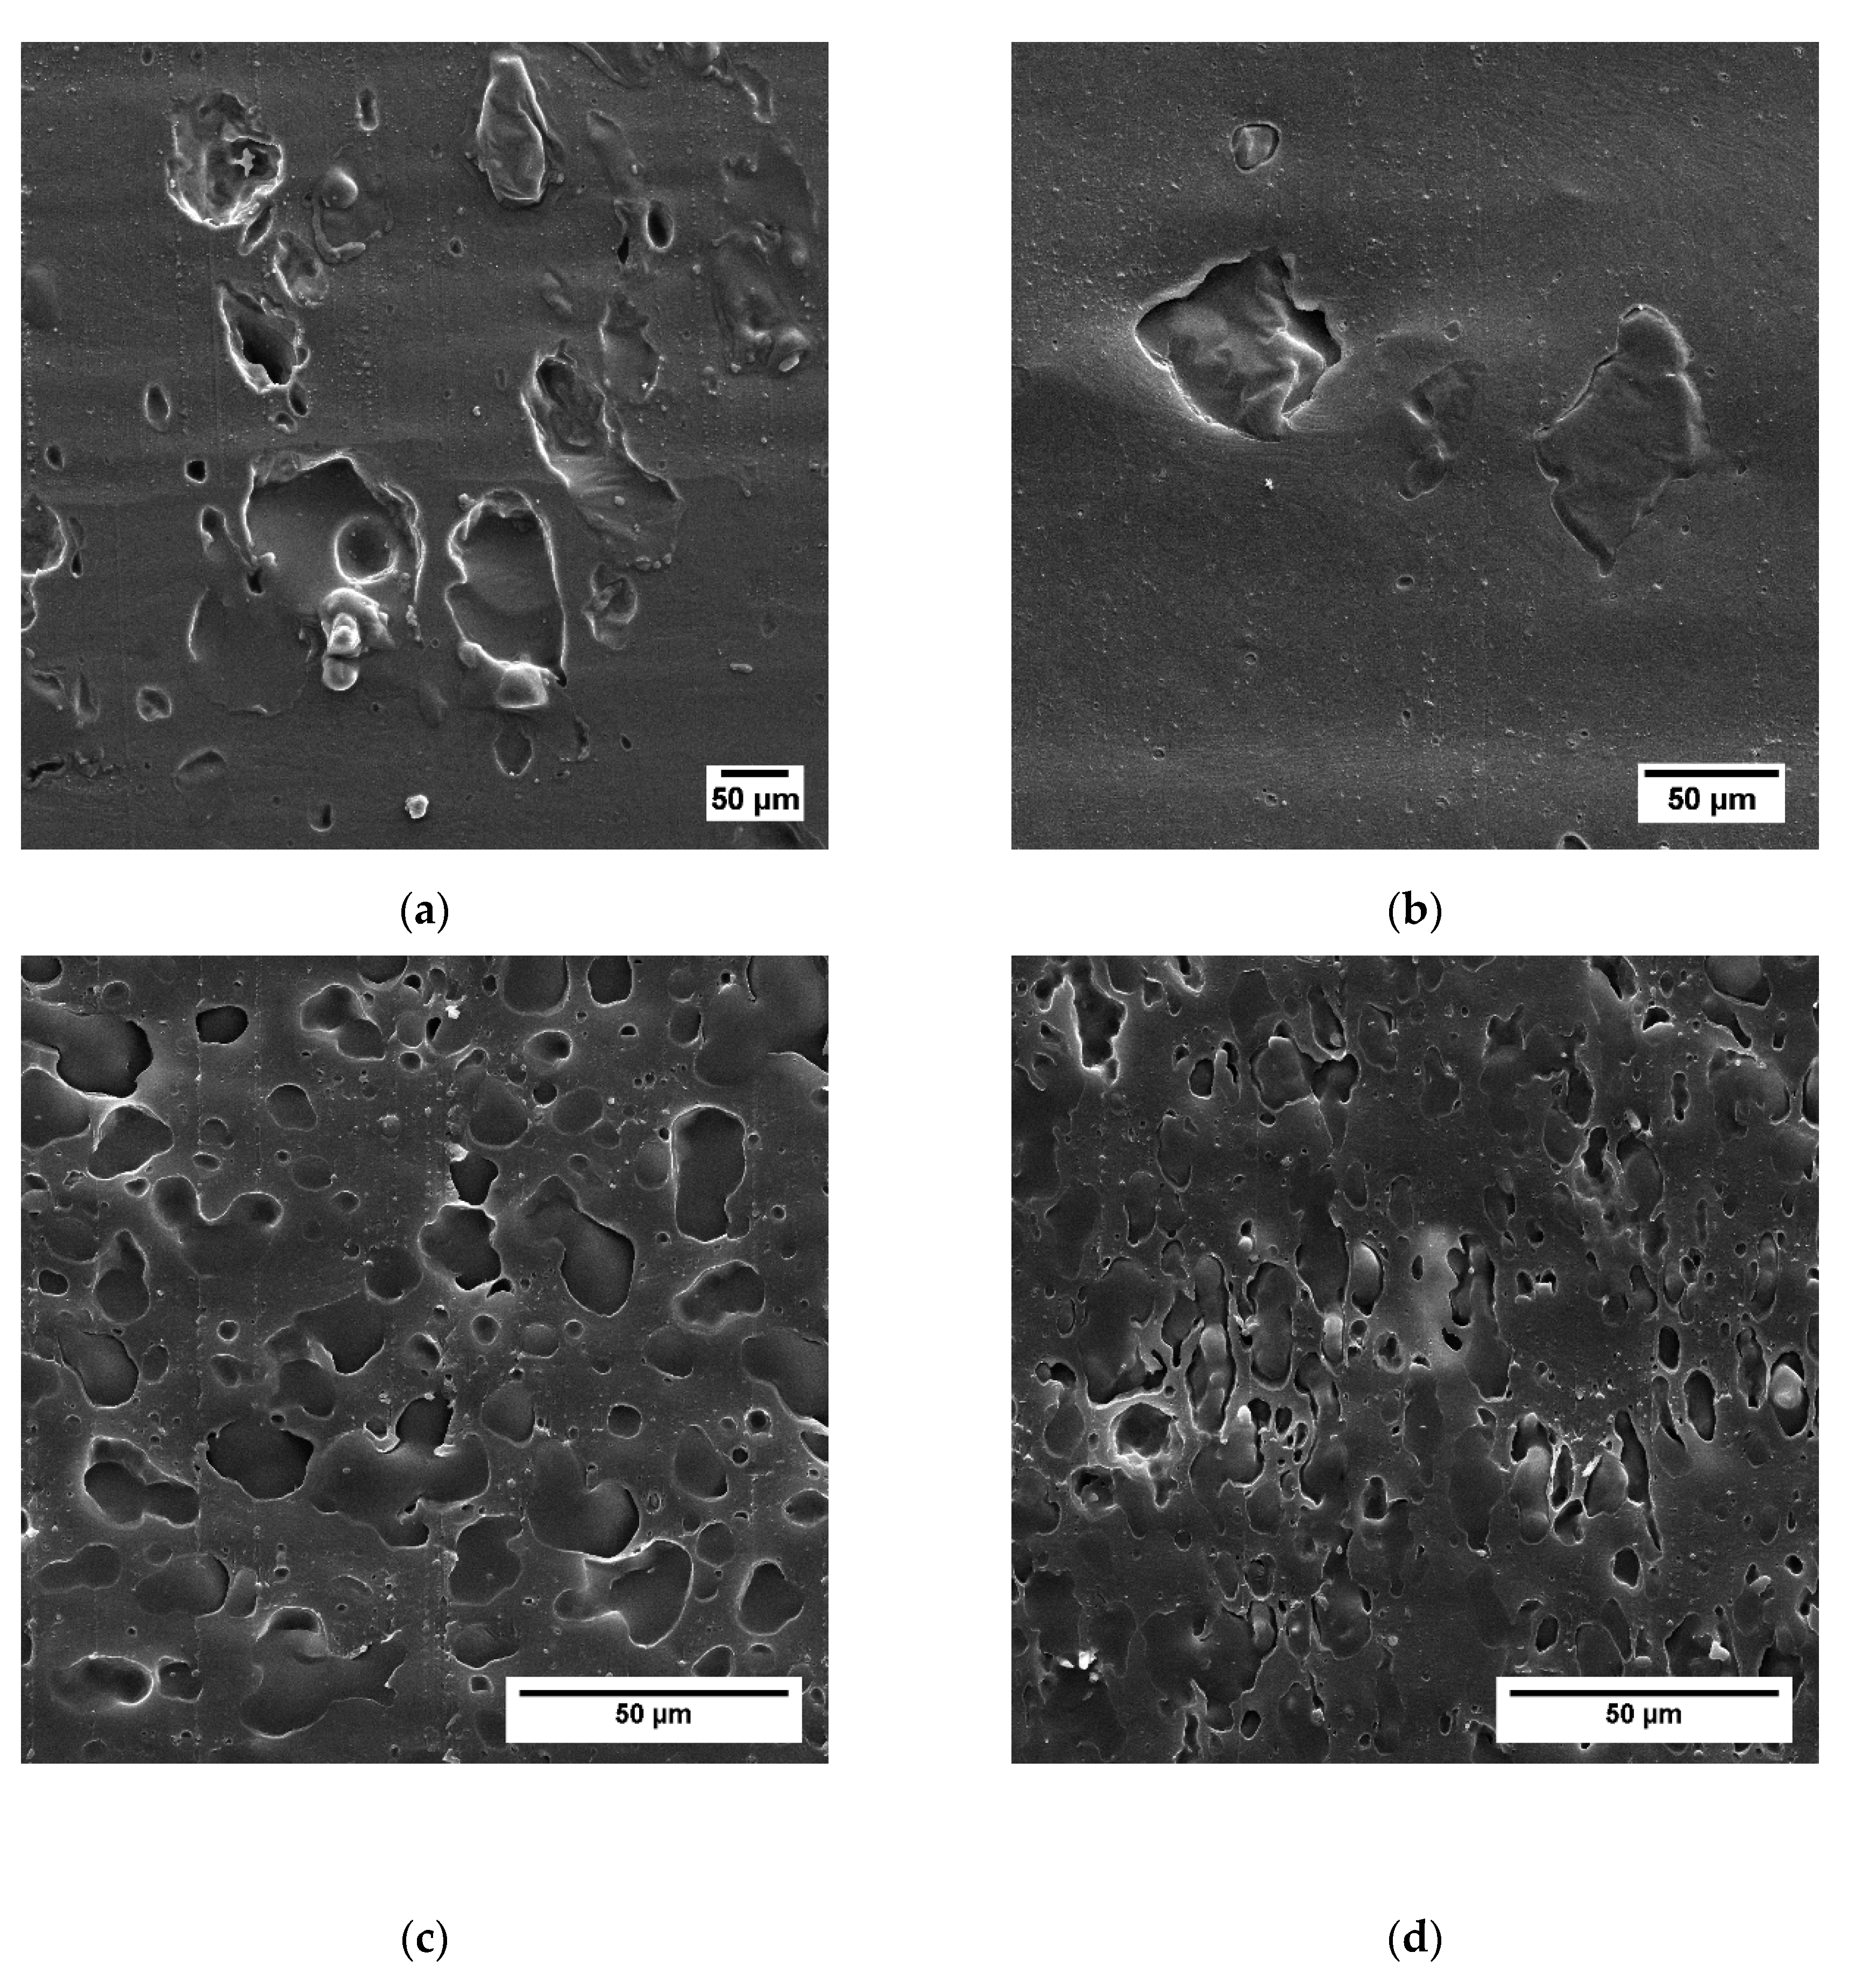
2.3.2. Morphological Properties
2.3.3. Mechanical Properties
2.3.4. Thermal Properties
3. Results and Discussion
3.1. Surface and Interfacial Properties
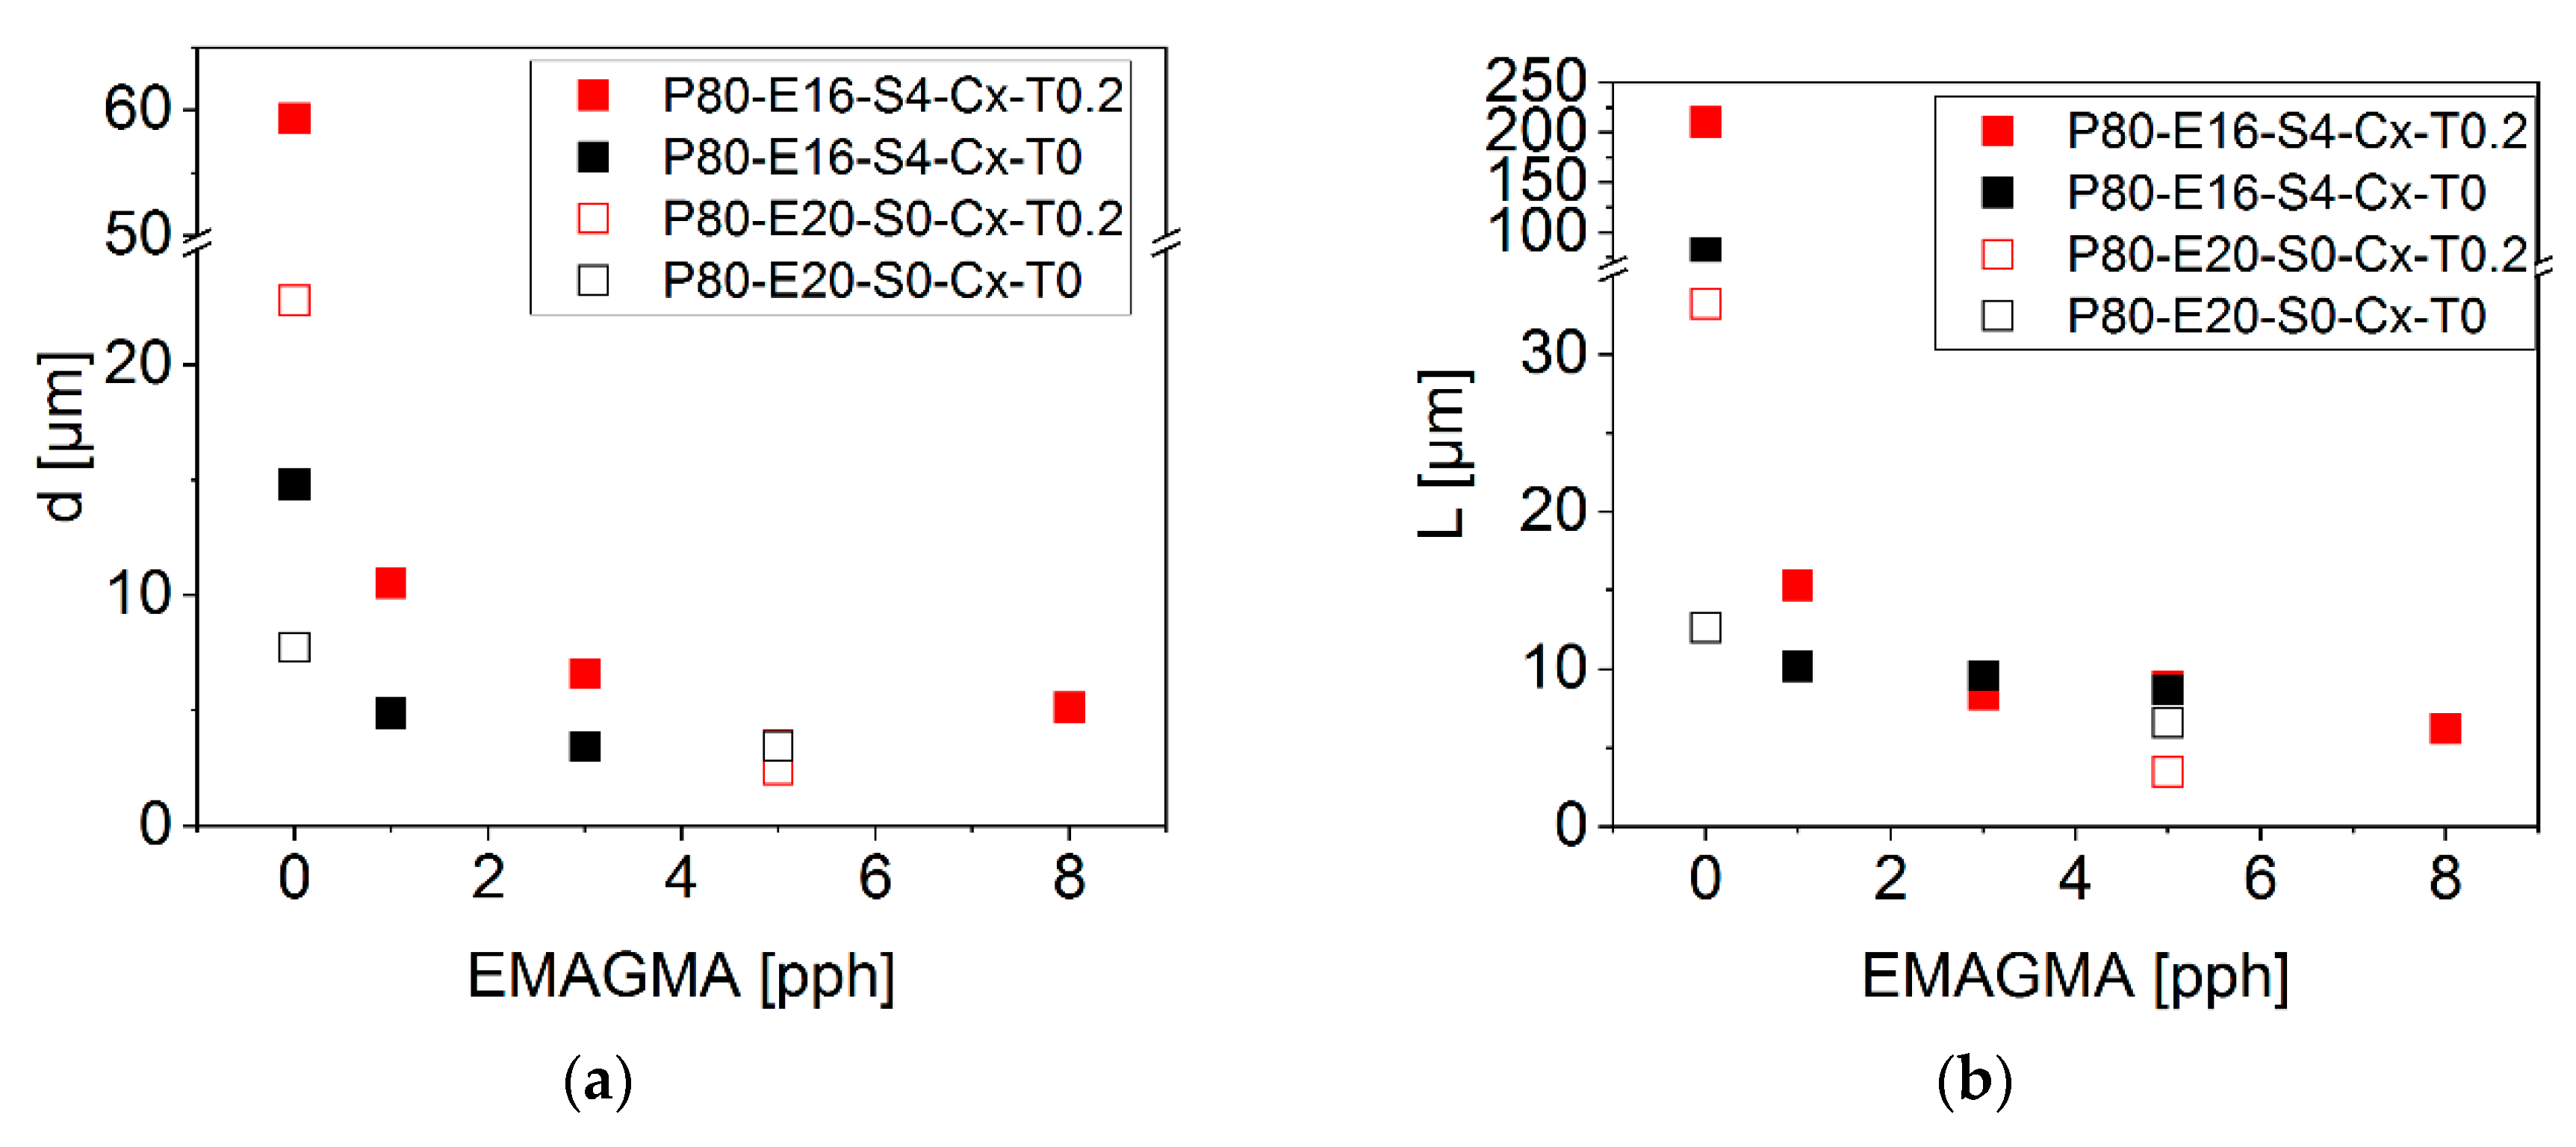
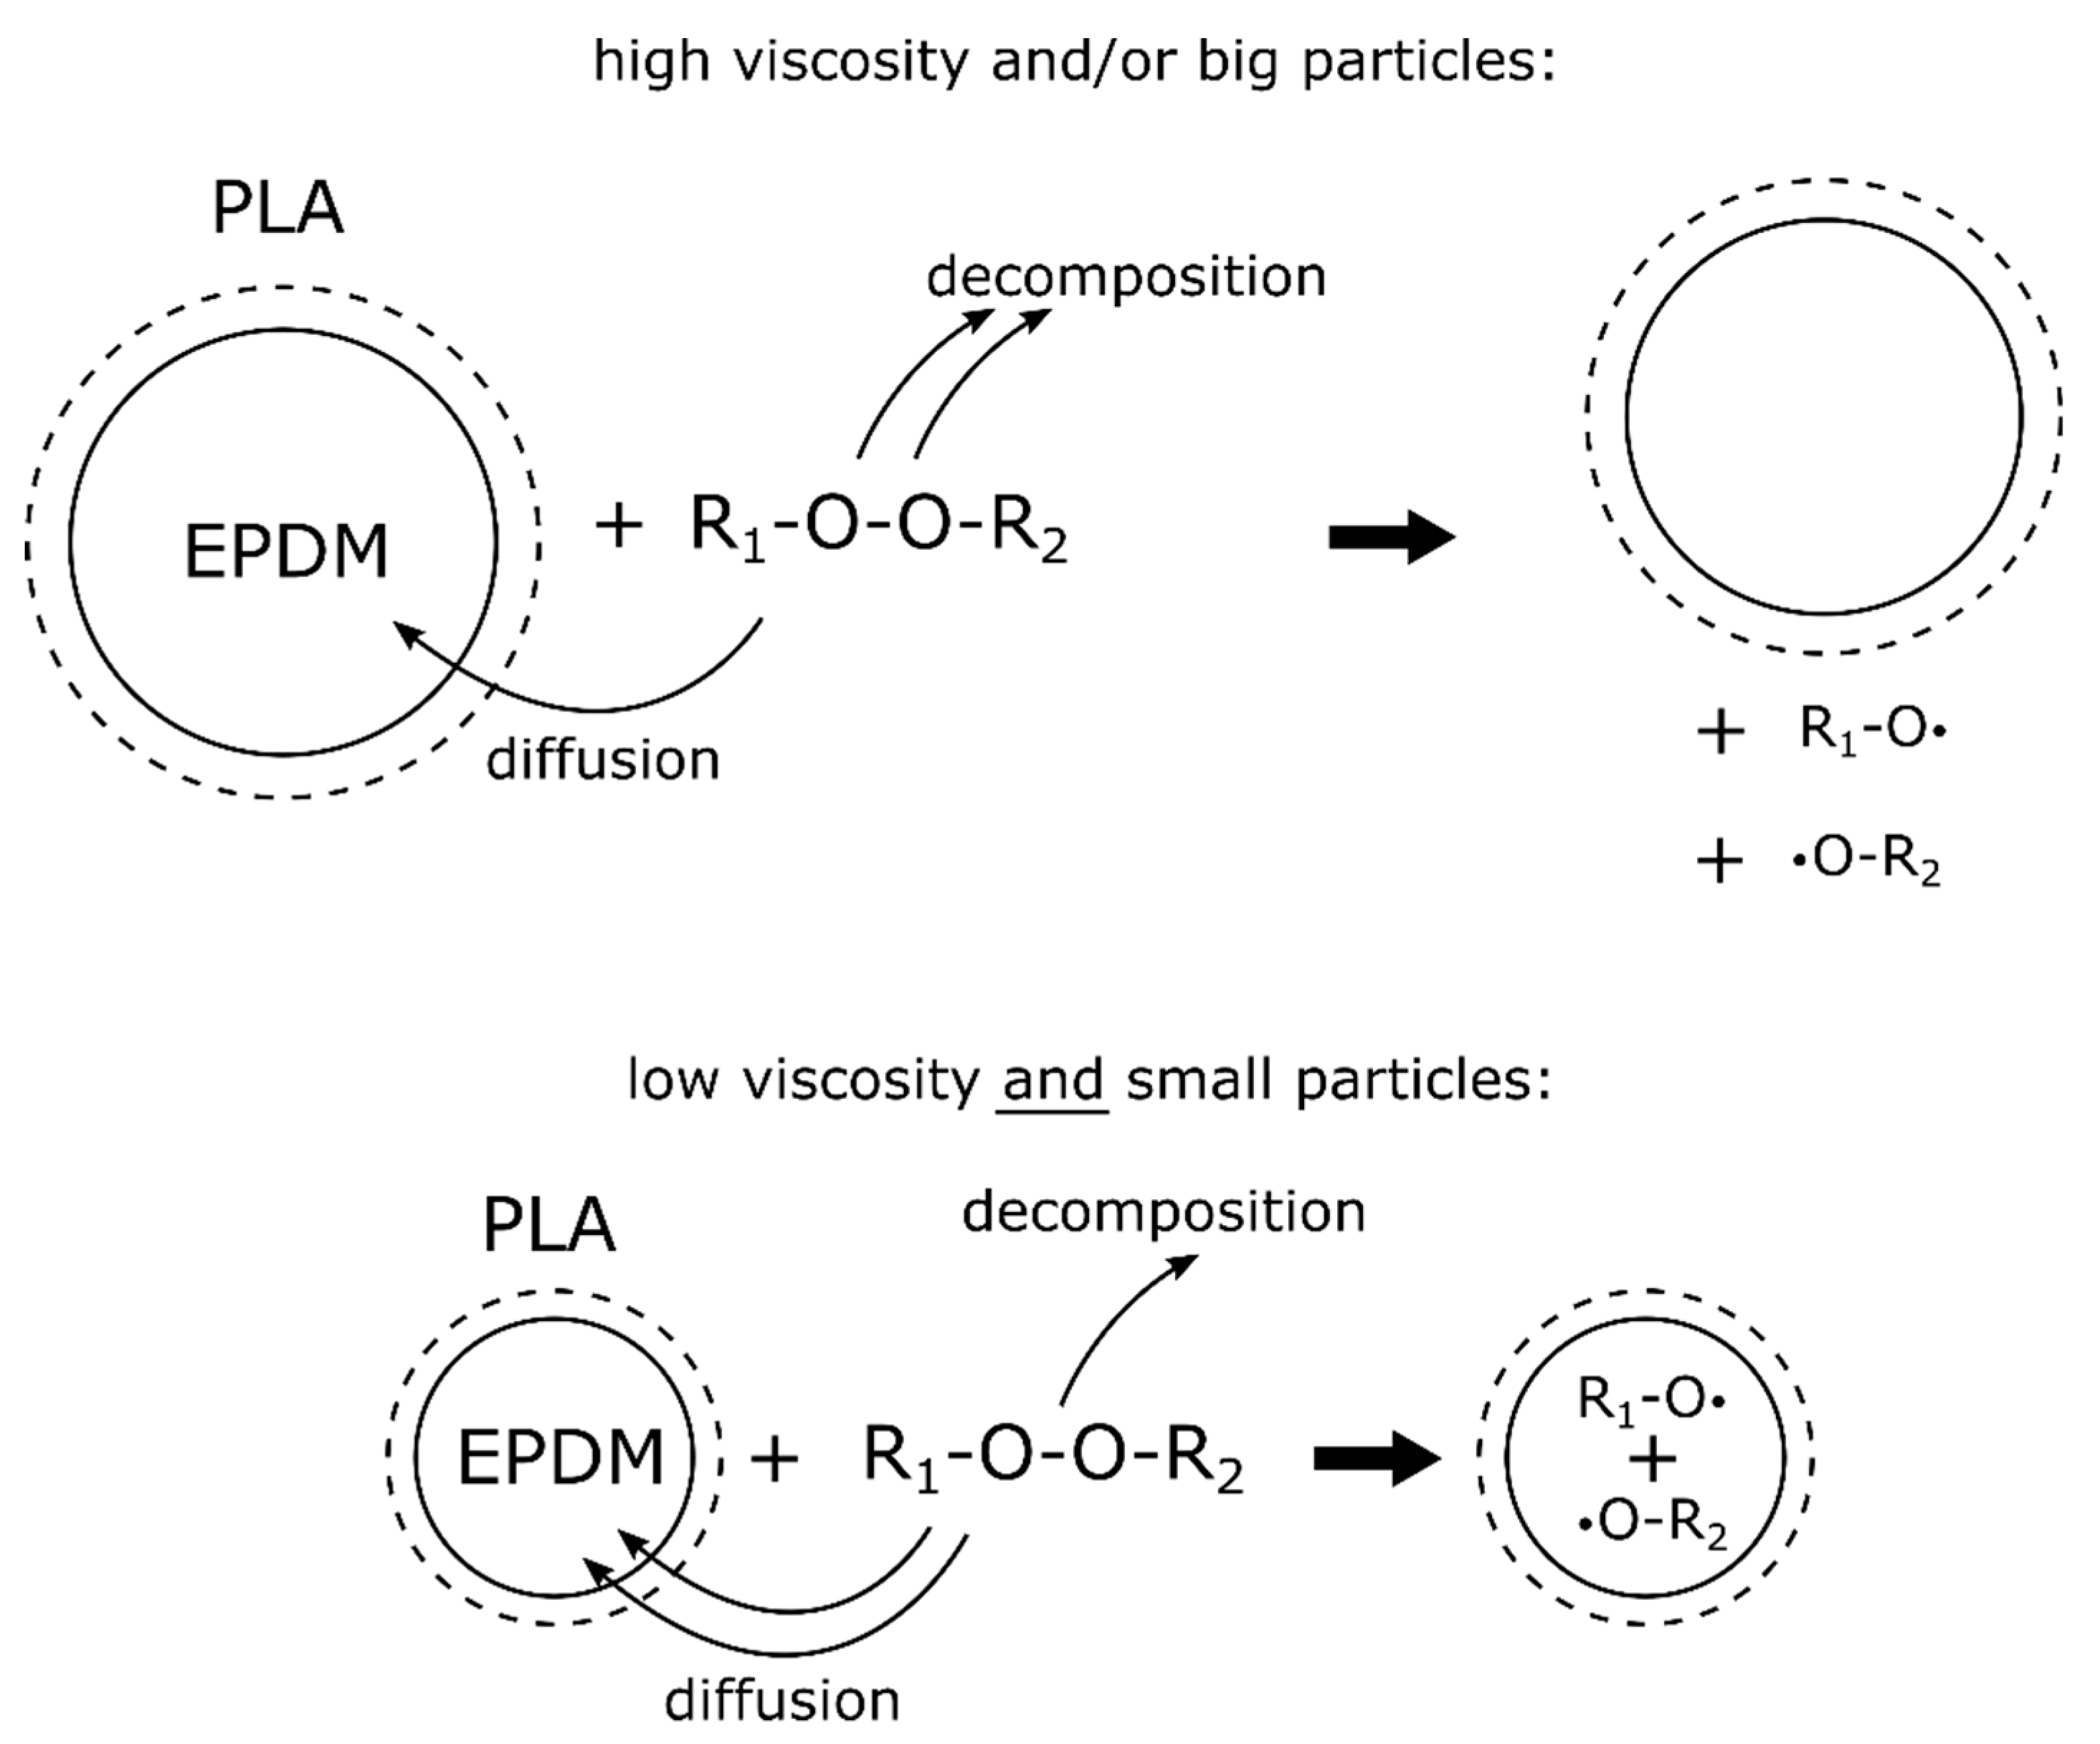
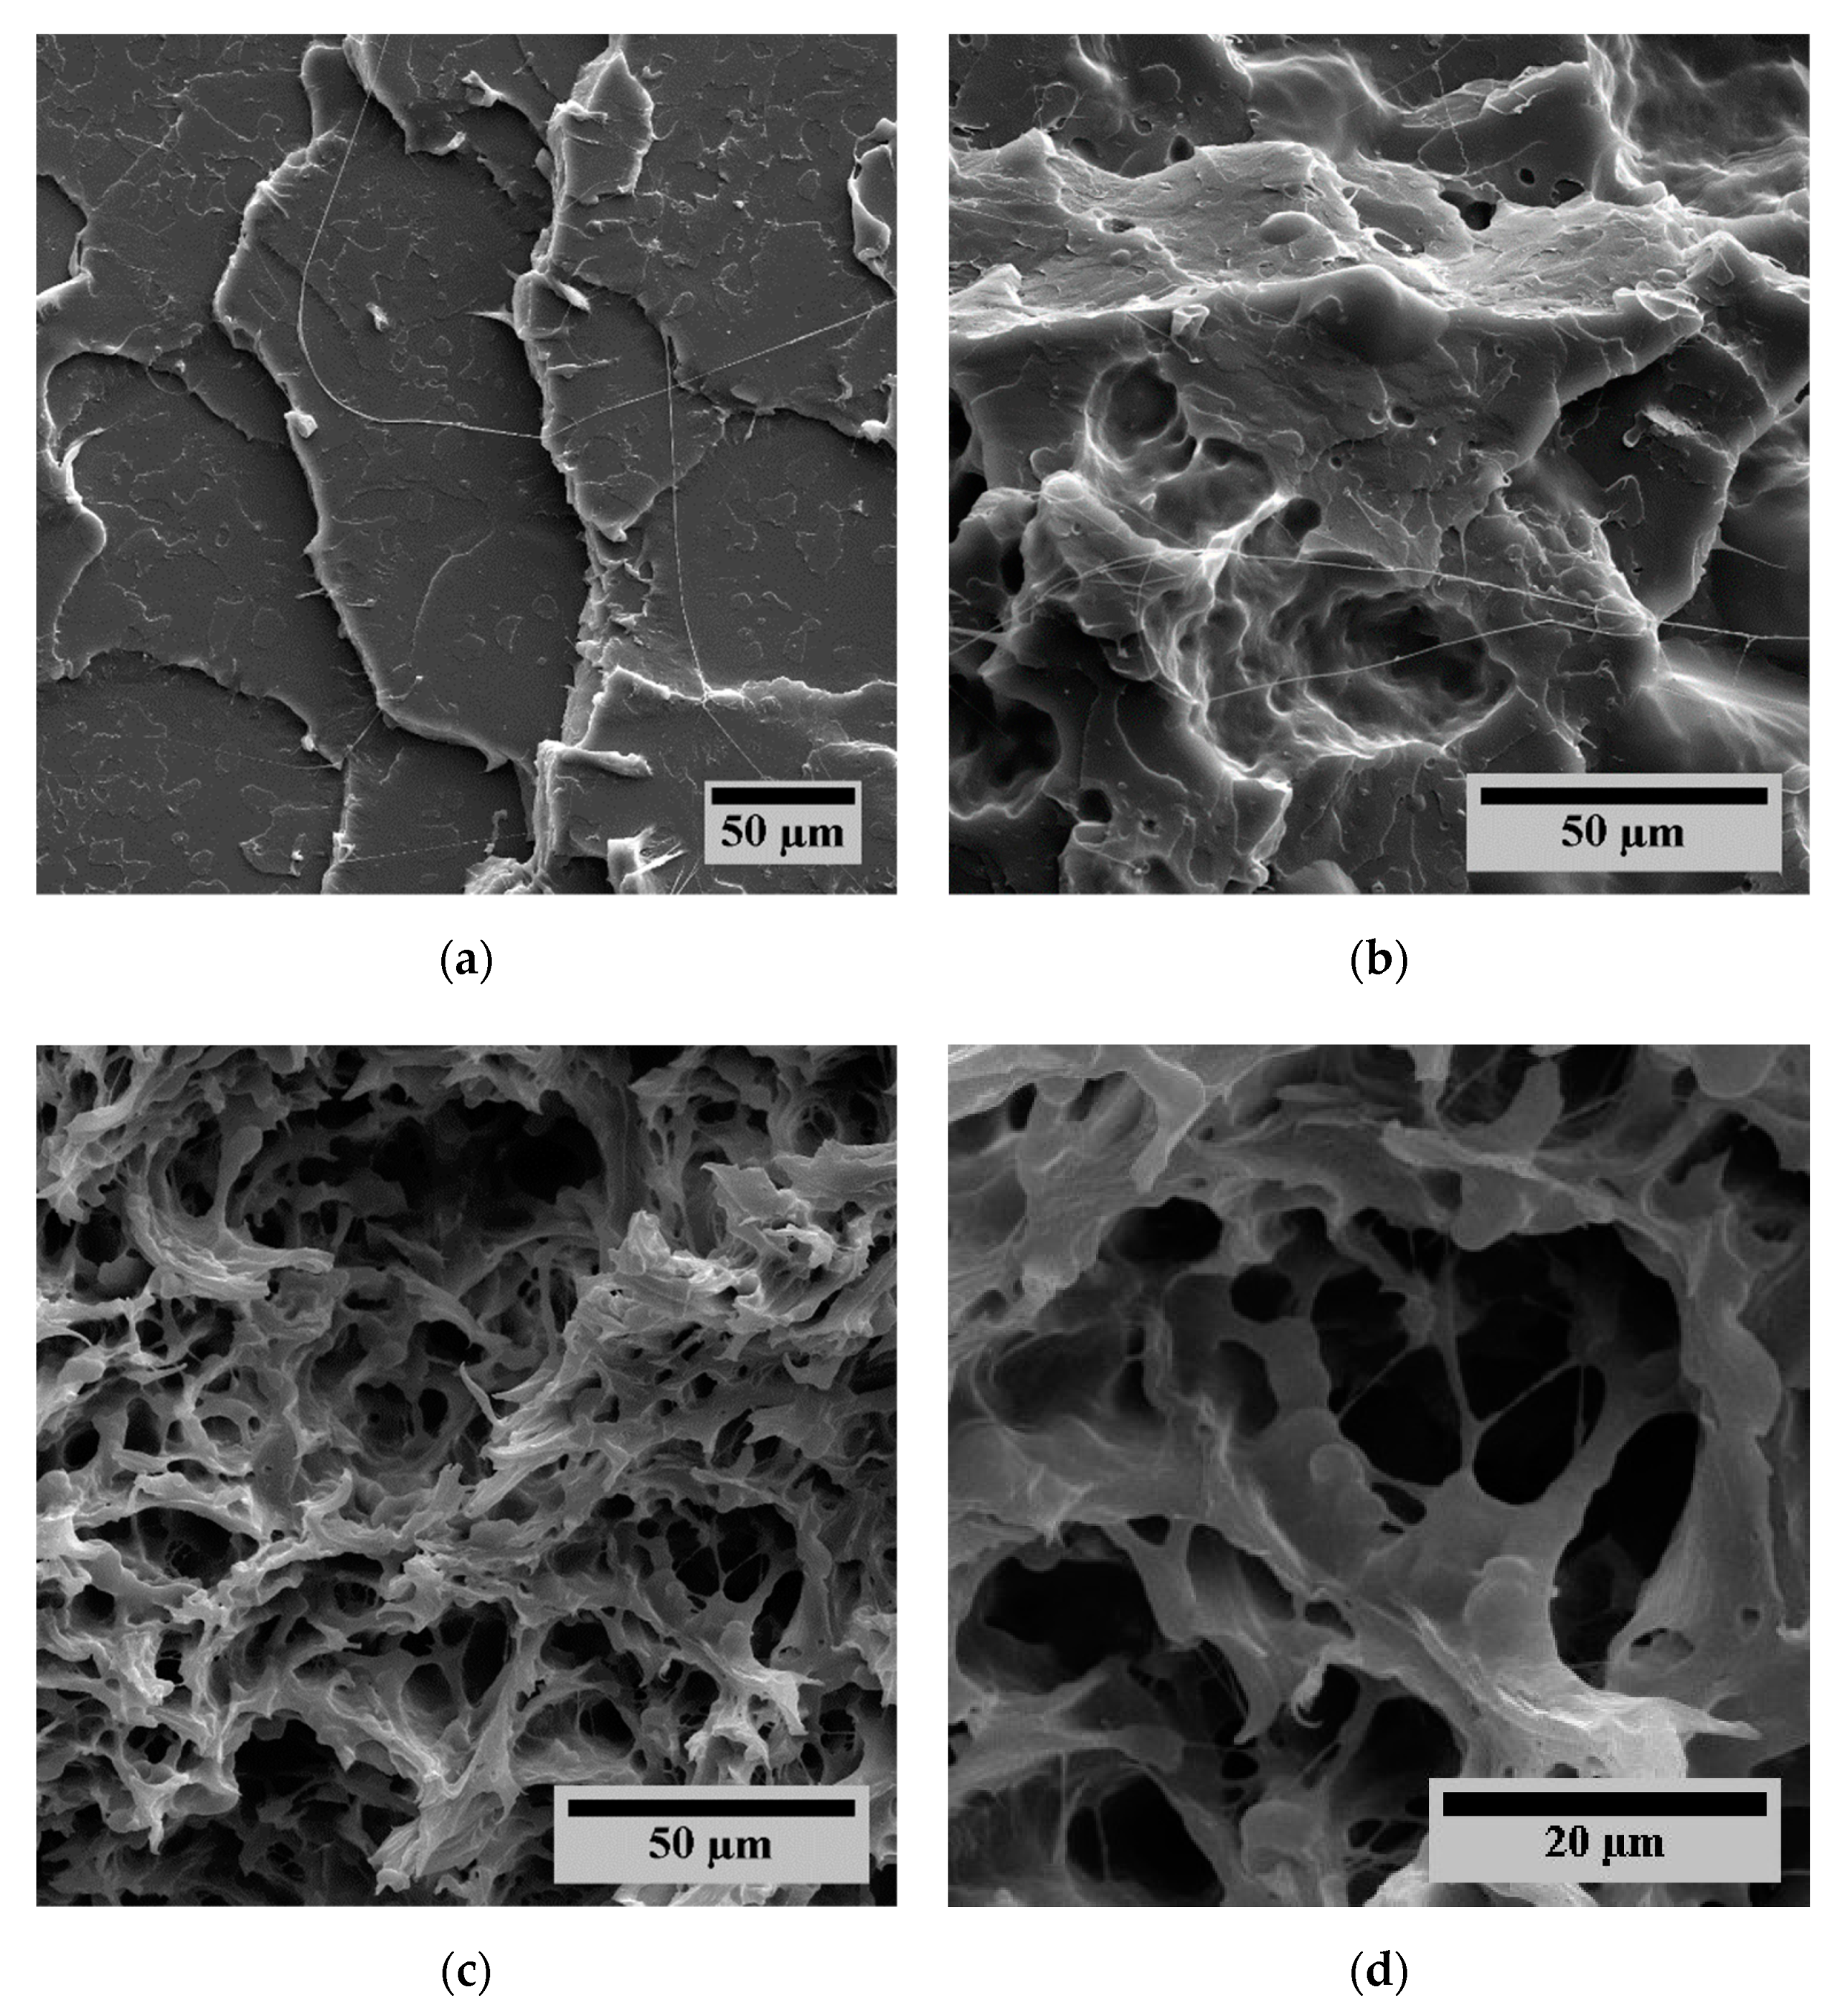
3.2. Morphological Properties
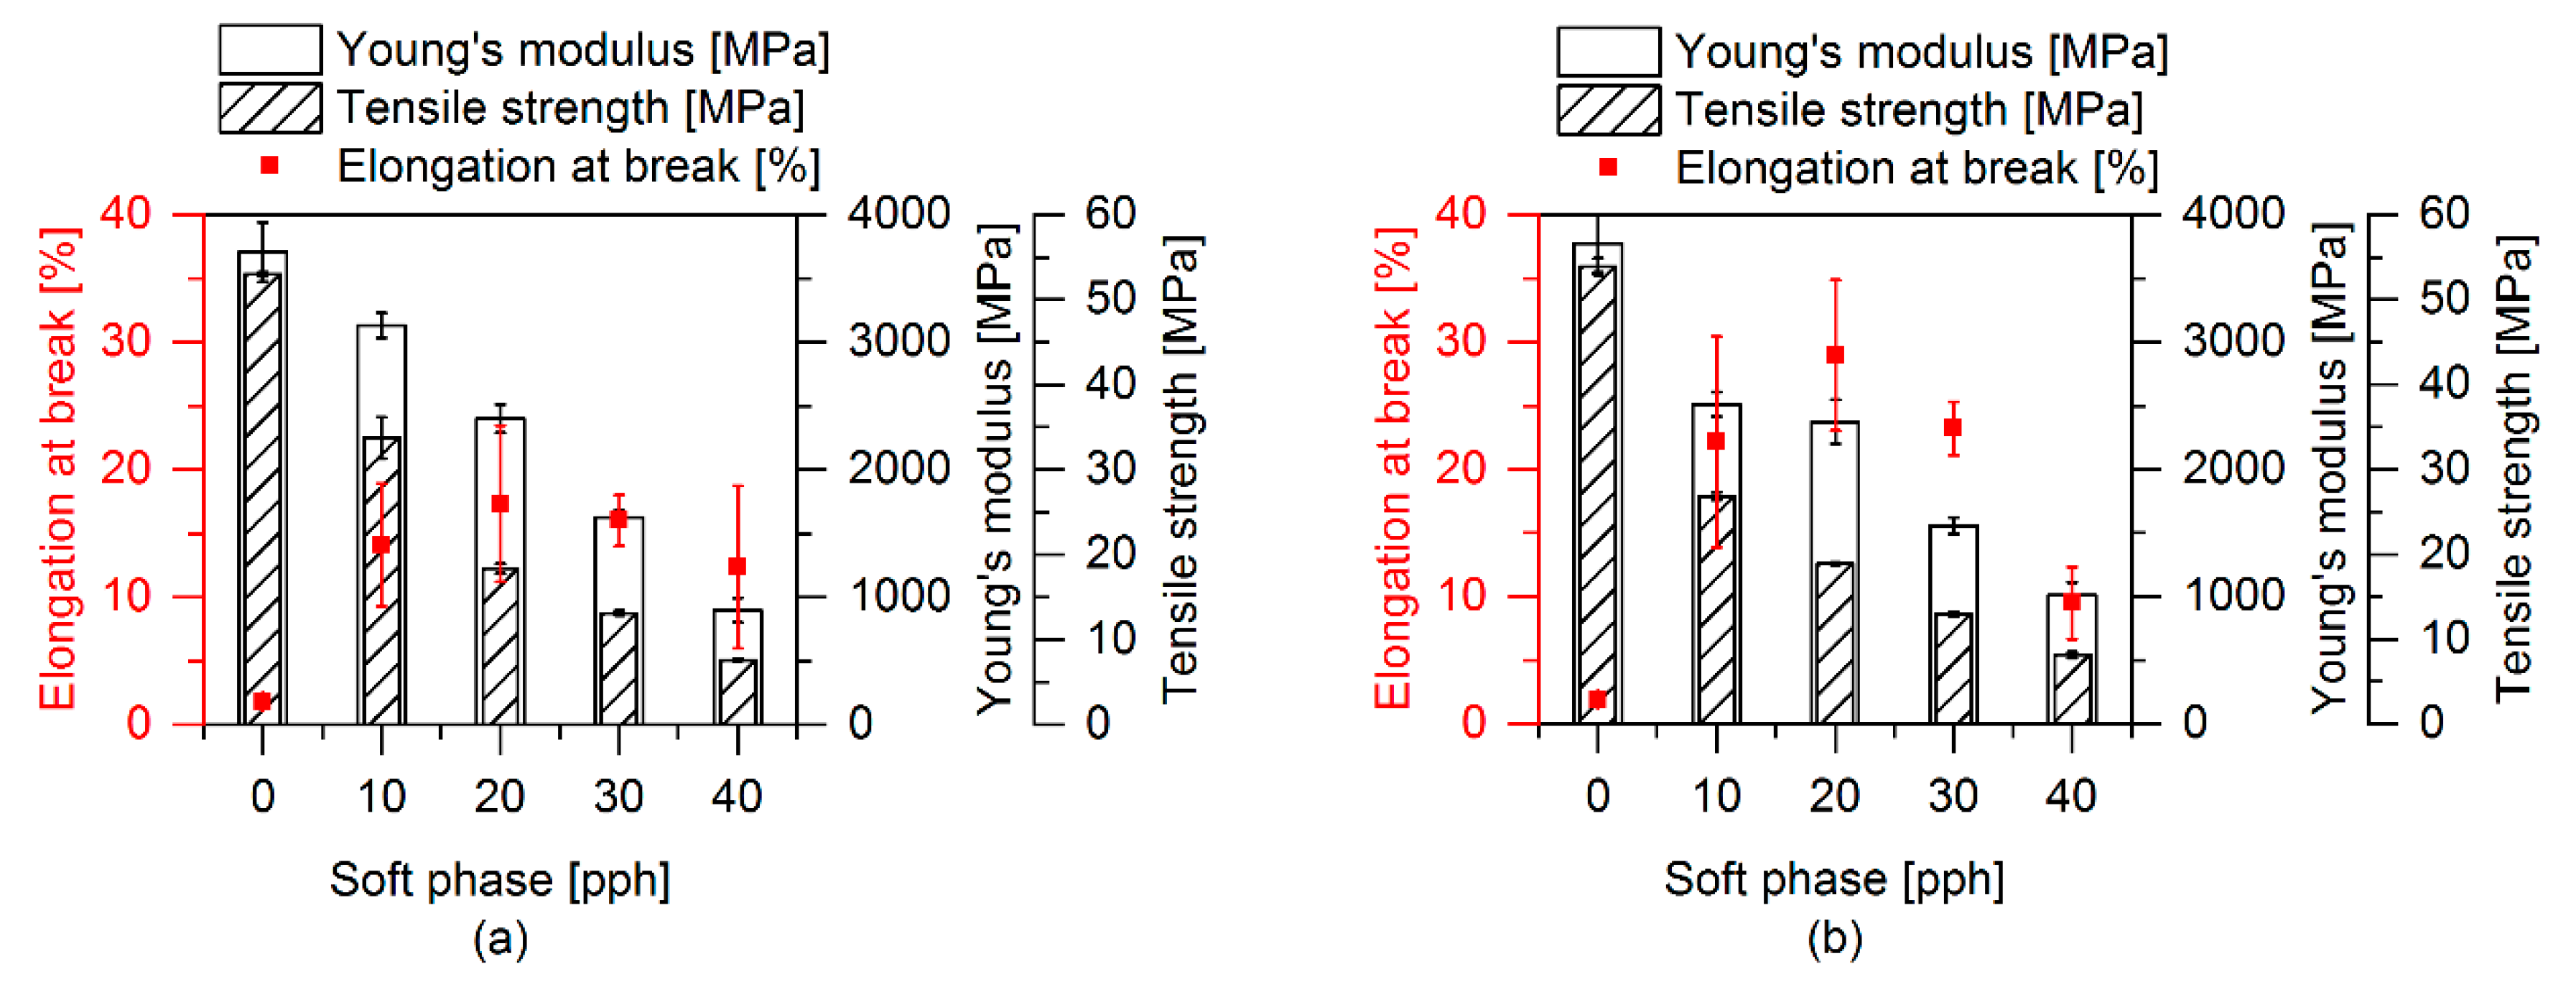
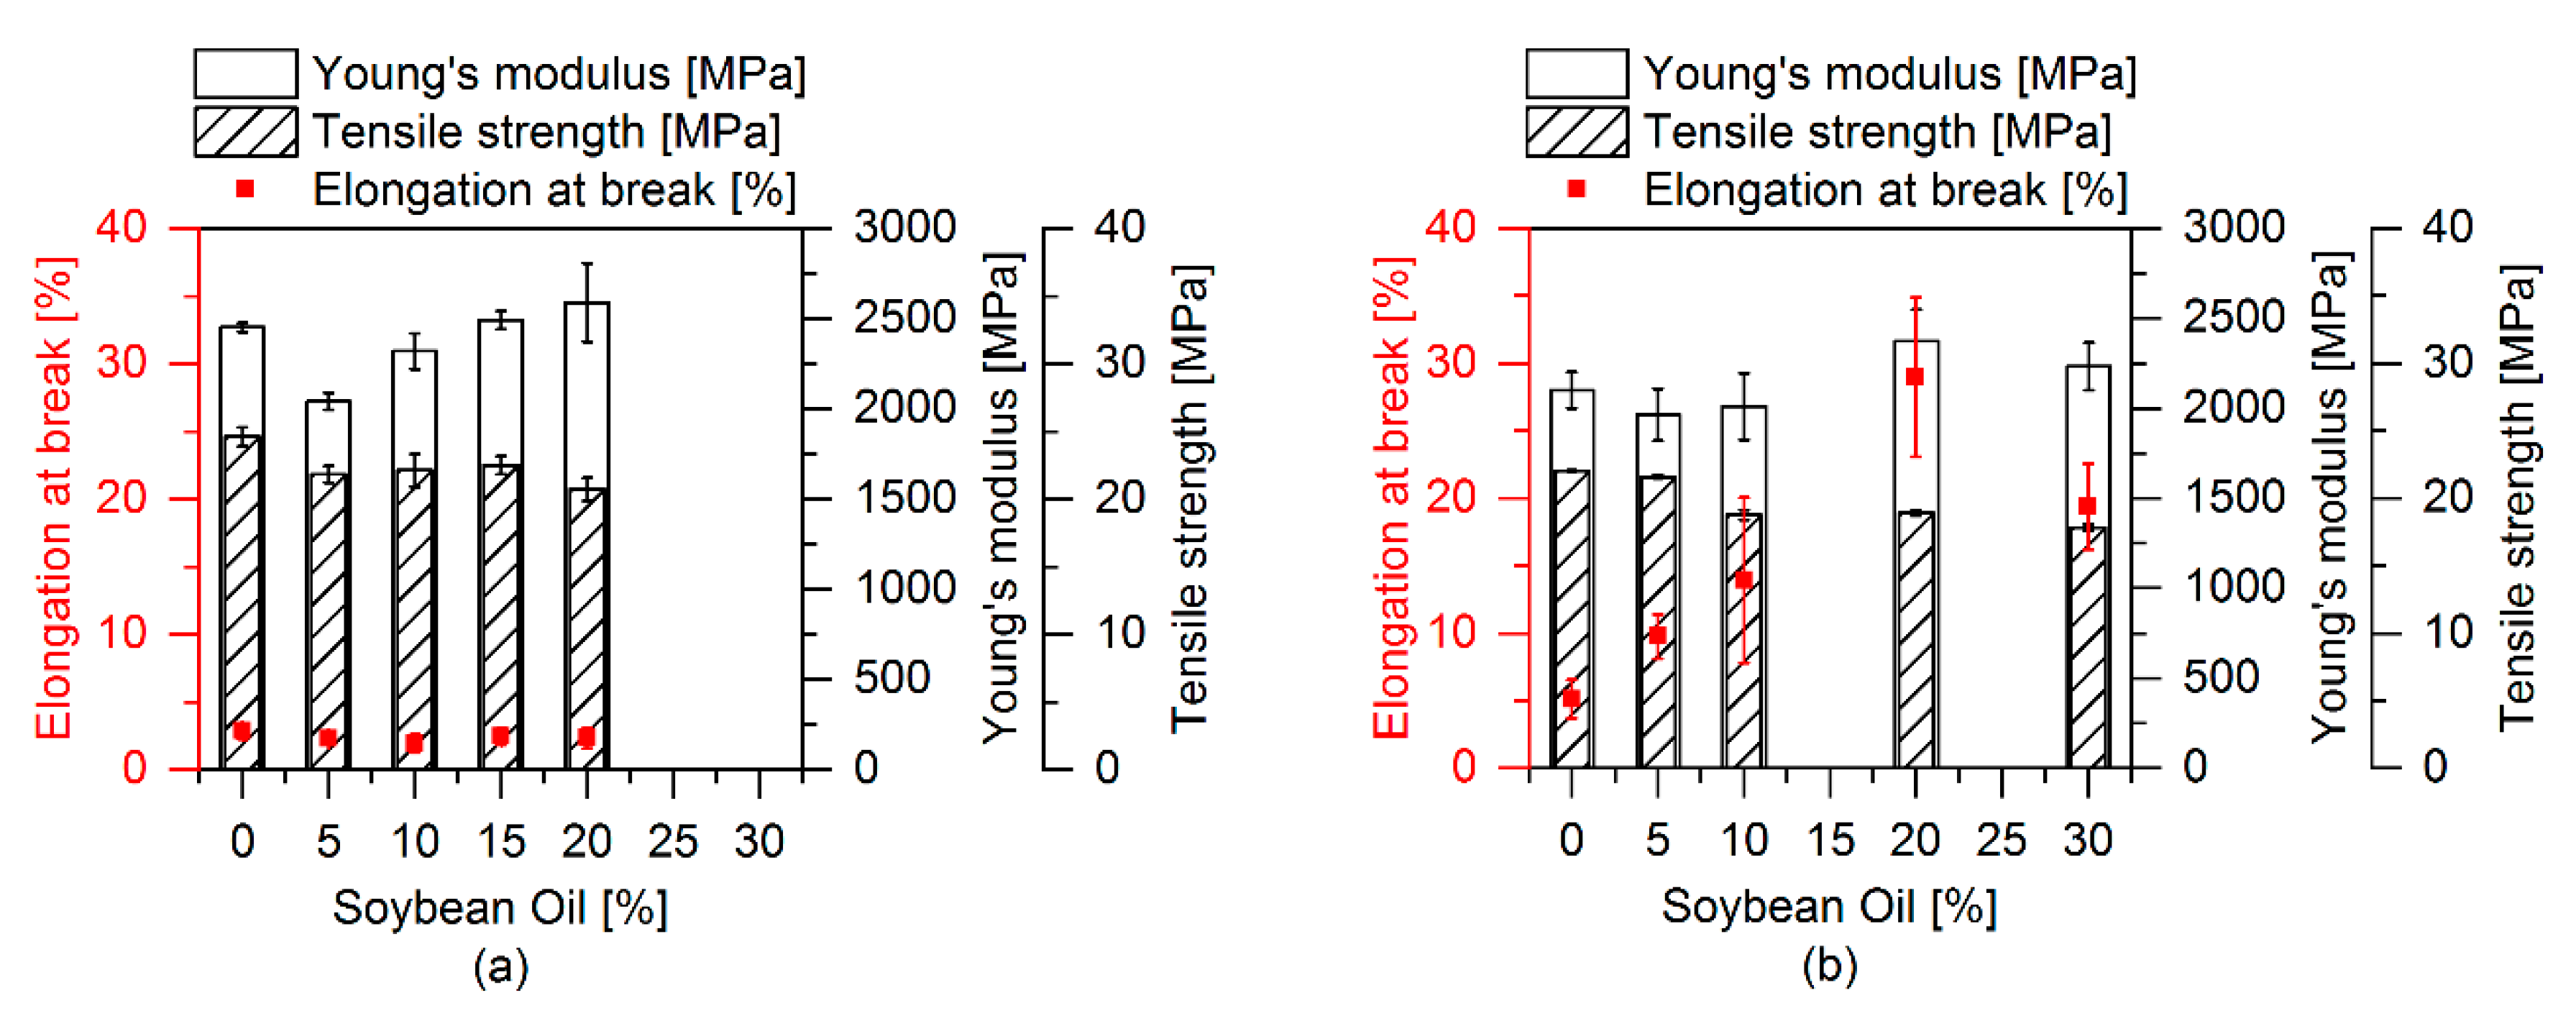
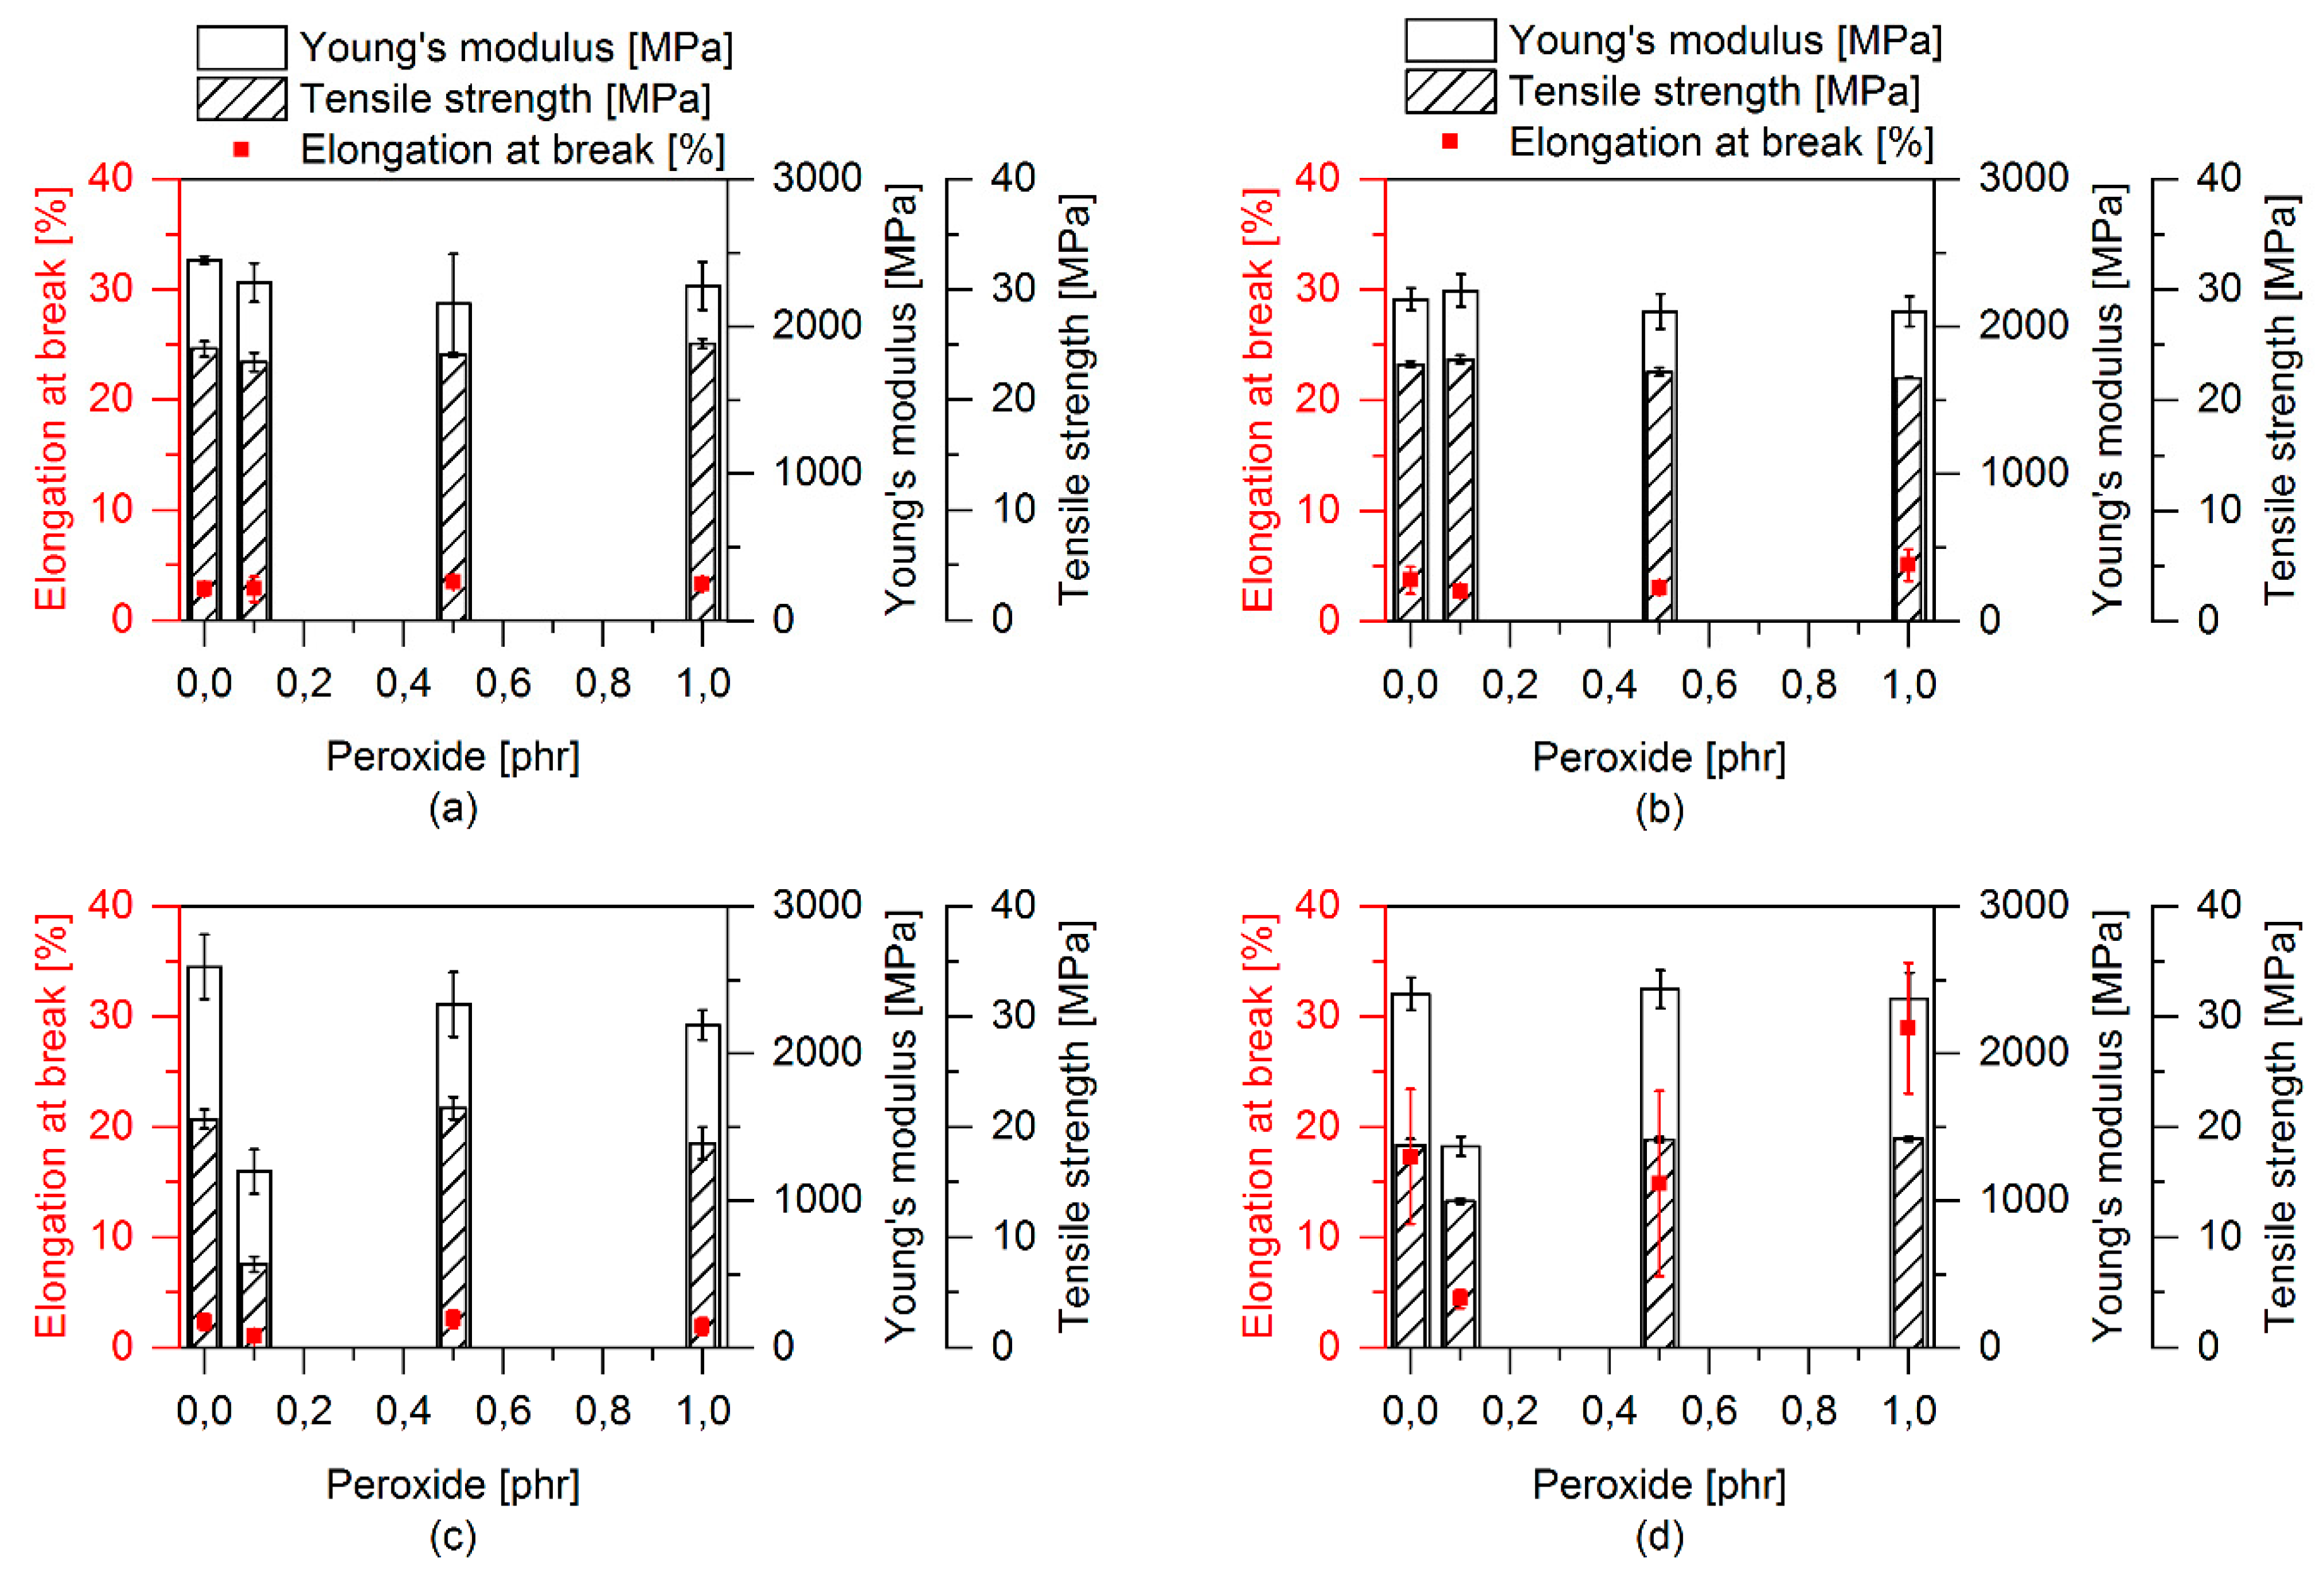
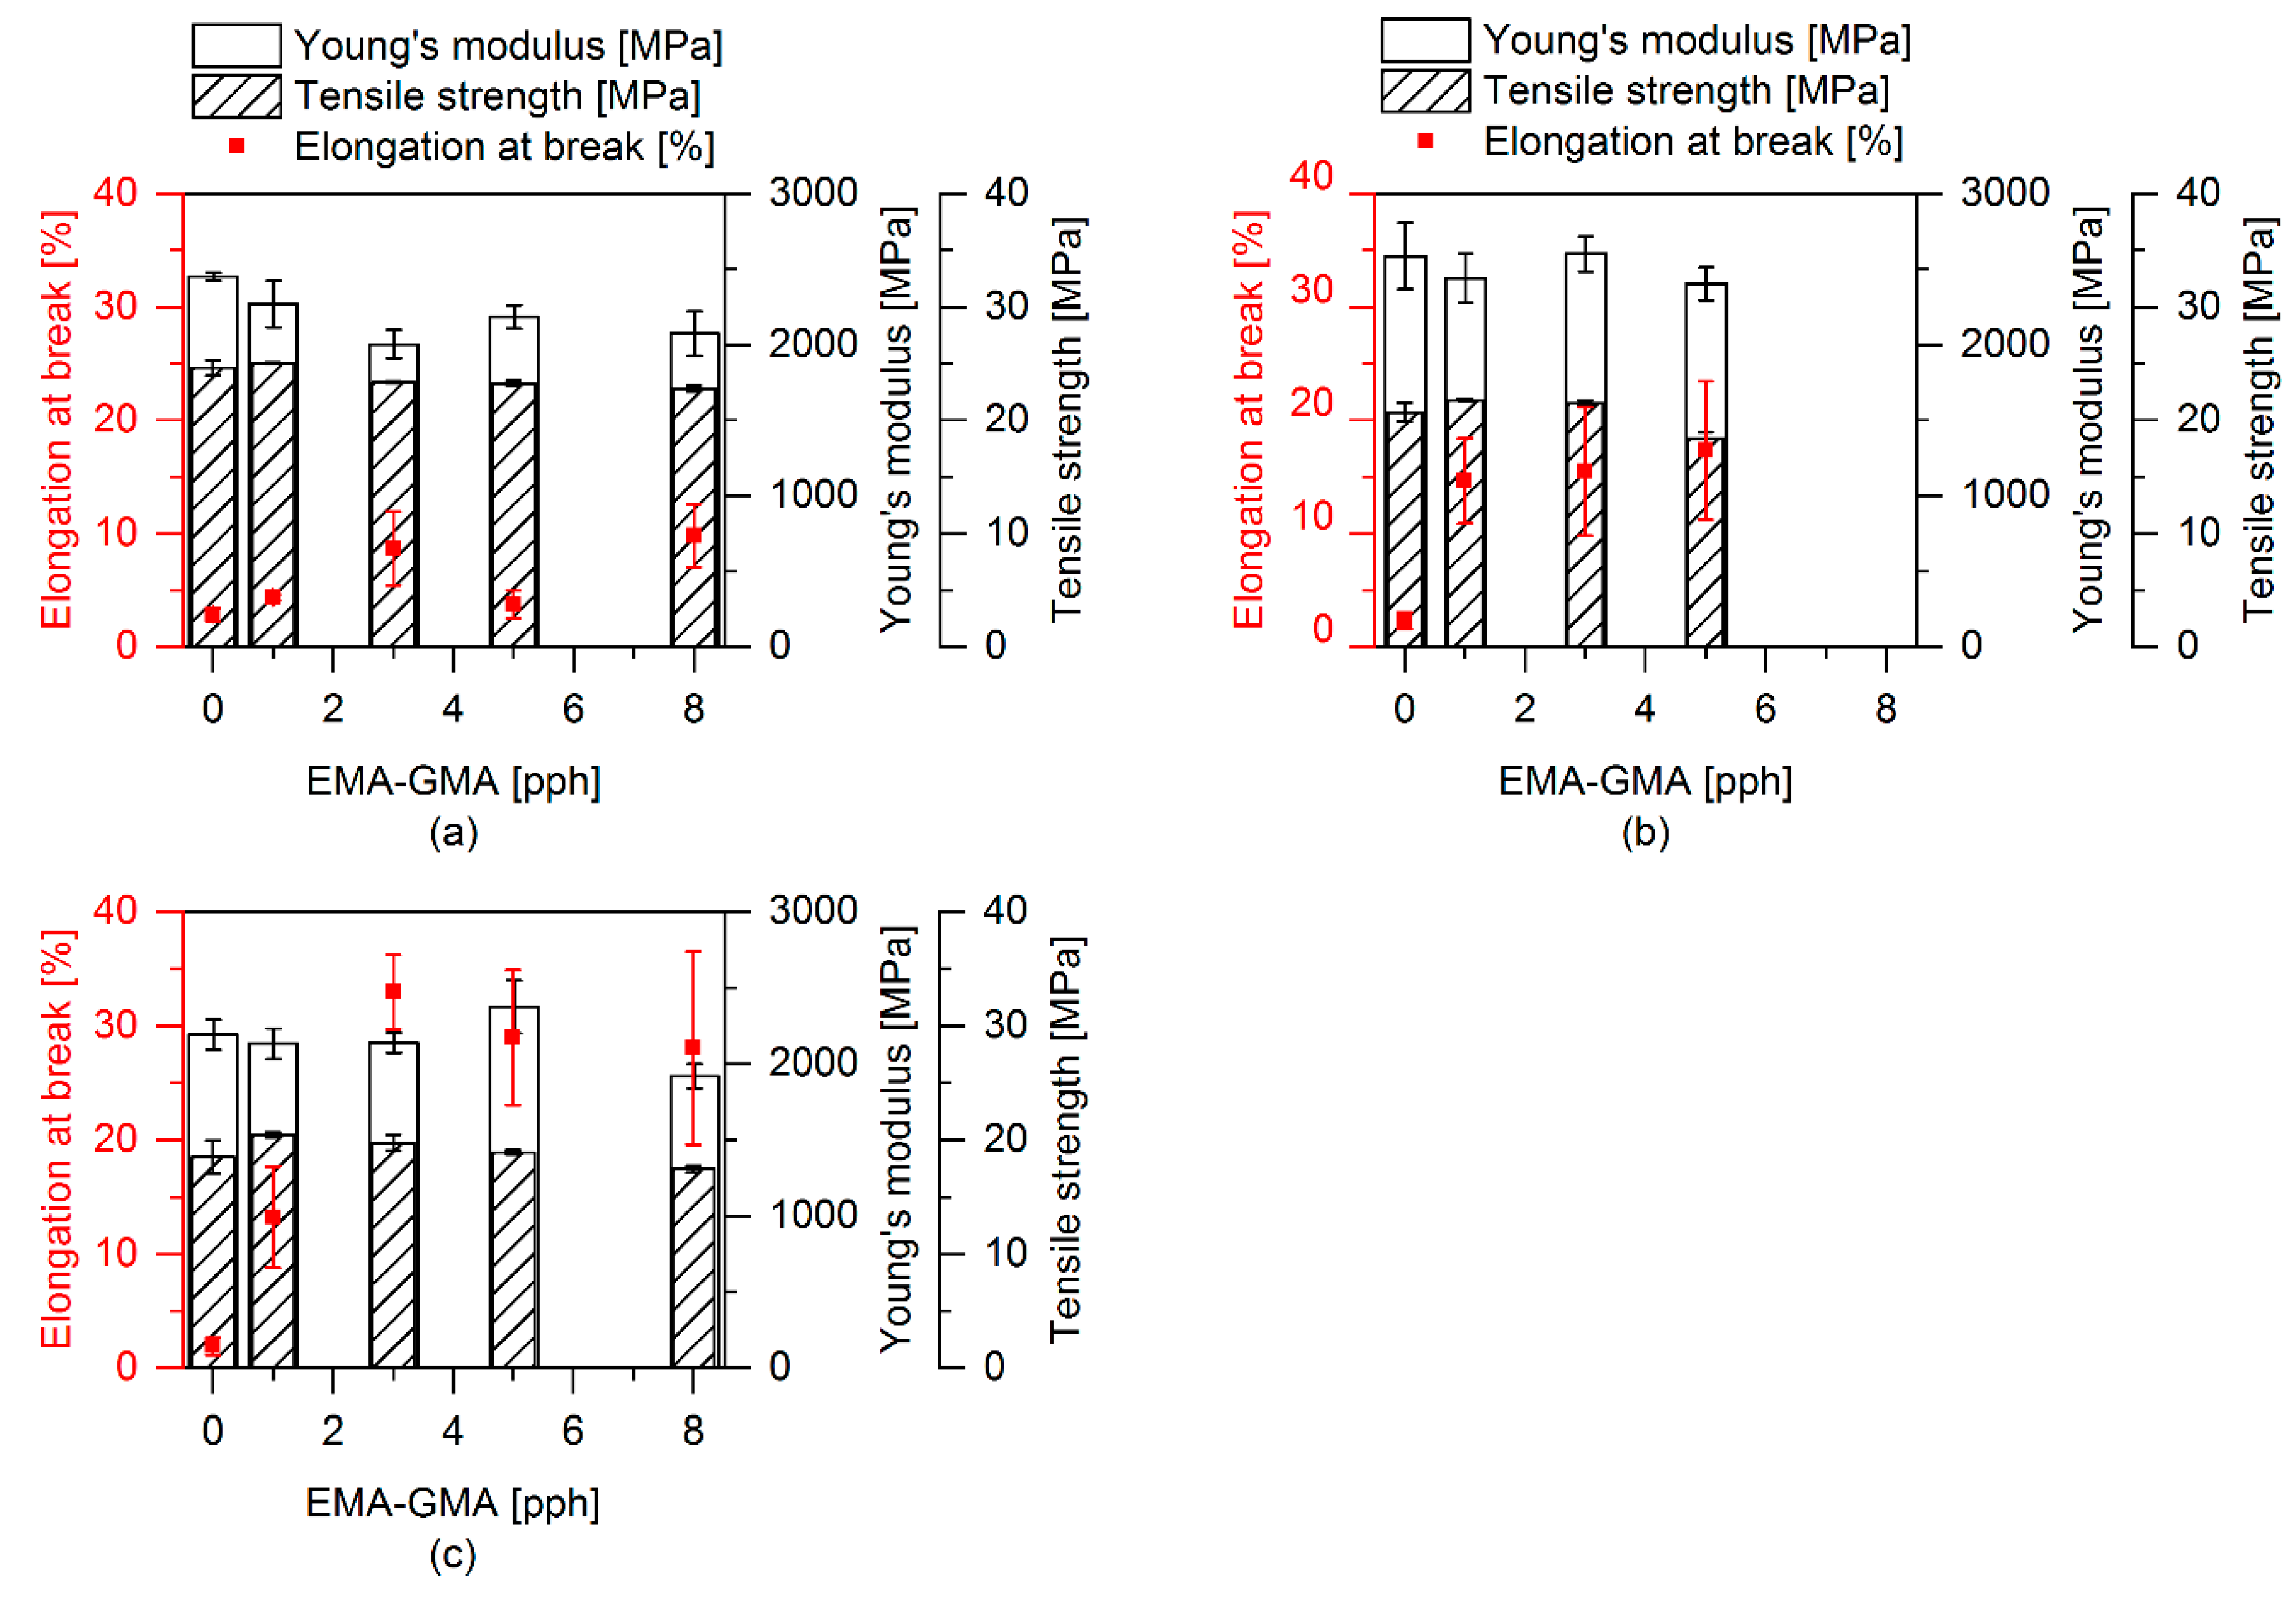
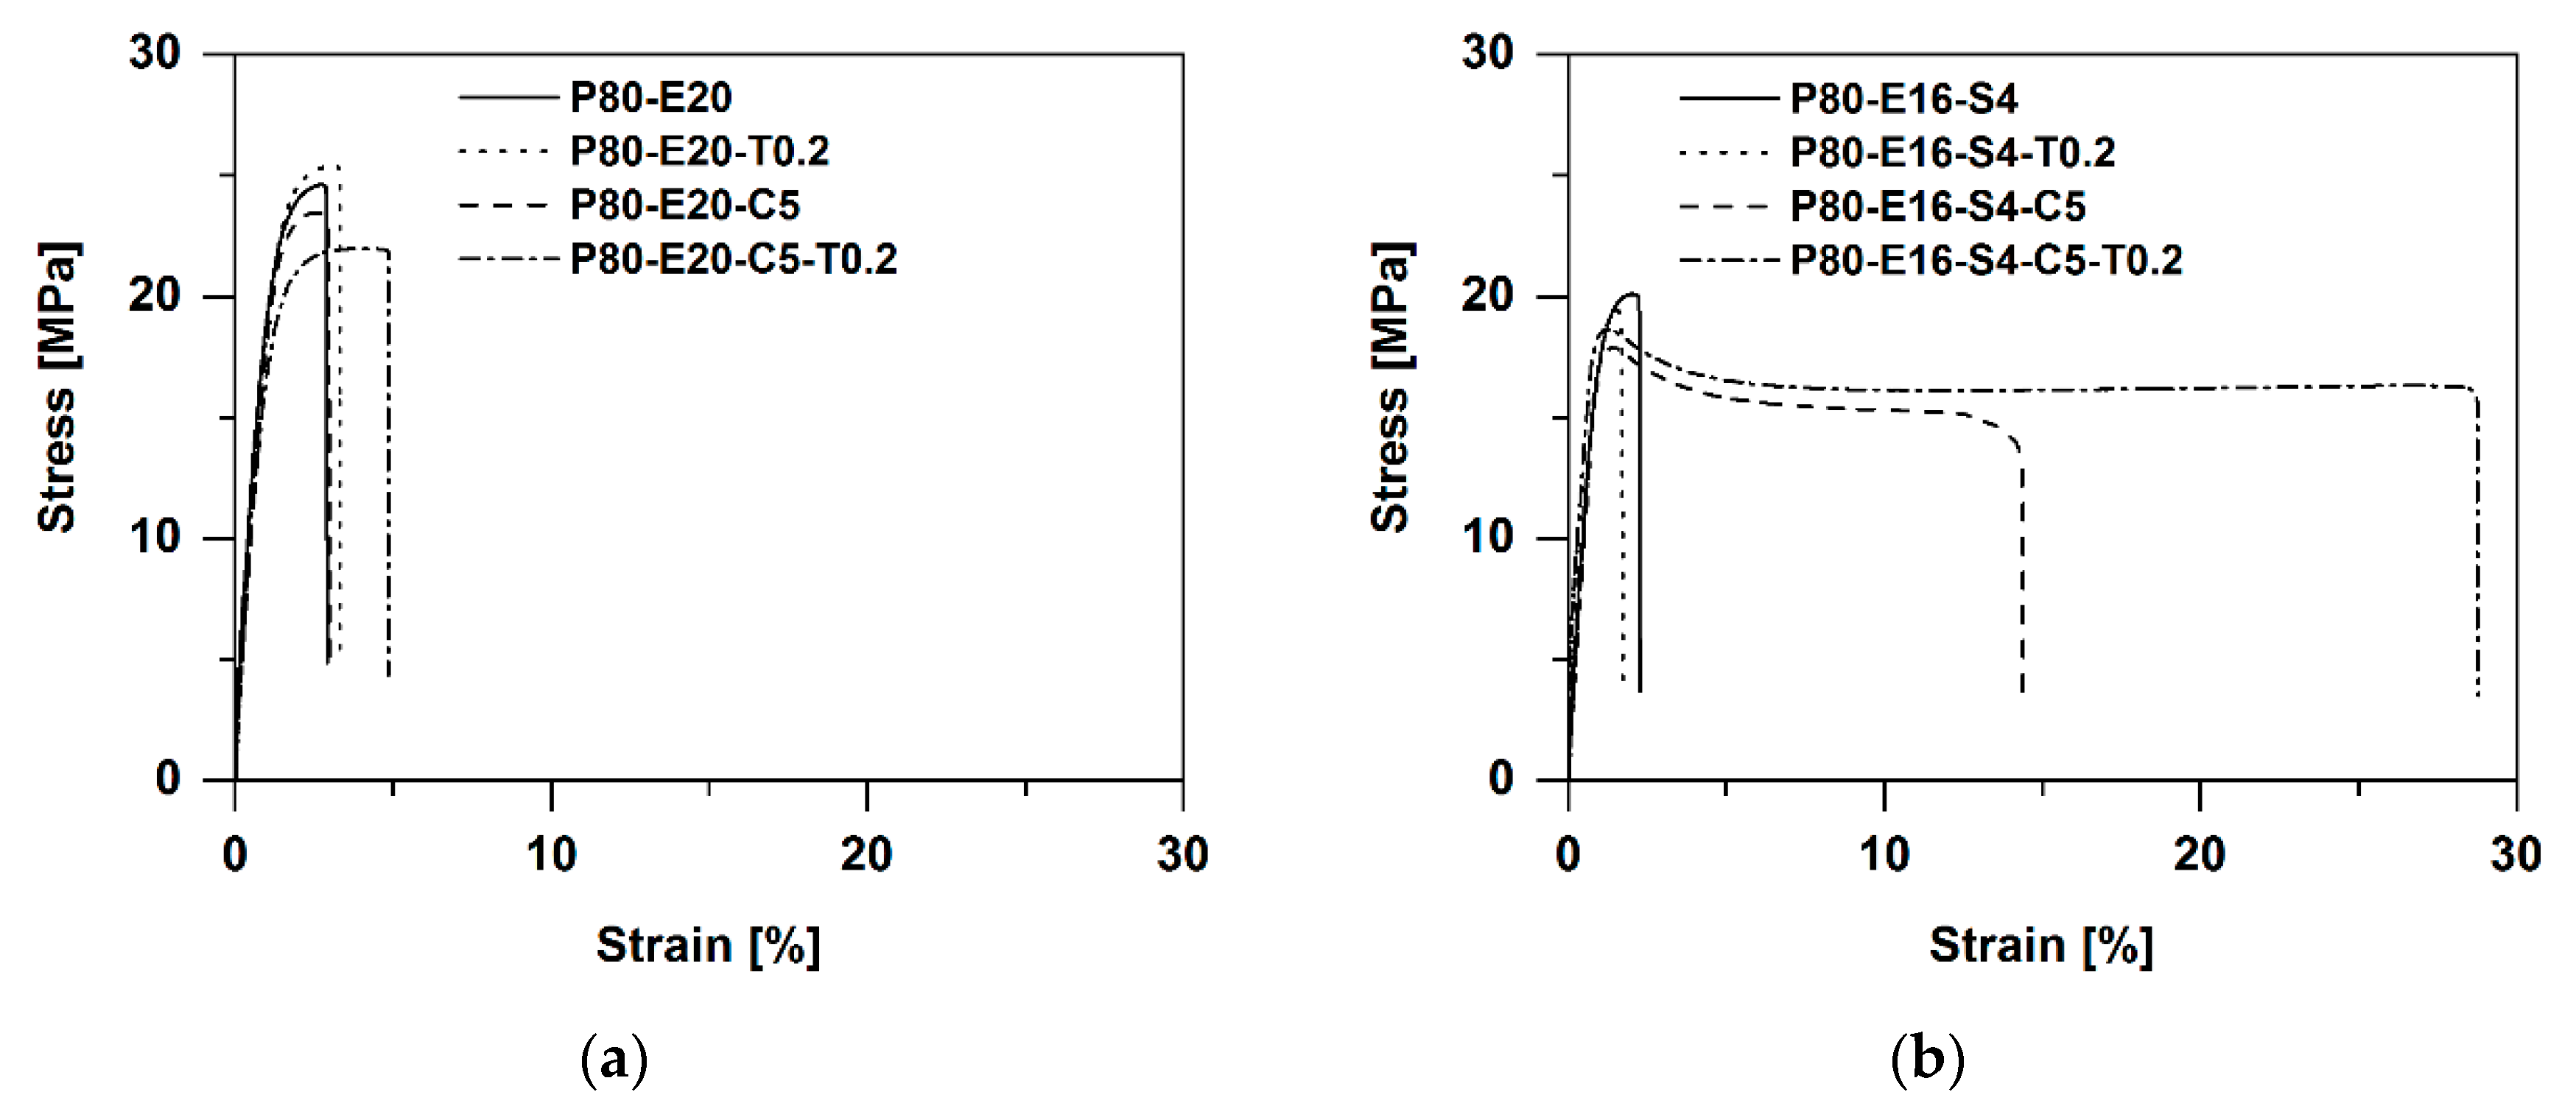
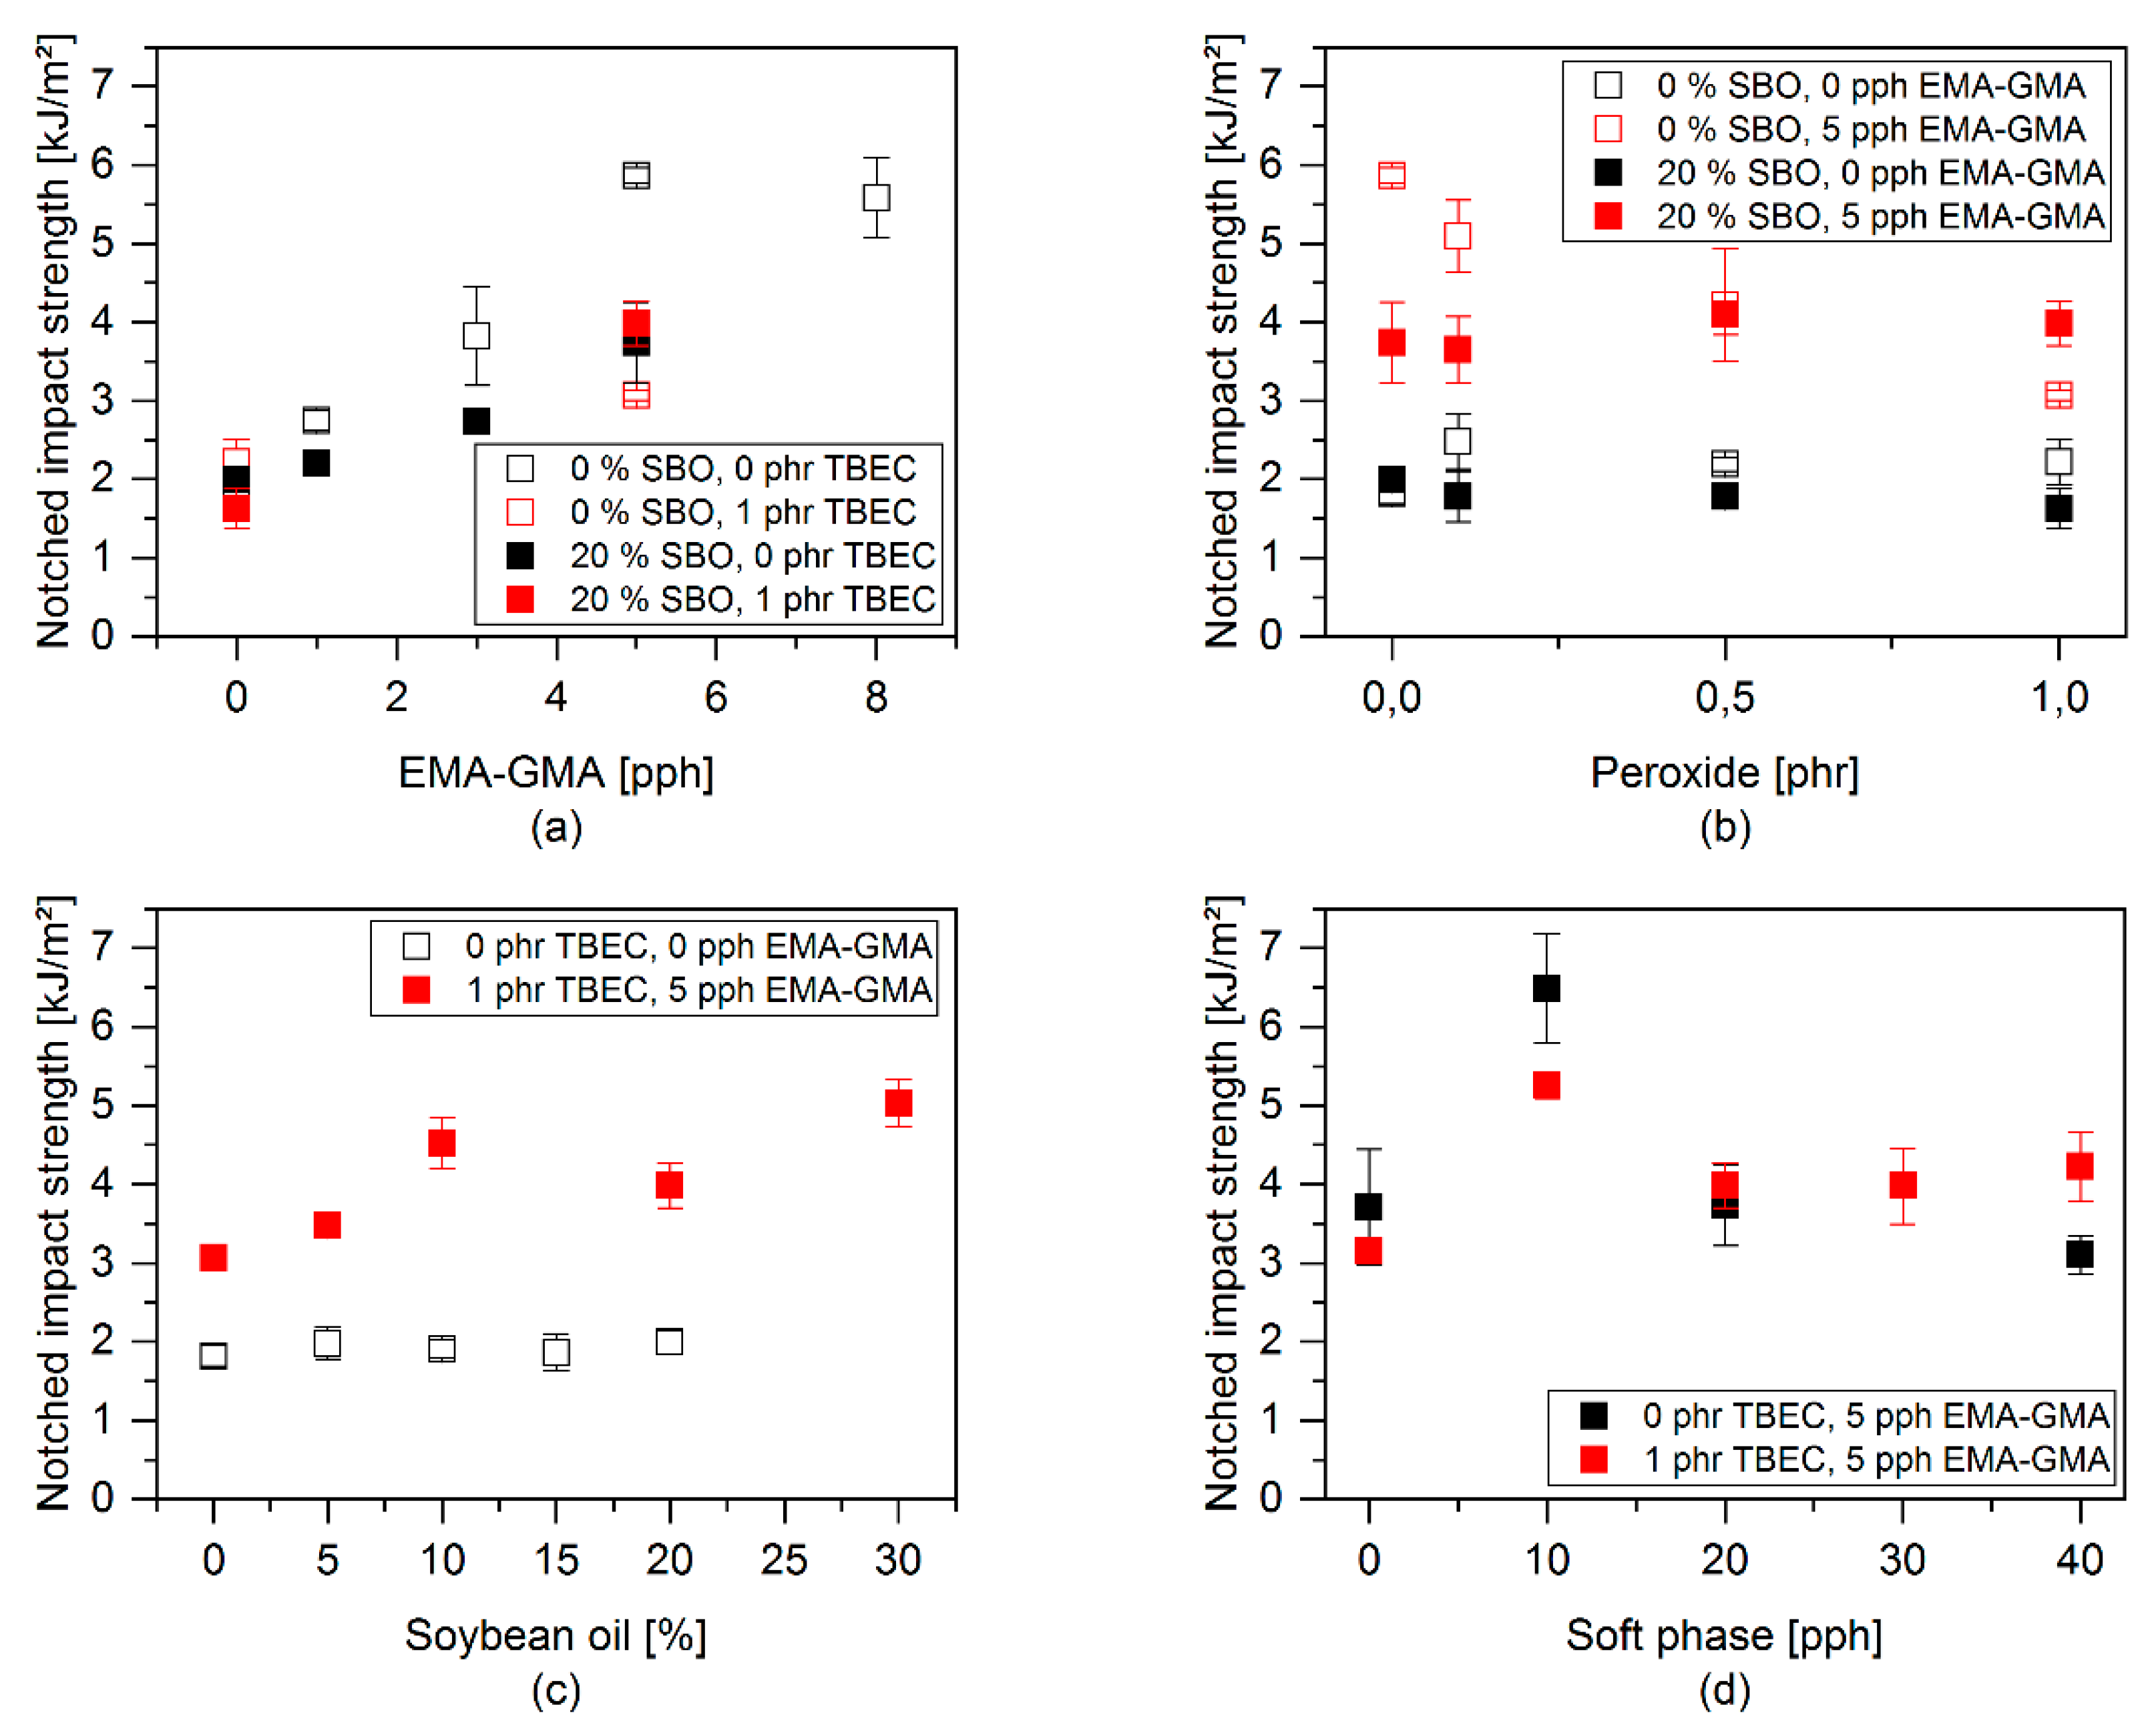
3.3. Mechanical Properties
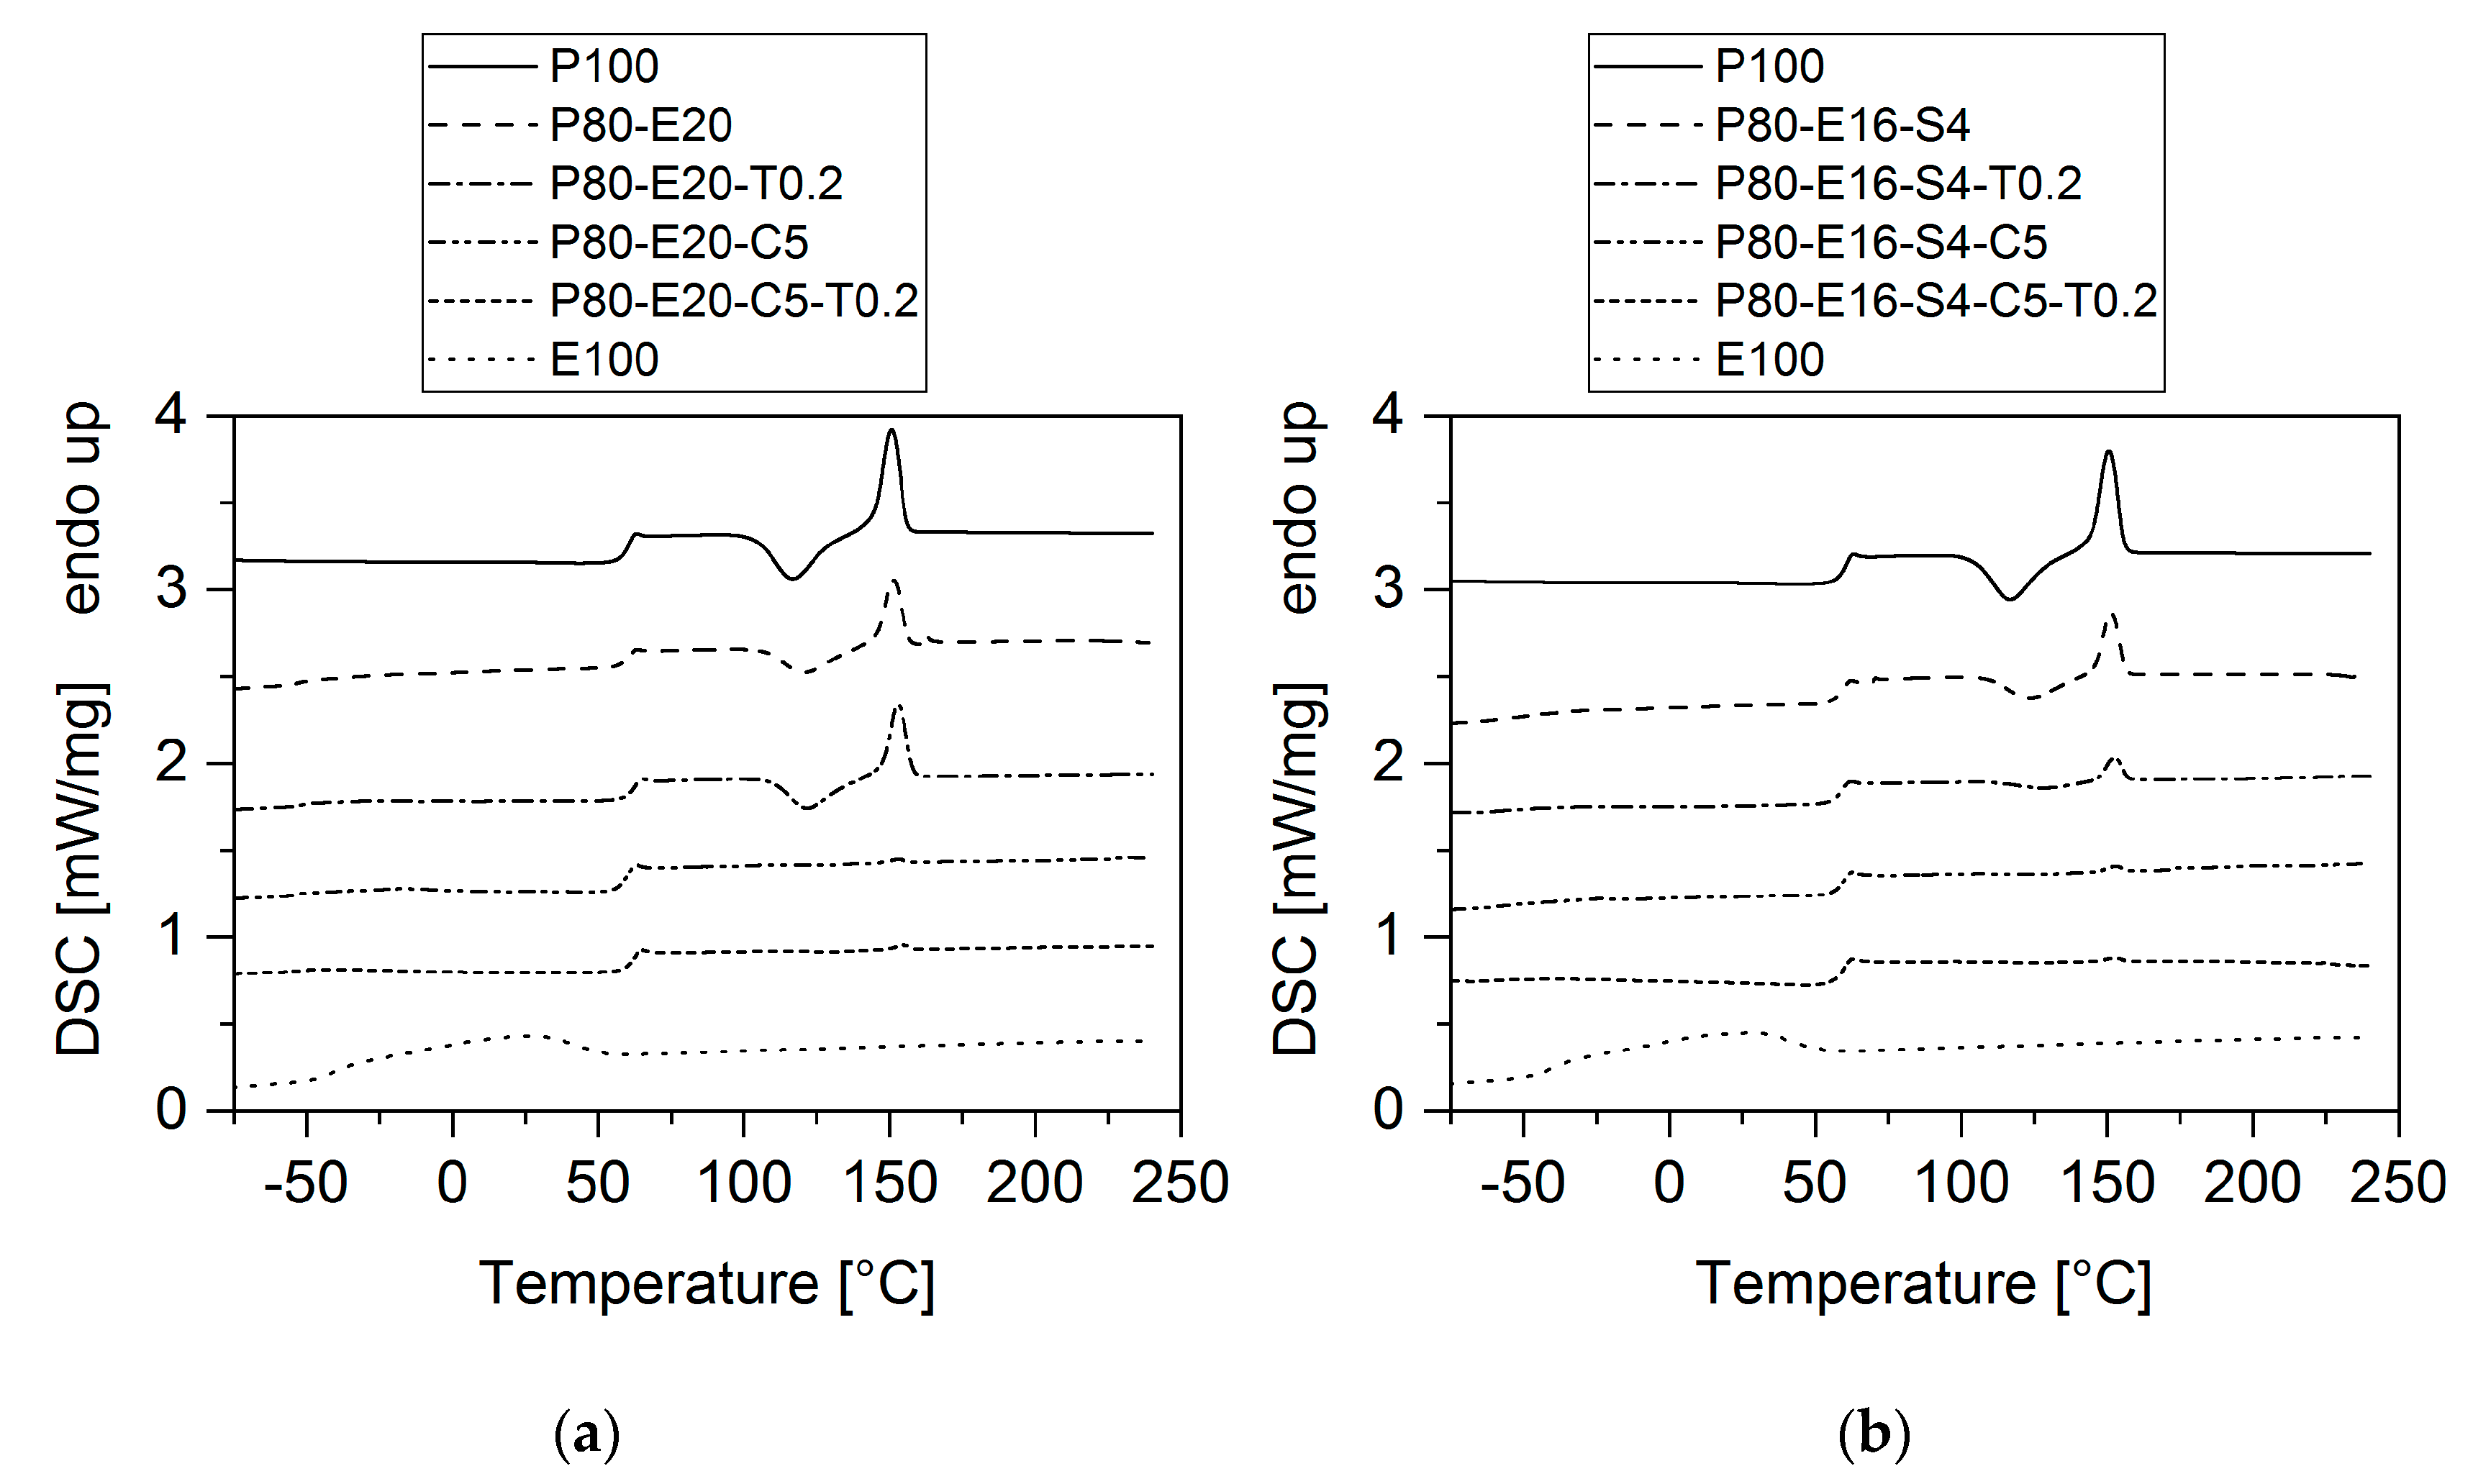
3.4. Thermal Properties
4. Conclusions
Author Contributions
Funding
Acknowledgments
Conflicts of Interest
References
- Rasal, R.M.; Janorkar, A.V.; Hirt, D.E. Poly(lactic acid) modifications. Prog. Polym. Sci. 2010, 35, 338–356. [Google Scholar] [CrossRef]
- Hamad, K.; Kaseem, M.; Ayyoob, M.; Joo, J.; Deri, F. Polylactic acid blends: The future of green, light and tough. Prog. Polym. Sci. 2018, 85, 83–127. [Google Scholar] [CrossRef]
- Labrecque, L.V.; Kumar, R.A.; Dav, V.; Gross, R.A.; McCarthy, S.P. Citrate esters as plasticizers for poly(lactic acid). J. Appl. Polym. Sci. 1997, 66, 1507–1513. [Google Scholar] [CrossRef]
- Martin, O.; Avérous, L. Poly(lactic acid): Plasticization and properties of biodegradable multiphase systems. Polymer 2001, 42, 6209–6219. [Google Scholar] [CrossRef]
- Burgos, N.; Martino, V.P.; Jiménez, A. Characterization and ageing study of poly(lactic acid) films plasticized with oligomeric lactic acid. Polym. Degrad. Stabil. 2013, 98, 651–658. [Google Scholar] [CrossRef]
- Jacobsen, S.; Fritz, H.G. Plasticizing polylactide-the effect of different plasticizers on the mechanical properties // Plasticizing polylactide?the effect of different plasticizers on the mechanical properties. Polym. Eng. Sci. 1999, 39, 1303–1310. [Google Scholar] [CrossRef]
- Zhang, H.; Fang, J.; Ge, H.; Han, L.; Wang, X.; Hao, Y.; Han, C.; Dong, L. Thermal, mechanical, and rheological properties of polylactide/poly(1,2-propylene glycol adipate). Polym. Eng. Sci. 2013, 53, 112–118. [Google Scholar] [CrossRef]
- Anakabe, J.; Zaldua Huici, A.M.; Eceiza, A.; Arbelaiz, A. Melt blending of polylactide and poly(methyl methacrylate): Thermal and mechanical properties and phase morphology characterization. J. Appl. Polym. Sci. 2015, 132. [Google Scholar] [CrossRef]
- Su, S.; Kopitzky, R.; Tolga, S.; Kabasci, S. Polylactide (PLA) and Its Blends with Poly(butylene succinate) (PBS): A Brief Review. Polymers 2019, 11, 1193. [Google Scholar] [CrossRef] [PubMed] [Green Version]
- Karami, S.; Lafleur, P.G. Toughening of polylactide nanocomposites with an ethylene alkyl acrylate copolymer: Effects of the addition of nanoparticles on phase morphology and fracture mechanisms. Polym. Eng. Sci. 2016, 56, 1415–1424. [Google Scholar] [CrossRef]
- Hao, Y.; Liu, Z.; Zhang, H.; Wu, Y.; Xiao, Y.; Li, Y.; Tong, Y. Effect of reactive group types on the properties of poly(ethylene octane) toughened poly(lactic acid). J. Polym. Res. 2019, 26, 109. [Google Scholar] [CrossRef]
- Shakouri, Z.; Nazockdast, H. Microstructural development and mechanical performance of PLA/TPU blends containing geometrically different cellulose nanocrystals. Cellulose 2018, 25, 7167–7188. [Google Scholar] [CrossRef]
- Zeng, J.-B.; Li, K.-A.; Du, A.-K. Compatibilization strategies in poly(lactic acid)-based blends. RSC Adv. 2015, 5, 32546–32565. [Google Scholar] [CrossRef]
- Imre, B.; Pukánszky, B. Compatibilization in bio-based and biodegradable polymer blends. Eur. Polym. J. 2013, 49, 1215–1233. [Google Scholar] [CrossRef] [Green Version]
- Coltelli, M.-B.; Toncelli, C.; Ciardelli, F.; Bronco, S. Compatible blends of biorelated polyesters through catalytic transesterification in the melt. Polym. Degrad. Stabil. 2011, 96, 982–990. [Google Scholar] [CrossRef]
- Ning, N.; Li, S.; Wu, H.; Tian, H.; Yao, P.; Hu, G.-H.; Tian, M.; Zhang, L. Preparation, microstructure, and microstructure-properties relationship of thermoplastic vulcanizates (TPVs): A review. Prog. Polym. Sci. 2018, 79, 61–97. [Google Scholar] [CrossRef]
- Si, W.-J.; Yuan, W.-Q.; Li, Y.-D.; Chen, Y.-K.; Zeng, J.-B. Tailoring toughness of fully biobased poly(lactic acid)/natural rubber blends through dynamic vulcanization. Polym. Test. 2018, 65, 249–255. [Google Scholar] [CrossRef]
- Chen, Y.; Yuan, D.; Xu, C. Dynamically vulcanized biobased polylactide/natural rubber blend material with continuous cross-linked rubber phase. ACS Appl. Mater. Inter. 2014, 6, 3811–3816. [Google Scholar] [CrossRef]
- Yuan, D.; Ding, J.; Mou, W.; Wang, Y.; Chen, Y. Bio-based polylactide/epoxidized natural rubber thermoplastic vulcanizates with a co-continuous phase structure. Polym. Test. 2017, 64, 200–206. [Google Scholar] [CrossRef]
- Chen, Y.; Chen, K.; Wang, Y.; Xu, C. Biobased Heat-Triggered Shape-Memory Polymers Based on Polylactide/Epoxidized Natural Rubber Blend System Fabricated via Peroxide-Induced Dynamic Vulcanization: Co-continuous Phase Structure, Shape Memory Behavior, and Interfacial Compatibilization. Ind. Eng. Chem. Res. 2015, 54, 8723–8731. [Google Scholar] [CrossRef]
- Ma, P.; Xu, P.; Liu, W.; Zhai, Y.; Dong, W.; Zhang, Y.; Chen, M. Bio-based poly(lactide)/ethylene-co-vinyl acetate thermoplastic vulcanizates by dynamic crosslinking: Structure vs. property. RSC Adv. 2015, 5, 15962–15968. [Google Scholar] [CrossRef]
- Zhang, N.; Lu, X. Morphology and properties of super-toughened bio-based poly(lactic acid)/poly(ethylene-co-vinyl acetate) blends by peroxide-induced dynamic vulcanization and interfacial compatibilization. Polym. Test. 2016, 56, 354–363. [Google Scholar] [CrossRef]
- Hu, X.; Kang, H.; Li, Y.; Geng, Y.; Wang, R.; Zhang, L. Preparation, morphology and superior performances of biobased thermoplastic elastomer by in situ dynamical vulcanization for 3D-printed materials. Polymer 2017, 108, 11–20. [Google Scholar] [CrossRef]
- Kang, H.; Hu, X.; Li, M.; Zhang, L.; Wu, Y.; Ning, N.; Tian, M. Novel biobased thermoplastic elastomer consisting of synthetic polyester elastomer and polylactide by in situ dynamical crosslinking method. RSC Adv. 2015, 5, 23498–23507. [Google Scholar] [CrossRef]
- Zhao, X.; Venoor, V.; Koelling, K.; Cornish, K.; Vodovotz, Y. Bio-based blends from poly(3-hydroxybutyrate- co -3-hydroxyvalerate) and natural rubber for packaging applications. J. Appl. Polym. Sci. 2019, 136, 47334. [Google Scholar] [CrossRef]
- Ma, P.; Hristova-Bogaerds, D.G.; Lemstra, P.J.; Zhang, Y.; Wang, S. Toughening of PHBV/PBS and PHB/PBS Blends via In situ Compatibilization Using Dicumyl Peroxide as a Free-Radical Grafting Initiator. Macromol. Mater. Eng. 2012, 297, 402–410. [Google Scholar] [CrossRef] [Green Version]
- Owens, D.K.; Wendt, R.C. Estimation of the surface free energy of polymers. J. Appl. Polym. Sci. 1969, 13, 1741–1747. [Google Scholar] [CrossRef]
- Rabel, W. Einige Aspekte der Benetzungstheorie und ihre Anwendung auf die Untersuchung und Veränderung der Oberflächeneigenschaften von Polymeren. Farbe Lack 1971, 77, 997–1006. [Google Scholar]
- Kaelble, D.H. Dispersion-Polar Surface Tension Properties of Organic Solids. J. Adhes. 1970, 2, 66–81. [Google Scholar] [CrossRef]
- Kwok, D.Y. The usefulness of the Lifshitz–van der Waals/acid–base approach for surface tension components and interfacial tensions. Colloid Surf. A 1999, 156, 191–200. [Google Scholar] [CrossRef]
- Holländer, A. On the Selection of Test Liquids for the Evaluation of Acid-Base Properties of Solid Surfaces by Contact Angle Goniometry. J. Colloid Interf. Sci. 1995, 169, 493–496. [Google Scholar] [CrossRef]
- Adão, M.H.V.C.; Saramago, B.J.V.; Fernandes, A.C. Estimation of the Surface Properties of Styrene-Acrylonitrile Random Copolymers from Contact Angle Measurements. J. Colloid Interf. Sci. 1999, 217, 94–106. [Google Scholar] [CrossRef] [PubMed]
- Brugnara, M. Available online: https://imagej.nih.gov/ij/plugins/contact-angle.html (accessed on 14 February 2020).
- Wu, S. Calculation of interfacial tension in polymer systems. J. Polym. Sci. C Polym. Symp. 1971, 34, 19–30. [Google Scholar] [CrossRef]
- Robeson, L.M. Polymer Blends. A Comprehensive Review; Hanser: Munich, Germany; Cincinnati, OH, USA, 2007; ISBN 978-3-446-22569-5. [Google Scholar]
- Harkins, W.D.; Feldman, A. Films. The spreading of liquids and the spreading coefficient. J. Am. Chem. Soc. 1922, 44, 2665–2685. [Google Scholar] [CrossRef]
- Molau, G.E. Heterogeneous polymer systems. I. Polymeric oil-in-oil emulsions. J. Polym. Sci. A Gen. Pap. 1965, 3, 1267–1278. [Google Scholar] [CrossRef]
- Han, C.D.; Chuang, H.-K. Blends of nylon 6 with an ethylene-based multifunctional polymer. I. Rheology–structure relationships. J. Appl. Polym. Sci. 1985, 30, 2431–2455. [Google Scholar] [CrossRef]
- Liu, Z.H.; Zhang, X.D.; Zhu, X.G.; Li, R.K.Y.; Qi, Z.N.; Wang, F.S.; Choy, C.L. Effect of morphology on the brittle ductile transition of polymer blends: 2. Analysis on poly(vinyl chloride)/nitrile rubber blends. Polymer 1998, 39, 5019–5025. [Google Scholar] [CrossRef]
- Wu, S. A generalized criterion for rubber toughening: The critical matrix ligament thickness. J. Appl. Polym. Sci. 1988, 35, 549–561. [Google Scholar] [CrossRef]
- Sumita, M.; Sakata, K.; Asai, S.; Miyasaka, K.; Nakagawa, H. Dispersion of fillers and the electrical conductivity of polymer blends filled with carbon black. Polym. Bull. 1991, 25, 265–271. [Google Scholar] [CrossRef]
- Yuryev, Y.; Mohanty, A.K.; Misra, M. A New Approach to Supertough Poly(lactic acid): A High Temperature Reactive Blending. Macromol. Mater. Eng. 2016, 301, 1443–1453. [Google Scholar] [CrossRef]
- Xu, Y.; Loi, J.; Delgado, P.; Topolkaraev, V.; McEneany, R.J.; Macosko, C.W.; Hillmyer, M.A. Reactive Compatibilization of Polylactide/Polypropylene Blends. Ind. Eng. Chem. Res. 2015, 54, 6108–6114. [Google Scholar] [CrossRef]
- Fortelný, I.; Jůza, J. Description of the Droplet Size Evolution in Flowing Immiscible Polymer Blends. Polymers 2019, 11, 761. [Google Scholar] [CrossRef] [PubMed] [Green Version]
- de Bruijn, R.A. Deformation and Breakup of Drops in Simple Shear Flows. Ph.D. Thesis, Technische Universiteit Eindhoven, Eindhoven, The Netherlands, 1989. [Google Scholar]
- Peters, G.W.M.; Hansen, S.; Meijer, H.E.H. Constitutive modeling of dispersive mixtures. J. Rheol. 2001, 45, 659–689. [Google Scholar] [CrossRef] [Green Version]
- Wang, S.; Pang, S.; Pan, L.; Xu, N.; Li, T. Isothermal Cold Crystallization, Heat Resistance, and Tensile Performance of Polylactide/Thermoplastic Polyester Elastomer (PLA/TPEE) Blends: Effects of Annealing and Reactive Compatibilizer. Polymers 2016, 8, 417. [Google Scholar] [CrossRef] [Green Version]


| Test Liquid | Reference | |||
|---|---|---|---|---|
| Water | 21.8 | 51.0 | 72.8 | [30,31] |
| Dimethyl sulfoxide (DMSO) | 36.0 | 8.0 | 44.0 | [30,31] |
| Ethylene glycol | 29.0 | 19.0 | 48.0 | [30,31] |
| Thiodiglycol | 38.4 | 15.6 | 54.0 | [32] |
| Sample | Contact Angle [°] | SFE [mN/m] | |||||
|---|---|---|---|---|---|---|---|
| Water | Ethylene Glycol | Thiodiglycol | DMSO | ||||
| PLA | 63.4 ± 1.8 | 26.2 ± 1.5 | 27.8 ± 1.6 | n.a. * | 46.0 ± 1.7 | 33.1 ± 1.1 | 13.0 ± 0.6 |
| EPDM | 84.0 ± 2.2 | 69.8 ± 3.0 | 77.4 ± 2.9 | 54.8 ± 2.4 | 23.8 ± 2.2 | 14.4 ± 1.2 | 9.4 ± 1.0 |
| EMAGMA | 83.5 ± 1.6 | 68.9 ± 2.3 | 64.5 ± 2.3 | 52.4 ± 1.5 | 26.5 ± 1.7 | 18.8 ± 1.0 | 7.7 ± 0.7 |
| Interface | IFT Harmonic Mean [mN/m] | IFT Geometric Mean [mN/m] |
|---|---|---|
| PLA–EPDM | 7.9 | 4.1 |
| PLA–EMAGMA | 5.3 | 2.7 |
| EPDM–EMAGMA | 0.7 | 0.4 |
| Spreading coefficient | 1.9 | 1.0 |
| Wetting coefficient | −0.6 | −0.6 |
| Sample | Elongation at Break [%] | Tensile Strength [MPa] | Young’s Modulus [GPa] | Charpy Notched Impact Strength [kJ/m2] |
|---|---|---|---|---|
| P100 | 2.0 ± 0.2 | 65.9 ± 2.3 | 4.9 ± 0.3 | 2.4 ± 0.5 |
| E100 | 1130 * | 4 * | 4E-3 * | n.a. ** |
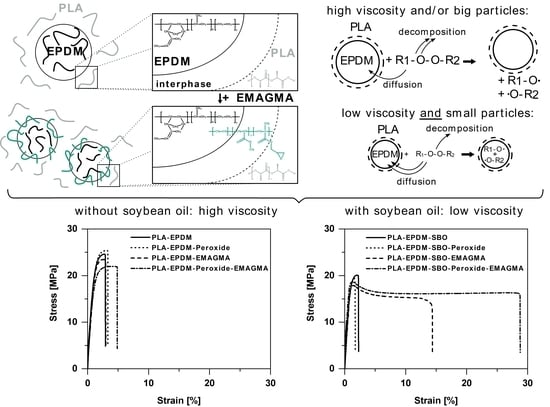
| P80-E20 | 2.8 ± 0.6 | 24.6 ± 0.7 | 2.5 ± 0.1 | 1.8 ± 0.1 |
| P80-E20-T0.2 | 3.3 ± 0.2 | 25.1 ± 0.4 | 2.3 ± 0.2 | 2.2 ± 0.3 |
| P80-E20-C5 | 3.7 ± 1.2 | 23.2 ± 0.3 | 2.2 ± 0.1 | 5.9 ± 0.1 |
| P80-E20-C5-T0.2 | 5.1 ± 1.4 | 22.0 ± 0.1 | 2.1 ± 0.1 | 3.1 ± 0.1 |
| P80-E16-S4 | 2.3 ± 0.8 | 20.7 ± 0.8 | 2.6 ± 0.2 | 2.0 ± 0.2 |
| P80-E16-S4-T0.2 | 1.9 ± 0.8 | 18.5 ± 1.4 | 2.2 ± 0.1 | 1.6 ± 0.2 |
| P80-E16-S4-C5 | 17.3 ± 6.1 | 18.4 ± 0.6 | 2.4 ± 0.1 | 3.7 ± 0.5 |
| P80-E16-S4-C5-T0.2 | 29.0 ± 5.9 | 18.9 ± 0.2 | 2.4 ± 0.2 | 4.0 ± 0.3 |
© 2020 by the authors. Licensee MDPI, Basel, Switzerland. This article is an open access article distributed under the terms and conditions of the Creative Commons Attribution (CC BY) license (http://creativecommons.org/licenses/by/4.0/).
Share and Cite
Piontek, A.; Vernaez, O.; Kabasci, S. Compatibilization of Poly(Lactic Acid) (PLA) and Bio-Based Ethylene-Propylene-Diene-Rubber (EPDM) via Reactive Extrusion with Different Coagents. Polymers 2020, 12, 605. https://0-doi-org.brum.beds.ac.uk/10.3390/polym12030605
Piontek A, Vernaez O, Kabasci S. Compatibilization of Poly(Lactic Acid) (PLA) and Bio-Based Ethylene-Propylene-Diene-Rubber (EPDM) via Reactive Extrusion with Different Coagents. Polymers. 2020; 12(3):605. https://0-doi-org.brum.beds.ac.uk/10.3390/polym12030605
Chicago/Turabian StylePiontek, Alexander, Oscar Vernaez, and Stephan Kabasci. 2020. "Compatibilization of Poly(Lactic Acid) (PLA) and Bio-Based Ethylene-Propylene-Diene-Rubber (EPDM) via Reactive Extrusion with Different Coagents" Polymers 12, no. 3: 605. https://0-doi-org.brum.beds.ac.uk/10.3390/polym12030605