
Prediction of Strawberries’ Quality Parameters Using Artificial Neural Networks


1
CREA—Research Centre for Food and Nutrition, Via Ardeatina 546, 00178 Rome, Italy
2
CREA—Research Centre for Olive, Fruit and Citrus Crops, 00134 Rome, Italy
*
Author to whom correspondence should be addressed.
Agronomy 2022, 12(4), 963; https://0-doi-org.brum.beds.ac.uk/10.3390/agronomy12040963
Submission received: 28 March 2022
/
Revised: 14 April 2022
/
Accepted: 15 April 2022
/
Published: 16 April 2022
(This article belongs to the Special Issue Enhanced Product Quality of Plant Material from Field Crops)
Abstract
:Strawberry is a very popular fruit, appreciated for its unique flavor and many beneficial traits such as antioxidants and useful amino acids, which strongly contribute to the overall quality of the product. Indeed, the quality of fresh fruit is a fundamental aspect for consumers, and it is crucial for the success of breeding activities as well as for enhancing the competitiveness and profitability of the fruit industry. Nowadays, the entire supply chain requires simple and fast systems for quality evaluation. In this context, the pomological and chemical traits (i.e., soluble solids, firmness, titratable acidity, dry matter) as well as nutritional ones such as total phenols, total anthocyanins and antioxidant potential were evaluated and compared for seven strawberry cultivars and three harvest times. The prediction of the qualitative traits was carried out using color space coordinates (L*, a* and b*) and two statistical techniques, i.e., the multiple linear regression models (MLR) and artificial neural networks (ANNs). Unsatisfactory prediction performances were obtained for all parameters when MLR was applied. On the contrary, the good prediction of the internal quality attributes, using ANN, was observed, especially for both antioxidant activity and the total monomeric anthocyanin (R2 = 0.906, and R2 = 0.943, respectively). This study highlighted that color coordinates coupled with ANN can be successfully used to evaluate the quality of strawberry.
1. Introduction
Fragaria is one of genus in the Rosaceae family. Its most popular form is the strawberry (Fragaria × ananassa Duch.), which is the most consumed and profitable berry fruit crop worldwide [1]. It can be consumed fresh, frozen, used as raw material and additive to a wide range of products such as jams, juices, ice cream, and jellies [2]. It is appreciated for its unique flavor and many beneficial traits such as being low in calories, its high number of antioxidants, vitamin C and A, anthocyanin, and useful amino acids which makes it a medicinal and anticancer compound [3,4,5,6,7]. The fruit’s nutritional value and health benefits have further boosted its consumption in recent times.
According to the FAOSTAT data platform, the global production of strawberry has doubled in the past 20 years to 8.8 million tons. The cultivation of Fragaria plants is widespread worldwide but especially in moderate climate zones, as they must accumulate a specific amount of chilling hours (below 7 °C) for floral induction [8]. China is the largest strawberry producer in the world with 3.3 million tons production per year, followed by United States of America with a yearly production of 1 million tons. Mexico is the third largest producer of strawberry. China, the United States of America, and Mexico produce together more than 50% of the world’s total strawberries. The first European producer and sixth in the world is Spain; Italy ranks sixth among European countries with 121 thousand tons (FAOSTAT, 2020). There are hundreds of varieties of strawberries cultivated due to the numerous breeding projects implemented in recent decades. Strawberry breeders have succeeded in improving the fruit size and vigor of strawberry plants as well as their firmness and resistance to pathogens and have even adapted them to different climatic conditions and cultivation systems. On the contrary, the development of cultivars of superior quality and nutritional value is still a complex undertaking [9]. This is due to the complexity of the multiple factors that significantly impact fruit quality [10,11,12,13]. Furthermore, few genotypes are currently well characterized for nutritional quality and the level of antioxidants and antioxidant capacity in strawberry extracts [14]. Detecting fruit quality parameters is crucial for the success of breeding activities, as well as for enhancing the competitiveness and profitability of the fruit industry [15]. Moreover, the quality of fresh fruit is a fundamental aspect for consumers who are encouraged to eat more fruit, vegetables, functional foods and vitamin juices with good taste and high antioxidant potential [16].
At present, quality traits, bioactive compounds and antioxidant activity determinations are manually carried out using equipment which are mostly destructive, laborious, and time-consuming. It goes without saying that current methods cannot be used in the supply chain where there is a need to a massive detection without fruit destruction. In sight of this, the development of non-destructive methods is considered a great challenge for the entire supply chain, which requires simple and fast systems for fruit quality evaluation both at harvest and during postharvest storage. Recently, non-destructive and non-invasive analytical methods have been applied for fruit quality evaluation to avoid the complexity, time requirements and low performance occurring when destructive methods are performed [17,18]. Since then, different non-destructive techniques including colorimetry, visible imaging, visible and near infrared spectroscopy, hyperspectral imaging, multispectral imaging, fluorescence imaging, acoustic impulse technique, and magnetic resonance imaging have been introduced [19]. Among these technologies, colorimetry has drawn great attention for the simplicity of its use, as no complex pre-treatments or chemical reactions on fruit samples are needed. Moreover, the colorimeter (i.e., a vis spectrometer) is one of the least expensive among high throughput instruments. In recent years, the combination of the color space coordinates and chemometrics has been also successfully applied for compound quantification [20].
In this regard, several authors highlighted the potential use of different algorithms, such as principal component analysis (PCA), multiple linear regression (MLR), and artificial neural networks (ANNs) to classify and quantify specific compounds in different agricultural products [21,22,23,24,25,26,27,28]. However, there is still a lack of methods that effectively evaluate fruit quality using easily and readily measured factors. Multiple linear regression (MLR) is often used to model some indicators, but this technique is not always effective in determining quality attributes due to the non-linearity of its variables. In recent years, machine learning, a field in artificial intelligence, has led to innovation in numerous fields involving the core technologies of algorithms and big data [29]. It has been applied to many areas including medicine, manufacturing, healthcare, etc., because it greatly improves productivity, quality, flexibility, safety, and cost [30,31,32]. It has also attracted a lot of attention for its use in smart and digital agriculture and food industry applications, especially for the pattern recognition, prediction, and classification of quality attributes [33]. Among the various machine learning techniques, artificial neural networks (ANNs) have powerful abilities in learning, identifying and modeling complex and often non-linear relationships between the entrance and exit signals in function of the provided patterns [28]. Moreover, ANNs can learn from example datasets through iteration without requiring prior knowledge of the relationships between the process variables. Previous studies demonstrated that ANN has the ability to reliably and practically predict fruit characteristics [24,25,27,34].
In light of these considerations, our study aimed to characterize the physico-chemical and nutraceutical characteristics of seven strawberry cultivars in relation to different harvest times and verify the effectiveness of MLR and ANN algorithms to build models for the prediction of these attributes using color space coordinates. To the best of our knowledge, there are no literature data on the use of colorimetry on strawberries for this purpose.
2. Materials and Methods
2.1. Plant Material and Experimental Design
Strawberry fruits (F. × ananassa L) from seven everbearing strawberry cultivars (listed in Table 1) were collected at commercial maturity in the experimental orchards of the “Centro Appenninico del Terminillo Carlo Jucci”, of the Università degli Studi di Perugia, located in Rieti (central Italy, lat. 42°24′29.52″ N, 12°51′36.36″ E; alt. 381 m a.s.l.).
All tested cultivars were grown with the same cultural practices. The experiment was laid out following the completely randomized design with three agronomic replications. Each replication consisted of 50 {(2 × 25) = 50} strawberry plants spaced 50 cm × 40 cm and the fruits were harvested at three different times (May, July, and October). A set of 114 pooled samples of all the cultivars except for Favette (only one harvest during springtime) was collected during the three harvest times. Each pooled sample resulted from 20 strawberries. Samples were screened for the uniformity, appearance and absence of physical defects or decay, and then chemically analyzed. After each harvest, fruits were immediately taken to the laboratory, cleaned with MilliQ water, drained and gently blotted with a paper towel, and then immediately analyzed for the quality traits.
2.2. Chemical Analyses
All reagents were of analytical high-performance liquid chromatography (HPLC) grade (Merk Life Science S.r.l, Milan, Italy). Folin–Ciocalteu reagent, 2,2-diphenyl-1-picrylhydrazyl (DPPH), (±)-6-hydroxy-2,5,7,8-tetramethylchromane-2-carboxylic acid (Trolox), sodium carbonate and gallic acid (GA) and cyanidin 3O glucoside (CG), were purchased from Sigma-Aldrich (St. Louis, MO, USA). Milli-Q water (Millipore, Bedford, MA, USA) and passed through 0.45 nylon membrane filters (Pall Corporation, Ann Arbor, MI, USA).
2.3. Analytical Methods
Quality traits analysis (i.e., weight (W), length, width, thickness, firmness (FF), color (CIELab coordinates), dry matter (DM), titratable acidity (TA), and soluble solids content (TSS)) was performed on the fresh fruits (approximately 500 g per sample). In addition, the fruit shape index was calculated as a length–width ratio. The bioactive compounds (i.e., total phenolic content (TPC) and total anthocyanins content (TMA)) and the antioxidant activity (AA) determinations were performed on frozen samples at −80 °C. In detail, the strawberry dimensions (length, width, thickness) and shape index were determined by digital caliper (±0.05 mm accuracy). Weight loss—comprising the drying of fresh samples at 105 °C ± 1 until a constant weight was reached—was used to determine the percentage of moisture content (g 100 g−1 of fresh weight). Ground skin color on the external opposite sides (two readings in the equatorial perimeter) of all the whole fruits in each replicate was evaluated using the CIELab color space coordinates (L* = luminosity; a* = redness/greenness; b* = yellowness/blueness) obtained with a tristimulus colorimeter (Chroma Meter CR-200; Minolta, Milan, Italy) equipped with a D65 illuminant. The instrument was calibrated with a standard calibration plate and the results, L*, a*, and b* are reported as the means of the two opposite sides. Regarding CIELab coordinates, the L* axis gives the lightness: L* = 0 yields black and L* = 100 indicates diffuse white. Chromatic colors are described using the two axes in the horizontal plane. The a* axis is the green–red axis and the b* axis goes from blue (−b*) to yellow (+b*).
Berry firmness was measured with a penetrometer (Fruit Pressure Tester FT011, TR snc, Forlì, Italy), using an 8 mm tip, and the result is expressed in Newton (N). An aliquot of fresh fruits 10 g was used to titratable acidity (TA) determination using an automatic titration system (785 DPM Titrino, Metrohm Ldt, Herisau, Switzerland), and the results are expressed as g of malic acid (MA) 100 g−1 of fresh weight (FW). Instead, a fruit juice and digital refractometer (Refractometer 30PX, Mettler Toledo, Switzerland) were used for the TSS evaluation and data are expressed as g 100 g−1 of FW, as previously reported by Ceccarelli et al. [35]. Approximately 5 g of defrosted samples were extracted with 25 mL of acidified (5 mM HCl) of methanol/water solution (70/30 v/v) for TPC and AA analyses, whereas 20 mL of methanol solution containing 0.2% of hydrochloric acid were used for the total anthocyanins content (TAC) evaluation, according to Ceccarelli et al. [35]. Briefly, the Folin–Ciocalteu method was applied for TPC determination and the results are expressed in mg of gallic acid equivalent (GAE) 100 g−1 of FW, whereas the antioxidant activity evaluation of the extracts was performed with 2,2-diphenyl-1-picrylhydrazyl (DPPH) and the data are expressed on a FW basis μg of Trolox equivalent (TE) mg−1 of FW [34]. Finally, the pH-differential method [35] was used for TMA quantification and the results are expressed as mg cyanidin 3-O-glucoside equivalents (CGE) 100 g−1 of FW.
2.4. Statistical Analysis
In order to assess the distribution of data concerning the measured parameters, descriptive statistics (i.e., minimum, maximum, mean, standard deviation (SD), 25th percentile (Q1), median (Q2), and 75th percentile (Q3)) were calculated. Outliers were detected and removed from the dataset. Therefore, the final dataset consisted of 104 samples. Hierarchical clustering analysis, performed with a paired group algorithm and considering the Euclidean distance measure on the mean values of each cultivar, was applied to identify relatively homogenous groups of cultivars in terms of their pomological and quality traits. The non-parametric Spearman’s correlation was used to evaluate the pair relationships among all the quality attributes. Principal component analysis (PCA) was carried out on TSS, TA, DM, TPC, AA, TMA, and FF values to visualize the samples’ distribution considering the seven cultivars of strawberry and the three harvest times. Descriptive statistics and PCA were performed by using SPSS statistical software (version 22, SPSS, Chicago, IL, USA), whereas correlation analysis with PAST 4.02 [36].
2.5. Multiple Linear Regression Modeling
Multiple linear regression (MLR) was applied to determine how the CIELab coordinates were functionally related to the quality and nutraceutical characteristics of strawberry samples measured by physical and chemical analyses. The MLR model was defined as
where Y is the dependent variable (flesh firmness—FF; total soluble solid content—TSS; titratable acidity—TA; total phenolic —TPC; antioxidant activity—AA; total monomeric anthocyanin—TMA); β0 is the intercept; βi is the regression coefficients (i = 1, 2, 3); xi is the independent variables (lightness—L*; redness—a*; yellowness—b*); and εi = error term. Prediction performance was evaluated using the coefficient of determination (R2).
2.6. Artificial Neural Network Modeling
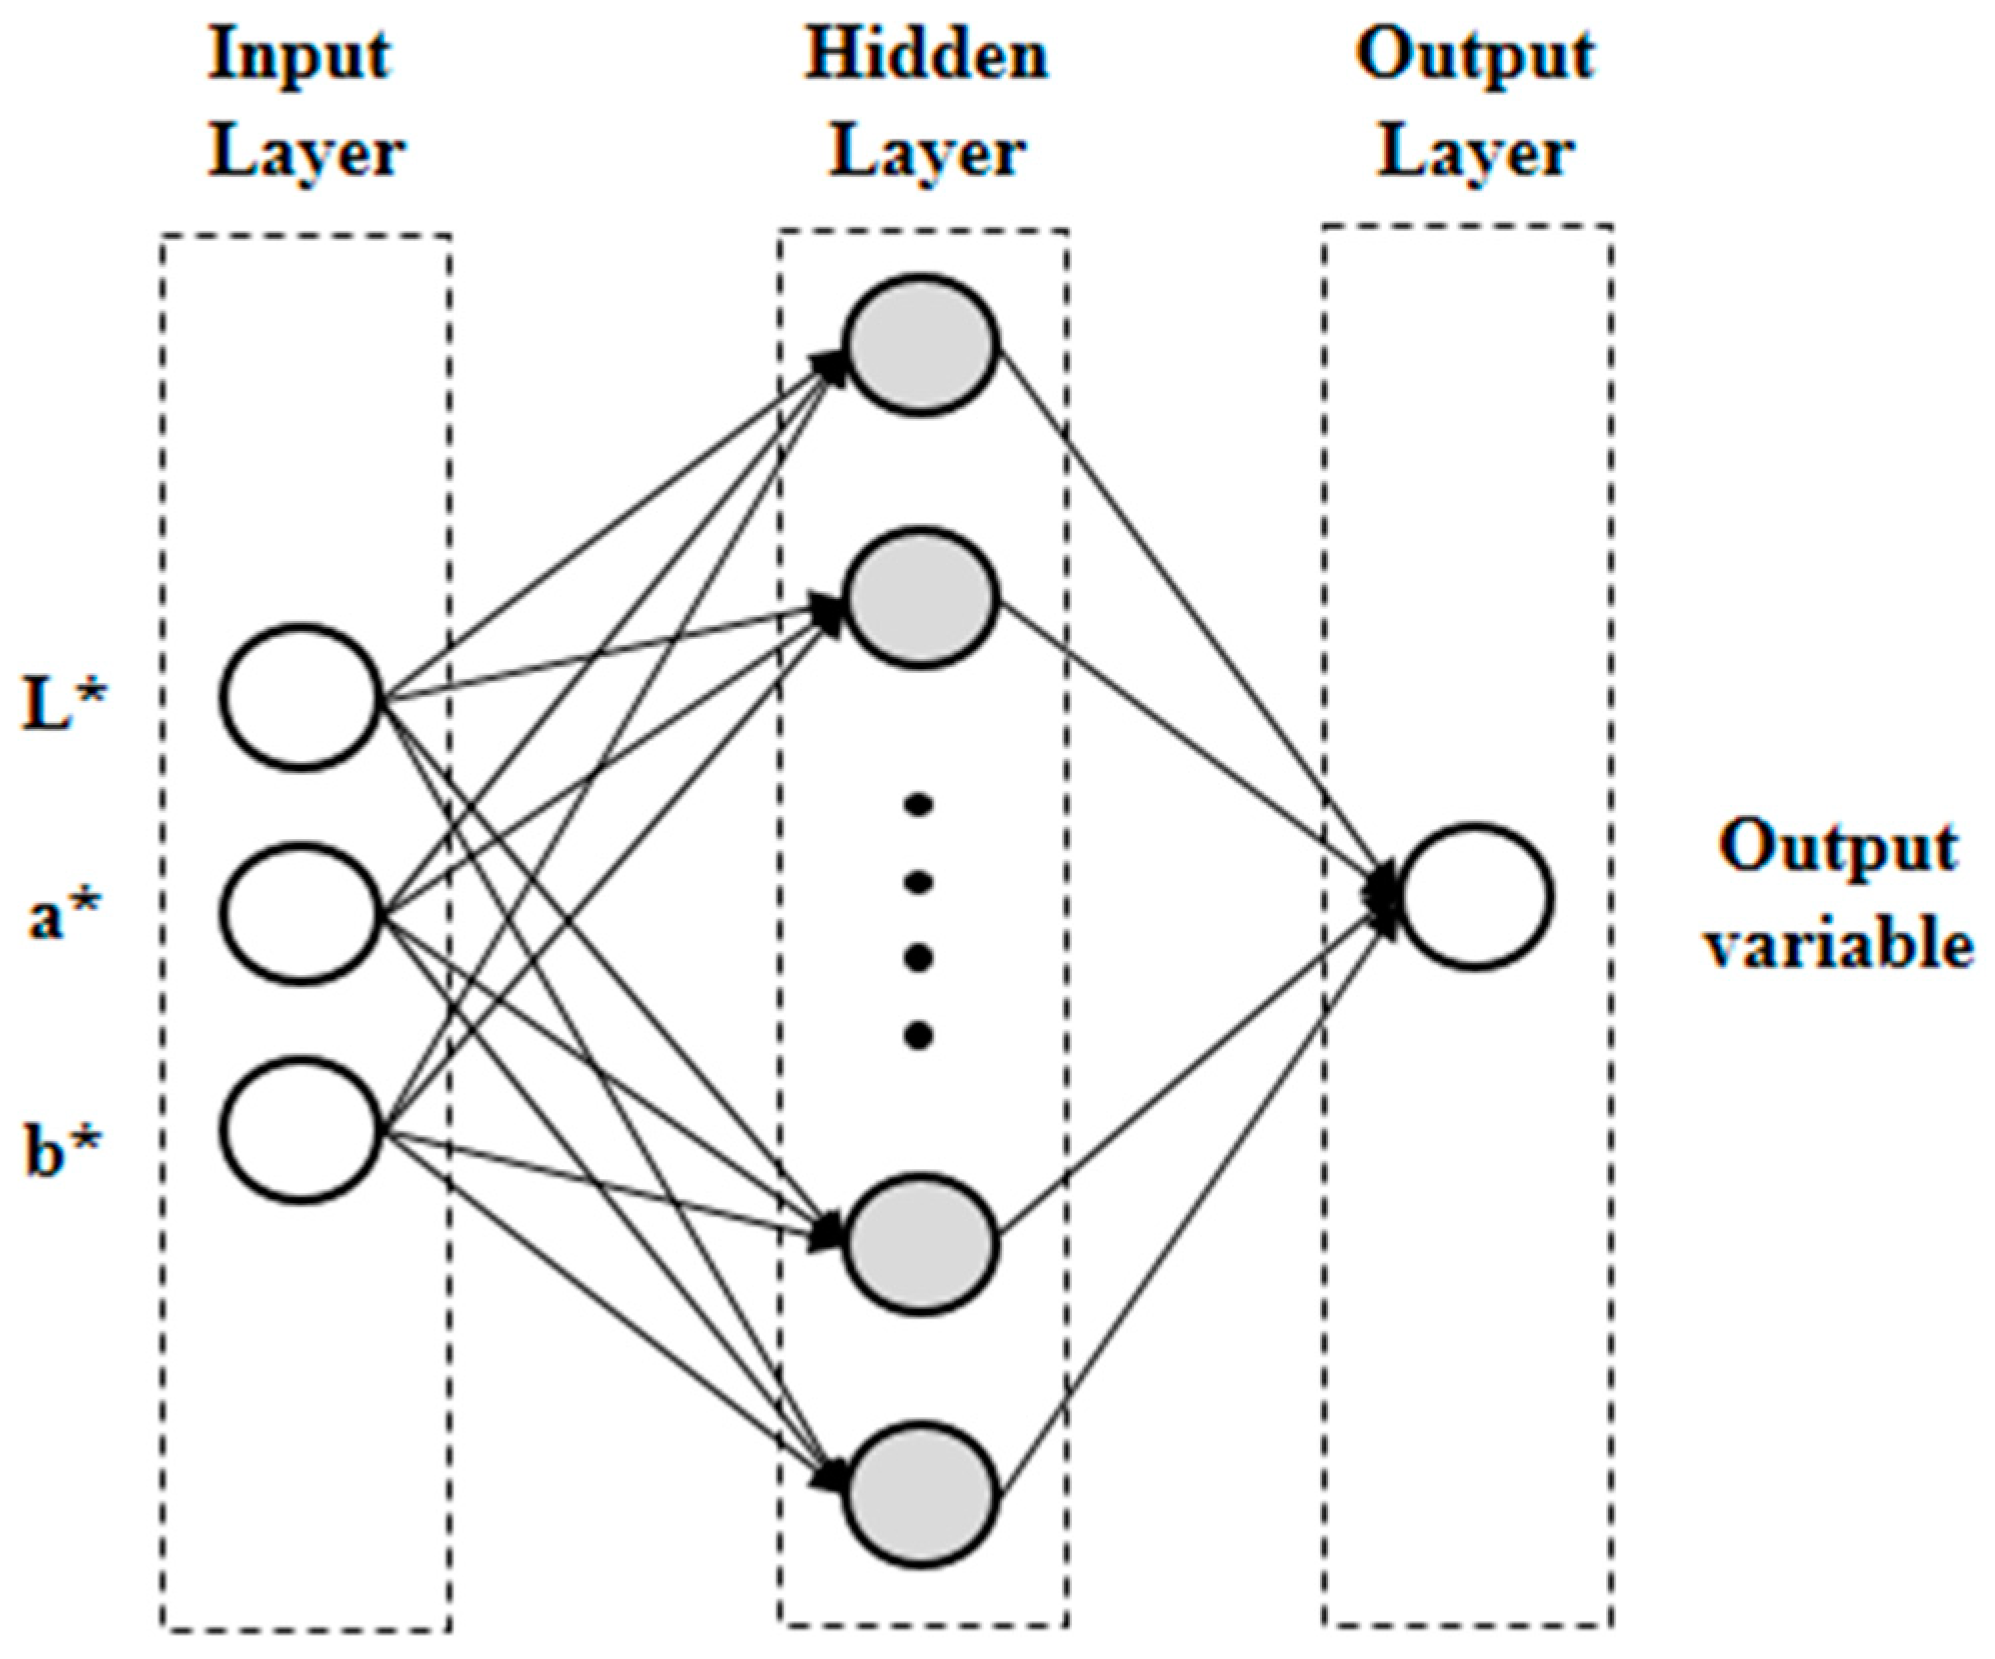
An artificial neural network (ANN) was used for predicting the quality attributes in strawberry fruit. A feed-forward architecture of ANN, known as multi-layered perceptron (MLP), with back propagation and training algorithms was employed to build predictive and non-linear models for the output variables (FF, TSS, TA, TPC, AA, TMA). It consists of one input layer with the neurons as independent variables (L*, a*, b*), one or more hidden layers, and one output layer for each output variable with the neurons as dependent variables (Figure 1).
In these feed-forward networks, error minimization is achieved by Levenberg–Marquardt algorithm which is an iterative algorithm used to train the dataset where the whole data were randomly split into training (80% of data) and testing groups (20% of data). The training set was used to train the network, whereas the test set was used to evaluate the performance of the network after training. During the training step, the neurons of the first level receive the input values, weighted individually, from external sources. The weights, associated with the connections between the neurons, were updated by learning rules to produce output values as close as possible to the target values. The number of artificial neurons or nodes equals the size of the input vector. All the input nodes send a signal to each hidden node as a weighted sum and are then subjected to the activation function. The same process also applied for the signal from the hidden layer to the output layer. The hidden (xi) and output (yi) neuron activities are defined as follows:
where f(νi) is the activation function applied in the hidden or output layers. In this study, whole architectures with hidden layers and four types of activation functions were assessed. The activation functions (identity function, logistic sigmoid function, hyperbolic tangent function and exponential function) are described in Equations (4)–(7):
νi is calculated as follows:
where m is the number of output layer neurons; wij is the weight between the i-th and j-th layers; bi is the bias of i-th neuron.
Different topologies with different neurons in the hidden layer (from 1 to 9) were tested, and the training process of the network was run 100,000 times with the random initial values of weights and biases. The best topology for each quality parameter was evaluated using prediction performance values.
The prediction performance of various ANN configurations for each output variable was assessed using four statistical metrics: the coefficient of determination (R2), the mean absolute error (MAE), the root mean squared error (RMSE), and the relative standard error (RSE). MAE, RMSE, and RSE are defined as follows:
where n = number of data; Oi = observed values; Pi = predicted values; is the mean of observed values. MAE is a measure of the average magnitude of error generated by the regression model. Values close to zero indicate an optimal prediction. RMSE represents the standard deviation of the residuals, and it can provide an estimate of how accurately the model predicts the response and how large the residuals are being dispersed. Lower values of RMSE indicate a better fit. RSE is the standard error expressed as a fraction of the estimate of a variable and as a percentage. RSE is particularly helpful where the confidence interval is quite large. In such a case, the reliability of the estimate would be suspect in the absence of additional information; however, if RSE does not exceed 30%, the estimate may still be considered reliable.
ANN was carried out by Statistica statistical package software (Stat Soft Inc., Tulsa, OK, USA).
3. Results and Discussion
3.1. Exploratory Analysis by Cultivars
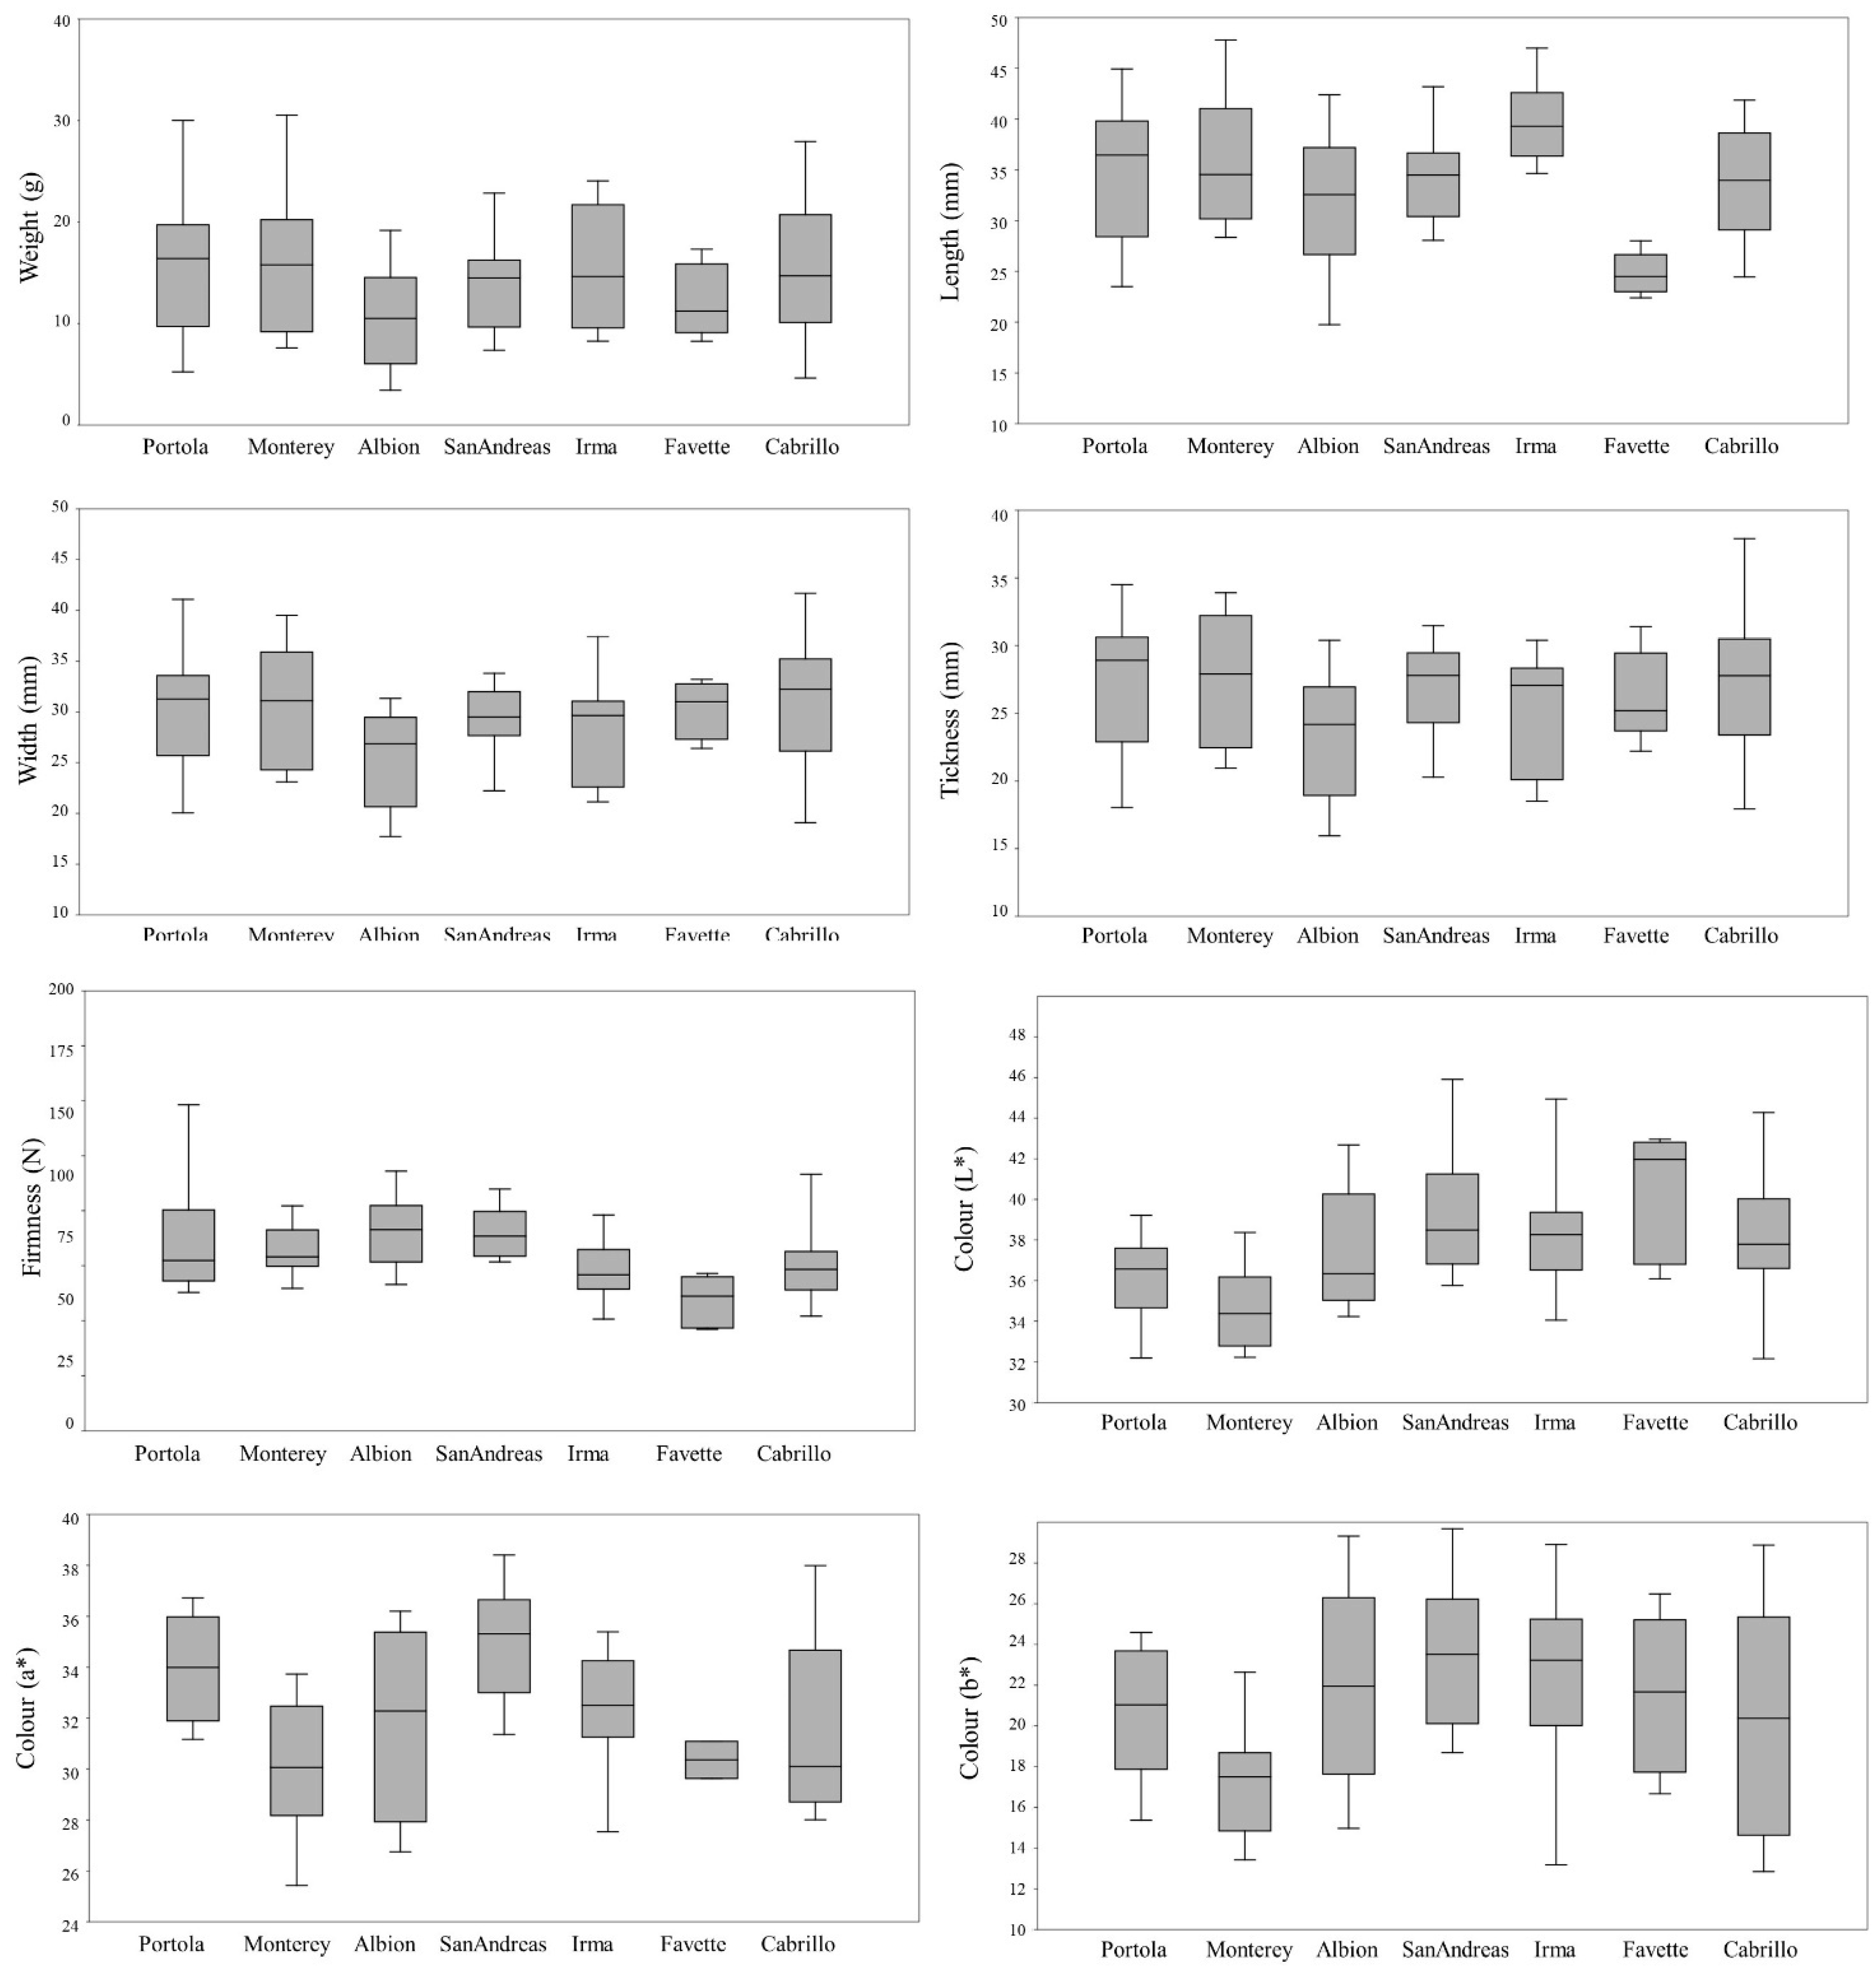
High variability among the seven investigated strawberry cultivars for pomological traits (i.e., weight, length (L), width (W), thickness (T), firmness, and CIELab color coordinates) means values were observed (Figure 2) during the three harvest times.
In detail, the weight values varied from 3.4 to 30.1 g measured in Albion and Monterey, respectively. Albion and Monterey, characterized by the lowest and highest weight, denote the lowest and greatest values of length, width, and thickness (L: 19.8 mm and 47.8 mm; W: 17.7 mm and 41.7 mm; and T: 15.9 mm and 37.9 mm; respectively). The shape index calculated from the L and W ratio ranged from approximately 0.74 to 1.84 (Favette and Irma, respectively). Fruit color coordinates showed high variability among the cultivars (L* ranged from 32.16 (Portola) to 45.91 (San Andreas), a* from 25.43 (Monterey) to 38.41 (San Andreas), b* from 12.85 (Cabrillo) to 29.68 (San Andreas)) (Figure 2). Similar physical traits’ variability among the cultivars was reported by other authors [37,38,39,40], but a comparison of these seven cultivars was not available in the literature data.
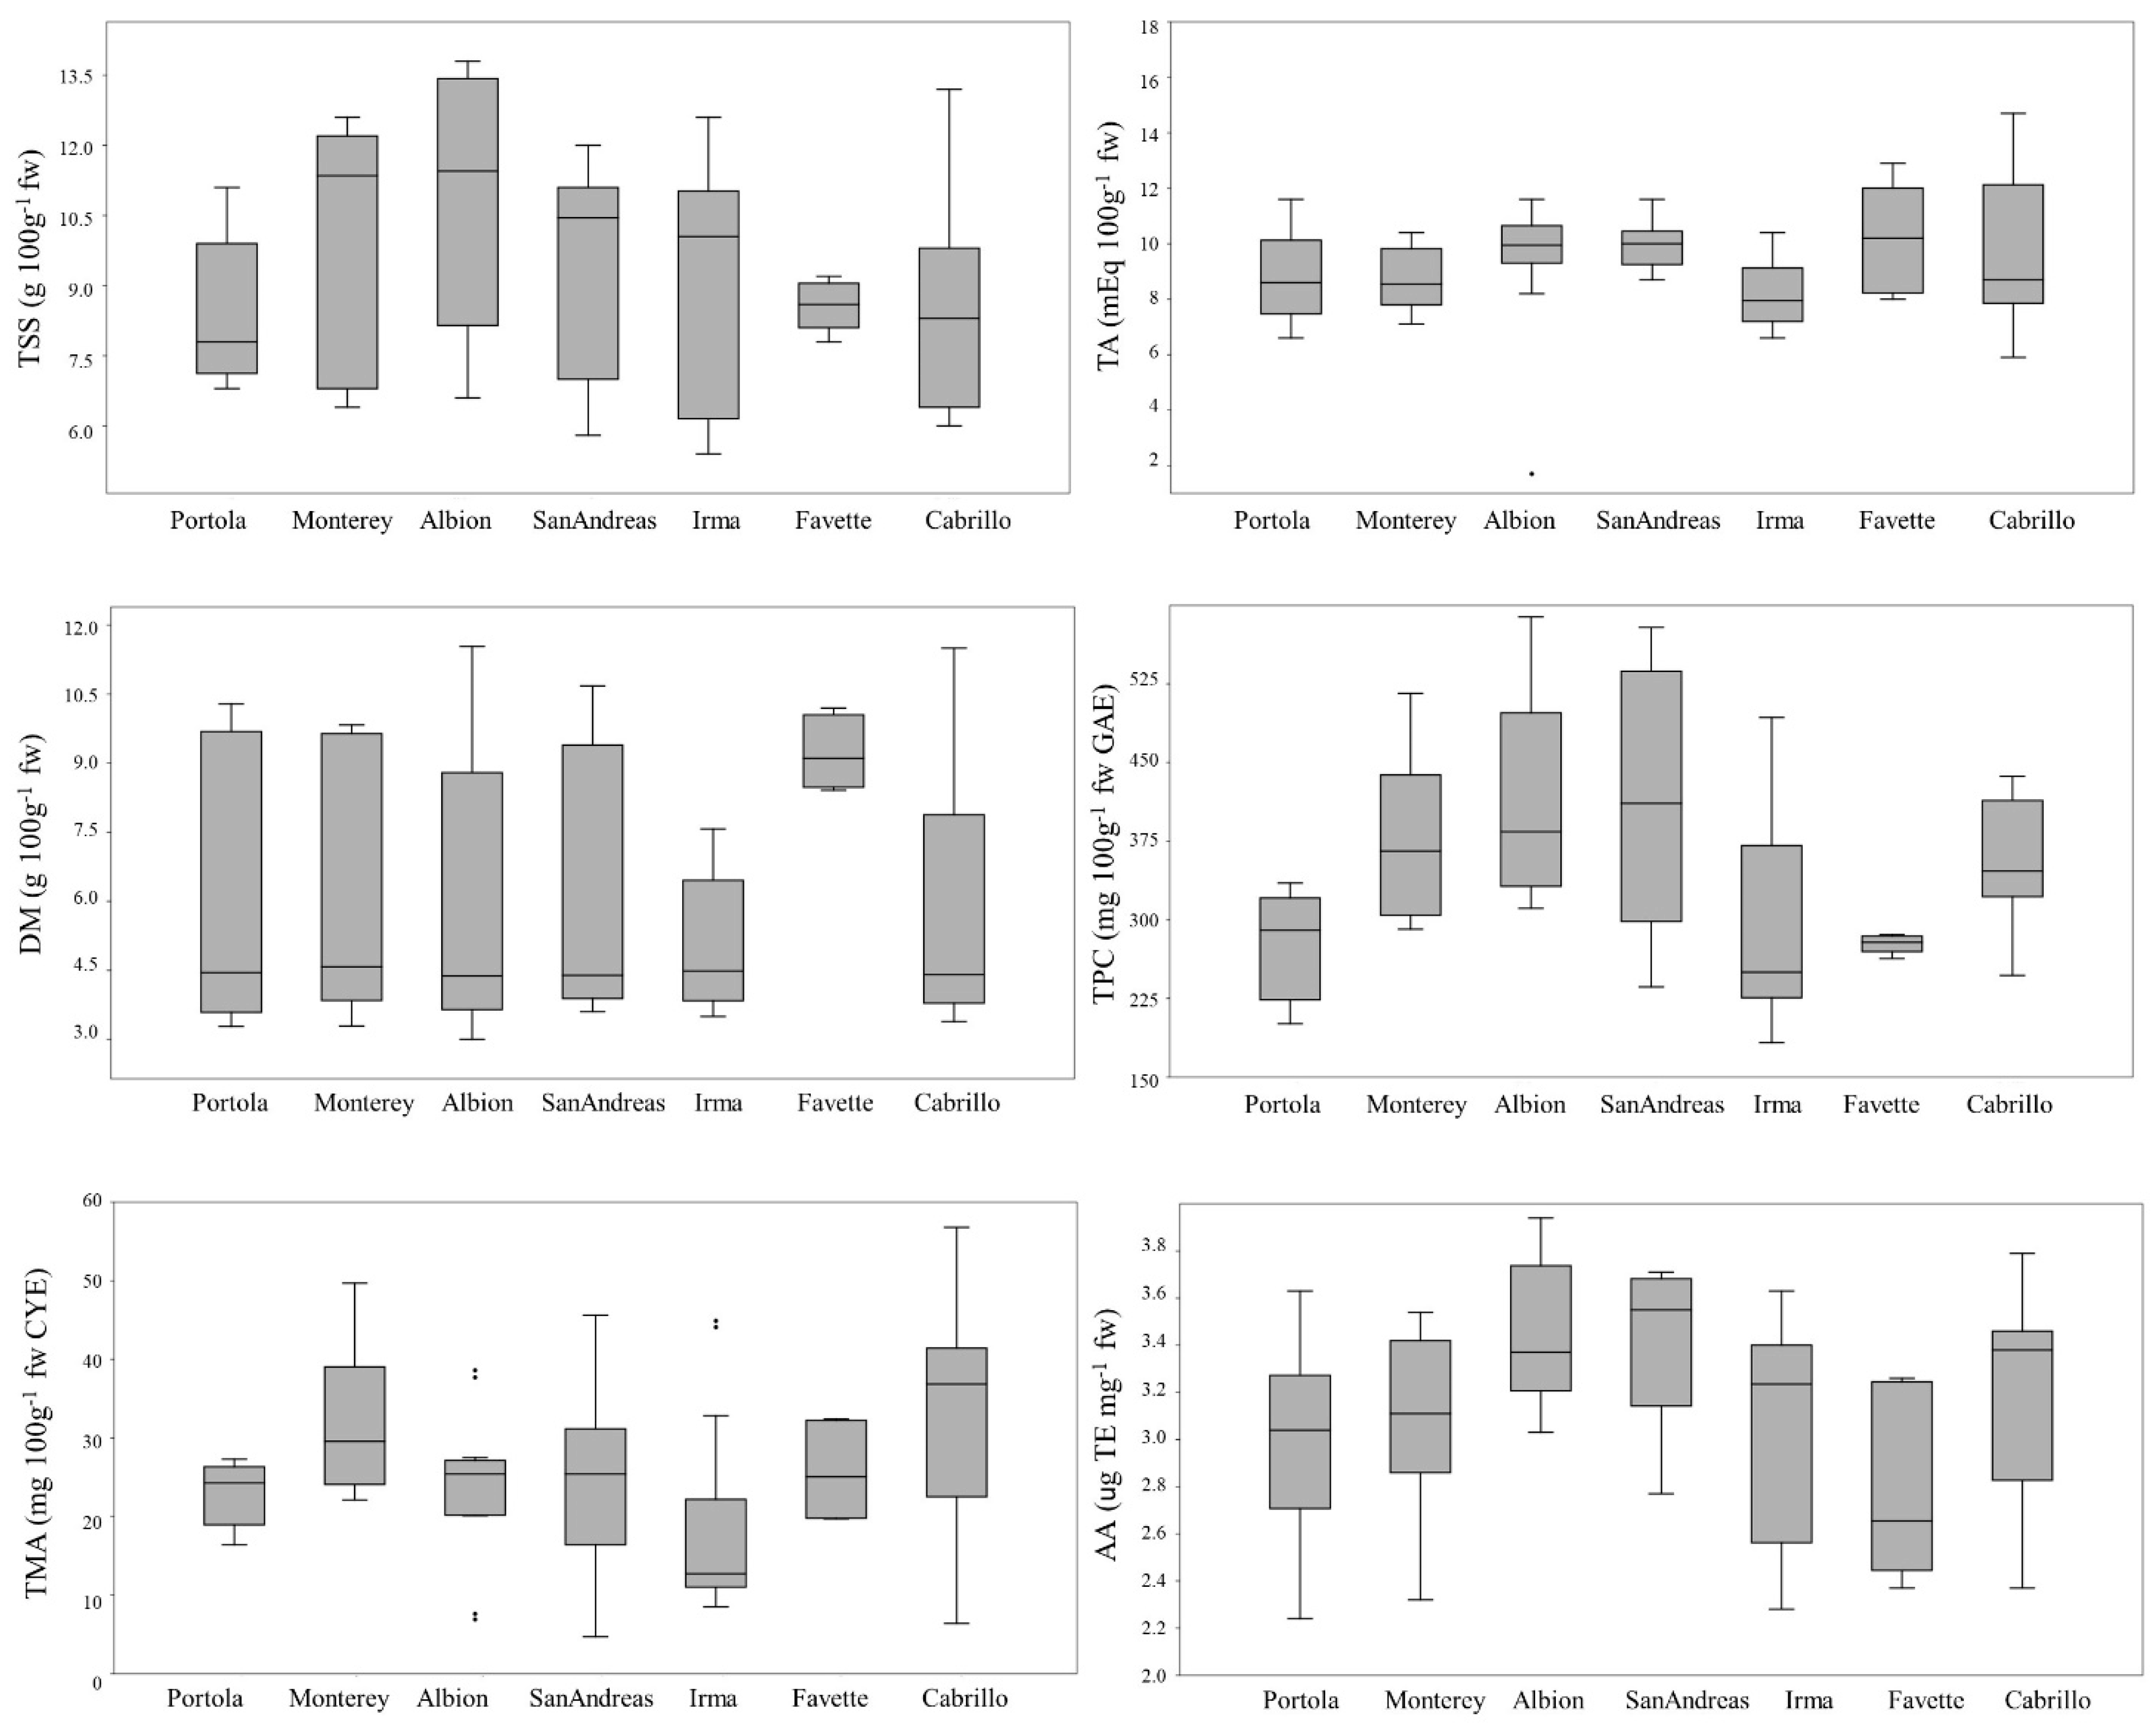
Chemical parameters’ distributions for the different cultivars and harvest times are shown in Figure 3. As regards the total soluble substance, the values ranged from 5.4 ± 0.1 g 100 g−1 FW (Irma) to 13.8 ± 0.2 g 100 g−1 FW (Albion). On average, Albion showed the highest values (11.1 ± 2.7 g 100 g−1 FW), whereas the lowest mean value was recorded by Cabrillo (8.5 ± 2.0 g 100 g−1 FW). In contrast to TSS, the titratable acidity showed less variability both between cultivars and between harvest times (Figure 3).
Favette presented the highest mean TA values (10.2 ± 2.1 mEq 100 g−1 FW), whereas Irma, Portola and Monterey presented the lowest ones (8.2 ± 1.2, 8.6 ± 1.5, 8.7 ± 0.9 mEq 100 g−1 FW, respectively). The highest TA variability among the different harvest times was observed in Cabrillo: values ranged from 7.2 ± 0.9 to 13.2 ± 1.3 mEq 100 g−1 FW. All cultivars showed similar dry matter values, ranging from approximately 3.0 to 11 g 100 g−1 FW, except for Favette (DM 9.2 ± 0.8 g 100 g−1 FW).
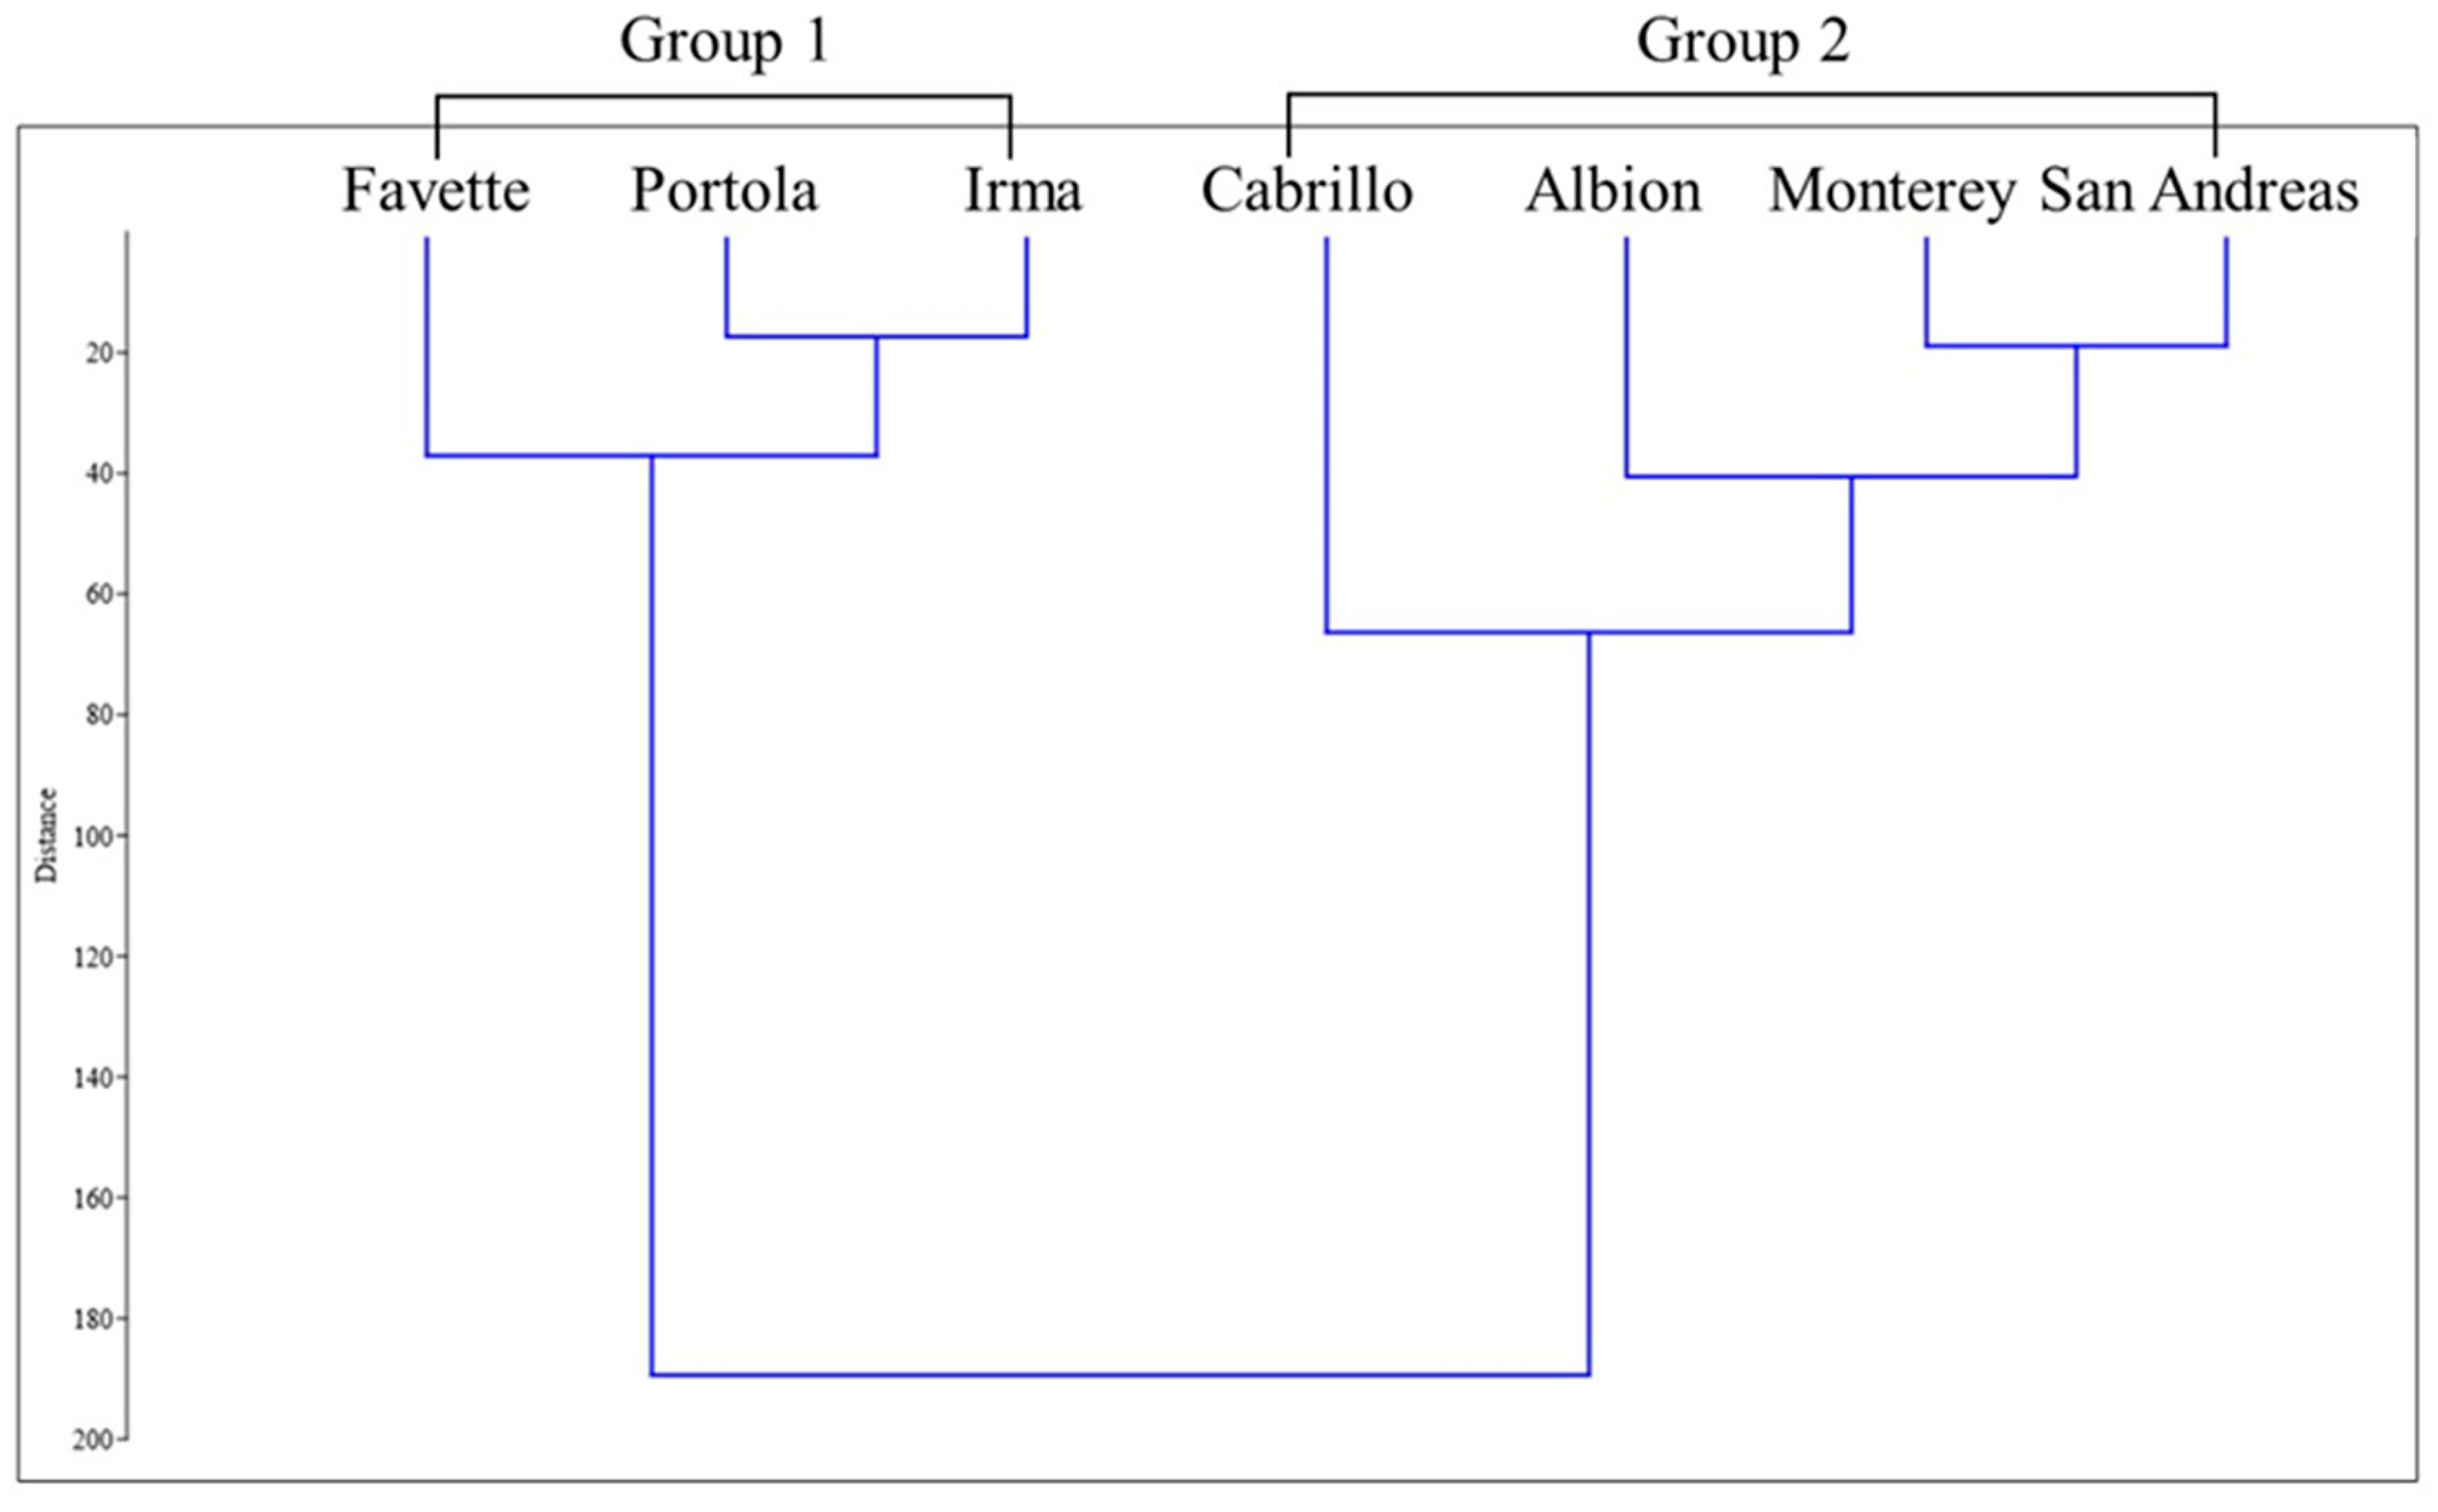
Similar trends for TSS and TA were reported by Cocco et al. [41]. These authors reported a significant effect of differing environmental conditions and field management practices specific to the trial site (plant type, planting date, harvest time, cultural technique) on TSS and TA fruits quality traits. The study of TTS and TA ratio variability in relation to the cultivars or different harvest times is very important because it is considered a better index for fruit consumer acceptability, as well reported by Crisosto et al. [42] for cherries. A high variability of TPC was observed (Figure 3). Irma and Portola showed the minimum values (203 ± 51 and 207 ± 38 mg GAE 100 g−1 FW, respectively), whereas Albion and San Andreas showed the highest ones (550 and 530 mg GAE 100 g−1 FW, respectively). Moreover, the harvest time strongly influenced the total phenolic content of all cultivars, except for Favette, which was only harvested once. Regarding the TMA, the highest mean values were registered for Cabrillo and Monterey (32 ± 10 and 36 ± 12 mg CGE 100 g−1 FW, respectively), while Irma registered the lowest one (24 ± 12 mg CGE 100 g−1 FW). Furthermore, Cabrillo showed simultaneously the highest TMA values and the greatest variability for this parameter among the different harvest periods (48 ± 9, 27 ± 16, and 26 ± 8 mg CGE 100 g−1 FW for spring, summer, and autumn, respectively). Phenolic compounds’ monitoring, in relation to the effects of environmental and genetic conditions, is important to global fruits quality evaluation because, if present in high concentrations, could contribute to astringency in the fruits’ taste [43]. As regards AA, it showed the maximum value (3.5 ± 0.3 µg TE mg−1 FW), whereas the minimum was revealed in Favette and Portola (2.8 ± 0.4 and 2.9 ± 0.4 µg TE mg−1 FW, respectively). The seven investigated cultivars showed a trend for the total phenolic content, antioxidant activity, and total anthocyanins content in agreement with those reported by other authors [41,44,45,46,47]. Hierarchical clustering analysis was used to investigate whether relatively homogenous groups of strawberry cultivars could be classified in relation to the nutritional traits using chemical parameters (SSC, TA, DM TPC, TAC and AA). Cultivars are connected in different ways, which show the existence of numerous hierarchical levels. In particular, cluster analysis identified two main clusters, each of which was split off into two distinct sub-clusters which constituted the first group (group 1) and into three sub clusters which constituted the second group (group 2) (Figure 4).
In detail, Favette (located in a separate sub-cluster), Portola and Irma (located in the same sub-cluster) were in the first group. The separation of the samples of these cultivars with respect to the other was probably due to the similar low mean values of TPC and AA (>300 mg GAE 100 g−1 FW, and >3 µg TE mg−1 FW, respectively). Moreover, Favette was discriminated in a sub-cluster probably due to the highest amount of TA (10 ± 1 mEq 100 g−1 FW) and TMA (26 ± 6 mg CGE 100 g−1 FW). The similar discrimination of cultivars in relation to the chemical characteristics was also reported by Ceccarelli et al. [35] in a previous work on cherry. The second group was characterized by Cabrillo, Albion, Monterey, and San Andreas. Cabrillo and Albion were divided in two distinct sub-clusters, whereas Monterey and San Andreas into another sub-cluster. Monterey and San Andreas, and then Albion, were probably placed as neighbors due to the genetic similarity between them (Monterey = Albion × Cal 97.85-6 and San Andreas = Albion × Cal 97.86-1) and due their similar TSS and DM values. These last two parameters also led cluster aggregation for currant berry, as described by Pluta et al. [48] and Mądry et al. [49].
3.2. Exploratory Analysis by Harvest Time
The pomological and chemical parameters’ variability due to the different harvest times is reported in Table 2.
In general, the mean values of three harvest times show significant differences except for the L* coordinate, FF, TA, TPC, and TMA. In previous studies, some authors [41,44,50] reported a significant influence of growing conditions on strawberry growth performance, yield, and quality in partial agreement with our results. In particular, the insignificant differences observed among the harvest times could be due to the high variability of these parameters related to the genetic characteristic of the investigated cultivars. As regards FF pomological traits, similarity is due to the same maturation grade of the fruits, needful for the comparison of the cultivars.
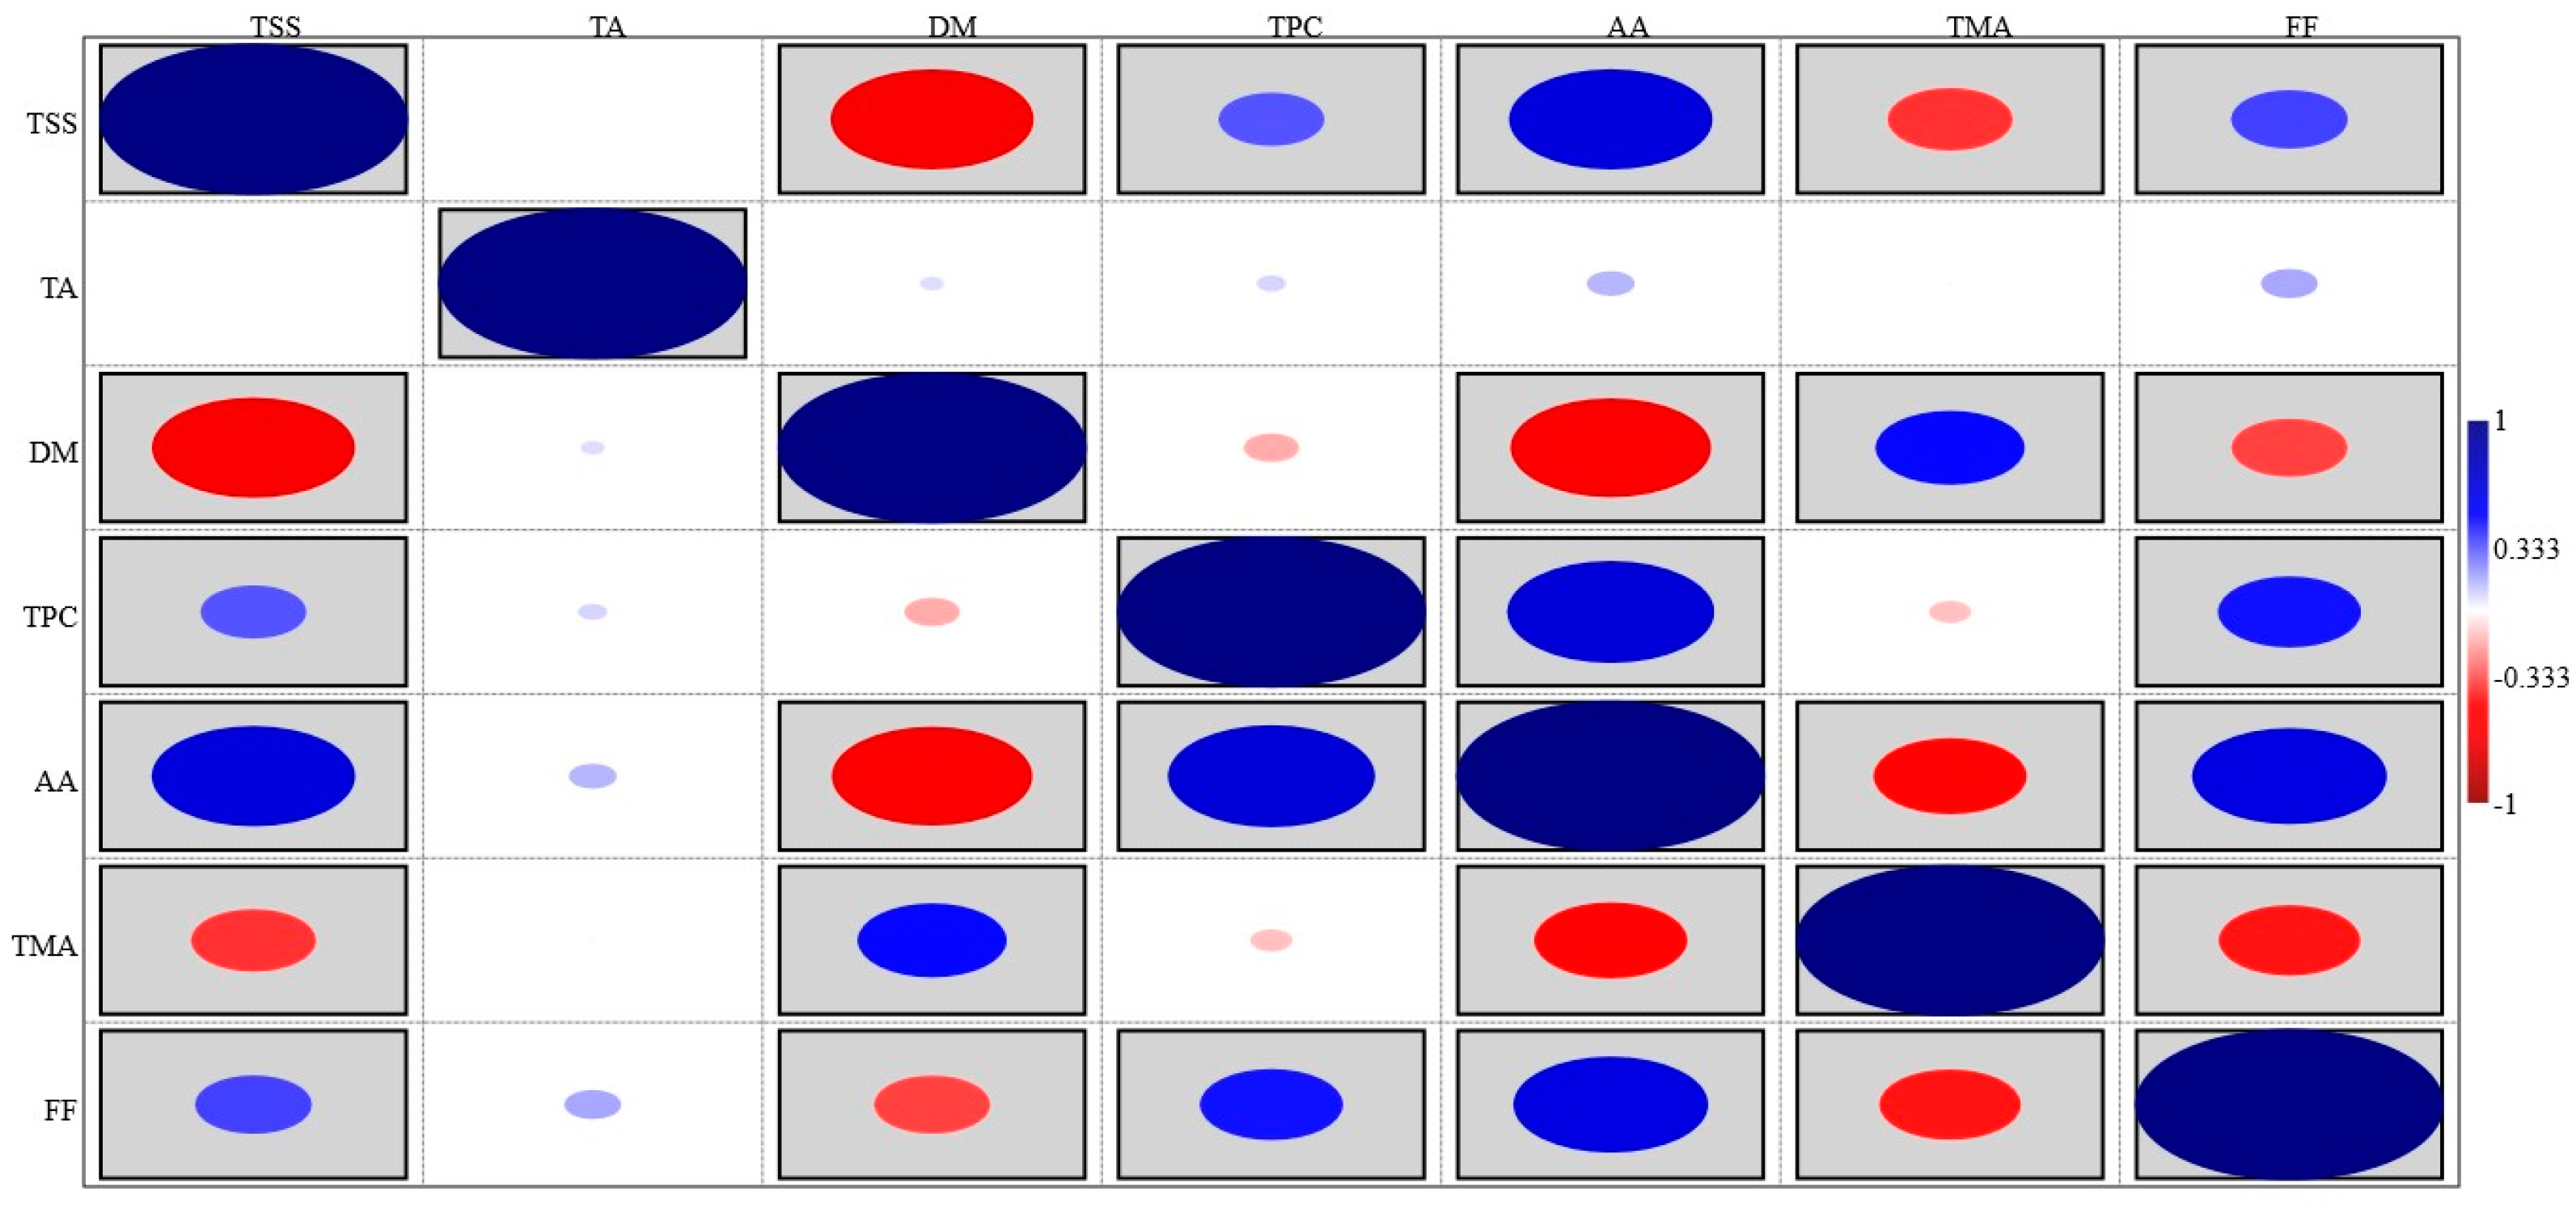
Pair correlations among the variables were also investigated using the color correlation graph (Figure 5). The size and the circle’s color depend on the correlation coefficient R. Blue indicates a positive correlation, whereas red indicates a negative correlation. Furthermore, the larger the circle, the greater the correlation. Figure 5 shows that TSS was significantly correlated with DM (R = −0.653; p ≤ 0.001), TPC (R = 0.335; p ≤ 0.001), TMA (R = −0.397; p ≤ 0.001), AA (R = 0.650; p ≤ 0.001), and FF (r −0.40; p ≤ 0.001), while no correlations were found among TA and all the parameters. Moreover, significant correlations were also found between DM and FF (R = −0.368; p ≤ 0.001), DM and TMA (R = 0.591; p ≤ 0.001), DM and AA (R = −0.645; p ≤ 0.001), TPC and AA (R = 0.125; p ≤ 0.001), TPC and FF (R = 0.456; p ≤ 0.001), TMA and AA (R = −0.489; p ≤ 0.001), TMA and FF (R = −0.451; p ≤ 0.001), and FF and AA (R = 0.626; p ≤ 0.001). As expected, most parameters were correlated with one another, as previously reported by Amoriello et al. [17]. On the contrary, Zitouni et al. [51] reported no correlations between the TPC and TMA or the TPC and AA. These differences could be explained by the different plant material used and by the size of the samples groups.
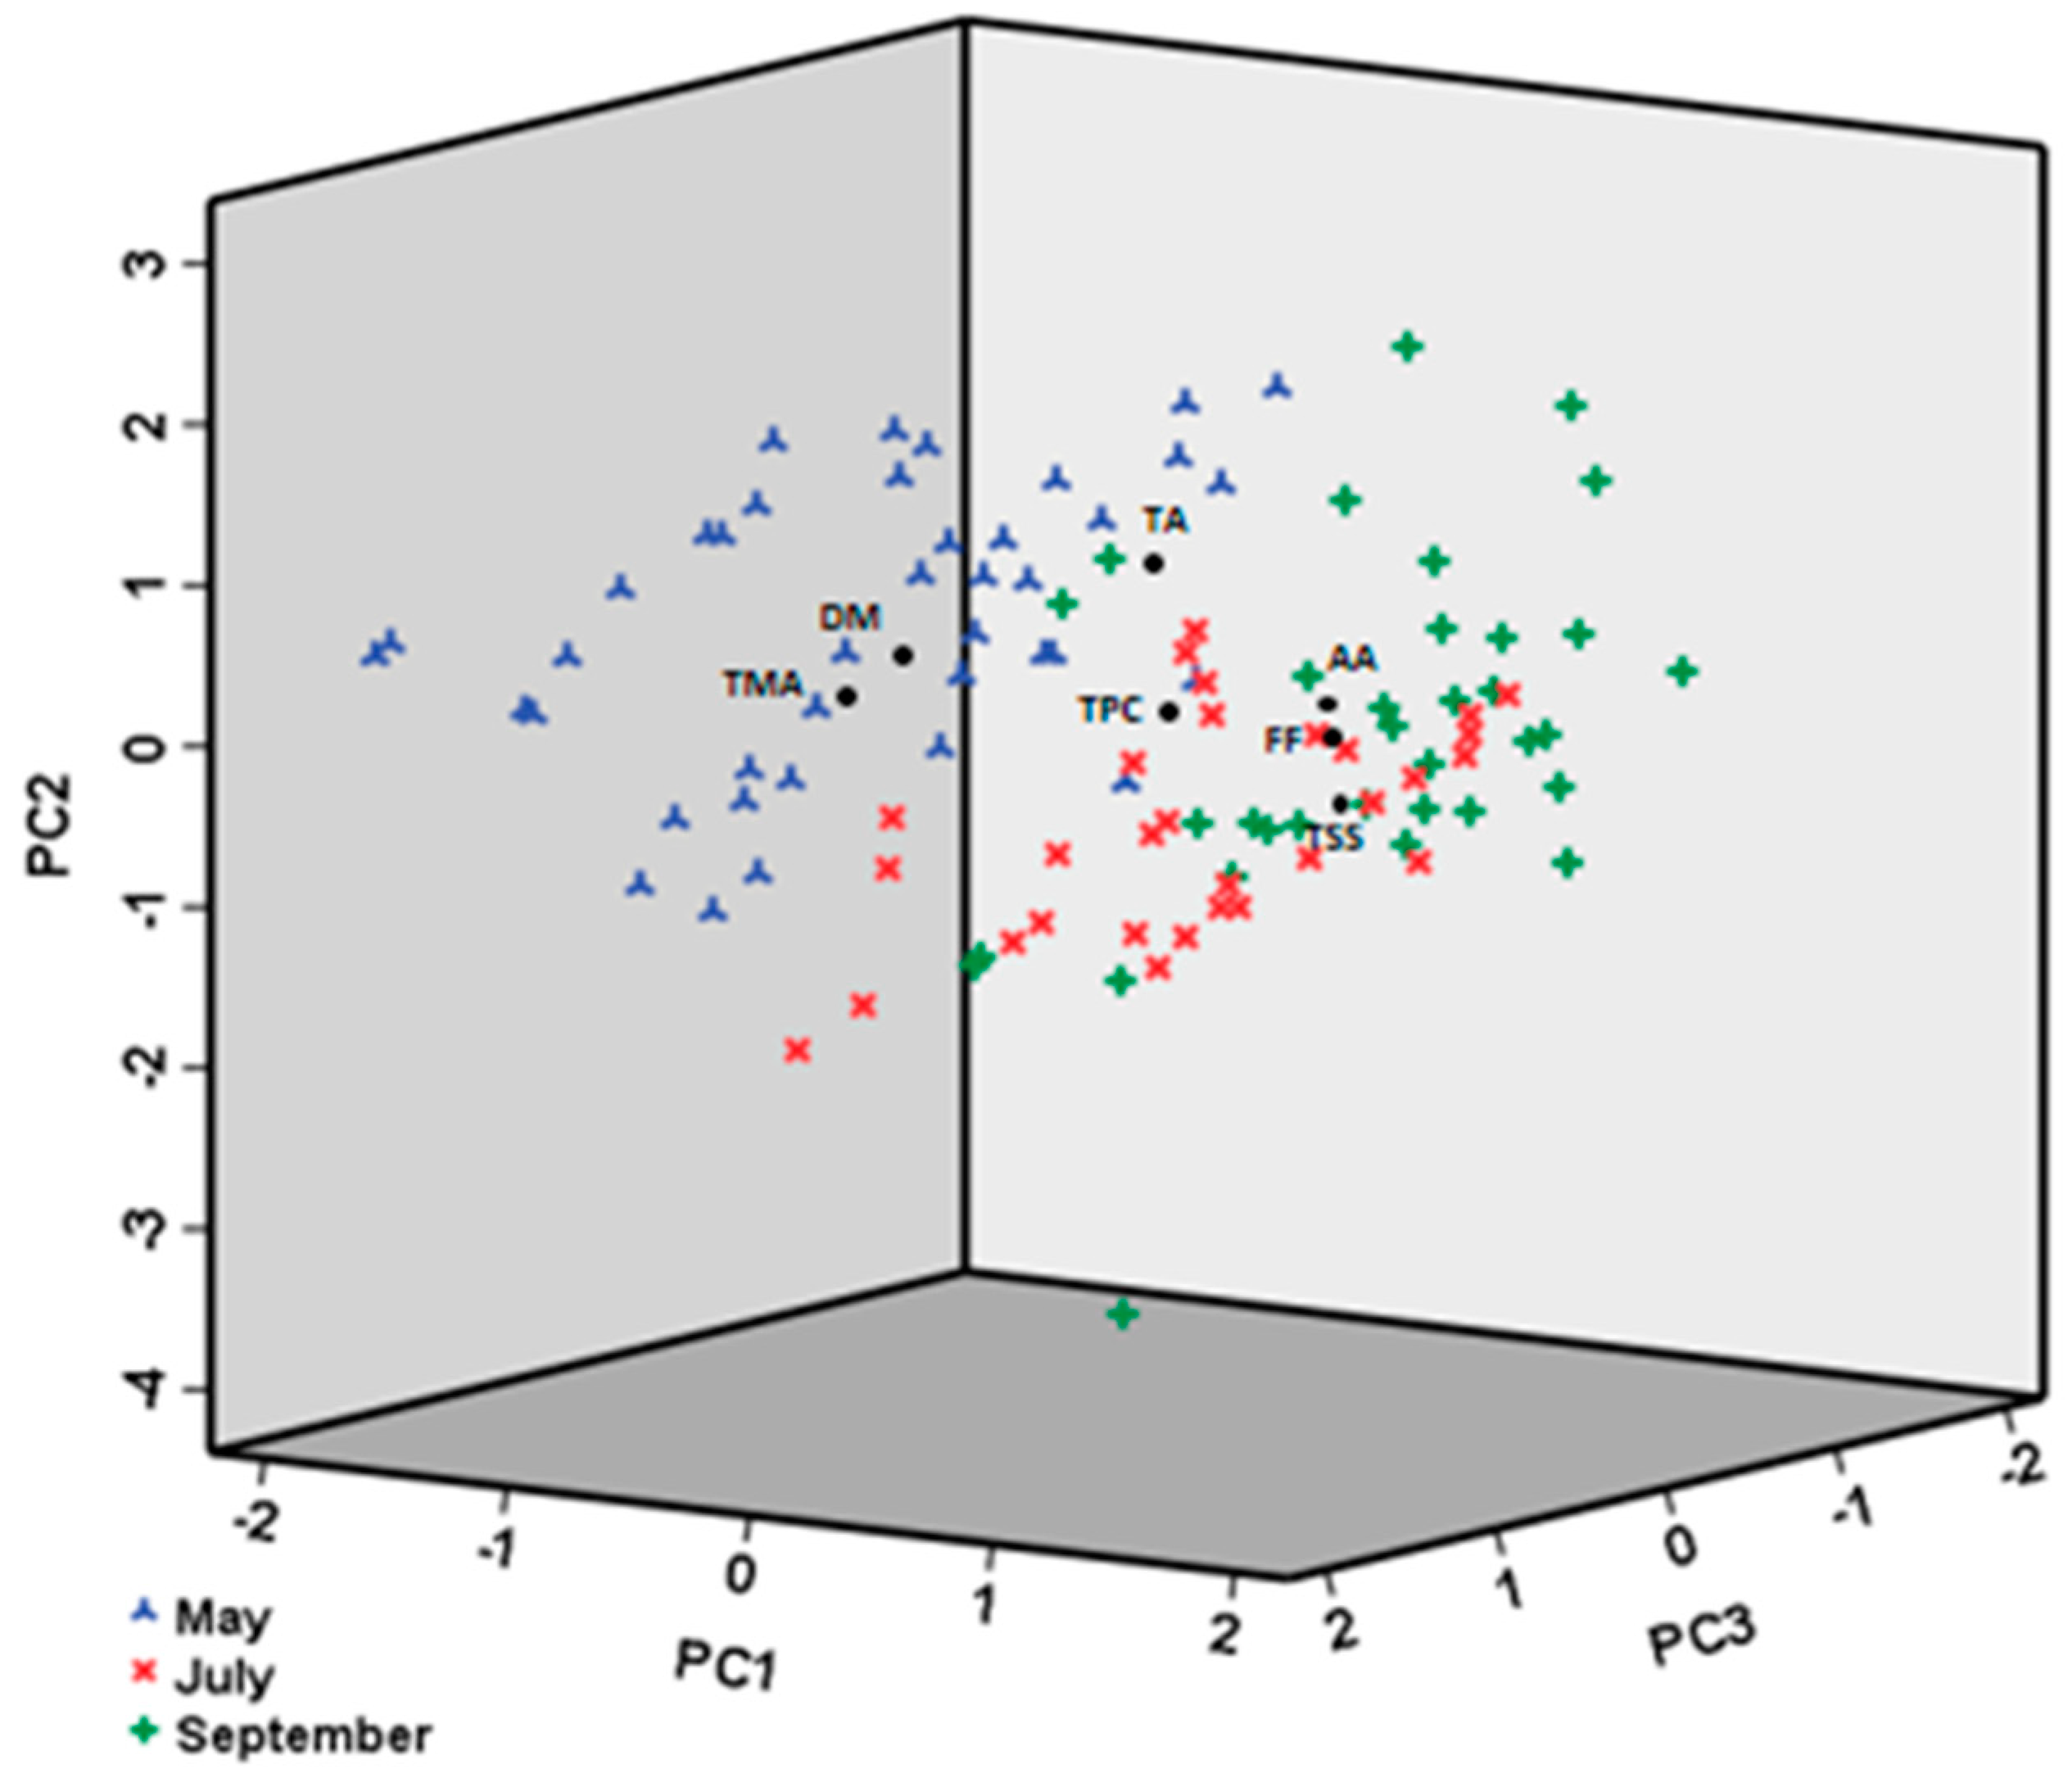
Figure 6 and Table 3 show the results of the PCA performed on the means of the TA, SSC, DM, FF, AA, TPC, and TMA values to visualize the samples distribution considering the three successive harvests (in May, July, and September) referred to three different seasonal periods (spring, summer, and autumn).
The first three factors (PCi) explained 77.34% of the total variance. PC1 accounted for 48.97% of explained variance, PC1 for 16.71%, and PC3 for 11.66% (Table 3). Analyzing the correlation coefficients, PC1 mostly described the strawberry qualitative aspects: AA, TSS, FF, and TPC showed a considerable and positive weight on PC1, whereas DM and TMA showed a negative weight. TA directly influenced PC2. Finally, PC3 was positively correlated with TPC and TMA.
The PCA plot (Figure 6) shows that the three factors adequately separated the strawberry samples harvested in May from the others, whereas the distance of measures for samples harvested in July or September was less visible but equally significant. This can be partially attributed to the different climatic conditions which occurred during the three different harvest times. As well known, the fruit quality traits are strongly influenced by climatic conditions. In a previously study, Intrigliolo and Castel [52] and Maatallah et al. [53] reported that water stress at the final stages of growth of plum fruits significantly decreased fruit size, but accelerated the fruit maturation and level of TSS and TA. Moreover, higher precipitation was found to be linked with varieties with higher TPC values [54]. Solovchenko and Schmitz-Eiberger [55] also described that the antioxidants biosynthesis depended on the temperature and spectral properties of light. Furthermore, Bartolini et al. [56] found change in antioxidant properties of apricot fruits in relation to weather conditions. The PCA plot also highlighted the different behavior of the samples in comparison with group’s memberships. Strawberries harvested in May are characterized by very high values of TMA and DM, whereas those in July and September are characterized by very high values of FF, TSS, and AA. Furthermore, samples of the second harvest clearly showed the lowest TA values.
3.3. Prediction of Strawberries Quality Attributes
In order to predict the strawberry quality attributes (FF, TSS, TA, TPC, AA, and TMA), multiple linear regression (MLR) models were considered using the CIELab color space coordinates (L*, a*, and b*) as input variables. The MLR equations are as follows:
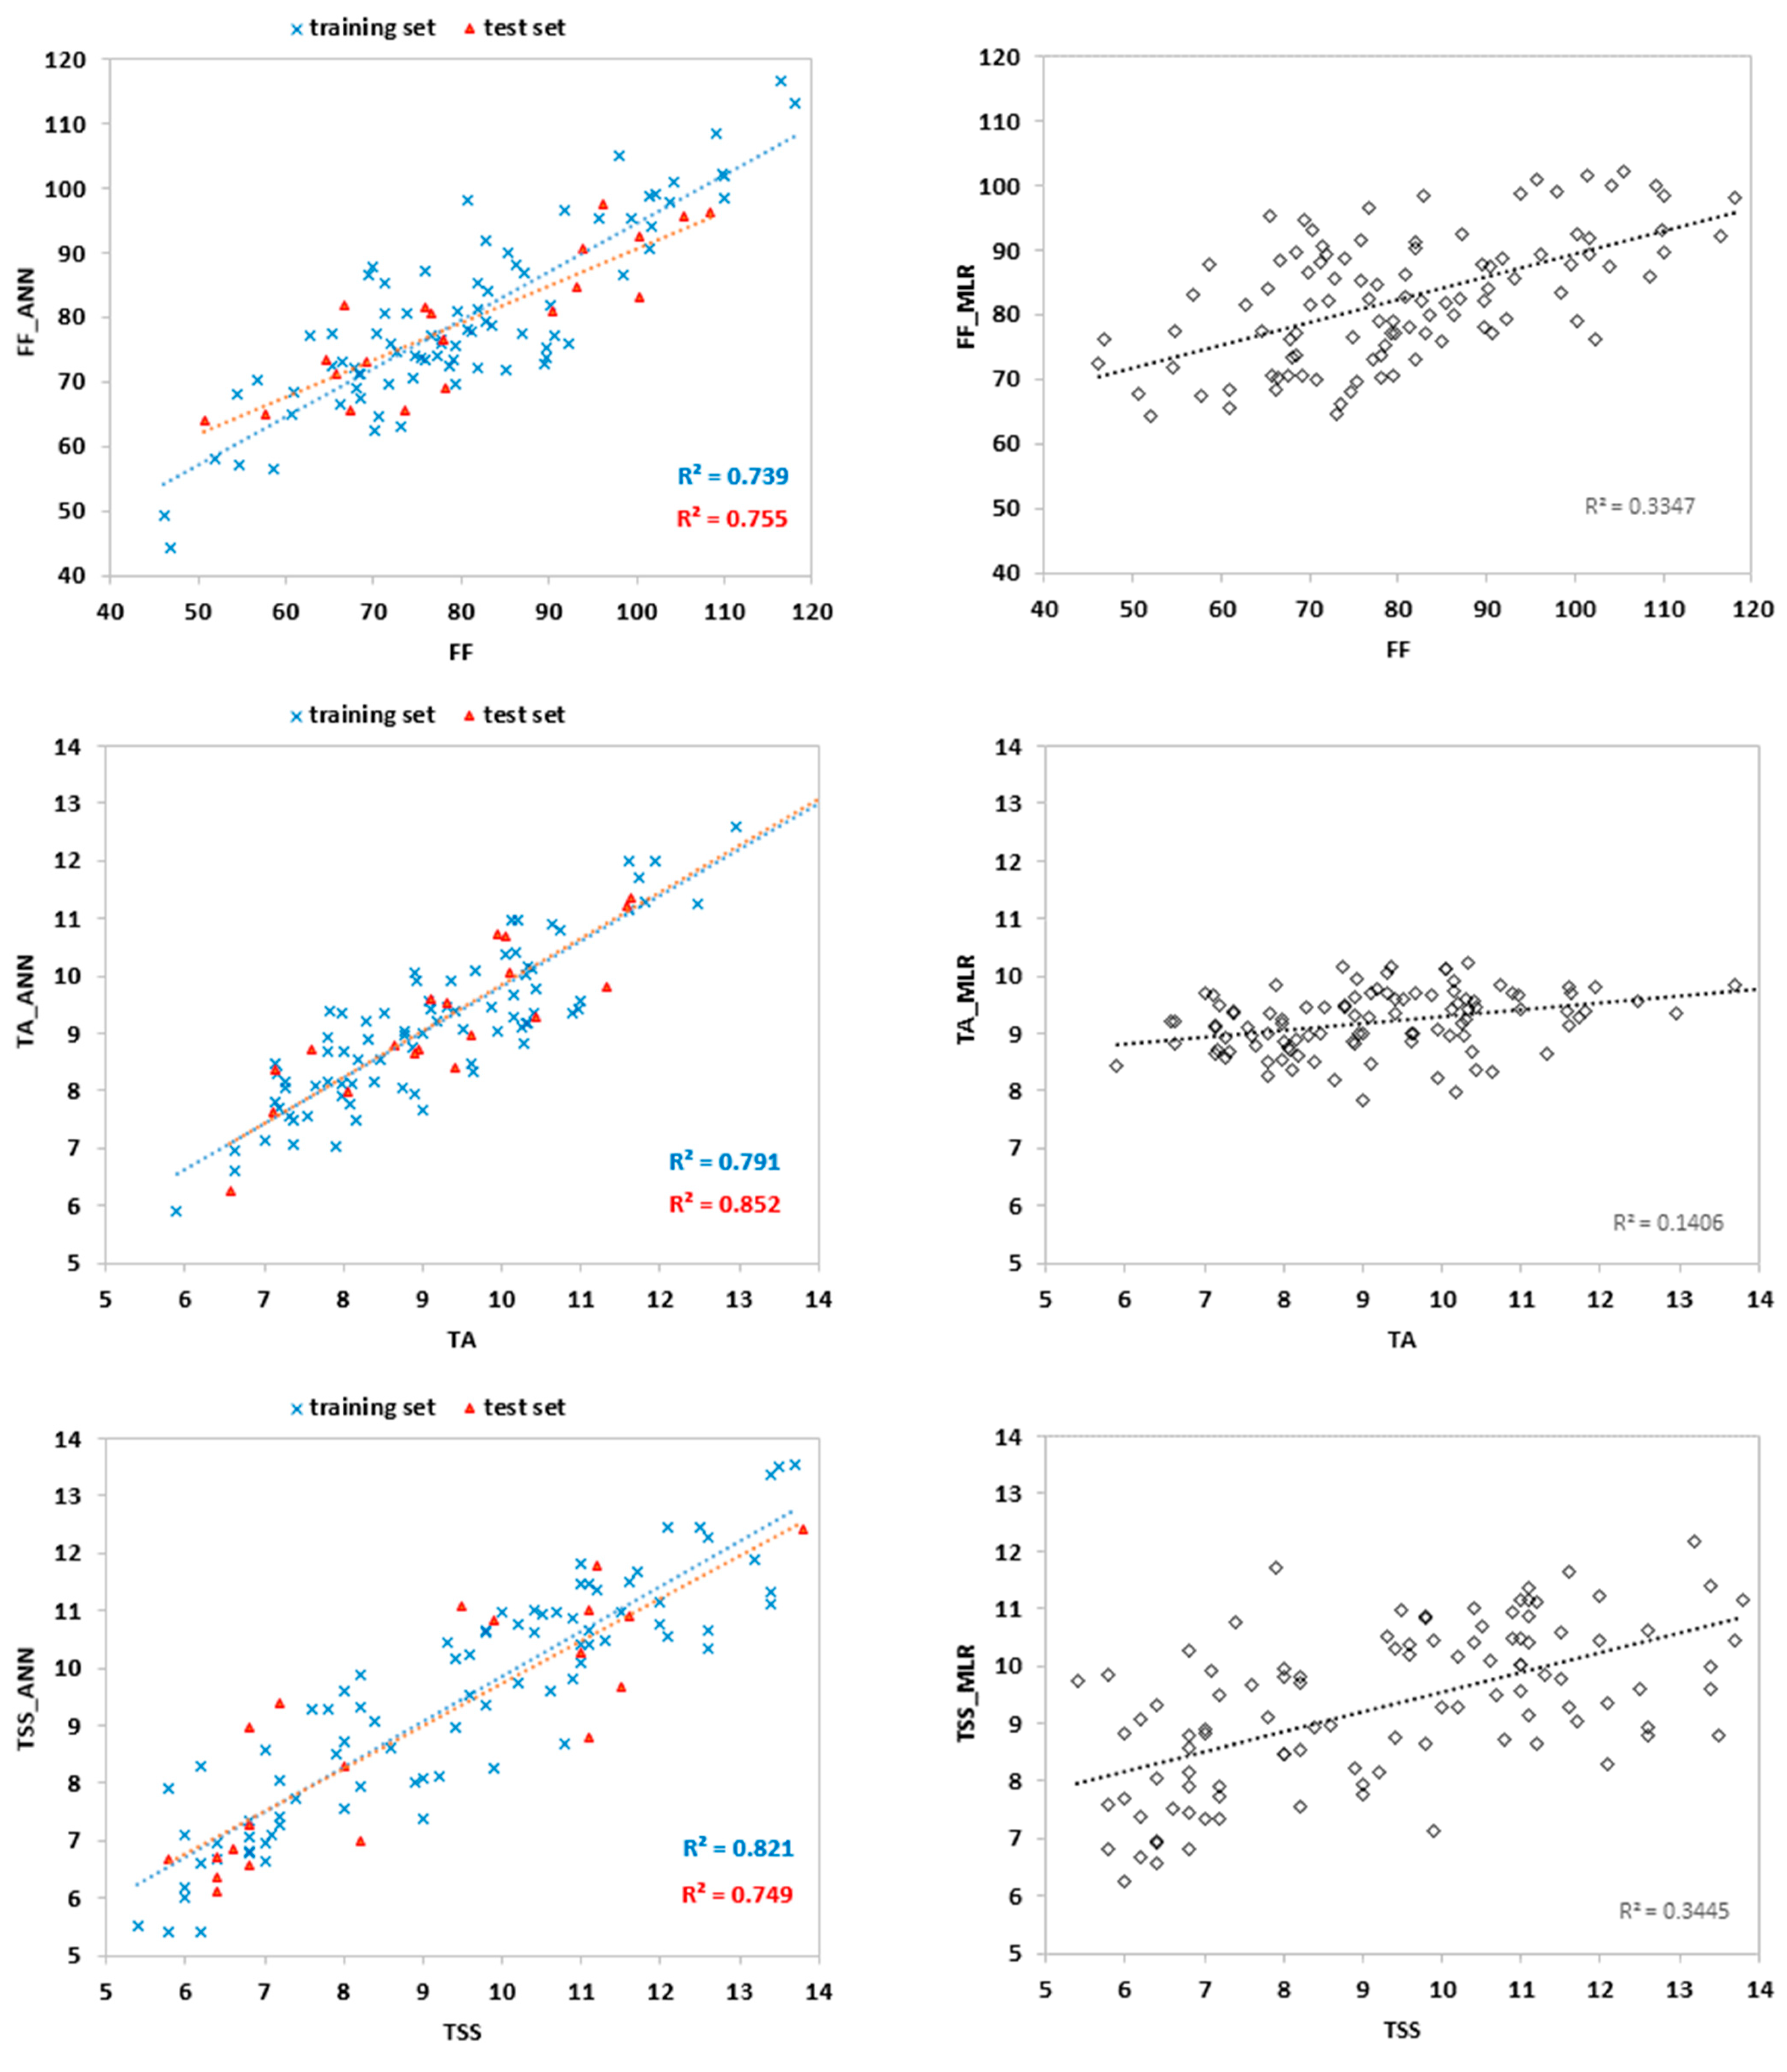
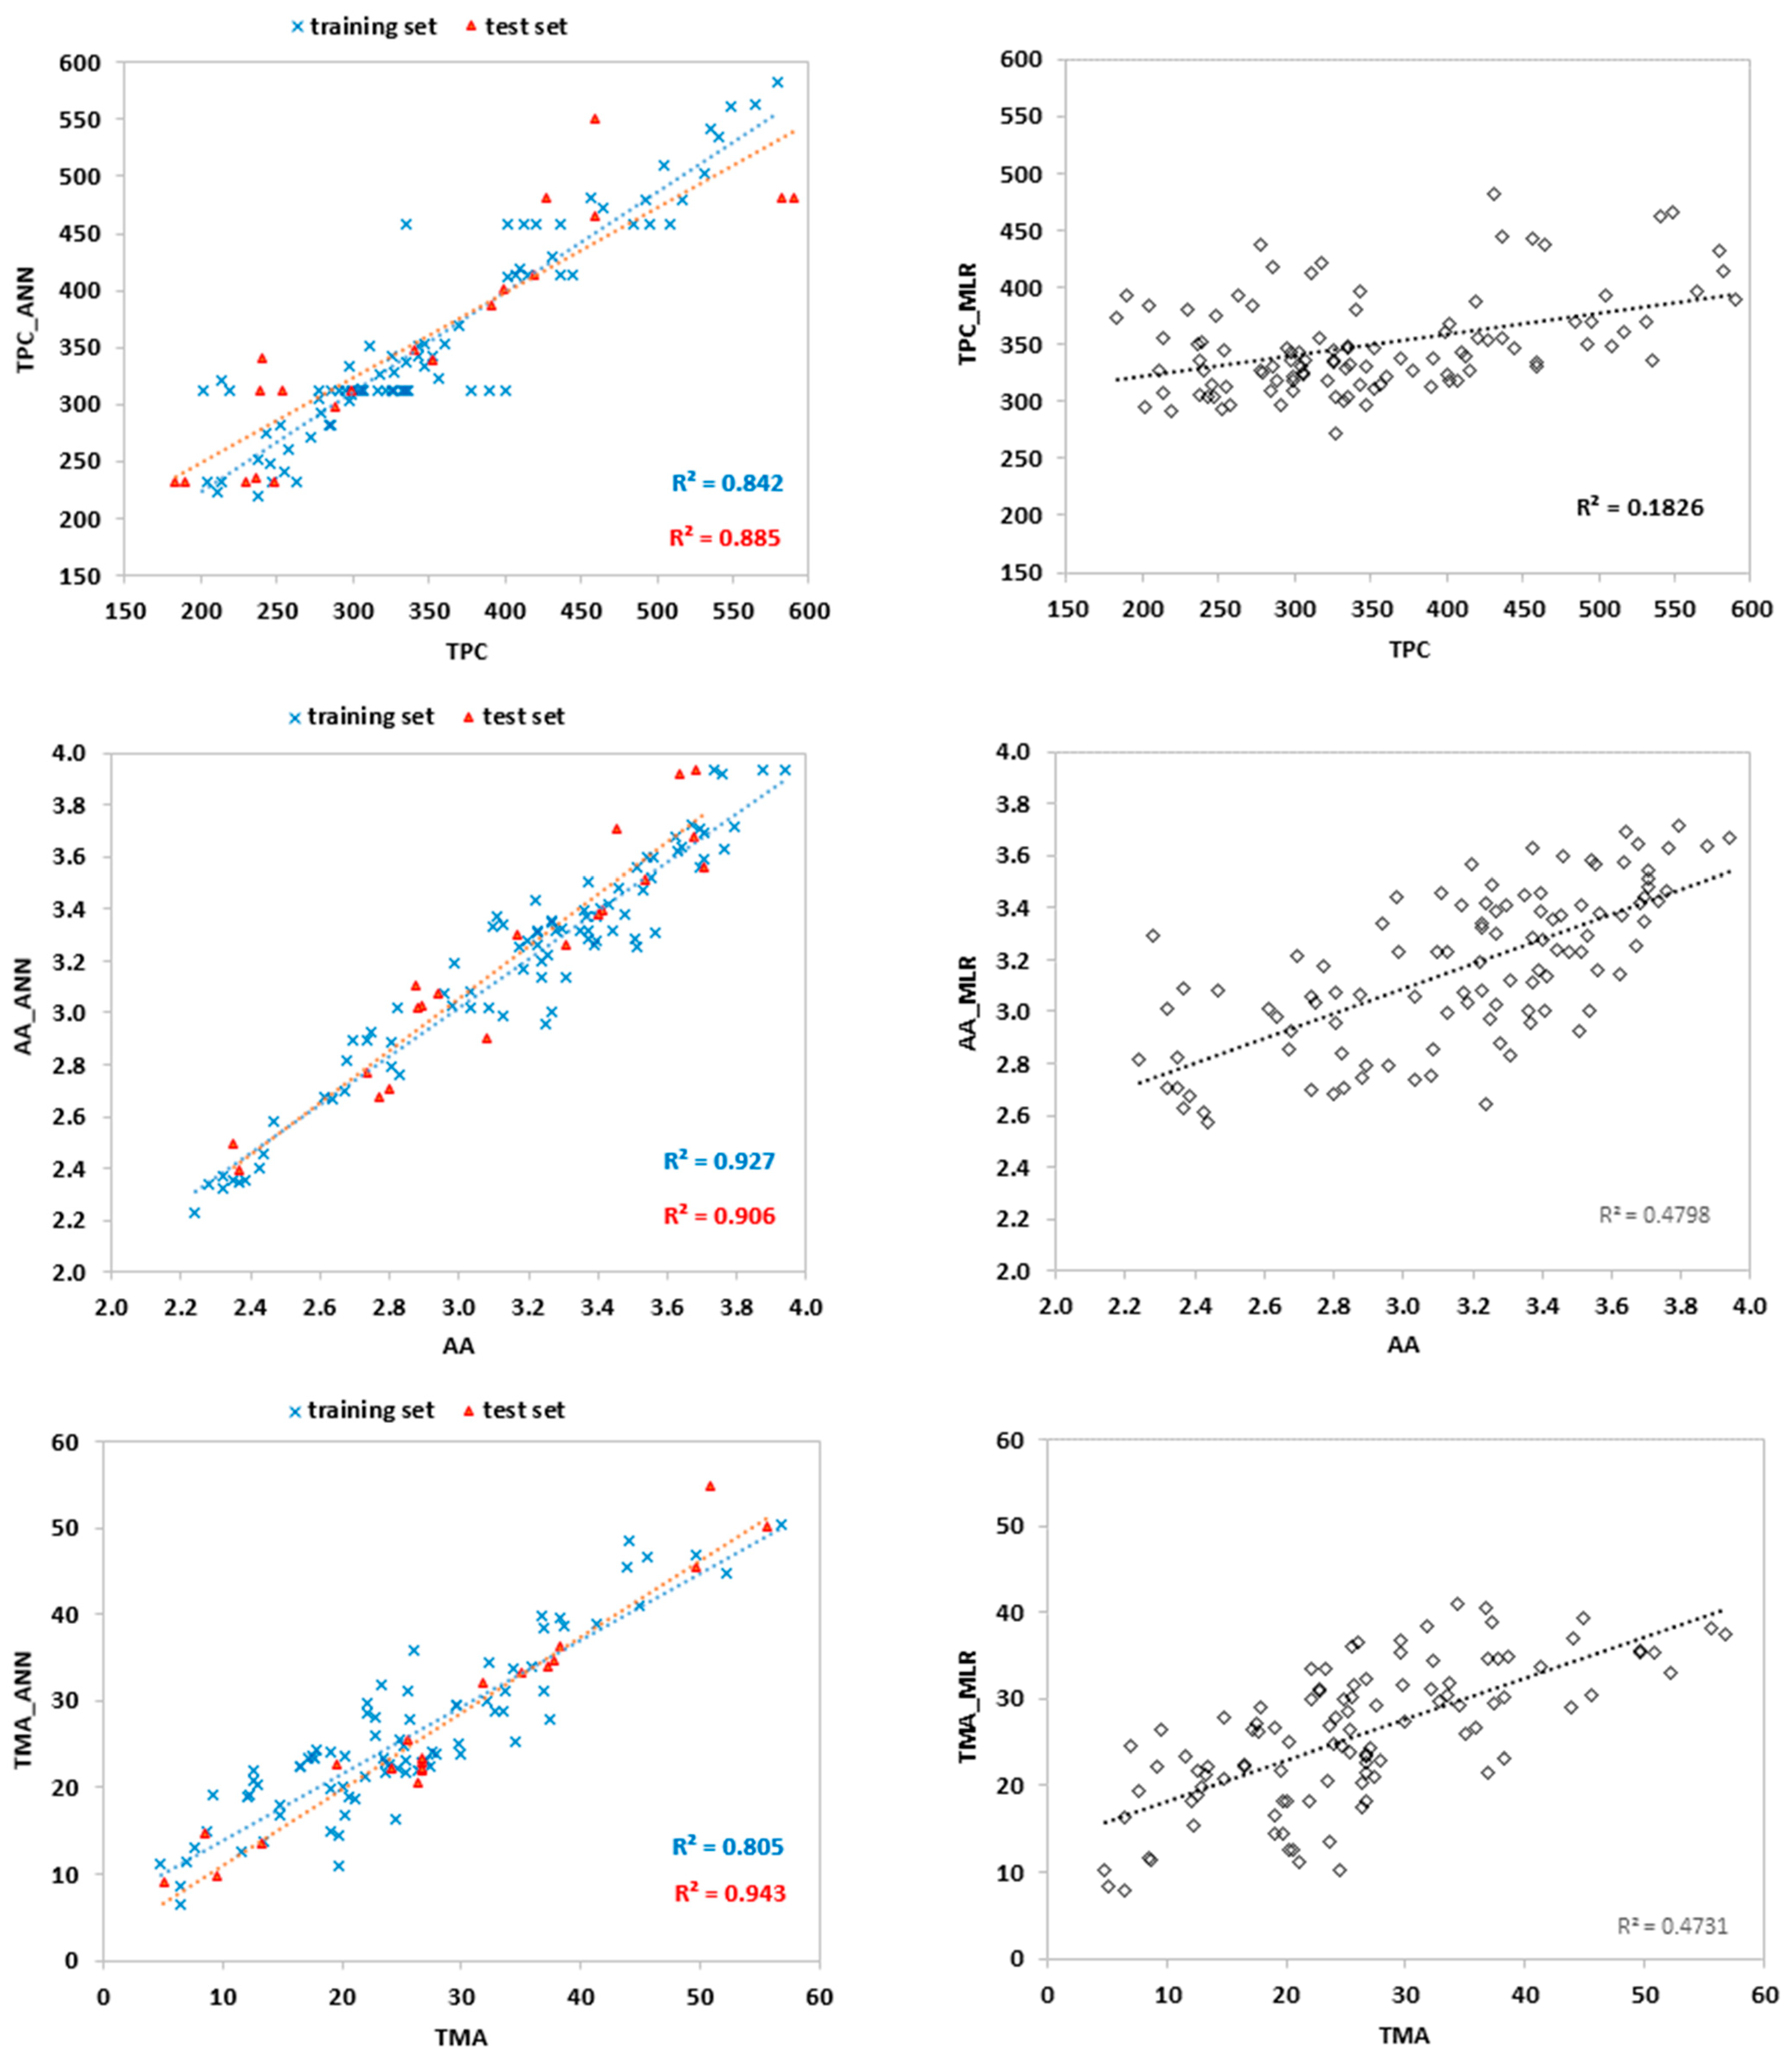
Measured and predicted quality parameters in MLR and models and the coefficient of determination (R2) for each attribute are presented in Figure 7. All scatter plots showed a large dispersion in the distribution pattern of data and low accuracy in predicting the parameters, with R2 ranging between 0.141 for TA and 0.480 for AA. These results suggest that MLR models did not effectively predict the strawberries quality attributes. Similar results were reported by Hernanz et al. [57], that applied multivariate statistical methods to single out the color parameters to correlate them with the pigment content.
Due to the unsatisfactory results of MLR modeling, a second attempt for prediction was carried out using the artificial neural networks (ANNs). Different ANN configurations were developed and compared which each other to determine the optimal MLP architecture (input–hidden–output layers). The network included three input data in the first layer and one output layer which represented the strawberry attributes. Hidden neurons in the hidden layers have been set to vary between 1 and 10. For each quality parameter, the best configuration was chosen, evaluating the best goodness of fit of ANN models, in terms of the lowest RMSE of the training and test sets. ANN performance could improve by an increase in hidden neurons [23]. In fact, the number of hidden neurons could determine how well a dataset can be learned [58]. If too few neurons are used, the network could not learn. At the same time, too many hidden neurons could cause overfitting, which resulted in good network learning and data memorization, but in an inability to generalize the input/output relationship [23,58]. Table 4 shows the neural networks’ architectures according to their topologies, including the algorithm (MLP), numbers of neurons in input, hidden, and output layers, hidden and output neurons’ activation function, and regression metrics (coefficient of determination—R2; root mean squared error—RMSE; mean absolute error—MAE; and relative standard error—RSE) for highest training and test sets predictions for each quality attribute (FF, TSS, TA, TPC, AA, TMA).
To find the best topology for each parameter, we tested different neurons in the hidden layer (from 1 to 9), and we choose the topology with achieved higher classification accuracy (the lowest MAE, RMSE, RSE values and the highest R2) for the test sets.
The best model for flesh firmness was obtained with five neurons in the hidden layer, logistic activation function for hidden neurons, and identity activation function for output neurons. The model had nine neurons in the hidden layer, a logistic activation function for hidden neurons, and an exponential activation function for output neurons was determined as optimal for the titratable acidity. As regards the total phenolic content, the best model was found with eight neurons in the hidden layer, and a logistic activation function for the hidden and output neurons. The optimal model for antioxidant activity was gained with nine neurons in the hidden layer, a logistic activation function for the hidden neurons, and a hyperbolic tangent activation function for the output neurons. At last, four neurons in the hidden layer, a hyperbolic tangent activation function for hidden neurons, and an exponential activation function for output neurons characterized the best model for total anthocyanin content.
In general, there was good agreement between the experimental and predicted values using the optimal ANN topology (Table 4, Figure 7). In fact, the coefficients of determination of the two types of sets were all above 0.73. The best estimation for the training set was obtained for the antioxidant activity (R2 = 0.925), whereas the worst was obtained for flesh firmness (R2 = 0.739). Regarding the test sets, the total monomeric anthocyanin achieved the highest accuracy (R2 = 0.943), while total soluble solids achieved the lowest (R2 = 0.739).
These results show that ANN models were sufficient to solve the nonlinearity of the data. However, considering the other regression metrics, not all models appeared to perform well. In particular, high values of MAE, RMSE, and RSE (4.161, 39.054, 11.4 for the training set, and 14.033, 37.870, and 9.6 for the test set, respectively) indicated a low ability in predicting the strawberry total phenolic content due to a large dispersion of residuals. In fact, since the error is being squared in RMSE, any predicting error is being heavily penalized. Our results could be due to the strawberries’ chemical phenolic composition. In particular, fruits contain high amounts of many beneficial colorless phenolics such as ellagic acid, p-coumaric acid, caffeic acid, flavanols, or glycosides of quercetin and kaempferol, whose distributions differ among varieties [59].
The three statistical indices were also not satisfactory for the flesh firmness and the total anthocyanin content. As expected, the slight variability in flesh firmness among the samples due to the strawberry selection in relation to the similar maturation grade strongly affected the model goodness. In contrast to in the study by Yoshioka et al. [60], which found models that are able to effectively predict anthocyanins considering the CIELab coordinates separately, our models were developed simultaneously, considering L*, a*, and b* values. On the contrary, the model for the antioxidant activity seemed to predict data accurately (RMSE < 0.2) as well as those for the titratable acidity and the total soluble solids seemed to work well (Table 4). A recent study suggested that ANN modeling can be successfully exploited for the evaluation of the same qualitative parameters [61].
To estimate the relative importance of the input variables to ANN model predictions, sensitivity analysis was carried out. As such, the CIELab coordinates were ranked according to their significance for each network and each quality parameter. Higher values of importance indicate a greater weight of the input variable in the ANN model. As shown in Table 5, L* was the most significant variable for TPC; a* for TSS, AA, and TMA; b* for FF and TA. It could be explained by the chemical nature of the fruit compounds. The relationship between the color and fruit characteristics is due to the pigment accumulation and variation in the sugar and organic acid in fruits [62,63]. During ripening, a series of biochemical and physiological processes occur, also inducing changes in the fruits’ color [64,65] in relation to the different cultivars. In particular, some bioactive compounds such as anthocyanins, carotenoids, and polyphenols are responsible for the skin and pulp color. For example, anthocyanins and polyphenols are mainly related to purple and red colors [62]. For strawberries, the color was dominated by red and to a lesser extent by blue, due to the characteristic accumulation of anthocyanins during the ripening of these fruits.
A strength of the study was the use of various cultivars with different traits, as shown in the previous sections. ANN predictions are significantly more trustworthy when a large number of cultivars is used for ANN modeling. A wide range in traits is a prerequisite of the successful training and testing of ANN [23]. In our study, the values of the various parameters were distributed fairly evenly over all the intervals, with a wide range of variation. At the same time, using a small number of samples might have represented a weakness in the accuracy of the estimates of the strawberry quality parameters, and could be one of the reasons why some models resulted to be not highly performing [66]. Nevertheless, the back propagation algorithm could have contributed to improving the model performance with a small number of neurons.
4. Conclusions
Strawberry cultivars showed significant differences in terms of the pomological and chemical traits. These aspects could be ascribed to the genetic and climatic variability occurred during the three harvest times. In this context, statistical analysis (PCA and cluster analysis) helped us evaluate the effects of different harvest times on qualitative traits, highlighting the cultivars with high similarity during the experimental tests. The results reveal that the cv. Monterey showed the highest achenes size. Moreover, cv. Albion contained important soluble solids, titratable acidity and phenols amount, whereas cv. Cabrillo presented the highest monomeric anthocyanins concentrations. Finally, cv. Favette was characterized by the highest antioxidant power. In the present study, we demonstrated the possibility of evaluating the content of specific compounds using robust and cultivar-independent indices by means of a portable CIELab colorimeter. MLR prediction models did not give satisfactory results. On the contrary, ANN models successfully predicted most of the investigated parameters using three neurons in the input layer (corresponding to color coordinates), one output layer for each output variable with the neurons as quality attributes, and a different number of neurons in the hidden layer (from four to nine in TMA and TA, respectively). In particular, the best estimation for the training set was obtained for the AA, whereas the worst was obtained for the FF. Regarding the test sets, the TMA achieved the highest accuracy, while TSS achieved the lowest. However, further investigation, using more training data (a greater number of strawberry samples and a greater number of cultivars) will need to be carried out to improve the performance of the proposed models. In conclusion, the study showed that the colorimeter is a promising non-destructive not time-consuming and not expensive instrument for the rapid monitoring of strawberry quality attributes. Therefore, farmers engaged in the cultivation of fruits, and food processing industry technologists can successfully use it in commercial application.
Author Contributions
Conceptualization, T.A., P.F. and R.C.; methodology, T.A. and R.C.; software, T.A.; validation, T.A. and R.C. formal analysis, R.C. and P.F.; investigation, T.A., P.F. and R.C.; data curation, T.A., P.F. and R.C.; writing—original draft preparation, T.A., P.F. and R.C.; writing—review and editing, T.A., P.F. and R.C. All authors have read and agreed to the published version of the manuscript.
Funding
This research received no external funding.
Institutional Review Board Statement
Not applicable.
Informed Consent Statement
Not applicable.
Data Availability Statement
Not applicable.
Acknowledgments
Grateful acknowledgements are given to Roberto Ciorba and Danilo Ceccarelli (CREA Research Centre for Olive, Fruit and Citrus Crops, Rome, Italy) for technical assistance. The authors also thank Simona Fiorentini and Valerio Vecchiarelli (Centro Appenninico del Terminillo Carlo Jucci, Università degli Studi di Perugia, Rieti, Italy) for agronomical assistance.
Conflicts of Interest
The authors declare no conflict of interest.
References
- Barbey, C.; Hogshead, M.; Schwartz, A.E.; Mourad, N.; Verma, S.; Lee, S.; Whitaker, V.M.; Folta, K.M. The genetics of differential gene expression related to fruit traits in strawberry (Fragaria × ananassa). Front. Genet. 2020, 10, 1317. [Google Scholar] [CrossRef] [Green Version]
- Kim, A.N.; Lee, K.Y.; Jeong, E.J.; Cha, S.W.; Kim, B.G.; Kerr, W.L.; Choi, S.G. Effect of vacuum-grinding on the stability of anthocyanins, ascorbic acid, and oxidative enzyme activity of strawberry. LWT-Food Sci. Technol. 2020, 136, 110304. [Google Scholar] [CrossRef]
- Hannun, S.M. Potential impact of strawberries on human health: A review of the science. Crit. Rev. Food Sci. Nutr. 2004, 44, 1–17. [Google Scholar] [CrossRef]
- Alvarez-Suarez, J.M.; Giampieri, F.; Tulipani, S.; Casoli, T.; Di Stefano, G.; González-Paramás, A.M.; Santos Buelga, C.; Busco, F.; Quiles, J.L.; Cordero, M.D.; et al. One-month strawberry-rich anthocyanin supplementation ameliorates cardiovascular risk, oxidative stress markers and platelet activation in humans. J. Nutr. Biochem. 2014, 25, 289–294. [Google Scholar] [CrossRef]
- Alarcón, M.; Fuentes, E.; Olate, N.; Navarrete, S.; Carrasco, G.; Palomo, I. Strawberry extract presents antiplatelet activity by inhibition of inflammatory mediator of atherosclerosis (sP-selectin, sCD40L, RANTES, and IL-1β) and thrombus formation. Platelets 2015, 26, 224–229. [Google Scholar] [CrossRef]
- Hakkinen, S.H.; Torronen, A.R. Content of flavonols and selected phenolic acids in strawberries and Vaccinium species: Influence of cultivar, cultivation site and technique. Food Res. Int. 2000, 33, 517–524. [Google Scholar] [CrossRef]
- Fan, Z.; Hasing, T.; Johnson, T.S.; Garner, D.M.; Schwieterman, M.L.; Barbey, C.R.; Colquhoun, T.A.; Sims, C.A.; Resende, M.F.R.; Whitaker, V.M. Strawberry sweetness and consumer preference are enhanced by specific volatile compounds. Hortic. Res. 2021, 8, 66. [Google Scholar] [CrossRef]
- Lee, S.G.; Kim, S.K.; Lee, H.J.; Lee, H.S.; Lee, J.H. Impact of moderate and extreme climate change scenarios on growth, morphological features, photosynthesis, and fruit production of hot pepper. Ecol. Evol. 2017, 8, 197–206. [Google Scholar] [CrossRef] [Green Version]
- Cockerton, H.M.; Karlstrom, A.; Johnson, A.W.; Li, B.; Stavridou, E.; Hopson, K.J.; Whitehouse, A.B.; Harrison, R.J. Genomic informed breeding strategies for strawberry yield and fruit quality traits. Front. Plant Sci. 2021, 12, 724847. [Google Scholar] [CrossRef]
- Prescott, J. Multisensory processes in flavour perception and their influence on food choice. Curr. Opin. Food Sci. 2015, 3, 47–52. [Google Scholar] [CrossRef]
- Yan, J.W.; Ban, Z.J.; Lu, H.Y.; Li, D.; Poverenov, E.; Luo, Z.S.; Li, L. The aroma volatile repertoire in strawberry fruit: A review. J. Sci. Food Agric. 2018, 98, 4395–4402. [Google Scholar] [CrossRef]
- Mitcham, B. Quality assurance for strawberries: A case study. Perish. Handl. Newsl. 1996, 85, 6–9. [Google Scholar]
- Ikegaya, A.; Toyoizumi, T.; Ohba, S.; Nakajima, T.; Kawata, T.; Ito, S.; Arai, E. Effects of distribution of sugars and organic acids on the taste of strawberries. Food Sci. Nutr. 2019, 7, 2419–2426. [Google Scholar] [CrossRef]
- Mezzetti, B.; Giampieri, F.; Zhang, Y.T.; Zhong, C.F. Status of strawberry breeding programs and cultivation systems in Europe and the rest of the world. J. Berry Res. 2018, 8, 205–221. [Google Scholar] [CrossRef]
- Lu, R.; Ariana, D. A near-infrared sensing technique for measuring internal quality of apple fruit. Appl. Eng. Agric. 2002, 18, 585–590. [Google Scholar]
- Annunziata, A.; Vecchio, R. Functional foods development in the European market: A consumer perspective. J. Funct. Foods 2011, 3, 223–228. [Google Scholar] [CrossRef]
- Amoriello, T.; Ciccoritti, R.; Carbone, K. Vibrational spectroscopy as a green technology for predicting nutraceutical properties and antiradical potential of early-to-late apricot genotypes. Postharvest Biol. Technol. 2019, 155, 156–166. [Google Scholar] [CrossRef]
- Abbott, J.A. Quality measurement of fruit and vegetables. Postharvest Biol. Technol. 1999, 15, 207–225. [Google Scholar] [CrossRef]
- Li, B.; Lecourt, J.; Bishop, G. Advances in non-destructive early assessment of fruit ripeness towards defining optimal time of harvest and yield prediction a review. Plants 2018, 7, 3. [Google Scholar] [CrossRef] [Green Version]
- Amoriello, T.; Ciccoritti, R.; Paliotta, M.; Carbone, K. Classification and prediction of early-to-late ripening apricot quality using spectroscopic techniques combined with chemometric tools. Sci. Hortic. 2018, 240, 310–317. [Google Scholar] [CrossRef]
- Di Scala, K.; Meschino, G.; Vega-Galvez, A.; Lemus-Mondaca, R.; Roura, S.; Mascheroni, R. An artificial neural network for prediction of quality characteristics of apples during convective dehydration. Food Sci. Technol. 2013, 33, 411–416. [Google Scholar] [CrossRef] [Green Version]
- Ehret, D.L.; Hill, B.D.; Raworth, D.A.; Estergaard, B. Artificial neural network modelling to predict cuticle cracking in greenhouse peppers and tomatoes. Comput. Electron. Agric. 2008, 61, 108–116. [Google Scholar] [CrossRef]
- Gholipoor, M.; Nadali, F. Fruit yield prediction of pepper using artificial neural network. Sci. Hortic. 2019, 250, 249–253. [Google Scholar] [CrossRef]
- Huang, X.; Wang, H.; Qu, S.; Luo, W.; Gao, Z. Using artificial neural network in predicting the key fruit quality of loquat. Food Sci. Nutr. 2021, 9, 1780–1791. [Google Scholar] [CrossRef]
- Torkashvand, A.M.; Ahmadi, A.; Nikravesh, N.L. Prediction of kiwifruit firmness using fruit mineral nutrient concentration by artificial neural network (ANN) and multiple linear regressions (MLR). J. Integr. Agric. 2017, 16, 1634–1644. [Google Scholar] [CrossRef] [Green Version]
- Zarifneshat, S.; Rohani, A.; Ghassemzadeh, H.R.; Sadeghi, M.; Ahmadi, E.; Zarifneshat, M. Prediction of bruise volume propagation of pear during the storage using soft computing methods. Food Sci. Nutr. 2020, 8, 884–893. [Google Scholar]
- Goyal, S. Artificial Neural Networks in Fruits: A Comprehensive Review. Int. J. Image Graph. Signal Process. 2014, 5, 53–63. [Google Scholar] [CrossRef] [Green Version]
- Naroui Rad, M.R.; Koohkan, S.; Fanaei, H.R.; Pahlavan Rad, M.R. Application of Artificial Neural Networks to predict the final fruit weight and random forest to select important variables in native population of melon (Cucumis melo L.). Sci. Hortic. 2015, 181, 108–112. [Google Scholar] [CrossRef]
- Choi, J.Y.; Seo, K.; Cho, J.S.; Moon, K.D. Applying convolutional neural networks to assess the external quality of strawberries. J. Food Compos. Anal. 2021, 102, 104071. [Google Scholar] [CrossRef]
- Bohr, A.; Memarzadeh, K. The rice of artificial intelligence in healthcare applications. Artif. Intell. Healthc. 2020, 2, 25–60. [Google Scholar]
- Buch, V.H.; Ahmed, I.; Maruthappu, M. Artificial intelligence in medicine: Current trends and future possibilities. Br. J. Gen. Pract. 2018, 68, 143–144. [Google Scholar] [CrossRef] [PubMed] [Green Version]
- Zhang, J.; Arine, J.; Chang, Q.; Gao, R. Artificial intelligence in advanced manufacturing: Current status and future outlook. J. Manuf. Sci. Eng. 2020, 142, 110804. [Google Scholar]
- Azarmdel, H.; Jahanbakhshi, A.; Mohtasebi, S.S.; Muñoz, A.R. Evaluation of image processing technique as an expert system in mulberry fruit grading based on ripeness level using artificial neural networks (ANNs) and support vector machine (SVM). Postharvest Biol. Technol. 2020, 166, 111201. [Google Scholar] [CrossRef]
- Lan, H.; Wang, Z.; Niu, H.; Zhang, H.; Zhang, Y.; Tang, Y.; Liu, Y. A non-destructive testing method for soluble solid content in Korla fragrant pears based on electrical properties and artificial neural network. Food Sci. Nutr. 2020, 8, 5172–5181. [Google Scholar] [CrossRef] [PubMed]
- Ceccarelli, D.; Antonucci, F.; Costa, C.; Talento, C.; Ciccoritti, R. An artificial class modelling approach to identify the most largely diffused cultivars of sweet cherry (Prunus avium L.) in Italy. Food Chem. 2020, 333, 127515. [Google Scholar] [CrossRef] [PubMed]
- Hammer, D.A.; Harper, P.D. Ryan PAST: Paleontological statistics software package for education and data analysis. Palaeontol. Electronica 2001, 4, 9. [Google Scholar]
- Saridas, M.A.; Simsek, O.; Donmez, D.; Kacar, Y.A.; Kargi, S.P. Genetic diversity and fruit characteristics of new superior hybrid strawberry (Fragaria × ananassa Duchesne ex Rozier) genotypes. Genet. Resour. Crop Evol. 2021, 68, 741–758. [Google Scholar] [CrossRef]
- Faedi, W.; Baruzzi, G.; Lucchi, P.; Magnani, S.; Sbrighi, P.; Turci, P.; Ambrosio, M.; Ballini, L.; Baroni, G.; Baudino, M.; et al. Monografia Fragola Volume Terzo; Imageline: Faenza, Italy, 2015. [Google Scholar]
- Cecatto, A.P.; Calvete, E.O.; Nienow, A.A.; Costa, R.C.D.; Mendonça, H.F.C.; Pazzinato, A.C. Culture systems in the production and quality of strawberry cultivars. Acta Sci. Agron. 2013, 35, 471–478. [Google Scholar] [CrossRef] [Green Version]
- Faedi, W.; Baruzzi, G.; Lucchi, P.; Sbrighi, P.; Aliosi, R.; Ballini, L.; Baroni, G.; Baudino, M.; Capriolo, G.; Caracciolo, G.; et al. Monografia Fragola Volume Secondo; Imageline: Faenza, Italy, 2009. [Google Scholar]
- Cocco, C.; Magnani, S.; Maltoni, M.L.; Quacquarelli, I.; Cacchi, M.; Antunes, L.E.C.; Baruzzi, G. Effects of site and genotype on strawberry fruits quality traits and bioactive compounds. J. Berry Res. 2015, 5, 145–155. [Google Scholar] [CrossRef] [Green Version]
- Crisosto, C.H.; Crisosto, G.M.; Metheney, P. Consumer acceptance of ‘Brooks’ and ‘Bing’ cherries is mainly dependent on fruit SSC and visual skin color. Postharvest Biol. Technol. 2003, 28, 159–167. [Google Scholar] [CrossRef]
- Hayaloglu, A.A.; Demir, N. Phenolic compounds, volatiles, and sensory characteristics of twelve sweet cherry (Prunus avium L.) cultivars grown in Turkey. J. Food Sci. 2016, 81, C7–C18. [Google Scholar] [CrossRef] [PubMed]
- Nunes, G.; Teixeira, F.; Schwarz, K.; Camargo, C.K.; Resende, J.T.V.D.; Santos, E.F.D.; Novello, D. Influence of genetic variability on the quality of strawberry cultivars: Sensorial, physical-chemical and nutritional characterization. Acta Scientiarum. Agron. 2020, 43, e46862. [Google Scholar] [CrossRef]
- Lal, S.; Ahmed, N.; Singh, S.R.; Singh, D.B.; Sharma, O.C.; Kumar, R. Variability of health and bioactive compounds in strawberry (Fragaria × ananassa Duch.) cultivars grown under an Indian temperate ecosystem. Fruits 2013, 68, 423–434. [Google Scholar] [CrossRef] [Green Version]
- Singh, A.; Singh, B.K.; Deka, B.C.; Sanwal, S.K.; Patel, R.K.; Verma, M.R. The genetic variability, inheritance and inter-relationships of ascorbic acid, β-carotene, phenol and anthocyanin content in strawberry (Fragaria × ananassa Duch.). Sci. Hortic. 2011, 129, 86–90. [Google Scholar] [CrossRef]
- Tulipani, S.; Mezzetti, B.; Capocasa, F.; Bompadre, S.; Beekwilder, J.; De Vos, C.R.; Battino, M. Antioxidants, phenolic compounds, and nutritional quality of different strawberry genotypes. J. Agric. Food Chem. 2008, 56, 696–704. [Google Scholar] [CrossRef] [PubMed]
- Pluta, S.; Madry, W.; Sieczko, L. Phenotypic diversity for agronomic traits in a collection of lackcurrant (Ribes nigrum L.) cultivars evaluated in Poland. Sci. Hortic. 2012, 145, 136–144. [Google Scholar] [CrossRef]
- Mądry, W.; Pluta, S.; Sieczko, L.; Studnicki, M. Phenotypic diversity in a sample of blackcurrant (Ribes nigrum L.) cultivars maintained in the Fruit Breeding Department at the Research Institute of Pomology and Floriculture in Skierniewice, Poland. J. Fruit Ornam. Plant Res. 2010, 18, 23–37. [Google Scholar]
- Krüger, E.; Josuttis, M.; Nestby, R.; Toldam-Andersen, T.B.; Carlen, C.; Mezzetti, B. Influence of growing conditions at different latitudes of Europe on strawberry growth performance, yield and quality. J. Berry Res. 2012, 2, 143–157. [Google Scholar] [CrossRef] [Green Version]
- Zitouni, H.; Hssaini, L.; Messaoudi, Z.; Ourradi, H.; Viuda-Martos, M.; Hernández, F.; Ercisli, S.; Hanine, H. Phytochemical components and bioactivity assessment among twelve strawberry (Arbutus unedo L.) genotypes growing in Morocco using chemometrics. Foods 2020, 9, 1345. [Google Scholar] [CrossRef]
- Intrigliolo, D.S.; Castel, J.R. Response of plum trees to deficit irrigation under two crop levels: Tree growth, yield and fruit quality. Irrig. Sci. 2010, 28, 525–534. [Google Scholar] [CrossRef]
- Maatallah, S.; Guizani, M.; Hjlaoui, H.; Boughattas, N.E.H.; Lopez-Lauri, F.; Ennajeh, M. Improvement of fruit quality by moderate water deficit in three plum cultivars (Prunus salicina L.) cultivated in a semi-arid region. Fruits 2015, 70, 325–332. [Google Scholar] [CrossRef] [Green Version]
- Sahamishirazi, S.; Moehring, J.; Claupein, W.; Graeff-Hoenninger, S. Quality assessment of 178 cultivars of plum regarding phenolic, anthocyanin and sugar content. Food Chem. 2017, 214, 694–701. [Google Scholar] [CrossRef] [PubMed]
- Solovchenko, A.; Schmitz-Eiberger, M. Significance of skin flavonoids for UV-B-protection in apple fruits. J. Exp. Bot. 2003, 54, 1977–1984. [Google Scholar] [CrossRef] [PubMed]
- Bartolini, S.; Leccese, A.; Viti, R. Quality and antioxidant properties of apricot fruits at ready-to-eat: Influence of the weather conditions under Mediterranean coastal area. J. Food Process Technol. 2015, 7, 1–6. [Google Scholar]
- Hernanz, D.; Recamales, Á.F.; Meléndez-Martínez, A.J.; González-Miret, M.L.; Heredia, F.J. Multivariate Statistical Analysis of the Color—Anthocyanin Relationships in Different Soilless-Grown Strawberry Genotypes. J. Agric. Food Chem. 2008, 56, 2735–2741. [Google Scholar] [CrossRef]
- Kaveh, M.; Chayan, R.A. Prediction of some physical and drying properties of terebinth fruit (Pistacia atlantica L.) using Artificial Neural Networks. Acta Sci. Pol. Technol. Aliment. 2014, 13, 65–78. [Google Scholar] [CrossRef] [Green Version]
- Fernández-Lara, R.; Gordillo, B.; Rodríguez-Pulido, F.J.; González-Miret, M.L.; del Villar-Martínez, A.A.; Dávila-Ortiz, G.; Heredia, F.J. Assessment of the differences in the phenolic composition and color characteristics of new strawberry (Fragaria × ananassa Duch.) cultivars by HPLC–MS and Imaging Tristimulus Colorimetry. Food Res. Int. 2015, 76, 645–653. [Google Scholar] [CrossRef] [Green Version]
- Yoshioka, Y.; Nakayama, M.; Noguchi, Y.; Horie, H. Use of image analysis to estimate anthocyanin and UV-excited fluorescent phenolic compound levels in strawberry fruit. Breed. Sci. 2013, 63, 211–217. [Google Scholar] [CrossRef] [Green Version]
- Rajković, D.; Marjanović Jeromela, A.; Pezo, L.; Lončar, B.; Zanetti, F.; Monti, A.; Kondić Špika, A. Yield and Quality Prediction of Winter Rapeseed—Artificial Neural Network and Random Forest Models. Agronomy 2022, 12, 58. [Google Scholar] [CrossRef]
- Llerena, W.; Samaniego, I.; Angós, I.; Brito, B.; Ortiz, B.; Carrillo, W. Biocompounds Content Prediction in Ecuadorian Fruits Using a Mathematical Model. Foods 2019, 8, 284. [Google Scholar] [CrossRef] [Green Version]
- Kalt, W.; McRae, K.B.; Hamilton, L.C. Relationship between surface color and other maturity indices in wild lowbush blueberries. Can. J. Plant Sci. 1995, 75, 485–490. [Google Scholar] [CrossRef]
- Acosta-Montoya, Ó.; Vaillant, F.; Cozzano, S.; Mertz, C.; Pérez, A.M.; Castro, M.V. Phenolic content and antioxidant capacity of tropical highland blackberry (Rubus adenotrichus Schltdl.) during three edible maturity stages. Food Chem. 2010, 119, 1497–1501. [Google Scholar] [CrossRef]
- Almeida, J.; Asís, R.; Molineri, V.N.; Sestari, I.; Lira, B.S.; Carrari, F.; Rossi, M. Fruits from ripening impaired, chlorophyll degraded and jasmonate insensitive tomato mutants have altered tocopherol content and composition. Phytochemistry 2015, 111, 72–83. [Google Scholar] [CrossRef] [PubMed]
- Alwosheel, A.; van Cranenburgh, S.; Chorus, C.G. Is your dataset big enough? Sample size requirements when using artificial neural networks for discrete choice analysis. J. Choice Model. 2018, 28, 167–182. [Google Scholar] [CrossRef]
Figure 1.
Structure of the multi-layer perceptron artificial neural network. The output variables are flesh firmness (FF), total soluble solid content (TSS), titratable acidity (TA), total phenolic content (TPC), antioxidant activity (AA), total monomeric anthocyanin (TMA). L* = lightness; a* = redness; b* = yellowness.

Figure 2.
Dataset box plots: evaluation pomological traits variability in relation to the different cultivars.
Figure 2.
Dataset box plots: evaluation pomological traits variability in relation to the different cultivars.

Figure 3.
Dataset box plots: evaluation of the chemical traits variability in relation to the different cultivars. TSS = total soluble solid content; TA = titratable acidity; DM = dry matter; TPC = total phenolic content; TMA = total monomeric anthocyanins; AA = antioxidant activity.
Figure 3.
Dataset box plots: evaluation of the chemical traits variability in relation to the different cultivars. TSS = total soluble solid content; TA = titratable acidity; DM = dry matter; TPC = total phenolic content; TMA = total monomeric anthocyanins; AA = antioxidant activity.

Figure 4.
Hierarchical clustering performed with a paired group algorithm and considering Wards methods of Euclidean distance to measure the mean values of each of the seven strawberry cultivars characterized for total acidity (TA), soluble solid content (SSC), dry matter (DM), total phenols content (TPC), antioxidant activity (AA), and total monomeric anthocyanin (TMA).

Figure 5.
Spearman’s correlation coefficients between chemical traits: total soluble solid content (TSS), titratable acidity (TA), dry matter (DM), total phenolic content (TPC), antioxidant activity (AA), total anthocyanin content (TMA), and flesh firmness (FF).
Figure 5.
Spearman’s correlation coefficients between chemical traits: total soluble solid content (TSS), titratable acidity (TA), dry matter (DM), total phenolic content (TPC), antioxidant activity (AA), total anthocyanin content (TMA), and flesh firmness (FF).

Figure 6.
Score plot from the principal component analysis per harvest time (May, July, and September). TA = total acidity; TSS = total soluble solid content; DM = dry matter; FF = flesh firmness; TPC = total phenols content; AA = antioxidant activity; TMA = total anthocyanin content.
Figure 6.
Score plot from the principal component analysis per harvest time (May, July, and September). TA = total acidity; TSS = total soluble solid content; DM = dry matter; FF = flesh firmness; TPC = total phenols content; AA = antioxidant activity; TMA = total anthocyanin content.

Figure 7.
Predicted vs. experimental values of the flesh firmness (FF), total soluble solid content (TSS), titratable acidity (TA), total phenolic content (TPC), antioxidant activity (AA), and total monomeric anthocyanin (TMA) using the optimal ANN topologies and multiple linear regression (MLR). The coefficients of determination (R2) are reported.


Table 1.
Cultivars, origin, fruit morphological characters (pulp and skin color and fruit dimension), and maturation time of strawberry samples (from Faedi et al. (2009); Faedi et al. (2015), US PP19,767; US PP20,552; US PP19,975; US 2016/0227687 P1; US PP16,228 P3).
Table 1.
Cultivars, origin, fruit morphological characters (pulp and skin color and fruit dimension), and maturation time of strawberry samples (from Faedi et al. (2009); Faedi et al. (2015), US PP19,767; US PP20,552; US PP19,975; US 2016/0227687 P1; US PP16,228 P3).
| Cultivars | Pedigree | Skin Color | Pulp Color | Fruit Dimension | Harvest Time |
|---|---|---|---|---|---|
| Albion | Diamante × Cal 94.16-1 | Dark red | Light red | Medium–large | From spring to fall |
| Cabrillo | Cal 3.149-8 × Cal 5.206-5 | Red | Light red | Medium–large | From spring to fall |
| Favette | Unknown | Bright red | Bright red | Medium–small | Spring |
| Irma | Don × 89.33.1 ((Addie × Earliglow) × Marmolada) | Red | Light red | Large | From spring to fall |
| Monterey | Albion × Cal 97.85-6 | Dark red | Light red | Medium–large | From spring to fall |
| Portola | Cal 97.93-7 × Cal 97.209-1 | Red | Light red | Medium–large | From spring to fall |
| San Andreas | Albion × Cal 97.86-1 | Red | Orange red | Medium–large | From spring to fall |
Table 2.
Means data, standard deviation (SD), minimum (Min), maximum (Max), 25th percentile (Q1), median (Q2), and 75th percentile (Q3) value of strawberries quality parameters divided by harvest time.
Table 2.
Means data, standard deviation (SD), minimum (Min), maximum (Max), 25th percentile (Q1), median (Q2), and 75th percentile (Q3) value of strawberries quality parameters divided by harvest time.
| Harvest Time | Mean ± SD | Min | Max | Q1 | Q2 | Q3 | |
|---|---|---|---|---|---|---|---|
| L* | May | 36.73 ± 2.81 a | 32.19 | 42.96 | 35.08 | 36.55 | 37.83 |
| July | 38.11 ± 3.99 a | 32.16 | 45.91 | 35.24 | 36.75 | 41.43 | |
| September | 38.28 ± 1.96 a | 34.11 | 42.68 | 38.28 | 38.28 | 39.26 | |
| a* | May | 30.27 ± 2.74 b | 25.43 | 36.06 | 28.05 | 30.21 | 31.52 |
| July | 31.86 ± 2.02 ab | 28.31 | 36.07 | 30.61 | 31.91 | 33.27 | |
| September | 35.53 ± 1.63 a | 32.47 | 38.41 | 34.30 | 35.38 | 36.33 | |
| b* | May | 17.77 ± 3.56 b | 12.92 | 26.48 | 14.77 | 16.77 | 20.34 |
| July | 22.22 ± 4.59 ab | 12.85 | 29.68 | 18.71 | 21.11 | 25.92 | |
| September | 24.01 ± 2.76 b | 16.96 | 29.32 | 22.46 | 24.27 | 25.43 | |
| FF | May | 73 ± 14 a | 46 | 110 | 66 | 73 | 79 |
| July | 86 ± 16 a | 52 | 117 | 74 | 86 | 100 | |
| September | 86 ± 18 a | 59 | 148 | 72 | 82 | 97 | |
| TSS | May | 7.0 ± 0.9 b | 5.4 | 9.2 | 6.3 | 6.8 | 7.4 |
| July | 10.6 ± 1.4 a | 7.6 | 13.5 | 9.8 | 10.7 | 11.2 | |
| September | 10.9 ± 1.8 a | 7.1 | 13.8 | 9.6 | 11.0 | 12.1 | |
| TA | May | 9.6 ± 1.5 a | 6.6 | 12.9 | 8.2 | 9.8 | 10.6 |
| July | 8.1 ± 1.1 a | 5.9 | 10.1 | 7.2 | 7.9 | 9.0 | |
| September | 9.8 ± 2.3 a | 1.7 | 14.7 | 8.8 | 9.5 | 10.5 | |
| DM | May | 9.2 ± 1.4 a | 6.2 | 11.5 | 8.5 | 9.2 | 10.2 |
| July | 4.1 ± 0.2 b | 3.4 | 4.7 | 4.3 | 4.5 | 4.5 | |
| September | 3.7 ± 0.2 b | 3.0 | 4.1 | 3.6 | 3.7 | 3.9 | |
| TPC | May | 301 ± 59 a | 201 | 420 | 252 | 299 | 346 |
| July | 430 ± 98 a | 210 | 579 | 341 | 434 | 510 | |
| September | 335 ± 98 a | 183 | 589 | 271 | 315 | 404 | |
| AA | May | 2.78 ± 0.11 b | 2.24 | 3.37 | 2.43 | 2.80 | 3.03 |
| July | 3.41 ± 0.25 a | 2.70 | 3.71 | 3.27 | 3.43 | 3.63 | |
| September | 3.43 ± 0.27 a | 2.8 | 3.94 | 3.22 | 3.42 | 3.64 | |
| TMA | May | 33 ± 11 a | 15 | 57 | 25 | 31 | 43 |
| July | 21 ± 11 a | 5 | 38 | 9 | 23 | 26 | |
| September | 22 ± 8 a | 12 | 41 | 16 | 20 | 27 |
Legend: FF = flesh firmness (N); TSS = total soluble solid content (g 100 g−1 FW); TA = titratable acidity (g of malic acid (MA) 100 g−1 of fresh weight (FW); DM = dry matter (g 100 g−1 FW); TPC = total phenolic content (mg GAE 100 g−1 FW); AA = antioxidant activity (µg TE mg−1 FW); and TMA = total anthocyanin content (mg CGE 100 g−1 FW). Different letters indicate that means are significantly different from each other (p < 0.05).
Table 3.
Principal component analysis per harvest time. Numbers in bold refer to correlation coefficient higher than 0.5 (assumed to be the conventional threshold) between the principal components (PC1, PC2, and PC3) and variables. The proportion of explained variance is reported.
Table 3.
Principal component analysis per harvest time. Numbers in bold refer to correlation coefficient higher than 0.5 (assumed to be the conventional threshold) between the principal components (PC1, PC2, and PC3) and variables. The proportion of explained variance is reported.
| PC1 | PC2 | PC3 | |
|---|---|---|---|
| FF | 0.692 | 0.251 | −0.056 |
| TSS | 0.804 | −0.208 | −0.043 |
| TA | 0.027 | 0.847 | −0.413 |
| DM | −0.805 | 0.397 | 0.093 |
| TPC | 0.643 | 0.377 | 0.568 |
| AA | 0.892 | 0.162 | 0.166 |
| TMA | −0.666 | 0.144 | 0.531 |
| Prop. explained variance (%) | 48.97 | 16.71 | 11.66 |
Table 4.
Neural network architectures, regression metrics for highest training and test sets predictions, goodness of fit, and residual analysis for the developed ANN models.
Table 4.
Neural network architectures, regression metrics for highest training and test sets predictions, goodness of fit, and residual analysis for the developed ANN models.
| Neural Network Topologies | Activation Function | Training Set | Test Set | ||||||||
|---|---|---|---|---|---|---|---|---|---|---|---|
| Hidden Neurons | Output Neurons | R2 | RMSE | MAE | RSE | R2 | RMSE | MAE | RSE | ||
| FF | MLP(3–5–1) | Logistic | Identity | 0.739 | 8.857 | 0.609 | 10.0 | 0.755 | 8.027 | 1.263 | 11.2 |
| TSS | MLP(3–7–1) | Tanh | Logistic | 0.821 | 0.967 | 0.031 | 10.3 | 0.749 | 1.176 | 0.046 | 13.3 |
| TA | MLP(3–9–1) | Logistic | Exp | 0.791 | 0.756 | 0.042 | 8.2 | 0.852 | 0.720 | 0.069 | 7.6 |
| TPC | MLP(3–8–1) | Logistic | Logistic | 0.842 | 39.054 | 4.161 | 11.4 | 0.885 | 37.870 | 14.033 | 9.6 |
| AA | MLP(3–9–1) | Logistic | Tanh | 0.925 | 0.118 | 0.011 | 3.7 | 0.906 | 0.147 | 0.058 | 4.6 |
| TMA | MLP(3–4–1) | Tanh | Exp | 0.805 | 4.883 | 0.471 | 19.5 | 0.943 | 3.575 | 1.269 | 13.0 |
Legend: MLP = multilayer perceptron; Tanh = hyperbolic tangent function; Exp = exponential function; FF = flesh firmness (N); TSS = total soluble solid content (g 100 g−1 FW); TA = titratable acidity (g of malic acid (MA) 100 g−1 of fresh weight (FW); DM = dry matter (g 100 g−1 FW); TPC = total phenolic content (mg GAE 100 g−1 FW); AA = antioxidant activity (µg TE mg−1 FW); TMA = total anthocyanin content (mg CGE 100 g−1 FW).
Table 5.
Relative importance (%) of the input variables to ANN model predictions.
| Input Variable | FF | TSS | TA | TPC | AA | TMA |
|---|---|---|---|---|---|---|
| L* | 33.8 | 33.0 | 32.0 | 36.7 | 30.5 | 32.6 |
| a* | 29.6 | 36.3 | 30.3 | 34.8 | 39.1 | 37.2 |
| b* | 36.6 | 30.7 | 37.7 | 28.5 | 30.3 | 30.1 |
Legend: FF = flesh firmness; TSS = total soluble solid content; TA = titratable acidity; TPC = total phenolic content; AA= antioxidant activity; TMA = total anthocyanin content.
Publisher’s Note: MDPI stays neutral with regard to jurisdictional claims in published maps and institutional affiliations. |
© 2022 by the authors. Licensee MDPI, Basel, Switzerland. This article is an open access article distributed under the terms and conditions of the Creative Commons Attribution (CC BY) license (https://creativecommons.org/licenses/by/4.0/).
Share and Cite
MDPI and ACS Style
Amoriello, T.; Ciccoritti, R.; Ferrante, P. Prediction of Strawberries’ Quality Parameters Using Artificial Neural Networks. Agronomy 2022, 12, 963. https://0-doi-org.brum.beds.ac.uk/10.3390/agronomy12040963
AMA Style
Amoriello T, Ciccoritti R, Ferrante P. Prediction of Strawberries’ Quality Parameters Using Artificial Neural Networks. Agronomy. 2022; 12(4):963. https://0-doi-org.brum.beds.ac.uk/10.3390/agronomy12040963
Chicago/Turabian StyleAmoriello, Tiziana, Roberto Ciccoritti, and Patrizia Ferrante. 2022. "Prediction of Strawberries’ Quality Parameters Using Artificial Neural Networks" Agronomy 12, no. 4: 963. https://0-doi-org.brum.beds.ac.uk/10.3390/agronomy12040963
Note that from the first issue of 2016, this journal uses article numbers instead of page numbers. See further details here.