Article

Physiological, Biochemical and Chlorophyll Fluorescence Parameters of Physalis Peruviana L. Seedlings Exposed to Different Short-Term Waterlogging Periods and Fusarium Wilt Infection

by
Cristhian C. Chávez-Arias
,
Sandra Gómez-Caro
and
Hermann Restrepo-Díaz
*
Departamento de Agronomía, Facultad de Ciencias Agrarias, Universidad Nacional de Colombia, Carrera 30 No. 45-03 1, Bogotá 11321, Colombia
*
Author to whom correspondence should be addressed.
Submission received: 24 January 2019 / Revised: 12 April 2019 / Accepted: 23 April 2019 / Published: 26 April 2019
(This article belongs to the Special Issue Fluorescence Techniques: Understanding Crop Performance)

Abstract

:
Cape gooseberry has coped with abiotic and biotic stresses such as prolonged waterlogging periods and vascular wilt in recent years. The aim of this study was to evaluate the influence of four waterlogging periods on stomatal conductance (gs), leaf water potential (Ψwf), plant growth, leaf photosynthetic pigments, malondialdehyde (MDA) production, proline content and chlorophyll fluorescence parameters in cape gooseberry plants infected with Fusarium oxysporum f. sp. physali (Foph). Two-month-old ecotype “Colombia” plants were arranged in a completely randomized factorial design in eight treatments: plants without waterlogging (control), plants with waterlogging for 4, 6 and 8 d with and without Foph, respectively. The area under the disease progress curve was higher in inoculated plants subjected to 6 and 8 d of waterlogging (55.25 and 64.25) compared to inoculated plants but without waterlogging (45.25). The results also showed a lower plant growth, gs, Ψwf, leaf photosynthetic pigments and chlorophyll fluorescence parameters (Fv/Fm, electron transport rate (ETR), Y (II) and qP) as waterlogging periods in plants with Foph increased. However, this group of plants showed a greater proline and malondialdehyde (MDA) accumulation and a higher NPQ. In conclusion, cape gooseberry shows a low acclimation to waterlogging conditions of more than 6 d in soils with Foph.

1. Introduction

Cape gooseberry (Physalis peruviana L.) belongs to the Solanaceae family and is native to the South American Andean region [1]. In recent years, the cape gooseberry fruit has gained economic importance due to its nutritional properties as a source of vitamins A and C [2]. In Colombia, the crop occupied 1,025 ha with a national production of 15,112 t in 2016 [3]. Also, cape gooseberry is the second most exported fruit in the country, being Colombia one of the main world producers [4].
Cape gooseberry productivity in Colombia has been significantly affected by abiotic and biotic factors in the soil such as oxygen deficiency (waterlogging) and the presence of pathogens [5,6]. Fusarium oxysporum f. sp. physali (Foph) (vascular wilt causal agent) has generated considerable reductions in yields and planted areas in the last decade, causing on certain occasions the total economic loss of this crop [7,8]. Also, Andean fruit trees (cape gooseberry, tamarillo and lulo) have been significantly affected by climate variability phenomena (ENSO), increasing the intensity and frequency of rainfall which generates prolonged waterlogging episodes [5,9,10].
The pathogen F. oxysporum (FO) can survive for long periods in the soil and is difficult to eliminate [11,12,13]. FO infection occurs through roots via direct penetration or wounds. The pathogen obstructs the plants’ xylem, generating leaf water deficit and low leaf gas exchange properties (stomatal conductance, transpiration, and photosynthesis) [14,15,16]. As a consequence, symptoms in the infected plants include low plant growth, leaf area and dry matter accumulation, followed by vascular tissue wilting and finally plant death [15,17,18,19,20,21].
Soil oxygen deficiency can also affect the leaf gas exchange properties and chlorophyll fluorescence parameters (maximum quantum efficiency of photosystem II (PSII) (Fv/Fm), actual efficiency of PSII (Y (II)), photochemical quenching (qP), non-photochemical quenching (NPQ) and electron transport rate (ETR)) [22,23]. It has been reported that stomatal conductance is a physiological parameter sensitive to waterlogging conditions [24]. Flórez-Velasco et al. [9] observed a 30% reduction of stomatal conductance in lulo plants (Solanum quitoense cv. Septentrionale) subjected to short waterlogging periods. Kallestad et al. [25] also found similar effects in pecan tree (Carya illinoinensis) seedlings. On the other hand, chlorophyll fluorescence parameters have been widely used as indicators of the photosystem II (PSII) activity under soil oxygen deficiency conditions [26,27]. Ren et al. [23] found a reduction of 16% in the Fv/Fm and Y (II) values in two maize (Zea mays L.) hybrids under short waterlogging periods (6 d). Similar results were also reported by Casierra-Posada and Cutler [28] who observed that prolonged waterlogging periods (25 d) also caused lower Fv/Fm, Y (II) and qP in cabbage (Brassica oleracea var. capitata) plants.
However, few studies have determined the relationship between soil saturation duration and severity of diseases. Yanar et al. [29] observed that growth of maize (Zea mays L.) plants was negatively affected by increased flooding duration and presence of the pathogen Pythium arrhenomanes. Additionally, Kirkpatrick et al. [30] observed that Pythium sp. isolation frequency increased with waterlogging in soybean plants. Also, short periods of exposure to waterlogging can stimulate the germination of fusarium spores in the soil [31].
The production of malondialdehyde (MDA) and leaf photosynthetic pigments content (chlorophylls and carotenoids) can be altered by either waterlogging or FO since these compounds are biochemical markers that indicate the intensity of the stress conditions [24,32,33,34,35]. Additionally, waterlogging promotes proline content, which is also a biochemical marker that shows the plant’s acclimation response. Ren et al. [23] observed a significant increase in MDA contents under waterlogging conditions in maize plants, which indicates a negative impact on cell membrane integrity. On the other hand, Fortunato et al. [36] reported a 45% increase in MDA content in two banana (Musa AAB Simmonds) genotypes inoculated with F. oxysporum f. sp. cubense.
Plant proline biosynthesis is stimulated by abiotic and biotic stress conditions [37,38]. Tou et al. [39] observed a greater proline accumulation in leaves of waterlogged peach plants, concluding that it was a tolerance mechanism to cope with this stress condition. Additionally, Hao et al. [40] observed an increase in proline concentrations in cucumber (Cucumis sativus L.) plants after FO inoculation. Regarding leaf photosynthetic pigments, reductions in chlorophyll content under waterlogging conditions have been reported in rice (Oriza sativa L.) [41], pigeonpeas (Cajanus cajan L.) [42], wheat (Triticum aestivum L.) [22], and jatropha (Jatropha curcas L.) [43]. Rajeswari et al. [44] also observed a reduction of 74% and 69% in the total chlorophyll and carotenoids values in peanut (Arachis hypogaea L.) plants infected with FO, respectively.
The knowledge on the impact of combined abiotic and biotic stresses is important to understand their influence on crop growth and productivity. In this sense, the effect of combined stress factors on crops cannot always be additive, because these stresses are complex and involve numerous physiological, molecular, and cellular adaptations [45,46]. Combined studies about the interaction of waterlogging and soil borne pathogens on physio-morphological and biochemical (proline, MDA, leaf photosynthetic pigments) traits are still scarce. However, available literature only shows the effect of the combination of biotic stress (pathogens) and abiotic stress which can favor the impact of pathogenicity via increased disease levels [47]. Drought stress increased the level of MDA in plants inoculated with leaf or soil-borne pathogens. [18,48].
Climate change models predict longer flooding periods with favorable environments for biotic stresses associated with phytopathogens [49,50]. Studies on the effect of interactions between abiotic (waterlogging) and biotic (soil-borne vascular pathogens) stresses have shown an increase in the severity of the disease under waterlogging periods. For example, Sanogo et al. [51] observed a 140% increase in vascular wilt severity caused by Verticillium dahliae in waterlogged chili pepper (Capsicum annuum L.) plants compared to non-waterlogged plants. Flooding and soil-borne diseases can cause severe crop losses of tomato during the hot and wet summer months in the tropics [52]. Villarreal-Navarrete et al. [6] also observed a greater progress of vascular wilt caused by FO in cape gooseberry under waterlogging conditions. Furthermore, these authors reported a reduction in dry matter accumulation, root length, leaf area, plant height and dry matter distribution under the same conditions mentioned above.
Increases in the intensity and frequency of rainfall are projected in Colombia for the coming years [53,54]. Consequently, studies on the response of Andean fruit trees acclimation to waterlogging scenarios have gained importance in recent years [5,9,10]. However, research on the interaction between the frequency and intensity of waterlogging periods and the incidence and severity of FO in cape gooseberry is still scarce [6]. We hypothesized that waterlogging conditions may favor the progress of the disease and condition growth and development in cape gooseberry plants. For this reason, the objective of this study was to evaluate different waterlogging periods on physiological, biochemical and chlorophyll fluorescence parameters in cape gooseberry plants infected with Foph.

2. Materials and Methods

2.1. Growth Conditions and Inoculation of the Pathogen

An experiment was carried out from November 2016 to March 2017 under greenhouse conditions at the Faculty of Agricultural Sciences of the Universidad Nacional de Colombia’s Bogotá campus (4°35′56″ N, 74°04′51″ W). The environmental growth conditions during the experiment were: 25/20 °C day/night temperature, 60%–80% relative humidity and a natural photoperiod of 12 h (photosynthetically active radiation was 1500 μmol m−2 s−1 at noon). Two-month-old cape gooseberry ecotype “Colombia” seedlings purchased from a local nursery were used. Seedlings were indexed following the methodology described by [55] to discard the infection with Foph. Then, seedlings were subjected to an acclimation period for 15 days. After the acclimation period ended, the cape gooseberry seedlings were transplanted in 2 L plastic pots, containing a soil-based substrate and rice husk (3:1 v/v) with and without Foph inoculum. Before substrate inoculation, the methodology described by [56] was used to confirm the absence of Foph in the soil used for the mixture.
The inoculation with Foph was carried out by incorporating the pathogen’s propagules at a concentration of 1 × 10⁶ microconidia mL−1 at the time of substrate preparation prior to transplantation [4]. One hundred mL of an Foph suspension in sterile distilled water were added for every 1 kg of substrate used (soil + rice husk). The Map5 strain (Laboratorio de Microbiología Agrícola, Agrosavia, Colombia) was used as source of inoculum, which was cultured in 250 mL liquid medium of potato dextrose broth in constant agitation in an orbital incubator-shaker (Lab-Line, Melrose Park, IL, USA) at 125 rpm for 8 d at room temperature (28 °C) under dark conditions [57].
The seedlings were irrigated daily with 50 mL of a nutrient solution prepared with a complete liquid fertilizer (Nutriponic®, Walco SA, Colombia) at a dose of 5 mL L−1 H2O from the transplant to the beginning of the waterlogging periods. The concentration of the nutrient solution was as follows: 2.08 mM Ca (NO3)2·4H2O, 1.99 mM MgSO4·7 H2O, 2.00 mM NH4H2PO4, 10.09 mM KNO3, 46.26 nM H3BO3, 0.45 nM Na2MoO4·2H2O, 0.32 nM CuSO4·5H2O, 9.19 nM MnCl2·4H2O, 0.76 nM ZnSO4·7H2O, and 19.75 nM FeSO4·H2O. The volume of water used was obtained by daily quantification of the plant evapotranspiration needs using the gravimetric technique described by [58].

2.2. Waterlogging Treatments

At inoculation time, two groups of 100 plants each [inoculated (substrate with Foph) and non-inoculated (substrate without Foph)] were obtained. Then, each group was divided into groups of 25 plants, which were subjected to a different waterlogging period (0, 4, 6 and 8 d) at 5 d after inoculation (DAI), obtaining eight groups of treatments: plants without waterlogging (control), inoculated plants without waterlogging, inoculated plants with waterlogging for 4, 6 and 8 d, and non-inoculated plants with waterlogging for 4, 6 and 8 d. Subsequently, the seedlings had a recovery period until the end of the trial (53 DAI).
The imposition of the waterlogging periods was performed by placing the plastic pots inside 120 L plastic boxes, which were filled with 60 L to guarantee approximately 5 cm water level over the pot´s soil surface. At the end of each waterlogging period, the pots were removed from the plastic boxes and drained until reaching the substrate’s moisture field capacity. After waterlogging, the seedlings were watered during the recovery period according to the evapotranspiration requirements of each of the treatments until the end of the experiment. Additionally, the different groups of waterlogging treatments were arranged in a completely randomized design where each treatment was repeated five times. Therefore, a total of five plants were used per treatment at each sampling point. Finally, the experiment lasted 70 days.

2.3. Analysis of Vascular Wilt Severity

At the beginning of the waterlogging periods (5 DAI), the severity of vascular wilt was determined visually every three days until the end of the experiment (53 DAI), following the scale described by Moreno [59]: 0) asymptomatic plants; 1) slight hyponasty and mild chlorosis of the lower third of the plant; 2) hyponasty in between 30%–50% of the leaves and moderate chlorosis in mature leaves; 3) hyponasty between 60%–80% of the leaves and moderate chlorosis in the middle third; 4) hyponasty in all the leaves of the plant, severe chlorosis and defoliation and 5) wilting, severe defoliation and/or dead plant. Subsequently, the disease severity index was determined using Equation (1) described by Townsend and Heuberger [60]:
Severity   index   ( % ) =   ( ( n v ) / V )
where n is the level of infection according to the scale, v is the number of plants present in each level and V is the total number of plants evaluated.
Finally, the intensity of the disease in each treatment was estimated by calculating the area under the disease progress curve (AUDPC) by the trapezoidal integration method [61,62] using Equation (2):
AUDPC   =   { i = 1 n 1 [ ( y i + y i + 1 ) / 2 ] ( t i + 1 t i ) }
where n is the number of evaluations, y i and y i + 1 are the values of the severity scale that were presented at each time of evaluation and ( t i + 1 t i ) is the time interval between evaluations. Finally, Foph presence or absence in plants of the different treatments was confirmed by planting segments taken from the base of the plant in potato dextrose agar (PDA) medium and incubating them at 25 °C at each evaluation time (13, 33, and 53 DAI) [55].

2.4. Stomatal Conductance and Leaf Water Potential

Stomatal conductance (gs) was estimated using a portable porometer (SC-1, Decagon Devices Inc., Pullman, WA, USA) with a range of 0 to 1000 mmol m−2 s−1 and a sample chamber aperture of 6.35 mm. Measurements were taken by clipping the sensor of the porometer onto the third fully expanded leaf of the middle portion of the canopy. gs measurements were taken from two leaves per plot and the two readings were averaged. gs was measured in completely sunny days between 0900 and 1100 hours.
Leaf water potential (Ψwf) was also estimated in the same leaves used to determine gs with a Scholander pressure chamber (PMS Instruments, Albany, OR, USA). Measurements were taken midday on a sunny day with clear sky. The time between chamber pressurization and leaf excision was as brief as possible, generally less than 15 s. The leaf petiole was cut with a sharp razor from the shoot and placed in the chamber. The chamber was then sealed and gradually and slowly pressurized with nitrogen gas. The pressure increased forcing sap out of the xylem system, which is observed with a 15× magnifying glass at the cut end of the leaf petiole. The measurements of gs and Ψwf were recorded at 13, 33 and 53 DAI.

2.5. Chlorophyll Fluorescence Parameters

The same leaves used to determine gs were also taken for the measurement of chlorophyll a fluorescence parameters using a modulated fluorometer (MINI-PAM, Walz, Effeltrich, Germany). Before taking the measurements, the leaves were adapted to darkness using clips for 20 minutes. After adaptation in the dark, the maximum efficiency of the photosystem (PSII) (Fv/Fm), electron transport rate, actual efficiency of PSII (Y(II)), photochemical quenching (qP), and non-photochemical quenching (NPQ) were estimated. Then, the leaves received a pulse of actinic light of up to 2,600 μmol m−2 s−1 on the surface of the leaf to obtain the fluorescence parameters. These measurements were also taken at 13, 33 and 53 DAI.

2.6. Diameter of the Stem and Leaf Area

The leaves of each plant per treatment were collected and photographed with a digital camera (D3300, Nikon, Thailand) and saved in TIFF (Tagged Image File Format) format. The leaf area was measured from the digital images using a Java image processing program (Image J; National Institute of Mental Health, Bethesda, MD, USA). The fresh and dry weight (FW and DW, respectively) of the same leaves were measured gravimetrically. The diameter of the stem was also determined as a growth measure. These variables were also evaluated at 13, 33 and 53 DAI.

2.7. Leaf Photosynthetic Pigments

The equations described by [63] were used to estimate leaf chlorophylls and carotenoids content. Thirty mg of leaf tissue sample from the middle part of the canopy were collected and homogenized in 3 mL of 80% acetone (v/v). Then, the samples were centrifuged (Model 420101, Becton Dickinson Primary Care Diagnostics, MD, USA) at 5000 rpm for 10 minutes to remove particles. The supernatant was diluted to a final volume of 6 ml by adding acetone [64]. Chlorophyll content was determined at 663 and 646 nm, and carotenoids were determined at 470 nm using a spectrophotometer (Spectronic BioMate 3 UV-vis Thermo, Madison, WI, USA).

2.8. Proline and Malondialdehyde Content

Proline content was estimated for all treatments using the method described by [65]. Approximately 300 mg of the same leaves collected for the determination of photosynthetic pigments were homogenized in liquid nitrogen and stored for further analysis. Then, 10 mL of a 3% aqueous sulfosalicylic acid solution were added to the stored samples and filtered through Whatman paper (No. 2). Two mL of this filtrate were reacted with 2 mL of ninhydrin acid and 2 mL of glacial acetic acid. The mixture was placed in a water bath at 90 °C for 1 h. The reaction was stopped by incubation in ice. The resulting solution was dissolved in 4 mL of toluene by shaking the test tubes vigorously using a vortex shaker and the absorbance readings were determined at 520 nm with the same spectrophotometer used in the quantification of photosynthetic pigments (Spectronic BioMate 3 ultraviolet-visible (UV-Vis), Thermo, Madison, WI, USA). Proline content was calculated using the fresh weight of the sample with a standard calibration curve (Equation (3)).
μ mol   Proline   fresh   vegetal   material = [ ( μ g   P r o l i n e m L × m L   T o l u e n e ) 115.5   μ g μ m o l ]   [ g   s a m p l e 5 ]
The thiobarbituric acid (TBA) method described by [66] was used to estimate membrane lipid peroxidation (MDA). Approximately 300 mg of plant material were homogenized in liquid nitrogen. Samples were centrifuged at 5000 rpm, and then their absorbances were estimated at 440, 532 and 600 nm with the spectrophotometer. Finally, an extinction coefficient (157 M·mL−1) was used to obtain the MDA concentration. Proline, leaf photosynthetic pigments and MDA measurements were performed at 13 and 53 DAI.

2.9. Experimental Design and Data Analysis

Data were analyzed by a factorial arrangement where the main factor was plant inoculation (with and without Foph) and the second factor was the four different waterlogging periods (0, 4, 6 and 8 days). Each treatment group consisted of 5 plants. An analysis of variance (ANOVA) was performed and when significant differences (p ≤ 0.05) were found, and a Tukey post hoc test was used for the comparison of means. The percentage values were transformed using the arcsine function. Data were analyzed using the Statistix v 9.0 software (Analytical Software, Tallahassee, FL, USA), and SigmaPlot (Systat Software, San Jose, CA, USA) was used for the figures.

3. Results and Discussion

The analysis of variance that shows the effect of the waterlogging treatments, F. oxysporum f. sp. physali (Foph) inoculation and their interaction on the leaf photosynthetic pigments (chlorophyll a, b, and total content and carotenoids), malondialdehyde and proline content at 53 DAI is summarized in Table 1. The analysis of variance that shows the effect between Fusarium oxysporum f. sp. physali (Foph), waterlogging periods, and sampling time on stomatal conductance (gs), leaf water potential (Ψwf,), stem diameter, leaf area (LA), foliar dry weight (FDW), the maximum efficiency of the photosystem (PSII) (Fv/Fm), actual efficiency of PSII (Y(II)), photochemical quenching (qP), non-photochemical quenching (NPQ) and electron transport rate (ETR) of cape gooseberry plants is summarized in Table 2.

3.1. Vascular Wilt Severity

The area under the disease progress curve (AUDPC) and the disease severity index at the end of the trial (53 DAI) are shown in Table 2. All inoculated plants showed the characteristic symptoms of vascular wilt; additionally, the presence of FO was confirmed by isolation in PDA from affected material (data not shown). Plants without pathogen inoculation did not show any disease symptoms and pathogen isolation in PDA was also negative for all cases. Significant differences were observed in the AUDPC (p < 0.001) and the disease severity index (p < 0.05). Plants subjected to 8 d of waterlogging showed the highest AUDPC values. Then, plants subjected to an intermediate waterlogging (6 d), while plants with waterlogging for 4 d and plants that were only inoculated with the pathogen showed no differences between them. On the other hand, the highest levels of vascular wilt severity were also found in 8 d of waterlogging, being statistically different from treatments of 4 and 6 d and plants inoculated with Foph under field capacity conditions (Table 3).
Kumar et al. [67] stated that environmental factors played an important role in the incidence of diseases and also reported that the development of FO was favored by warm temperatures and dry periods in the soil. However, other authors mentioned that soil pathogens such as Phytophthora and Pythium are favored in waterlogged soil [68,69]. The present study showed similar findings in which medium (6 d) and prolonged (8 d) waterlogging periods caused a greater vascular wilt severity generated by Foph in cape gooseberry seedlings. Moslemi et al. [70] also found that FO severity was higher under 4 d of waterlogging in pyrethrum (Tanacetum cinerariifolium) plants. These authors stated that the greater severity in waterlogged soils could be due to the fact that hypoxia conditions weaken the root favoring infection and colonization of the pathogen.

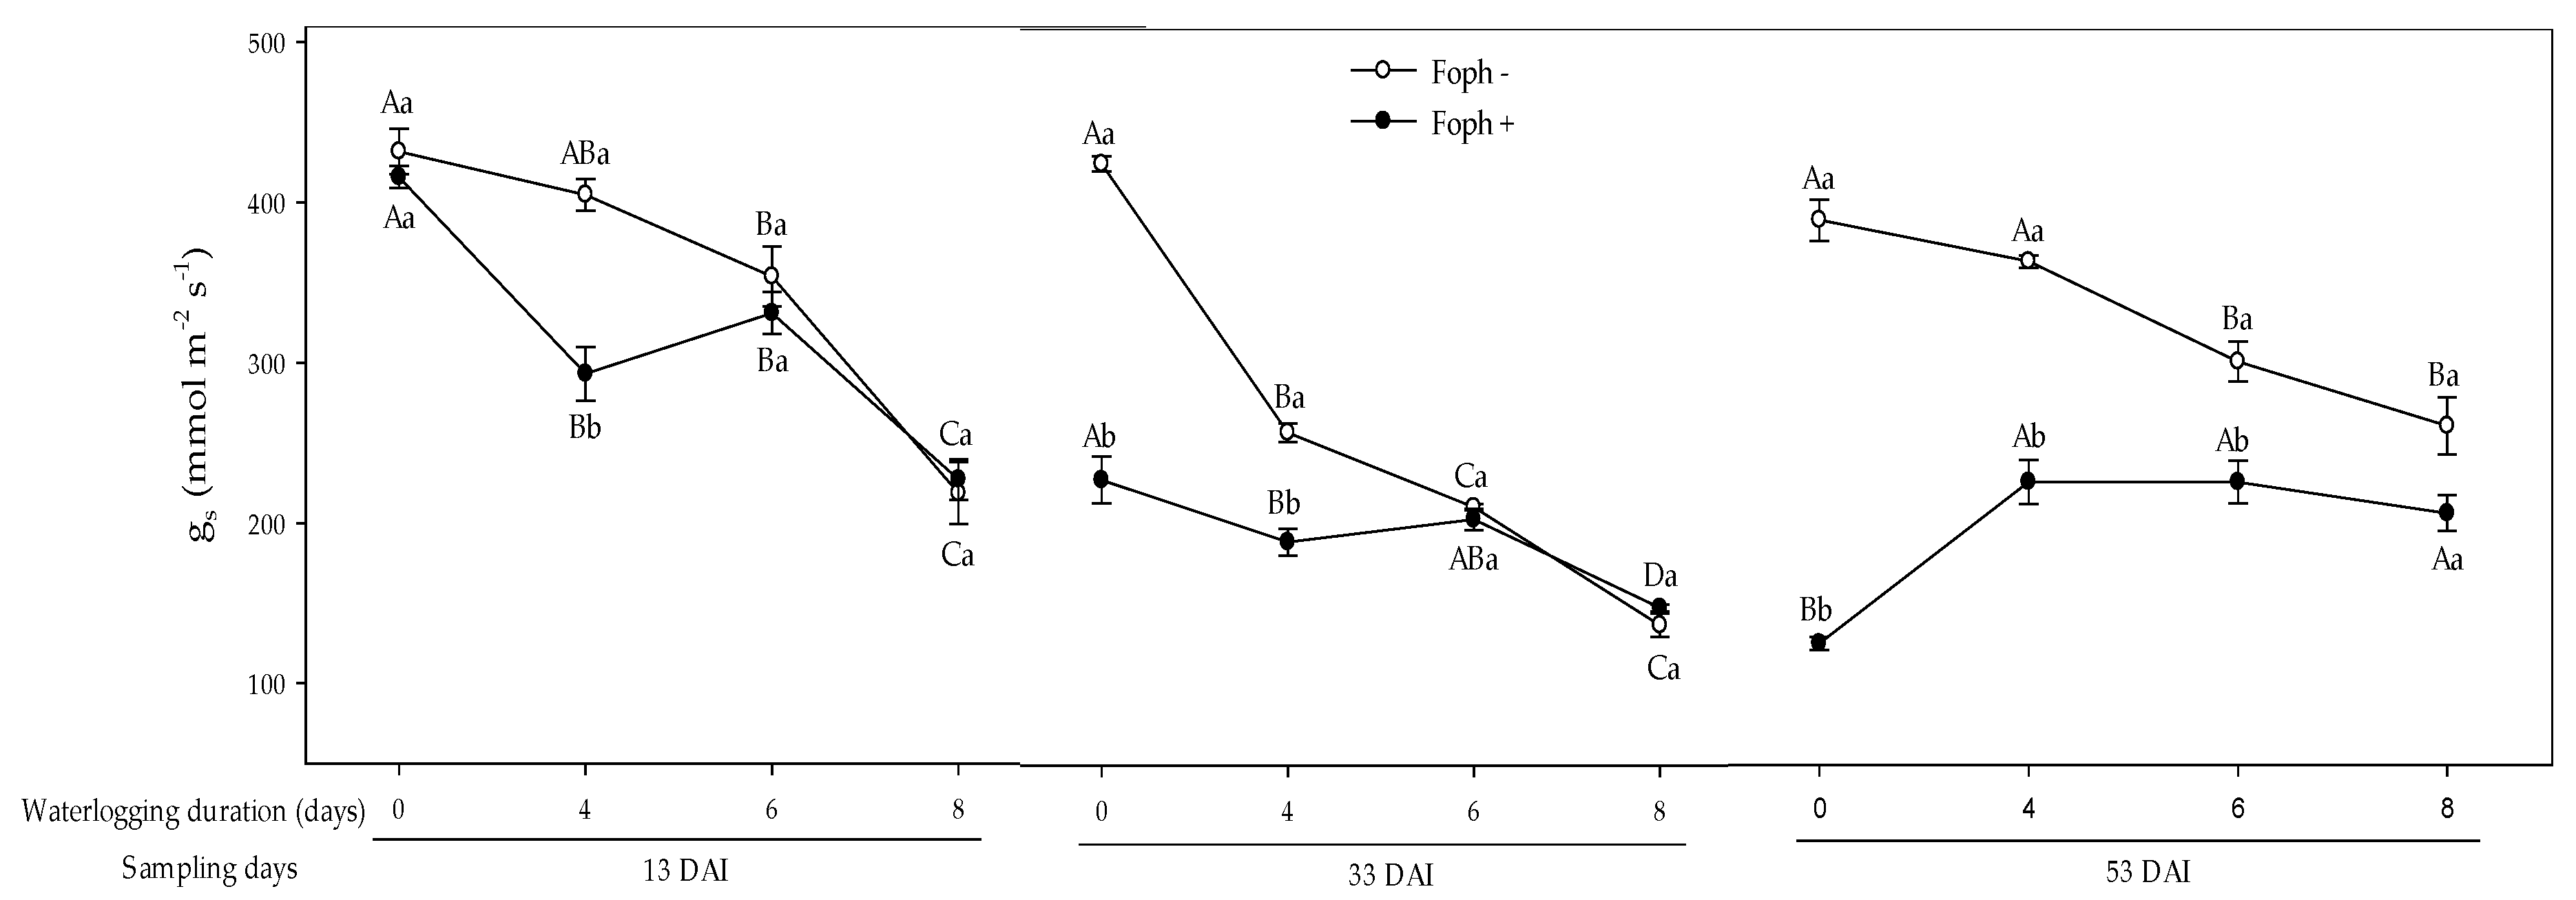
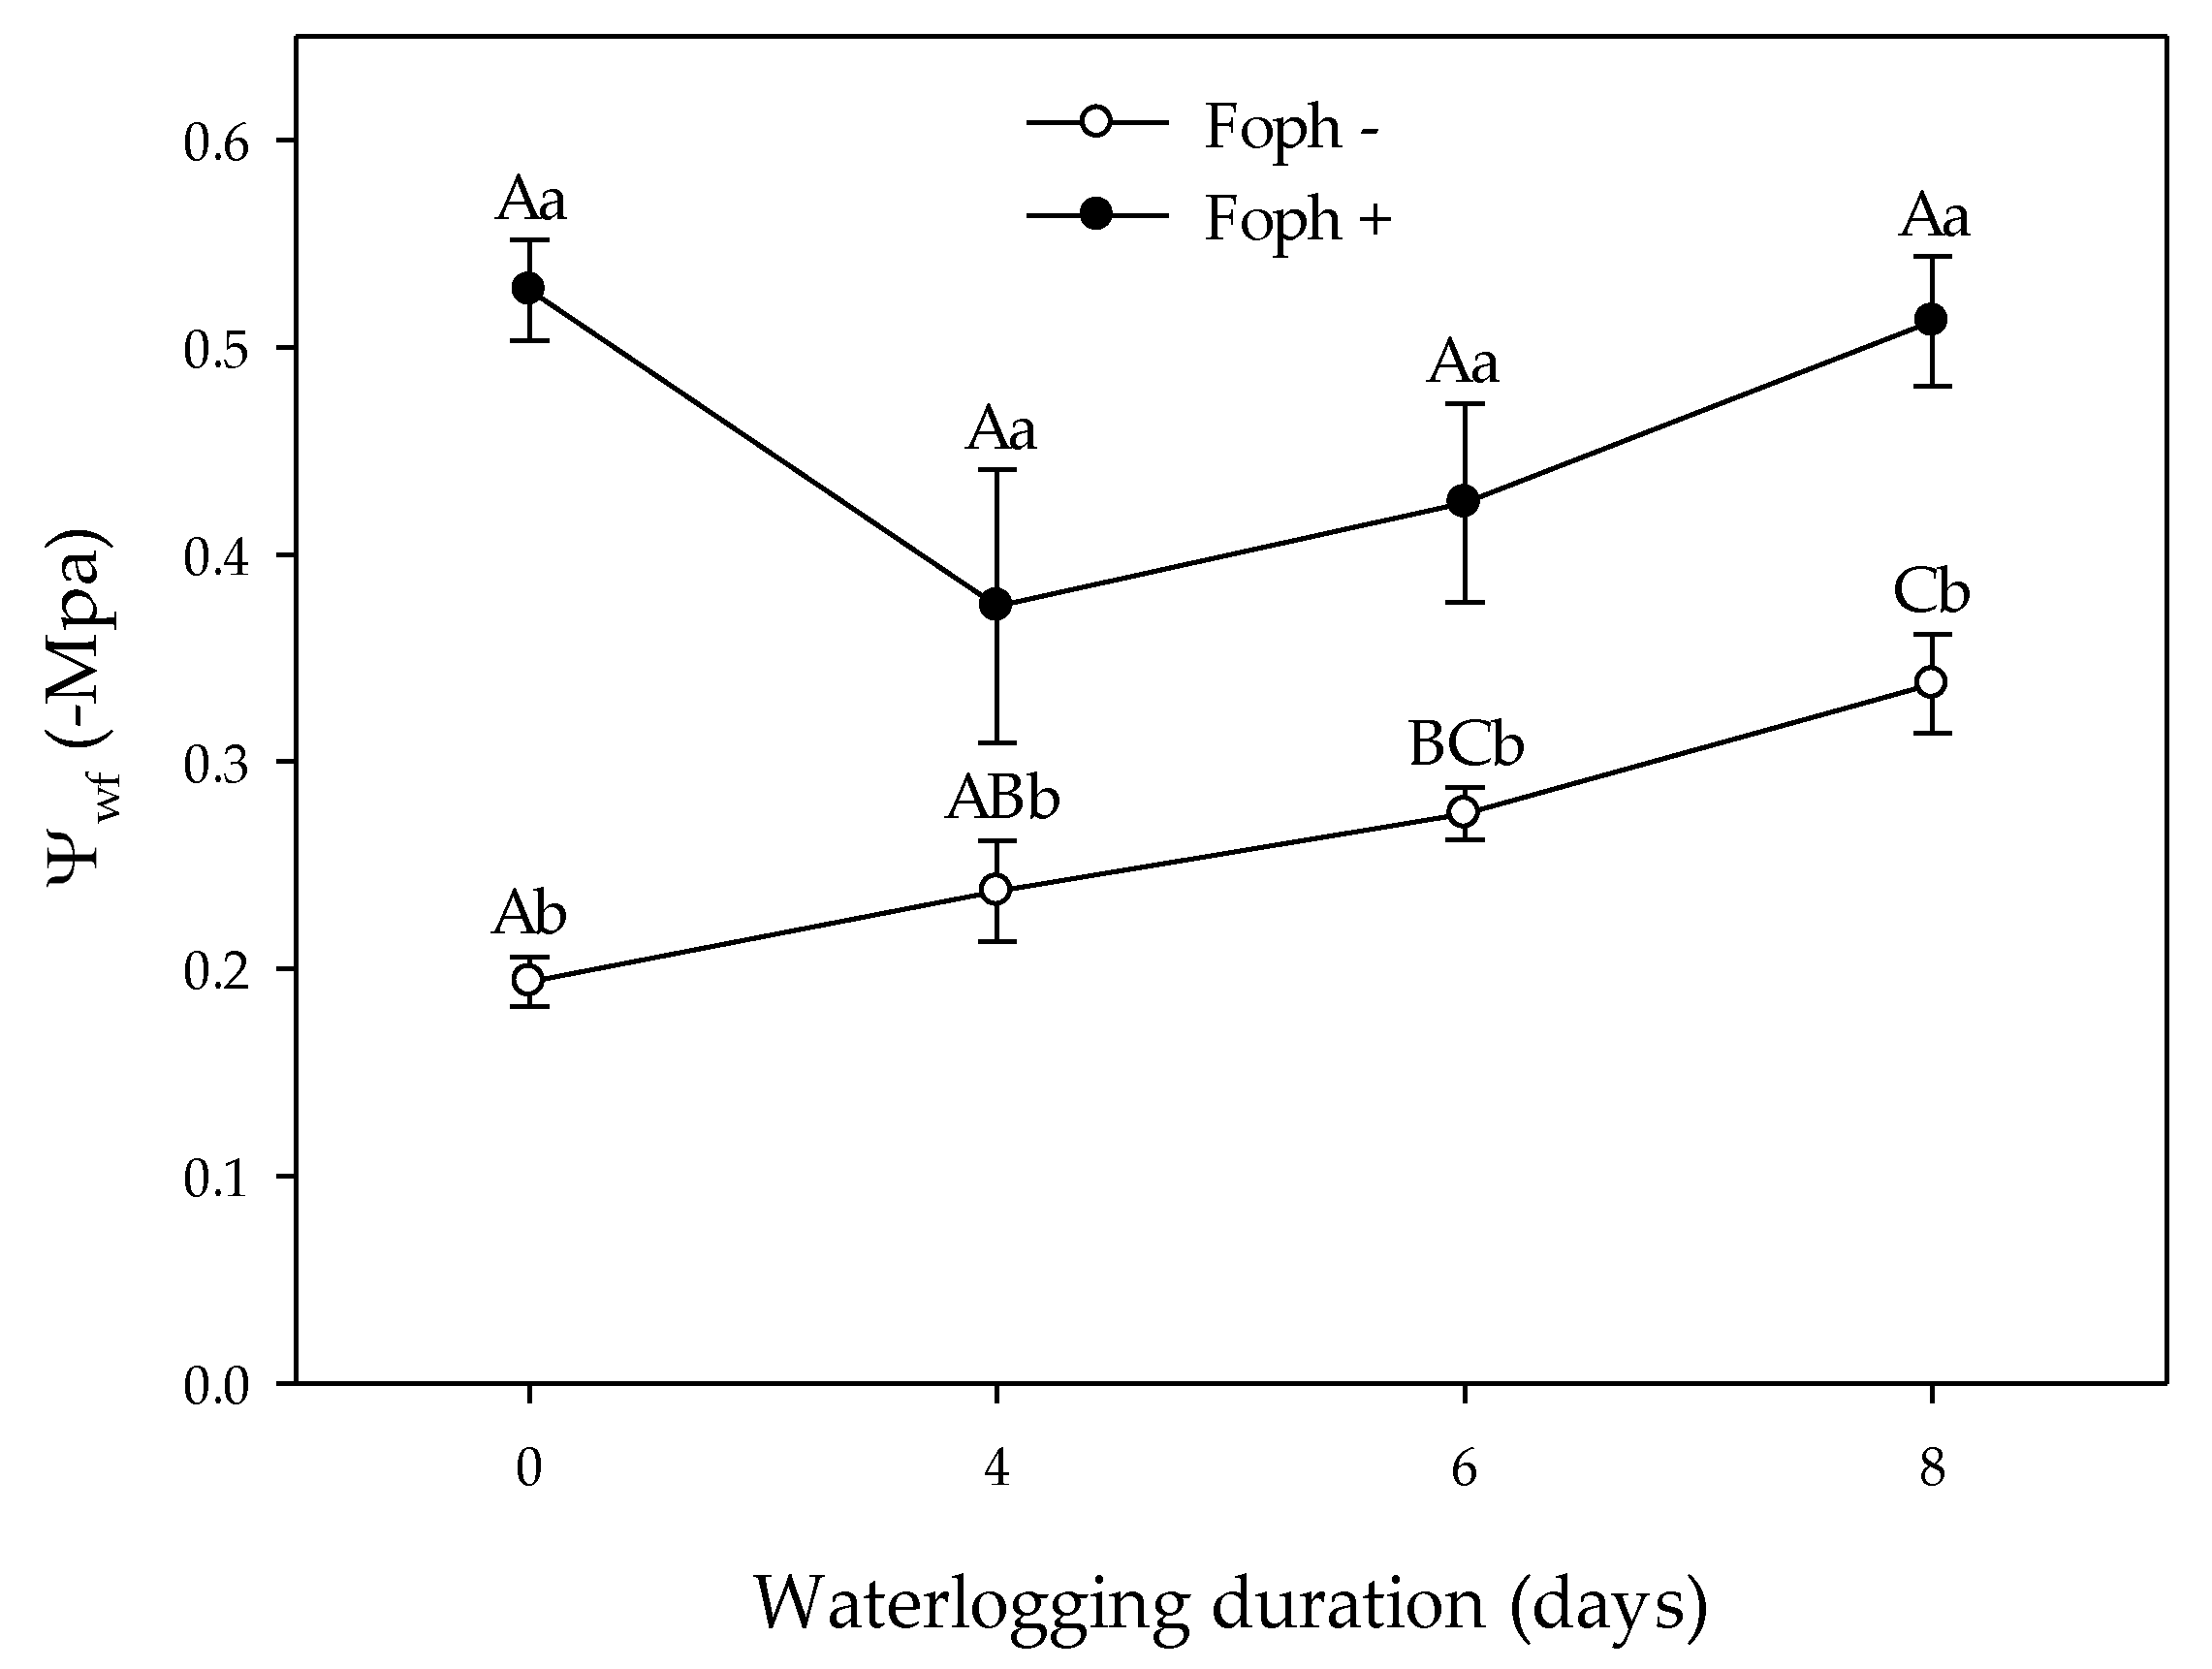
3.2. Stomatal Conductance (gs) and Leaf Water Potential (Ψwf)

Differences were found between the triple interaction (waterlogging, Foph inoculation and sampling point) on gs (p < 0.001) (Table 2). At 13 DAI, control plants (without waterlogging and with or without pathogen inoculation) had the highest gs (~410 mmol m−2 s−1). Then, a progressive gs decrease was observed with the increase of the waterlogging periods in both inoculation conditions. The lowest gs (~210 mmol m−2 s−1) was obtained in cape gooseberry plants with waterlogging for 8 d (with or without pathogen inoculation). At 33 DAI, gs continued being higher in the non-inoculated control plants and without soil oxygen deficiency. Subsequently, a significant drop in this variable was observed due to the pathogen infection in non-waterlogged plants. Finally, gs progressively decreased as waterlogging periods increased (4, 6 and 8 d) in both inoculation conditions. A greater influence of the pathogen on this variable was observed at 4 d of waterlogging. At 53 DAI, similar negative trends occurred with the increase of waterlogging periods in plants without inoculation. Foph presence also caused a reduction, with a greater effect on plants without waterlogging (~84.27 mmol m−2 s−1) Figure 1).
Significant differences (p < 0.05) between waterlogging periods and Foph presence on Ψwf were only obtained at 53 DAI (Table 2). In general, the lowest Ψwf values were registered in plants inoculated with Foph regardless of the waterlogging period. On the other hand, Ψwf values were statistically different among the waterlogging periods in plants without inoculation, observing a progressive drop as the waterlogging period increased (Figure 2).
One of the initial leaf responses to the waterlogging condition is a lower gs to avoid water loss as a result of a hypoxia condition in the soil [71,72]. In the present study, gs was negatively affected (reduction between 30% and 40%) mainly at 6 and 8 d of waterlogging. Similar results were observed by Olmo-Vega et al. [73] where intermediate waterlogging periods (6 d) reduced gs around 60% in three pomegranate (Punica granatum L.) genotypes. Herrera [74] also suggested that species sensitive to waterlogging show an initial reduction in gs accompanied by a decrease in Ψwf.
The above was observed in the present study in waterlogged and non-inoculated cape gooseberry plants. Castonguay et al. [75] observed that alfalfa (Medicago sativa L.) plants showed a reduction in Ψwf of approximately 44% under a waterlogging period from 2 to 6 d. Striker and Colmer [76] mentioned that lower gs and Ψwf f are due to a low hydraulic conductivity of the root. FO produces toxins such as fusaric acid that can also influence the stem hydraulic conductance, affecting Ψwf negatively [18,77]. In the current study, Foph presence in both waterlogging situations caused a more negative Ψwf. Dong et al. [78] also observed lower Ψwf in banana (Musa AAA) plants infected with F. oxysporum f. sp. cubense and stated that this reduction could have been due to a blockage of xylem elements by the structures of the pathogen.

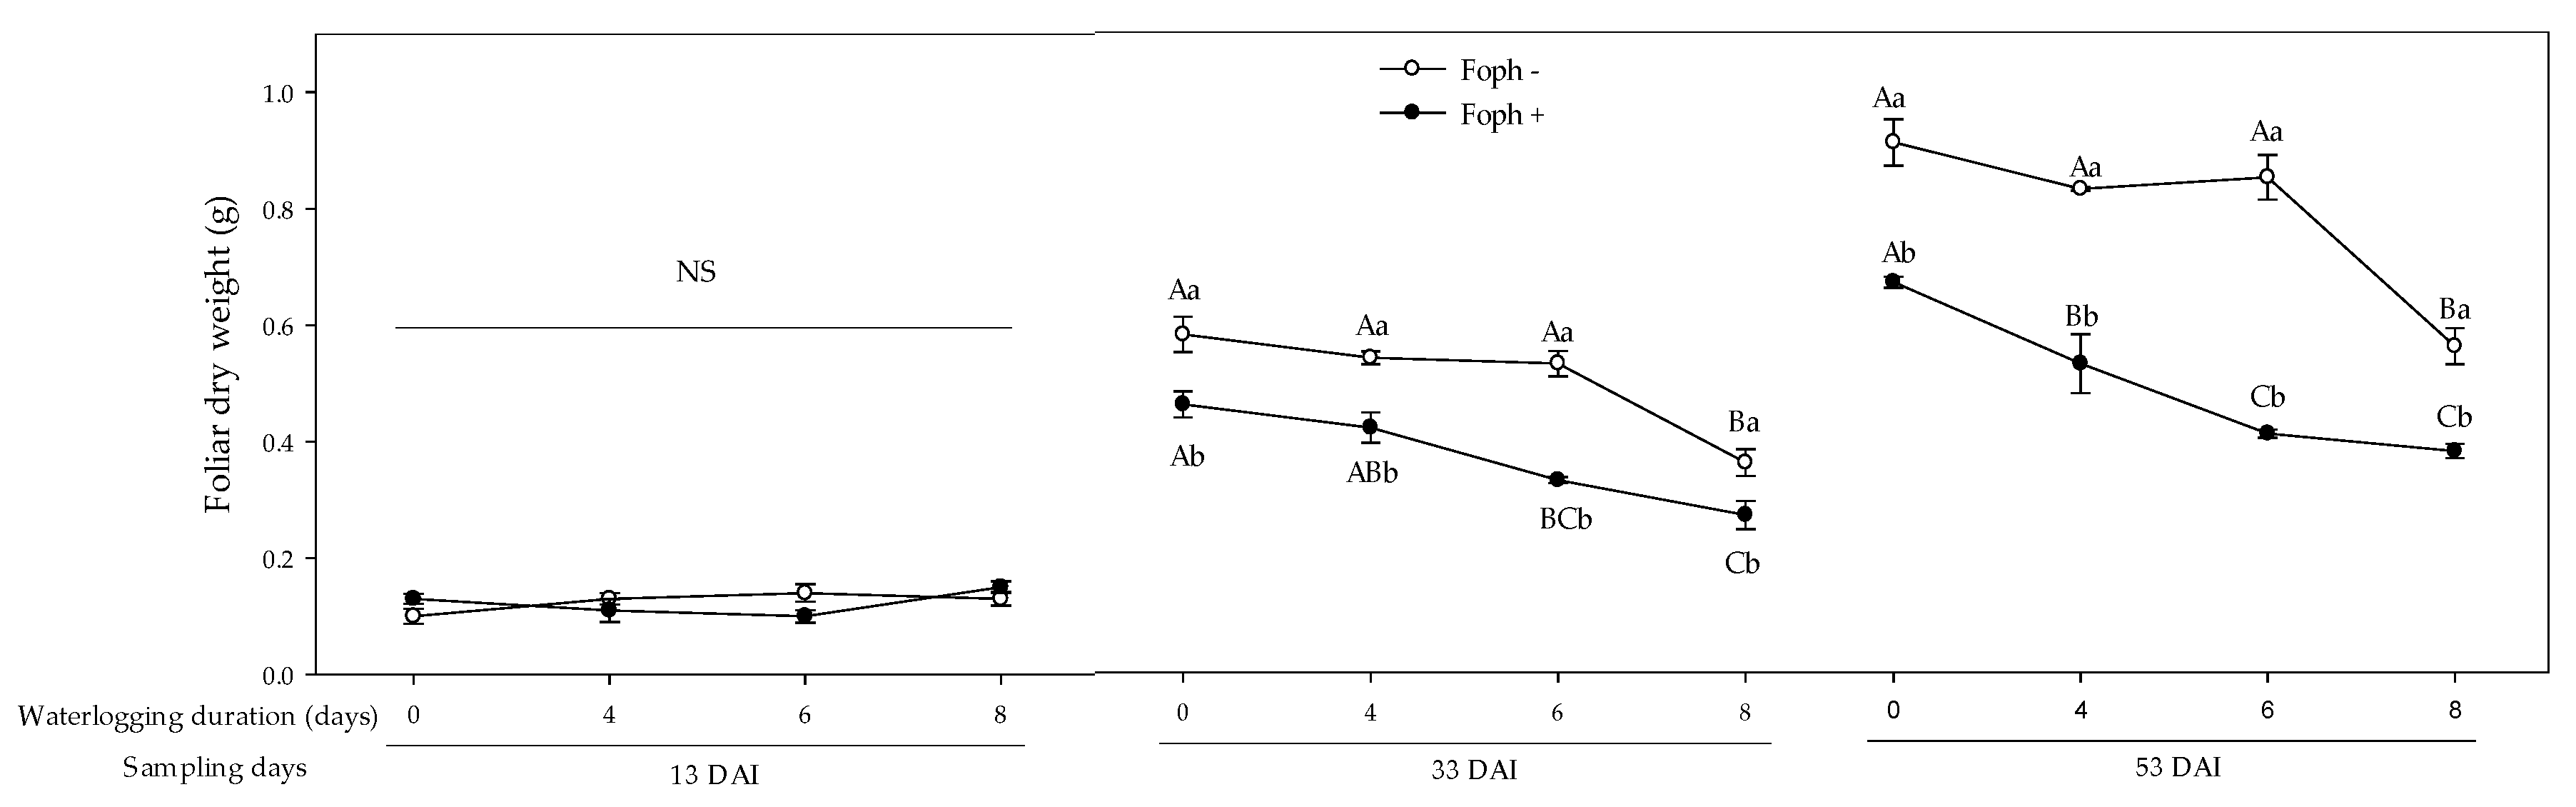
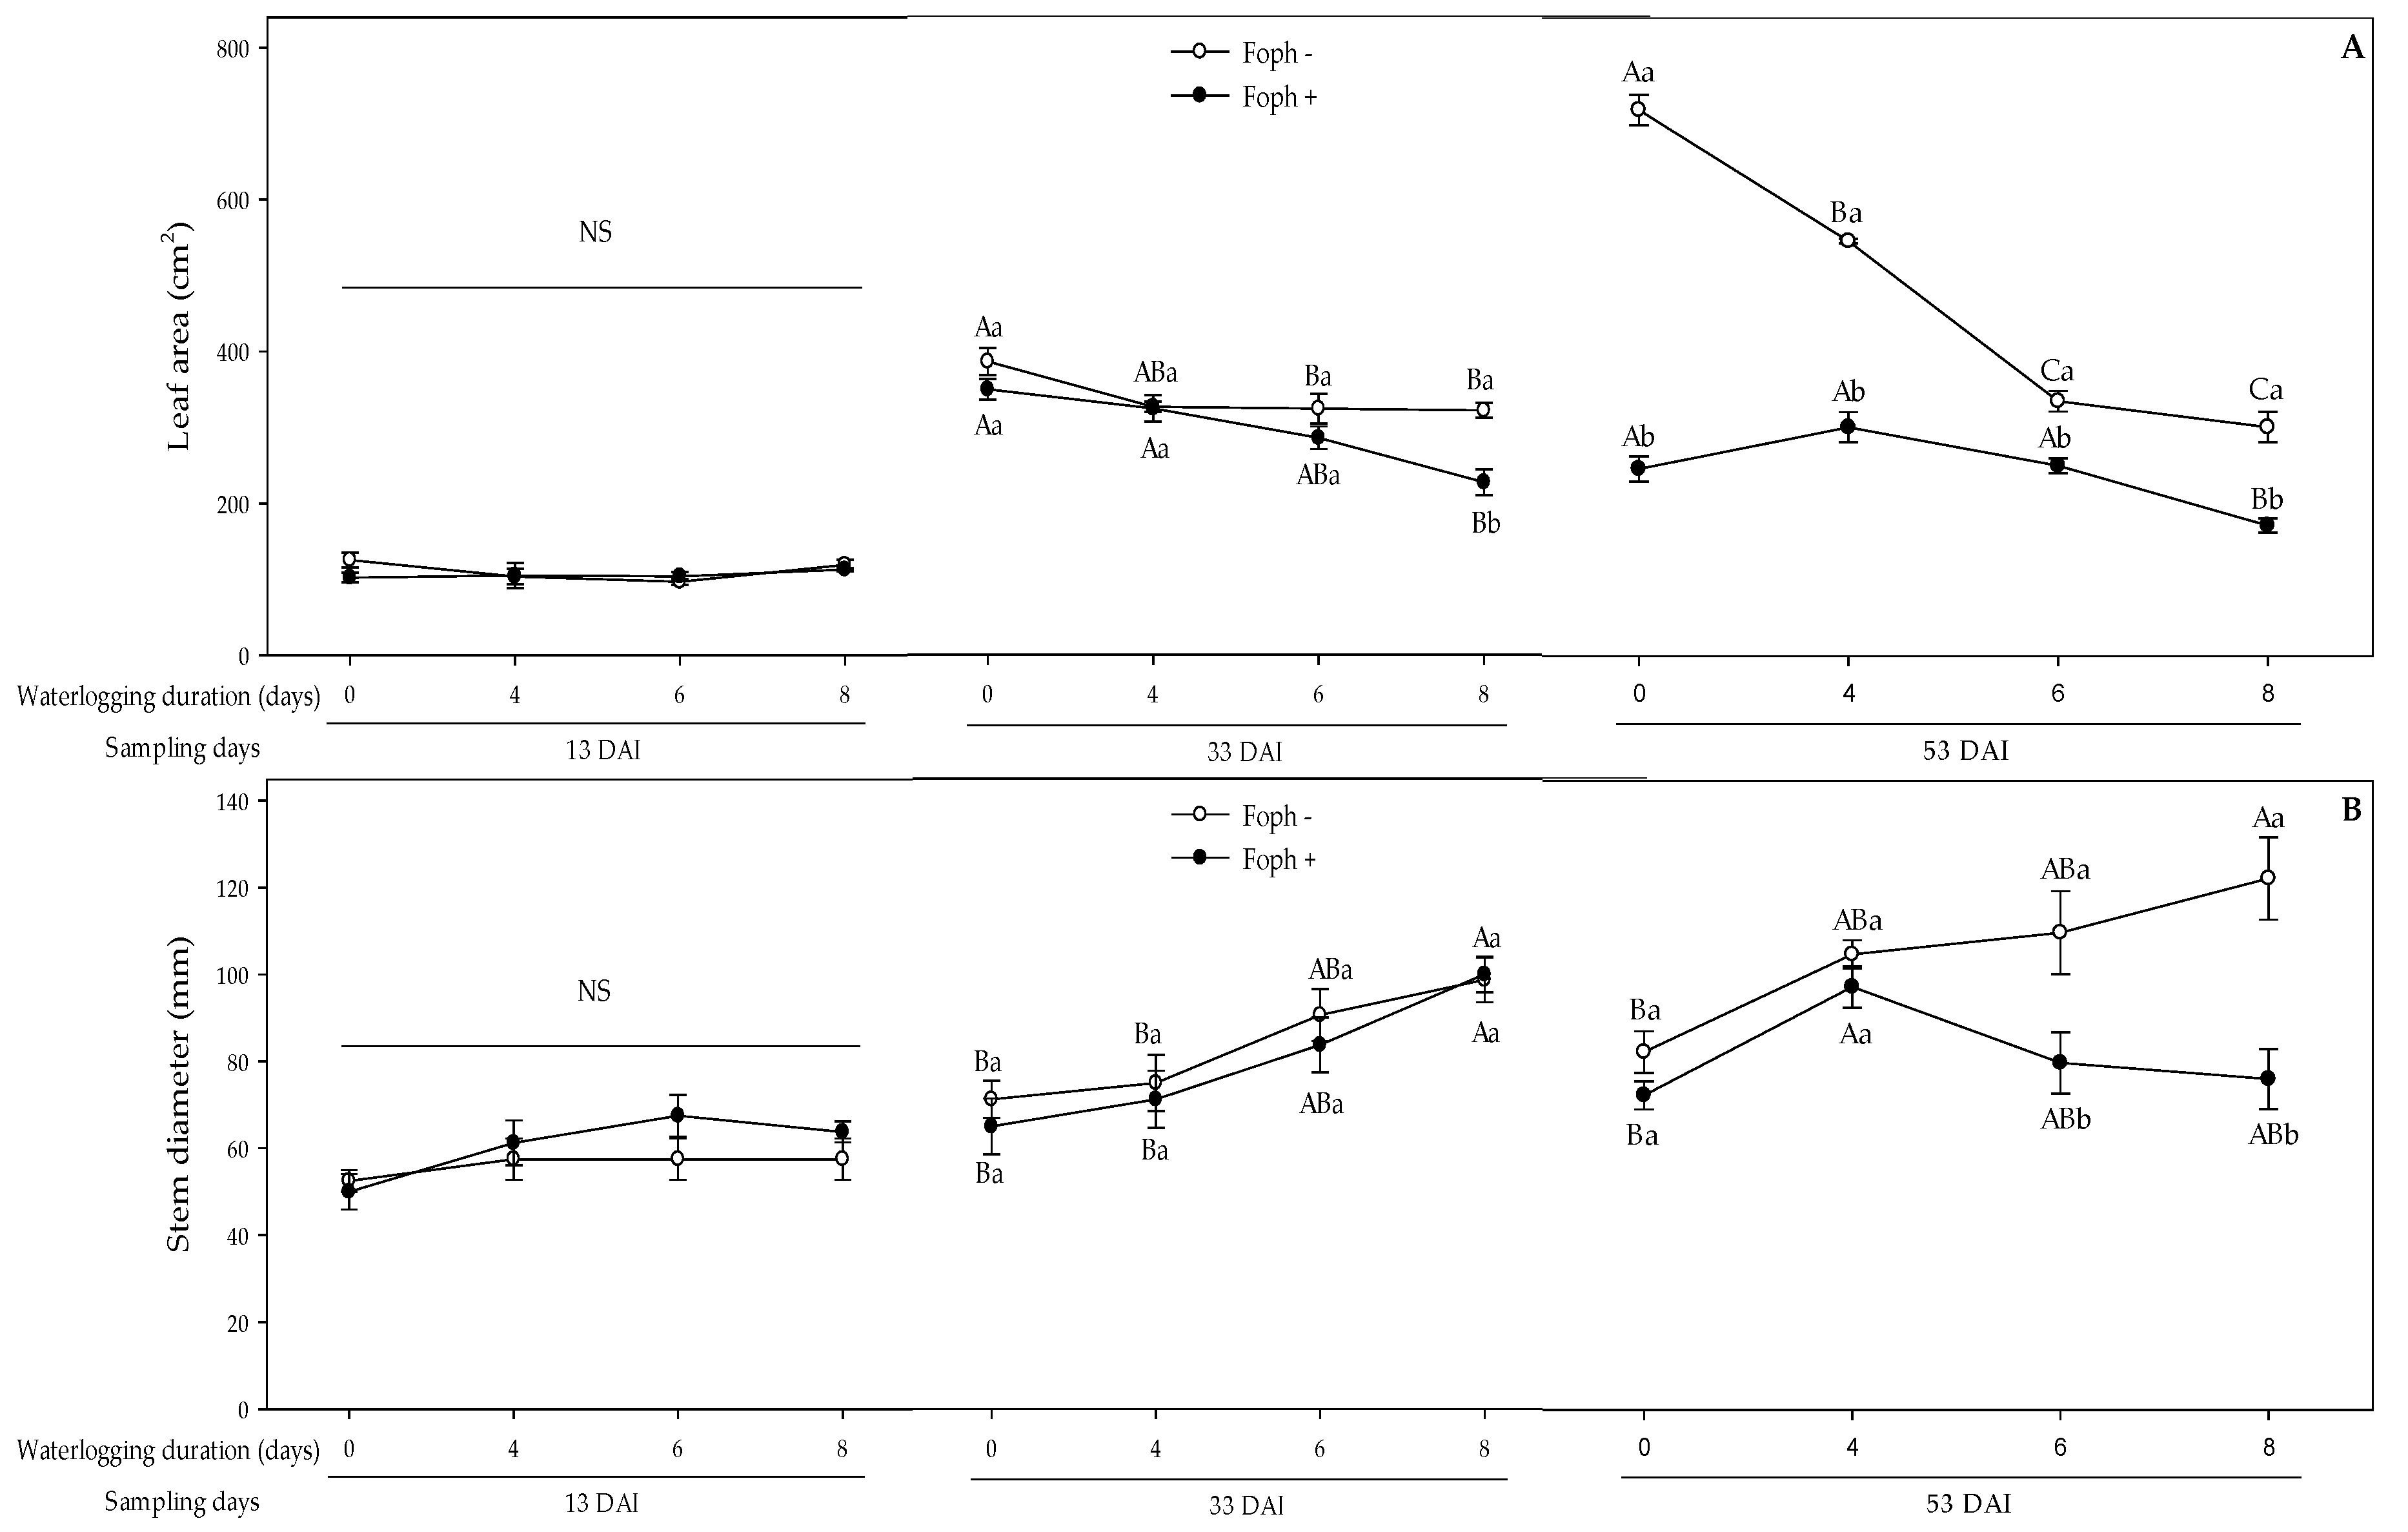
3.3. Growth Response

Growth parameters (foliar dry weight (FDW), leaf area (LA) and stem diameter) of cape gooseberry plants showed differences (p < 0.05, <0.001, and <0.05, respectively) in the interaction between the waterlogging periods, Foph presence and time (Table 2). From the second and third sampling points (33 and 53 DAI), plants without Foph presence, in general, showed higher FDW values compared to inoculated plants. In both inoculation conditions, the FDW decreased as the waterlogging periods increased, with the lowest values with waterlogging for 8 d at the above-mentioned sampling days (Figure 3).
Significant differences were not observed on LA and stem diameter between inoculation and waterlogging periods at 13 DAI. At 33 and 53 DAI, a progressive LA reduction was observed with the increase of the waterlogging periods in plants with both inoculation conditions. Likewise, the inoculated plants showed a lower LA through the experiment. In addition, the lowest LA values were obtained in plants with waterlogging for 8 d and with Foph (Figure 4A). Regarding stem diameter, similar trends were observed between waterlogging periods and Foph inoculation at 33 DAI, in which an increase in stem diameter was observed as waterlogging periods increased in both inoculation conditions. However, contrasting trends were obtained on this variable at 53 DAI. Stem diameter was favored in plants subjected to different episodes of waterlogging in the absence of the pathogen. On the other hand, stem diameter increased when plants with Foph were subjected to 4 d of waterlogging; then, longer waterlogging periods (6 and 8 d) caused a drop in this variable (Figure 4B).
The combination of abiotic and biotic stresses has an impact on plant growth [46]. Therefore, the interaction between waterlogging and the presence of Foph caused a lower plant growth (LA, FDW and stem diameter) in this study, which was mainly observed at 53 DAI. Villarreal-Navarrete et al. [6] also observed a decrease of 57.3% in the values of the stem diameter and 42.1% in LA values in cape gooseberry plants with 6 d of waterlogging and inoculated with FO compared to control plants. Suzuki et al. [79] reported that the interaction between abiotic and biotic (pathogen) stresses can also generate alterations in physiological traits such as photosynthetic activity (photosystems efficiency or rubisco enzyme activity), hormonal signaling or nutritional status. On the other hand, the present work also showed that the stem diameter of cape gooseberry plants was favored mainly by the increase in the duration of waterlogging in non-inoculated plants. Flórez-Velasco et al. [9] also observed a greater stem diameter in lulo plants with a period of 4 d of waterlogging and mentioned that an increase in the thickness of the stem may be due to the formation of aerenchyma that facilitates the transport of oxygen from the stems to the roots under hypoxia or anoxia conditions. On the other hand, a decrease in stem diameter was observed from a waterlogging period of 6 d in inoculated plants. The reduction of stem diameter in this group of plants was related with the plant infection since the fungal hyphae cause the reduction of the diameter of the xylem vascular elements. This causes a higher resistance to water flow which results in leaf vascular wilt due to water deficiency [77].

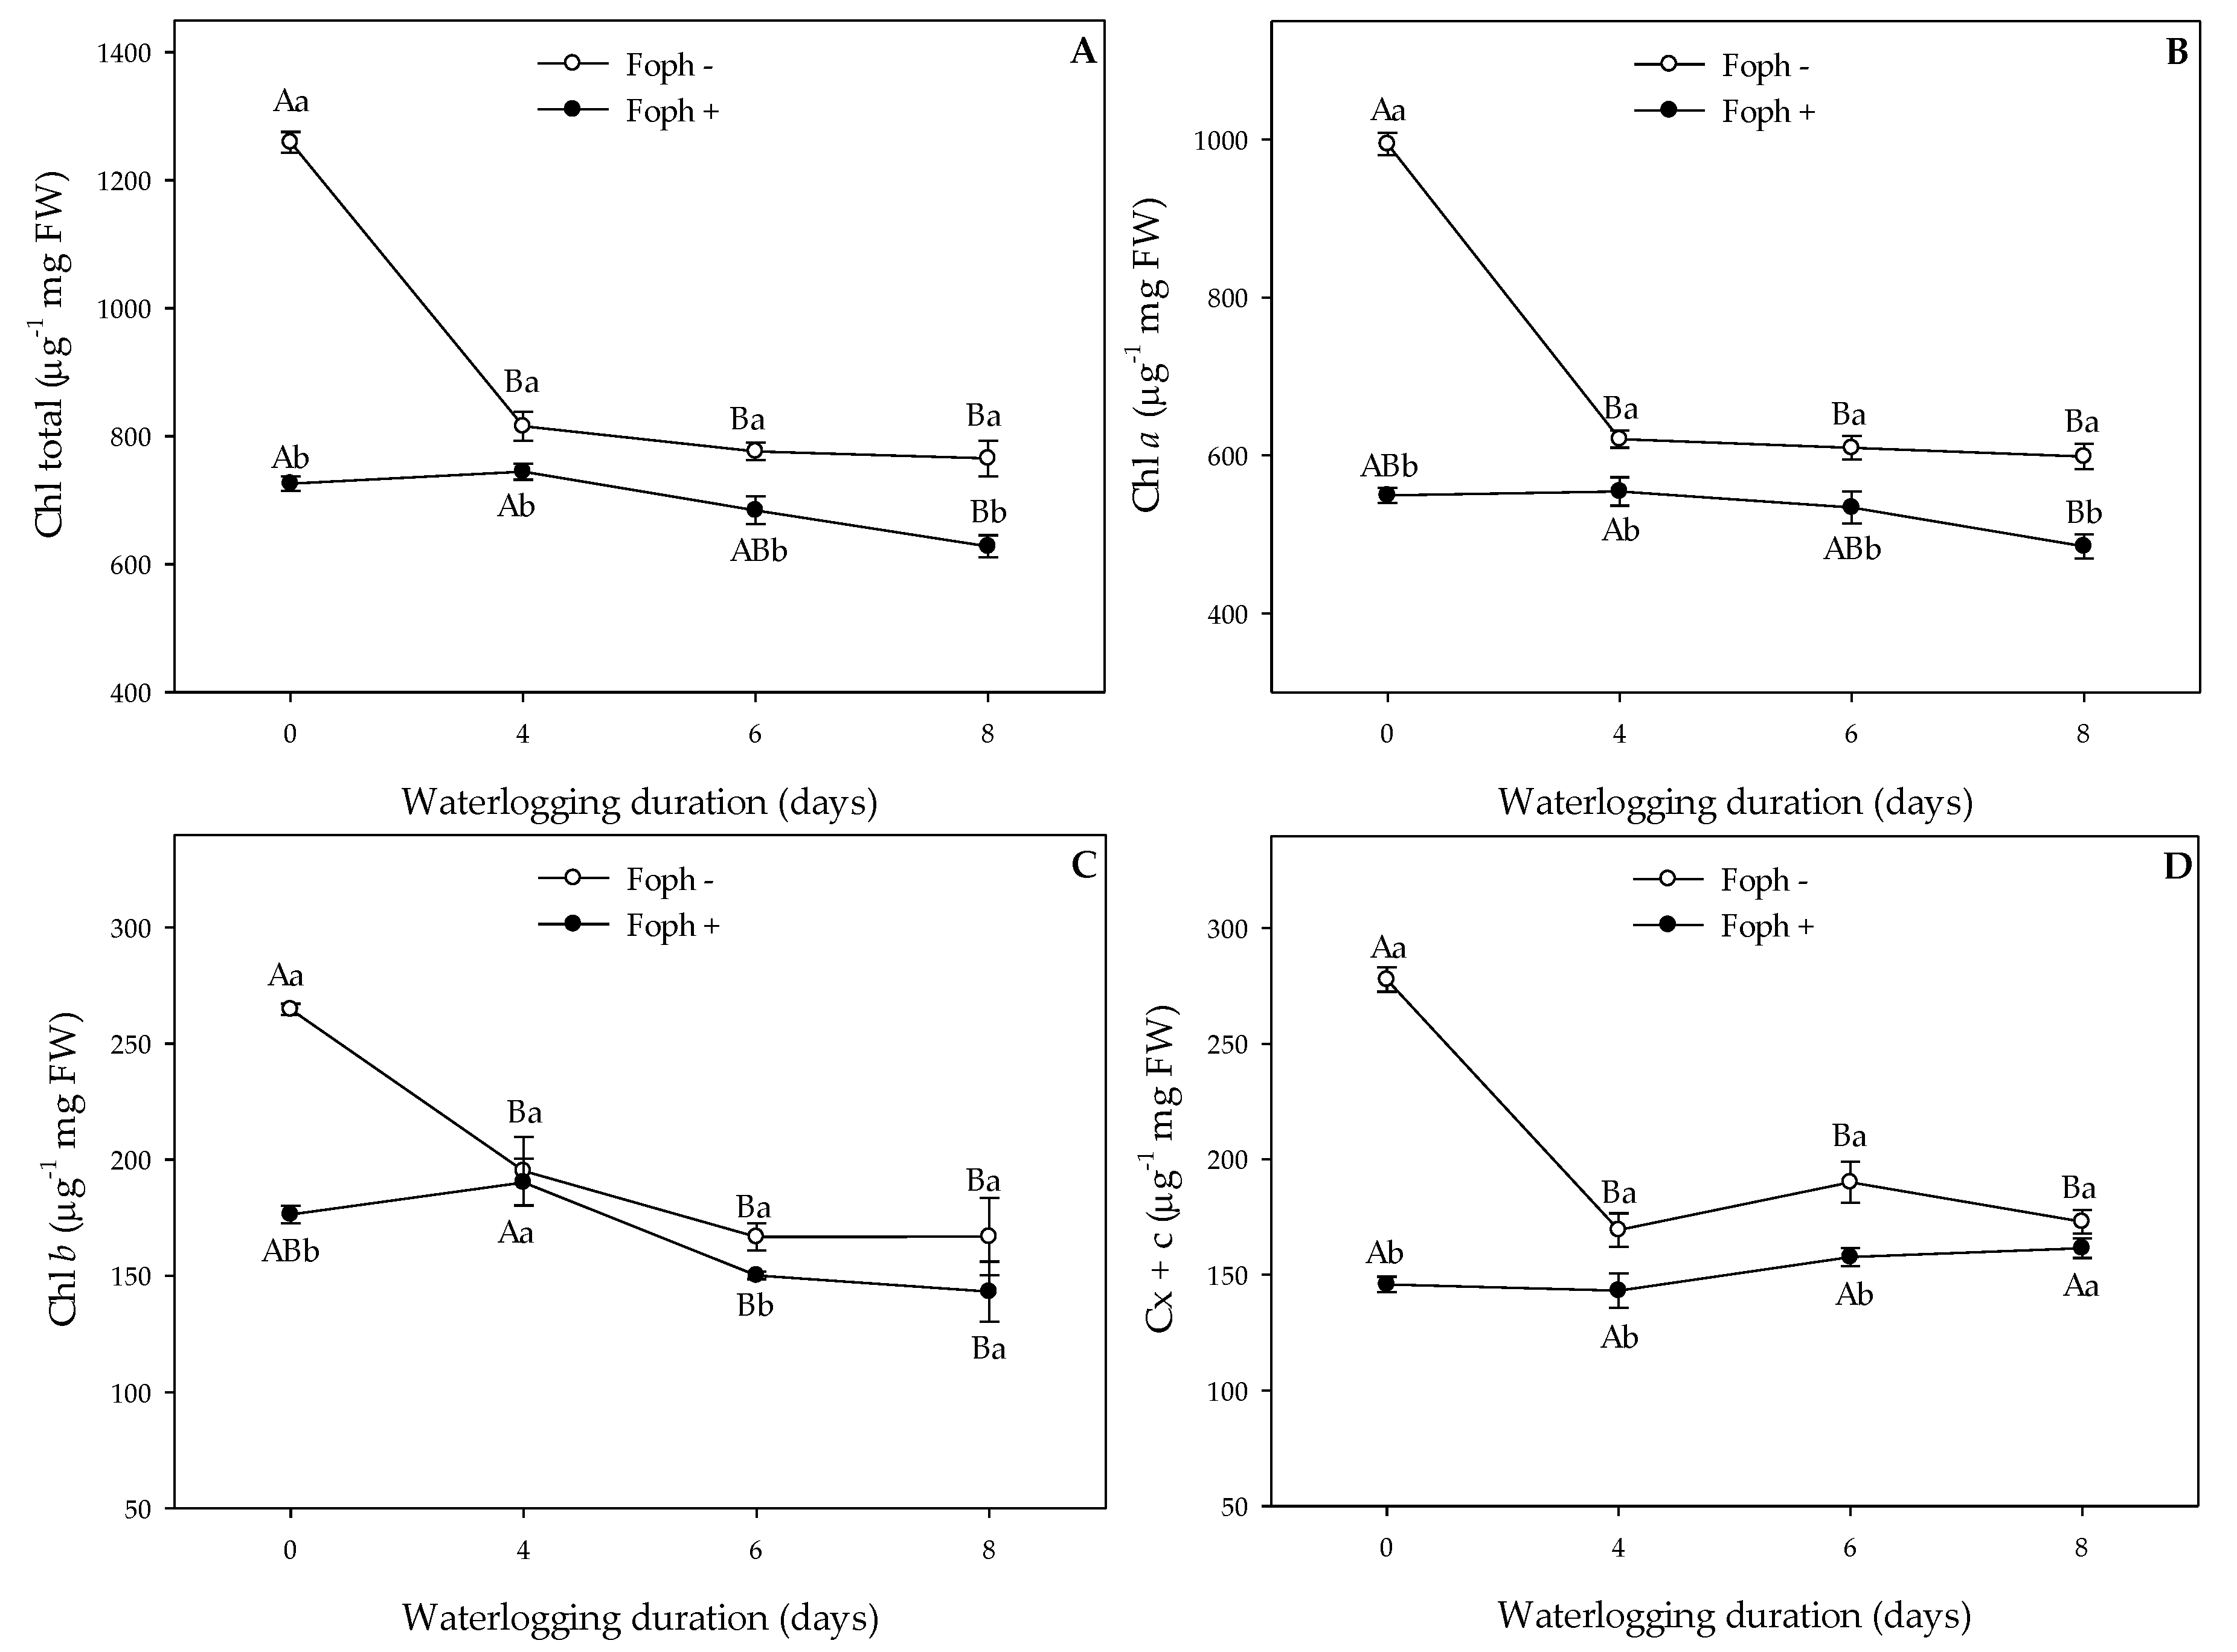
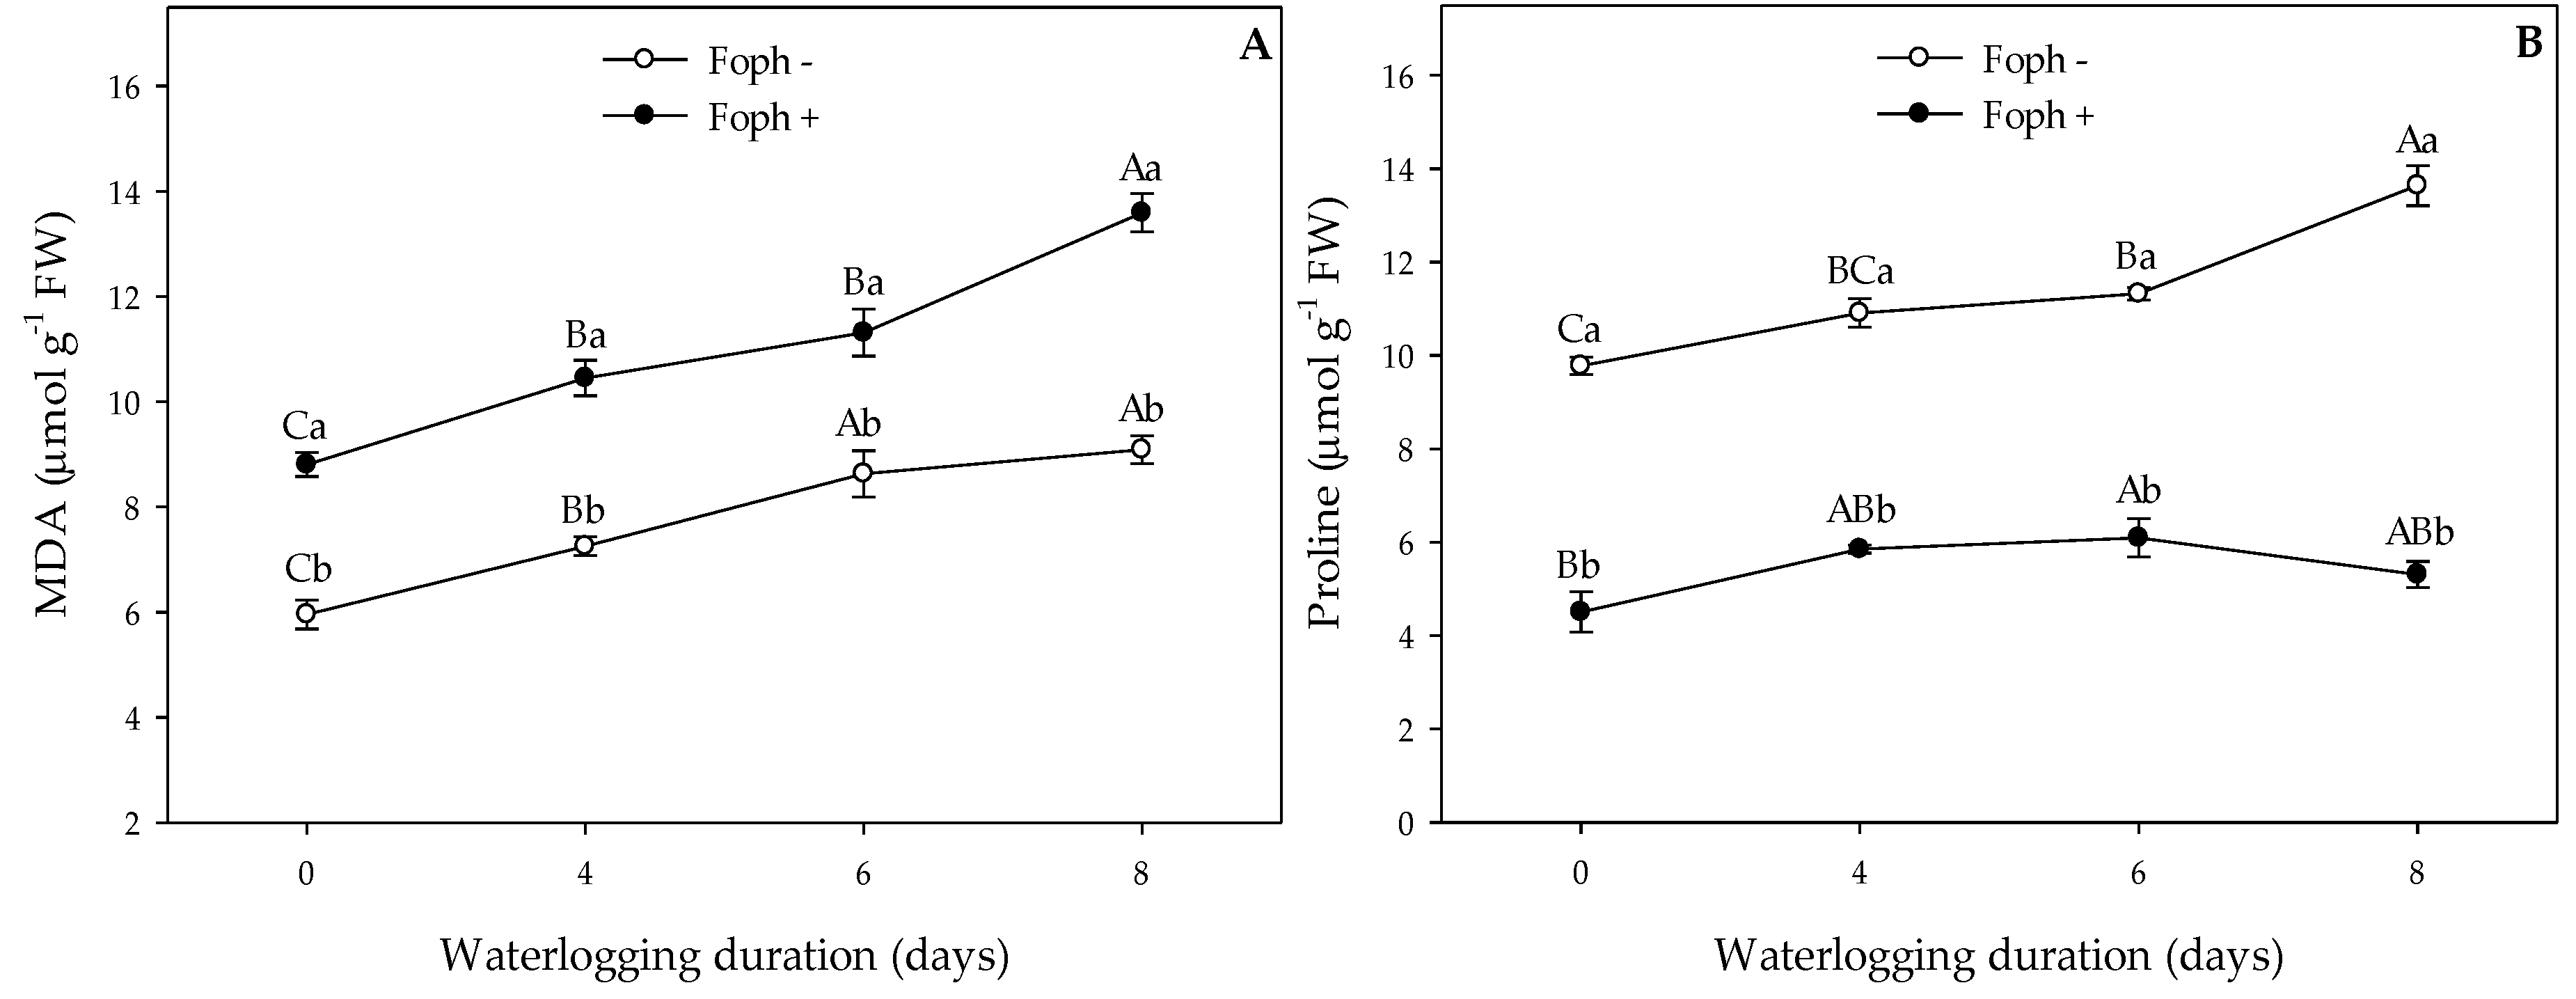
3.4. Biochemical Tests on Leaves (Malondialdehyde Content, Photosynthetic Pigments and Proline)

Significant differences in the interaction between waterlogging periods and inoculation on leaf chlorophyll a (p < 0.001), chlorophyll b (p < 0.05), total chlorophyll (p < 0.001), carotenoids (p < 0.001), MDA (p < 0.05) and proline (p < 0.001) were found only at 53 DAI (Table 1). In general, leaf photosynthetic pigments content (chlorophyll a, b, total and carotenoids) was lower in plants inoculated with Foph and/or subjected to 4, 6 and 8 d of waterlogging compared to plants without any stressful condition (Figure 5A–D). However, MDA contents increased under both stress conditions, with higher values observed in plants with Foph and with waterlogging for 8 d (~14 μmol g−1 FW) (Figure 6A). On the other hand, proline accumulation was mainly favored with the increase of the waterlogging periods, whereas proline synthesis was not stimulated by Foph presence (Figure 6B).
It has been widely reported that leaf photosynthetic pigments content (chlorophylls a, b and carotenoids) and biochemical markers such as proline and MDA may indicate plant susceptibility or tolerance to abiotic or biotic stress conditions [80,81,82]. In the present study, leaf photosynthetic pigments were negatively affected by waterlogging and/or Foph. Alwathnani and Perveen [83] also found that tomato plants (Solanum lycopersicum L.) infected with F. oxysporum f. sp. lycopersici showed an 80% decrease in leaf chlorophyll content. Leaf chlorophyll degradation was also observed in Andean fruit trees under conditions of soil oxygen deficit [5,9,10]. A low leaf chlorophyll content under both factors studied may be due to the fact that FO has the capacity to produce fusaric acid (pathogenicity factor), which alters the plant’s metabolism and favors leaf photosynthetic pigments degradation [11]. Also, waterlogging periods can cause an increase in chlorophyllase activity (chlorophyll degradation) as well as in the ethylene synthesis, which generates leaf senescence [24,42].
A high MDA accumulation indicates a greater damage in the cell membrane stability due to stressful conditions [84]. Higher MDA contents have been reported under waterlogging conditions in tomato or FO presence in pigeonpea, mung (Vigna radiata) and black bean (Vigna mungo) plants [33,35]. On the other hand, proline is a molecule that confers plant tolerance under different stress conditions; an increase of this amino acid can suggest a plant acclimation mechanism [81]. In this study, proline synthesis was only favored by soil oxygen deficit (Figure 6B). Pérez-Jiménez et al. [85] also observed a greater proline accumulation (>60%) in four sweet cherry (Prunus avium L. Batsch) genotypes with waterlogging for 7 d compared to genotypes without waterlogging. In this regard, a higher proline content in plants under waterlogging conditions may help to maintain a normal plant osmoregulation and/or act as a compatible solute to adjust the osmotic potential in the cytoplasm [84,86]. However, proline content did not show any variations in Foph inoculated plants under different waterlogging periods in this study. Sun et al. [18] did not observe any variations in proline production in cucumber (Cucumis sativus L.) plants inoculated with F. oxysporum f. sp. cucumerinum. Additionally, these authors stated that FO presence affects plant nitrogen metabolism, conditioning the synthesis of this molecule.

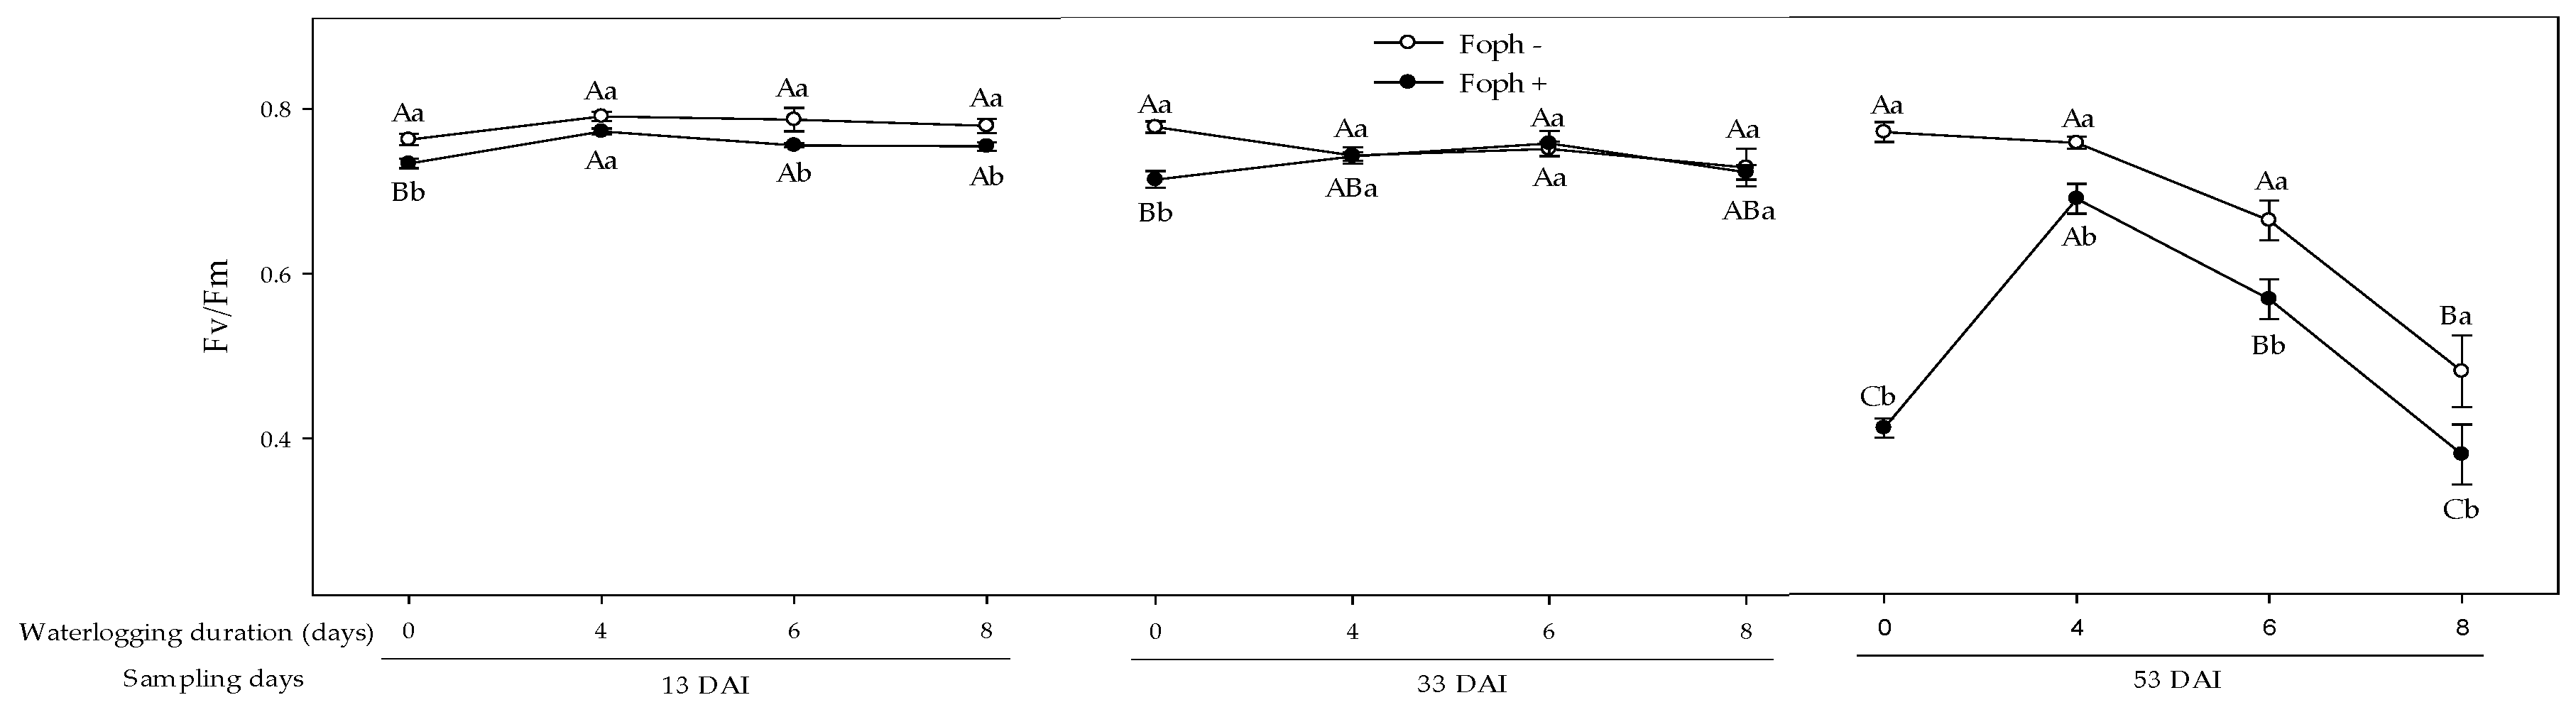
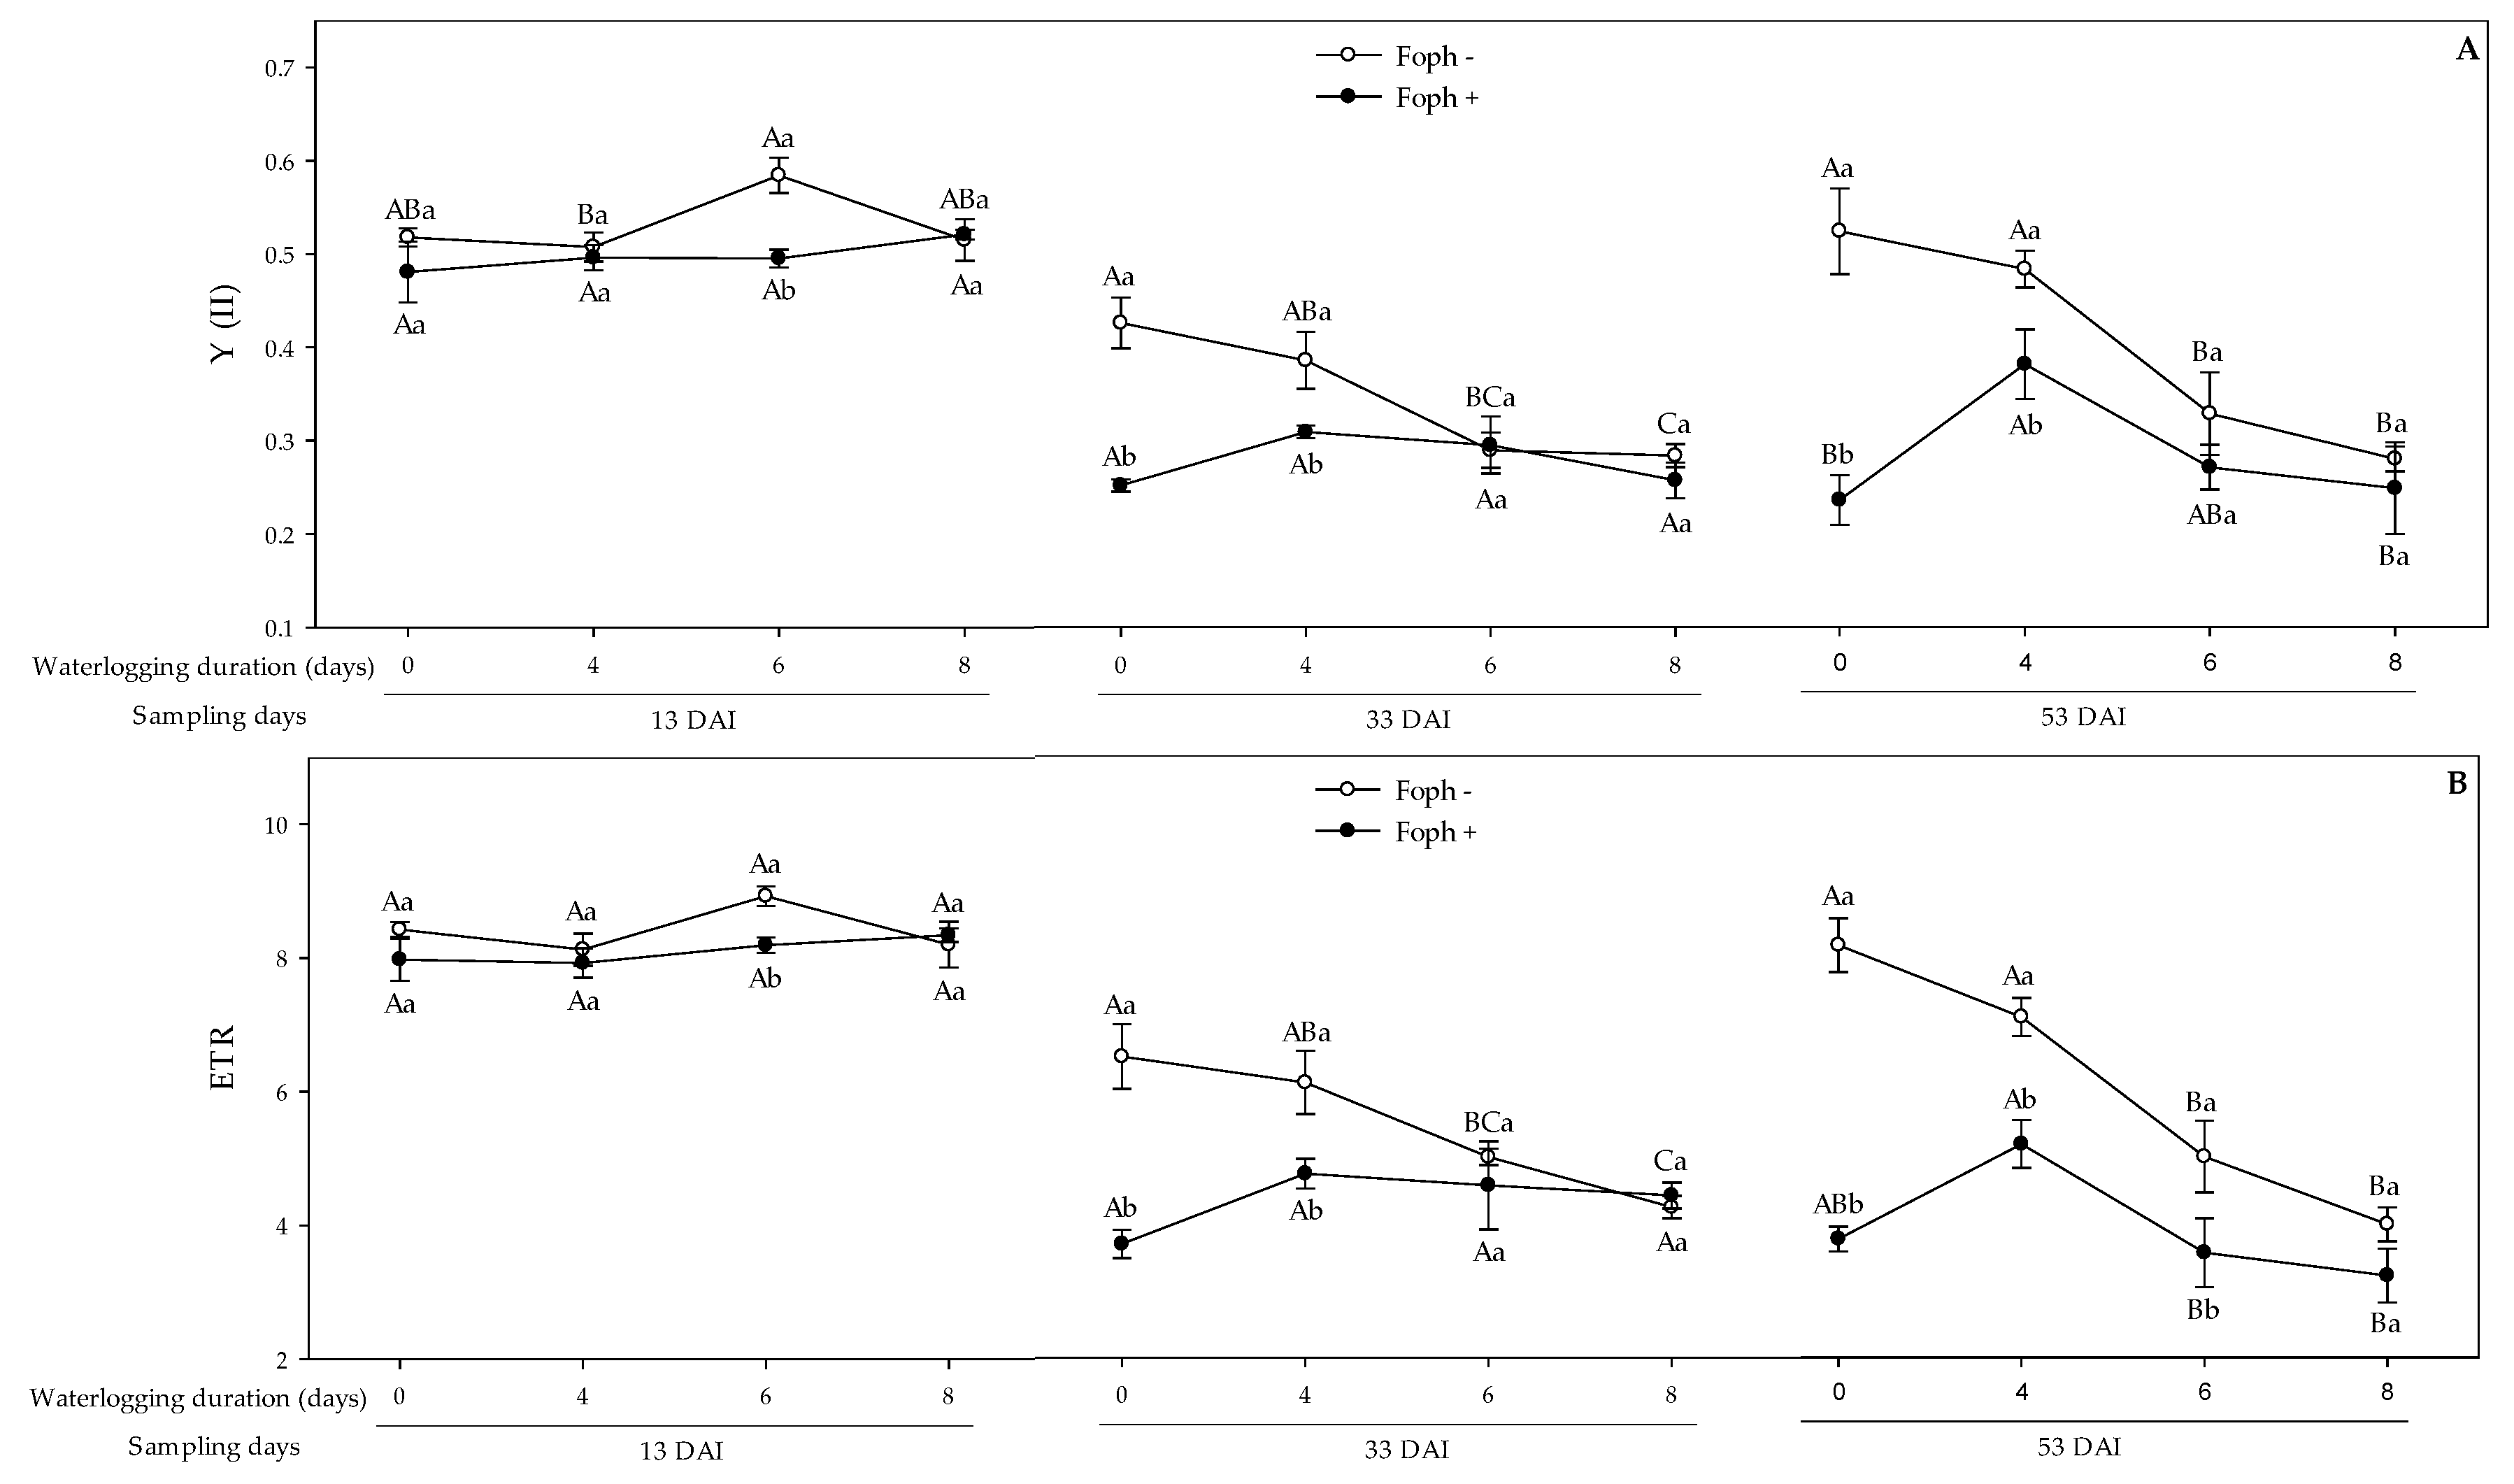
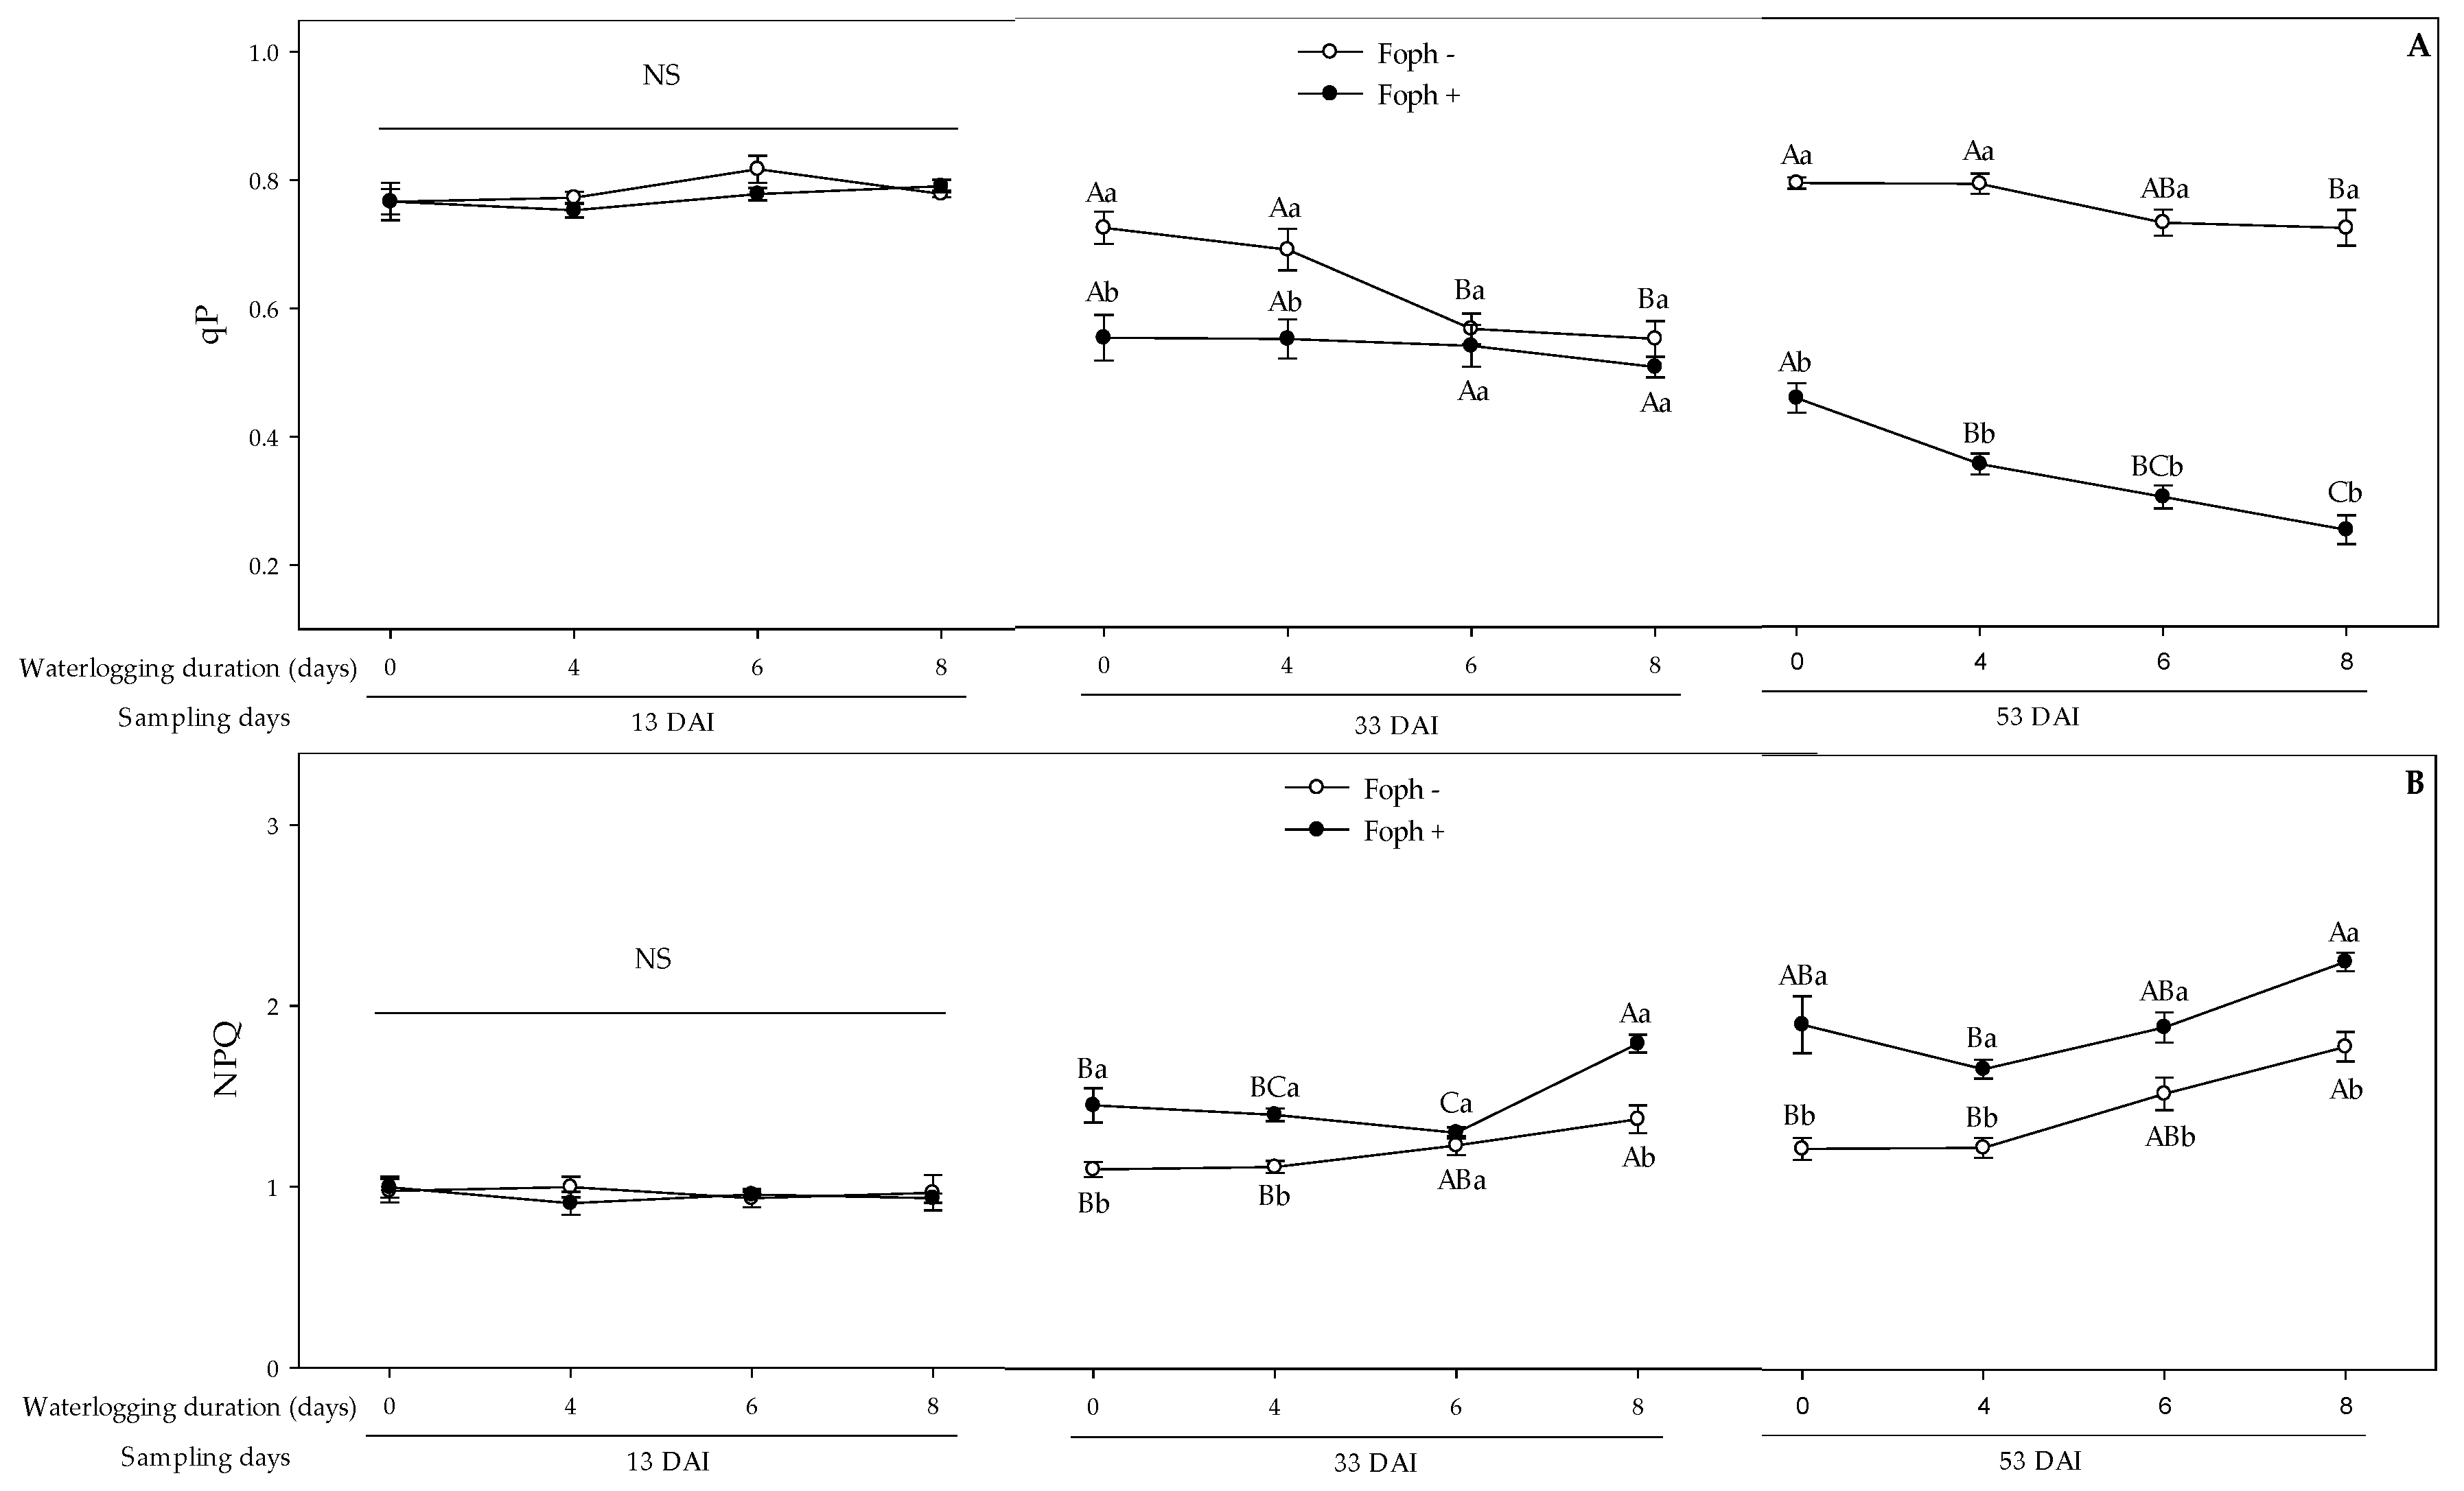
3.5. Chlorophyll Fluorescence Parameters

Table 2 shows that differences between waterlogging, Foph inoculation, and sampling time were obtained on Fv/Fm (p < 0.001), Y(II) (p < 0.01), ETR (p < 0.01) and qP (p < 0.01).
Differences were only obtained between inoculation treatments at 13 DAI. Nevertheless, a lower Fv/Fm ratio was recorded in cape gooseberry plants only inoculated with Foph at 33 DAI. At the end of the experiment (53 DAI), Fv/Fm ratio showed a progressive decrease in relation to the higher soil oxygen deficit period. Also, Foph caused a greater affectation of this ratio in plants under waterlogging for 8 d compared with inoculated plants under 4 and 6 d of waterlogging, respectively (Figure 7).
In general, differences between interaction factors were not recorded in Y(II) and ETR at 13 DAI. At 33 DAI, Y(II) and ETR values decreased as the waterlogging periods evaluated increased in non-inoculated plants. Foph inoculation caused a drop of approximately 45% in these variables, mainly at 0 and 4 d of waterlogging. At 53 DAI, similar trends were maintained, in which Y(II) and ETR values decreased when waterlogging periods (4, 6 and 8 d) increased in plants without Foph inoculation. On the other hand, Foph presence also influenced Y (II) and ETR values, observing a similar reduction (>50%) in inoculated plants in the different waterlogging periods (Figure 8A,B).
The qP and NPQ did not show any significant differences between factors interaction (waterlogging periods and Foph inoculation) in the first sampling point (13 DAI). However, qP started to show differences between the evaluated factors separately at 33 DAI, where plants subjected to the longest waterlogging periods (6 and 8 d) had the lowest value (Figure 9A).
Furthermore, Foph inoculation factor showed that plants with pathogen presence registered the lowest qP values. A significant interaction at 53 DAI was observed between waterlogging and inoculation in which plants without Foph under the different waterlogging periods recorded the highest qP values. Additionally, Foph presence caused a drastic fall in this variable, which was accentuated by the different waterlogging times (Figure 9A). Regarding NPQ, opposite results were found, where this variable was higher in plants with Foph and subjected to the four different waterlogging periods evaluated at both 33 and 53 DAI (Figure 9B).
The measurement of chlorophyll a fluorescence is a rapid and non-destructive technique that allows estimating the plant’s tolerance or acclimation level to abiotic and biotic stress conditions [87,88]. Parameters such as Fv/Fm, qP, Y(II), ETR and NPQ have been applied as plant acclimation indicators to stressful conditions [84,87,89]. In this sense, Fv/Fm ratio is a sensitive indicator of the environmental effects on the plant acclimation [22]. In the present study, Fv/Fm was affected both by the waterlogging periods and the pathogen presence. Zhang et al. [90] also found a decrease in Fv/Fm values in ninebark (Physocarpus amurensis Maxim.) plants with a waterlogging period of 16 d. On the other hand, the inoculation with F. oxysporum f. sp. cubense and f. sp. ciceri also caused a decrease in Fv/Fm in banana (Musa AAA) and chickpea (Cicer arietinum L.) plants, respectively [91,92].
The qP is a parameter that is used to estimate PSII saturation level under stress conditions [93]. A lower qP has been reported under waterlogging conditions in avocado (Persea americana Mill.) plants inoculated with Phytophthora cinnamomi [94]. Similar results were also reported in this study, in which cape gooseberry plants inoculated with Foph under the different waterlogging periods showed a decrease in qP. Lower Fv/Fm and qP under stress conditions (waterlogging and Foph) may be due to the fact that these factors cause leaf photosynthetic pigments degradation, a high ethylene and reactive oxygen species (ROS) production which affect the biochemical function of chloroplasts [24,91,92]. Likewise, NPQ is an important plant photoprotective mechanism to abiotic and biotic stress conditions [95]. In this study, high NPQ values were mainly observed in cape gooseberry plants inoculated with Foph and subjected to waterlogging periods. Zhou et al. [96] also observed a higher NPQ in sweat weed (Kosteletzkya virginica L.) plants with waterlogging for 35 d. High NPQ values have also been reported in tomato plants after inoculation with FO [97,98]. A higher NPQ indicates a dissipation of excess energy in the PSII in the form of heat as a plant protection mechanism to stress [84,99].

4. Conclusions

In summary, this study revealed that cape gooseberry plants are susceptible to waterlogging periods of over 6 d, which favor the severity of vascular wilt caused by Foph. The interaction between waterlogging and the pathogen caused important physiological disorders such as a decrease in stomatal conductance, leaf water potential, leaf area, proline and fluorescence parameters of chlorophyll a (Fv/Fm, ETR, Y(II) and qP). In addition, longer waterlogging periods caused stem diameter reduction in inoculated plants. NPQ and malondialdehyde (MDA) can also be considered as physiological and biochemical markers to quantify plant susceptibility to combined stress, since higher NPQ and MDA indicate that the plant can be seriously compromised. The results obtained suggest that cape gooseberry plants ecotype “Colombia” have a low acclimation to events where waterlogging periods of more than 6 d can be expected in soils with the presence of the pathogen F. oxysporum f. sp. physali. Additionally, the use of chlorophyll fluorescence parameters can be considered a reliable tool for understanding cape gooseberry acclimation mechanisms to abiotic and biotic stress conditions.

Author Contributions

C.C.C.-A. conducted the experiments, performed the analyses, collected the data and wrote the manuscript. S.G.-C. Supervision, review and edited the manuscript. H.R.-D. conceived and designed the experiments, read and edited the manuscript. All authors approved the final manuscript.

Funding

This research received no external funding.

Conflicts of Interest

The authors declare no conflict of interest.

References

  1. Fischer, G.; Almanza-Merchán, P.J.; Miranda, D. Importancia y cultivo de la uchuva (Physalis peruviana L.). Rev. Bras. Frutic. 2014, 36, 1–15. [Google Scholar] [CrossRef]
  2. Ramadan, M.F. Bioactive phytochemicals, nutritional value, and functional properties of cape gooseberry (Physalis peruviana): An overview. Food Res. Int. 2011, 44, 1830–1836. [Google Scholar] [CrossRef]
  3. Agronet. Available online: http://www.agronet.gov.co/estadistica/Paginas/default.aspx (accessed on 1 October 2019).
  4. Osorio-Guarín, J.A.; Enciso-Rodríguez, F.E.; González, C.; Fernández-Pozo, N.; Mueller, L.A.; Barrero, L.S. Association analysis for disease resistance to Fusarium oxysporum in cape gooseberry (Physalis peruviana L.). BMC Genomics 2016, 17, 248. [Google Scholar] [CrossRef]
  5. Aldana, F.; García, P.N.; Fischer, G. Effect of waterlogging stress on the growth, development and symptomatology of cape gooseberry (Physalis peruviana L.) plants. Rev. Acad. Colomb. Cienc. Exactas. Fis. Nat. 2014, 38, 393–400. [Google Scholar] [CrossRef]
  6. Villarreal-Navarrete, A.; Fischer, G.; Melgarejo, L.M.; Correa, G.; Hoyos-Carvajal, L. Growth response of the cape gooseberry (Physalis peruviana L.) to waterlogging stress and Fusarium oxysporum infection. Acta Hortic. 2017, 1178, 161–168. [Google Scholar] [CrossRef]
  7. Cotes, A.M.; Jiménez, P.; Rodríguez, M.X.; Díaz, A.; Zapata, J.; Gómez, M.; Grijalba, E.; Villamizar, L.; González, C.; Smith, A.; et al. Estrategias de control biológico de Fusarium Oxysporum en el cultivo de la Uchuva (Physalis peruviana L.); Corporación colombiana de investigación agropecuaria (Corpoica): Bogotá, Colombia, 2012; p. 82. [Google Scholar]
  8. Simbaqueba, J.; Catanzariti, A.M.; González, C.; Jones, D.A. Evidence for horizontal gene transfer and separation of effector recognition from effector function revealed by analysis of effector genes shared between cape gooseberry-and tomato-infecting formae speciales of Fusarium oxysporum. Mol. Plant Pathol. 2018, 19, 2302–2318. [Google Scholar] [CrossRef]
  9. Flórez-Velasco, N.; Balaguera-López, H.E.; Restrepo-Díaz, H. Effects of foliar urea application on lulo (Solanum quitoense cv. septentrionale) plants grown under different waterlogging and nitrogen conditions. Sci. Hortic. 2015, 186, 154–162. [Google Scholar] [CrossRef]
  10. Betancourt-Osorio, J.; Sánchez-Canro, D.; Restrepo-Díaz, H. Effect of nitrogen nutritional statuses and waterlogging conditions on growth parameters, nitrogen use efficiency and chlorophyll fluorescence in tamarillo Seedlings. Not. Bot. Horti Agrobot. 2016, 44, 375–381. [Google Scholar] [CrossRef]
  11. Wu, H.S.; Raza, W.; Fan, J.Q.; Sun, Y.G.; Bao, W.; Liu, D.Y.; Miao, W.G. Antibiotic effect of exogenously applied salicylic acid on in vitro soilborne pathogen. Fusarium oxysporum f. sp. niveum. Chemosphere 2008, 74, 45–50. [Google Scholar] [CrossRef]
  12. Jiménez-Fernández, D.; Montes-Borrego, M.; Navas-Cortés, J.A.; Jiménez-Díaz, R.M.; Landa, B.B. Identification and quantification of Fusarium oxysporum in planta and soil by means of an improved specific and quantitative PCR assay. Appl. Soil Ecol. 2010, 46, 372–382. [Google Scholar] [CrossRef]
  13. Portal, N.; Soler, A.; Alphonsine, P.A.M.; Borras-Hidalgo, O.; Portieles, R.; Peña-Rodriguez, L.M.; Walton, J.D. Nonspecific toxins as components of a host-specific culture filtrate from Fusarium oxysporum f. sp. cubense race 1. Plant Pathol. 2018, 67, 467–476. [Google Scholar] [CrossRef]
  14. Lorenzini, G.; Guidi, L.; Nali, C.; Ciompi, S.; Soldatini, G.F. Photosynthetic response of tomato plants to vascular wilt diseases. Plant Sci. 1997, 124, 143–152. [Google Scholar] [CrossRef]
  15. Nogués, S.; Cotxarrera, L.; Alegre, L.; Trillas, M.I. Limitations to photosynthesis in tomato leaves induced by Fusarium wilt. N. Phytol. 2002, 154, 461–470. [Google Scholar] [CrossRef]
  16. Gawehns, F.; Ma, L.; Bruning, O.; Houterman, P.M.; Boeren, S.; Cornelissen, B.J.; Takken, F.L. The effector repertoire of Fusarium oxysporum determines the tomato xylem proteome composition following infection. Front. Plant Sci. 2015, 6, 967. [Google Scholar] [CrossRef]
  17. Gordon, T.R. Fusarium oxysporum and the Fusarium wilt syndrome. Annu. Rev. Phytopathol. 2017, 55, 23–39. [Google Scholar] [CrossRef]
  18. Sun, Y.; Wang, M.; Li, Y.; Gu, Z.; Ling, N.; Shen, Q.; Guo, S. Wilted cucumber plants infected by Fusarium oxysporum f. sp. cucumerinum do not suffer from water shortage. Ann. Bot. 2017, 120, 427–436. [Google Scholar] [CrossRef]
  19. Ghaemi, A.; Rahimi, A.; Banihashemi, Z. Effects of Water Stress and Fusarium oxysporum f. sp. lycoperseci on Growth (leaf area, plant height, shoot dry matter) and Shoot Nitrogen Content of Tomatoes Under Greenhouse Conditions. Iran Agric. Res. 2010, 29, 51–62. [Google Scholar] [CrossRef]
  20. Nosir, W.S. Trichoderma harzianum as a Growth Promoter and Bio-Control Agent against Fusarium oxysporum f. sp. tuberosi. Adv. Crop. Sci. Tech. 2016, 4, 1–7. [Google Scholar] [CrossRef]
  21. Zhou, J.; Wang, M.; Sun, Y.; Gu, Z.; Wang, R.; Saydin, A.; Guo, S. Nitrate increased cucumber tolerance to fusarium wilt by regulating fungal toxin production and distribution. Toxins 2017, 9, 100. [Google Scholar] [CrossRef]
  22. Wu, X.; Tang, Y.; Li, C.; Wu, C.; Huang, G. Chlorophyll fluorescence and yield responses of winter wheat to waterlogging at different growth stages. Plant Prod. Sci. 2015, 18, 284–294. [Google Scholar] [CrossRef]
  23. Ren, B.; Zhang, J.; Dong, S.; Liu, P.; Zhao, B. Effects of waterlogging on leaf mesophyll cell ultrastructure and photosynthetic characteristics of summer maize. PLoS ONE 2016, 11, e0161424. [Google Scholar] [CrossRef] [PubMed]
  24. Rao, R.; Li, Y. Management of flooding effects on growth of vegetable and selected field crops. HortTechnology 2003, 13, 610–616. [Google Scholar] [CrossRef]
  25. Kallestad, J.C.; Sammis, T.W.; Mexala, J.G.; Gutschick, V. The impact of prolonged flood-irrigation on leaf gas exchange in mature pecans in an orchard setting. Int. J. Plant Prod. 2012, 1, 163–178. [Google Scholar] [CrossRef]
  26. Bertholdsson, N.O. Screening for barley waterlogging tolerance in nordic barley cultivars (Hordeum vulgare L.) using chlorophyll fluorescence on hydroponically-grown plants. Agronomy 2013, 3, 376–390. [Google Scholar] [CrossRef]
  27. He, L.; Yu, L.; Li, B.; Du, N.; Guo, S. The effect of exogenous calcium on cucumber fruit quality, photosynthesis, chlorophyll fluorescence, and fast chlorophyll fluorescence during the fruiting period under hypoxic stress. BMC Plant Biol. 2018, 18, 180. [Google Scholar] [CrossRef]
  28. Casierra-Posada, F.; Cutler, J. Photosystem II fluorescence and growth in cabbage plants (Brassica oleracea var. capitata) grown under waterlogging stress. Rev. U.D.C.A Actual. Divulg. Cient. 2017, 20, 321–328. [Google Scholar] [CrossRef]
  29. Yanar, Y.; Lipps, P.E.; Deep, I.W. Effect of soil saturation duration and soil water content on root rot of maize caused by Pythium arrhenomanes. Plant Dis. 1997, 81, 475–480. [Google Scholar] [CrossRef]
  30. Kirkpatrick, M.T.; Rothrock, C.S.; Rupe, J.C.; Gbur, E.E. The effect of Pythium ultimum and soil flooding on two soybean cultivars. Plant Dis. 2006, 90, 597–602. [Google Scholar] [CrossRef]
  31. Newcombe, M. Some effects of water and anaerobic conditions on Fusarium oxysporum f. cubense in soil. Trans. Br. Mycol. Soc. 1960, 43, 51–59. [Google Scholar] [CrossRef]
  32. Jain, R.; Singh, S.P.; Singh, A.; Singh, S.; Chandra, A.; Solomon, S. Response of foliar application of nitrogen compounds on sugarcane grown under waterlogging stress. Sugar Tech. 2015, 18, 433–436. [Google Scholar] [CrossRef]
  33. Rao, G.S.; Reddy, N.N.R.; Surekha, C. Induction of plant systemic resistance in Legumes Cajanus cajan, Vigna radiata, Vigna mungo against plant pathogens Fusarium oxysporum and Alternaria alternata–a Trichoderma viride mediated reprogramming of plant defense mechanism. Int. J. Recent Sci. Res. 2015, 6, 4270–4280. [Google Scholar]
  34. Jain, S.; Vaishnav, A.; Kumari, S.; Varma, A.; Tuteja, N.; Choudhary, D.K. Chitinolytic Bacillus-mediated induction of jasmonic acid and defense-related proteins in soybean (Glycine max L. Merrill) plant against Rhizoctonia solani and Fusarium oxysporum. J. Plant Growth Regul. 2016, 36, 200–214. [Google Scholar] [CrossRef]
  35. Rasheed, R.; Iqbal, M.; Ashraf, M.A.; Hussain, I.; Shafiq, F.; Yousaf, A.; Zaheer, A. Glycine betaine counteracts the inhibitory effects of waterlogging on growth, photosynthetic pigments, oxidative defence system, nutrient composition, and fruit quality in tomato. J. Hortic. Sci. Biotechnol. 2018, 93, 385–391. [Google Scholar] [CrossRef]
  36. Fortunato, A.A.; Rodrigues, F.Á.; do Nascimento, K.J.T. Physiological and biochemical aspects of the resistance of banana plants to Fusarium wilt potentiated by silicon. Phytopathology 2012, 102, 957–966. [Google Scholar] [CrossRef] [PubMed]
  37. Ashraf, M.; Foolad, M. Roles of glycine betaine and proline in improving plant abiotic stress resistance. Environ. Exp. Bot. 2007, 59, 206–216. [Google Scholar] [CrossRef]
  38. Dar, M.I.; Naikoo, M.I.; Rehman, F.; Naushin, F.; Khan, F.A. Proline Accumulation in Plants: Roles in Stress Tolerance and Plant Development. In Osmolytes and Plants Acclimation to Changing Environment: Emerging Omics Technologies; Iqbal, N., Nazar, R., A. Khan, N., Eds.; Springer: New Delhi, India, 2016; pp. 155–166. ISBN 978-81-322-2615-4. [Google Scholar]
  39. Tuo, X.Q.; Li, S.; Wu, Q.S.; Zou, Y.N. Alleviation of waterlogged stress in peach seedlings inoculated with Funneliformis mosseae: Changes in chlorophyll and proline metabolism. Sci. Hortic. 2015, 197, 130–134. [Google Scholar] [CrossRef]
  40. 1Hao, Z.; Christie, P.; Qin, L.; Wang, C.; Li, X. Control of fusarium wilt of cucumber seedlings by inoculation with an arbuscular mycorrhical fungus. J. Plant Nutr. 2005, 28, 1961–1974. [Google Scholar] [CrossRef]
  41. Das, B.; Padhiary, A.K.; Behera, S.; Mishra, S.P.; Jena, M.; Swain, S.; Rout, S. Biochemical Changes in Some Rice Varieties in Response to Waterlogged and Submerged Conditions. Int. J. Pure Appl. Biosci. 2017, 5, 972–978. [Google Scholar] [CrossRef]
  42. Bansal, R.; Srivastava, J.P. Effect of waterlogging on photosynthetic and biochemical parameters in pigeonpea. Russ. J. Plant Physiol. 2015, 62, 322–327. [Google Scholar] [CrossRef]
  43. Verma, K.K.; Singh, M.; Gupta, R.K.; Verma, C.L. Photosynthetic gas exchange, chlorophyll fluorescence, antioxidant enzymes, and growth responses of Jatropha curcas during soil flooding. Turk. J. Bot. 2014, 38, 130–140. [Google Scholar] [CrossRef]
  44. Rajeswari, P. Management of Fusarium wilt caused by Fusarium oxysporum by Trichoderma Species and Pseudomonas fluorescens on Arachis hypogaea (Groundnut). J. Biol. Control 2014, 28, 133–136. [Google Scholar]
  45. Rejeb, I.; Pastor, V.; Mauch-Mani, B. Plant responses to simultaneous biotic and abiotic stress: Molecular mechanisms. Plants 2014, 3, 458–475. [Google Scholar] [CrossRef]
  46. Pandey, P.; Irulappan, V.; Bagavathiannan, M.V.; Senthil-Kumar, M. Impact of combined abiotic and biotic stresses on plant growth and avenues for crop improvement by exploiting physio-morphological traits. Front. Plant Sci. 2017, 8, 537. [Google Scholar] [CrossRef]
  47. Dikilitas, M.; Karakas, S.; Hashem, A.; Abd_Allah, E.F.; Ahmad, P. Oxidative stress and plant responses to pathogens under drought conditions. In Water Stress and Crop Plants: A Sustainable Approach, 1st ed.; Parvaiz, A., Ed.; John Wiley Sons, Ltd.: Chichester, UK, 2016; Volume 1, pp. 102–123. [Google Scholar]
  48. Deepthi, V.; Raksha, B.; Pooja, S.; Subashkumar, R.; Vivekanandhan, G.; Siva, R.; Babu, S. Differential response of cultivated rice to pathogen challenge and abiotic stresses with reference to cationic peroxidase. Arch. Phytopathol. Plant Prot. 2014, 47, 1390–1399. [Google Scholar] [CrossRef]
  49. Coakley, S.M.; Scherm, H.; Chakraborty, S. Climate change and plant disease management. Annu. Rev. Phytopathol. 1999, 37, 399–426. [Google Scholar] [CrossRef]
  50. Petzoldt, C.; Seaman, A. Climate change effects on insects and pathogens. Clim. Chang. Agric Promot. Pract. Profitab. Responses 2006, 3, 6–16. [Google Scholar]
  51. Sanogo, S.; El-Sebai, O.I.; Sanderson, R. Severity of Verticillium wilt, plant growth, and spectral reflectance indices of chile pepper under periodic flooding and no-flooding conditions. HortScience 2008, 43, 414–419. [Google Scholar] [CrossRef]
  52. Keatinge, J.D.H.; Lin, L.J.; Ebert, A.W.; Chen, W.Y.; Hughes, J.A.; Luther, G.C.; Ravishankar, M. Overcoming biotic and abiotic stresses in the Solanaceae through grafting: Current status and future perspectives. Biol. Agric. Hortic. 2014, 30, 272–287. [Google Scholar] [CrossRef]
  53. Ocampo, O. El cambio climático y su impacto en el agro. Rev. Ing. 2011, 33, 115–123. [Google Scholar]
  54. Ramirez-Villegas, J.; Salazar, M.; Jarvis, A.; Navarro-Racines, C.E. A way forward on adaptation to climate change in Colombian agriculture: Perspectives towards 2050. Clim. Chang. 2012, 115, 611–628. [Google Scholar] [CrossRef]
  55. Rekah, Y.; Shtienberg, D.; Katan, J. Disease development following infection of tomato and basil foliage by airborne conidia of the soilborne pathogens Fusarium oxysporum f. sp. radicis-lycopersici and F. oxysporum f. sp. basilici. Phytopathology 2000, 90, 1322–1329. [Google Scholar] [CrossRef]
  56. Park, D. Isolation of Fusarium oxysporum from soils. Trans. Br. Mycol. Soc. 1961, 44, 119–122. [Google Scholar] [CrossRef]
  57. Namiki, F.; Shiomi, T.; Kayamura, T.; Tsuge, T. Characterization of the formae speciales of Fusarium oxysporum causing wilts of cucurbits by DNA fingerprinting with nuclear repetitive DNA sequences. Appl. Environ. Microbiol. 1994, 60, 2684–2691. [Google Scholar]
  58. Hainaut, P.; Remacle, T.; Decamps, C.; Lambert, R.; Sadok, W. Higher forage yields under temperate drought explained by lower transpiration rates under increasing evaporative demand. Eur. J. Agron. 2016, 72, 91–98. [Google Scholar] [CrossRef]
  59. Moreno, C. Interactions between Bacillus amyloliquefaciens Bs006, Fusarium oxysporun Map5 and Cape gooseberry (Physalis peruviana). Ph.D. Thesis, Universidad Nacioanl de Colombia, Bogotá, Colombia, 2017. [Google Scholar]
  60. Townsend, G.R.; Heuberger, J.W. Methods for estimating losses caused by diseases in fungicide experiments. Plant Dis. Report. 1943, 27, 340–343. [Google Scholar]
  61. Campbell, C.L.; Madden, L.V. Introduction to Plant Disease Epidemiology; Wiley-Interscience: New York, NY, USA, 1990; p. 532. [Google Scholar]
  62. Alves, D.P.; Tomaz, R.S.; Laurindo, B.S.; Laurindo, R.D.F.; Cruz, C.D.; Nick, C.; Silva, D.J.H.D. Artificial neural network for prediction of the area under the disease progress curve of tomato late blight. Sci. Agric. 2017, 74, 51–59. [Google Scholar] [CrossRef] [Green Version]
  63. Wellburn, A.R. The spectral determination of chlorophylls a and b, as well as total carotenoids, using various solvents with spectrophotometers of different resolution. J Plant Physiol. 1994, 144, 307–313. [Google Scholar] [CrossRef]
  64. Sims, D.A.; Gamon, J.A. Relationships between leaf pigment content and spectral reflectance across a wide range of species, leaf structures and developmental stages. Remote Sens. Environ. 2002, 81, 337–354. [Google Scholar] [CrossRef]
  65. Bates, L.S.; Waldren, R.P.; Teare, I.D. Rapid determination of free proline for water-stress studies. Plant Soil 1973, 39, 205–207. [Google Scholar] [CrossRef]
  66. Hodges, D.M.; DeLong, J.M.; Forney, C.F.; Prange, R.K. Improving the thiobarbituric acid-reactive-substances assay for estimating lipid peroxidation in plant tissues containing anthocyanin and other interfering compounds. Planta 1999, 207, 604–611. [Google Scholar] [CrossRef]
  67. Kumar, S.; Kumar, J.; Singh, S.; Ahmed, S.; Chaudhary, R.G.; Sarker, A. Vascular wilt disease of lentil: A review. J. Lentil Res. 2010, 4, 1–14. [Google Scholar]
  68. Li, Y.P.; You, M.P.; Colmer, T.D.; Barbetti, M.J. Effect of timing and duration of soil saturation on soilborne Pythium diseases of common bean (Phaseolus vulgaris). Plant Dis. 2015, 99, 112–118. [Google Scholar] [CrossRef]
  69. Chaudhary, S.; Kusakabe, A.; Melgar, J.C. Phytophthora infection in flooded citrus trees reduces root hydraulic conductance more than under non-flooded condition. Sci. Hortic. 2016, 202, 107–110. [Google Scholar] [CrossRef]
  70. Moslemi, A.; Ades, P.K.; Groom, T.; Nicolas, M.E.; Taylor, P.W. Influence of waterlogging on growth of pyrethrum plants infected by the crown and root rot pathogens, Fusarium oxysporum, Fusarium avenaceum and Paraphoma vinacea. Australas. Plant Pathol. 2018, 47, 205–213. [Google Scholar] [CrossRef]
  71. Rasheed-Depardieu, C.; Parelle, J.; Tatin-Froux, F.; Parent, C.; Capelli, N. Short-term response to waterlogging in Quercus petraea and Quercus robur. A study of the root hydraulic responses and the transcriptional pattern of aquaporins. Plant Physiol. Biochem. 2015, 97, 323–330. [Google Scholar] [CrossRef] [PubMed]
  72. Jurczyk, B.; Pociecha, E.; Janowiak, F.; Kabała, D.; Rapacz, M. Variation in waterlogging-triggered stomatal behavior contributes to changes in the cold acclimation process in prehardened Lolium perenne and Festuca pratensis. Plant Physiol. Biochem. 2016, 109, 280–292. [Google Scholar] [CrossRef] [PubMed]
  73. Olmo-Vega, A.; García-Sánchez, F.; Simón-Grao, S.; Simón, I.; Lidón, V.; Nieves, M.; Martínez-Nicolás, J.J. Physiological responses of three pomegranate cultivars under flooded conditions. Sci. Hortic. 2017, 224, 171–179. [Google Scholar] [CrossRef]
  74. Herrera, A. Responses to flooding of plant water relations and leaf gas exchange in tropical tolerant trees of a black-water wetland. Front. Plant Sci. 2013, 4, 106. [Google Scholar] [CrossRef]
  75. Castonguay, Y.; Nadeau, P.; Simard, R.R. Effects of flooding on carbohydrate and ABA levels in roots and shoots of alfalfa. Plant Cell Environ. 1993, 16, 695–702. [Google Scholar] [CrossRef]
  76. Striker, G.G.; Colmer, T.D. Flooding tolerance of forage legumes. J. Exp. Bot. 2016, 68, 1851–1872. [Google Scholar] [CrossRef]
  77. Wang, M.; Sun, Y.; Sun, G.; Liu, X.; Zhai, L.; Shen, Q.; Guo, S. Water balance altered in cucumber plants infected with Fusarium oxysporum f. sp. cucumerinum. Sci. Rep. 2015, 5, 7722. [Google Scholar] [CrossRef]
  78. Dong, X.; Ling, N.; Wang, M.; Shen, Q.; Guo, S. Fusaric acid is a crucial factor in the disturbance of leaf water imbalance in Fusarium-infected banana plants. Plant Physiol. Biochem. 2012, 60, 171–179. [Google Scholar] [CrossRef]
  79. Suzuki, N.; Rivero, R.M.; Shulaev, V.; Blumwald, E.; Mittler, R. Abiotic and biotic stress combinations. New Phytol. 2014, 203, 32–43. [Google Scholar] [CrossRef] [Green Version]
  80. Davey, M.W.; Stals, E.; Panis, B.; Keulemans, J.; Swennen, R.L. High-throughput determination of malondialdehyde in plant tissues. Anal. Biochem. 2005, 347, 201–207. [Google Scholar] [CrossRef]
  81. Liang, X.; Zhang, L.; Natarajan, S.K.; Becker, D.F. Proline mechanisms of stress survival. Antioxid. Redox Signal. 2013, 19, 998–1011. [Google Scholar] [CrossRef]
  82. Abdelrahman, M.; Abdel-Motaal, F.; El-Sayed, M.; Jogaiah, S.; Shigyo, M.; Ito, S.I.; Tran, L.S.P. Dissection of Trichoderma longibrachiatum-induced defense in onion (Allium cepa L.) against Fusarium oxysporum f. sp. cepa by target metabolite profiling. Plant Sci. 2016, 246, 128–138. [Google Scholar] [CrossRef]
  83. Alwathnani, H.A.; Perveen, K. Biological control of Fusarium wilt of tomato by antagonist fungi and cyanobacteria. Afr. J. Biotechnol. 2012, 11, 1100–1105. [Google Scholar] [CrossRef]
  84. Sánchez-Reinoso, A.D.; Ligarreto-Moreno, G.A.; Restrepo-Díaz, H. Physiological and biochemical expressions of a determinated growth common bean genotype (Phaseolus vulgaris L.) to water deficit stress periods. J. Anim. Plant Sci. 2018, 28, 119–127. [Google Scholar]
  85. Pérez-Jiménez, M.; Hernández-Munuera, M.; Piñero Zapata, M.C.; López-Ortega, G.; del Amor, F.M. Two minuses can make a plus: Waterlogging and elevated CO2 interactions in sweet cherry (Prunus avium) cultivars. Physiol. Plant. 2017, 161, 257–272. [Google Scholar] [CrossRef]
  86. Chanu, W.S.; Sarangthem, K. Changes in proline accumulation, amino acid, sugar and chlorophyll content in leaf and culm of Phourel-amubi, a rice cultivar of Manipur in response to flash flood. Indian J. Plant Physiol. 2015, 20, 10–13. [Google Scholar] [CrossRef]
  87. Chaerle, L.; Hagenbeek, D.; De Bruyne, E.; Van Der Straeten, D. Chlorophyll fluorescence imaging for disease-resistance screening of sugar beet. Plant Cell Tissue Organ. Cult. 2007, 91, 97–106. [Google Scholar] [CrossRef]
  88. Kalaji, H.M.; Jajoo, A.; Oukarroum, A.; Brestic, M.; Zivcak, M.; Samborska, I.A.; Ladle, R.J. Chlorophyll a fluorescence as a tool to monitor physiological status of plants under abiotic stress conditions. Acta Physiol. Plant 2016, 38, 102. [Google Scholar] [CrossRef]
  89. Khan, M.I.R.; Khan, N.A. Ethylene reverses photosynthetic inhibition by nickel and zinc in mustard through changes in PSII activity, photosynthetic nitrogen use efficiency, and antioxidant metabolism. Protoplasma 2014, 251, 1007–1019. [Google Scholar] [CrossRef]
  90. Zhang, H.; Feng, P.; Yang, W.; Sui, X.; Li, X.; Li, W.; Xu, N. Effects of flooding stress on the photosynthetic apparatus of leaves of two Physocarpus cultivars. J. Forest Res. 2017, 1–11. [Google Scholar] [CrossRef]
  91. Bhar, A.; Gupta, S.; Chatterjee, M.; Sen, S.; Das, S. Differential expressions of photosynthetic genes provide clues to the resistance mechanism during Fusarium oxysporum f. sp. ciceri race 1 (Foc1) infection in chickpea (Cicer arietinum L.). Eur. J. Plant Pathol. 2017, 148, 533–549. [Google Scholar] [CrossRef]
  92. Dong, X.; Wang, M.; Ling, N.; Shen, Q.; Guo, S. Potential role of photosynthesis-related factors in banana metabolism and defense against Fusarium oxysporum f. sp. cubense. Environ. Exp. Bot. 2016, 129, 4–12. [Google Scholar] [CrossRef]
  93. Sofo, A. Drought stress tolerance and photoprotection in two varieties of olive tree. Acta Agric. Scand. B Soil Plant Sci. 2011, 61, 711–720. [Google Scholar] [CrossRef]
  94. Reeksting, B.J.; Taylor, N.J.; Van den Berg, N. Flooding and Phytophthora cinnamomi: Effects on photosynthesis and chlorophyll fluorescence in shoots of non-grafted Persea americana (Mill.) rootstocks differing in tolerance to Phytophthora root rot. South Afr. J. Bot. 2014, 95, 40–53. [Google Scholar] [CrossRef]
  95. Zhao, X.; Chen, T.; Feng, B.; Zhang, C.; Peng, S.; Zhang, X.; Tao, L. Non-photochemical quenching plays a key role in light acclimation of rice plants differing in leaf color. Front. Plant Sci. 2017, 7, 1968. [Google Scholar] [CrossRef]
  96. Zhou, J.; Qi, A.G.; Zhang, Y.C.; Wan, S.W.; Qin, P. Adventitious root growth and relative physiological responses to waterlogging in the seedlings of seashore mallow (Kosteletzkya virginica), a biodiesel plant. Aust. J. Crop Sci. 2012, 6, 73–80. [Google Scholar]
  97. Pshibytko, N.L.; Zenevich, L.A.; Kabashnikova, L.F. Changes in the photosynthetic apparatus during Fusarium wilt of tomato. Rus. J. Plant Physiol. 2006, 53, 25–31. [Google Scholar] [CrossRef]
  98. Nali, C.; Lorenzini, G.; Guidi, L. Ecophysiology of Susceptible and Resistant Tomato Plants Inoculated with Fusarium oxysporum f. sp. lycopersici. Acta Hortic. 2011, 914, 419–422. [Google Scholar] [CrossRef]
  99. Barczak-Brzyżek, A.K.; Kiełkiewicz, M.; Gawroński, P.; Kot, K.; Filipecki, M.; Karpińska, B. Cross-talk between high light stress and plant defence to the two-spotted spider mite in Arabidopsis thaliana. Exp. Appl. Acarol. 2017, 73, 177–189. [Google Scholar] [CrossRef] [PubMed]
Figure 1. Effect of four waterlogging periods on stomatal conductance (gs) of cape gooseberry plants infected with Fusarium oxysporum f. sp. physali (Foph) at three different sampling points (13, 33, and 53 days after inoculation (DAI)). The data represent the mean of five plants ± standard error per treatment (n = 5). Capital letters refer to differences between waterlogging periods under each inoculation condition. Lower case letters refer to differences between inoculation treatments within the same waterlogging period. The same letters indicate that means are not statistically significantly different at p ≤ 0.05.
Agronomy 09 00213 g001
Figure 2. Effect of four waterlogging periods on leaf water potential (Ψwf) of cape gooseberry plants infected with Fusarium oxysporum f. sp. physali (Foph) at 53 days after inoculation (DAI). The data represent the mean of five plants ± standard error per treatment (n = 5). Capital letters refer to differences between waterlogging periods under each inoculation condition. Lower case letters refer to differences between inoculation treatments within the same waterlogging period. The same letters indicate that means are not statistically significantly different at p ≤ 0.05.
Agronomy 09 00213 g002
Figure 3. Effect of four waterlogging periods on foliar dry weight (FDW) of cape gooseberry plants infected with Fusarium oxysporum f. sp. physali (Foph) at three different sampling points (13, 33, and 53 days after inoculation (DAI)). The data represent the mean of five plants ± standard error per treatment (n = 5). Capital letters refer to differences between waterlogging periods under each inoculation condition. Lower case letters refer to differences between inoculation treatments within the same waterlogging period. The same letters indicate that means are not statistically significantly different at p ≤ 0.05.
Agronomy 09 00213 g003
Figure 4. Effect of four waterlogging periods on leaf area (LA) (A) and stem diameter (B) of cape gooseberry plants infected with Fusarium oxysporum f. sp. physali (Foph) at three different sampling points (13, 33, and 53 days after inoculation (DAI)). The data represent the mean of five plants ± standard error per treatment (n = 5). Capital letters refer to differences between waterlogging periods under each inoculation condition. Lower case letters refer to differences between inoculation treatments within the same waterlogging period. The same letters indicate that means are not statistically significantly different at p ≤ 0.05.
Agronomy 09 00213 g004
Figure 5. Effect of four waterlogging periods on chlorophyll total (Chl total). (A), chlorophyll a (Chl a) (B), chlorophyll b (Chl b) (C) and carotenoids (Cx+c) (D) of cape gooseberry plants infected with Fusarium oxysporum f. sp. physali (Foph) at 53 days after inoculation (DAI). The data represent the mean of five plants ± standard error per treatment (n = 5). Capital letters refer to differences between waterlogging periods under each inoculation condition. Lower case letters refer to differences between inoculation treatments within the same waterlogging period. The same letters indicate that means are not statistically significantly different at p ≤ 0.05.
Agronomy 09 00213 g005
Figure 6. Effect of four waterlogging periods on malondialdehyde (MDA) production. (A) and proline content (B) of cape gooseberry plants infected with Fusarium oxysporum f. sp. physali (Foph) at 53 days after inoculation (DAI). The data represent the mean of five plants ± standard error per treatment (n = 5). Capital letters refer to differences between waterlogging periods under each inoculation condition. Lower case letters refer to differences between inoculation treatments within the same waterlogging period. The same letters indicate that means are not statistically significantly different at p ≤ 0.05.
Agronomy 09 00213 g006
Figure 7. Effect of four waterlogging periods on maximum efficiency of the photosystem (PSII) (Fv/Fm) of cape gooseberry plants infected with Fusarium oxysporum f. sp. physali (Foph) at three different sampling points (13, 33, and 53 days after inoculation (DAI)). The data represent the mean of five plants ± standard error per treatment (n = 5). Capital letters refer to differences between waterlogging periods under each inoculation condition. Lower case letters refer to differences between inoculation treatments within the same waterlogging period. The same letters indicate that means are not statistically significantly different at p ≤ 0.05.
Agronomy 09 00213 g007
Figure 8. Effect of four waterlogging periods on actual efficiency of PSII (Y(II)) (A) and electron transport rate (ETR) (B) of cape gooseberry plants infected with Fusarium oxysporum f. sp. physali (Foph) at three different sampling points (13, 33, and 53 days after inoculation (DAI)). The data represent the mean of five plants ± standard error per treatment (n = 5). Capital letters refer to differences between waterlogging periods under each inoculation condition. Lower case letters refer to differences between inoculation treatments within the same waterlogging period. The same letters indicate that means are not statistically significantly different at p ≤ 0.05.
Agronomy 09 00213 g008
Figure 9. Effect of four waterlogging periods on photochemical quenching (qP) (A) and non-photochemical quenching (NPQ) (B) of cape gooseberry plants infected with Fusarium oxysporum f. sp. physali (Foph) at three different sampling points (13, 33, and 53 days after inoculation (DAI)). The data represent the mean of five plants ± standard error per treatment (n = 5). Capital letters refer to differences between waterlogging periods under each inoculation condition. Lower case letters refer to differences between inoculation treatments within the same waterlogging period. The same letters indicate that means are not statistically significantly different at p ≤ 0.05.
Agronomy 09 00213 g009
Table 1. Summary of the analysis of variance of the effect of four waterlogging (W) periods on the leaf photosynthetic pigments (chlorophyll a, b, and total content and carotenoids), malondialdehyde (MDA) and proline of cape gooseberry plants infected with Fusarium oxysporum f. sp. physali (Foph) at 53 DAI.
Abbr. Source Variation
FophWaterloggingFoph × Waterlogging
Chlorophyll aChl a***z******
Chlorophyll bChl b********
Total chlorophyllChl total*********
CarotenoidsCx + c*********
MalondialdehydeMDA*******
Proline *********
z *, **, and *** significantly different at the 0.05, 0.01 and 0.001 probability levels, respectively.
Table 2. Summary of the analysis of variance between Fusarium oxysporum f. sp. physali (Foph), waterlogging (W) periods, and sampling time on the physiological variables of cape gooseberry plants.
Source VariationdfgsΨwfSDLAFDWFv/FmY(II)qPNPQETR
Foph1<0.001<0.0010.0011<0.001<0.001<0.001<0.001<0.001<0.001<0.001
Waterlogging (W)3<0.001<0.001<0.001<0.001<0.001<0.001<0.001<0.001<0.001<0.001
Foph*W3<0.0010.02210.3399<0.001<0.01<0.001<0.0010.29140.408<0.001
Time2<0.001<0.001<0.001<0.001<0.001<0.001<0.001<0.001<0.001<0.001
Time*Foph2<0.001<0.001<0.001<0.001<0.001<0.0010.0051<0.001<0.001<0.001
Time*W6<0.001<0.0010.0163<0.001<0.001<0.001<0.001<0.001<0.001<0.001
Time*W*Foph6<0.0010.3034<0.05<0.001<0.05<0.001<0.01<0.010.149<0.01
C.V. (%) 1 8.7818.5312.78.4210.113.6913.19.567.210.98
gs, stomatal conductance; Ψwf, leaf water potential; SD, stem diameter; LA, leaf area; FDW, foliar dry weight; Fv/Fm, the maximum efficiency of the photosystem (PSII), Y(II), actual efficiency of PSII; qP, photochemical quenching; NPQ, non-photochemical quenching; ETR, electron transport rate. 1 C.V.: coefficient of variation.
Table 3. Effect of four waterlogging periods on the area under the disease progress curve (AUDPC) and the disease severity index of cape gooseberry plants infected with Fusarium oxysporum f. sp. physali (Foph) at 53 DAI.
TreatmentAUDPCDisease Index
F. oxysporum45.25 c 12.5 b
4 days + Foph41.25 c2.75 ab
6 days + Foph55.25 b3.75 ab
8 days + Foph64.25 a4.25 a
Significance*** 2**
CV (%) 38.2926.23
1 Values within one column followed by different letters are significantly different to p ≤ 0.05 according to Tukey Test. 2 **, *** significant to p ≤ 0.01 or p ≤ 0.001. 3 C.V.: coefficient of variation.

