Intercomparison of the Surface Energy Partitioning in CMIP5 Simulations


1
Department of Civil and Environmental Engineering, the Hong Kong University of Science and Technology, Kowloon, Hong Kong, China
2
School of Sustainable Engineering and the Built Environment, Arizona State University, Tempe, AZ 85281, USA
3
School for Engineering of Matter, Transport and Energy, Arizona State University, Tempe, AZ 85281, USA
*
Author to whom correspondence should be addressed.
Atmosphere 2019, 10(10), 602; https://0-doi-org.brum.beds.ac.uk/10.3390/atmos10100602
Submission received: 25 August 2019
/
Revised: 30 September 2019
/
Accepted: 1 October 2019
/
Published: 4 October 2019
Abstract
:The warming climate significantly modifies the global water cycle. Global evapotranspiration has increased over the past decades, yet climate models agree on the drying trend of land surface. In this study, we conducted an intercomparison analysis of the surface energy partitioning across Coupled Model Intercomparison Phase 5 (CMIP5) simulations and evaluated its behaviour with surface temperature and soil moisture anomalies, against the theoretically derived thermodynamic formula. Different responses over land and sea surfaces to elevated greenhouse gas emissions were found. Under the Representative Concentration Pathway of +8.5 W m−2 (RCP8.5) warming scenario, the multi-model mean relative efficiency anomaly from CMIP5 simulations is 3.83 and −0.12 over global sea and land, respectively. The significant anomaly over sea was captured by the thermodynamic solution based on the principle of maximum entropy production, with a mean relative error of 14.6%. The declining trend over land was also reproduced, but an accurate prediction of its small anomaly will require the inclusions of complex physical processes in future work. Despite increased potential evapotranspiration under rising temperatures, both CMIP5 simulations and thermodynamic principles suggest that the soil moisture-temperature feedback cannot support long-term enhanced evapotranspiration at the global scale. The dissipation of radiative forcing eventually shifts towards sensible heat flux and accelerates the warming over land, especially over South America and Europe.
1. Introduction
During the 20th century, intensification of the global hydrological cycle has been observed [1], and the trend is expected to continue under a warming climate [2]. The established robust responses of the global hydrological cycle to temperature rise include amplified variance of precipitation everywhere [3], increased precipitation intensity over land [4,5], land evapotranspiration acceleration [6], and reduced soil moisture [7]. The long-term decline in soil moisture is the only response that has not been validated against in-situ measurements, as historical ground observations are limited [8] and soil moisture products derived from satellites are sensitive to the accuracy of retrieval algorithms [9,10]. Previous studies on the net water flux into the surface, i.e., the precipitation minus evaporation, suggested that wet regions will become wetter and dry regions will become drier in response to global warming [11]. Nevertheless, recent studies found that such a response would not occur over land surfaces [12,13].
The interactions between the Earth’s surface and the atmosphere, i.e., surface sensible (H) and latent (LE) heat fluxes, play a key role in regulating the hydroclimate across scales and causing the aforementioned response to climate change [14]. In the absence of a long-term dataset, the interactions have been primarily analysed through the Coupled Model Intercomparison Project Phase 5 (CMIP5) [15], a state-of-the-art multi-model assessment tool for studying the evolving climate from past to present to future. Previous studies have reported the trends of both surface fluxes in a warming globe [16]. Latent heat flux and sensible heat flux are found to increase over most of the global land under the future climate, largely corresponding to the increased net radiation. Note that the signal of changes in radiative forcing is sensitive to the treatment of atmospheric aerosols in individual climate models [17]. The diurnal cycle of clouds also has an important effect on surface moisture and energy budgets, whose large biases over land potentially increase the uncertainty of climate predictions [18]. While trends of individual climatic indicators (temperature, humidity, energy budgets, etc.) tend to ramify, we believe that there exist some intrinsic measures/constraints of climate changes. These measures should preferably be derived from the thermodynamic principles and be capable of providing a more fundamental explanation of the behaviors in anomalies of the coupled energy and water cycles among different General Circulation Models (GCMs), with a limited number of parameters and reduced uncertainty.
In this study, we choose the ratio between surface latent and sensible heat fluxes (LE/H, hereinafter relative efficiency) as such a measure, for it is well-formulated by the Clausius-Clapeyron equation and is relatively insensitive to radiative forcing. It is well established that the surface energy partitioning can be affected by a suite of variables, including temperature, humidity, and soil moisture. The question remains: how large is the variety in surface energy partitioning across CMIP5 simulations, given the different parameterizations and feedbacks in global climate models? To address this question, we examined results from historical, RCP4.5 (Representative Concentration Pathway of +4.5 W m−2) and RCP8.5 scenarios in CMIP5 simulations against a theoretically derived relationship.
2. Materials and Methods
2.1. Global Climate Dataset
The global climate data were taken from the CMIP5 data portal [19]. We made use of the historical RCP4.5 and RCP8.5 scenario simulations by the latest generation of earth system models [15]. Based on the data availability, a total of 17 models were initially selected. Monthly outputs of near-surface specific humidity, surface sensible heat flux, surface latent heat flux, surface temperature, surface soil moisture, and total soil moisture were downloaded. For quality control of the data, we performed a consistence check on the surface sensible and latent heat fluxes from different GCMs. Note that it is difficult to evaluate the performance of individual models because of the lack of direct global observations. Assuming that the majority of CMIP5 simulations should fall within a reasonable range, in this study, we included a model in the subsequent analysis only if its output fluxes were within two standard deviations from the multi-model mean between 1860 and 2100. This led to a total of 12 models from six institutes for this study, and their information is summarized in Table 1. The annual area-weighted average over the globe, land, and sea were estimated using all available ensemble members that passed the quality control.
2.2. Thermodynamic Solution of Relative Efficiency
Surface energy partitioning can be treated as a dissipation process that consumes energy perturbation at the surface and returns the land-atmosphere system to thermal equilibrium in the long term. As the partitioning process is irreversible and produces entropy, the response of the system to perturbation follows the second law of thermodynamics and leads to the state with a maximum entropy production of turbulent dissipation. Details of the maximum entropy production theory and its applications can be found in Kleidon and Lorenz [20]. Based on the maximum entropy production theory, surface energy balance components can be solved through an analytical solution. Linearizing the relation between saturated vapour pressure and temperature, the ratio of surface latent heat flux to sensible heat flux is given by [21]
where β is the surface moisture availability, Lv is the latent heat of vaporization for water, cp is the specific heat of air, qs* is the surface saturated specific humidity, and Ts is the surface temperature. The resulting ratio between surface latent and sensible heat fluxes is only a function of surface temperature and moisture availability. Note that Equation (1) is formulated purely on thermodynamic principles, and the dynamic processes, i.e., wind/circulation induced influences on turbulent fluxes, are neglected.
The surface moisture availability β equals to unity over sea and is calculated as the dimensionless water content over bare land [22,23]:
where θs is the volumetric water content near surface, and subscripts r and s denote the residual and saturated values, respectively. Note that deep soil moisture could affect LE over vegetated land surface through the root water uptake process. To account for the effect of leaf stomata on the exchange of water vapor, the surface moisture availability over vegetated surface βveg is estimated using the “stomatal function” approach proposed by Wang et al. [24]:
where θt is the total volumetric water content in the soil column that plant roots can uptake water, ηs is the openness of stomatal apertures, and qa is the near-surface specific humidity. For each land grid cell, the surface moisture availability is then computed as
where fbare is the bare soil fraction. The performance of the thermodynamic solution has been validated against in-situ point observations over water surface, vegetated and non-vegetated land surfaces [24,25,26]. In this study, we assumed that the maximum entropy production theory is valid at the global scale and compared its predictions against climate model output.
With the CMIP5 global climate dataset, we computed the relative efficiency (left-hand side of Equation (1)) for individual grids using local surface temperature and moisture availability, then averaged the local relative efficiency (weighted by the area of each grid cell) to estimate the global mean. The mean value across the 12 selected models was calculated to obtain the ensemble mean of thermodynamic prediction. θs and θr at individual model grid cells were approximated using the maximum and minimum values of monthly soil moisture. Depending on the root depths, different plants can have different moisture uptake capabilities. However, the CMIP5 simulations only have two soil moisture outputs: surface moisture (upper 10 cm) and total soil moisture (0–100 cm). Here, we used surface soil moisture to compute θs over bare soil and total soil moisture to estimate θt over vegetated land. We only considered areas with a latitude smaller than 60o to exclude surfaces with permanent ice because of their different Lv.
3. Results and Discussion
3.1. Global Mean Relative Efficiency Anomaly
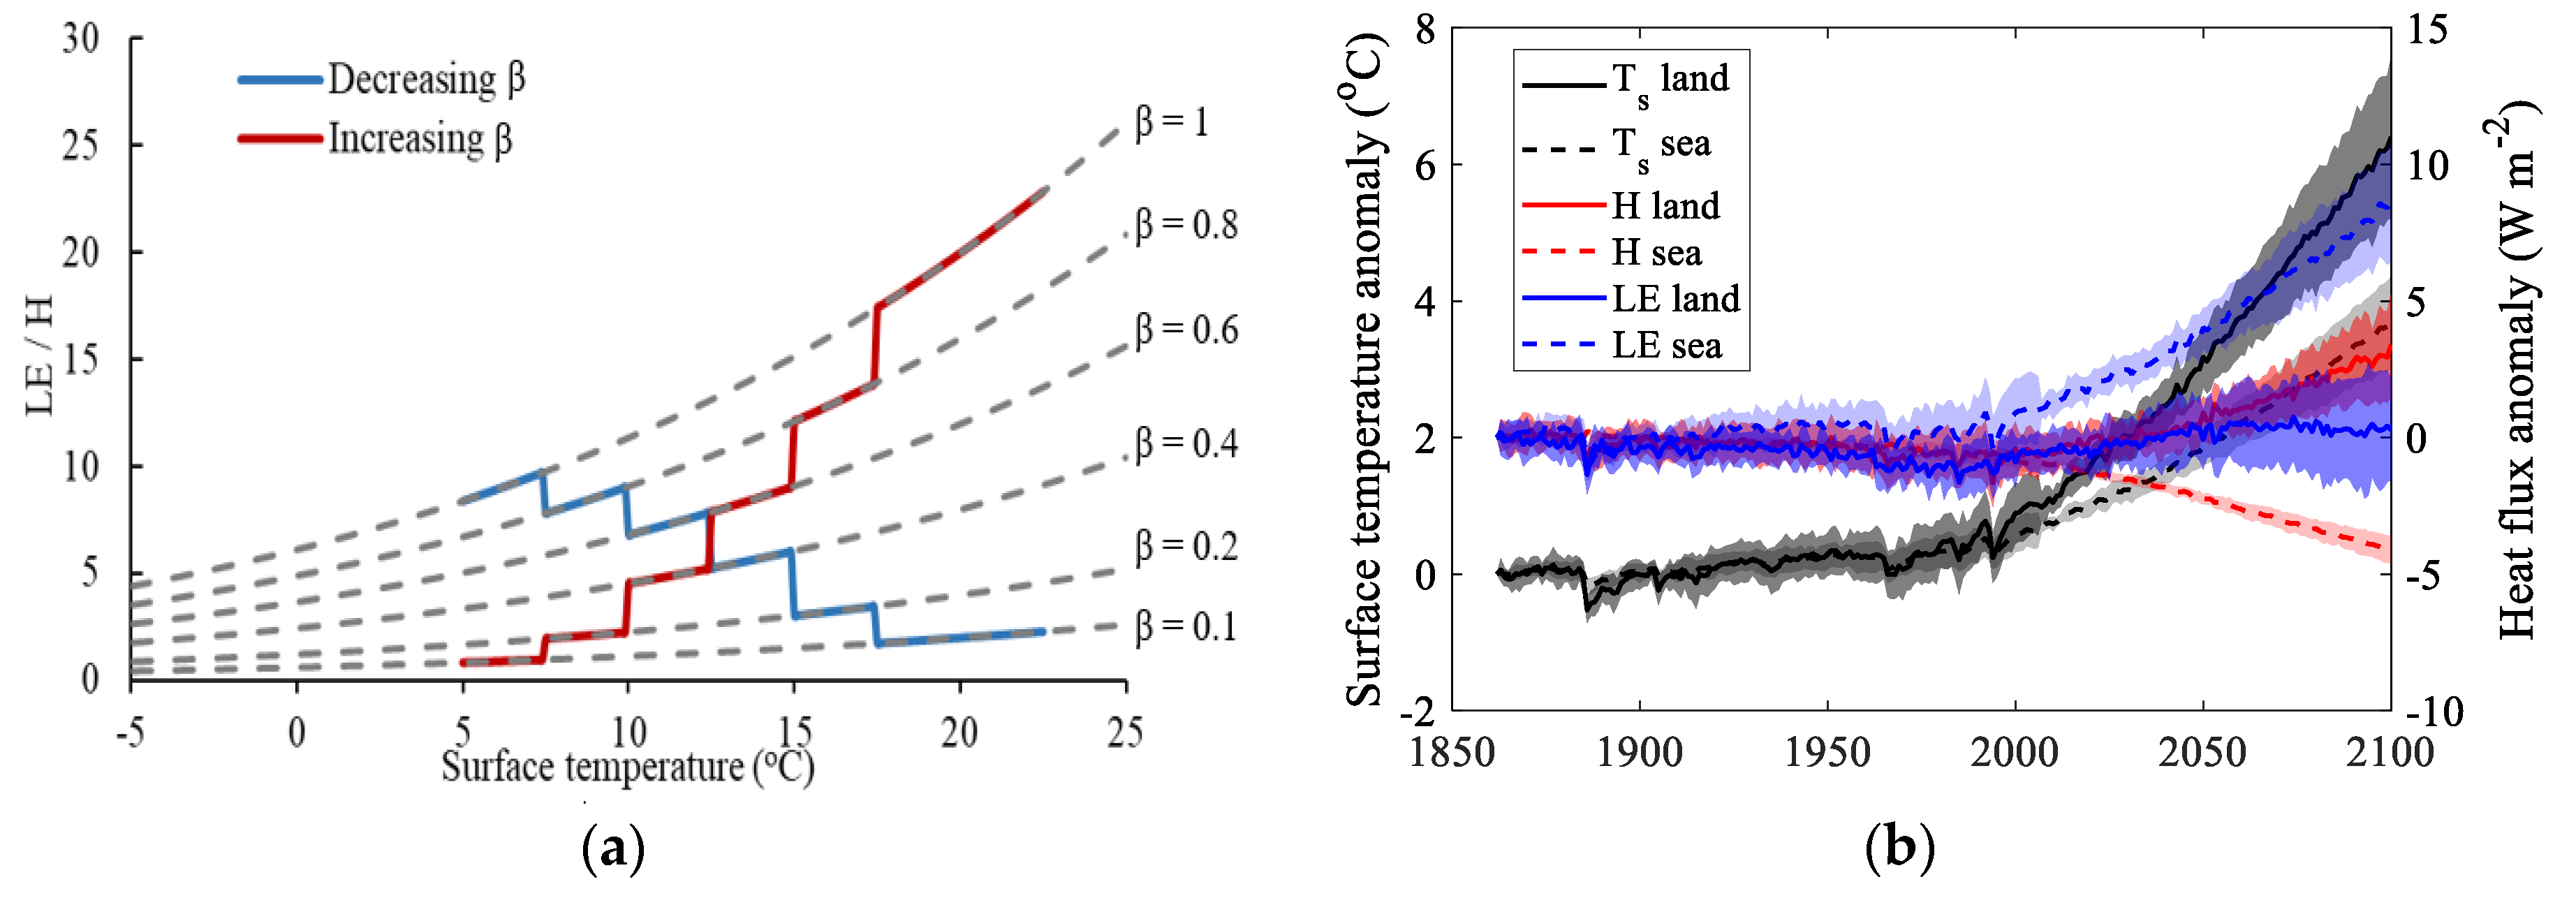
The non-linear nature of the Clausius–Clapeyron relationship shifts the partitioning of radiative energy at the Earth’s surface towards latent heat flux at high temperatures (Figure 1a). With constant or increased surface moisture, the thermodynamic process allows the Earth system to resist human-induced temperature perturbations and could eventually mitigate global warming. This mechanism fails when surface moisture depletes and in turn boosts the temperature rise via directing more radiation towards sensible heat exchange. Climate models consistently show that the global land surface warms faster than the sea surface, and the gap in surface temperature anomaly between land and sea rapidly expands with increased atmospheric greenhouse gas concentration in the future (Representative Concentration Pathway of +8.5 W m−2 (RCP8.5) scenario, Figure 1b). The colored bands in Figure 1b illustrate the significant variety in temperature and heat fluxes from different climate models. This variety was found to be larger over the land surface than over the sea surface. Climatic observations indicate the minimum land/sea warming contrast in equatorial latitudes and the maxima contrast in subtropics [27]. The large thermal inertia of the ocean is one important component but not the determining factor in forming the warming contrast [28]. The slow temperature rise over the sea surface is associated with increased LE and decreased H, while the fast warming over the global land is accompanied by a greater increase in H than LE. Yet, it remains unclear how relative efficiency evolves with global warming and whether the predicted change from general circulation models agrees with the law of thermodynamics.
Multi-model mean relative efficiency shows a clear ascending trend over sea surface (Figure 2a). Global sea LE/H increased by about 0.56 from 1860 to 2005, and by about 3.27 from 2006 to 2100 under the RCP8.5 scenario. Surface moisture is not a constraint over the ocean; therefore, the relative efficiency anomaly generally increases with the projected temperature anomaly in climate models from present to future (Figure 3). Climate variability amplifies in response to the increased greenhouse gas such that predictions from individual models diverge towards the end of the century. The predicted LE/H anomaly at the year 2100 ranged from 2.75 to 4.86 across the analyzed models. Nevertheless, the temporal evolution of mean relative efficiency over sea surface at the planetary scale was reasonably captured by the thermodynamic formula.
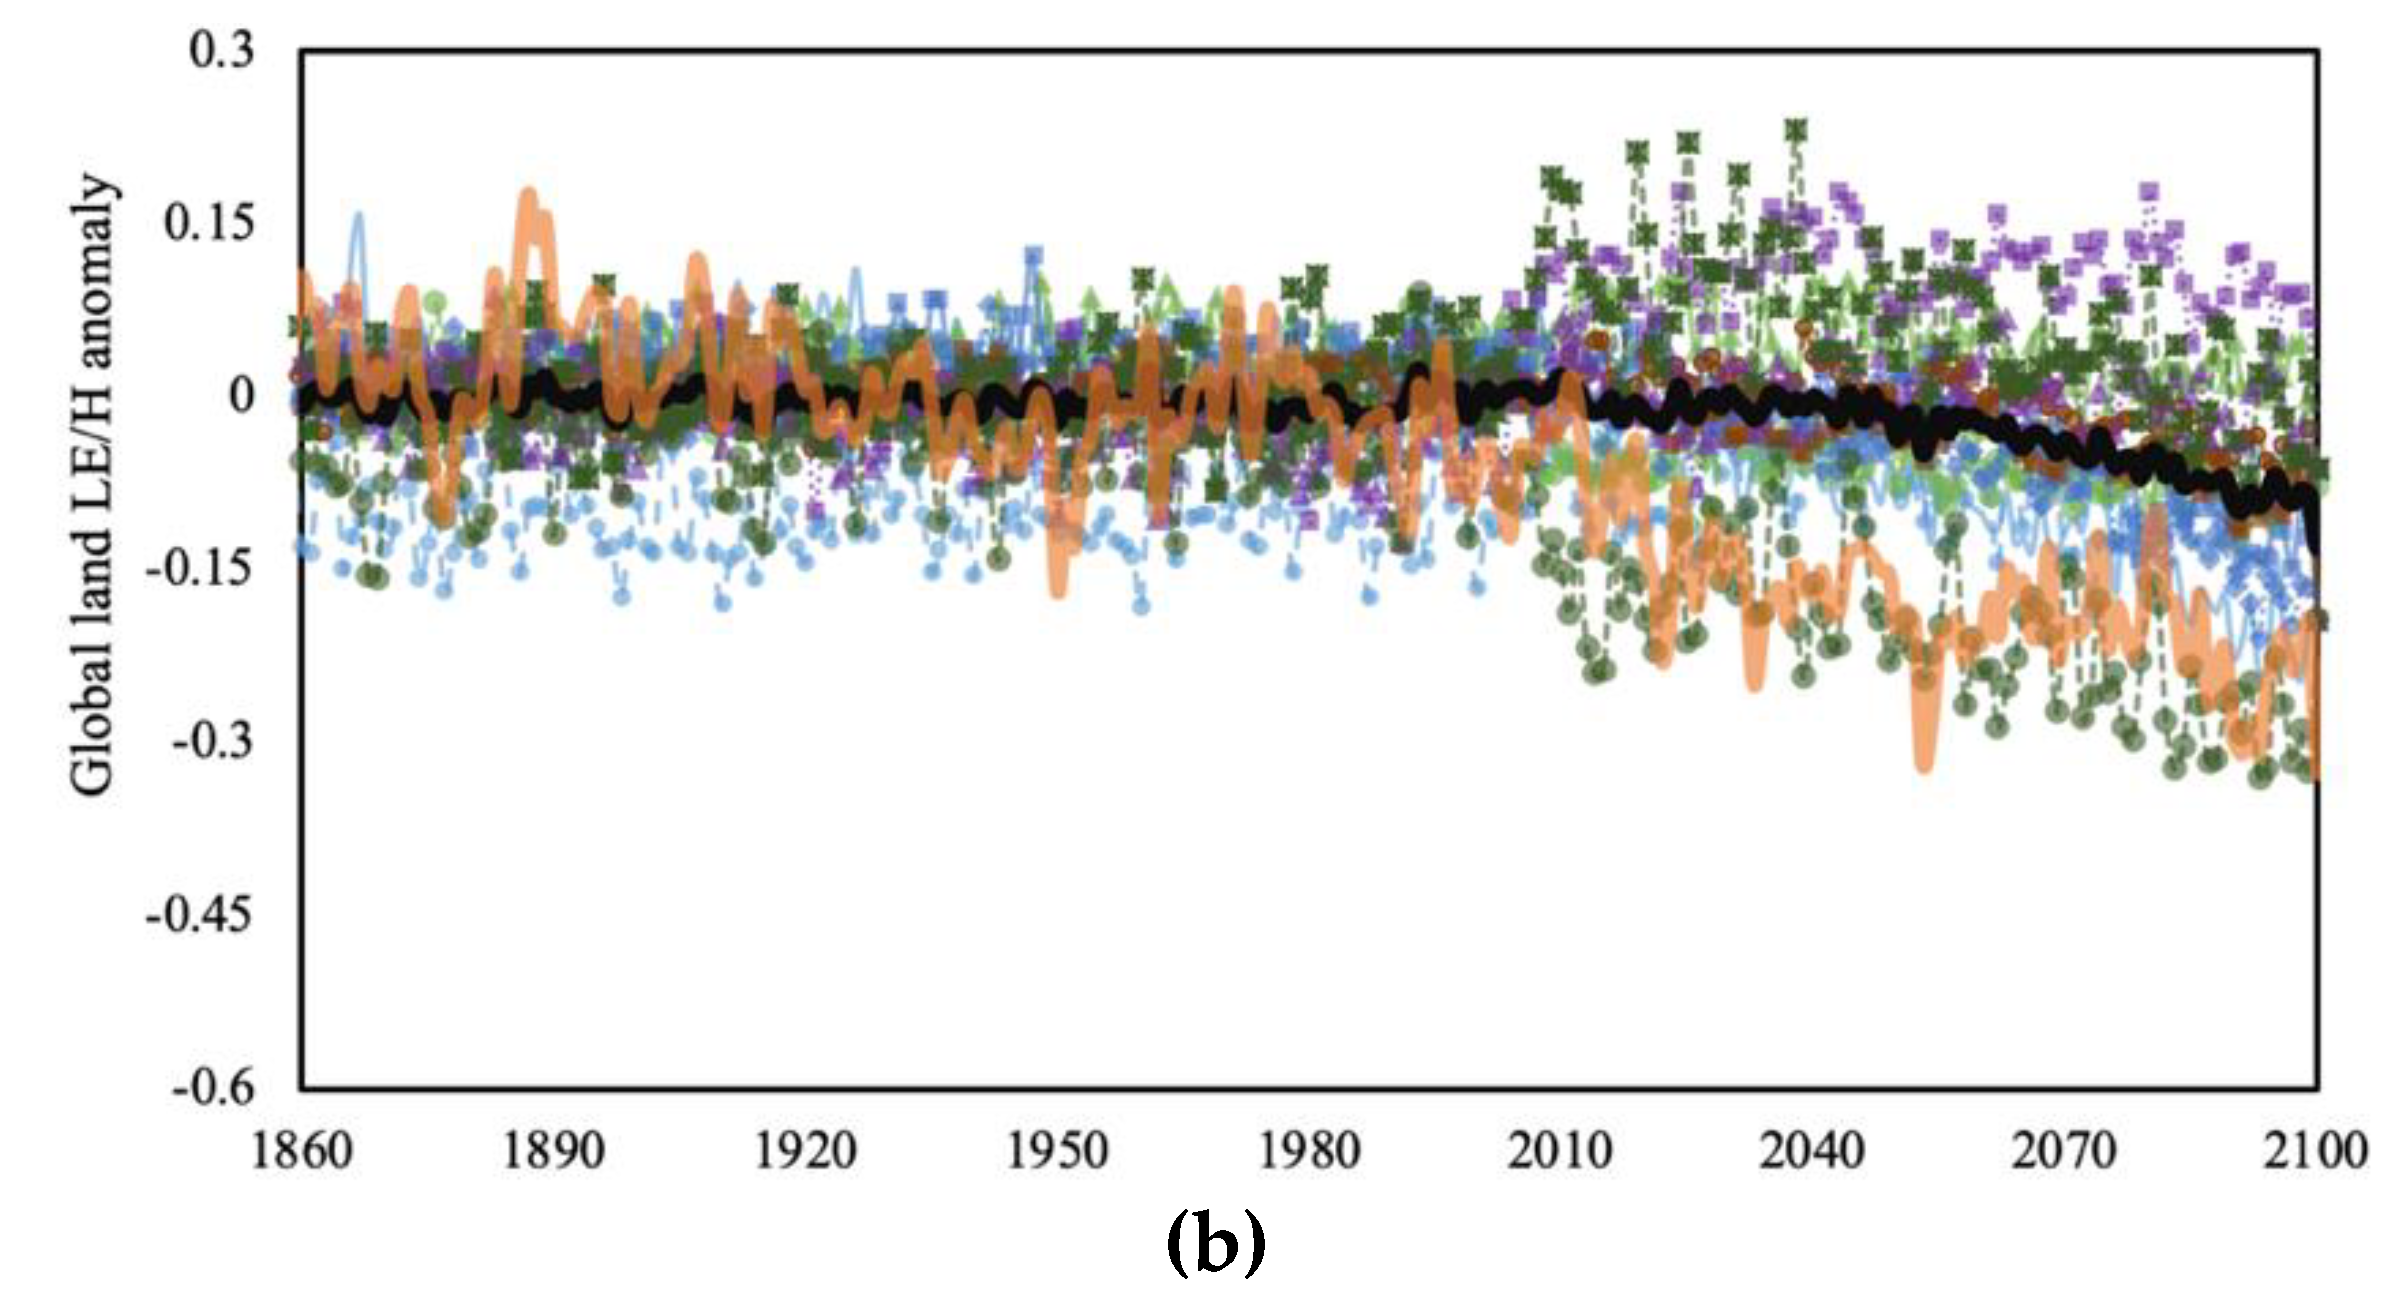
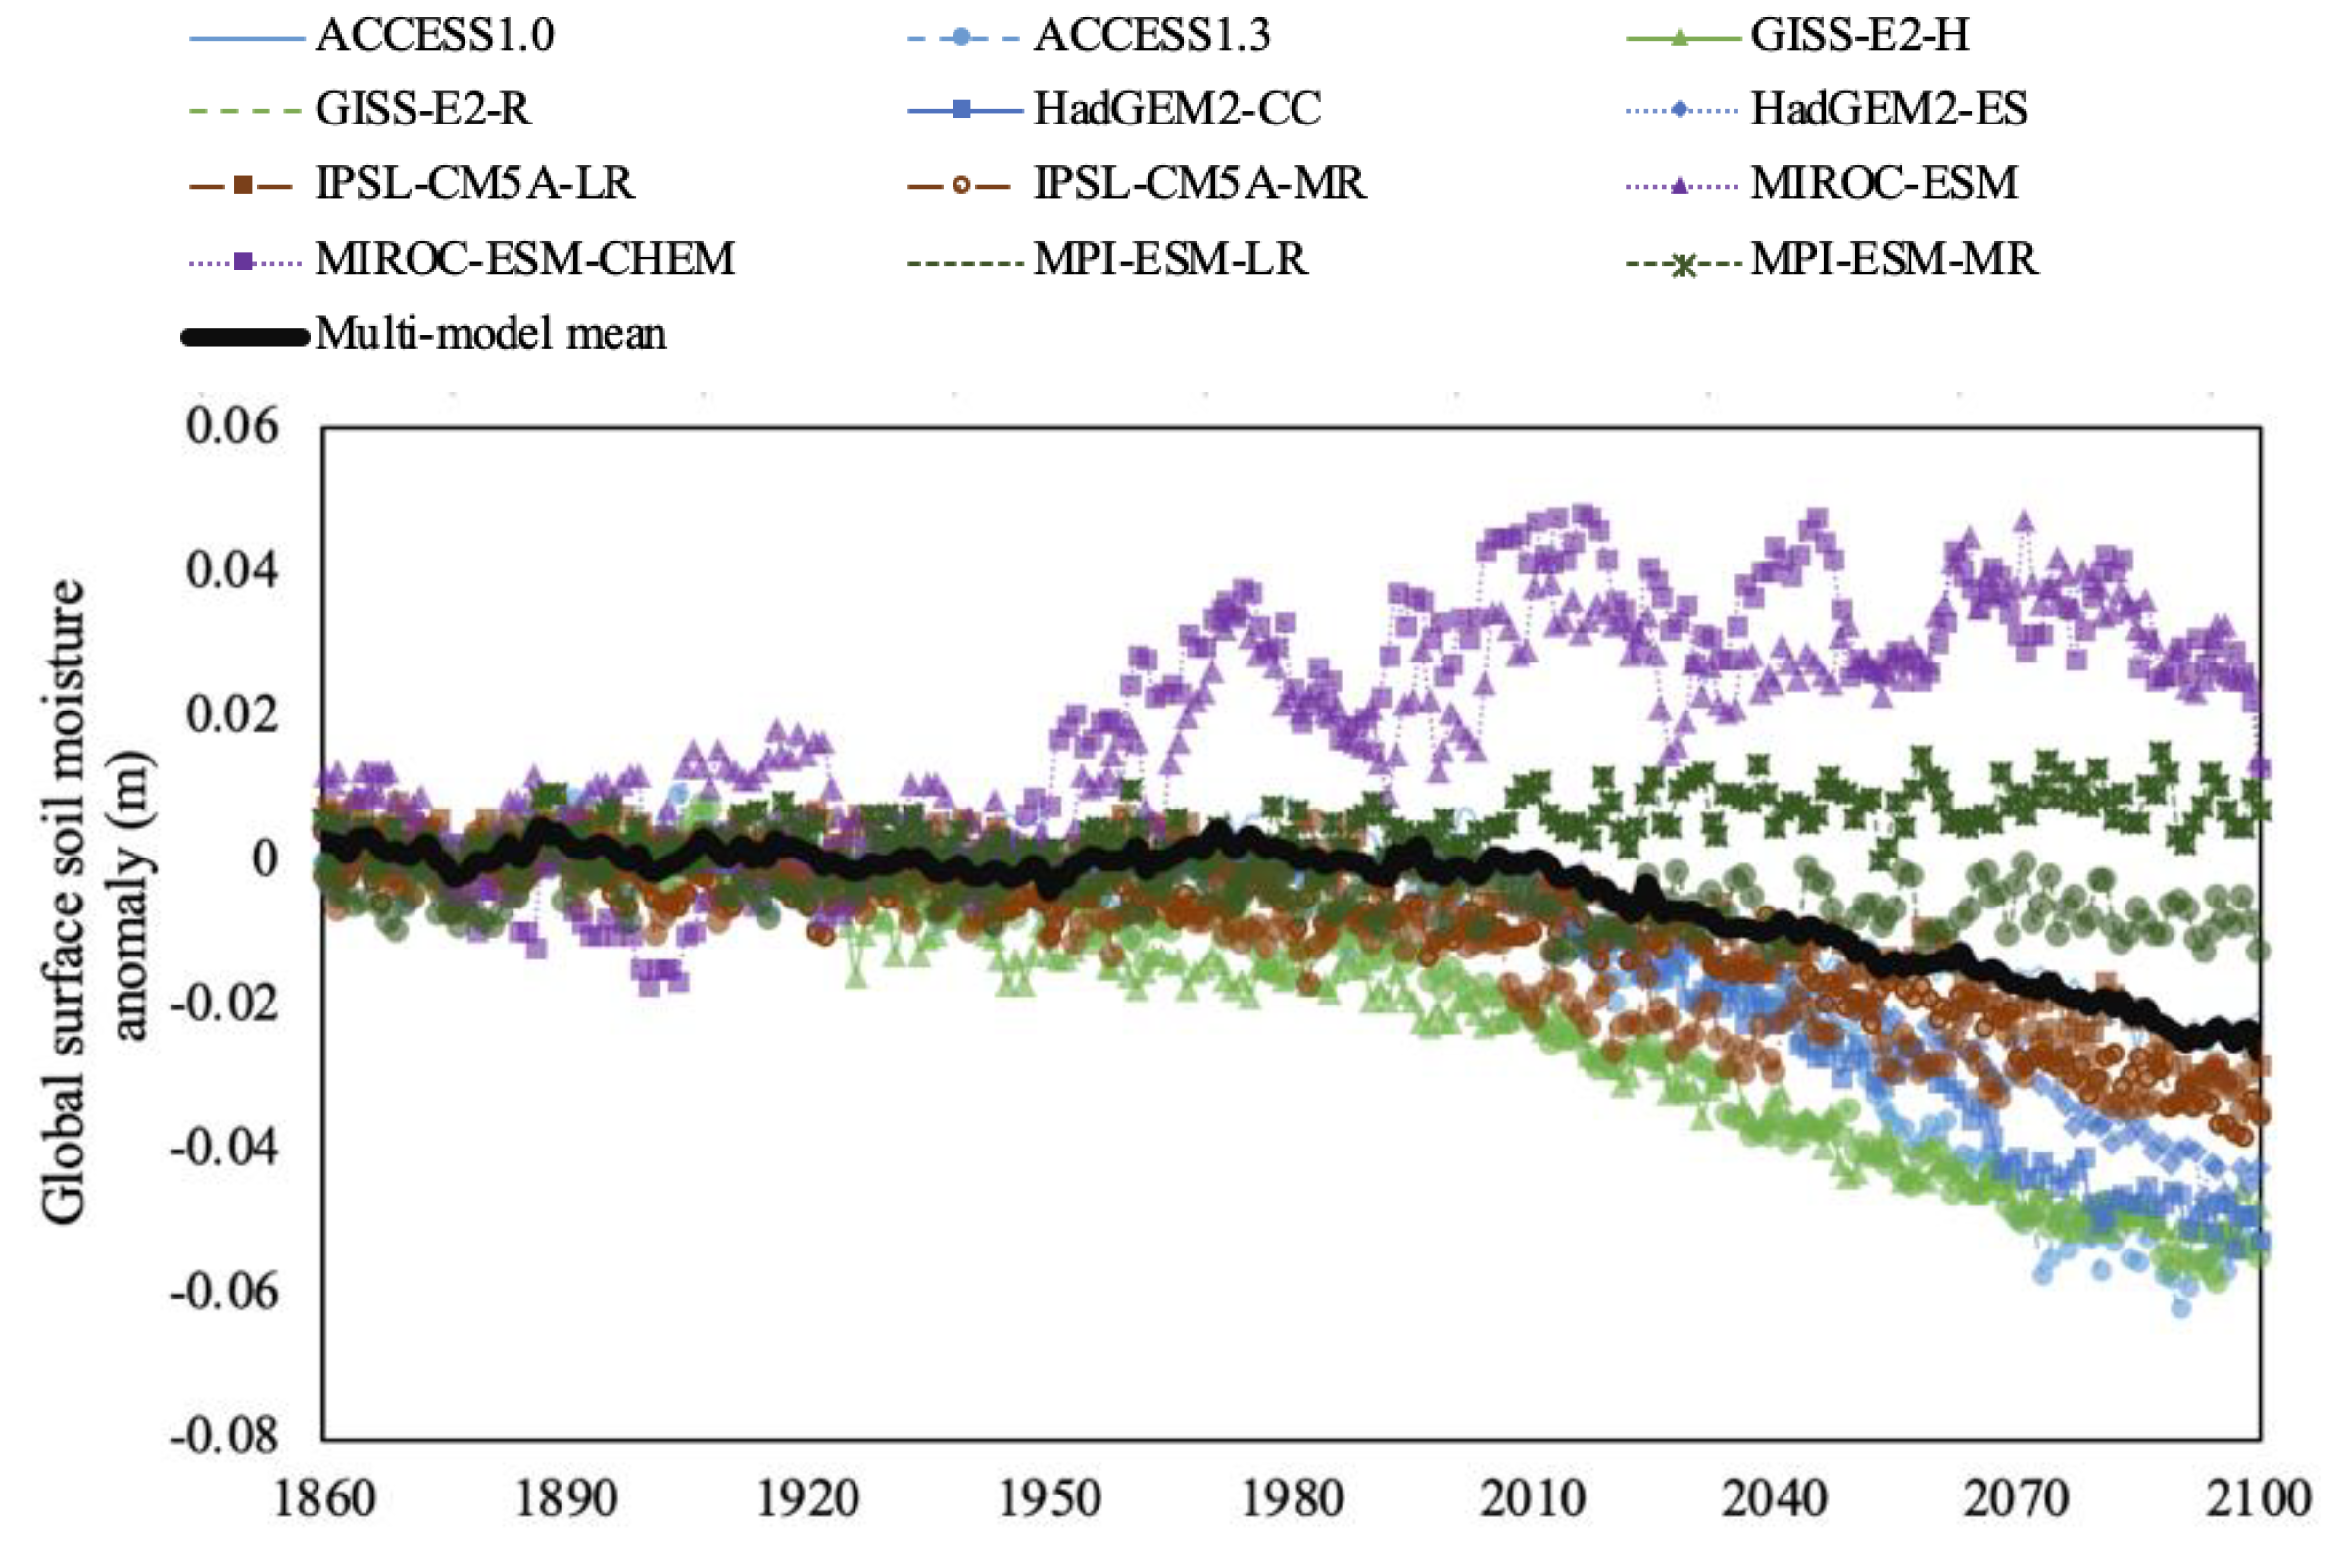
On the other hand, although global land surface is projected to experience a stronger warming in the future, the multi-model mean relative efficiency decreases gradually (Figure 2b). Despite the variability in projected land warming among the different models, the mean LE/H anomaly is negligible as compared to that over the sea (Figure 3). The shift in partitioning of radiative energy at the land surface towards sensible heat flux concurs with the depletion of surface soil moisture (Figure 4). Along with the greening trend of the Earth [29,30], rapid warming over the land surface accelerates evapotranspiration and subsequently extracts subsurface water resources to compensate the surface moisture loss. The large deviations in the projected surface soil moisture change are due to the different coupling between soil moisture and precipitation in earth system models [31,32]. Among the studied models, GISS-E2-H predicts the lower end of global land moisture anomaly, while the MIROC earth system models (MIROC-ESM and MIROC-ESM-CHEM) project a wetter global land at the end of the century. This large gap in the surface soil moisture anomaly indicates a different land–atmosphere coupling in related climate models. The variety in soil moisture affects the estimated surface moisture availability by Equations (2)–(4) and results in the multi-year oscillations of the thermodynamic predictions.
Figure 2b shows notable deviations between thermodynamic predictions and CMIP5 simulations over the land surface, especially towards the end of the century. To quantify the deviations, root mean square error (RMSE) and mean relative error (MRE) are computed as
where t is the time, n is the number of years and equals to 240 in this study, ΔRE is the multi-model mean relative efficiency anomaly, and subscripts Thermo and CMIP5 stand for the results from thermodynamic predictions and the CMIP5 simulations, respectively.
Over sea and land surfaces, RMSE of LE/H by the thermodynamic solution against CMIP5 data is 0.12 and 0.08, while MRE is 14.6% and 68.3%. The large MRE over land surface is caused by the small magnitude of ΔRE, where results from various models have different signs and balance each other out. Compared to sea surface, energy partitioning over land surface is subject to change with more processes, e.g., seasonal vegetation growth or topography-induced weather. It is also worth mentioning that the global mean LE/H anomaly by 2100 is about 40.6% of the LE/H value at year 1860 over the sea surface but is only about 7.7% over the land surface. Accurately capturing the small anomaly will require precise equations that take better account of different land surface processes, and the thermodynamic formula in this study can only generally reproduce the declining trend. Under the less warming RCP4.5 scenario, a large deviation over land surface and a small gap over sea surface between thermodynamic predictions and CMIP5 simulations were also found (Figure 5).
Although the thermodynamic solution in this study neglects the effect of dynamic processes, its small deviations from the multi-model mean of CMIP5 simulations indicate that such effect on surface energy partitioning over sea surface is at second order on a global basis. It is worth mentioning that global precipitation change implied by the Clausius–Clapeyron relationship deviates significantly from climate model predictions [33,34]. Due to sparse in-situ observations [35], climate models have not converged on the ability of the troposphere to radiate away latent heat. Ambiguous estimated trends in upper tropospheric humidity substantially increase the uncertainties of precipitation and downward solar radiation. Propagation of these uncertainties leads to a large variety of surface turbulent heat fluxes across different climate models. While the precise evolution of LE and H is difficult to estimate, our analysis here demonstrates that approximate solutions of surface energy partitioning anomaly can be derived from thermodynamic principles.
3.2. Spatial Distribution of Relative Efficiency Anomaly
We now turn our attention to the spatial distribution of relative efficiency anomaly around the world. From past to present, the difference in relative efficiency (normalized by the mean LE/H value of 1850–1860, ) over land surface is inconclusive (Figure 6a). The evident increases around the Tropic of Cancer in Africa and in northeastern Asia are caused by decreased sensible heat flux. Global sea surface generally witnessed a small increase (<0.2 over 80% of ocean grids) in relative efficiency from 1860 to 2005. The trend in relative efficiency anomaly becomes clear in the warming future (normalized by the mean LE/H value of 1995–2005, Figure 6b). An increased relative efficiency around the Tropic of Cancer in Africa and in northeastern Asia in the historical scenario tends to intensify in the twenty-first century. On the other hand, multi-model mean projects a decline over Oceania, Europe and South America. Increases of relative efficiency over the ocean become more obvious at high latitudes. Contrasting relative efficiency anomalies are consistently found over oceans near Antarctica in both historical and RCP8.5 scenarios. Driven by the stratospheric ozone depletion over Antarctica, the strengthening surface westerlies enhance the advection of cold surface waters northwards [36] and result in the blue regions with a reduced relative efficiency.
The overall water content of a land grid is characterized by the total soil moisture, and its anomaly, together with relative efficiency anomaly, can indicate the warming trend of different regions. Here, we found that the total soil moisture anomaly significantly correlates with local relative efficiency anomaly over global land grids (Figure 7a, r = 0.3972, p < 0.001). Under future climate change, the current moisture level over land allows for surface latent heat flux increasing at a faster rate than sensible heat flux by about 2050 (Figure 1b). The effect of surface temperature rise counteracts the impact of soil moisture decline that relative efficiency over land maintains a steady level in the near future. Such balance is broken as increased land evapotranspiration continuously consumes subsurface water content up to a point at which the decline in soil moisture outweighs the surface temperature rise in controlling land–atmosphere interactions. Since then, energy partitioning has been directed towards the sensible heat flux and a larger energy exchange than water exchange between land surfaces and the atmosphere was observed in the latter part of the century (Figure 1b), leading to a faster descending of relative efficiency (Figure 2b). As global land warming varies with the latitude [4], the area-weighted relative efficiency anomaly does not necessarily agree with soil moisture changes per continent (Figure 7b). Both soil moisture and relative efficiency are projected to decrease substantially under the future warming over Europe and South America, suggesting a warming acceleration in these regions. Slightly decreased relative efficiency with increased soil moisture indicates that Oceania and Asia maintain resistance to rapid warming. However, this resistance may not sustain if anthropogenic modifications of land surface exceed present projections and induce rapid soil moisture depletion.
4. Conclusions
In this study, we investigated the evolution of relative efficiency under future climate projections via multi-model analysis of CMIP5 simulations and thermodynamic predictions. Thermodynamic principles support the observed increase in evapotranspiration during the past decades and suggest a reverse trend in the future once soil moisture drops below a certain threshold. Multi-model mean surface energy partitioning over global land shifts towards sensible heat flux at the end of the century. Decreased relative efficiency and soil moisture depletion exacerbates the water vulnerability in Europe and South America, which already face great challenges from rising water demands and outdated water infrastructure [37,38]. Regional nonlinear response is another critical threat as some regions may see a disproportionately large change in surface temperature and moisture [39]. Changes in water and energy dynamics through surface–atmosphere interfaces will likely vary significantly within individual regions and the broad-scale analysis presented here are intended to identify areas of major concerns. Despite the assumptions and uncertainties embedded in various climate models, our analysis shows that surface energy partitioning over sea surface of new earth system models in CMIP5 follow the intrinsic thermodynamic constraints in response to elevated greenhouse gas emissions. The partitioning over global land nevertheless involves more complex processes and requires further investigation.
Author Contributions
Z.-H. W. conceptualized and supervised the study. J.Y. carried out the data analysis and derived thermodynamic predictions. Z-H.W., J.Y. and H-P. H. jointly designed the research and drafted the manuscript.
Funding
This research was supported by the U.S. National Science Foundation under grant CBET-1435881.
Acknowledgments
The authors would like to thank the anonymous reviewers for their helpful and constructive comments that contributed to the improvement of this study.
Conflicts of Interest
The authors declare no conflict of interest.
References
- Huntington, T.G. Evidence for intensification of the global water cycle: Review and synthesis. J. Hydrol. 2006, 319, 83–95. [Google Scholar] [CrossRef]
- Collins, M.; Knutti, R.; Arblaster, J.; Dufresne, J.L.; Fichefet, T.; Friedlingstein, P.; Gao, X.; Gutowski, W.J.; Johns, T.; Krinner, G.; et al. Chapter 12—Long-term climate change: projections, commitments and irreversibility. In Climate Change 2013-The Physical Science Basis: Contribution of Working Group I to the Fifth Assessment Report of the Intergovernmental Panel on Climate Change; Cambridge University Press: Cambridge, UK, 2013; pp. 1029–1136. [Google Scholar]
- Trenberth, K.E. Changes in precipitation with climate change. Clim. Res. 2011, 47, 123–138. [Google Scholar] [CrossRef] [Green Version]
- Alexander, L.; Zhang, X.; Peterson, T.C.; Caesar, J.; Gleason, B.; Tank, A.K.; Haylock, M.; Collins, D.; Trewin, B.; Rahimzadeh, F.; et al. Global observed changes in daily climate extremes of temperature and precipitation. J. Geophys. Res. Atmos. 2006, 111, D05109. [Google Scholar] [CrossRef]
- Chylek, P.; Dubey, M.; Hengartner, N.; Klett, J. Observed and projected precipitation changes over the nine US climate regions. Atmosphere 2017, 8, 207. [Google Scholar] [CrossRef]
- Zeng, Z.; Zhu, Z.; Lian, X.; Li, L.Z.; Chen, A.; He, X.; Piao, S. Responses of land evapotranspiration to Earth’s greening in CMIP5 Earth System Models. Environ. Res. Lett. 2016, 11, 104006. [Google Scholar] [CrossRef]
- Zhao, T.; Dai, A. The magnitude and causes of global drought changes in the twenty-first century under a low–moderate emissions scenario. J. Clim. 2015, 28, 4490–4512. [Google Scholar] [CrossRef]
- Hartmann, D.L.; Tank, A.M.K.; Rusticucci, M.; Alexander, L.V.; Brönnimann, S.; Charabi, Y.A.R.; Dentener, F.J.; Dlugokencky, E.J.; Easterling, D.R.; Kaplan, A.; et al. Chapter 2—Observations: atmosphere and surface. In Climate Change 2013-The Physical Science Basis: Contribution of Working Group I to the Fifth Assessment Report of the Intergovernmental Panel on Climate Change; Cambridge University Press: Cambridge, UK, 2013; pp. 235–336. [Google Scholar]
- Kim, S.; Liu, Y.Y.; Johnson, F.M.; Parinussa, R.M.; Sharma, A. A global comparison of alternate AMSR2 soil moisture products: Why do they differ? Remote Sens. Environ. 2015, 161, 43–62. [Google Scholar] [CrossRef]
- Petropoulos, G.P.; Ireland, G.; Barrett, B. Surface soil moisture retrievals from remote sensing: Current status, products & future trends. Phys. Chem. Earth 2015, 83, 36–56. [Google Scholar]
- Held, I.M.; Soden, B.J. Robust responses of the hydrological cycle to global warming. J. Clim. 2006, 19, 5686–5699. [Google Scholar] [CrossRef]
- Seneviratne, S.I.; Corti, T.; Davin, E.L.; Hirschi, M.; Jaeger, E.B.; Lehner, I.; Orlowsky, B.; Teuling, A.J. Investigating soil moisture–climate interactions in a changing climate: A review. Earth Sci. Rev. 2010, 99, 125–161. [Google Scholar] [CrossRef]
- Byrne, M.P.; O’Gorman, P.A. The response of precipitation minus evapotranspiration to climate warming: Why the “wet-get-wetter, dry-get-drier” scaling does not hold over land. J. Clim. 2015, 28, 8078–8092. [Google Scholar] [CrossRef]
- Roderick, M.; Sun, F.; Lim, W.; Farquhar, G. A general framework for understanding the response of the water cycle to global warming over land and ocean. Hydrol. Earth Syst. Sci. 2014, 18, 1575–1589. [Google Scholar] [CrossRef] [Green Version]
- Taylor, K.E.; Stouffer, R.J.; Meehl, G.A. An overview of CMIP5 and the experiment design. B. Am. Meteorol. Soc. 2012, 93, 485–498. [Google Scholar] [CrossRef]
- Dirmeyer, P.A.; Jin, Y.; Singh, B.; Yan, X. Trends in land–atmosphere interactions from CMIP5 simulations. J. Hydrometeorol. 2013, 14, 829–849. [Google Scholar] [CrossRef]
- Cox, P.M.; Betts, R.A.; Jones, C.D.; Spall, S.A.; Totterdell, I.J. Acceleration of global warming due to carbon-cycle feedbacks in a coupled climate model. Nature 2000, 408, 184–187. [Google Scholar] [CrossRef]
- Yin, J.; Porporato, A. Diurnal cloud cycle biases in climate models. Nat. Commun. 2017, 8, 2269. [Google Scholar] [CrossRef]
- Lawrence Livermore National Laboratory. Available online: http:// https://esgf-node.llnl.gov/projects/esgf-llnl/ (accessed on 18 September 2019).
- Kleidon, A.; Lorenz, R.D. Non-Equilibrium Thermodynamics and the Production of Entropy: Life, Earth, and Beyond; Springer: Berlin/Heidelberg, Germany, 2004; pp. 1–264. [Google Scholar]
- Bateni, S.; Entekhabi, D. Relative efficiency of land surface energy balance components. Water Resour. Res. 2012, 48, W04510. [Google Scholar] [CrossRef]
- Yang, J.; Wang, Z.H.; Li, Q.; Vercauteren, N.; Bou-Zeid, E.; Parlange, M.B. A novel approach for unraveling the energy balance of water surfaces with a single depth temperature measurement. Limnol. Oceanogr. 2017, 62, 89–103. [Google Scholar] [CrossRef]
- Wang, Z.H.; Bou-Zeid, E.; Smith, J.A. A coupled energy transport and hydrological model for urban canopies evaluated using a wireless sensor network. Q. J. Royal Meteorol. Soc. 2013, 139, 1643–1657. [Google Scholar] [CrossRef]
- Wang, J.; Bras, R. A model of evapotranspiration based on the theory of maximum entropy production. Water Resour. Res. 2011, 47, W03521. [Google Scholar] [CrossRef]
- Yang, J.; Wang, Z.H. Land surface energy partitioning revisited: A novel approach based on single depth soil measurement. Geophys. Res. Lett. 2014, 41, 8348–8358. [Google Scholar] [CrossRef]
- Wang, J.; Bras, R.L. A model of surface heat fluxes based on the theory of maximum entropy production. Water Resour. Res. 2009, 45, W11422. [Google Scholar] [CrossRef]
- Jones, P.; Osborn, T.J.; Briffa, K.R.; Folland, C.K.; Horton, E.B.; Alexander, L.V.; Parker, D.E.; Rayner, N.A. Adjusting for sampling density in grid box land and ocean surface temperature time series. J. Geophys. Res. Atmos. 2001, 106, 3371–3380. [Google Scholar] [CrossRef] [Green Version]
- Sutton, R.T.; Dong, B.; Gregory, J.M. Land/sea warming ratio in response to climate change: IPCC AR4 model results and comparison with observations. Geophys. Res. Lett. 2007, 34, L02701. [Google Scholar] [CrossRef]
- Zhu, Z.; Piao, S.; Myneni, R.B.; Huang, M.; Zeng, Z.; Canadell, J.G.; Ciais, P.; Sitch, S.; Friedlingstein, P.; Arneth, A.; et al. Greening of the Earth and its drivers. Nat. Clim. Change 2016, 6, 791–795. [Google Scholar] [CrossRef]
- Gottfried, M.; Pauli, H.; Futschik, A.; Akhalkatsi, M.; Barančok, P.; Alonso, J.L.B.; Coldea, G.; Dick, J.; Erschbamer, B.; Kazakis, G.; et al. Continent-wide response of mountain vegetation to climate change. Nat. Clim. Change 2012, 2, 111–115. [Google Scholar] [CrossRef]
- Koster, R.D.; Sud, Y.C.; Guo, Z.; Dirmeyer, P.A.; Bonan, G.; Oleson, K.W.; Chan, E.; Verseghy, D.; Cox, P.; Davies, H.; et al. GLACE: the global land–atmosphere coupling experiment. Part I: overview. J. Hydrometeorol. 2006, 7, 590–610. [Google Scholar] [CrossRef]
- Seneviratne, S.I.; Lüthi, D.; Litschi, M.; Schär, C. Land–atmosphere coupling and climate change in Europe. Nature 2006, 443, 205–209. [Google Scholar] [CrossRef]
- Allen, M.R.; Ingram, W.J. Constraints on future changes in climate and the hydrologic cycle. Nature 2002, 419, 224–232. [Google Scholar] [CrossRef]
- Chadwick, R.; Boutle, I.; Martin, G. Spatial patterns of precipitation change in CMIP5: Why the rich do not get richer in the tropics. J. Clim. 2013, 26, 3803–3822. [Google Scholar] [CrossRef]
- Bates, J.J.; Jackson, D.L.; Bréon, F.M.; Bergen, Z.D. Variability of tropical upper tropospheric humidity 1979–1998. J. Geophys. Res. Atmos. 2001, 106, 32271–32281. [Google Scholar] [CrossRef]
- Thompson, D.W.; Solomon, S.; Kushner, P.J.; England, M.H.; Grise, K.M.; Karoly, D.J. Signatures of the Antarctic ozone hole in Southern Hemisphere surface climate change. Nature Geosci. 2011, 4, 741–749. [Google Scholar] [CrossRef]
- Vörösmarty, C.J.; Green, P.; Salisbury, J.; Lammers, R.B. Global water resources: Vulnerability from climate change and population growth. Science 2008, 289, 284–288. [Google Scholar] [CrossRef] [PubMed]
- Liu, X.; Xu, J.; Yang, S.; Lv, Y. Surface energy partitioning and evaporative fraction in a water-saving irrigated rice field. Atmosphere 2019, 10, 51. [Google Scholar] [CrossRef]
- Good, P.; Lowe, J.A.; Andrews, T.; Wiltshire, A.; Chadwick, R.; Ridley, J.K.; Menary, M.B.; Bouttes, N.; Dufresne, J.L.; Gregory, J.M.; et al. Nonlinear regional warming with increasing CO2 concentrations. Nat. Clim. Change 2015, 5, 138–143. [Google Scholar] [CrossRef]
Figure 1.
Trends of surface temperature, heat fluxes, and relative efficiency. (a) Derived relative efficiency as a function of surface temperature and surface moisture availability β. (b) Anomalies in global mean surface temperature, sensible heat flux, and latent heat flux during 1860–2100 from CMIP5 simulations. Results between 2006 and 2100 are obtained from the Representative Concentration Pathway of +8.5 W m−2 (RCP8.5) scenario. The colored bands denote the boundaries of one standard deviation from the multi-model mean. LE and H denote the latent and sensible heat fluxes, respectively.

Figure 2.
Anomaly of relative efficiency across the CMIP5 simulations from past to future over (a) sea and (b) land. The results between 2006 and 2100 were obtained from the RCP8.5 scenario.
Figure 2.
Anomaly of relative efficiency across the CMIP5 simulations from past to future over (a) sea and (b) land. The results between 2006 and 2100 were obtained from the RCP8.5 scenario.


Figure 3.
Mean LE/H anomaly and mean temperature anomaly between 1860 and 2100 over global land and sea surfaces from the RCP8.5 scenario.
Figure 3.
Mean LE/H anomaly and mean temperature anomaly between 1860 and 2100 over global land and sea surfaces from the RCP8.5 scenario.

Figure 4.
Anomaly of global land surface soil moisture (upper 10 cm) across the CMIP5 simulations from past to future. The results between 2006 and 2100 were obtained from the RCP8.5 scenario.
Figure 4.
Anomaly of global land surface soil moisture (upper 10 cm) across the CMIP5 simulations from past to future. The results between 2006 and 2100 were obtained from the RCP8.5 scenario.

Figure 5.
Anomaly of global relative efficiency in the RCP4.5 scenario of CMIP5 simulations over (a) sea and (b) land.
Figure 5.
Anomaly of global relative efficiency in the RCP4.5 scenario of CMIP5 simulations over (a) sea and (b) land.

Figure 6.
Spatial distribution of multi-model mean relative efficiency anomaly across the CMIP5 simulations. (a) Difference in LE/H between 1860 and 2005 normalized by the mean LE/H value of 1850–1860 in the historical Scenario. (b) Difference in LE/H between 2006 and 2100 normalized by the mean LE/H value of 1995–2005 in the RCP8.5 scenario.

Figure 7.
Relative efficiency and total soil moisture anomalies over global land in the RCP8.5 scenario across the CMIP5 simulations. (a) Relationship between relative efficiency anomaly and total soil moisture anomaly over individual land grids. (b) Mean relative efficiency and total soil moisture anomalies over continents.


Table 1.
Summary of the Coupled Model Intercomparison Phase 5 (CMIP5) earth system models analysed in this study.
Table 1.
Summary of the Coupled Model Intercomparison Phase 5 (CMIP5) earth system models analysed in this study.
| Model Name | Institute |
|---|---|
| ACCESS1.0 ACCESS1.3 | Commonwealth Scientific and Industrial Research Organization and Bureau of Meteorology, Australia |
| GISS-E2-H GISS-E2-R | NASA Goddard Institute for Space Studies, USA |
| HadGEM2-CC HadGEM2-ES | Met Office Hadley Centre, United Kingdom |
| IPSL-CM5A-LR IPSL-CM5A-MR | Institut Pierre-Simon Laplace, France |
| MIROC-ESM MIROC-ESM-CHEM | Japan Agency for Marine-Earth Science and Technology, Atmosphere and Ocean Research Institute (The University of Tokyo), and National Institute for Environmental Studies |
| MPI-ESM-LR MPI-ESM-MR | Max Planck Institute for Meteorology, Germany |
© 2019 by the authors. Licensee MDPI, Basel, Switzerland. This article is an open access article distributed under the terms and conditions of the Creative Commons Attribution (CC BY) license (http://creativecommons.org/licenses/by/4.0/).
Share and Cite
MDPI and ACS Style
Yang, J.; Wang, Z.-H.; Huang, H.-P. Intercomparison of the Surface Energy Partitioning in CMIP5 Simulations. Atmosphere 2019, 10, 602. https://0-doi-org.brum.beds.ac.uk/10.3390/atmos10100602
AMA Style
Yang J, Wang Z-H, Huang H-P. Intercomparison of the Surface Energy Partitioning in CMIP5 Simulations. Atmosphere. 2019; 10(10):602. https://0-doi-org.brum.beds.ac.uk/10.3390/atmos10100602
Chicago/Turabian StyleYang, Jiachuan, Zhi-Hua Wang, and Huei-Ping Huang. 2019. "Intercomparison of the Surface Energy Partitioning in CMIP5 Simulations" Atmosphere 10, no. 10: 602. https://0-doi-org.brum.beds.ac.uk/10.3390/atmos10100602
Note that from the first issue of 2016, this journal uses article numbers instead of page numbers. See further details here.