Article

An Air Quality Health Index (AQHI) with Different Health Outcomes Based on the Air Pollution Concentrations in Stockholm during the Period of 2015–2017

Swedish Environmental Protection Agency, Hammarby fabriksväg 19, SE-120 30 Stockholm, Sweden
Submission received: 21 December 2019 / Revised: 5 February 2020 / Accepted: 8 February 2020 / Published: 12 February 2020
(This article belongs to the Special Issue Health Impact Assessment of Air Pollution)

Abstract

:
The Air Quality Health Index (AQHI) is a tool that has been developed in order to address the health effects caused by simultaneous exposure to several different air pollutants. Short-term health effects in terms of mortality or morbidity are used in order to construct an index. In this study, different indexes for different health outcomes, based on the concentrations of NO2, O3, and PM10 at an urban background measuring station in Stockholm during the period of 2015–2017, are calculated by using different risk-coefficients obtained from a meta-analysis. An AQHI based on local risk-coefficients for asthma emergency department visits (AEDV) in Stockholm is also included in the analysis. Correlation coefficients between different pairs of AQHIs, where the additive effects associated with exposure to NO2, O3, and PM10 during 2015–2017 are used, exhibit R-values as in 12 out of 15 cases exceed 0.80. However, the average risk increase for different AQHIs are very different, where indexes based on hospital admissions for asthma are larger than those based on mortality outcomes. An overall conclusion is that different AQHIs for different population groups are not needed, but the index may need to be weighted differently for different population groups.

1. Introduction

The Air Quality Health Index (AQHI) is a tool that has been developed in order to address the health effects caused by simultaneous exposure to several different air pollutants, and can thereby for preventive purposes be used as a warning system regarding the current or the forecasted air quality situation. The Air Quality Index (AQI), which is commonly used in many cities as a tool to quantify the air quality, is normally based on several pollutants, but where the pollutant with the highest concentration in relation to its standard value determines the index value [1]. This means that the additive effects of several different air pollutants are not captured. Contrary, the AQHI is based on a multi-pollutant approach, where the excess risks of different health outcomes related to exposure to a group of air pollutants are used in order to construct the index. Short-term health effects in terms of mortality or morbidity are usually used. Previous studies have used several different health-related indicators in order to construct an AQHI. Excess risks associated with short-term mortality from different combinations of air pollutants have been used in Canada by Stieb et al. (2008) [1] and in China by Li et al. (2017) [2]. A similar approach has been performed in South Africa by Cairncross et al. (2007) [3].
An AQHI based on the exposure-response relationships between short-term mortality and different combinations of air pollutants has also been proven to be useful for other health outcomes. In Chen et al. (2014) [4], an AQHI based on excess risks of mortality was also significantly associated with emergency department visits for acute ischemic stroke in the city of Edmonton in Canada. This AQHI, based on mortality, has also been significantly correlated with emergency department visits for asthma in Ontario, Canada, as has been shown by Szyszkowicz et al. (2014) [5]. Significant correlations between this AQHI and increased use of asthma health services in Ontario, Canada, have also been shown in To et al. (2013) [6], where significant associations were found for asthma outpatient visits, hospitalizations, and emergency department visits. The AQHI that has been constructed based on excess risks of mortality is thus also significantly correlated with asthma, where the mortality rate, however, is low.
The main purpose of this study is to analyze how the AQHI varies depending on the health outcome that is used in order to construct the index. The reason for this is to clarify if different types of AQHI are needed for different population groups, i.e., sensitive groups with cardiovascular or respiratory diseases, children and elderly, and healthy individuals who want to avoid poor air quality for preventive purposes. This study is partly a further development of a previous study in Stockholm, where a local AQHI was constructed by using locally produced risk-coefficients for asthma emergency department visits (Olstrup et al., 2019) [7], but where the calculated AQHI is not highly correlated with the threshold-based index (AQI) based on PM10. In this study, the correlations between different AQHI based on different health outcomes are analyzed.
By using air pollution data for NO2, O3, and PM10 from an urban background station in Stockholm during the period of 2015–2017 (see Appendix A) and meta-coefficients for the excess risks of different health outcomes [8], the variations of the additive effects of different indexes and the correlations between them are graphically presented and statistically analyzed. Additive effects associated with simultaneous exposure to NO2, O3, and PM10 have been assumed, since synergistic effects have normally not been observed at environmental exposure levels [9].

2. Experiments

Different AQHIs based on NO2, O3, and PM10 are calculated by using several risk-coefficients obtained from a meta-analysis [
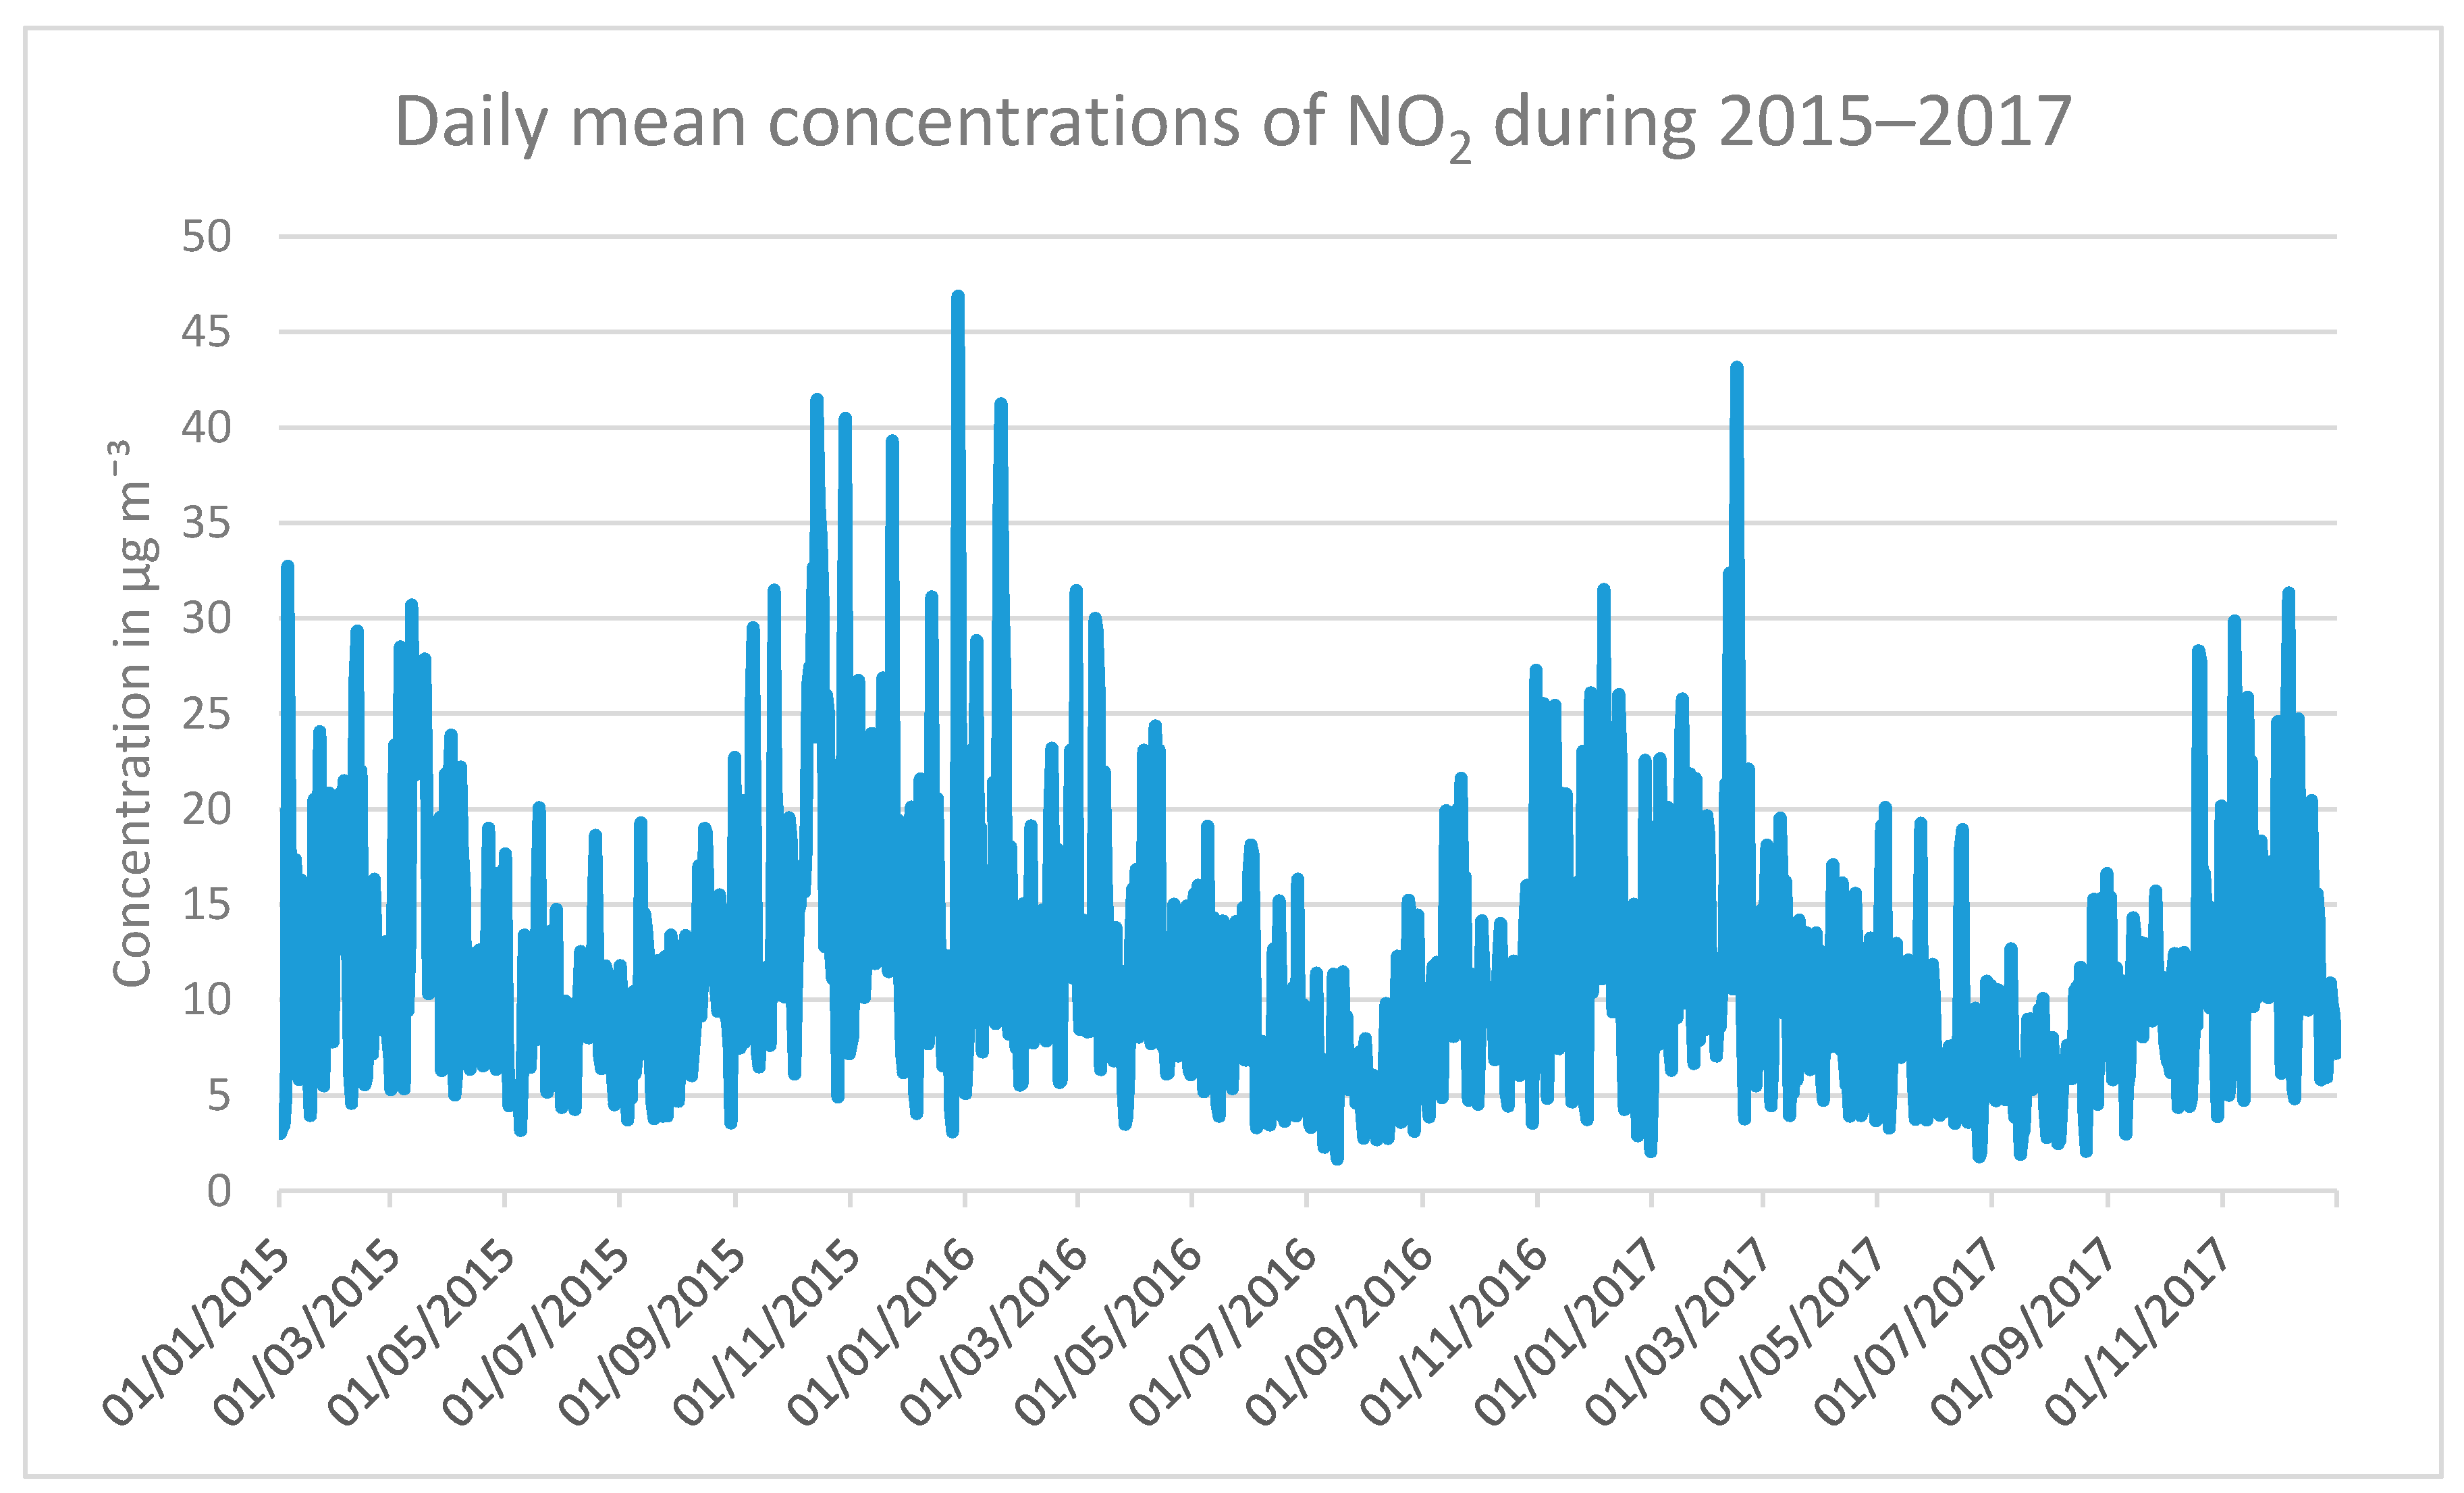
8]. The choice of NO2, O3, and PM10 is based on their representation of different sources of air pollution. NO
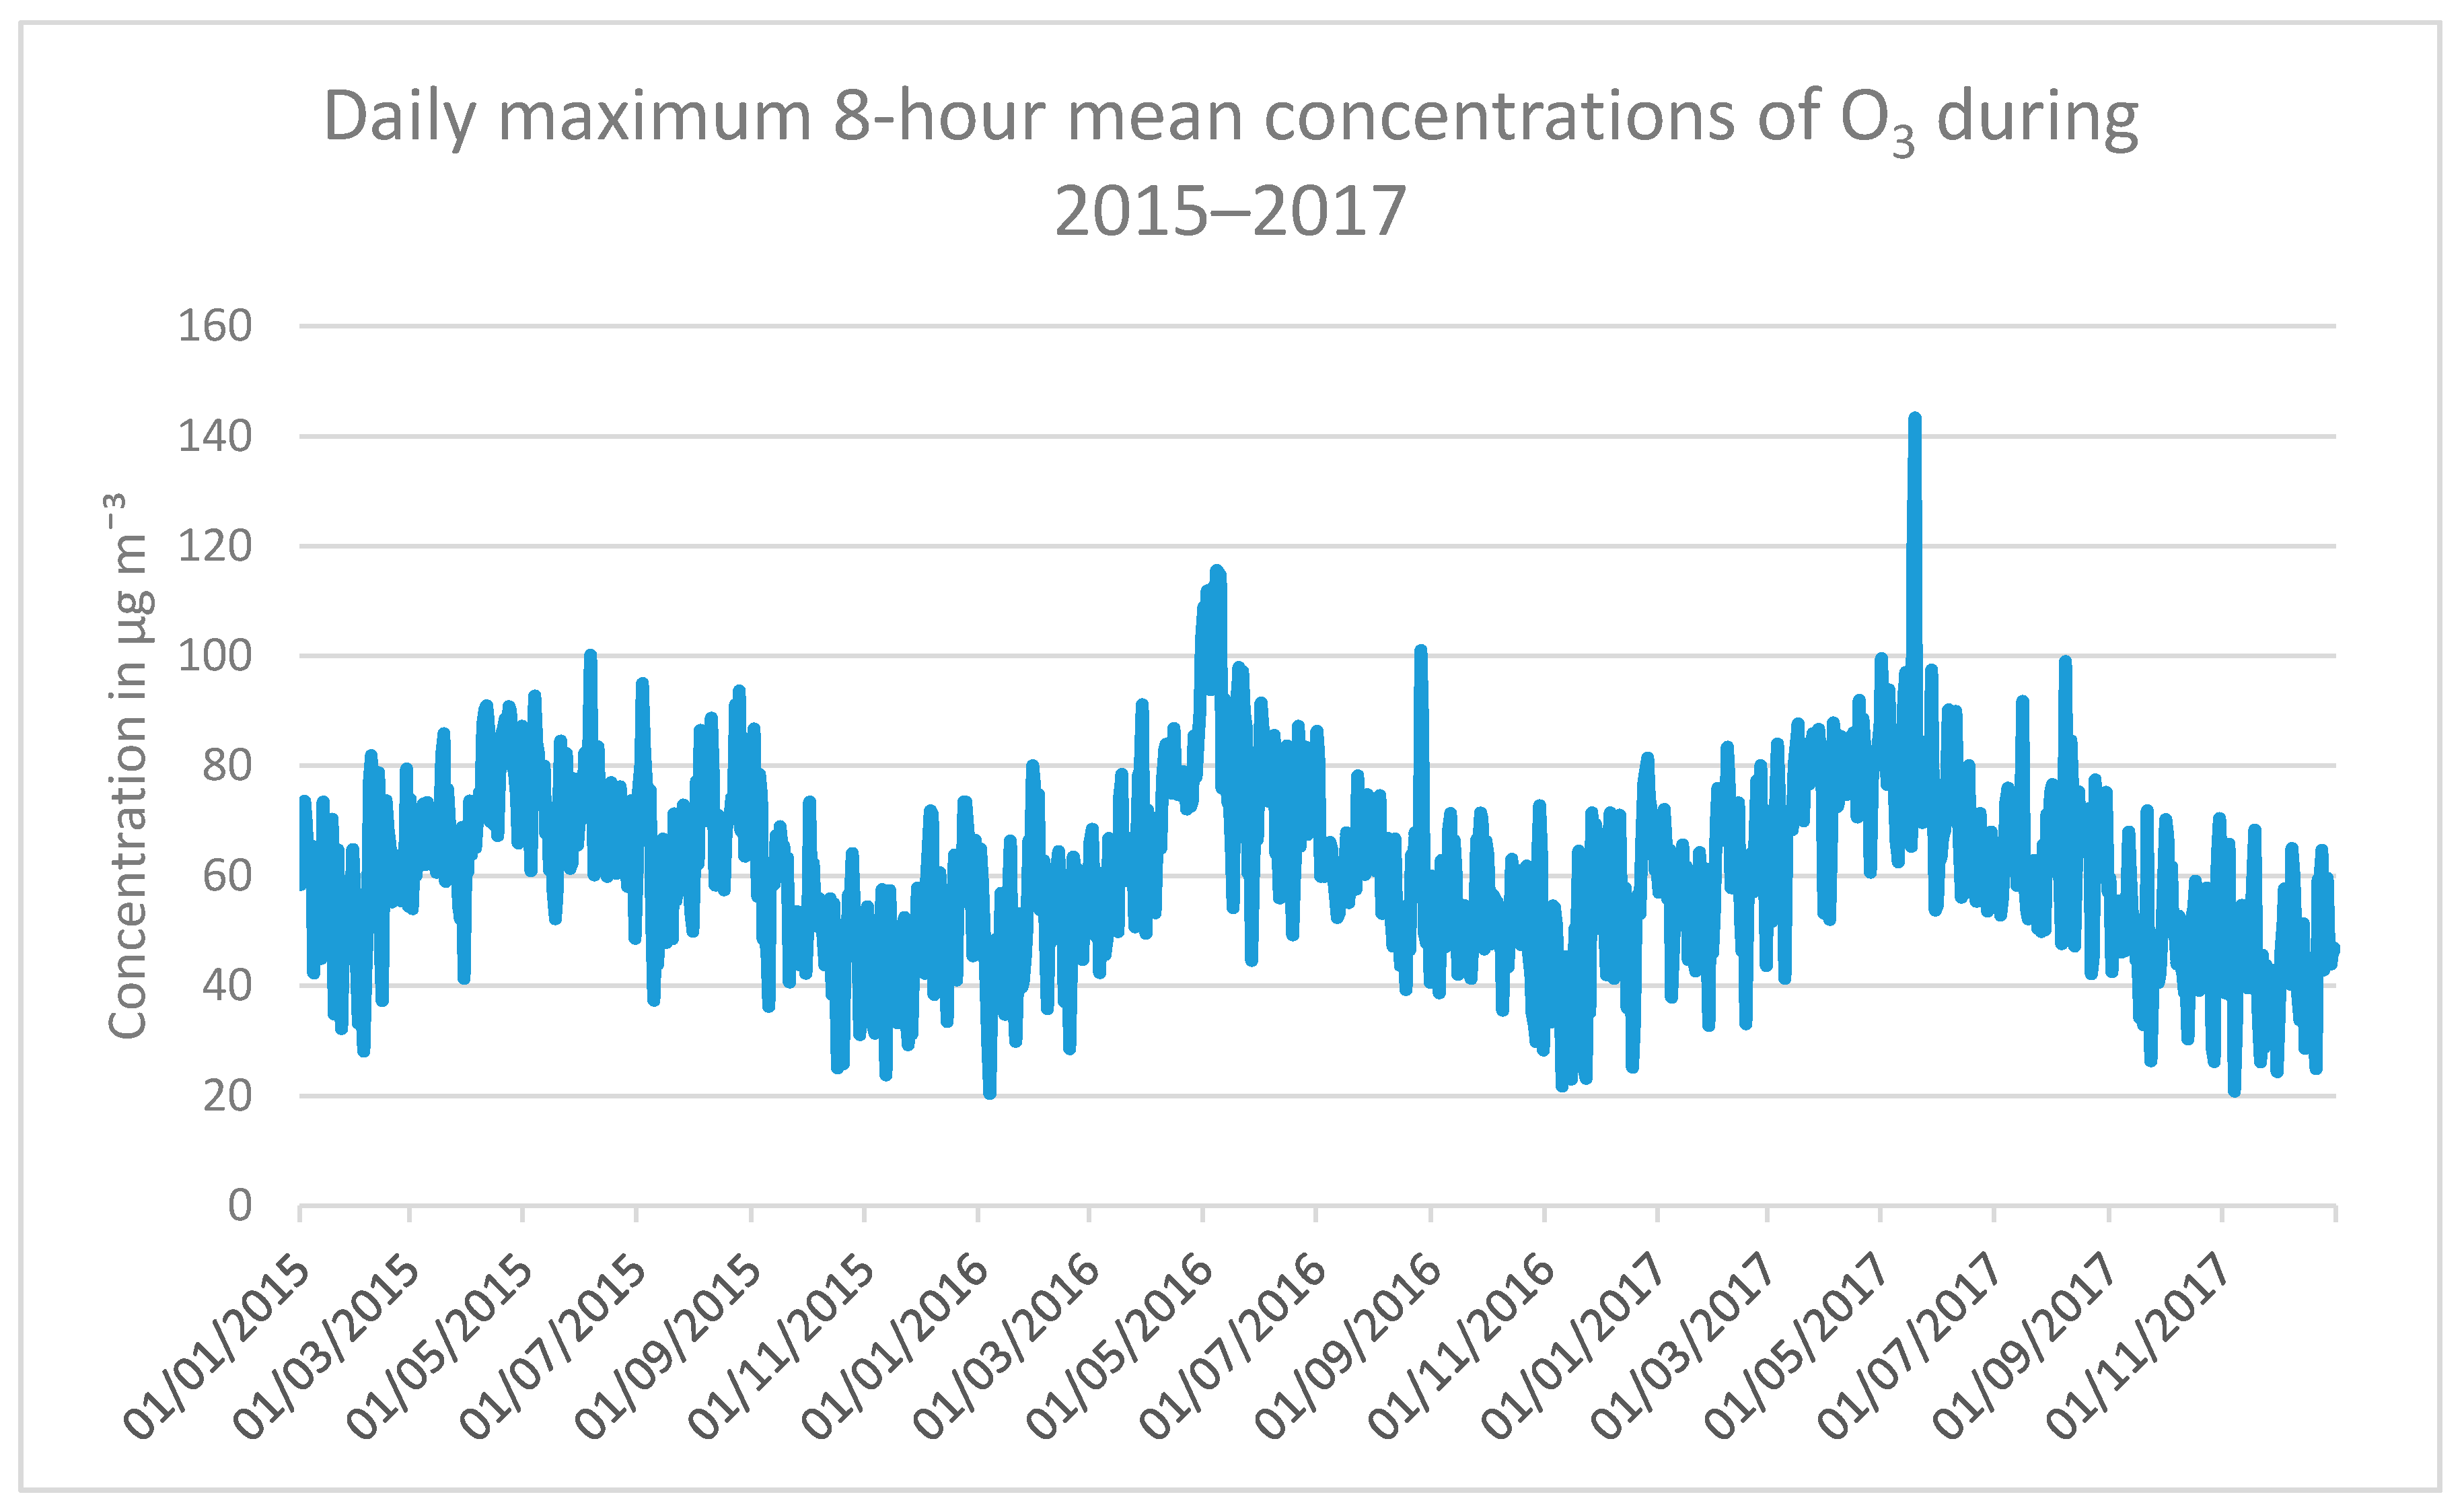
2 represents exhaust emissions, O
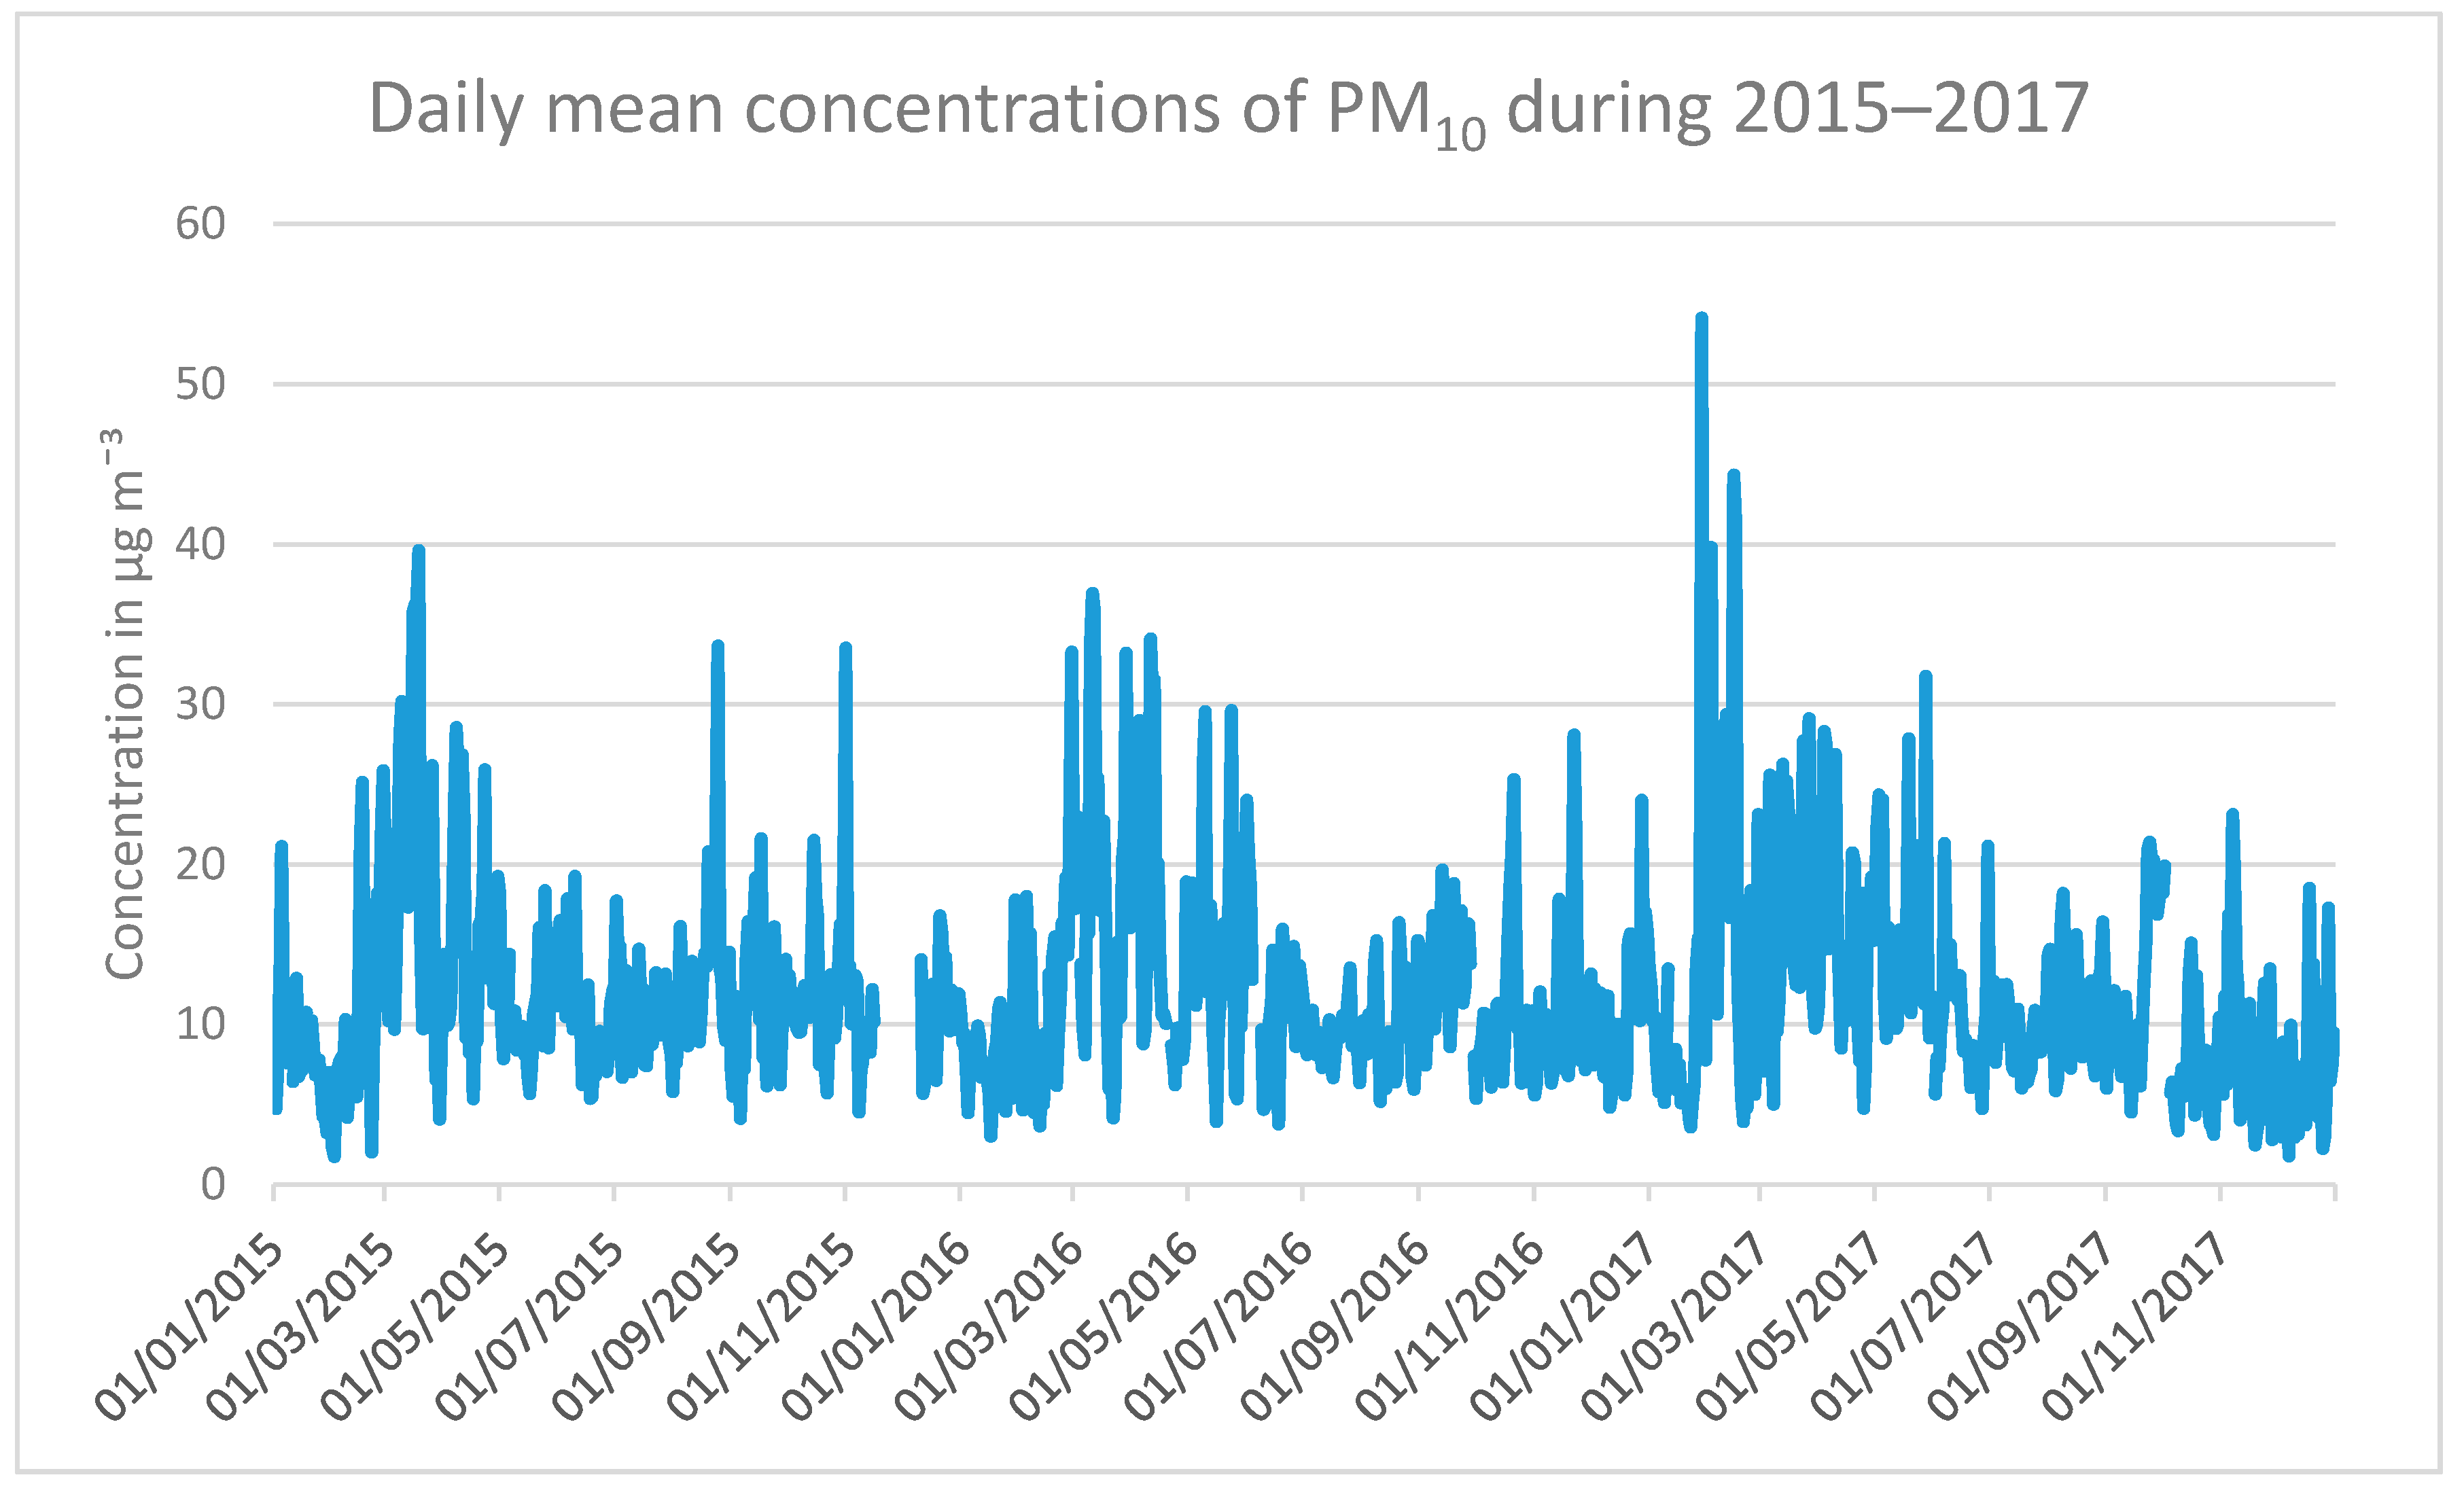
3 is a marker for oxidants, and PM10 represents a wide spectrum of particles, where the mass consists largely of mechanically generated road dust particles.
Different indexes are calculated for Stockholm during the period of 2015–2017 based on the concentrations of the above-mentioned air pollutants at a measuring station representing urban background. The monitoring station is located on a roof 20 m above street level and represents urban background concentrations, and it is a part of the city’s regulatory air pollution control network. The methods and instruments at the station are described in Table 1.
The AQHI is calculated as a percentage increase according to the following equation:
AQHI   =   i = 1 p 100   ( e β i X i 1 )
The beta-coefficient (βi) represents the increase in a specific health outcome associated with 1 µg m-3 increase of each individual air pollutant (i) for pollutant 1 to p and where Xi represents the absolute no-threshold concentration of the specific air pollutant measured in µg m-3. Since the beta-coefficients are based on no-threshold concentrations, the AQHI is calculated by using the absolute concentrations assuming no threshold under which no effect occurs. The concentrations of NO2 and PM10 are based on daily mean values, while the concentrations of O
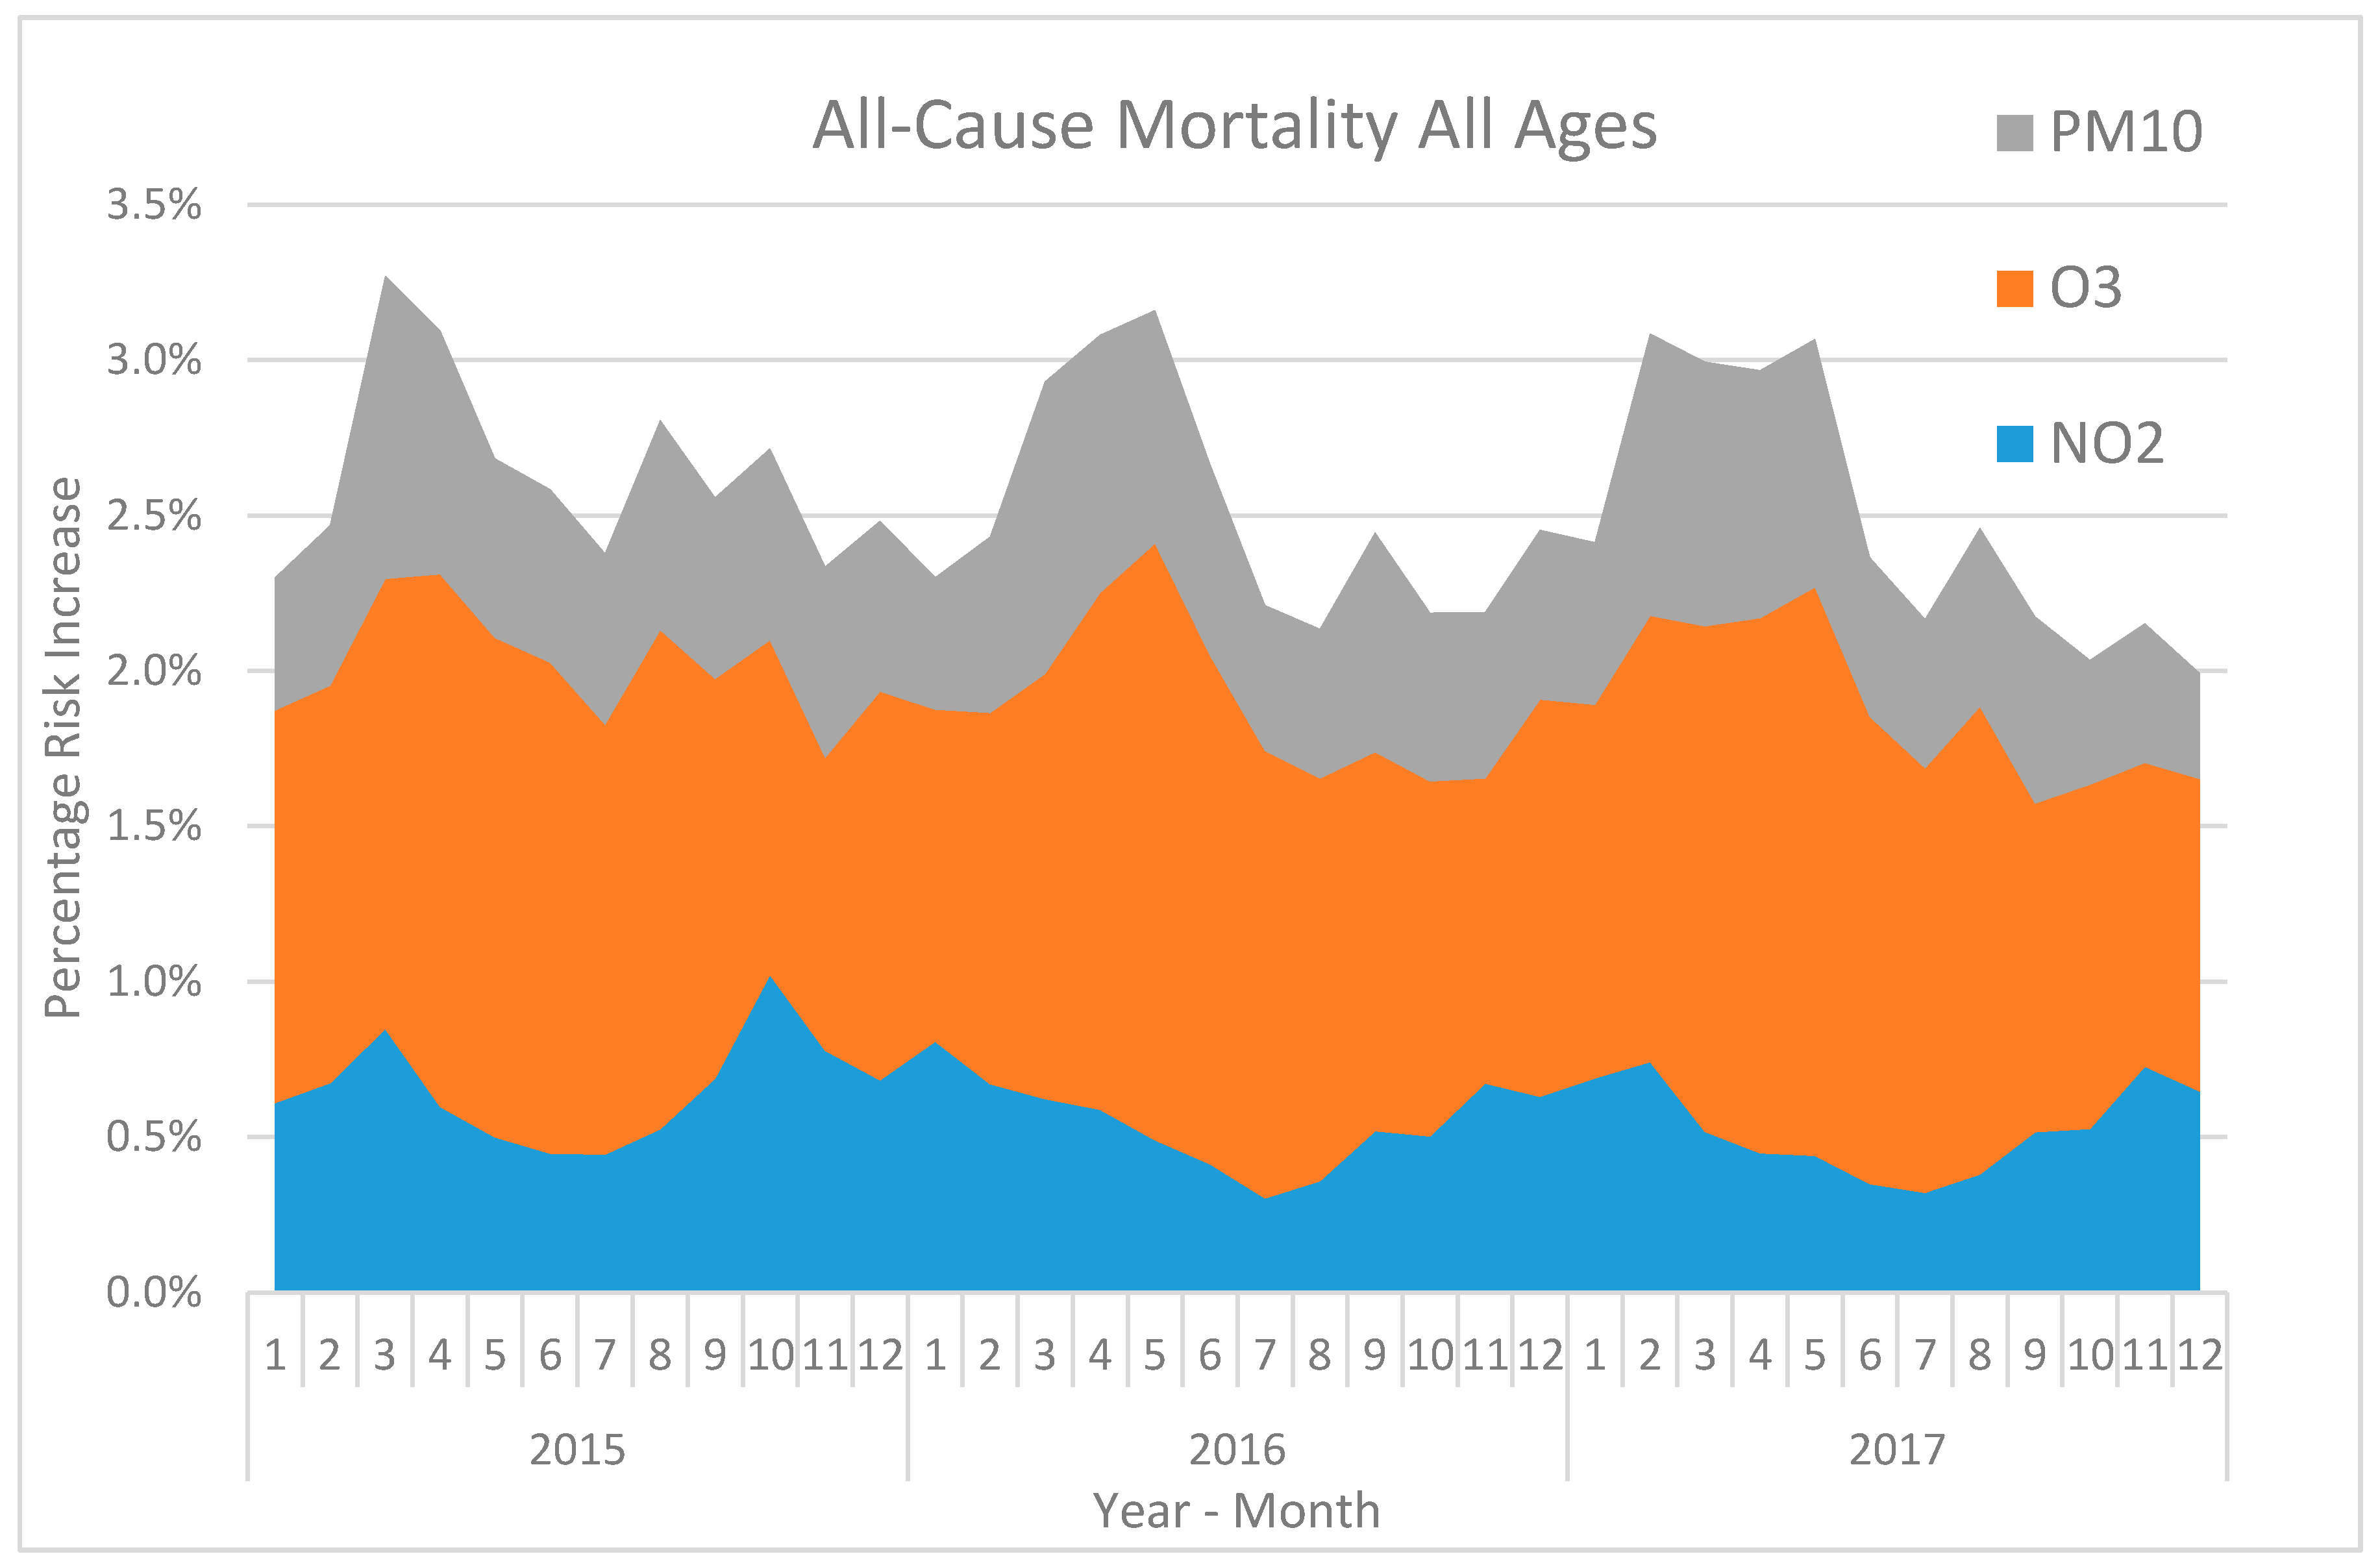
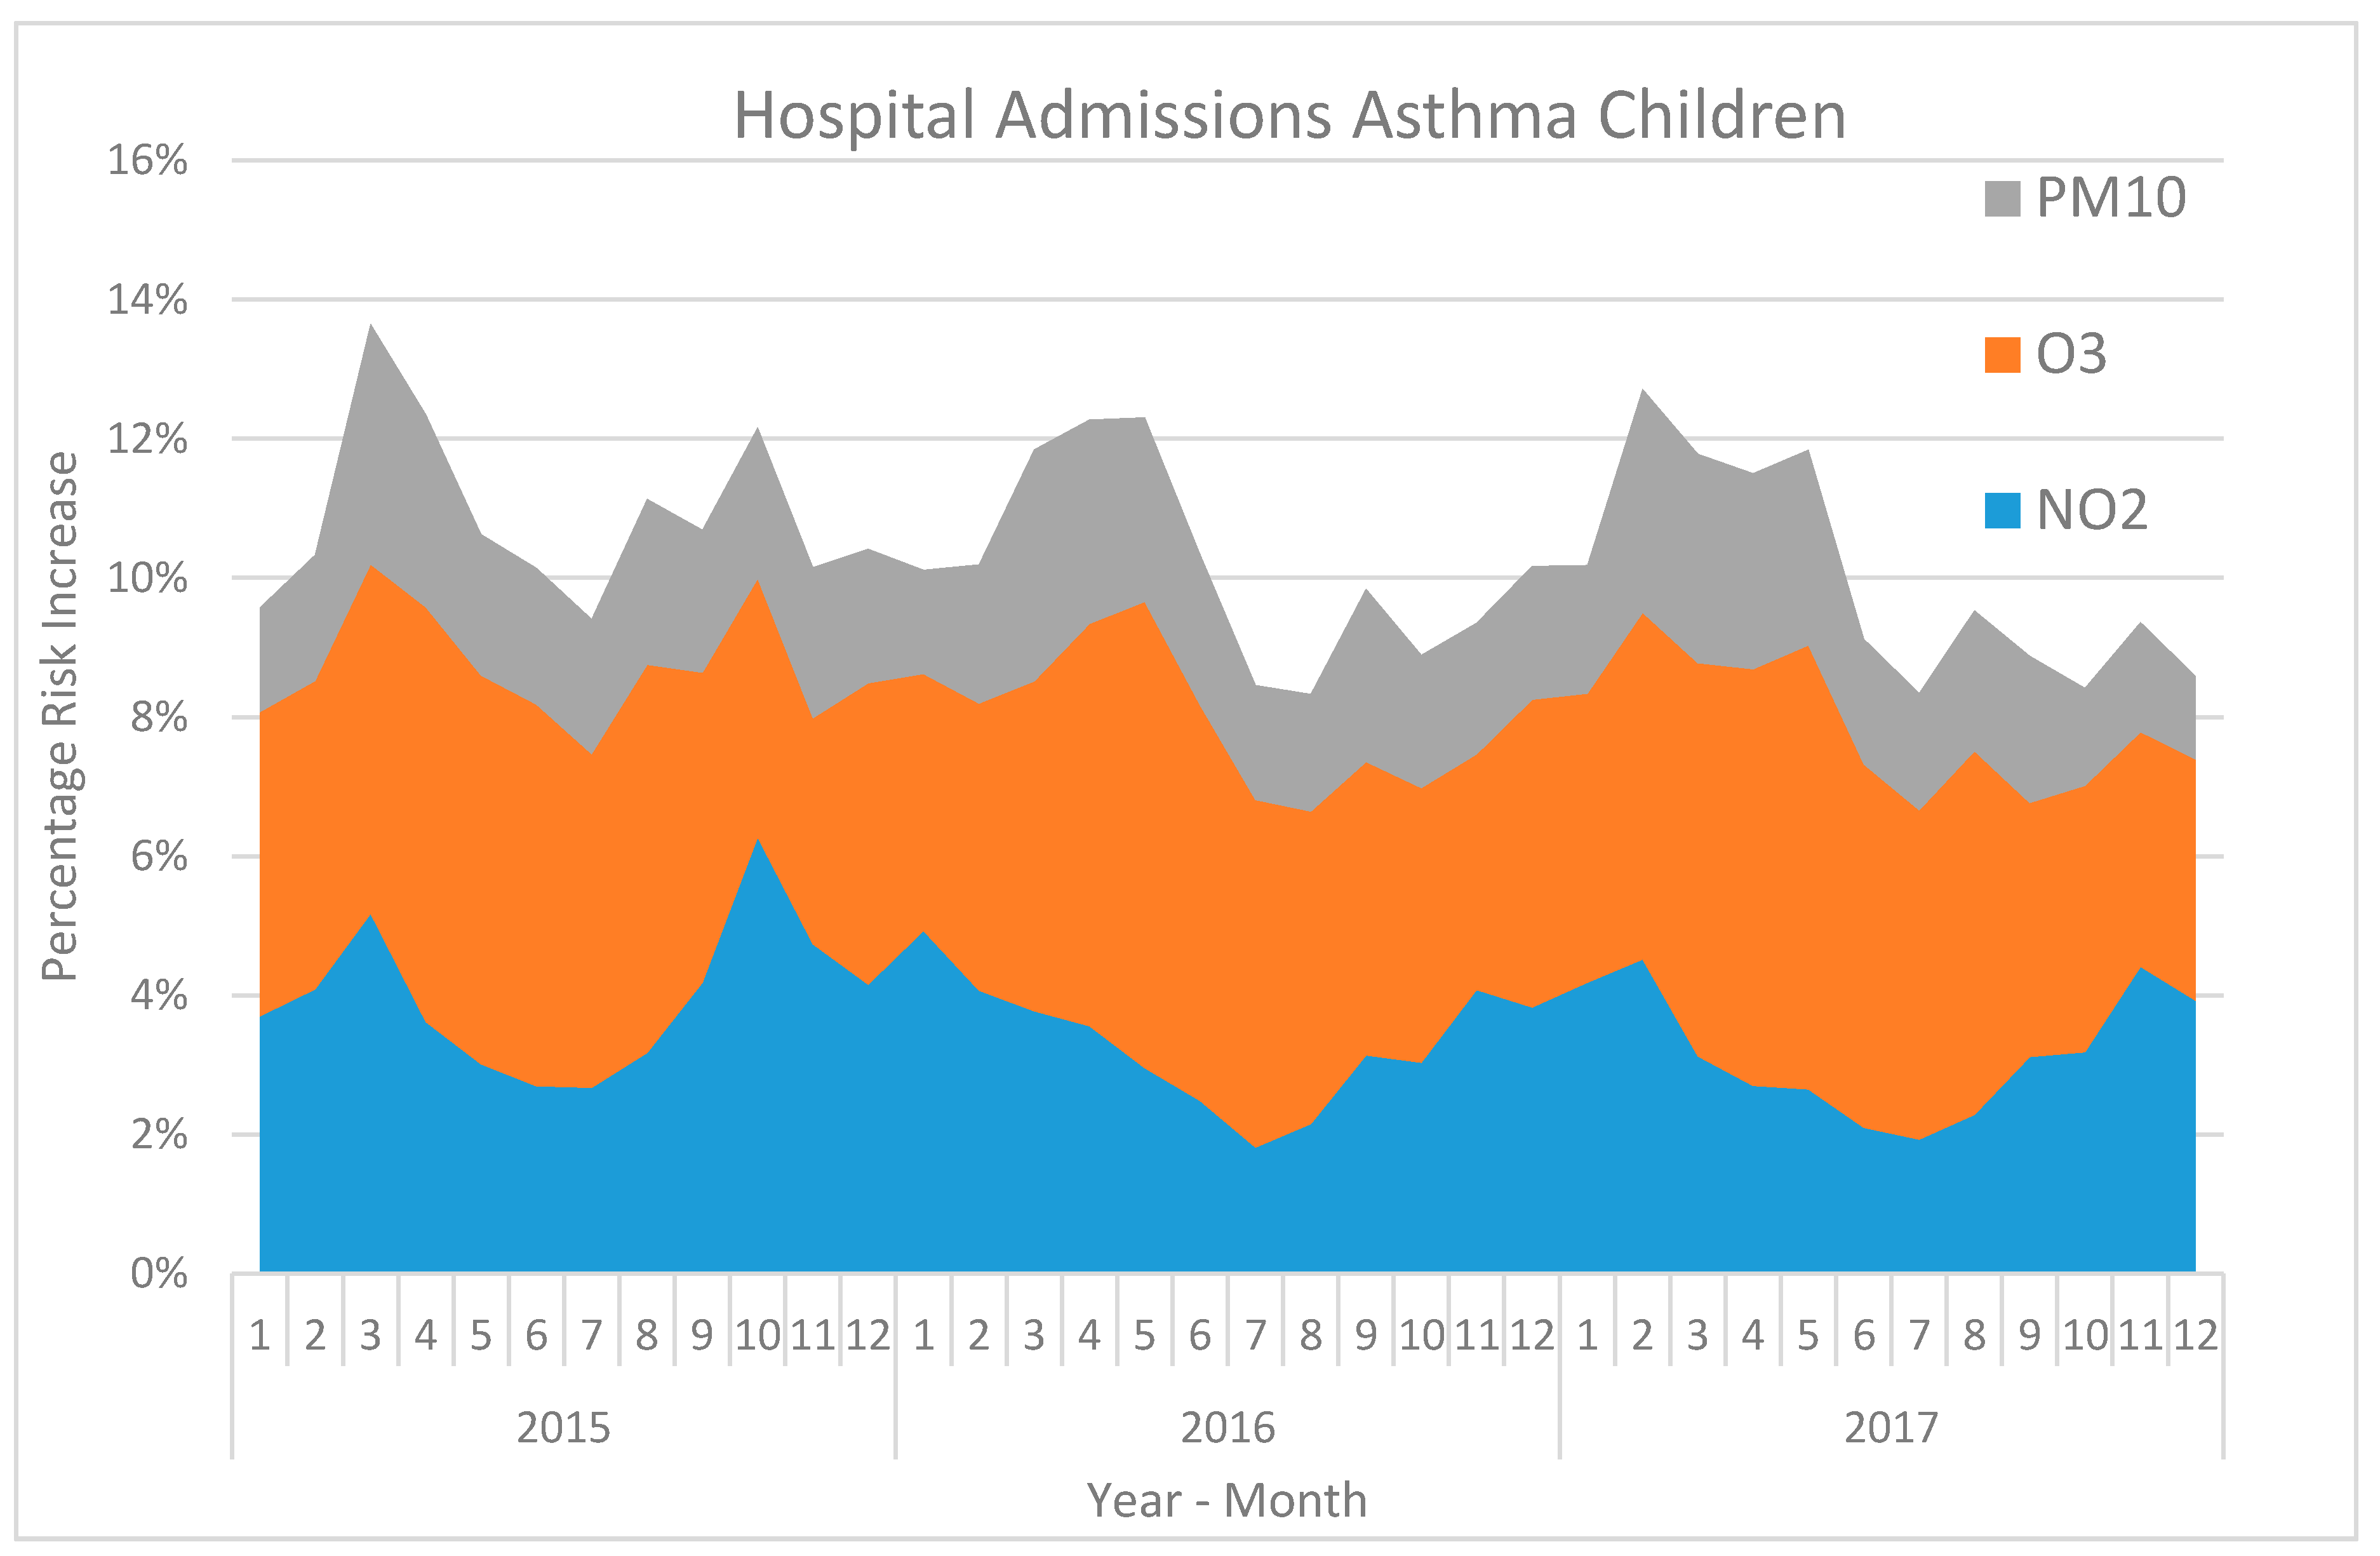
3 are based on daily maximum 8-h mean values. The AQHI represents the total percentage increase by adding the individual effect of each air pollutant. The variations in the index during the period of 2015–2017 are presented for different health outcomes including mortality and morbidity, and where different age groups are analyzed separately. The correlations between all pairs of combinations of indexes, based on the beta-coefficients for different health outcomes, are calculated by using Pearson correlation coefficient according to the following equation:
r xy   =   n Σ x y Σ x Σ y [ n Σ x 2   ( Σ x ) 2   ] [ n Σ y 2 ( Σ y ) 2 ]
In Equation (2), rxy is the correlation coefficient, n is the sample size and x and y are the individual sample points.
There are not local beta-coefficients from Stockholm available for all health outcomes that form the basis for the analyses, and therefore, beta-coefficients from a meta-analysis (Anderson et al., 2007) [
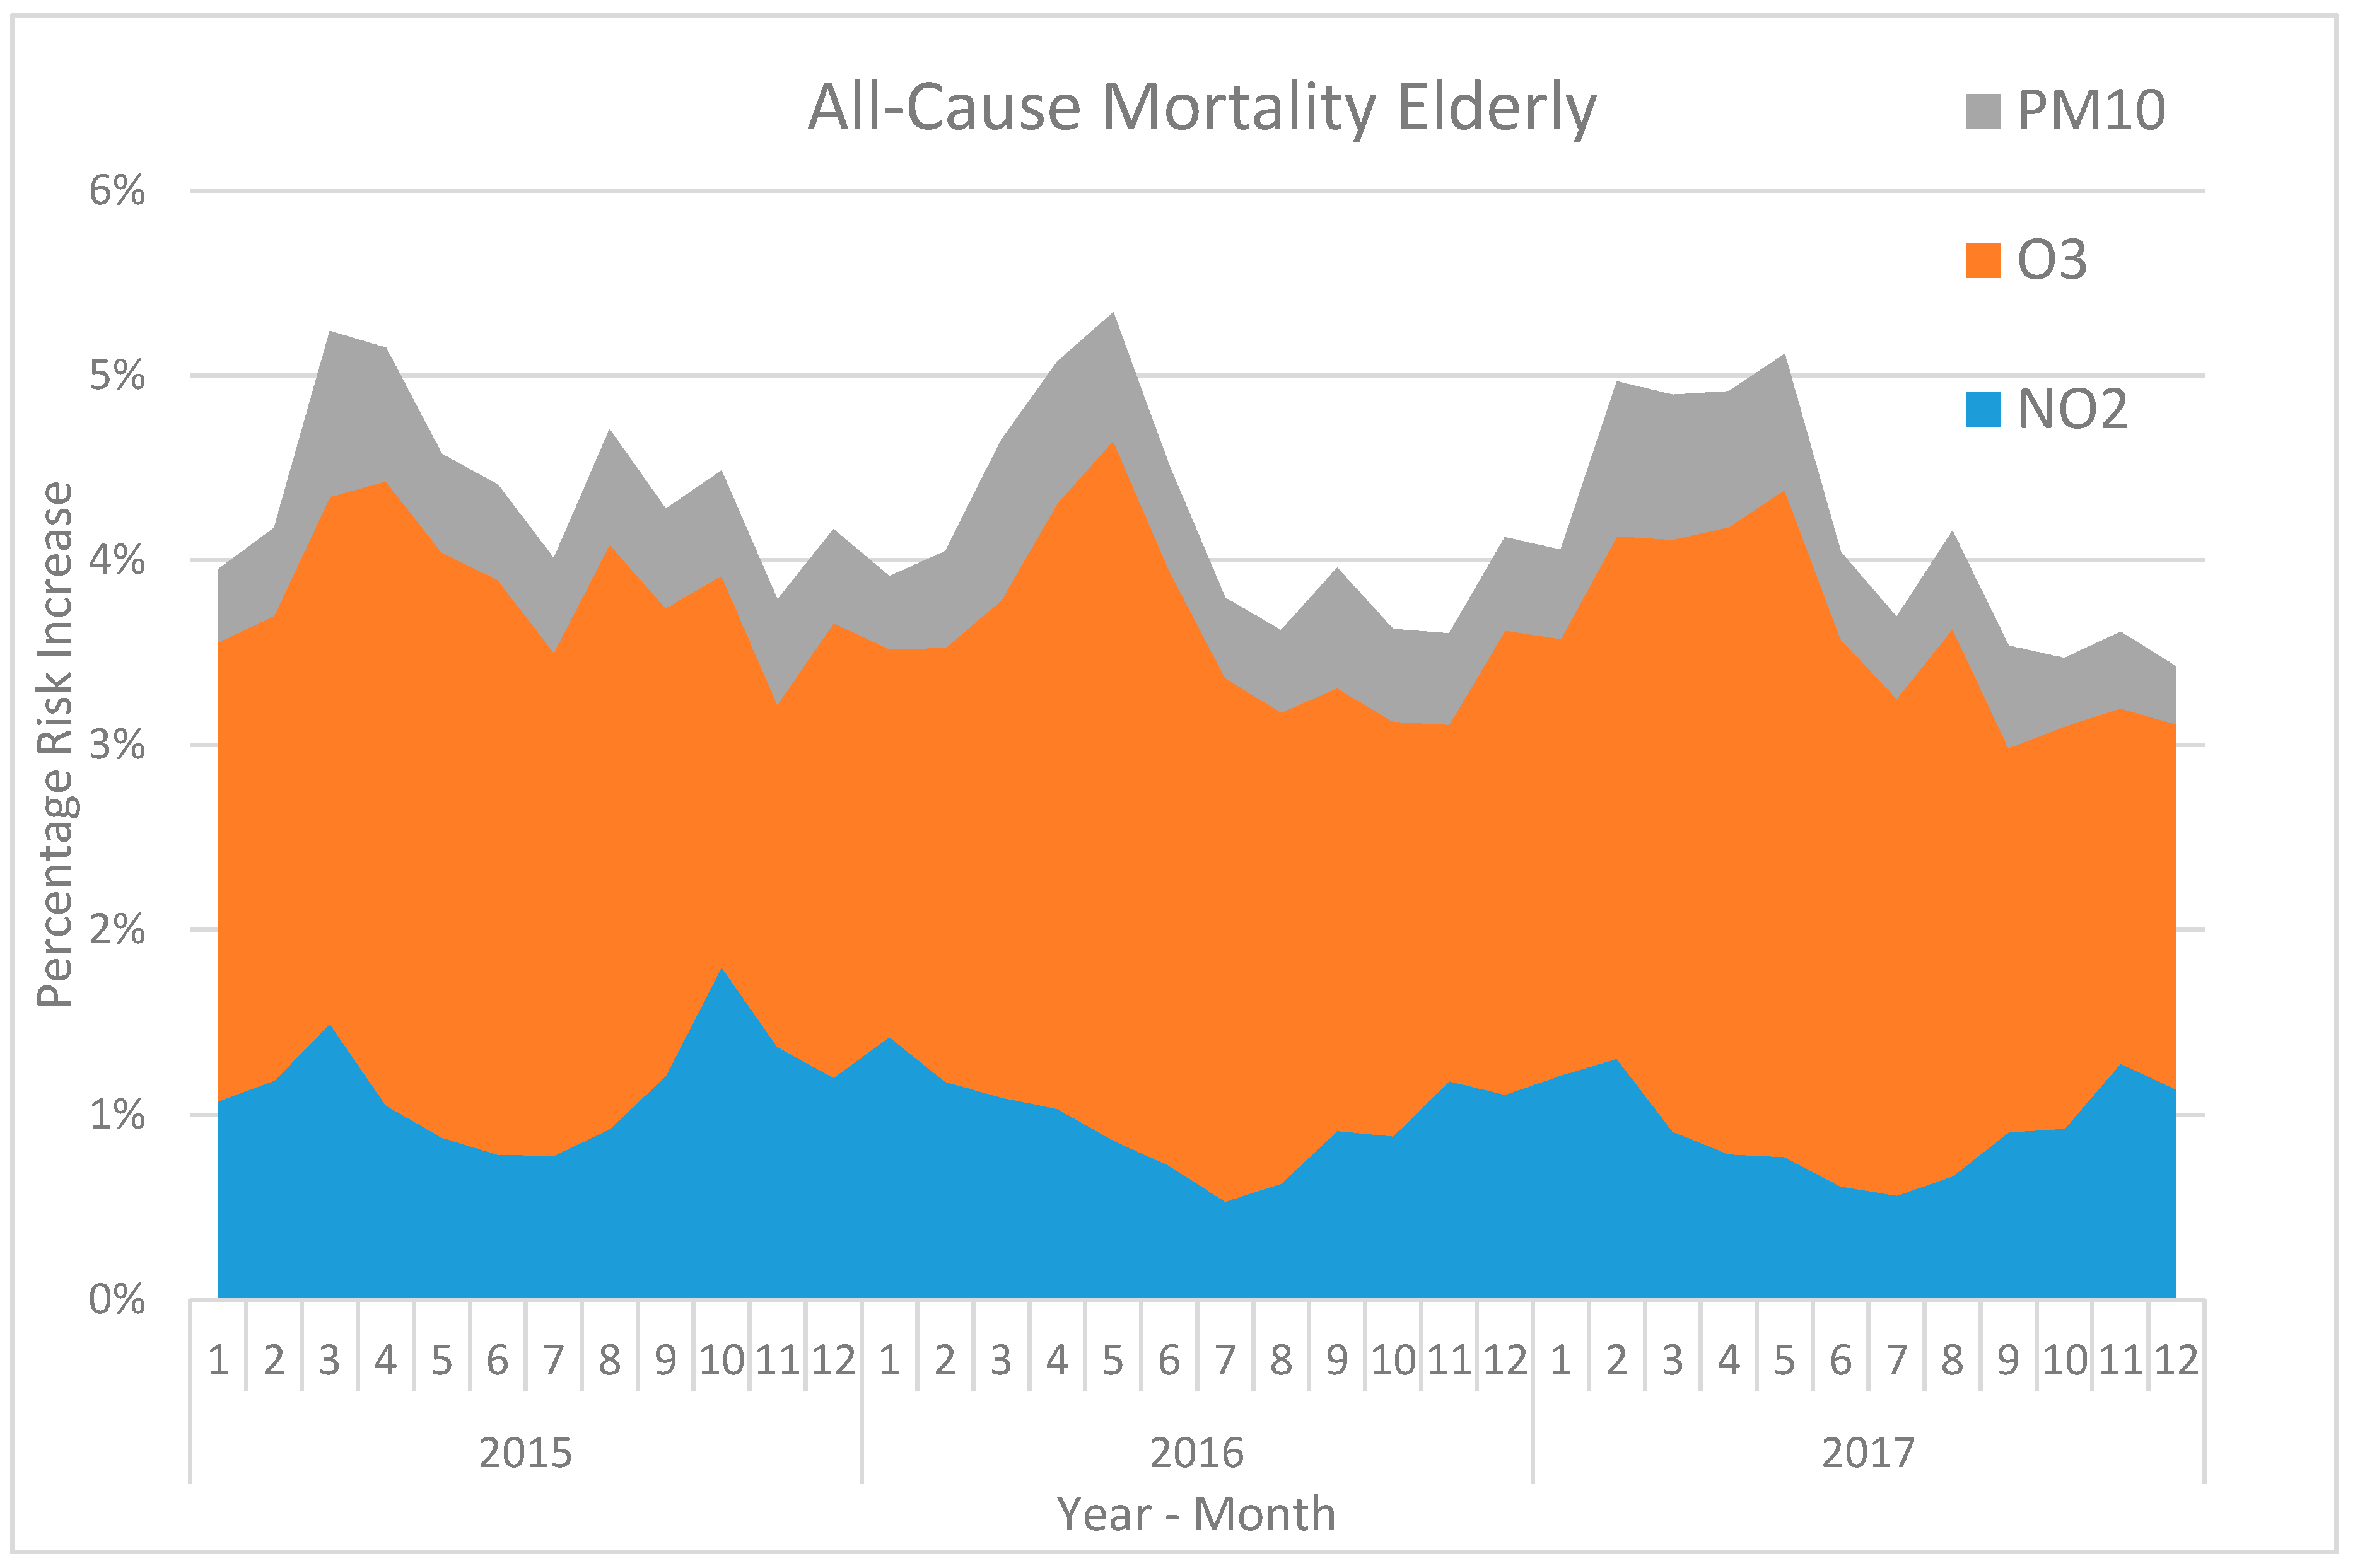
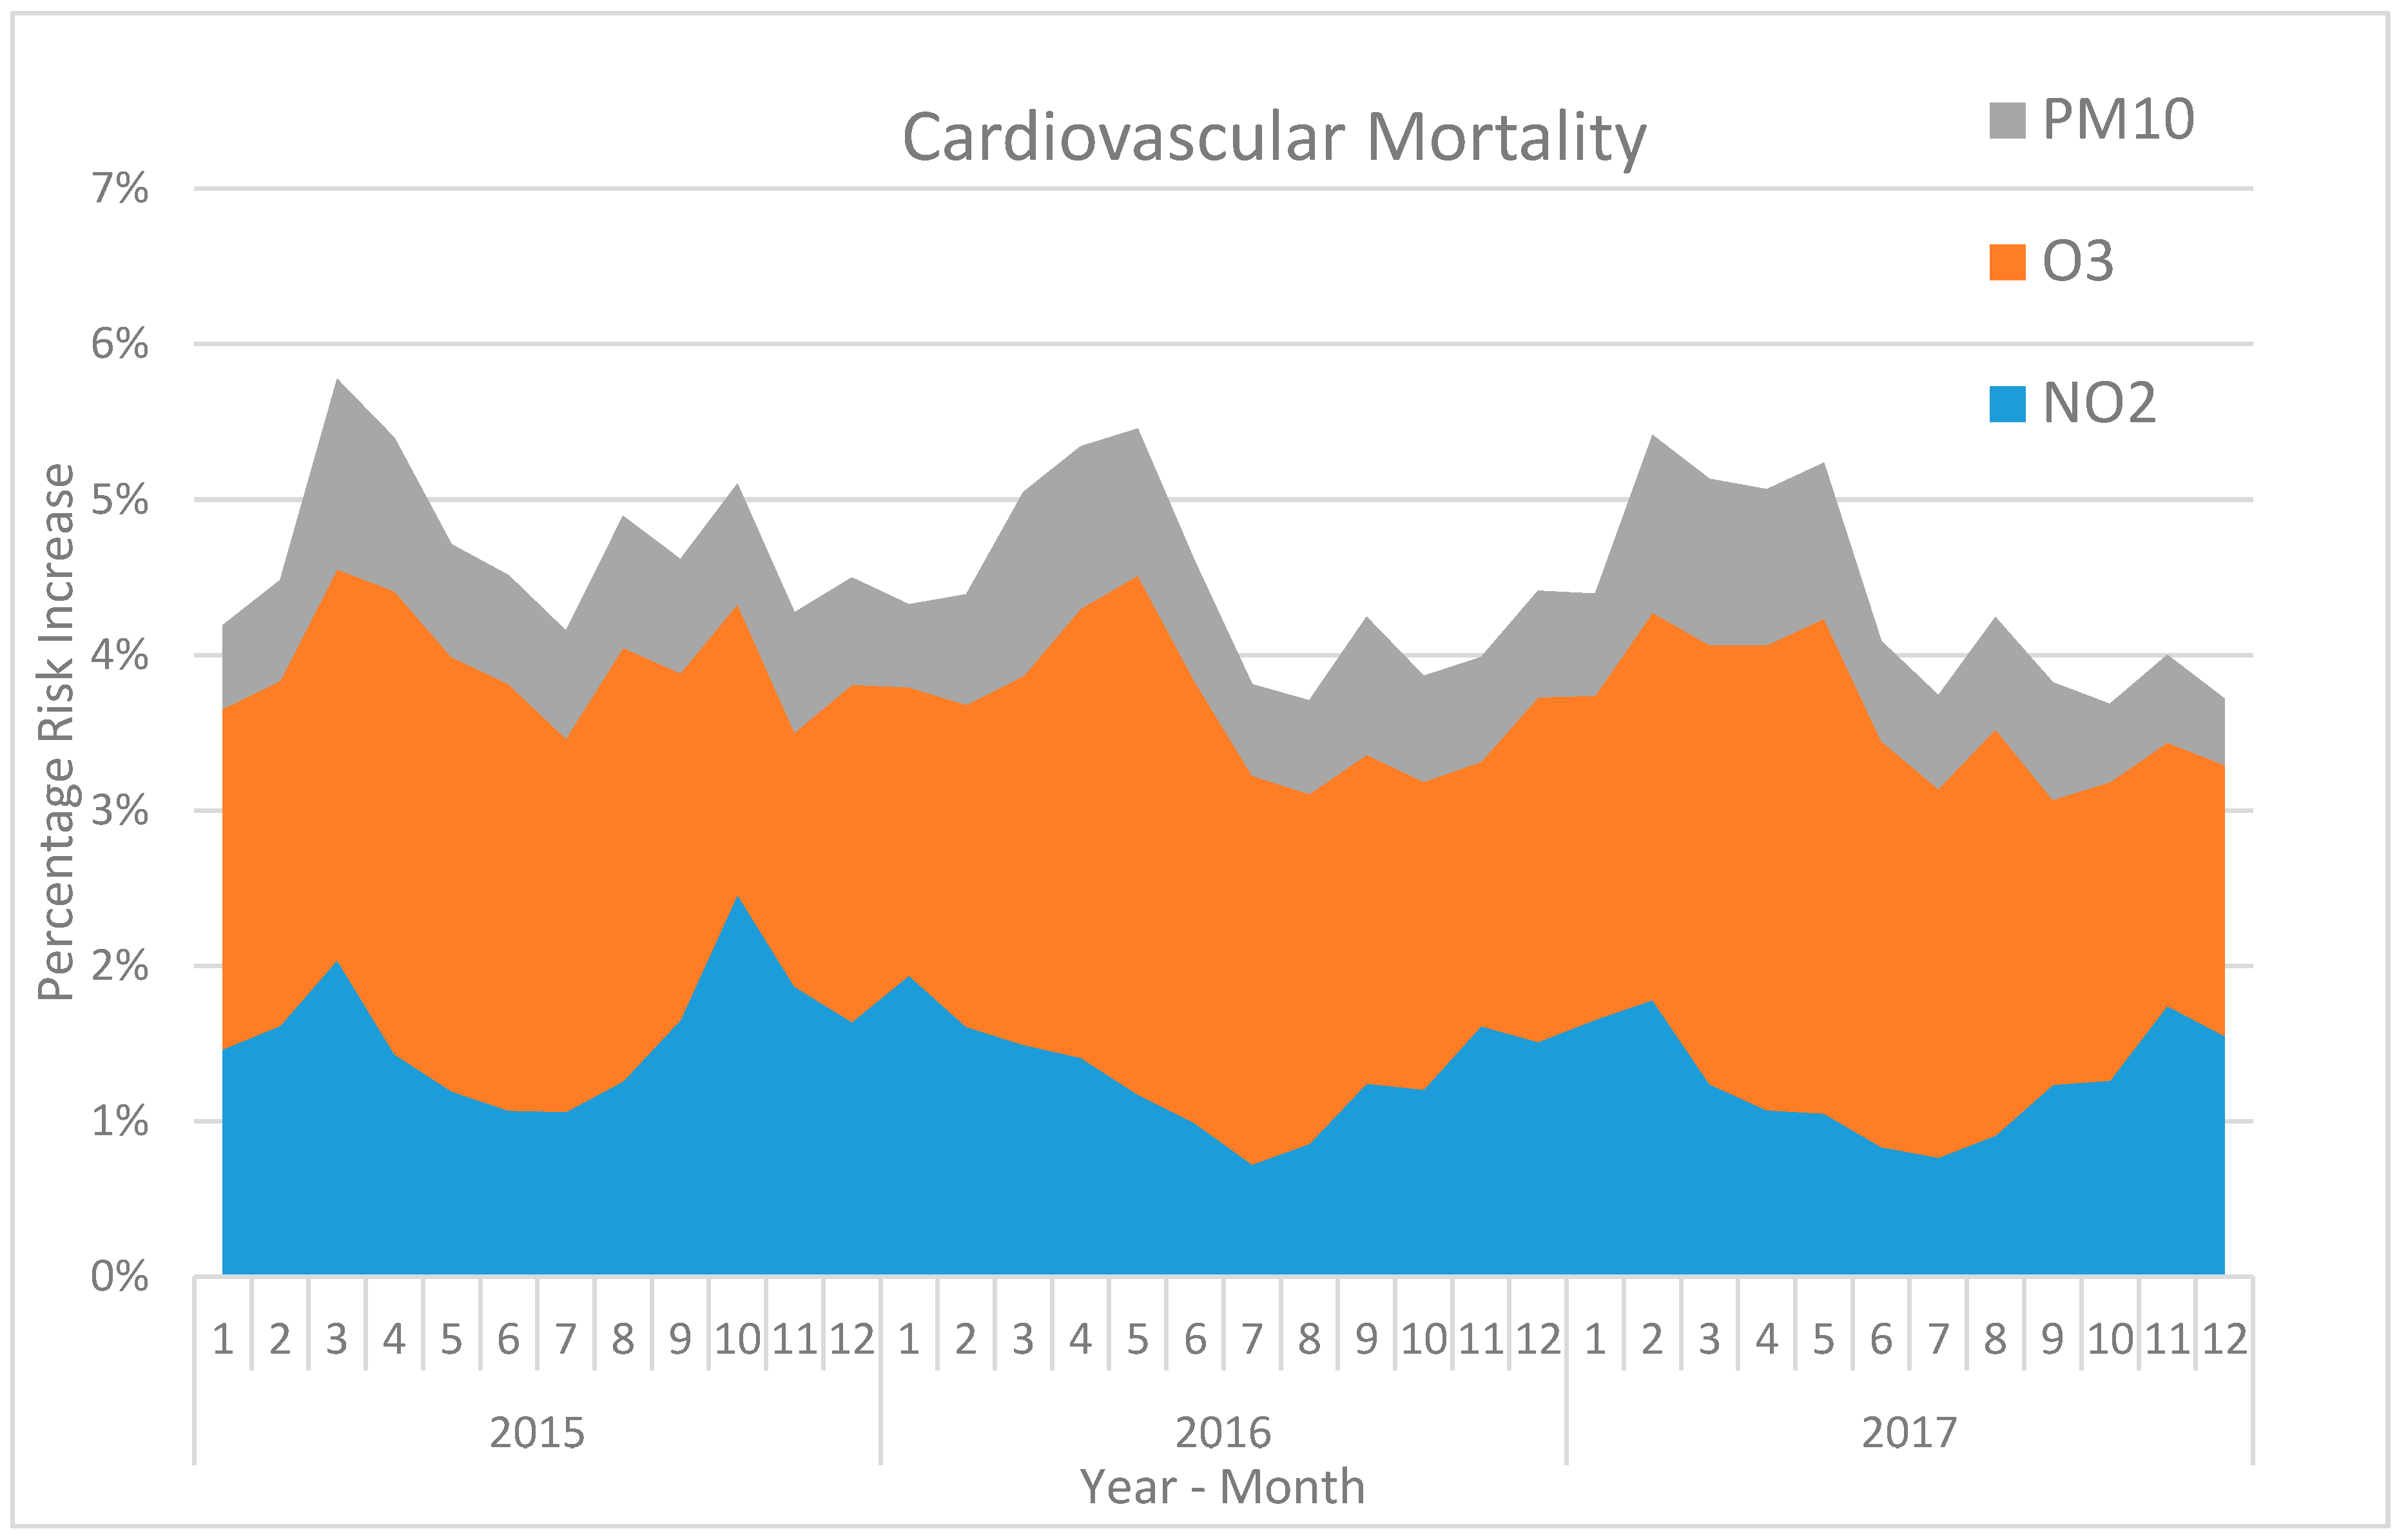
8], which is the most comprehensive and current study in this field, have been chosen. The excess risks associated with exposure to the measured air pollutants (NO2, O3, and PM
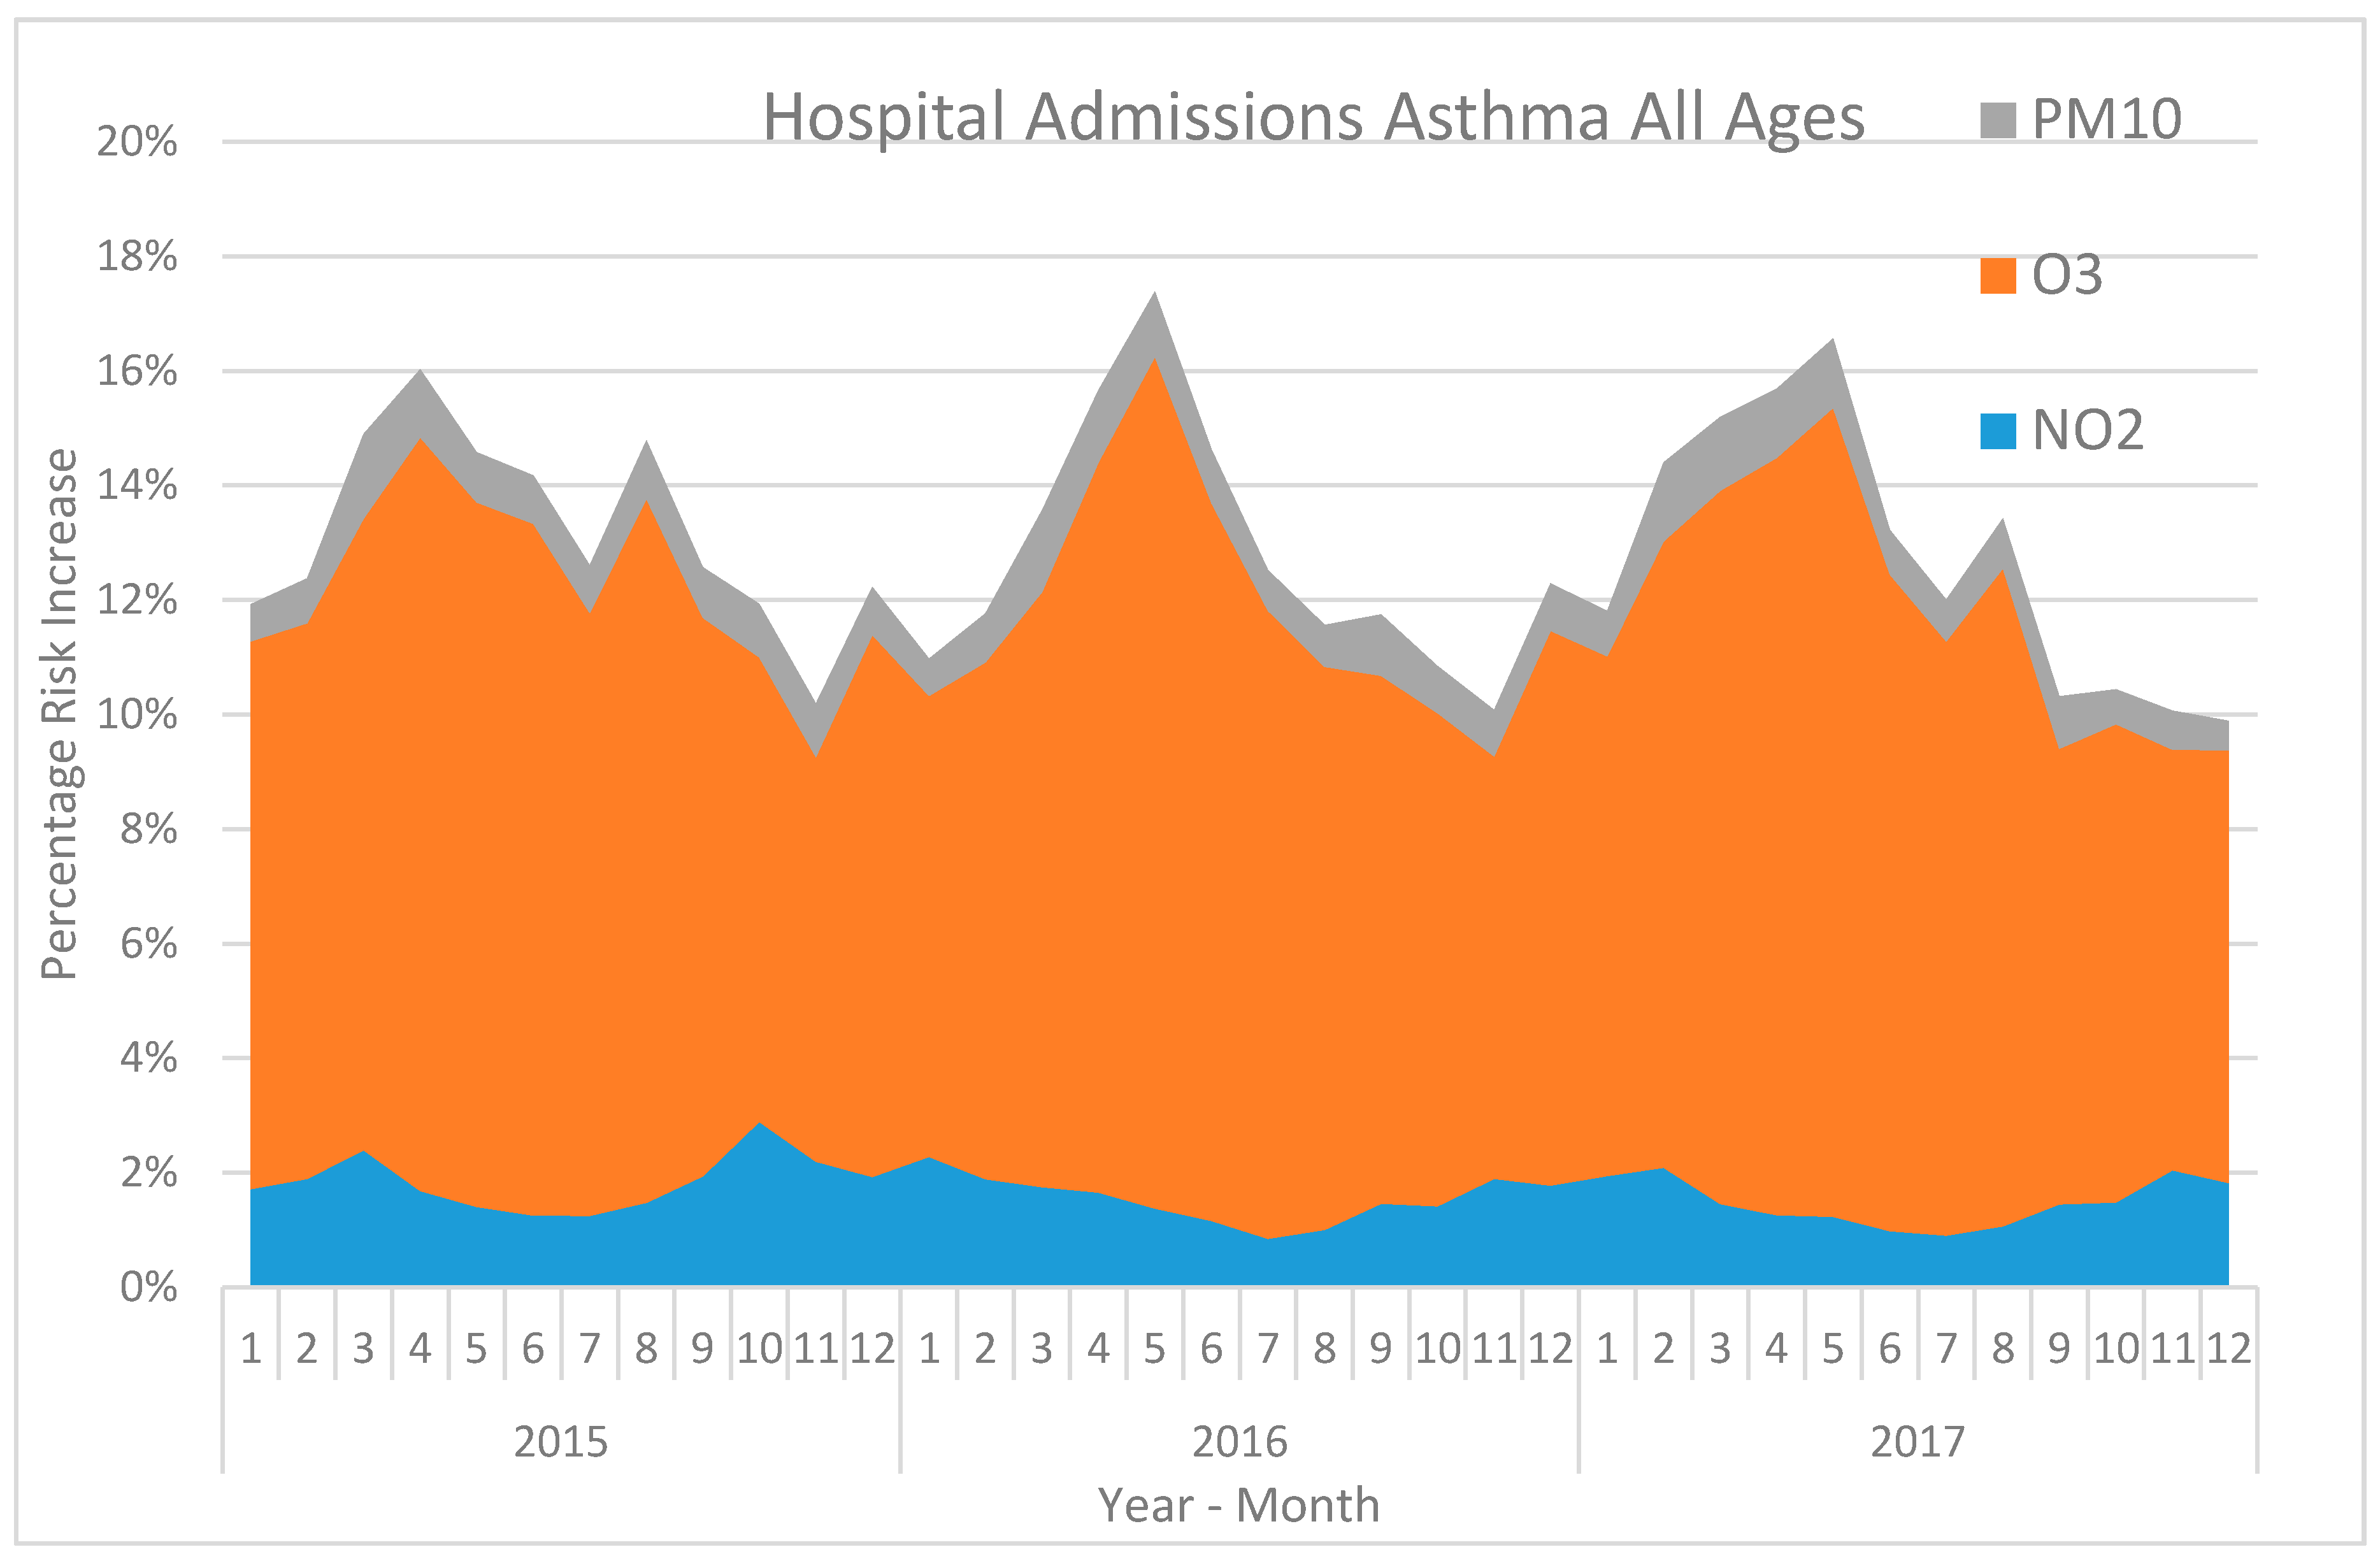
10) have been chosen for all-cause mortality in all ages, all-cause mortality in the elderly, cardiovascular mortality in all ages, hospital admissions for asthma in all ages, and hospital admissions for asthma in children (Table 2). The health outcomes in Table 2 have been chosen to represent both mortality and morbidity. Since the mortality rates are generally low for asthma, then the health outcomes associated with asthma should be clearly separated from the health outcomes associated with mortality. The health outcomes have also been selected due to the number of studies on which the risk-coefficients have been based on, where the greatest possible number of studies has been sought to provide the largest possible amount of data. This is also the reason for the choice of mortality as a metric for all health outcomes except for asthma, where the meta-coefficients using mortality as a health outcome are based on a relatively larger amount of data in comparison with the meta-coefficients using morbidity-related health outcomes.

3. Results

3.1. The Risk Increases for Different Health Outcomes during 2015–2017

The percentage risk increases for the different health outcomes on a monthly basis during 2015–2017 are presented in Figure 1, Figure 2, Figure 3, Figure 4 and Figure 5. All calculations are based on the point estimates of the risk-coefficients from a meta-analysis [8] (Table 2). This meta-analysis is based on a large number of studies that have been analyzed. The choice of lag is different for different studies. The choice of lag is commonly firstly based on the smallest p-value and secondly on the size of the risk estimate [8]. Since lag 01 is the most commonly used lag, the calculations in this study are consistently based on lag 01 (the average pollution concentration of the same day and the day before). The cumulative effects from three pollutants (NO2, O3, and PM10) are presented for Stockholm during the period of 2015–2017.
The annual variations in the concentrations of NO2, O3, and PM10 and the following risk increases are shown in Figure 1, Figure 2, Figure 3, Figure 4 and Figure 5. The concentrations of NO2 and the following risk increases are highest during wintertime. The reasons for this are a more intensive traffic during wintertime in combination with a more stable atmosphere with lower wind speeds. On the contrary, during summertime, the traffic intensity decreases, and the atmosphere becomes more unstable with greater dilution effects, contributing to lower concentrations and relatively lower risk increases. The O3 concentrations and the highest risk increases arise during April and May. The reasons for this phenomenon are not entirely clear. A peak in the photochemical production in combination with a stratospheric-tropospheric exchange might be the two main factors behind the peak levels in O3 during springtime [10]. The concentrations in PM10 and the risk increases associated with those exhibit a peak during late winter and early spring. The is mainly caused by road abrasion from the use of studded tires during wintertime [11]. These road dust particles are then suspended when the road surfaces become drier during early spring, contributing to the peak levels in PM10 [12].

3.2. Correlations and Comparisons between Different AQHIs Based on Different Health Outcomes

In Table 3, the Pearson correlation coefficients (R-values) between all pairs of the different AQHIs in Figure 1, Figure 2, Figure 3, Figure 4 and Figure 5 are presented.
In Table 3, 8 out of 10 correlations have R-values larger than 0.85. The corresponding R-values between the health outcomes in Table 3 and the AQHI during 2015–2017 in Stockholm (with birch pollen excluded) in Olstrup et al. (2019) [7] are presented in Table 4. In this study [7], daily local excess risks of asthma emergency department visits (AEDV) in all ages based on NOx, O3, PM10, and birch pollen have been used. The R2adjusted, when including this AQHI in a base model, and observed AEDV during 2005–2013 (after adjustments for calendar variables, meteorological data, and influenza admissions) is 0.765, which indicates that this AQHI is a valid indicator of AEDV related to air pollution exposure.
In Table 5, the average daily percentage risk increase associated with different AQHIs based on different health outcomes are presented. The result from the previous study in Stockholm [7], where AEDV in all ages (AA) is used, is presented together with the results based on the meta-coefficients used in his study.

4. Discussion

The results from the correlation analyzes clearly indicate that the R-values between the different AQHIs, based on different health outcomes, are relatively high. Moreover, the R-values between the AQHIs based on the meta-coefficients and the AQHI based on AEDV in Stockholm [7] are relatively high. The exception is hospital admissions for asthma in all ages, where the correlation between the AQHIs based on other health outcomes are lower in comparison with the others. What is most remarkable is that the coefficient for ozone is very much greater in comparison with the other health outcomes. The meta-coefficient for O3 in “HA asthma AA” is based on seven studies, where adjustment for the effect of pollen has only been performed in one of these seven studies. The levels of O3 tend to be high during the pollen season, and pollen exposure can thereby contribute to the risk increase associated with O3 and make the risk-coefficient for O3 greater than it would have been if pollen adjustments had been performed. Adjustment for pollen has been performed in the local AQHI in Stockholm [7] and except for the AQHI based on “HA asthma AA” this index correlates well with all the AQHIs based on meta-coefficients (R-values in the range of 0.87–0.95).
The main purpose of this study is to find out if there is a need to produce different indexes for different population groups. Based on the calculated R-values, the correlations are so evident that they do not give reason to construct different indexes for different population groups. An AQHI based on excess risks associated with mortality has also been proven to exhibit statistically significant associations with non-lethal health outcomes [4,5,6]. However, when considering the daily average percentage risk increases for the different AQHIs (Table 4), hospital admissions for asthma in both children and all ages stand out as significantly larger than the others. This can of course be regarded as highly reasonable, since mortality is by far the most serious health consequence, and asthma triggering can be expected to increase relatively more at a certain level of the AQHI. The average daily percentage risk increases of cardiovascular mortality and mortality in elderly are also larger than it is for all-cause mortality in all ages. Consequently, even if there is no need to construct different AQHIs for different population groups, there may be a reason to weight the index differently depending on the population group, where children and other individuals who are predisposed to asthma or cardiovascular diseases could have the index higher scaled in comparison with other less sensitive groups.
Although the different calculated AQHIs are highly correlated, the currently air quality index (AQI) that is used in large parts of the world has proven insufficient when it comes to estimating the cumulative effects of multi-pollutant exposure [1]. When comparing AQHI based on AEDV and AQI based on PM10 in Stockholm during 2015–2017, it turned out that the conformity was not great; the AQI (scaled from 1–4) exhibited the lowest value of 1 at many times while the AQHI exhibited a relatively large risk increase [7]. Previous studies in China have also shown that the AQHI is a better predictor of health outcomes in comparison with the AQI [2,13]. Assuming that the AQHI is a more reliable tool in order to estimate the expected health risks associated with current or forecasted air pollution concentrations, this study indicates that there is probably no need to create different indexes for different population groups.
The AQHIs used in the calculations in this study are based on the absolute concentrations assuming no threshold under which no effect occurs. For NO2, short-term exposure studies do not indicate any clear threshold values [14], making the calculations based on the absolute concentrations for NO2 valid. This also applies to PM10, where short-term exposure studies do not indicate any clear threshold values [15,16]. For O3, it is more unclear if there is a threshold value under which no effect occurs. When threshold values regarding daily mortality associated with O3 exposure in the Jiangsu Province in China were analyzed, no clear evidence of a specific threshold value was found. When the Akaike Information Criterion for quasi-Poisson (Q-AIC) values for models was used in order to compare a model with a threshold value of 90 µg m−3 with a model with no threshold (0 µg m−3), there was no clear indication of better model fit for the threshold-based model [17]. However, the same study indicates potential threshold values for O3 exposure at some places, where the concentration-response functions were almost horizontal at O3 concentrations below 80 µg m−3. In contrast to NO2 and PM10, there might be a problem to use non-threshold-based concentrations for O3 when the AQHI is calculated. However, since there is no clear evidence of a specific value that should be used, the absolute concentrations for O3 are used in this study, although it is important to be aware of the potential risk that the effects related to O3 exposure are overestimated.
Since there are not local risk-coefficients for Stockholm available for all the presented health outcomes, meta-coefficients have been used. Using meta-coefficients instead of local risk-coefficients has both its advantages and disadvantages. Local risk-coefficients can spontaneously be regarded as advantageous, since they are specific for the areas of interest. However, variations in city-specific estimates are stochastic and a meta-coefficient is therefore preferable in order to reduce these stochastic errors (Le Tertre et al., 2005) [18]. The meta-coefficients that are used in this study differ greatly regarding the number of studies included. The meta-coefficients for all-cause mortality in all ages are based on the largest amount of data; 147 studies are included in the coefficient for PM10, 137 studies are included in the coefficient for NO2, and 20 are included in the coefficient for O3. The largest possible amount of data is preferable in order to reduce the stochastic errors. However, Stockholm, like many other cities in the north, are a bit special when it comes to the composition of PM10, where as much as 90% of the mass of PM10 during springtime originates from road abrasion, largely caused by the studded tires that are used during wintertime [11]. Consequently, a meta-coefficient may be inappropriate if there are local circumstances that are not present in the studies included in the meta-coefficient, which must be considered when a local AQHI is constructed.
The large amount of data that underlies the meta-coefficients for all-cause mortality in all ages makes them particularly robust. Additionally, mortality as a health outcome is a more reliable indicator in comparison with morbidity-related health outcomes like asthma. This is caused by mainly two factors: (1) Different access to healthcare in different countries and cities creates uncertainties when it comes to comparing results that have been obtained at locations where the access to health care is significantly different; (2) different individuals are differently prone to seek health care for air pollution attributed morbidity, which means that unrecorded statistics may occur. On the other hand, mortality as an indicator does not give rise to these above-mentioned problems. This means that meta-coefficients based on mortality-related health outcomes are valid both in terms of the large amount of data and the lack of the above-mentioned problems. An increase in mortality can, however, be assumed to be an indicator also for morbidity, which occurs before mortality as a less serious consequence, where mortality is by far the most serious health consequence. The R-value of 0.95 between the AQHI based meta-coefficients for AC mort. AA and the locally constructed AQHI in Stockholm based on AEDV is moreover surprisingly large when considering the different health outcomes and the special composition of PM10 in Stockholm.

5. Conclusions

The AQHI has been proven to be a useful tool in order to capture the combined effects of simultaneous exposure to several different air pollutants. The main purpose of this study is to compare different AQHIs based on different health outcomes and answer the question if different indexes are needed for different population groups. The conclusions are that based on the conditions in Stockholm, different indexes are not needed, but the index may need to be weighted differently for different population groups when used as a warning system for the forecasted or the current air quality situation. Another conclusion is that meta-coefficients for all-cause mortality are valid when it comes to designing a local AQHI, even in the case of usually non-lethal outcomes like asthma.

Funding

This work has been financed by the Swedish Environmental Protection Agency.

Acknowledgments

Great thanks to Matthew Ross-Jones, Johan Genberg Safont, and Siiri Latvala at the Swedish Environmental Protection Agency for great ideas and good support during the development of this paper. Also great thanks to two anonymous reviewers and one anonymous editor for reviewing this paper with several improvement suggestions.

Conflicts of Interest

The author declares no conflict of interest.

Appendix A

Figure A1. Daily mean concentrations of NO2 at an urban background station in Stockholm during the period of 2015–2017.
Atmosphere 11 00192 g0a1
Figure A2. Daily maximum 8-h mean concentrations of O3 at an urban background station in Stockholm during the period of 2015–2017.
Atmosphere 11 00192 g0a2
Figure A3. Daily mean concentrations of PM10 at an urban background station in Stockholm during the period of 2015–2017.
Atmosphere 11 00192 g0a3

References

  1. Stieb, D.M.; Burnett, R.T.; Smith-Doiron, M.; Brion, O.; Shin, H.H.; Economou, V. A new multipollutant, no-threshold air quality health index based on short-term associations observed in daily time-series analyses. J. Air Waste Manag. Assoc. 2008, 58, 435–450. [Google Scholar] [CrossRef] [PubMed] [Green Version]
  2. Li, X.; Xiao, J.; Lin, H.; Liu, T.; Qian, Z.; Zeng, W.; Guo, L.; Ma, W. The construction and validity analysis of AQHI based on mortality risk: A case study in Guangzhou, China. Environ. Pollut. 2017, 220A, 487–494. [Google Scholar] [CrossRef] [PubMed]
  3. Cairncross, E.K.; John, J.; Zunckel, M. A novel air pollution index based on the relative risk of daily mortality associated with short-term exposure to common air pollutants. Atmos. Environ. 2007, 41, 8442–8454. [Google Scholar] [CrossRef]
  4. Chen, L.; Villeneuve, P.J.; Rowe, B.H.; Liu, L.; Stieb, D.M. The Air Quality Health Index as a predictor of emergency department visits for ischemic stroke in Edmonton, Canada. J. Expos. Sci. Environ. Epidemiol. 2014, 24, 358–364. [Google Scholar] [CrossRef] [PubMed]
  5. Szyszkowicz, M.A.; Kousha, T. Emergency department visits for asthma in relation to the Air Quality Health Index: A case-crossover study in Windsor, Canada. Can. J. Public Health 2014, 105, 336–341. [Google Scholar] [CrossRef] [PubMed] [Green Version]
  6. To, T.; Shen, S.; Atenafu, E.G.; Guan, J.; McLimont, S.; Stocks, B.; Licskai, C. The air quality health index and asthma morbidity: A population-based study. Environ. Health. Perspect. 2013, 121, 46–52. [Google Scholar] [CrossRef] [PubMed]
  7. Olstrup, H.; Johansson, C.; Forsberg, B.; Tornevi, A.; Ekebom, A.; Meister, K. A Multi-Pollutant Air Quality Health Index (AQHI) Based on Short-Term Respiratory Effects in Stockholm, Sweden. Int. J. Environ. Res. Public Health 2019, 16, 105. [Google Scholar] [CrossRef] [PubMed] [Green Version]
  8. Anderson, H.R.; Atkinson, R.W.; Bremner, S.A.; Carrinton, J.; Peacock, J. Quantitative Systematic Review of Short Term Associations between Ambient Air Pollution (Particulate Matter, Ozone, Nitrogen Dioxide, Sulphur Dioxide and Carbon Monoxide), and Mortality and Morbidity; Contract number: 0020017; Report to Department of Health revised following first review 2007; Division of Community Health Sciences St George’s, University of London: London, UK, 2007. [Google Scholar]
  9. Mauderly, J.L.; Samet, J.M. Is There Evidence for Synergy Among Air Pollutants in Causing Health Effects? Environ. Health Perspect. 2009, 117, 1–6. [Google Scholar] [CrossRef] [PubMed]
  10. Monks, P.S. A review of the observations and origins of the spring ozone maximum. Atmos. Environ. 2000, 34, 3545–3561. [Google Scholar] [CrossRef]
  11. Johansson, C.A.; Norman, M.; Gidhagen, L. Spatial & temporal variations of PM10 and particle number concentrations in urban air. Environ. Monit. Assess. 2007, 127, 477–487. [Google Scholar] [PubMed]
  12. Denby, B.R.; Sundvor, I.; Johansson, C.; Pirjola, L.; Ketzel, M.; Norman, M.; Kupiainen, K.; Gustafsson, M.; Blomqvist, G.; Omstedt, G. A coupled road dust surface moisture model to predict non-exhaust road traffic induced particle emissions (NORTRIP). Part 1: Road dust loading and suspension modelling. Atmos. Environ. 2013, 77, 283–300. [Google Scholar] [CrossRef]
  13. Chen, R.; Wang, X.; Meng, X.; Hua, J.; Zhou, Z.; Chen, B.; Kan, H. Communicating air pollution-related health risks to the public: An application of the Air Quality Health Index in Shanghai, China. Environ. Int. 2013, 51, 168–173. [Google Scholar] [CrossRef] [PubMed]
  14. Bino, M.; Lefebvre, W.; Walton, H.; Dajnak, D.; Janssen, S.; Williams, M.; Blyth, L.; Beevers, S. Improved Methodologies for NO2 Exposure Assessment in the EU; Contract 070201/2015/SER/717473/C.3; VITO (Belgium), in collaboration with King’s College London (UK); Report no.: 2017/RMA/R/1250; VITO, Belgium, October 2017; University of London: London, UK, 2017. [Google Scholar]
  15. Daniels, M.J.; Dominici, F.; Samet, J.M.; Zeger, S.L. Estimating particulate matter-mortality dose-response curves and threshold levels: An analysis of daily time-series for the 20 largest US cities. Am. J. Epidemiol. 2000, 152, 397–406. [Google Scholar] [CrossRef] [Green Version]
  16. Hong, Y.C.; Leem, J.H.; Ha, E.H.; Christiani, D.C. PM10 exposure, gaseous pollutants, and daily mortality in Inchon, South Korea. Environ. Health Perspect. 1999, 107, 873–878. [Google Scholar]
  17. Chen, K.; Zhou, L.; Chen, X.; Bi, J.; Kinney, P.L. Acute effect of ozone exposure on daily mortality in seven cities of Jiangsu Province, China: No clear evidence for threshold. Environ. Res. 2017, 155, 235–241. [Google Scholar] [CrossRef] [Green Version]
  18. Le Tertre, A.; Schwartz, J.; Touloumi, G. Empirical Bayes and Adjusted Estimates Approach to Estimating the Relation of Mortality to Exposure of PM10. Risk Anal. 2005, 25, 711–718. [Google Scholar] [CrossRef] [PubMed]
Figure 1. The calculated average monthly percentage risk increase associated with NO2, O3, and PM10 for all-cause mortality in all ages in Stockholm during 2015–2017 based on meta-coefficients [8].
Atmosphere 11 00192 g001
Figure 2. The calculated average monthly percentage risk increase associated with NO2, O3, and PM10 for all-cause mortality in elderly in Stockholm during 2015–2017 based on meta-coefficients [8].
Atmosphere 11 00192 g002
Figure 3. The calculated average monthly percentage risk increase associated with NO2, O3, and PM10 for cardiovascular mortality in all ages in Stockholm during 2015–2017 based on meta-coefficients [8].
Atmosphere 11 00192 g003
Figure 4. The calculated average monthly percentage risk increase associated with NO2, O3, and PM10 for hospital admissions for asthma in all ages in Stockholm during 2015–2017 based on meta-coefficients [8].
Atmosphere 11 00192 g004
Figure 5. The calculated average monthly percentage risk increase associated with NO2, O3, and PM10 for hospital admissions for asthma in children in Stockholm during 2015–2017 based on meta-coefficients [8].
Atmosphere 11 00192 g005
Table 1. Description of the measurement methods and the instruments that have been used to measure the pollutants included in the Air Quality Health Index (AQHI).
PollutantMethodInstrument
NO2ChemiluminescenceAC32M, Environment S.A.
O3UV absorptionO342M, Environment S.A.
PM10GravimetricTEOM 1400A, Thermo Fisher Scientific
Table 2. The percentage risk increases with 95% confidence intervals (CI) associated with a 10 µg m−3 increase in exposure to NO2, O3, and PM10 obtained from a meta-analysis [8]. All-cause mortality and hospital admissions for asthma are divided into all ages and elderly, and all ages and children, respectively. Cardiovascular mortality is presented for all ages only.
Health OutcomeNO2O3PM10
All-cause mortality, all ages0.49 (95% CI: 0.38–0.60)0.22 (95% CI: 0.09–0.35)0.51 (95% CI: 0.40–0.62)
All-cause mortality, elderly0.86 (95% CI: 0.50–1.22)0.43 (95% CI: 0.18–0.69)0.47 (95% CI: 0.35–0.58)
Cardiovascular mortality, all ages1.17 (95% CI: 0.82–1.53)0.38 (95% CI: 0.27–0.49)0.64 (95% CI: 0.46–0.81)
Hospital admissions (asthma) all ages1.37 (95% CI: 0.59–2.15)1.60 (95% CI: −0.08–3.30)0.77 (95% CI: 0.06–1.48)
Hospital admissions (asthma), children2.92 (95% CI: 1.15–4.72)0.75 (95% CI: −1.72–3.28)1.78 (95% CI: 1.01–2.55)
Table 3. Correlation matrix with R-values for different pairs of AQHI-indexes, calculated in Stockholm for NO2, O3, and PM10 based on the daily risk increases during the period of 2015–2017. The abbreviations mean the following: AA = all ages, AC = all cause, C = children, CV = cardiovascular, E = elderly, HA = hospital admissions.
Health OutcomeAC mort. AAAC mort. ECV mort. AAHA Asthma AAHA Asthma C
AC mort. AA10.980.980.850.96
AC mort. E0.9810.970.900.93
CV mort. AA0.980.9710.770.99
HA asthma AA0.850.900.7710.69
HA asthma C0.960.930.990.691
Table 4. Correlations (R-values) between AQHIs based on meta-coefficients and an AQHI based on local risk-coefficients for asthma emergency department visits (AEDV) in Stockholm. The calculations are based on the daily risk increases during the period of 2015–2017.
AQHI Based on Different Health Outcomes from a Meta-Analysis [8]AQHI Based on Local Risk-Coefficients for AEDV in Stockholm [7]
AC mort. AA0.95
AC mort. E0.87
CV mort. AA0.88
HA asthma AA0.72
HA asthma C0.88
Table 5. The average daily percentage risk increases for different AQHIs based on different health outcomes during the period of 2015–2017.
AQHI Based on Different Health OutcomesAverage Daily Percentage Risk Increases During 2015–2017.
AC mort. AA2.6
AC mort. E4.3
CV mort. AA4.5
HA asthma AA12.9
HA asthma C10.4
AEDV AA [7]5.8

