Article

Cordon Pricing, Daily Activity Pattern, and Exposure to Traffic-Related Air Pollution: A Case Study of New York City

by
Amirhossein Baghestani
1,*,
Mohammad Tayarani
2,
Mahdieh Allahviranloo
1 and
H. Oliver Gao
2
1
Department of Civil Engineering, The City College of New York—CUNY, New York, NY 10031, USA
2
School of Civil & Environmental Engineering, Cornell University, Ithaca, NY 14853, USA
*
Author to whom correspondence should be addressed.
Submission received: 27 September 2021 / Revised: 29 October 2021 / Accepted: 2 November 2021 / Published: 4 November 2021
(This article belongs to the Collection Measurement of Exposure to Air Pollution)

Abstract

:
Road pricing is advocated as an effective travel demand management strategy to alleviate traffic congestion and improve environmental conditions. This paper analyzes the impacts of cordon pricing on the population’s daily activity pattern and their exposure to particulate matter by integrating activity-based models with air quality and exposure models in the case of New York City. To estimate changes in public exposure under cordon pricing scenarios, we take a sample of employees and study their mobility behavior during the day, which is mainly attributed to the location of the work and the time spent at work. The selection of employees and their exposure during the duration of their work is due to the unavailability of exact activity patterns for each individual. We show that the Central Business District (CBD) experiences a high concentration of PM2.5 emissions. Results indicate that implementing cordon pricing scenarios can reduce the population-weighted mean of exposure to PM2.5 emissions by 7% to 13% for our sample and, in particular, by 22% to 28% for those who work in the CBD. Furthermore, using an experimental model and assuming constant conditions, we point out the positive influence on indoor exposure for two locations inside and outside the CBD in response to cordon pricing. Considering the correlation between long-term exposure to fine particulate matter and the risks of developing cardiovascular disease and lung cancer, our findings suggest that improved public health conditions could be provided by implementing cordon pricing in the New York City CBD.

1. Introduction

Air pollution is considered the greatest risk to human health, causing 4.2 million premature deaths worldwide in 2016 [1]. Emissions from road transportation are known as one of the major sources of ambient air pollution; it is responsible for over 55% of the total NOx emissions inventory and approximately 10% of particulate matter in the US [2]. Spending a substantial amount of time in proximity to highways can significantly increase the health hazards. Notable studies have indicated that long-term exposure to fine particulate matter (PM2.5 and PM10) increases the risks of developing cardiovascular diseases and respiratory cancer [3,4,5,6,7,8]. Increasing concern over public health risks has led to a variety of policies aimed at reducing vehicle emissions, including different strategies of advancements in the design of electric vehicles [9], promoting non-motorized transport systems, and managing and changing travel patterns, known as travel demand management (TDM). Congestion pricing is one of the most widely adopted TDM strategies to relieve traffic congestion and improve transportation system performance.
Congestion pricing refers to imposing additional fees on some users of transportation systems, mostly trips made by personal vehicles. It is expected to regulate traffic, improve safety, reduce delays, enhance system reliability, improve environmental conditions, and, at the same time, become a source of funding for transportation investment projects. It may also result in various behavioral reactions, such as modal shifts, rerouting, rescheduling, changing destinations, and canceling some trips. The strategy is being implemented in different cities around the world, such as London (UK), Singapore (SG), and Stockholm (SE).
London’s Congestion Charging Scheme resulted in a 25% reduction in congestion, a 30% improvement in the average speed, and a 20% drop in carbon dioxide emissions [10]. Singapore’s Electronic Road Pricing (ERP) system induced a 24% reduction in the number of vehicles entering the Central Business District (CBD) and also a 10–15% reduction in the level of greenhouse gas emissions within the inner city [10,11,12]. Congestion charging in Stockholm and Gothenburg reduced traffic in their CBDs by approximately 20% and 12%, respectively. However, the reduction in the total emissions in response to congestion charges was very small, approximately 2–3% of carbon emissions [13]. According to [14], road pricing policies in Milan (2004–2012) had a short-term effect on air quality, especially the reduction in carbon monoxide and particulates. A variety of methods and algorithms can be found in the literature that is devoted to designing an optimal charging area by considering different network equilibrium models [15,16,17,18,19,20] and environmental objectives [21]. Due to the importance of public acceptance of pricing policies, in recent years, subjects relevant to equity and environmental justice have also been studied and addressed in the literature [22,23,24,25,26]. Despite successful applications, congestion pricing plans have been pushed back by the public or politicians in some cities, such as Edinburgh, Manchester, and New York.
New York City was the first US city to propose a congestion pricing plan for its CBD [27], aiming to relieve the city’s worsening congestion problem. NYC is the most congested city in the US, mostly because of its population of eight million. High population density, economic activity, the job–housing balance of people in the city, along with the population of tourists visiting the city and goods movement demand are all contributing to the city’s traffic congestion [10]. Despite having a very high non-driving mode share, NYC’s congestion is still ongoing and results in poor air quality and public health problems. Every year, exposure to PM2.5 causes approximately 320 deaths and 870 hospitalizations/emergency department visits [28].
A variety of methods are used to evaluate the potential environmental impacts of regional transportation planning and policies. Some studies analyze the impacts of transportation policies on vehicle emissions by integrating travel demand forecasting models, land use, and emission models [29,30,31,32,33,34,35], while others model vehicle emissions using real-time traveler activity information provided by new technologies such as navigation apps [34,36,37].
A large portion of air quality studies are related to exposure analysis and health outcomes. By integrating dispersion models with the travel demand and emission models, the impacts of transportation plans and policies on the concentration of vehicle emissions are assessed [38,39,40,41,42,43,44]. To better understand the health effects of air pollution, it is also important to investigate the relationship between indoor and outdoor air pollution levels, since people spend most of their time indoors [45]. The indoor/outdoor (I/O) emission ratio, and other variables such as building characteristics, ventilation systems, and individual activities, which may impact this ratio, have been looked into [46,47].
Despite the prior literature, there is still a relatively limited discussion on studying the activity patterns and spatiotemporal characteristics of individuals under the pricing strategies. The existing works mostly employ classical travel demand models that rely on the aggregated information of users. However, activity-based models, as disaggregate-level tour-based travel demand models, can be used to assess the influence of policies on activities and travel preferences, which can provide better insights for taking appropriate actions [48]. The use of activity-based demand models would enable the capturing of the dynamics of population activity while computing the total exposure during the day. While previous environmental impact analyses evaluated the emission exposure mostly based on the residential locations of individuals, employees spend a significant amount of time in the area surrounding their workplaces, which might be different from their residential neighborhood. Existing studies also do not differentiate between outdoor and indoor air pollution concentration levels. Considering the significant difference [4], it is important to include air quality in both indoor and outdoor environments in assessing the effects of congestion pricing policies.
This paper aims to contribute to this line of research by considering congestion pricing, vehicle emissions, and air quality on a disaggregated level for New York City. As in many other metropolitans, New York has a diverse population with different socioeconomic characteristics. Residents of New York often do not have the luxury of living close to their workplaces (a case that might be true for less populated regions). From the perspective of the city architect, you may find a golden brick building next to a Victorian building, which might be next to a newly constructed, full-amenity, luxury building. It is clear that the ratio of indoor/outdoor air quality will not be the same for the residents of these buildings located in the same neighborhood. Having these arguments in mind, a cordon pricing study for New York demands the inclusion of an activity-based travel demand model at its core, where the mobility behavior of travelers can be captured with higher resolutions. The unique features of this paper that make it different from other existing studies are:
(a) Applying the activity-based model to address the growing complexity in travel patterns and to allow for the inclusion of more dimensions of activity patterns such as mode and destination choice simultaneously [33,49]. Reviewing the literature indicates that activity-based approaches for evaluating policies have mostly been applied for sparsely populated cities in Europe, while, employing such models for analyzing cordon pricing in a case such as New York City, where the number of daily trips and commutes is not comparable with previous cases, is considered in this research.
(b) Estimating the dynamic emission exposure of employees by conducting a high-resolution study with hourly precision. Despite previous research that evaluated emission exposure mostly based on the residential location of individuals, we utilize the spatiotemporal distribution of employees to estimate environmental effects at workplaces. Additionally, instead of daily emission exposure, we focus on the hourly distribution of PM2.5 concentrations to evaluate the dynamic emission exposure for employees throughout the duration of their work.
(c) Analyzing the environmental impacts of cordon pricing schemes in indoor areas for a specific sample of the population. Notably, the indoor air quality analysis presented here is a preliminary analysis tailored to the objective of this study to illustrate how it can be tied to city-level planning decisions.
The rest of this paper is organized as follows. Section 2 presents a summary of the literature review for congestion pricing and health impact analysis. Next, in Section 3, the methodology is described by explaining the proposed framework and different applied models. Section 4 indicates the details of the proposed pricing scenarios. The results of the scenarios are shown in Section 5 to compare the emission rates and exposures followed by the discussion in Section 6. The paper concludes with a summary of the findings and outlines future research directions in Section 7.

2. Literature Review

2.1. Congestion Pricing Studies

Congestion pricing has been studied extensively over the past few decades. Some of the previous studies are based on before–after analysis to demonstrate traffic and economic effects by using observed data [13,50,51,52,53]. Tvinnereim et al. [54] conducted a before–after study for the case of Bergen, Norway. Although congestion pricing improves traffic conditions, it was not supported by the public, except for boroughs with more significant traffic improvements. Similarly, Gibson and Carnovale [55] studied travel behavior changes in response to Milan’s road pricing policy using observed traffic data. Considering the possible responses, including departure time and route change, analyses showed a 14.5% reduction in the number of vehicles entering the target area and also a 6–17% drop in air pollution, resulting in significant welfare gains. Based on their analyses, pricing has a greater impact on routes without public transportation.
Isaksen and Johansen [56] investigated the impact of congestion pricing based on vehicle type and charging time in Norway. They found significant changes in peak hour traffic volume (14.5%) and an improvement in ambient levels of NO2 (11%). Results also indicated that commuters subjected to congestion charging on their work trip were more likely to shift their mode to electric vehicles. Additionally, He et al. [57] used a multi-agent simulation model for New York City to evaluate the congestion pricing plan. Their findings indicated that the pricing plan caused reduction of around 127,000 of daily trips, which resulted in greater travel time savings for trips made within the charging area compared to travelers in non-charging segments.
Li and Sun [58] developed an integrated choice and latent variable (ICLV) model to study mode choice behavior under the congestion pricing scenario. The data were collected through a stated preference survey, including more than 1000 automobile travelers in Beijing. Compared to multinomial logit models, their findings suggested that the ICLV model provides a better fit to the data, where the latent variables positively affect subway and bike choice. A more comprehensive analysis of attitudes towards congestion pricing has been conducted by Hess and Borjesson [25] by employing survey data in four European cities. Based on their results, the willingness to pay is impacted by attitudes, where users with a positive attitude towards pricing will pay more to reduce their travel time.
A different approach to congestion pricing has also been studied by Tang [59], who analyzed the willingness to pay by using the housing market model. His results suggested that congestion pricing increases home prices in the Charge Zone by 2.84% because of improved traffic conditions. Moreover, Takayama [60] developed a model to study the reaction of heterogeneous users in a closed monocentric city under congestion pricing. The findings showed that congestion pricing would be beneficial for high-income commuters but not for low-income users. He also concluded that congestion pricing makes cities more compact when rich commuters are more flexible.
In addition to short-term impacts on travel behavior and traffic conditions, congestion pricing would cause long-term effects such as household relocation decisions since travel cost is one the major factors affecting residential location choice [61]. According to the literature, any change in the cost of travel, directly and indirectly, affects both short- and long-term choices with regard to location choices [62]. In particular, congestion pricing that directly increases the cost of travel affects travel behavior in the short term and affects land use patterns in the long term [63]. Long-term responses to congestion pricing can also be used to estimate the elasticity of traffic with respect to pricing, as Gibson and Carnovale [55] indicated that a one percent increase in charging price would result in a 0.3 percent reduction in the number of charged vehicles.
Modeling of changes in air quality could be also used to evaluate the environmental effects of pricing [21,64,65,66,67]. Cavallaro et al. [68] studied carbon reduction under different pricing methods such as distance-based, congestion-based, and pay-as-you-drive. For the case of Milan, PM10, NOx, and CO2 concentrations were reduced by 23%, 18%, and 14% inside the charged area, respectively [69]. Moreover, Beckx et al. [33] estimated temporarily and geographically distributed traffic emissions by combining an activity-based model (ALBATROSS) and an emission model (MIMOSA). They found that the activity-based approach would provide a more accurate estimation of the evaluation of different policy measures. Unlike the significant reduction across a range of pollutants that occurred due to the London Congestion Charge, Green et al. [70] found an increase in the concentration of NO2. Congestion pricing caused a modal shift from private cars to diesel buses, which are exempt from charging. To service more commuters, diesel buses should travel more, which results in increased miles traveled followed by a higher concentration of NO2.

2.2. Exposure Assessment Studies

Besides emission inventory and air quality studies, exposure to traffic-related air pollution can be used as a tool to evaluate the policies’ environmental impacts [71]. While some studies employed personal exposure monitoring to quantify the concentration [4,72], others conducted their analyses based on the estimations provided by dispersion models. For instance, using AERMOD, Qian and Wu [73] focused on the environmental injustice aspects as a consequence of the bike-share system in Chicago, since users from disadvantaged areas are more likely to experience higher PM2.5 exposure. Besides human exposure assessment related to traffic-related air pollution, the concentration of indoor air pollutants is important from a health perspective. By measuring indoor and outdoor exposure, Wichmann et al. [45] estimated the indoor/outdoor (I/O) ratios of air pollution levels at homes and schools. Their results indicated a median (I/O) ratio of 0.93 for PM2.5, meaning that the outdoor pollution concentration was reduced by 7% in indoor areas.

3. Method

Our modeling framework is the integration of travel demand (NYBPM) [74], an emission model (PPS-AQ) [75], and a dispersion model (US EPA AERMOD). The study is focused on estimating exposure to fine particulate matter for a sample of people who work in Manhattan.

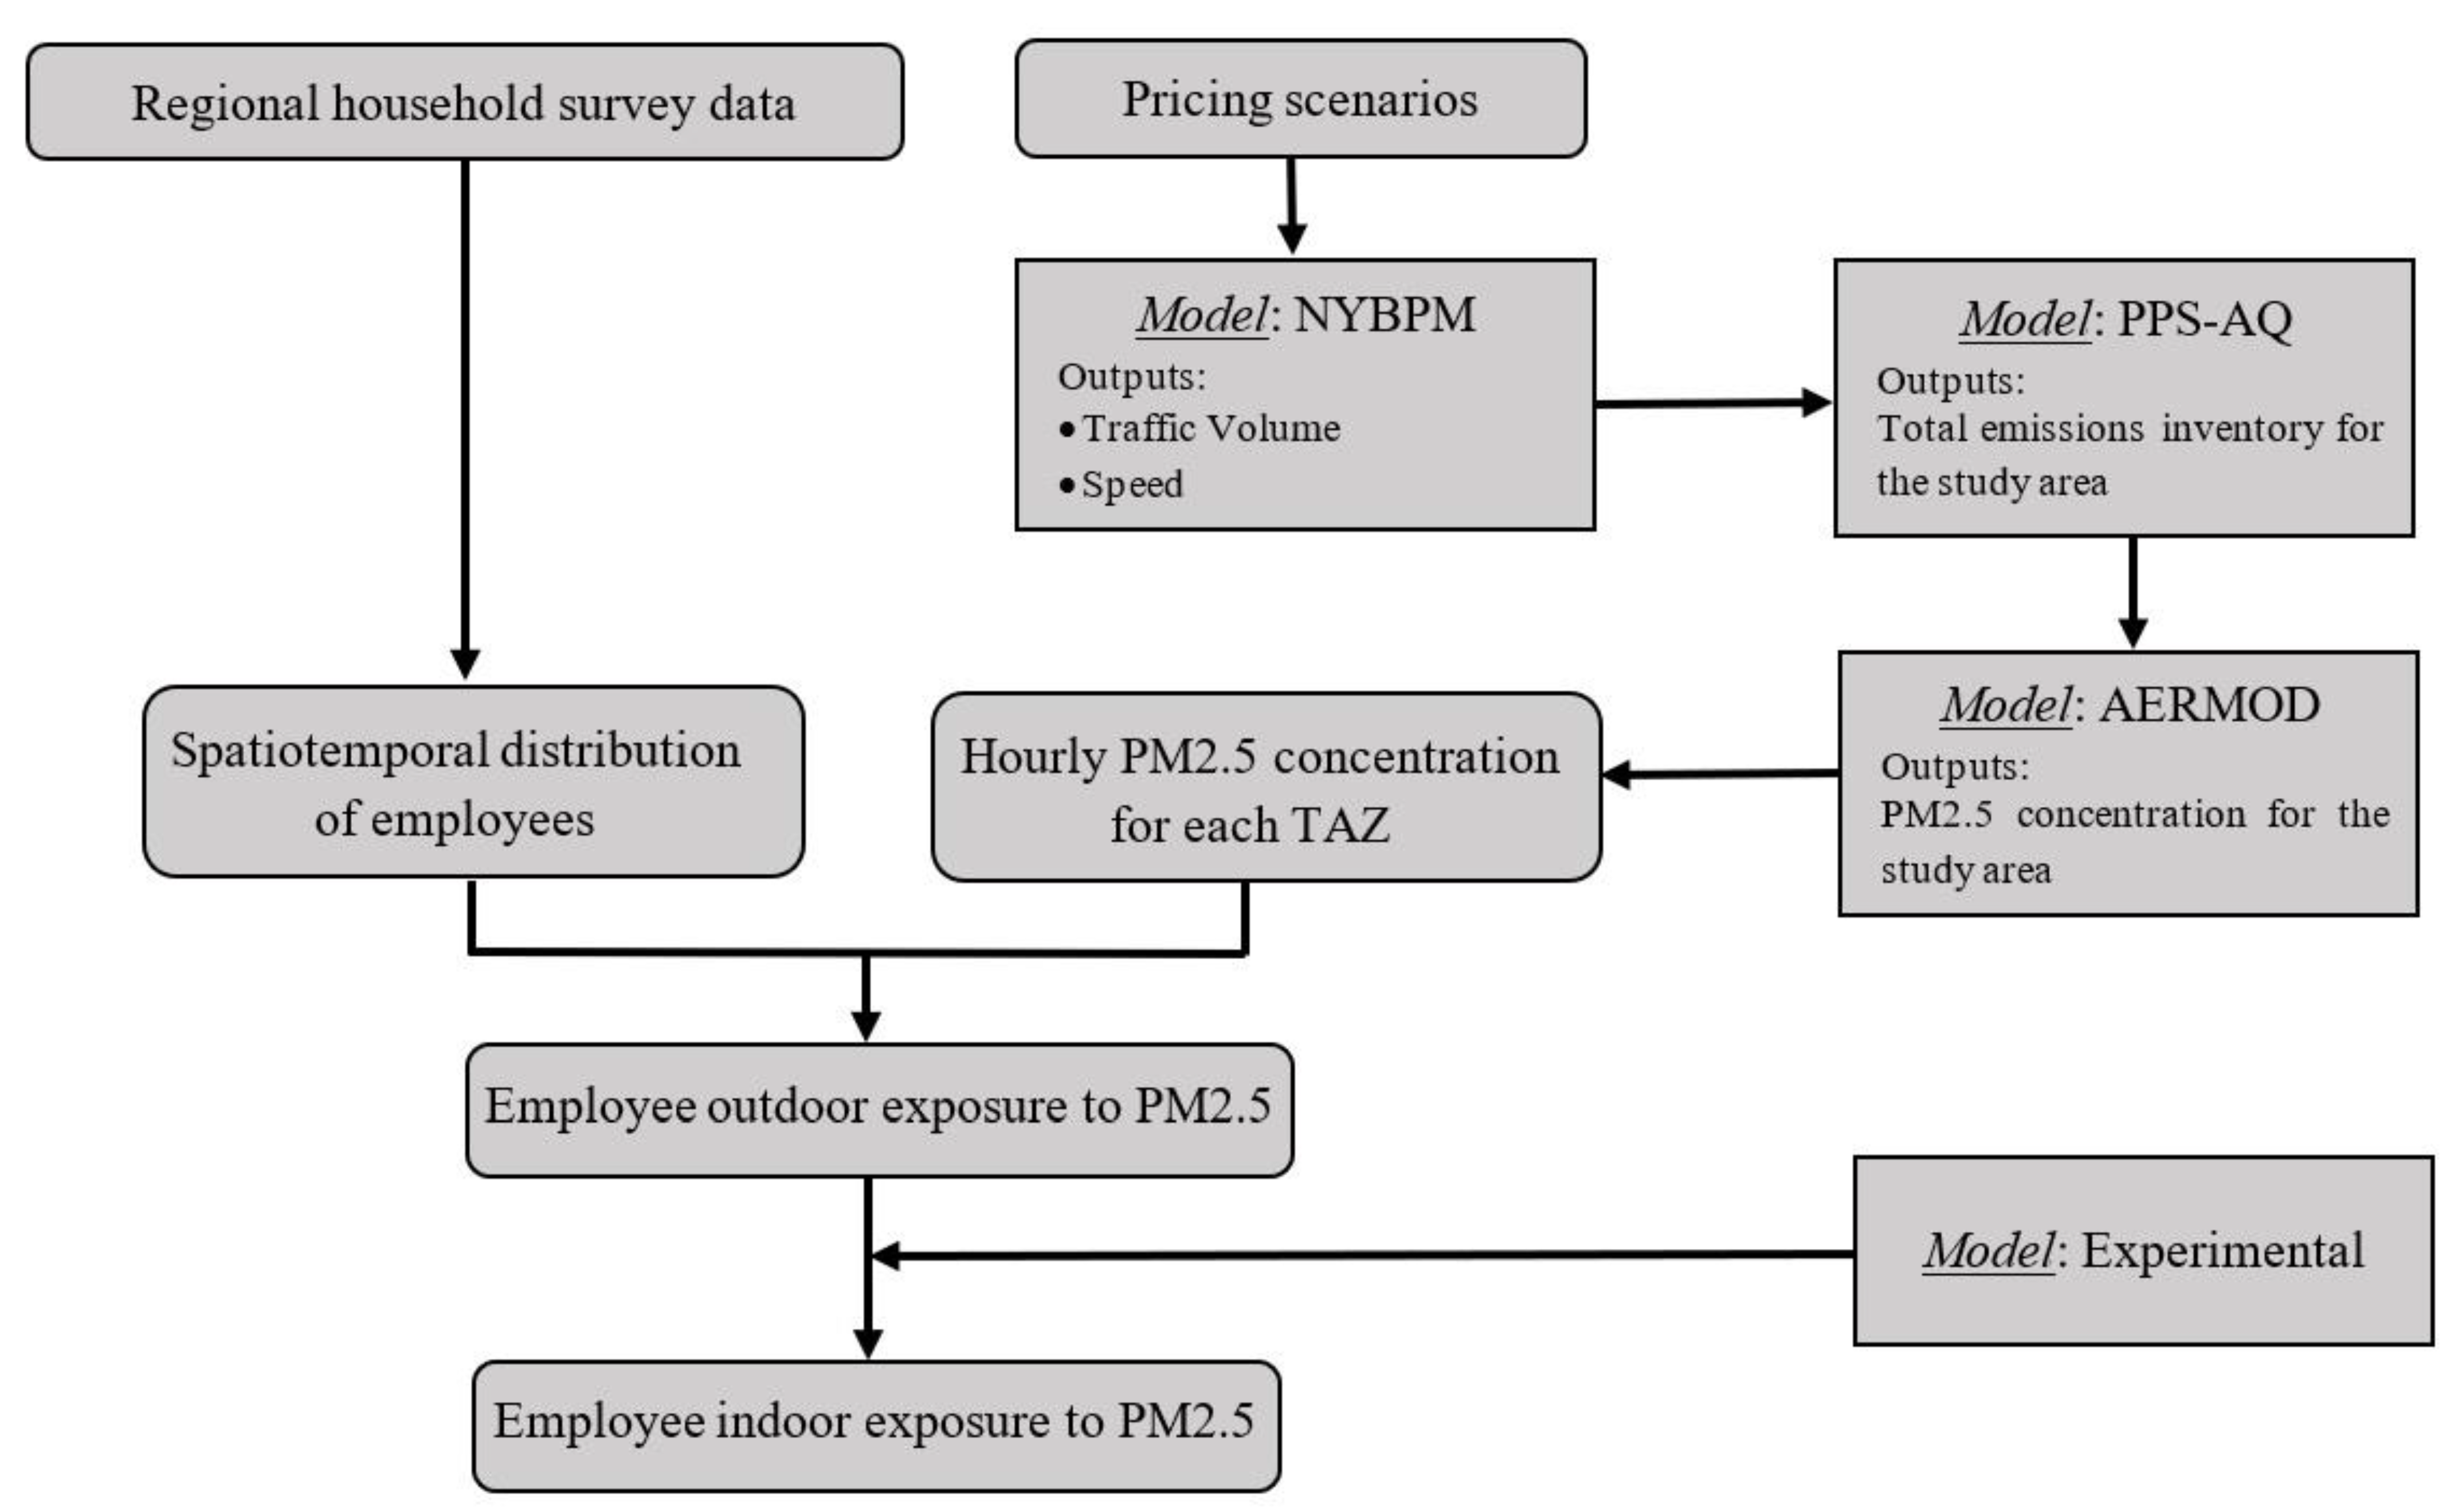
3.1. Integrated Modeling Framework

The NYBPM, as an activity-based travel demand model, predicts travelers’ responses to congestion pricing and generates trip tables between origins and destinations. Besides the regular input data, here, pricing scenarios, including various toll levels for different times of day, are the inputs of the NYBPM. The model then assigns the predicted demand to both highway and transit networks. Traffic volume and speed outputs from the NYBPM for each roadway segment are imported into the emission model (PPS-AQ) to estimate the total emissions inventory. Indeed, the PPS-AQ integrates the outputs of the NYBPM with the emission rates collected from the US Environmental Protection Agency (US EPA) Motor Vehicle Emission Simulator (MOVES). Designed based on field and laboratory test data, MOVES is an emission simulator that enables the estimation of factors or inventories of GHG and toxic air pollutants based on different classes of vehicles, roads, speed bins, and metrological conditions. The total emissions are calculated by multiplying the traffic volume on the roadway segments by the emission rate matched for roadway type and travel speed. Travel speed obtained from the travel demand model is post-processed by PPS-AQ to calculate recurrent delays, including at traffic stops and queues at entrance/exit ramps. Next, the dispersion model (US EPA AERMOD) estimates the PM2.5 concentration over the study area during each period, which can be converted to a 24 h distribution. In this step, roadway segments are modeled as area sources, and other dispersion parameters are set based on US EPA particulate matter hotspot modeling guidance. By employing the Regional Household Travel Survey (RHTS) data, we can obtain detailed information on the daily activity patterns for employees in the study area [76]. The information is used to estimate the value of employee × hours spent at the Traffic Analysis Zone (TAZ) level. The model integrates the hourly PM2.5 concentration with the spatiotemporal distribution of employees to compute the employees’ exposure to PM2.5 for each pricing scenario. Figure 1 illustrates the integrated modeling framework developed for this paper. More details of each step are described in the following sections.

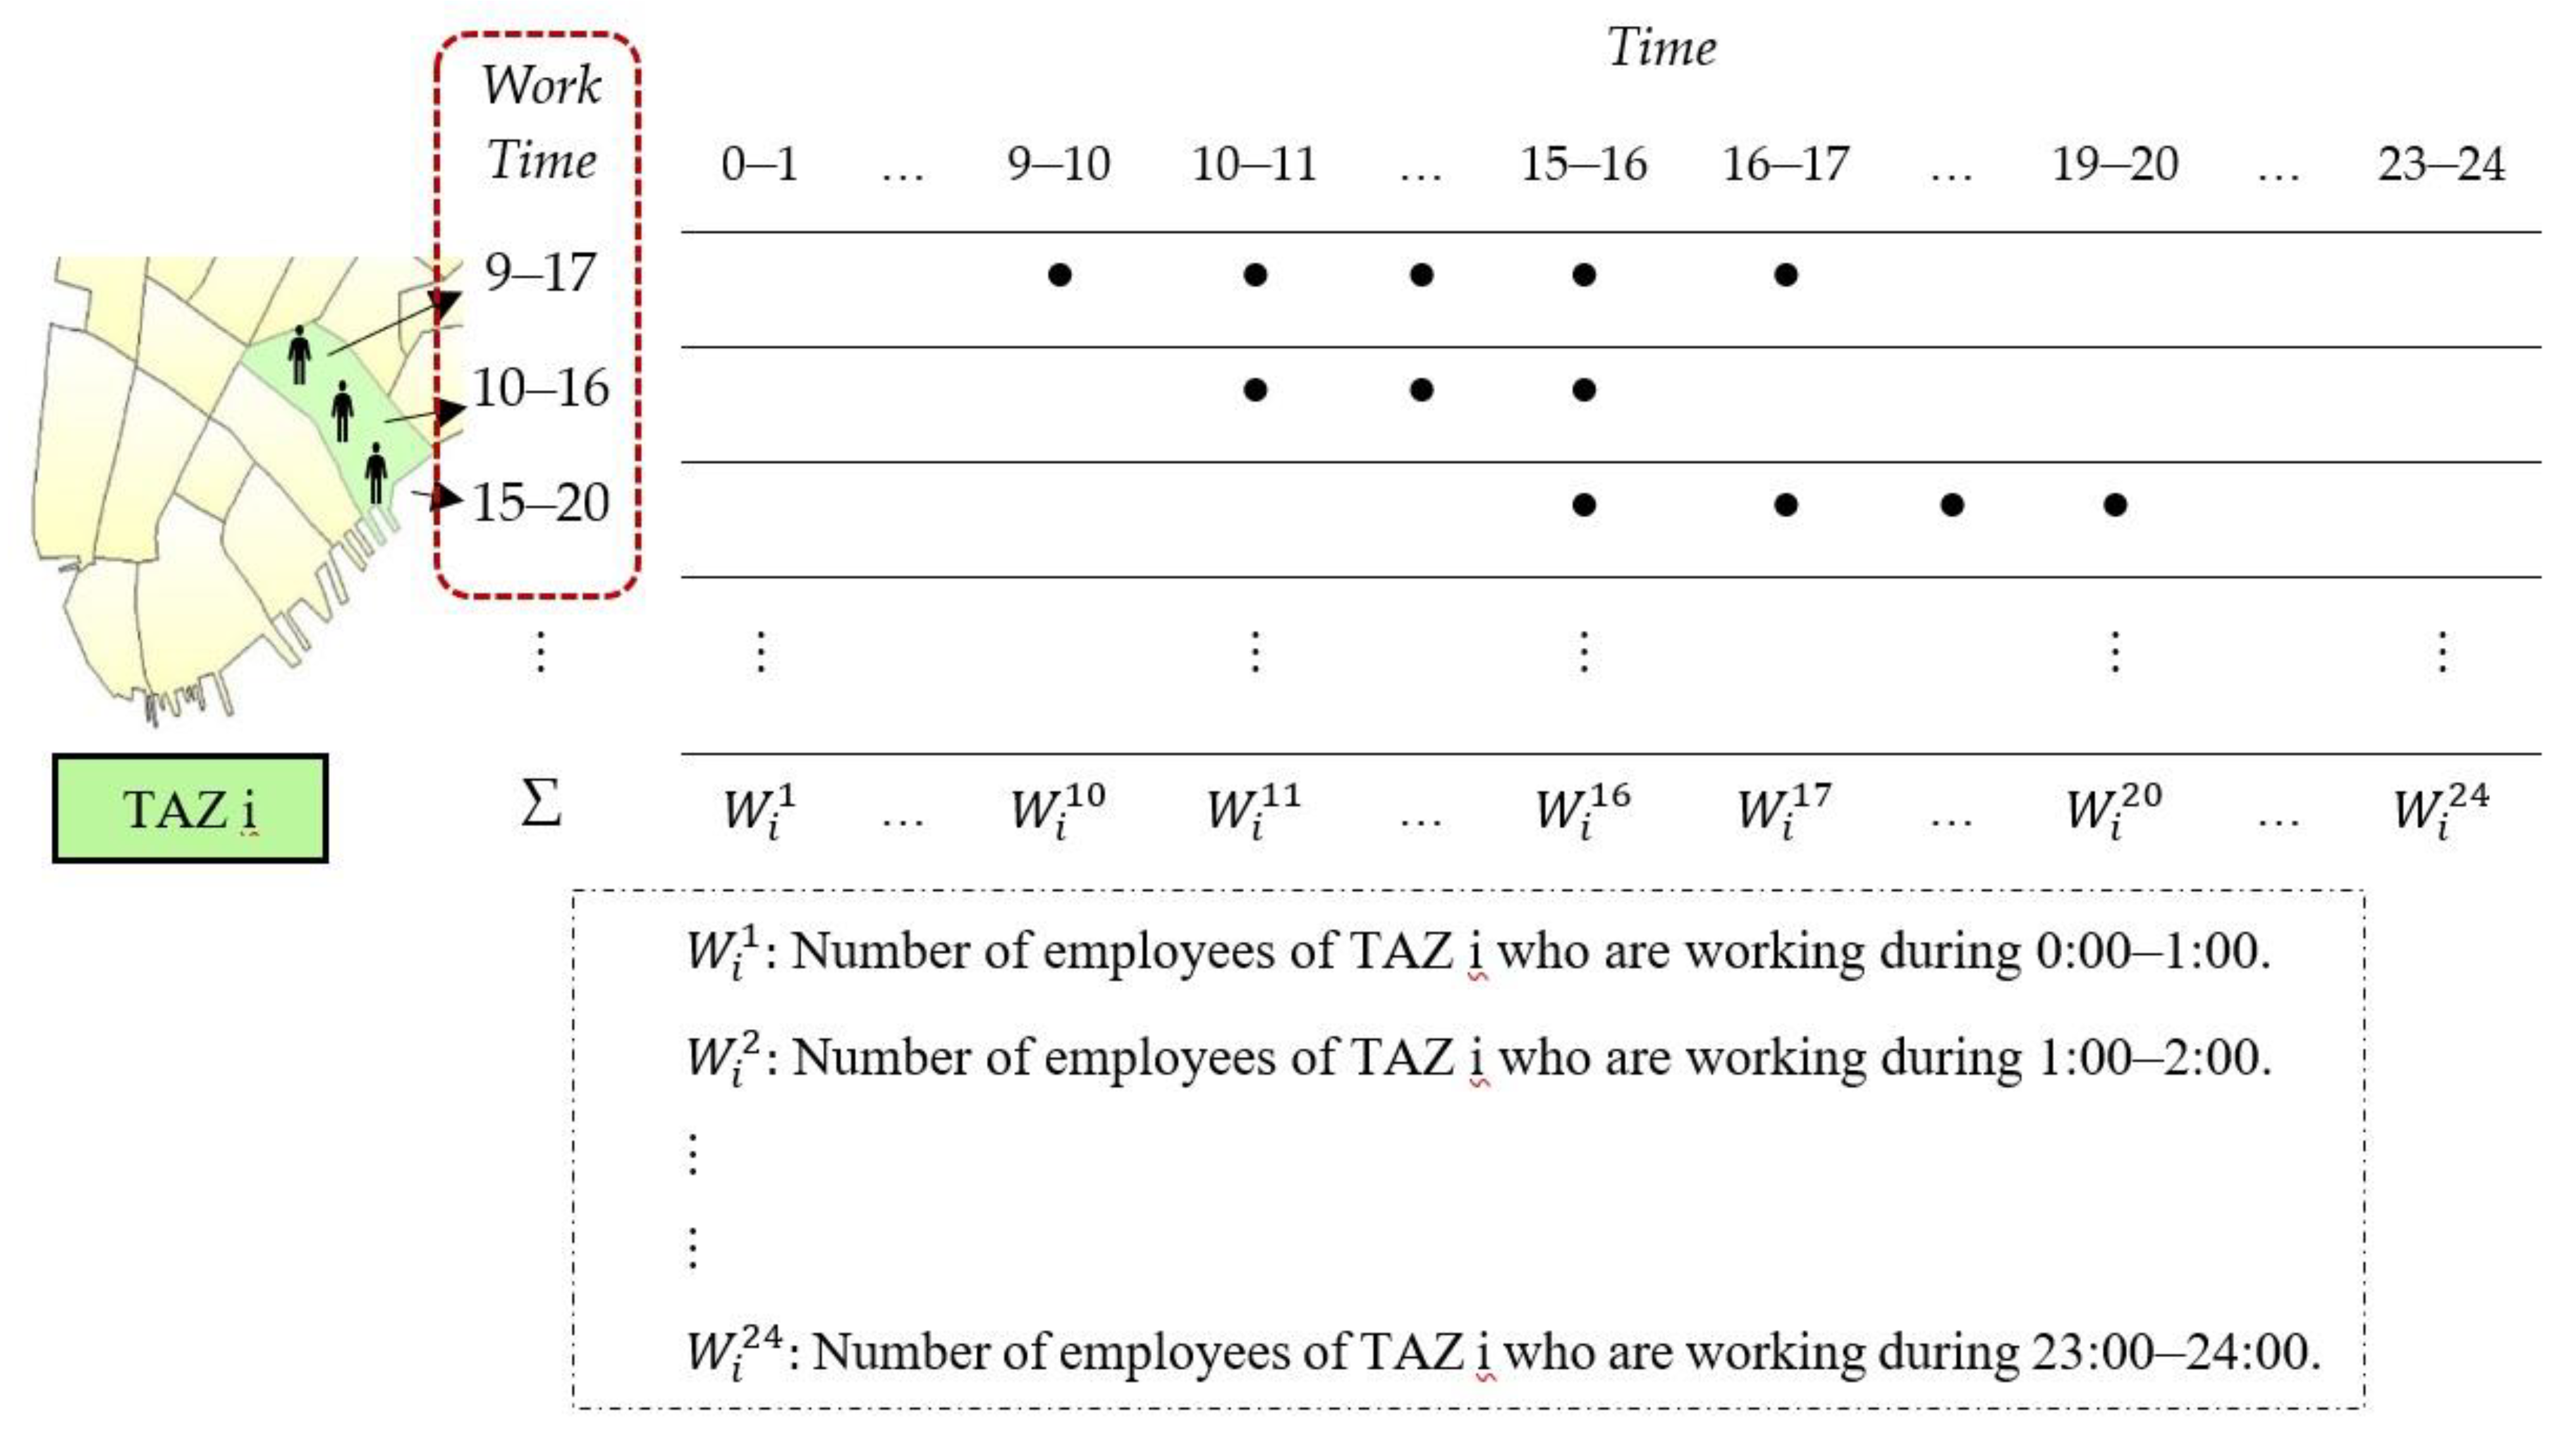
3.2. Activity-Based Modeling

New York Metropolitan Planning Council (NYMTC) has named its official activity-based travel demand model as the New York Best Practice Model (NYBPM). The NYBPM is a micro-simulation model that predicts how changes in the sociodemographic profiles and transportation systems affect users’ travel behavior, using tours as the basic unit of modeling. The NYBPM takes socioeconomic data (SED) and highway and transit networks as inputs [74]. The updated version of the NYBPM model was developed in 2015 and it covers 28 counties in New York, New Jersey, and Connecticut, which includes 8 million households, 25 million citizens, and 25 million daily paired journeys over 21,000 miles of roadways.
The NYBPM takes into account the travel pattern at a disaggregated level by using the micro-simulation method, including household synthesis, auto ownership, journey frequency, mode/destination choice, and stop frequency and locations. The Household–Auto Ownership–Journey (HAJ) model starts with synthesizing the population and assigning them to one of the 288 household types based on data obtained from the household travel survey. Next, the NYBPM’s Auto Ownership model estimates the probability of the number of cars for each household. The model then estimates the frequency that a person makes 0, 1, 2, or over 3 journey pairs per day using a logit model with independent variables such as income, automobile ownership, number of vehicles, number and age of children, and employment status [77]. Using a series of logit models, the NYBPM determines the destination and travel mode for every disaggregated journey using the general cost for each origin and destination pair, which includes length, free-flow travel time, toll costs, fixed costs, and congested time. The initial data for model calibration were obtained from the 1998 Regional Travel—Household Interview Survey and later updated with more recent survey data [78].
The NYBPM’s Pre-Assignment Processor (PAP) model applies the time of day distribution to daily journeys to obtain sets of origin–destination trip tables for four periods: morning peak, mid-day, PM peak, night-time. After adding external auto and truck trips obtained from external sub-models, the model finally assigns the six highway mode vehicle trip tables generated from the core mode choice model (single-occupant vehicle (SOV), high-occupant vehicle with 2 persons (HOV2), high-occupant vehicle with 3 or more persons (HOV3+), taxi, truck (6 tires+), and other commercial vehicles) to the networks using the standard User Equilibrium (UE) traffic assignment [77]. The standard assignment procedure is designed to assign the four periods to a convergence level of 0.001 and 100 maximum iterations. The parameters for volume delay functions (BPR) in the NYBPM are also defined by physical link type classification.
The NYBPM then undergoes the calibration process to ensure that it provides accurate results [74]. At this stage, the traffic volume, the number of auto trips, and the number of transit passengers estimated by the model for the base year are compared against observation data gathered at several screenlines and cordon counting stations. The findings imply a high level of agreement between model estimation and observation data. For instance, for the New York City boroughs of Nassau and Westchester, the difference in modeled traffic flow versus traffic counting data at screenlines is within ±5% and the average difference for crossing trips over several river bridges is 1.6% [74].

3.3. Vehicle Emission Modeling

Here, we use the PPS-AQ to analyze the environmental impacts of congestion pricing. In this process, the outputs from the NYBPM are integrated with the PM2.5 emission rates from the US Environmental Protection Agency (US EPA) Motor Vehicle Emission Simulator (MOVES). PPS-AQ converts four time period traffic volume and speed outputs from NYBPM into hourly values using observed traffic counts. The traffic volume and speed on each roadway segment are then adjusted based on the observed data and, also, based on the seasonal and monthly variations. To estimate particulate matter emissions rates in gr/mile, the US EPA MOVES is tailored with various local data, including road type distribution, average speed distribution, fuel characteristics, source type population, inspection–maintenance programs, fleet age distribution, and meteorology data. The model estimates emission rates for rural restricted, rural unrestricted, urban restricted, and urban unrestricted roadway types for 16 speed bins. The PPS-AQ calculates emissions by multiplying the traffic volume on roadway segments with the emission rate matched for roadway type and travel speed.

3.4. Dispersion Modeling

To model the PM2.5 concentration, we use a rastering approach [79] that follows US EPA regulatory modeling guidance and previously has been implemented for different case studies [41,43,80]. In brief, we use PM2.5 emission rates for each roadway segment as input in the air pollutant dispersion model, US EPA AERMOD, to estimate the hourly concentration of primary vehicle exhaust PM2.5. In this approach, roadway segments are modeled as area sources, and other dispersion parameters are set based on US EPA particulate matter hotspot modeling guidance [81]. Following the US EPA guideline, we use 2 days of hourly meteorological data recorded from each month of the most recently available five-year meteorology data. The five-year meteorology data are obtained from 3 monitoring stations that cover the study area (Figure 2).
The grid of point receptors with 100 m spacing covers the five counties in the study area used to estimate PM2.5 concentrations. The unique rastering approach allows us to break down the modeling domain into smaller sections, which enables a parallel computing process. We finally create a 20-m-resolution raster from the point concentration estimates using the spatial interpolation method in ArcGIS for every hour.

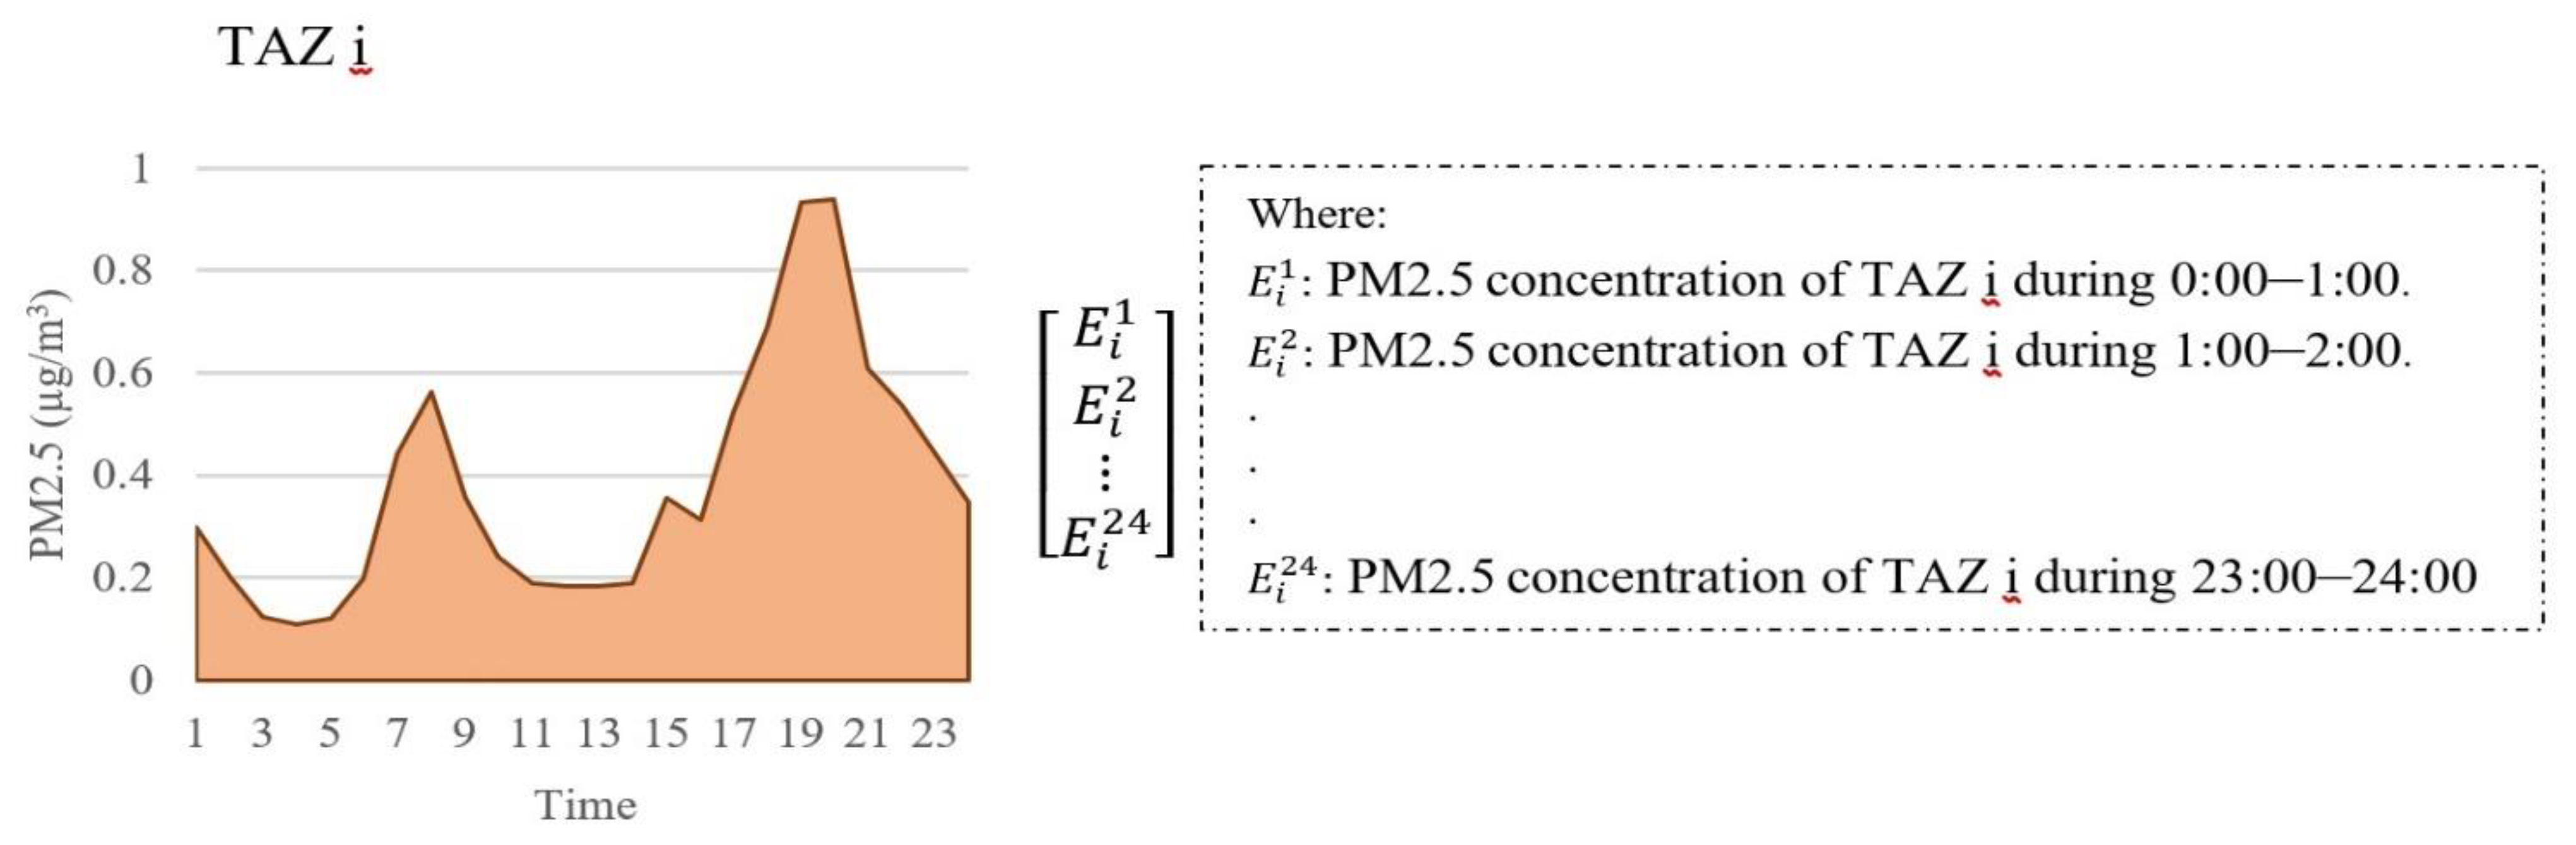
3.5. Exposure Estimation

Figure 3 depicts the detailed formulation of calculating population daily exposure for our sample population. The model first uses RHTS data to break down the work duration of each employee into 1 h intervals. To clarify the process, three employees with different work times at zone i are shown as an example, each broken down into 1 h intervals. This process is conducted for the zones inside the study area to estimate the number of employees for each 24 h period.
The outputs of air quality and dispersion models calculate the average hourly PM2.5 concentration over each TAZ ( [ E i t 1 , E i t 2 ,   ,   E i t 24   ] ), where E i t 1 is the average PM2.5 concentration of TAZ i during 0:00–1:00, and E i t 24 refers to the average PM2.5 concentration of TAZ i during 23:00–24:00 (Figure 4).
Consequently, the sum product of the spatiotemporal matrices of employees and hourly concentration would generate the total value of the exposure to vehicle PM2.5 for employees in each TAZ (Equation (1)). By summing the computed values for the entire study area (consisting of 335 TAZs) and dividing this value by the total number of employees, the population-weighted mean exposure is computed (Equation (2)).
Total Employee Exposure to PM2.5 Emissions in TAZ i ( T W E i ):
T W E i = [ W i 1 , W i 2 ,   ,   W i 24   ] .   [ E i 1 E i 2 E i t 24 ]
Population-Weighted Mean of Employee Exposure to PM2.5 Emissions:
( W M E ) : W M E = i = 1 335 ( [ W i 1 , W i 2 ,   ,   W i 24   ] .   [ E i 1 E i 2 E i t 24 ] ) i = 1 335 j = 1 24 W i j

3.6. Indoor Exposure
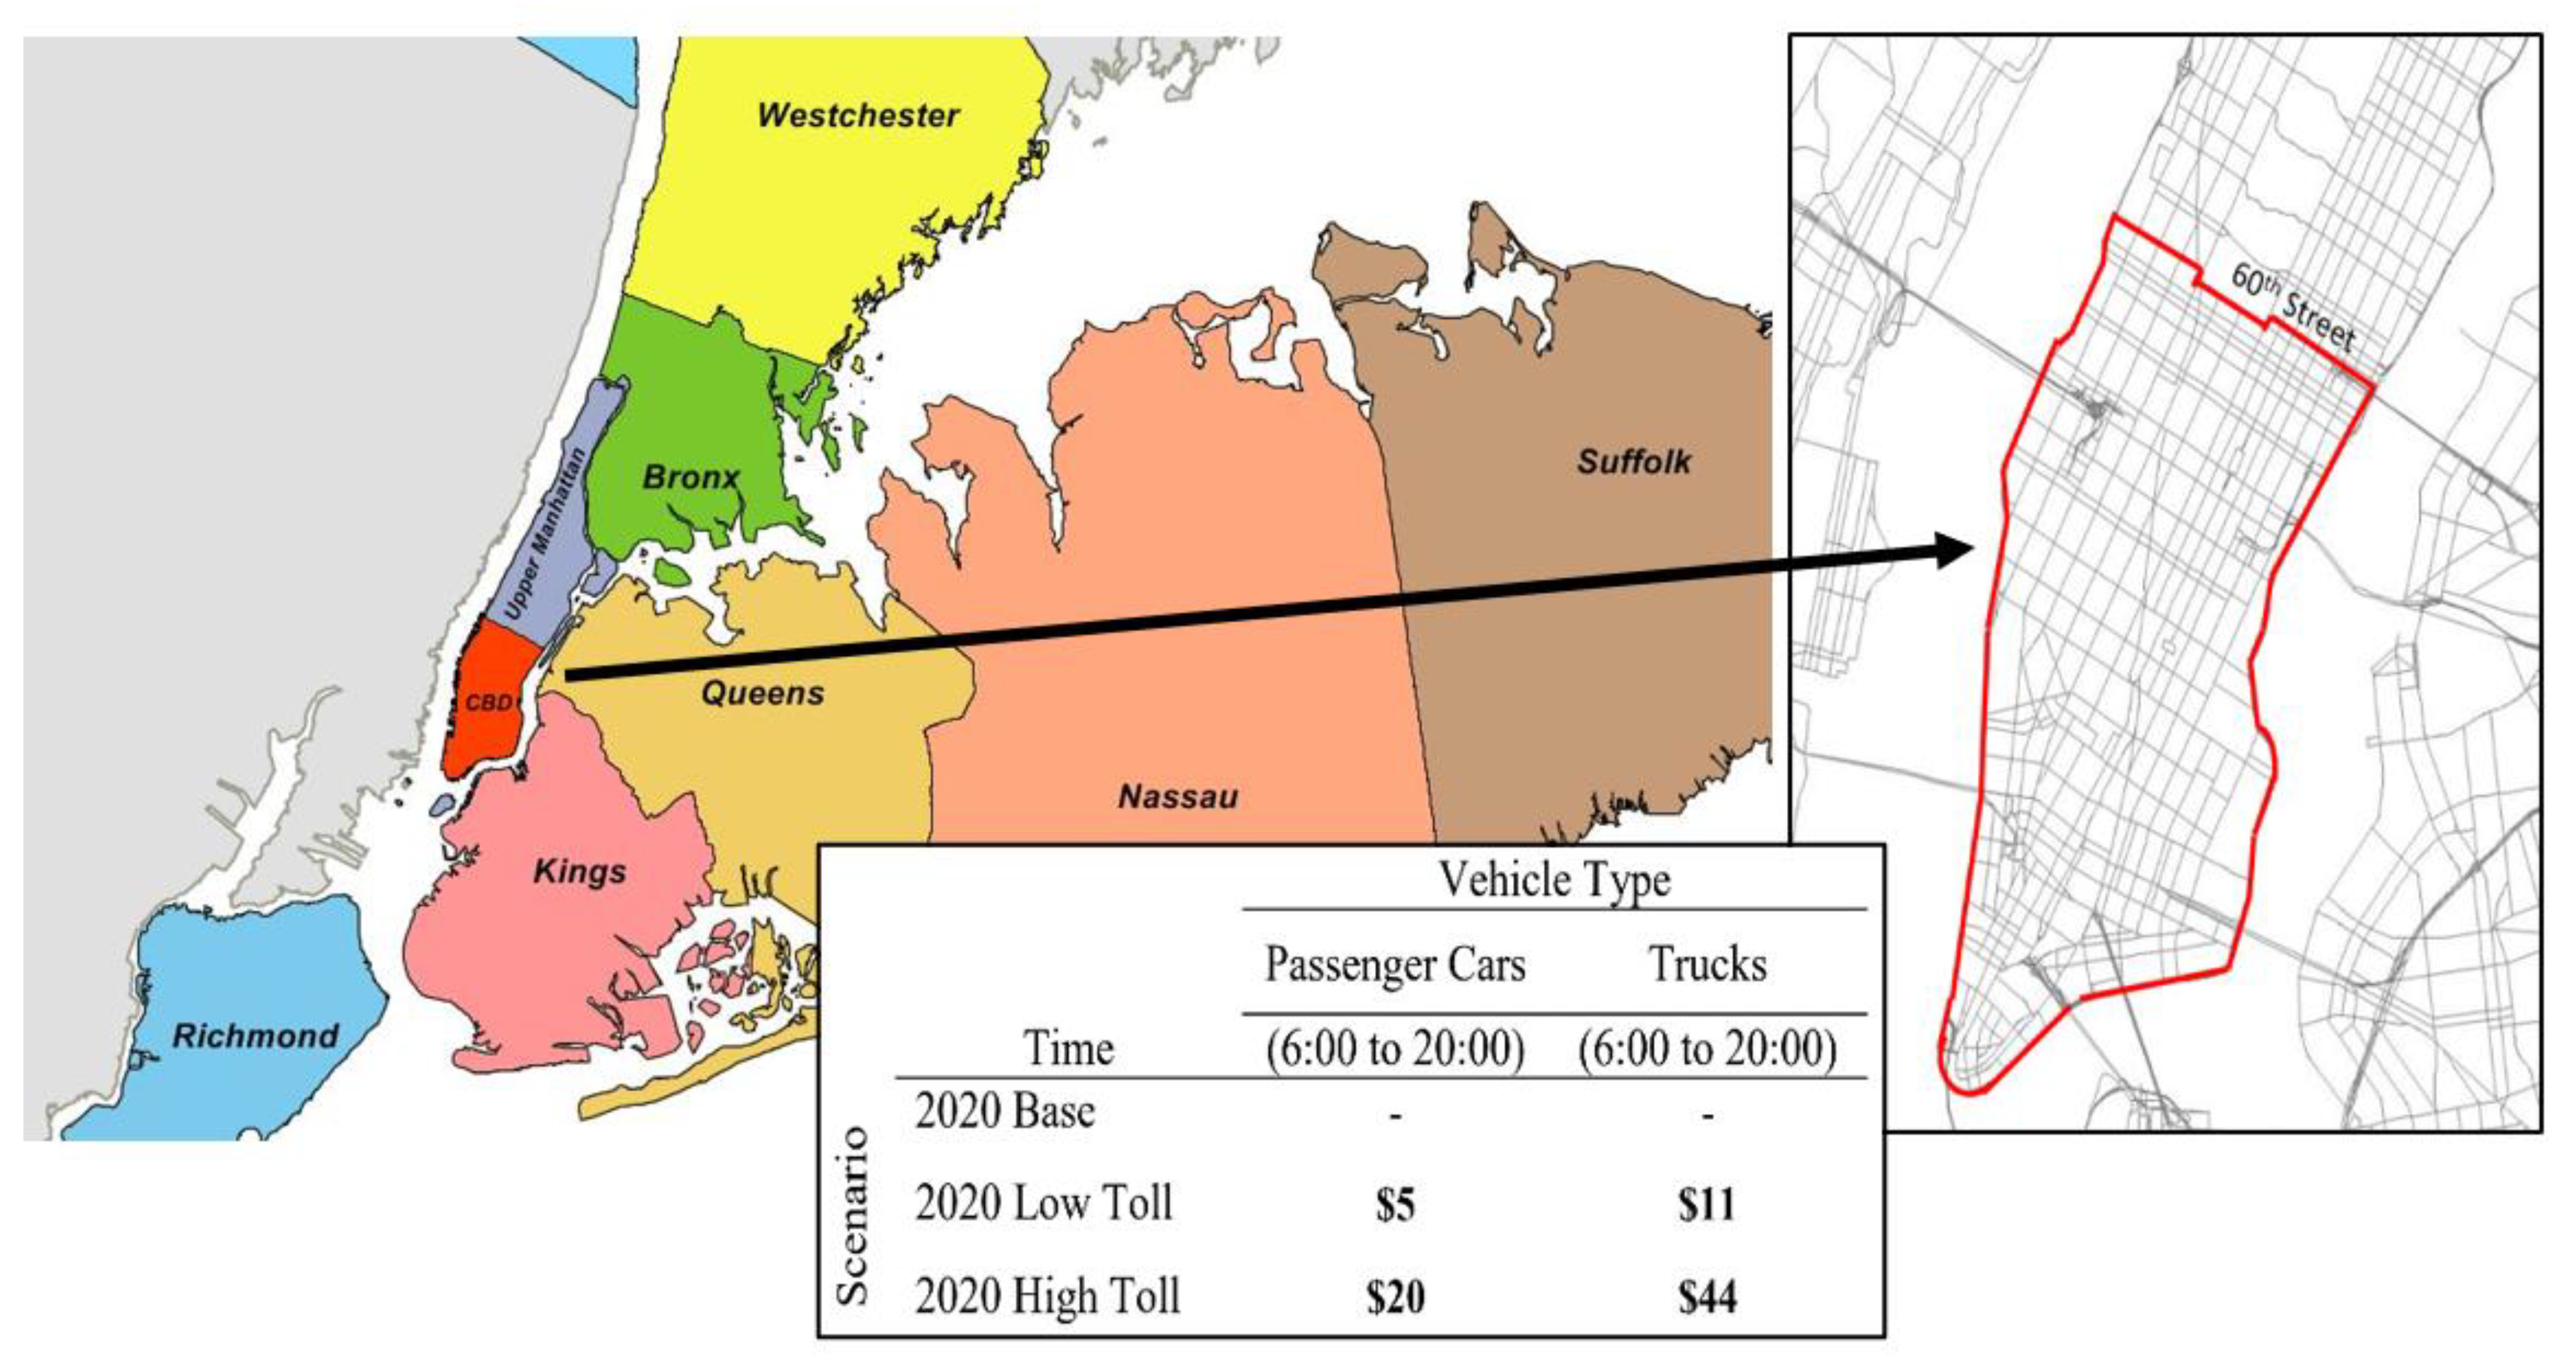
In this section, the process of transferring the outdoor particulate matter concentration to the indoor level is described to obtain a better assessment of air quality congestion pricing scenarios. We use an experimental model based on simple physical principles of the air exchange rate [82,83,84,85]. Assuming the absence of indoor sources such as smoking and cooking, the indoor concentration of particles is given by the expression:
C i n = P α C o u t α + k
where C i n and C o u t are the indoor and outdoor concentrations of PM2.5 (µg/m3), respectively. According to Equation (3), the indoor concentration is a function of the penetration coefficient P (dimensionless), air exchange rate α per hour (h−1) due to infiltration and natural ventilation, and the decay rate K (h−1), which originates from the outdoor sources based on the pollutant’s physicochemical properties. The penetration factor describes the reduced amount of inhalation exposure caused by the filtering effect of the building shell [86]. Under conditions with open doors and windows, the penetration factor could be assumed to be one; however, if the building envelope acts as a filter, it would be less than one depending on the particle size [87]. Related assumptions reported by previous researchers are generally in agreement with the penetration coefficient being in the range of 0.85 to 1, an air exchange rate of 0.51, and a decay rate of around 0.46 for PM2.5 [82,86,88,89].
In this paper, we consider two cases: a building in downtown Manhattan (inside the CBD) and another one in Upper Manhattan (outside the CBD). Values from the literature were obtained based on the canyon aspect ratio (i.e., the canyon height H to canyon width W) and are applied for pricing scenarios.

4. Pricing Schemes

Two cordon charging schemes that are in line with the majority of the previous proposals for New York City are depicted in Figure 5 [10,27]. The Congestion Charging Plan proposed by Mayor Bloomberg, however, still has been under debate since 2008 [90]. Vehicles that cross the boundary of the cordon area between 6 a.m. and 8 p.m. will be charged based on the vehicle type (passenger car or truck). Toll values are assumed based on previous congestion pricing proposals for NYC [10]. Under the low charging scheme, passenger and truck vehicles will be charged USD 5 and USD 11 per crossing of the cordons, respectively. The tolls rise to USD 20 and USD 44 for the high charging schemes. The cordon area has been selected based on the particular topology of Manhattan County, which is connected to other areas only via tunnels and bridges. Two pricing scenarios are performed for the year 2020 and compared to the 2020 Do Nothing scenario. The two pricing schemes are believed to cover the low and high possible charging scenarios.
In the original format, the total cost of traveling for each origin–destination pair, as one of the primary independent variables in the process of mode and destination choice, is calculated by using different parameters, such as vehicle (passenger cars) operating costs 0.22$/mile and value of time, which ranges from 0.29$/min for night-time travel to 0.35$/min for trips during the mid-day period. The costs of traveling for transit and taxi trips also include the fare term, and for trips that include toll road crossing, it also includes the toll term. For the NYBPM 2010 Update, tolls are considered one of the link attributes, coded in the highway networks database. To model the pricing schemes in the NYBPM travel demand model, we add the pricing charges to the boundary links of the cordon area. Therefore, the generalized cost for each origin destination that crosses the pricing zones is increased, which impacts the mode and destination process in the study area. Previous projects modeled in NYBPM for congestion pricing simply added the additional charges into origin destination matrices for each mode. We consider the pricing scenarios by applying them into the table of attributes of highway links and including them in the process of iterations in NYBPM. Although this approach requires more execution time, it will enable more accurate predictions of changes by updating the travel times at each iteration.

5. Results

In this study, we employ RHTS data, which were designed and collected for demand modeling, and we consider the spatiotemporal characteristics of employees whose workplace is located in Manhattan. Based on our data, the target group includes 4480 employees who work for a total of 38,277 h across 289 TAZs out of 335 TAZs. Figure 6a indicates the start time of the employees; around 65% of individuals start their work at 8:00 or 9:00. The aggregate number of employees for 24 h is indicated in Figure 6b based on the working hours divided into 1 h intervals. It can be seen that the number of employees follows a bell shape over time, where the majority of employees are in their workplaces between 9:00 and 16:00.
We then visualize the spatial distribution of the employees × hour across the study area (Figure 7), indicating the sum of working hours of all the employees from our sample per TAZ. For instance, a TAZ with 100 employees × hour might include 25 employees for each 4 h period of work or 10 employees for each 10 h period of work. As indicated, the majority of employees are located mostly in the CBD, where the pricing policy is being tested.
In order to obtain a general understanding of the environmental impact, average daily PM2.5 concentrations for each scenario are depicted in Figure 8. The CBD has the highest concentration level of PM2.5 emissions, partly due to the significant work trip attraction. As shown, implementing an additional charge for the trips entering/exiting the CBD has a notable effect on environmental issues. In the case of the CBD, the pricing scenarios can reduce the PM2.5 concentrations, specifically near highways surrounding the cordon area. The reductions in most areas are largely due to modal shifts from automobile modes to public transportation, followed by decreasing the vehicle miles traveled and increasing the average travel speed. Based on the results, toll values for cordon pricing scenarios reduce taxi and single-occupancy vehicle (SOV) trips, while trips made by transit systems rise noticeably, explaining the modal shift from automobiles to transit. For instance, SOV trips attracted to the CBD decline from 9% to 30% in the low and high toll scenarios.
Trip purpose analysis indicates that the modal shift mostly occurs for work trips. Further analysis also shows that the cordon pricing might eliminate a portion of the attracted discretionary trips to the CBD. Consequently, the network performance in Manhattan would be affected, results of which are indicated in Table 1 and Figure 9. In Table 1, four measures are selected to show the impacts on the network, including vehicle hours of delay (VHD), vehicle miles traveled (VMT), lane mile congested (LMC), and average travel speed (ATS), for restricted and unrestricted access. Based on the results, VHD and LMC dramatically decrease by 33% under the high toll scenario. Moreover, the VMT reduction ranges from 5% to 14%, which directly affects fuel consumption and vehicle emissions. The average speed also increases by 18% and 7% in restricted and unrestricted access, respectively. Figure 9 indicates traffic conditions in the Manhattan network for the morning peak period (AM), which obviously shows an improvement in the network performance [91].
We then compare the absolute and percentage changes in air pollution concentration between each scenario at the TAZ scale (Figure 10). Implementing the high toll scenario will result in better environmental conditions. Based on the maps, the absolute changes in some TAZs reaches −0.34 µg/m3 (equals to 20%) and −0.65 µg/m3 (equals to 38%) in the low toll and high toll scenarios, respectively. Additionally, according to Figure 7 and Figure 10, the proposed scenarios positively affect air quality in the surroundings of the workplaces of the target group in the sample. While most of the TAZs will experience a decrease in PM2.5 concentrations, a rise is observed in a few TAZs located in downtown Manhattan. The reason could be referred to as the pricing approach, which charges drivers as they are crossing the boundaries, regardless of whether they are entering or exiting the CBD. This means that those using personal vehicles used to make a trip from the CBD to other areas would react to the new scenarios and prefer to stay within the cordon to avoid charges.
In the next step, we focus on the hourly distribution of PM2.5 concentrations to evaluate the change in population exposure for the employees during the time that they spend at work. The population-weighted mean of employee exposure for each scenario is calculated and indicated in Table 2. Based on this table, the new pricing system could positively influence the environmental conditions of the study area. It starts with a 7% reduction for the low toll scenario and reaches a 13% reduction in the high toll scenario. In the case of the CBD, where more than 80% of the population in the sample makes one trip to work daily, congestion pricing can generate a significant reduction ranging from 22% to 28%. Moreover, congestion pricing has a positive influence on decreasing mean exposure for employees in Upper Manhattan by approximately 0.03 µg/m3 and 0.04 µg/m3, depending on the pricing scenario. The overall result of this section shows that implementing the cordon pricing can effectively reduce the employees’ exposure to PM2.5 emissions.
Finally, we study the cordon pricing’s impact on the indoor exposure of employees. Two locations inside and outside the CBD are selected, each with employees working from 09:00 to 17:00 (Figure 11). In this step, we assume the same conditions for both cases, using the parameters mentioned in Section 3.6. The only difference refers to the penetration coefficient: the upper bound (P = 1) is assumed for the case of the CBD (where streets are flanked by tall skyscrapers on both sides) and the lower bound (P = 0.85) is considered for the Upper Manhattan case due to the canyon aspect ratio. The results of the indoor exposure for the two cases under different pricing scenarios are shown in Table 3. It is important to mention that, unlike the previous section, which evaluated the population-weighted mean exposure, here, only a single employee is selected in each TAZ for estimating the indoor exposure, and results would be changed by considering different conditions. According to Table 3, the indoor exposure for the case of the CBD in this study is reduced by 0.10 to 0.21 µg/m3. Similarly, in the case of Upper Manhattan, a positive effect for indoor-level exposure is observed in response to implementing the cordon pricing.

6. Discussion

While several studies have previously demonstrated the effect of cordon pricing, relatively limited research has been conducted on the exposure analysis of the population, considering the daily spatiotemporal movement of individuals. Prior research typically evaluated emission exposure according to the residential location of individuals and did not consider mobility patterns to compute emission exposure. We aimed to contribute to this line of research by evaluating the impact of cordon pricing on exposure to vehicle emissions. In this regard, the population-weighted mean values of exposure to PM2.5 were computed and compared for pricing scenarios by integrating the concentration of traffic-related PM2.5 with the spatiotemporal distribution of employees. The use of activity-based demand models would enable the consideration of travel pattern changes as a continuous process and the capture of the dynamics of population activity while computing the total exposure during the day. Employing such models, which are more sensitive to scenarios, could provide a more credible analysis of responses to policies that are generally influential in transport planning and policy-making [49].
We indicate that the CBD experiences a high concentration of PM2.5 emissions, which again highlights the importance of travel demand management strategies for the area. In line with the outcome of the traffic conditions, our findings also confirm that the boundary of the cordon area would experience more benefits regarding a traffic emission reduction. The overall result of this study shows that implementing cordon pricing can effectively change the population-weighted mean of exposure to PM2.5 emissions for the target group, employees whose workplace is in Manhattan. This positive effect on air quality for the sample of employees, who have been rarely targeted by previous research, is particularly important considering that employees spend most of their time in the area surrounding their workplace, not in their residential neighborhood. Moreover, it is important to study the exposure impact of transport policies in both indoor and outdoor environments. To the best of our knowledge, our research is one of the primary studies that considers the indoor exposure impacts of cordon pricing for metropolitans. Accordingly, a positive effect on indoor-level exposure was observed in response to implementing cordon pricing.
The outputs of this research can be used by decision-makers to better evaluate policy impacts and also provide a more detailed picture to compare the results of different pricing scenarios. As indicated, the environmental impacts vary over TAZs in Manhattan, where most jobs are located. Therefore, complementary policies might be applied in specific areas to address the equity issues. With knowledge of the changes in the population-weighted mean of exposure, epidemiology studies could be added to the current findings to analyze the pricing effects on public health by estimating changes in negative health outcomes, including lung cancer mortality and ischemic heart disease mortality.

7. Conclusions

Cordon pricing as a travel demand management tool has been implemented in many urban areas around the world to improve traffic conditions and control vehicle emissions. In this paper, we evaluated the impact of CBD cordon pricing on employee exposure to particulate matter emissions by using work duration to predict the spatiotemporal characteristics. New York City was selected as the case study, where, despite its accessible public transport system, new policies are still needed to resolve traffic congestion.
We integrated an activity-based (NYBPM) travel demand model, a vehicle emission model (PPS-AQ), and an air dispersion model (AERMOD) to estimate the concentration of traffic-related PM2.5 over the study area. Then, by using the distribution of work duration in different zones, the population-weighted mean of employee exposure to PM2.5 was compared among different proposed pricing scenarios. Primary analysis indicated that in addition to the considerable work trip attraction, the CBD experiences a high concentration of PM2.5 emissions, which again highlights the necessity for travel demand management for this area. Comparing the average concentration of PM2.5 for the pricing scenarios shows that the boundary of the cordon area would gain more benefits from pollution reduction. Based on the results, implementing cordon pricing scenarios can improve the population-weighted mean of exposure to PM2.5 emissions in the study area by 7% to 13%. Furthermore, two locations inside and outside the CBD were considered to estimate the indoor exposure by employing an experimental model. Our findings explain the positive influence of indoor exposure reduction for both locations.
In summary, these results highlight the impacts of transportation policies on public health, as reducing long-term exposure to particulate matter—even in small ranges—could prevent significant numbers of early deaths [92]. The output of this research suggests that improved air quality could be obtained from implementing cordon pricing in the New York CBD. Employee exposure might be reduced by decreasing the vehicle miles traveled due to a modal shift from automobile modes to public transportation. These findings are particularly important considering that employees spend most of their time in the area surrounding their workplaces, not in their residential neighborhood, and long-term exposure to pollutants can result in great risks to health, including cardiovascular disease and premature death. In order to meet targets aimed at specific vehicle emission reductions, policy-makers and urban planners should pay more attention to travel demand management strategies and, alternatively, could test more congestion relief strategies in areas depending on emission exposure concerns. However, the importance of public acceptance, specifically for pricing policies, should not be neglected. Despite positive effects on traffic and environmental measures, implementing congestion pricing might raise equity and fairness issues, as they could be harmful to some minority groups. Therefore, it is necessary for decision-makers to take action in the primary steps of project planning to address the issue of equity. These actions might include the education of numerous civic and community groups to gain support and collaboration between elected officials and transportation agencies before project development.
The research was faced with some limitations, mainly due to the nature of the data and the models used for the analysis and the prediction of individual exposure to emissions. Since the NYBPM does not provide an exact activity pattern for each individual, this research employed RHTS data to estimate the spatiotemporal characteristics such as start time and duration. Hence, we only focused on employees and their exposure during the duration of their work. The availability of activity prediction at a disaggregated level will enable the conducting of a more credible analysis by considering more groups of individuals. Moreover, we employed an experimental model to estimate indoor exposure by assuming constant conditions in each scenario, which may not be necessarily correct. Integrating more detailed information with the current results might solve this limitation to provide a more accurate indoor prediction. Lastly, this paper only focused on the environmental impacts of cordon pricing, while other impacts could be considered for future research. For instance, managing urban freight transportation might be challenging since truck deliveries could not be switched entirely to other transportation modes. Studying the undesirable conditions of urban freight transportation resulting from cordon pricing and evaluating possible solutions’ efficiency (such as limiting delivery truck movement to night-time hours) can expand upon the cordon pricing research.

Author Contributions

Conceptualization, A.B., M.A., M.T. and H.O.G.; Methodology, A.B. and M.T.; Software, A.B. and M.T.; Supervision, M.A. and H.O.G.; Writing—review and editing, A.B., M.T. and M.A. All authors have read and agreed to the published version of the manuscript.

Funding

This project was partially supported by the 55606-08-28 UTRC-September 11th grant. The work of co-authors Tayarani and Gao in this paper is funded partially by a grant from the US Department of Transportation’s University Transportation Centers Program. However, the US Government assumes no liability for the contents or use thereof.

Institutional Review Board Statement

Not applicable.

Informed Consent Statement

Not applicable.

Data Availability Statement

Not applicable.

Acknowledgments

We would like to thank Prathap Ramamurthy for his support and insightful comments, which improved the quality of this paper. We also thank the New York Metropolitan Transportation Council (NYMTC) for providing access to the activity-based model NYBPM.

Conflicts of Interest

The authors declare that they have no known competing financial interests or personal relationships that could have appeared to influence the work reported in this paper.

References

  1. WHO. 9 Out of 10 People Worldwide Breathe Polluted Air, But More Countries Are Taking Action. Available online: https://www.who.int/news-room/detail/02-05-%0A2018-9-out-of-10-people-worldwide-breathe-polluted-air-but-more-countries-are-taking-action%0A (accessed on 15 November 2019).
  2. USEPA. Available online: https://www.epa.gov/transportation-air-pollution-and-climate-change/smog-soot-and-local-air-pollution (accessed on 15 November 2019).
  3. Allen, R.W.; Criqui, M.H.; Roux, A.V.D.; Allison, M.; Shea, S.; Detrano, R.; Sheppard, L.; Wong, N.D.; Stukovsky, K.H.; Kaufman, J. Fine Particulate Matter Air Pollution, Proximity to Traffic, and Aortic Atherosclerosis. Epidemiology 2009, 20, 254–264. [Google Scholar] [CrossRef] [PubMed] [Green Version]
  4. Engström, E.; Forsberg, B. Health impacts of active commuters’ exposure to traffic-related air pollution in Stockholm, Sweden. J. Transp. Heal. 2019, 14, 100601. [Google Scholar] [CrossRef]
  5. Kim, K.-H.; Kabir, E.; Kabir, S. A review on the human health impact of airborne particulate matter. Env. Int. 2015, 74, 136–143. [Google Scholar] [CrossRef] [PubMed]
  6. Pope, C.A.; Burnett, R.T.; Turner, M.C.; Cohen, A.; Krewski, D.; Jerrett, M.; Gapstur, S.M.; Thun, M.J. Lung Cancer and Cardiovascular Disease Mortality Associated with Ambient Air Pollution and Cigarette Smoke: Shape of the Exposure–Response Relationships. Env. Health Perspect. 2011, 119, 1616–1621. [Google Scholar] [CrossRef] [PubMed] [Green Version]
  7. Laden, F.; Schwartz, J.; Speizer, F.E.; Dockery, D.W. Reduction in fine particulate air pollution and mortality: Extended follow-up of the Harvard Six Cities Study. Am. J. Respir. Crit. Care Med. 2006, 173, 667–672. [Google Scholar] [CrossRef]
  8. Miller, K.A.; Siscovick, D.S.; Sheppard, L.; Shepherd, K.; Sullivan, J.H.; Anderson, G.L.; Kaufman, J.D. Long-Term Exposure to Air Pollution and Incidence of Cardiovascular Events in Women. N. Engl. J. Med. 2007, 356, 447–458. [Google Scholar] [CrossRef]
  9. Yu, H.; Stuart, A.L. Impacts of compact growth and electric vehicles on future air quality and urban exposures may be mixed. Sci. Total. Env. 2017, 576, 148–158. [Google Scholar] [CrossRef] [Green Version]
  10. Fix NYC. Fix NYC Advisory Panel Report January 2018. 2018. Available online: https://www.scribd.com/document/369529810/Fix-NYC-Panel-Report (accessed on 15 January 2018).
  11. Lee, D.-H.; Palliyani, S. Sustainable transport policy—An evaluation of Singapore’s past, present and future. J. Infrastruct. Policy Dev. 2017, 1, 112–118. [Google Scholar] [CrossRef]
  12. Us-Dot What Is Congestion Pricing? Available online: https://ops.fhwa.dot.gov/publications/congestionpricing/sec2.htm (accessed on 5 April 2019).
  13. Börjesson, M.; Kristoffersson, I. The Swedish congestion charges: Ten years on. Transp. Res. Part A Policy Pr. 2018, 107, 35–51. [Google Scholar] [CrossRef]
  14. Percoco, M. Is road pricing effective in abating pollution? Evidence from Milan. Transp. Res. Part D Transp. Environ. 2013, 25, 112–118. [Google Scholar] [CrossRef]
  15. Fan, W. Social welfare maximization by optimal toll design for congestion management: Models and comprehensive numerical results. Transp. Lett. 2017, 9, 81–89. [Google Scholar] [CrossRef]
  16. Daganzo, C.F.; Lehe, L.J. Distance-dependent congestion pricing for downtown zones. Transp. Res. Part B Methodol. 2015, 75, 89–99. [Google Scholar] [CrossRef] [Green Version]
  17. Simoni, M.D.; Pel, A.J.; Waraich, R.A.; Hoogendoorn, S.P. Marginal cost congestion pricing based on the network fundamental diagram. Transp. Res. Part C Emerg. Technol. 2015, 56, 221–238. [Google Scholar] [CrossRef]
  18. Zhang, X.; Yang, H. The optimal cordon-based network congestion pricing problem. Transp. Res. Part B Methodol. 2004, 38, 517–537. [Google Scholar] [CrossRef]
  19. Yang, H.; Bell, M.G. Traffic restraint, road pricing and network equilibrium. Transp. Res. Part B Methodol. 2003, 31, 303–314. [Google Scholar] [CrossRef]
  20. Ferrari, P. Road pricing and network equilibrium. Transp. Res. Part B Methodol. 1995, 29, 357–372. [Google Scholar] [CrossRef]
  21. Rodriguez-Roman, D.; Allahviranloo, M. Designing area pricing schemes to minimize travel disutility and exposure to pollutants. Transp. Res. Part D Transp. Env. 2019, 76, 236–254. [Google Scholar] [CrossRef]
  22. Sugiarto, S.; Miwa, T.; Morikawa, T. Recursive bivariate response models of the ex-ante intentions to link perceived acceptability among charge and refund options for alternative road pricing schemes. Transp. Lett. 2016, 10, 52–63. [Google Scholar] [CrossRef]
  23. Abulibdeh, A.; Andrey, J.; Melnik, M. Insights into the fairness of cordon pricing based on origin-destination data. J. Transp. Geogr. 2015, 49, 61–67. [Google Scholar] [CrossRef]
  24. Ecola, L.; Light, T. Making Congestion Pricing Equitable. Transp. Res. Rec. J. Transp. Res. Board 2010, 2187, 53–59. [Google Scholar] [CrossRef]
  25. Hess, S.; Börjesson, M. Understanding attitudes towards congestion pricing: A latent variable investigation with data from four cities. Transp. Lett. 2017, 11, 63–77. [Google Scholar] [CrossRef] [Green Version]
  26. Meyer de Freitas, L.; Schuemperlin, O.; Balac, M.; Ciari, F. Equity Effects of Congestion Charges: An Exploratory Analysis With Matsim. Transp. Res. Rec. 2017, 2670, 75–82. [Google Scholar] [CrossRef]
  27. Schaller, B. New York City’s congestion pricing experience and implications for road pricing acceptance in the United States. Transp. Policy 2010, 17, 266–273. [Google Scholar] [CrossRef] [Green Version]
  28. Kheirbek, I.; Haney, J.; Douglas, S.; Ito, K.; Matte, T. The contribution of motor vehicle emissions to ambient fine particulate matter public health impacts in New York City: A health burden assessment. Environ. Health 2016, 15, 1–14. [Google Scholar] [CrossRef] [Green Version]
  29. Wei, H.; Wang, X.; Yao, Z.; Liu, H.; Liang, S.; Yang, Y.J. Framework for integrating traffic-source emission estimates into sustainability analysis. In Proceedings of the CICTP 2012: Multimodal Transportation Systems-Convenient, Safe, Cost-Effective, Efficient-Proceedings of the 12th COTA International Conference of Transportation Professionals, Beijing, China, 3–6 August 2012. [Google Scholar]
  30. Hammadou, H.; Papaix, C. Policy packages for modal shift and CO2reduction in Lille, France. Transp. Res. Part D Transp. Environ. 2015, 38, 105–116. [Google Scholar] [CrossRef]
  31. Woodcock, J.; Givoni, M.; Morgan, A.S. Health Impact Modelling of Active Travel Visions for England and Wales Using an Integrated Transport and Health Impact Modelling Tool (ITHIM). PLoS ONE 2013, 8, e51462. [Google Scholar] [CrossRef]
  32. Bachman, W.; Sarasua, W.; Washington, S.; Guensler, R.; Hallmark, S.; Meyer, M.D. Integrating Travel Demand Forecasting Models with GIS to Estimate Hot Stabilized Mobile Source Emissions. In Proceedings of the Ninth Symposium on Geographic Information Systems for Transportation (GIS-T), Kansas City, MO, USA, 31 March 1996. [Google Scholar]
  33. Beckx, C.; Panis, L.I.; Vankerkom, J.; Janssens, D.; Wets, G.; Arentze, T. An integrated activity-based modelling framework to assess vehicle emissions: Approach and application. Env. Plan. B Plan. Des. 2009, 36, 1086–1102. [Google Scholar] [CrossRef] [Green Version]
  34. Hatzopoulou, M.; Miller, E.J.; Santos, B. Integrating Vehicle Emission Modeling with Activity-Based Travel Demand Modeling. Transp. Res. Rec. J. Transp. Res. Board 2008, 2011, 29–39. [Google Scholar] [CrossRef]
  35. Wei, H.; Zuo, T.; Liu, H.; Yang, Y.J. Integrating Land Use and Socioeconomic Factors into Scenario-Based Travel Demand and Carbon Emission Impact Study. Urban Rail Transit 2017, 3, 3–14. [Google Scholar] [CrossRef] [Green Version]
  36. Huang, W.; Hu, M. Estimation of the Impact of Traveler Information Apps on Urban Air Quality Improvement. Engineering 2018, 4, 224–229. [Google Scholar] [CrossRef]
  37. Karner, A.A.; Eisinger, D.S.; Niemeier, D.A. Near-roadway air quality: Synthesizing the findings from real-world data. Environ. Sci. Technol. 2010, 44, 5334–5344. [Google Scholar] [CrossRef] [PubMed]
  38. Dhondt, S.; Kochan, B.; Beckx, C.; Lefebvre, W.; Pirdavani, A.; Degraeuwe, B.; Bellemans, T.; Int Panis, L.; Macharis, C.; Putman, K. Integrated health impact assessment of travel behaviour: Model exploration and application to a fuel price increase. Environ. Int. 2013, 51, 45–58. [Google Scholar] [CrossRef] [PubMed]
  39. Gurram, S.; Stuart, A.L. Impacts of Transit-Oriented Compact-Growth on Air Pollutant Concentrations and Exposures in the Tampa Region; Center for Transportation and Community Health, University of South Florida, Tampa: Tampa, FL, USA, 2018; p. 27. [Google Scholar]
  40. Gustafsson, M.; Lindén, J.; Tang, L.; Forsberg, B.; Orru, H.; Åström, S.; Sjöberg, K. Quantification of Population Exposure to NO2, PM2.5 and PM10 and Estimated Health Impacts; Volume IVL Report; IVL Swedish Environmental Research Institute Ltd.: Stockholm, Sweden, 2018; ISBN 9789188787606. [Google Scholar]
  41. Poorfakhraei, A.; Tayarani, M.; Rowangould, G. Evaluating health outcomes from vehicle emissions exposure in the long range regional transportation planning process. J. Transp. Health 2017, 6, 501–515. [Google Scholar] [CrossRef]
  42. Shekarrizfard, M.; Faghih-Imani, A.; Tétreault, L.F.; Yasmin, S.; Reynaud, F.; Morency, P.; Plante, C.; Drouin, L.; Smargiassi, A.; Eluru, N.; et al. Regional assessment of exposure to traffic-related air pollution: Impacts of individual mobility and transit investment scenarios. Sustain. Cities Soc. 2017, 29, 68–76. [Google Scholar] [CrossRef]
  43. Tayarani, M.; Poorfakhraei, A.; Nadafianshahamabadi, R.; Rowangould, G.M. Evaluating unintended outcomes of regional smart-growth strategies: Environmental justice and public health concerns. Transp. Res. Part D Transp. Environ. 2016, 49, 280–290. [Google Scholar] [CrossRef]
  44. Vallamsundar, S.; Lin, J.; Konduri, K.; Zhou, X.; Pendyala, R.M. A comprehensive modeling framework for transportation-induced population exposure assessment. Transp. Res. Part D Transp. Environ. 2016, 46, 94–113. [Google Scholar] [CrossRef]
  45. Wichmann, J.; Lind, T.; Nilsson, M.A.M.; Bellander, T. PM2.5, soot and NO2 indoor-outdoor relationships at homes, pre-schools and schools in Stockholm, Sweden. Atmos. Environ. 2010, 44, 4536–4544. [Google Scholar] [CrossRef]
  46. Monn, C. Exposure assessment of air pollutants: A review on spatial heterogeneity and indoor/outdoor/personal exposure to suspended particulate matter, nitrogen dioxide and ozone. Atmos. Environ. 2001, 35, 1–32. [Google Scholar] [CrossRef]
  47. Martuzevicius, D.; Grinshpun, S.A.; Lee, T.; Hu, S.; Biswas, P.; Reponen, T.; LeMasters, G. Traffic-related PM2.5 aerosol in residential houses located near major highways: Indoor versus outdoor concentrations. Atmos. Environ. 2008, 42, 6575–6585. [Google Scholar] [CrossRef]
  48. ITF. The Social Impacts of Road Pricing; International Transport Forum Corporate Partnership Board: Paris, France, 2018. [Google Scholar]
  49. Shiftan, Y.; Ben-Akiva, M. A practical policy-sensitive, activity-based, travel-demand model. Ann. Reg. Sci. 2011, 47, 517–541. [Google Scholar] [CrossRef]
  50. West, J.; Börjesson, M.; Engelson, L. Accuracy of the Gothenburg congestion charges forecast. Transp. Res. Part A Policy Pract. 2016, 94, 266–277. [Google Scholar] [CrossRef]
  51. Leape, J. The London Congestion Charge. J. Econ. Perspect. 2007, 20, 157–176. [Google Scholar] [CrossRef] [Green Version]
  52. Menon, A.P.G. ERP in Singapore—A perspective one year on. Traffic Eng. Control 2000, 41, 40–45. [Google Scholar]
  53. Transport for London (TfL). Central London Congestion Charging: Impacts Monitoring—Sixth Annual Report. 2008. Available online: http://content.tfl.gov.uk/central-london-congestion-charging-impactsmonitoring-sixth-annual-report.pdf (accessed on 20 November 2019).
  54. Tvinnereim, E.; Haarstad, H.; Rødeseike, A.; Bugnion, V. Explaining public acceptance of congestion charging: The role of geographical variation in the Bergen case. Case Stud. Transp. Policy 2020, 8, 992–1001. [Google Scholar] [CrossRef]
  55. Gibson, M.; Carnovale, M. The effects of road pricing on driver behavior and air pollution. J. Urban Econ. 2015, 89, 62–73. [Google Scholar] [CrossRef] [Green Version]
  56. Isaksen, E.T.; Johansen, B.G. Congestion Pricing, Air Pollution, and Individual-Level Behavioral Responses. Available online: https://ssrn.com/abstract=3832230 (accessed on 22 April 2021).
  57. He, B.Y.; Zhou, J.; Ma, Z.; Wang, D.; Sha, D.; Lee, M.; Chow, J.Y.J.; Ozbay, K. A validated multi-agent simulation test bed to evaluate congestion pricing policies on population segments by time-of-day in New York City. Transp. Policy 2020, 101, 145–161. [Google Scholar] [CrossRef]
  58. Li, Y.; Sun, S. Prediction of Travel Mode Choice Behavior Preference under the Impacts of Congestion Pricing Based on ICLV Model. In Proceedings of the 20th COTA International Conference of Transportation Professionals, Xi’an, China, 14–16 August 2020; pp. 3241–3252. [Google Scholar]
  59. Tang, C.K. The Cost of Traffic: Evidence from the London Congestion Charge. J. Urban Econ. 2020, 121, 103302. [Google Scholar] [CrossRef]
  60. Takayama, Y. Who gains and who loses from congestion pricing in a monocentric city with a bottleneck? Econ. Transp. 2020, 24, 100189. [Google Scholar] [CrossRef]
  61. Waddell, P. Modeling Residential Location in UrbanSim. In Advances in Spatial Science; Pagliara, F., Preston, J., Simmonds, D., Eds.; Residential Location Choice. Advances in Spatial Science (The Regional Science Series); Springer: Berlin/Heidelberg, Germany, 2010. [Google Scholar] [CrossRef]
  62. Tayarani, M.; Nadafianshahamabadi, R.; Poorfakhraei, A.; Rowangould, G. Evaluating the cumulative impacts of a long range regional transportation plan: Particulate matter exposure, greenhouse gas emissions, and transportation system performance. Transp. Res. Part D Transp. Environ. 2018, 63, 261–275. [Google Scholar] [CrossRef]
  63. Gupta, S.; Kalmanje, S.; Kockelman, K.M. Road pricing simulations: Traffic, land use and welfare impacts for Austin, Texas. Transp. Plan. Technol. 2006, 29, 1–23. [Google Scholar] [CrossRef]
  64. Ferreira, F.; Gomes, P.; Carvalho, A.C.; Tente, H.; Monjardino, J.; Brás, H.; Pereira, P. Evaluation of the Implementation of a Low Emission Zone in Lisbon. J. Environ. Prot. 2012, 3, 1188–1205. [Google Scholar] [CrossRef] [Green Version]
  65. Wolff, H. Keep your clunker in the suburb: Low-emission zones and adoption of green vehicles. Econ. J. 2014, 124, F481–F512. [Google Scholar] [CrossRef]
  66. Coria, J.; Bonilla, J.; Grundström, M.; Pleijel, H. Air pollution dynamics and the need for temporally differentiated road pricing. Transp. Res. Part A Policy Pract. 2015, 75, 178–195. [Google Scholar] [CrossRef] [Green Version]
  67. Brown, V.; Moodie, M.; Carter, R. Congestion pricing and active transport—Evidence from five opportunities for natural experiment. J. Transp. Heal. 2015, 2, 568–579. [Google Scholar] [CrossRef]
  68. Cavallaro, F.; Giaretta, F.; Nocera, S. The potential of road pricing schemes to reduce carbon emissions. Transp. Policy 2018, 67, 85–92. [Google Scholar] [CrossRef]
  69. Rotaris, L.; Danielis, R.; Marcucci, E.; Massiani, J. The urban road pricing scheme to curb pollution in Milan, Italy: Description, impacts and preliminary cost-benefit analysis assessment. Transp. Res. Part A Policy Pract. 2010, 44, 359–375. [Google Scholar] [CrossRef]
  70. Green, C.P.; Heywood, J.S.; Navarro Paniagua, M. Did the London congestion charge reduce pollution? Reg. Sci. Urban Econ. 2020, 84, 103573. [Google Scholar] [CrossRef]
  71. York Bigazzi, A.; Rouleau, M. Can traffic management strategies improve urban air quality? A review of the evidence. J. Transp. Health 2017, 7, 111–124. [Google Scholar] [CrossRef]
  72. Barnes, J.H.; Chatterton, T.J.; Longhurst, J.W.S. Emissions vs exposure: Increasing injustice from road traffic-related air pollution in the United Kingdom. Transp. Res. Part D Transp. Environ. 2019, 73, 56–66. [Google Scholar] [CrossRef]
  73. Qian, X.; Wu, Y. Assessment for health equity of PM2.5 exposure in bikeshare systems: The case of Divvy in Chicago. J. Transp. Health 2019, 14, 100596. [Google Scholar] [CrossRef]
  74. Brinckerhoff, P. 2010 Base Year Update and Validation of the NYMTC; New York Best Practice Model (NYBPM) 2014. Available online: https://www.nymtc.org/LinkClick.aspx?fileticket=8WgNz6e-6dY%3D&portalid=0 (accessed on 20 October 2018).
  75. Cornell University. PPS-AQ Post Processor Software for Regional Conformity Analysis; Cornell University: Amherst, NY, USA, 2012. [Google Scholar]
  76. NYMTC. Available online: https://www.nymtc.org/DATA-AND-MODELING/Travel-Surveys/2010-11-Travel-Survey (accessed on 20 October 2018).
  77. Caliper Corporation, User’s Guide for the NYBPM 2G Model in TransCAD 6.0. 2012. Available online: https://www.caliper.com/press/transportationlibrary.htm (accessed on 1 November 2021).
  78. Brinckerhoff New York Best Practice Model (NYBPM) For Regional Travel Demand Forecasting. 2009. Available online: https://www.nymtc.org/Data-and-Modeling/New-York-Best-Practice-Model-NYBPM/Model-Background (accessed on 1 November 2021).
  79. Rowangould, G.M. A new approach for evaluating regional exposure to particulate matter emissions from motor vehicles. Transp. Res. Part D Transp. Environ. 2015, 34, 307–317. [Google Scholar] [CrossRef]
  80. Tayarani, M.; Rowangould, G. Estimating exposure to fine particulate matter emissions from vehicle traffic: Exposure misclassification and daily activity patterns in a large, sprawling region. Environ. Res. 2020, 182, 108999. [Google Scholar] [CrossRef] [PubMed]
  81. Transportation Conformity Guidance for Quantitative Hot-spot Analyses in PM2.5 and PM10 Nonattainment and Maintenance Areas; US EPA U.S. Environmental Protection Agency: Washington, DC, USA, 2015. Available online: https://www.fhwa.dot.gov/Environment/air_quality/conformity/policy_and_guidance/pmhotspotguidatt.cfm (accessed on 1 November 2021).
  82. Petros, K.; Briggs, S.L.K.; Leaderer, B.P. Source Apportionment of Indoor Aerosols in Suffolk and Onondaga Counties, New York. Environ. Sci. Technol. 1992, 26, 521–527. [Google Scholar]
  83. Cyrys, J.; Pitz, M.; Bischof, W.; Wichmann, H.E.; Heinrich, J. Relationship between indoor and outdoor levels of fine particle mass, particle number concentrations and black smoke under different ventilation conditions. J. Expo. Anal. Env. Epidemiol. 2004, 14, 275–283. [Google Scholar] [CrossRef] [PubMed] [Green Version]
  84. Qing, Y.M.; Turpin, B.J.; Korn, L.; Weisel, C.P.; Morandi, M.; Colome, S.; Junfeng, Z.; Stock, T.; Spektor, D.; Winer, A.; et al. Influence of ambient (outdoor) sources on residential indoor and personal PM2.5 concentrations: Analyses of RIOPA data. J. Expo. Anal. Env. Epidemiol. 2004, 15, 17–28. [Google Scholar]
  85. Long, C.M.; Suh, H.H.; Catalano, P.J.; Koutrakis, P. Using time- and size-resolved particulate data to ouantify indoor penetration and deposition behavior. Environ. Sci. Technol. 2001, 35, 2089–2099. [Google Scholar] [CrossRef] [PubMed]
  86. Thatcher, T.L.; Layton, D.W. Deposition, resuspension, and penetration of particles within a residence. Atmos. Environ. 1995, 29, 1487–1497. [Google Scholar] [CrossRef]
  87. Thornburg, J.; Ensor, D.S.; Rodes, C.E.; Lawless, P.A.; Sparks, L.E.; Mosley, R.B. Penetration of Particles into Buildings and Associated Physical Factors. Part I: Model Development and Computer Simulations. Aerosol Sci. Technol. 2001, 34, 284–296. [Google Scholar] [CrossRef]
  88. Koontz, M.D.; Rector, H. Estimation of Distributions for Residential Air Exchange Rates: Final Report; Environmental Protection Agency, Office of Pollution Prevention and Toxics: Washington, DC, USA, 1995.
  89. Jung, K.H.; Bernabé, K.; Moors, K.; Yan, B.; Chillrud, S.N.; Whyatt, R.; Camann, D.; Kinney, P.L.; Perera, F.P.; Miller, R.L. Effects of floor level and building type on residential levels of outdoor and indoor polycyclic aromatic hydrocarbons, black carbon, and particulate matter in New York City. Atmosphere 2011, 2, 96–109. [Google Scholar] [CrossRef] [PubMed] [Green Version]
  90. Gu, Z.; Liu, Z.; Cheng, Q.; Saberi, M. Congestion pricing practices and public acceptance: A review of evidence. Case Stud. Transp. Policy 2018, 6, 94–101. [Google Scholar] [CrossRef]
  91. Baghestani, A.; Tayarani, M.; Allahviranloo, M.; Gao, H.O. Evaluating the traffic and emissions impacts of congestion pricing in New York city. Sustainability 2020, 12, 3655. [Google Scholar] [CrossRef]
  92. Boldo, E.; Medina, S.; LeTertre, A.; Hurley, F.; Mücke, H.G.; Ballester, F.; Aguilera, I.; Eilstein, D. Apheis: Health impact assessment of long-term exposure to PM2.5 in 23 European cities. Eur. J. Epidemiol. 2006, 21, 449–458. [Google Scholar] [CrossRef] [PubMed]
Figure 1. Integrated modeling framework.
Atmosphere 12 01458 g001
Figure 2. Meteorological data stations.
Atmosphere 12 01458 g002
Figure 3. Splitting the work duration of employees into 1-h intervals.
Atmosphere 12 01458 g003
Figure 4. Average hourly PM2.5 concentration over TAZs.
Atmosphere 12 01458 g004
Figure 5. Study area and toll values for cordon pricing scenarios.
Atmosphere 12 01458 g005
Figure 6. Statistical analysis of the target group: (a) work start time distribution, (b) employee × hour distribution.
Atmosphere 12 01458 g006
Figure 7. Spatial distribution of employees × hour across the study area.
Atmosphere 12 01458 g007
Figure 8. Pricing scenario impact on PM2.5 concentration.
Atmosphere 12 01458 g008
Figure 9. Pricing scenario impact on Manhattan traffic conditions in the morning peak period (AM) [91].
Atmosphere 12 01458 g009
Figure 10. (a) Absolute and (b) percent change in average daily PM2.5 concentration.
Atmosphere 12 01458 g010
Figure 11. Sample locations of workplaces for evaluating indoor exposure.
Atmosphere 12 01458 g011
Table 1. Percentage change in Manhattan network measures in pricing scenarios.
MeasureVHDVMTLMCATS
(Restricted Access)
ATS
(Unrestricted Access)
Scenario2020 Low Toll−15.34−5.48−13.117.742.02
2020 High Toll−32.57−13.89−32.3417.867.07
Table 2. Population-weighted mean of employee exposure to PM2.5 emissions for pricing scenarios.
AreaNumber of TAZsNumber of Employees × Hour Population-Weighted Mean Exposure
2020 Base2020 Low Toll2020 High Toll
Manhattan CBD165313410.78030.60510.5587
(−22%)(−28%)
Upper Manhattan17069360.57340.54550.5349
(−5%)(−7%)
Total335382770.63890.59430.5544
(−7%)(−13%)
Table 3. Employee indoor exposure to PM2.5 emissions for pricing scenarios (single employee 9–17).
AreaIndoor Exposure (µg/m3)
2020 Base2020 Low Toll2020 High Toll
Manhattan CBD3.13393.02912.9189
Upper Manhattan0.85870.81140.7828
Publisher’s Note: MDPI stays neutral with regard to jurisdictional claims in published maps and institutional affiliations.

