Article

Improving Air Quality Standards in Europe: Comparative Analysis of Regional Differences, with a Focus on Northern Italy

1
Environmental Protection and Research Agency of Piedmont (Arpa Piemonte), 10135 Torino, Italy
2
Department of Chemistry, University of Torino, 10125 Torino, Italy
3
Department of Environmental Engineering, Turin Polytechnic, 10129 Torino, Italy
*
Author to whom correspondence should be addressed.
Submission received: 18 March 2022 / Revised: 10 April 2022 / Accepted: 14 April 2022 / Published: 19 April 2022
(This article belongs to the Collection Measurement of Exposure to Air Pollution)

Abstract

:
The study reports a consistent comparison of emission inventories, concentration trends, and PM source apportionment in different European regions and, mostly, a thorough investigation of meteorological parameters influencing atmospheric pollutants’ dispersion. The study focuses on the reasons why Northern Italy still has difficulties complying with EU air quality standards for PM10 and NO2, despite strong emission reductions. The study demonstrates that, in the colder seasons, wind speed, PBL height, and atmospheric pressure in the Po basin are three to five times less efficient at diluting and dispersing pollutants than those occurring in regions north of the Alps. Since air quality standards aim at countering health impacts, it is advisable to consider atmospheric particulate toxicity in addition to PM10/PM2.5 mass concentration as a limit value. A discussion is reported about PM toxicity factors depending on source-specific aerosols and PM composition. We obtained PM toxicity factors that can vary by 10 times (according to carbonaceous content) across Europe, suggesting that, even at the same mass concentration, the effects of PM10/PM2.5 on human health are significantly variable. Modern PM source apportionment and reliable toxicity and epidemiological analyses represent the correct tools to build a new consistent health metric for ambient PM.

Graphical Abstract

1. Introduction

The report ‘Air quality in Europe’ of 2020 by the European Environmental Agency [1] shows that better air quality has led to a significant reduction in premature deaths over the past decade in Europe.
Between 2005 and 2019, according to the commitments of the National Emission Ceilings Directive, emissions of many pollutants declined considerably in the EU-27 Member States: sulfur oxide (SOx) emissions by 76%, nitrogen oxides (NOx) by 42%, non-methane volatile organic compounds (NMVOCs) by 29%, and particulate matter (PM2.5) by 29%. The reductions have been strongly addressed by sector-specific EU legislation, such as the Industrial Emissions Directive, the Large Combustion Plants Directive, and Euro standards for vehicles. NH3 emissions were also reduced, but by only 8% overall, meaning that agriculture should still improve its environmental performance [2].
Considering the seven most populous countries in the EU (France, Germany, Italy, the Netherlands, Poland, Romania, and Spain), from 2005 to 2019, Italy shows the second-best mean emissive improvement (−39%) after France (−44%), whereas Poland and Germany reached much lower reductions (respectively, −26% and −27%). Table S1 in Supplementary Materials shows the commented data.
Despite the efforts made to reduce emissions in the EU, Bulgaria, Croatia, Czechia, Italy, Poland, and Romania still exceeded the European Union’s limit value from EU Air Quality Directives 2008/50/EC and 2004/107/EC for fine particulate matter (PM2.5) in 2018, and only four countries in Europe—Estonia, Finland, Iceland and Ireland—had fine PM concentrations below the World Health Organization’s (WHO) stricter guideline values.
The European Environmental Agency calculates the percentage of urban population exposed to air pollutant concentrations above EU air quality standards for all EU countries [3]. In Italy, in 2018, the percentage of the urban population exposed to a concentration above PM10 EU daily limit value (50 µg/m3 not to be exceeded for more than 35 days per year, that is 90.41 percentile of daily average in a calendar year) in 2018 is still around 34.4%, 1.5% for PM2.5 annual limit value (25 μg/m3) and 7.3% for NO2 annual limit value (40 μg/m3).
In particular, the Po Valley, located in Northern Italy at the foot of the Alps, is characterized by a high density of anthropogenic emissions and the frequent occurrence of stagnant weather conditions. The area is known to be a “hot spot” for air quality, where pollutant levels are still challenging despite constant reductions in air pollutant emissions in the last decade [4]. The Po basin is made up of four big Italian regions, Piedmont, Lombardy, Emilia Romagna, and Veneto, with around 23.5 million inhabitants; the main features of this area are strong industrialization and intensive farming and agriculture, producing 48% of Gross Domestic Product (GDP) of Italy in 2017. The four regions together emit 327 kt/y of NOx, 237 kt/y of ammonia, 60 kt/y of PM10 and 50 kt/y of PM2.5, and 36 kt/y of SO2.
Because of the morphological characteristics of the Po Valley, which is closed on three sides by the Alps and Apennines, pollutants’ background concentrations remain high for long periods during the cold season, with a large part of the particulate matter being due to secondary production [5,6,7]. The Po basin represents the largest European area, characterized by geographical and meteorological adverse conditions that caused the partial failure of air quality remediation policies, the so-called regional Air Quality Plans, in the last two decades. Indeed, the concentrations of PM10 strongly decreased in the last twenty years, but, although reduced to a quarter of what they measured in 2000, they still do not comply with the air quality limits in some agglomerations and areas [8].
In 2013, the regional governments of the area signed the first Po Valley Agreement, aiming at developing and coordinating short and long-term measures to improve the air quality of the Po Valley, focusing their actions on biomass domestic burning, the transportation of goods and passengers, and agriculture. In 2017, a second agreement was approved, reinforcing the actions to reduce emissions.
Nonetheless, on 10 November 2020 (case C-644/18), the Court of Justice of the European Union declared that the Italian Republic failed to fulfill its obligations under the provisions of Article 13 of, in conjunction with Annex XI too, Directive 2008/50/EC of the European Parliament and of the Council of 21 May 2008 on ambient air quality and cleaner air for Europe by having systematically and continuously exceeded, from 2008 to 2017, the daily and annual limit values applicable to PM10 concentrations in specific areas, highlighting that the exceeding is “still in progress”. In the same sentence, the Court of Justice found that the Italian Republic has also failed to adopt appropriate measures to ensure compliance with the limit values for PM10 in all those zones and to ensure that the exceedance of the limit values is kept as short as possible.
Meanwhile, in December 2021, the European Commission started the revision of ambient air quality standards to better align with the new World Health Organization’s guidelines, published in September 2021 [9].
According to the latest news by the European Environment Agency [10], the vast majority of EU citizens are exposed to levels of pollutants that can cause damage to health: 97% of the urban population is exposed to levels of fine particulate matter higher than those indicated in the new WHO guidelines, 94% for nitrogen dioxide and 99% for ozone.
Within the described framework, it is advisable to investigate the real effectiveness of the measures to be taken to respect air quality limits in Northern Italy, focusing on the health effects of the main air pollutants. In the next sections, in-depth analyses of the regional emission inventories across EU, the influence of three key meteorological parameters on air quality, PM source apportionment, the role of secondary particulates, and the air quality trends observed during the COVID-19 lockdown in Italy will be reported. Then, a discussion about PM toxicity data and regulation standards is proposed as well.

2. Materials and Methods

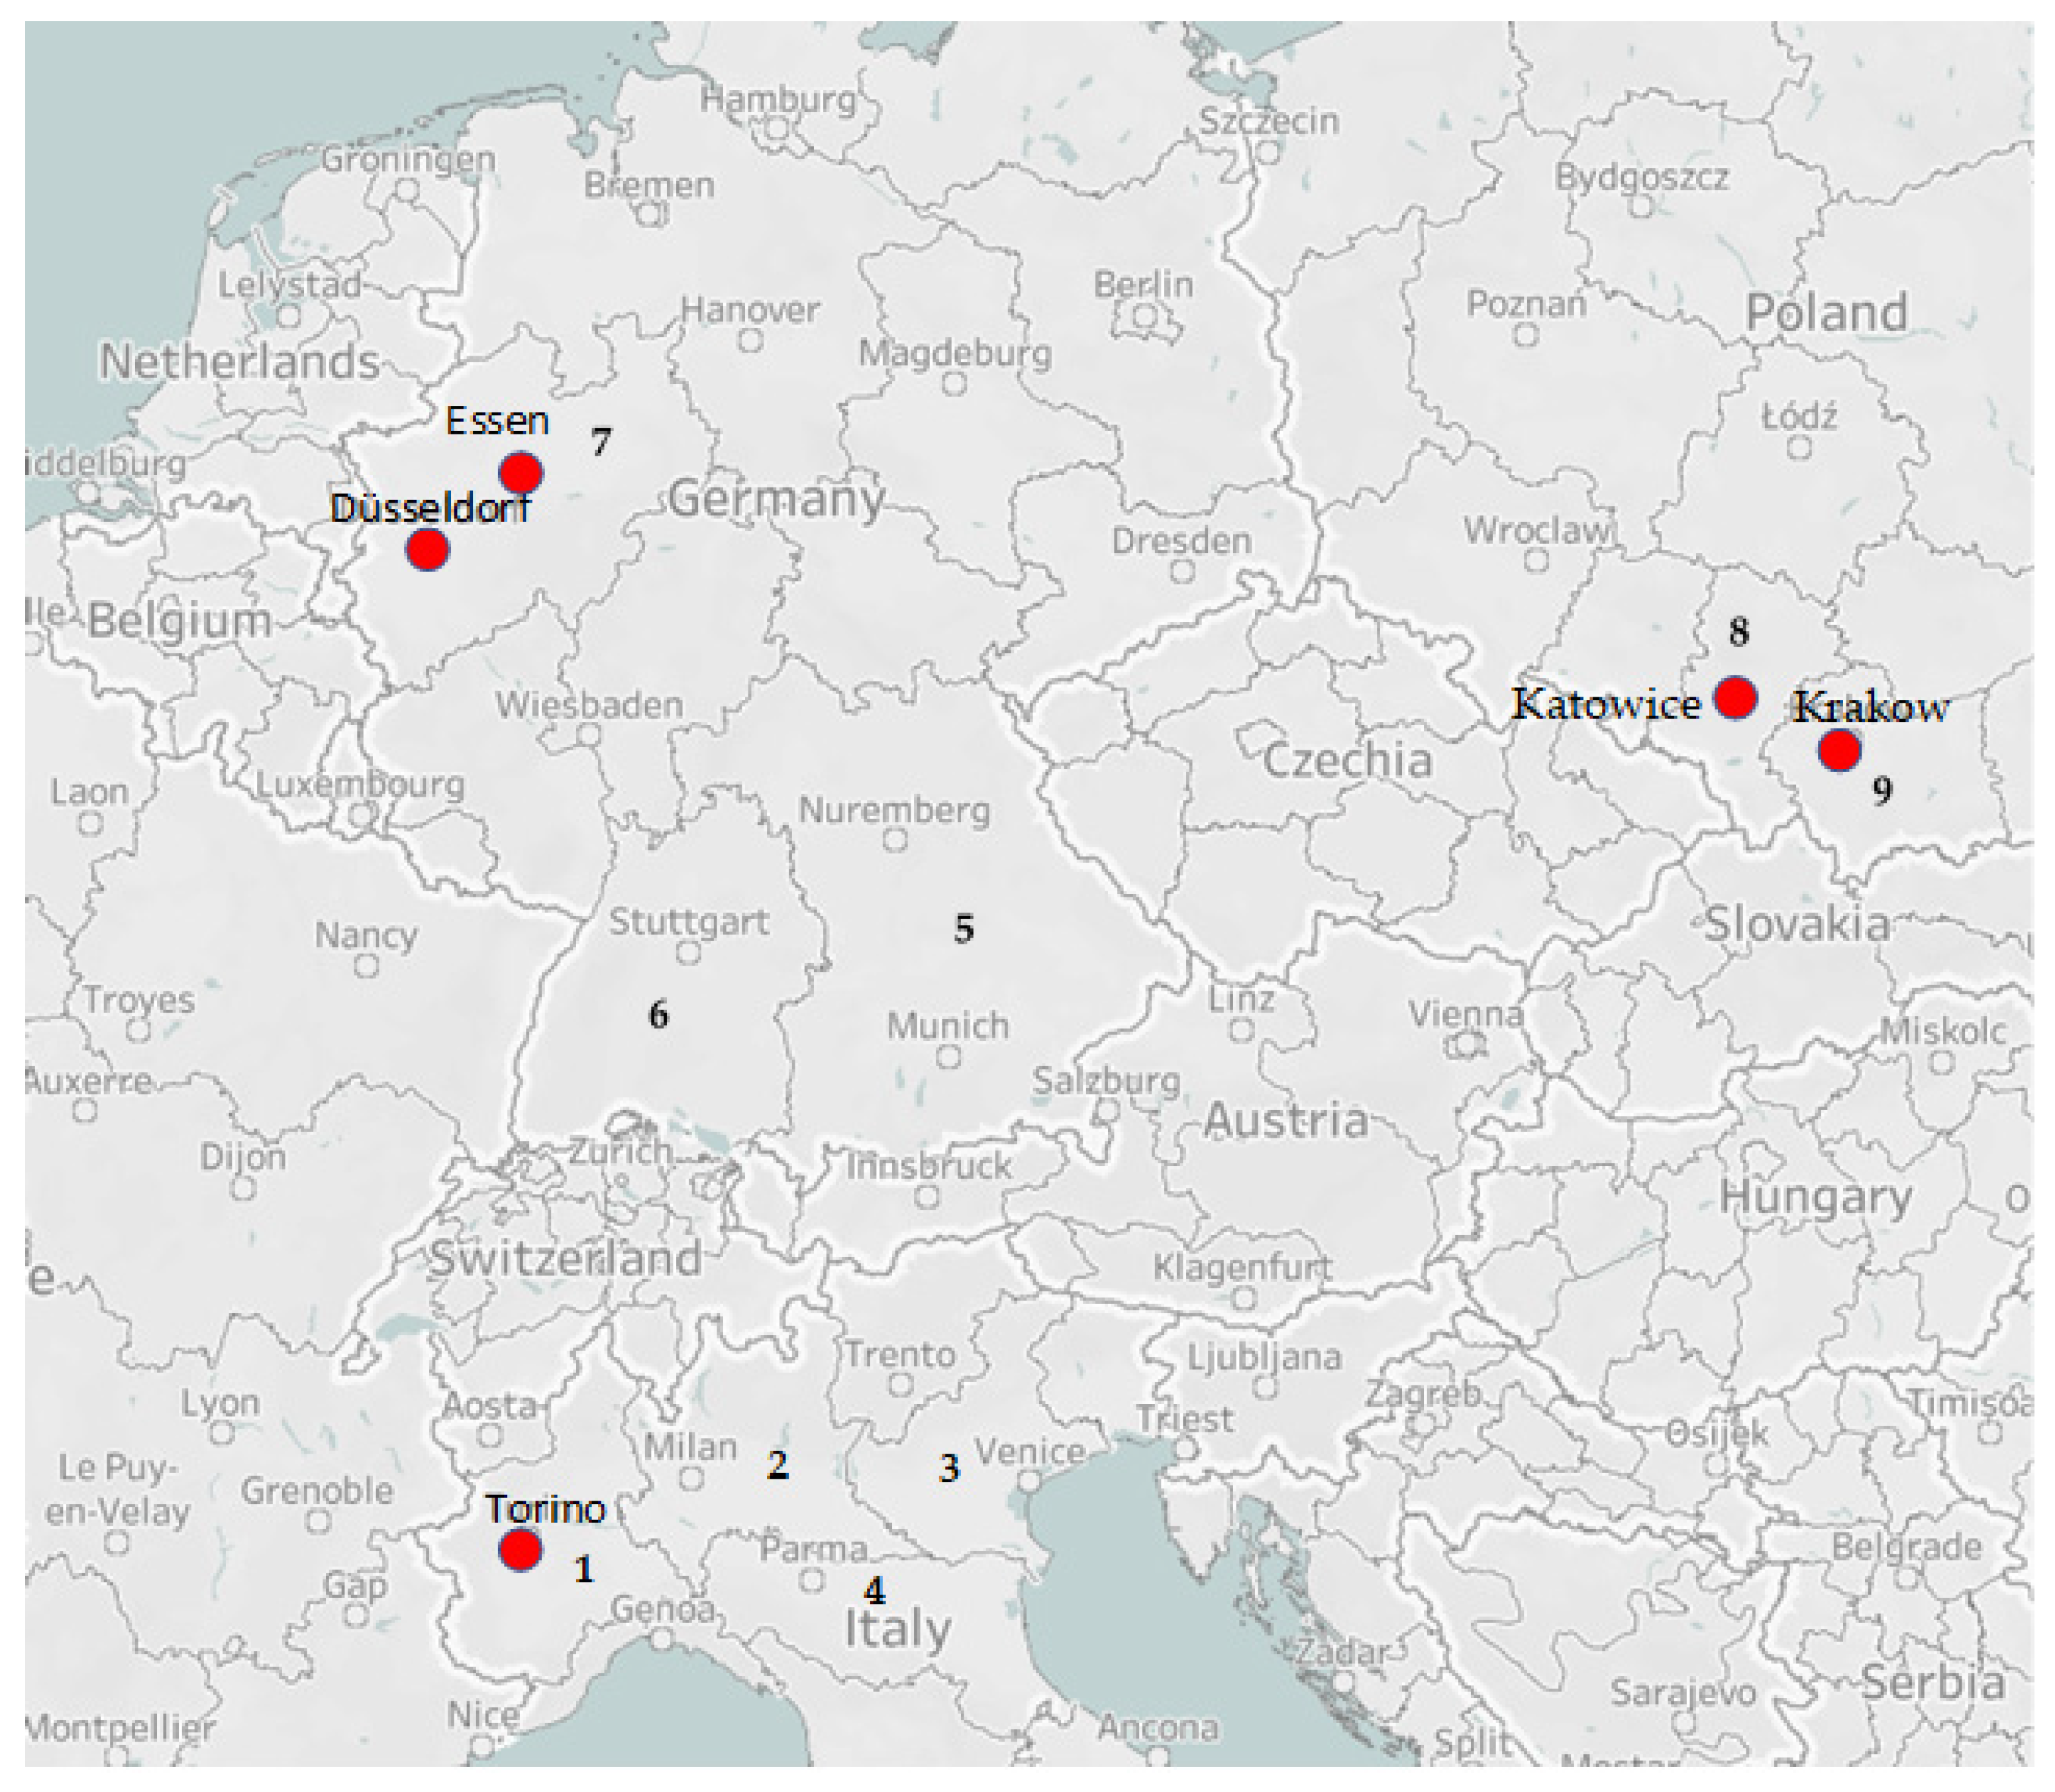
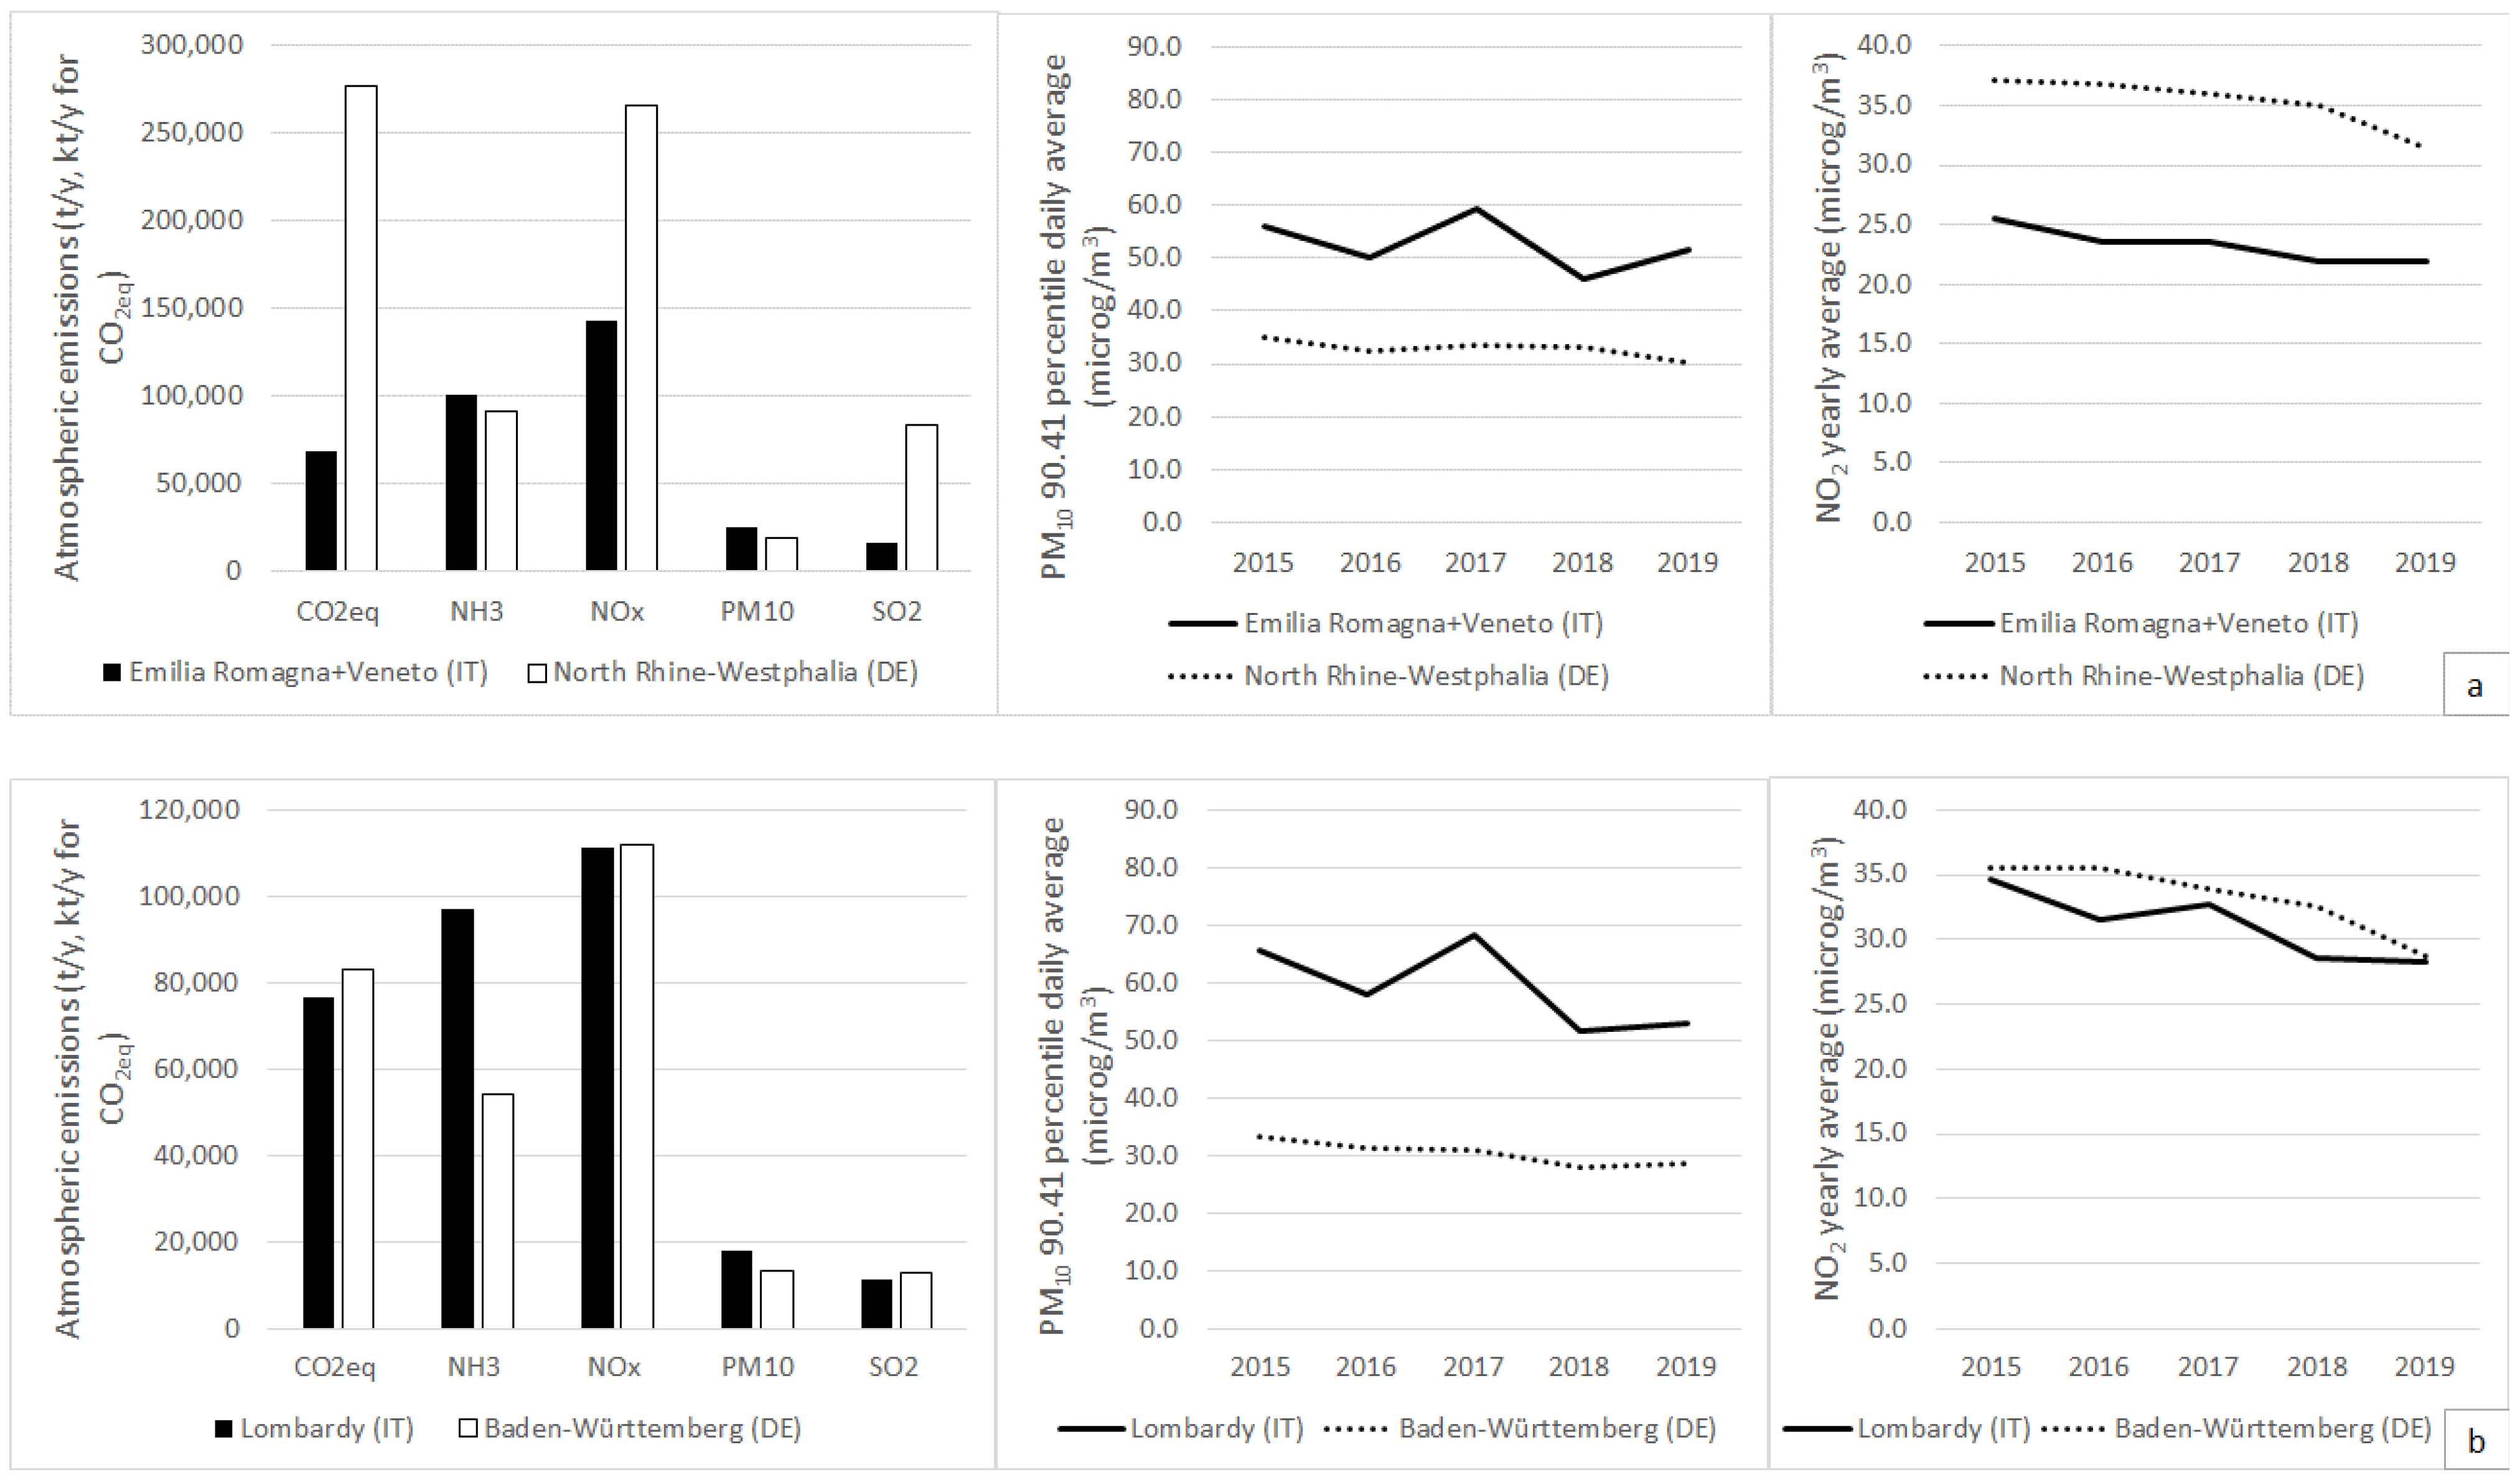
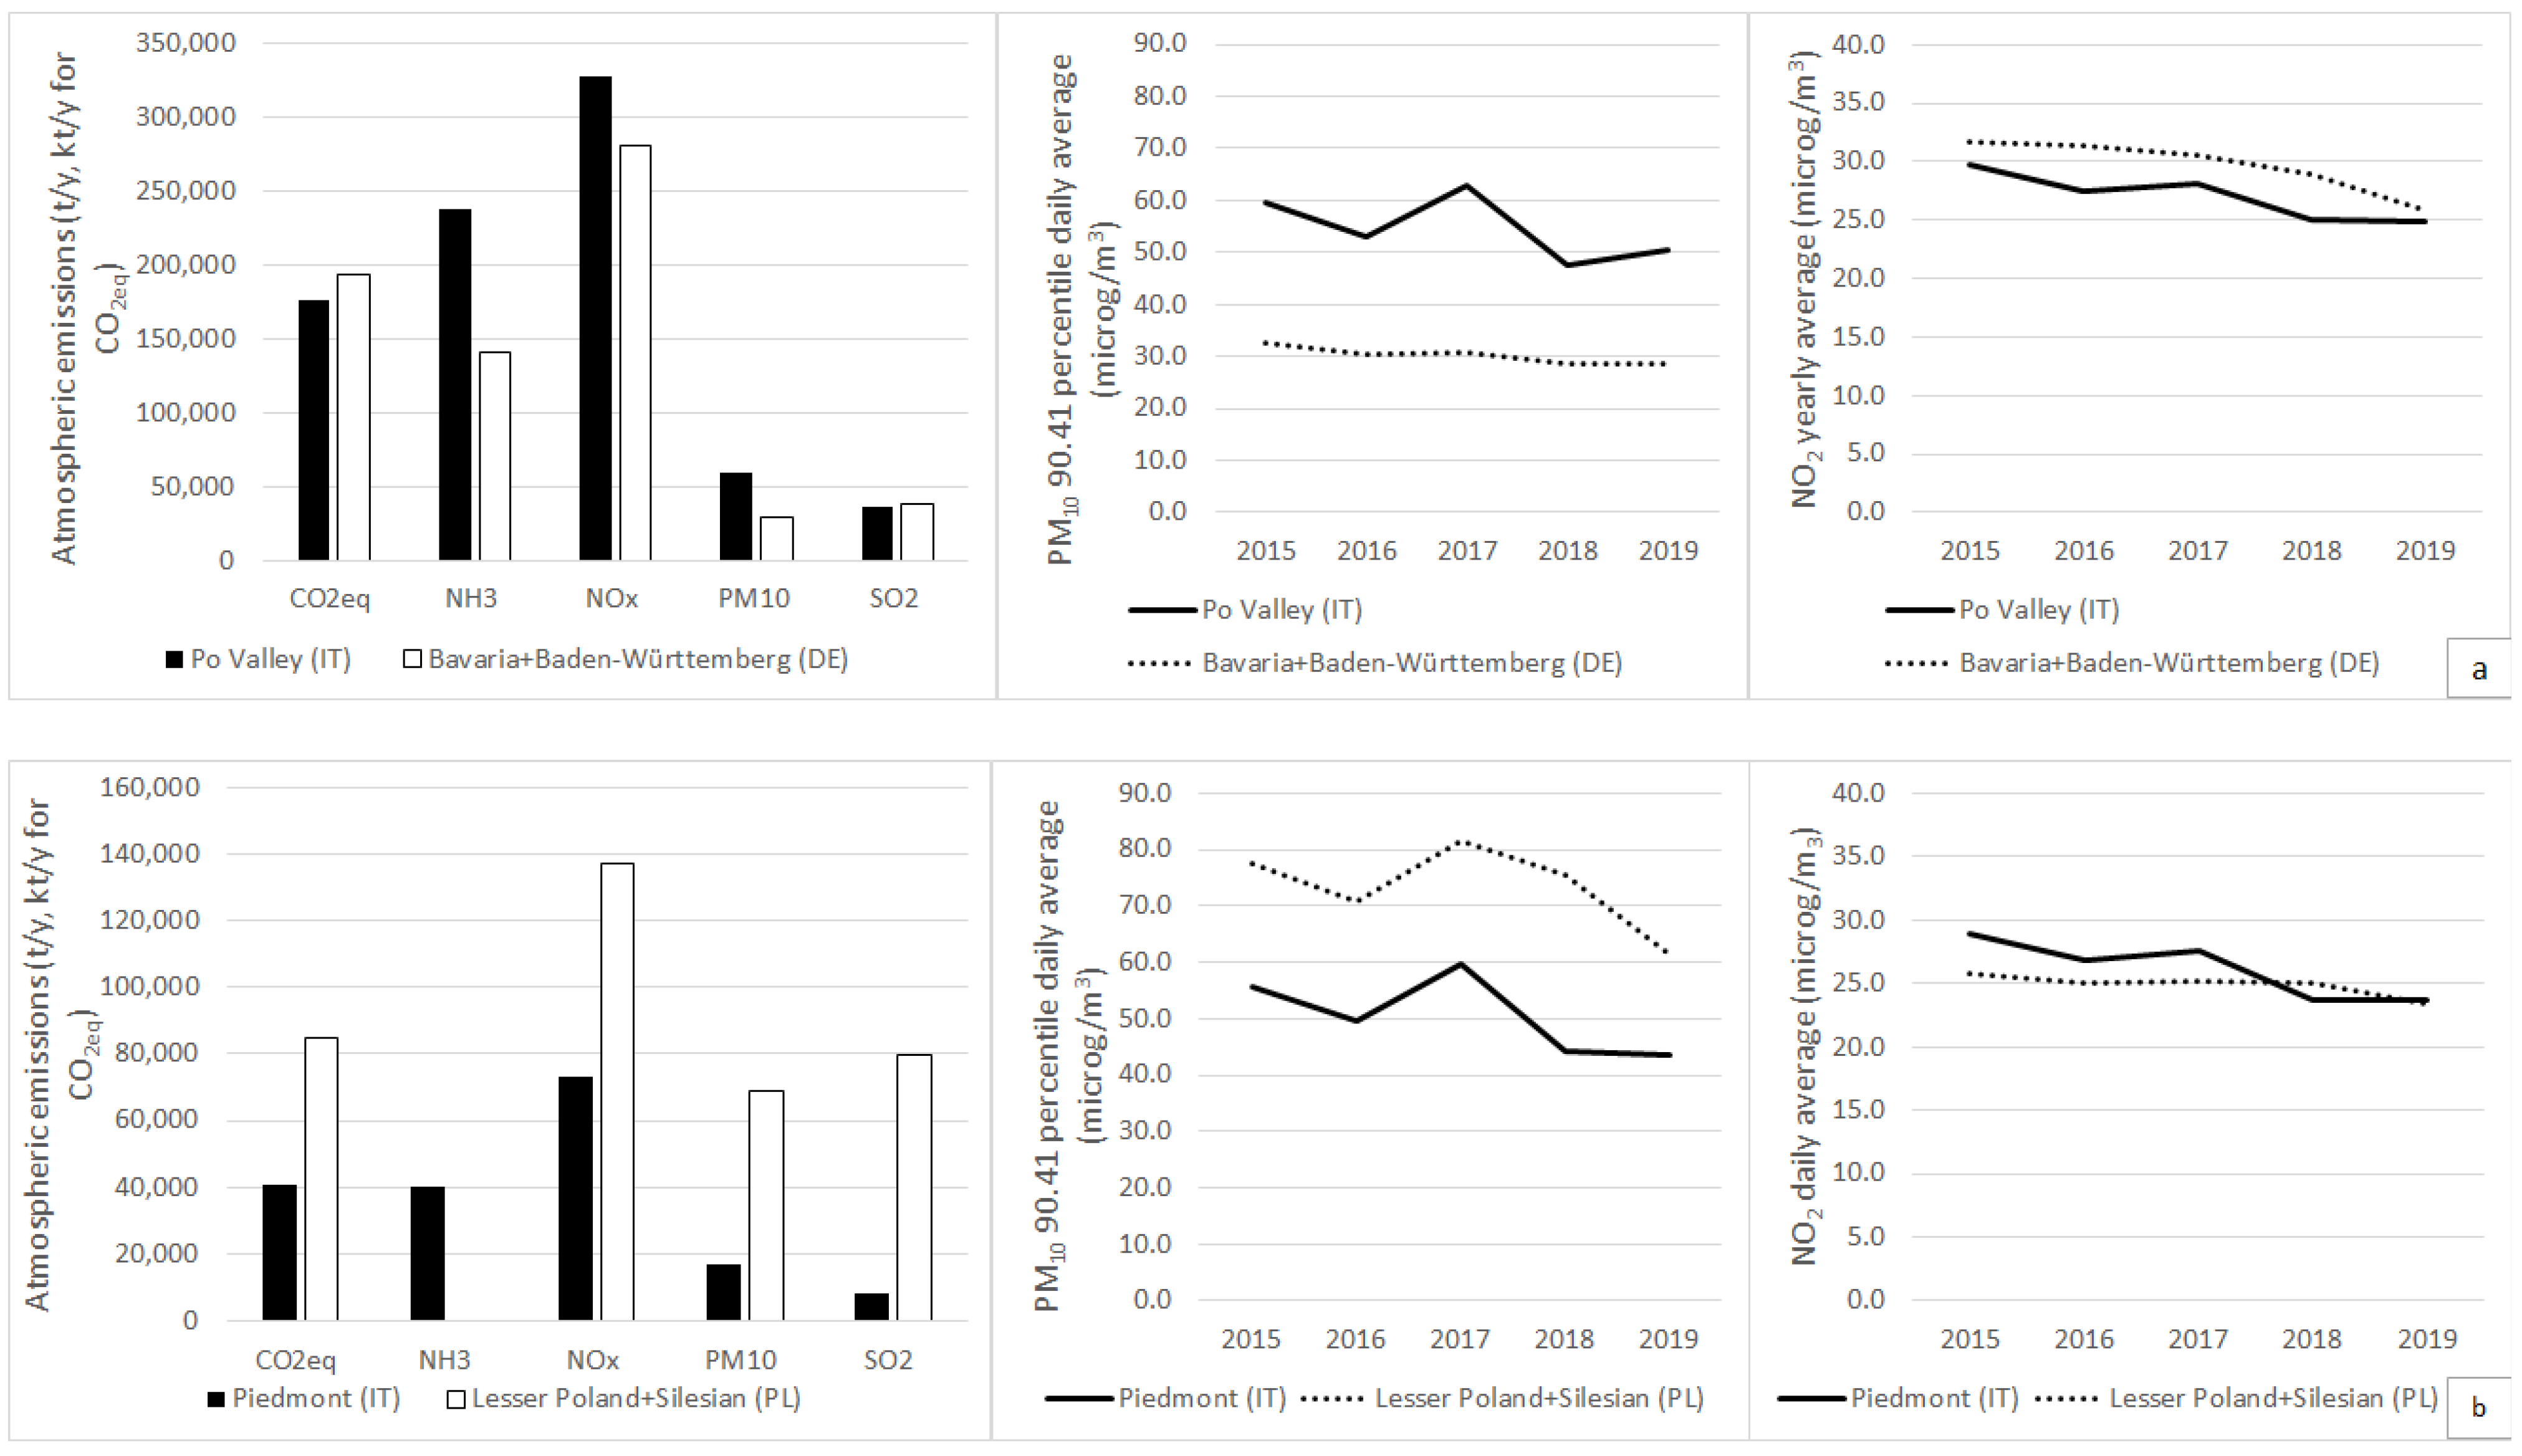
2.1. Emission Inventories and Air Quality Trends in EU

The first approach to address air quality problems consists of the analysis of emission inventories, referring to different areas. The European Union emission inventory report 1990–2018 by European Environmental Agency [11] highlights EU emission trends over 28 years for the main pollutants, nitrogen oxides (NOx), non-methane volatile organic compounds (NMVOCs), sulfur oxides (SOx), ammonia (NH3), carbon monoxide (CO), particulate matter (PM10 and PM2.5), heavy metals, persistent organic pollutants (POPs), and polycyclic aromatic hydrocarbons (PAH). In the described document, the national emission contributions of EU Member States are identified as well.
However, to develop coherent comparisons between different areas, emission inventories at the regional level are also required. To collect these data, regional emission inventories for regions in Northern Italy, North Rhine-Westphalia (NRW) in Northwestern Germany (the most populous State in Germany), Baden-Württemberg and Bavaria in Southern Germany, Lesser Poland, and Silesian in Southern Poland, have been downloaded from the official regional Administrations sites or taken from national studies [12,13,14,15,16,17,18,19,20]. All inventories are recent and have been elaborated according to EEA European guidelines [21]. Figure 1 reports the studied European regions.
When evaluating air quality, it is important to understand the difference between primary pollutants, such as NOx, SOx, or PM, and secondary pollutants, which are secondary PM (organic and inorganic secondary aerosols) and O3. An interesting methodology report [22] developed a set of aerosol formation factors, which are fractions of gaseous primary pollutants converted to particulate matter: the author set the factors equal to 0.88 for NOx, 0.54 for SOx, and 0.64 for NH3, whereas the contribution of VOC to the total PM10 emissions in EU was estimated to be less than 1.5%. Therefore, we focused our attention primarily on NOx, NH3, SO2 (gaseous precursor of PM), PM10, PM2.5 (where available), and CO2 equivalent emissions as an overall indicator of anthropization.
Emission inventory data together with population and surface in km2 of the studied European regions have been collected and reported in the Supplementary Materials (Table S2). Regions to compare have been chosen according to equivalent or comparable surfaces, even though population density can be quite different. We developed the following emissive comparisons:
  • North-Eastern Italy (regions Veneto and Emilia Romagna, equivalent to 9,289,720 inhabitants and 40,791 km2) vs. North Rhine-Westphalia (17,925,570 inhabitants and 34,084 km2);
  • Lombardy (9,964,993 inhabitants and 23,844 km2) vs. Baden-Württemberg (11,100,394 inhabitants and 35,751 km2);
  • Po Valley (regions Piedmont, Lombardy, Veneto and Emilia Romagna, equivalent to 23,527,923 inhabitants and 90,037 km2) vs. Southern Germany (regions Bavaria and Baden-Württemberg, with 24,225,131 inhabitants and 106,302 km2);
  • Piedmont (4,273,210 inhabitants and 25,402 km2) vs. Southern Poland (regions Lesser Poland and Silesian, equivalent to 7,928,954 inhabitants and 27,516 km2).
At the same time, official air quality data have been elaborated for the same areas where emission inventories were at disposal. We focused our attention on PM10 concentrations (90.41 percentile of daily concentration) and NO2 concentrations (yearly average), which are two critical pollutants for air quality. Five years of air quality statistics from 2015 to 2019 have been downloaded from the air quality statistics expert viewer by EEA official website [23]; 2020 has been avoided because of the influence of COVID-19 lockdowns on air quality. To be representative, PM10 and NO2 concentrations have been averaged over all the air quality stations operating within the reference area (rural, urban, and suburban sites).
From the same official database, air quality trends over the period 2001–2019 have been obtained for three urban-traffic and three urban-background stations of the cities of Torino (886,837 inhabitants in Piedmont, IT), Düsseldorf (619,294 inhabitants in North Rhine-Westphalia, DE), and Krakow (766,683 inhabitants in Lesser Poland, PL).

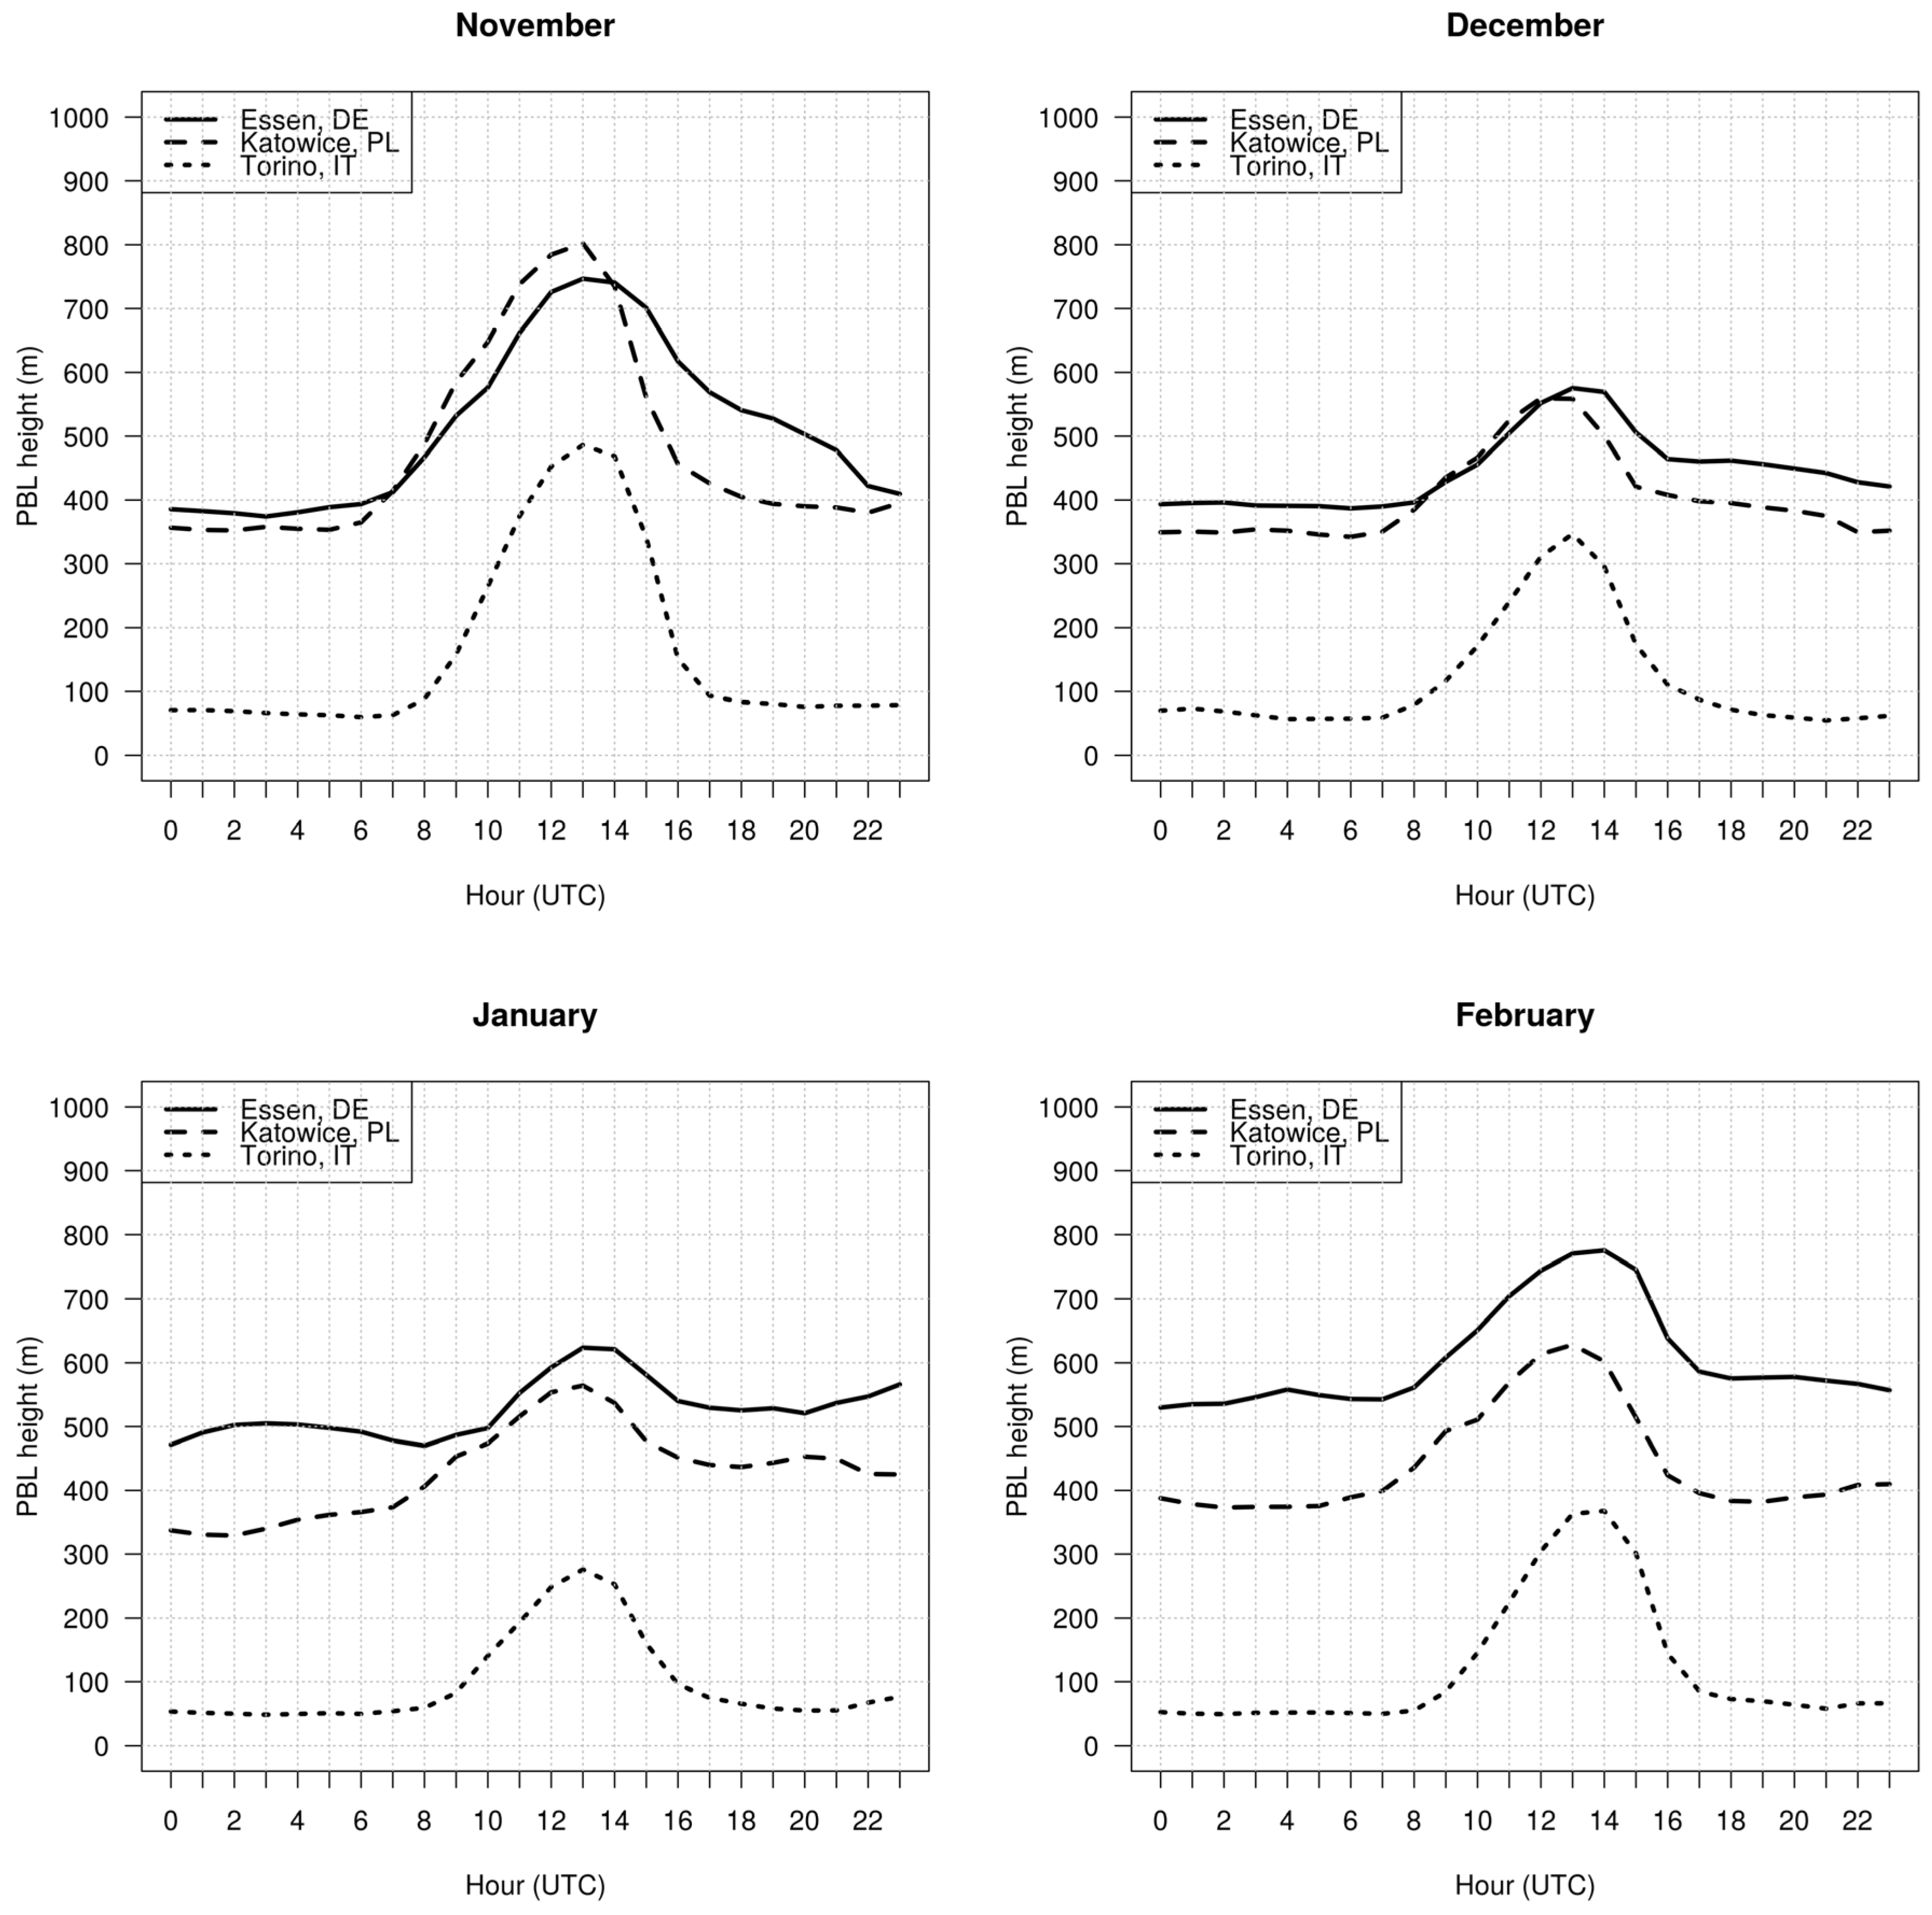
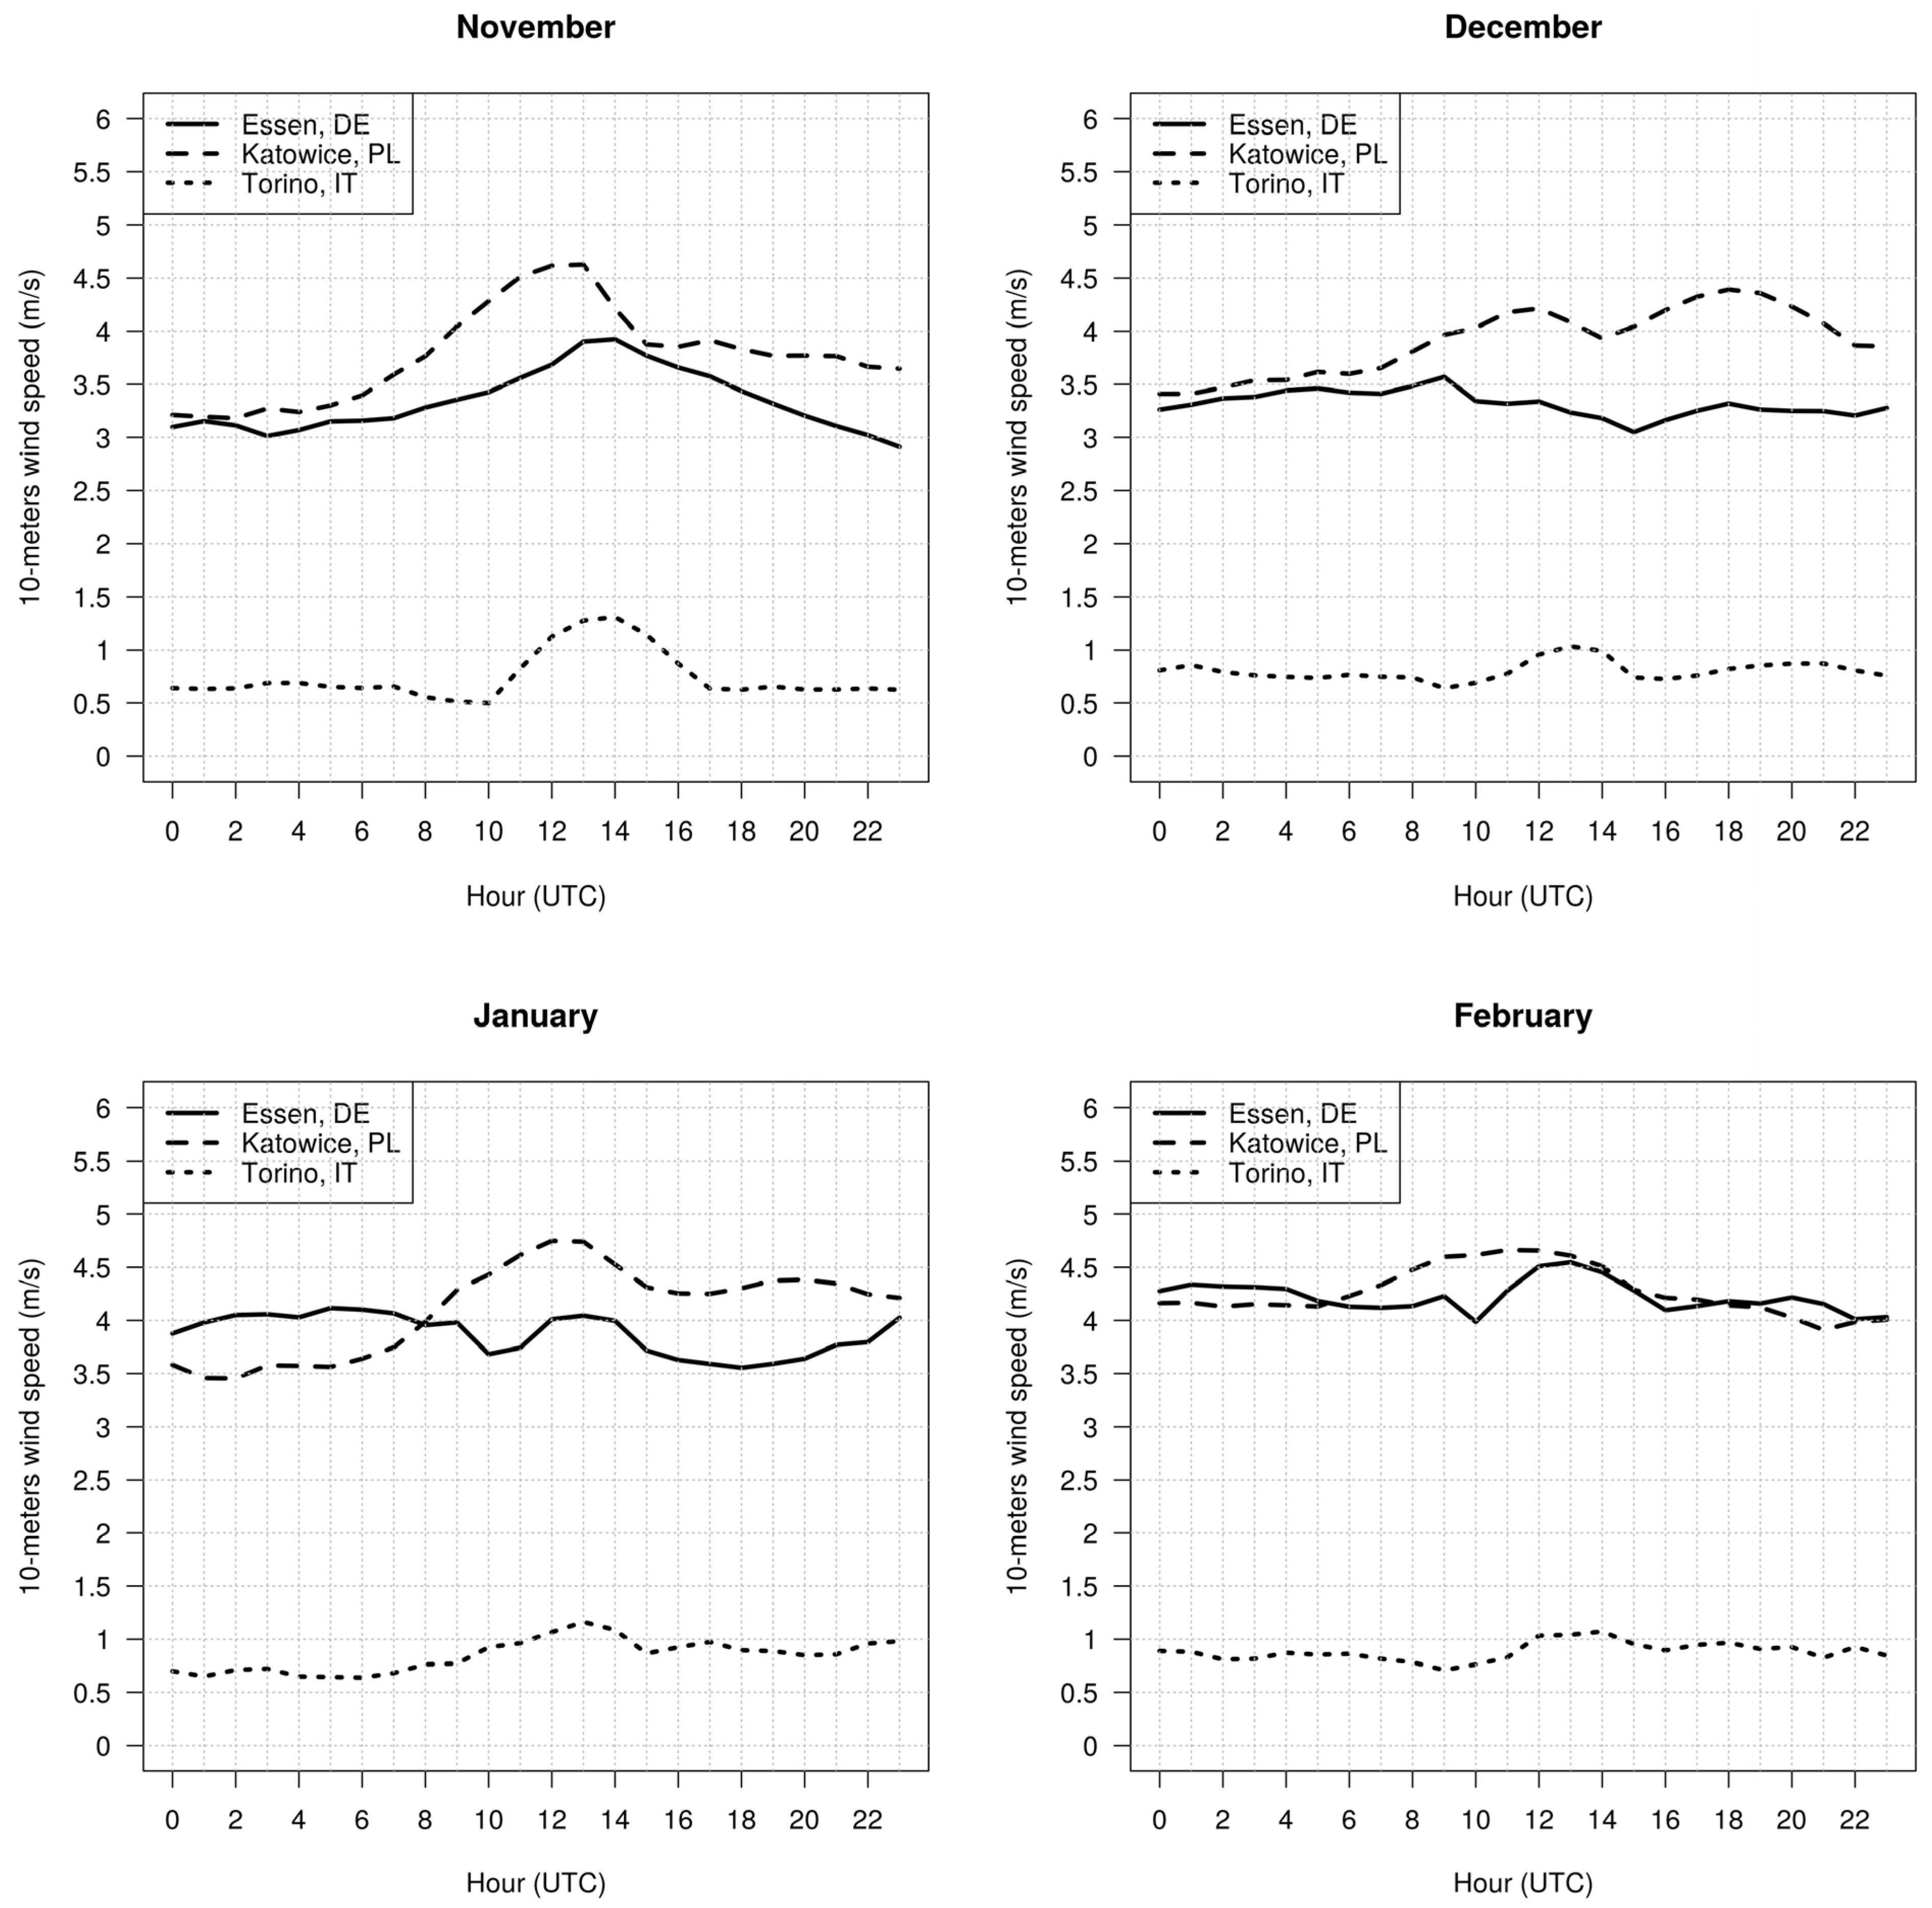
2.2. Parameters Influencing Pollutant Atmospheric Dispersion and Transport

Many meteorological parameters influence the dilution, dispersion, and transport of pollutants emitted into the atmosphere, including wind speed, wind direction, atmospheric pressure, and atmospheric stability. Atmospheric stability is, in turn, described by different meteorological parameters, such as the height of the planetary boundary layer (PBLH) or mixing height, stability class, vertical temperature gradient, solar radiation, etc. [24]. It is well-known that, when pollutant transformation mechanisms are not considered, the relationship between wind speed and pollutants’ concentration is inverse. The depth of PBL is crucial to determine near-surface atmospheric pollutant concentrations [25]. Indeed, PBLH determines the volume where emitted pollutants are diluted and dispersed, and therefore, it directly affects pollutants’ atmospheric concentrations. Daytime mixed-layer (ML) height acts as a capping over the convective boundary layer due to temperature inversion. Several studies have demonstrated a clear relationship between carbon dioxide and aerosol concentrations and ML depth through the entrainment processes [26,27,28,29].
The PBLH is influenced by surface topography, incoming solar radiation, temperature, and local winds. The planetary boundary layer can be 1–2 km deep, and it impacts not only air quality but also climate and weather. It changes throughout the day as the ground heats up and cools down; it is also a strongly seasonal parameter (during the winter the PBLH is lower). A higher PBL is generally better because emitted pollutants are more diluted; however, a higher PBL allows a greater dispersion of pollutants.
Critical conditions for air quality are, in most cases, related to the expansion of a high-pressure pattern; this way, besides wind speed and PBL height, mean sea level pressure is a parameter of interest when studying air quality [30].
To investigate meteorological parameters affecting air pollutants’ concentrations, long-term re-analysis data have been accessed. ERA5 is the fifth-generation ECMWF (European Centre for Medium-Range Weather Forecasts) atmospheric re-analysis of the global climate: combining observations with model data, re-analysis constitutes a globally complete and consistent dataset [31]. Spanning from 1979 to 2020, data are re-gridded to a regular latitude–longitude grid with 0.25° by 0.25° resolution. A complete overview for the ERA5 suite is available from ECMWF [32].
Here, the monthly average diurnal pattern of PBLH, atmospheric mean sea level pressure, and 10 m wind speed relating to Essen (7.0 E, 51.5 N—North Rhine-Westphalia, Germany), Torino (7.7 E, 45.0 N—Piedmont, Italy), and Katowice (19.0 E, 50.3 N—Silesian, Poland) have been obtained from Copernicus Climate Data Store [33]. The meteorological and dispersive characteristics of the three localities and their regions are compared focusing on the coldest months of the year, November–February, over the whole period (1979–2020).

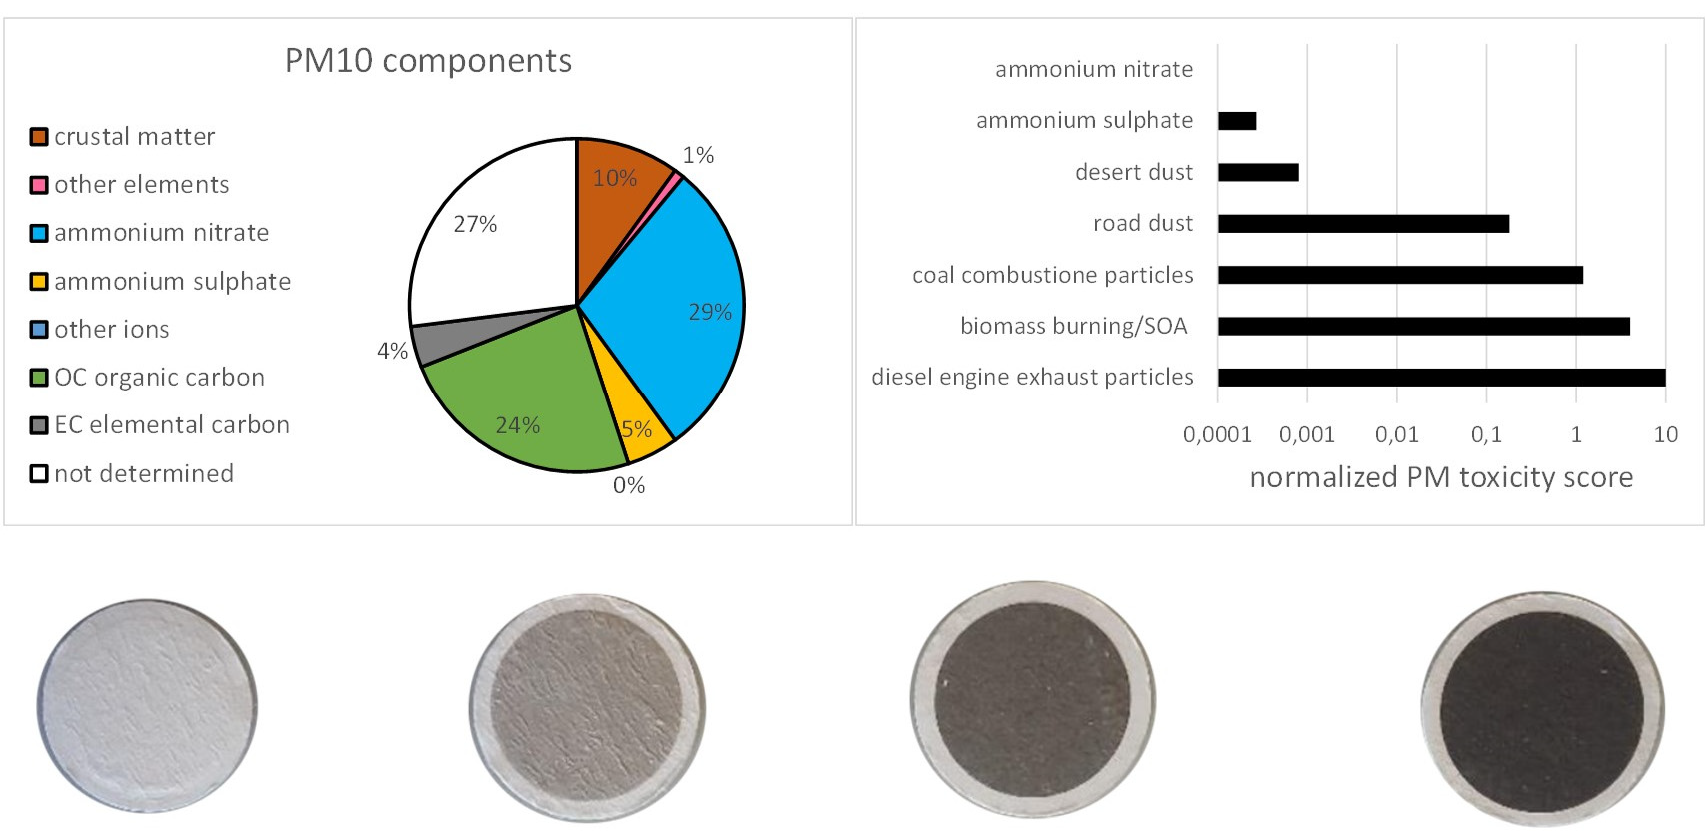
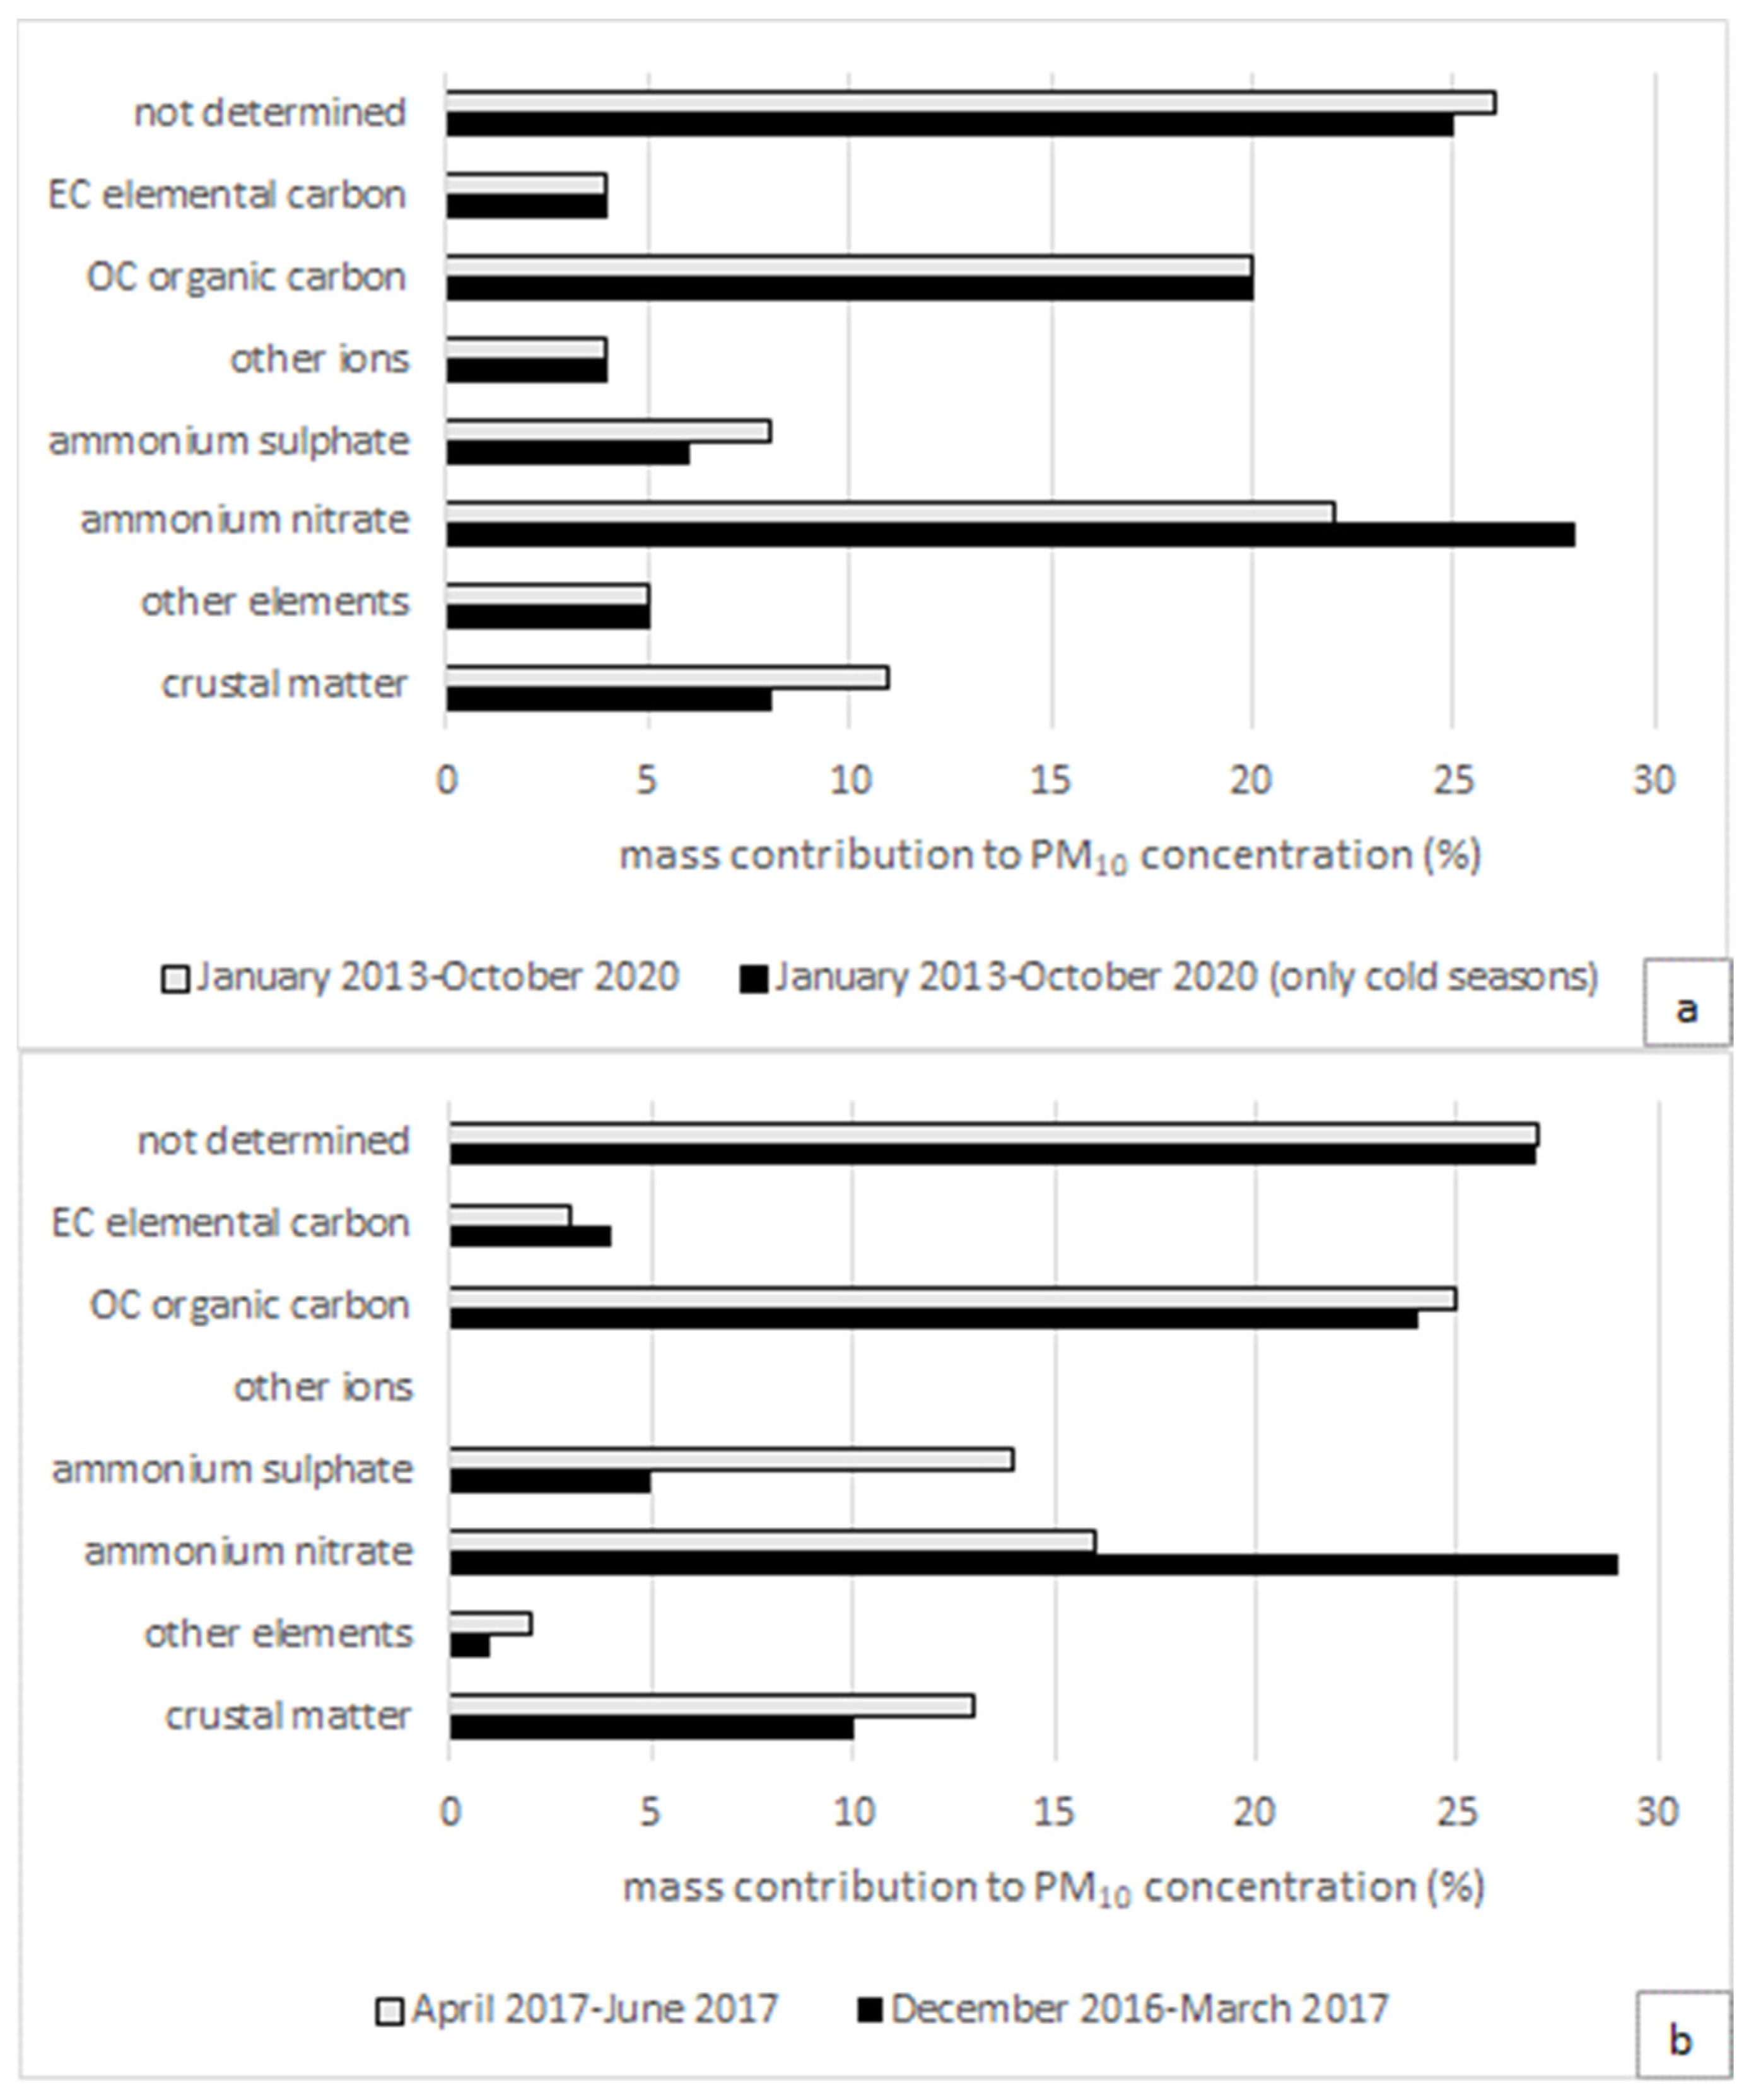
2.3. PM Source Apportionment in Northern Italy

The PM source apportionment (SA) represents the data collection and processing method that quantitatively determines the individual contributions to ambient air pollutant concentration, in our case, PM10 [34]. Among the different approaches that can be used, the “receptor” analytical approach allows to obtain estimates starting from the chemical composition of PM10 sampled at significant sites from the point of view of the objective, applying specific statistic techniques such as the Positive Matrix Factorization (PMF) by U.S. EPA.
The choice of the analytes to be quantified in PM10 is made by taking into account the need to define the main constituents of particulate as well as the tracer compounds of particular emissive sources (Levoglucosan for Biomass burning and Copper for traffic, for example). Cations (Na+, NH4+, K+, Mg2+) and anions (Cl, NO2, Br, NO3, PO43−, SO42−), elements (Al, Si, P, S, Cl, K, Ca, Ti, V, Cr, Mn, Fe, Ni, Cu, Zn, Br, Rb, Pb), the carbonaceous fraction (OC and EC, Organic and Elemental Carbon), and polycyclic aromatic hydrocarbons (PAHs) are usually determined for PM source apportionment.
For SA, the determination of ions (cations and anions) is crucial to estimate the amount of secondary inorganic aerosols (SIA): nitrates and sulfates come from combustion (industry, traffic, and heating), ammonium derives mainly from agriculture and animal intensive rearing.
Elemental carbon is a PM fraction containing only C, not bound to other elements; it is a primary pollutant emitted during the incomplete combustion of fossil fuels and biomass and can be emitted from natural and anthropogenic sources in the form of soot. In urban areas, it can be used as a tracer of internal combustion engines emissions.
Organic carbon (OC) includes many compounds with different volatilities; it is both a primary and secondary pollutant. The main sources of primary OC are the natural or anthropogenic combustion of biomass, fossil fuels (industry, transport, etc.), and biological material. The secondary OC can be formed by the photochemical oxidation of volatile precursors (VOC). OC includes a large set of compounds where tetravalent carbon is chemically bound to other atoms, hydrogen, oxygen, sulfur, nitrogen, phosphorus, chlorine, etc.
Lastly, the crustal oxide compounds (Al, Si, Ca, etc.) that can be found in PM10 are important to evaluate the resuspension contribution to PM pollution.
In the Po Valley, PM source apportionment has been carried out since 2013 in some specific sites such as the urban-background stations of Milano-Pascal or Bologna-Gobetti [35,36].
The source apportionment has been also carried out for the stations of Torino-Lingotto (urban-background) and Revello-Staffarda (rural) in Piedmont (N-W Italy), referring to the period December 2016–June 2017 [37]. In this case, the chemical analysis of the samples was followed by statistical pre-elaborations consisting of the characterization of soils in the monitoring sites, the calculation of enrichment factors, the study of the correlation between chemical parameters, cluster analyses, and attribution of uncertainty; after that, the EPA PMF 5.0 (positive matrix factorization) statistical model was applied based on the so-called fingerprint of the sources and their space–time variability, through the application of multivariate analysis techniques.
The analytical source apportionment developed for Piedmont (N-W Italy) represents a parallel technique strengthening the evaluations obtained from source apportionment modelling methods, starting from emission inventories and meteorological variables measured to simulate the chemical reactions taking place in the atmosphere.

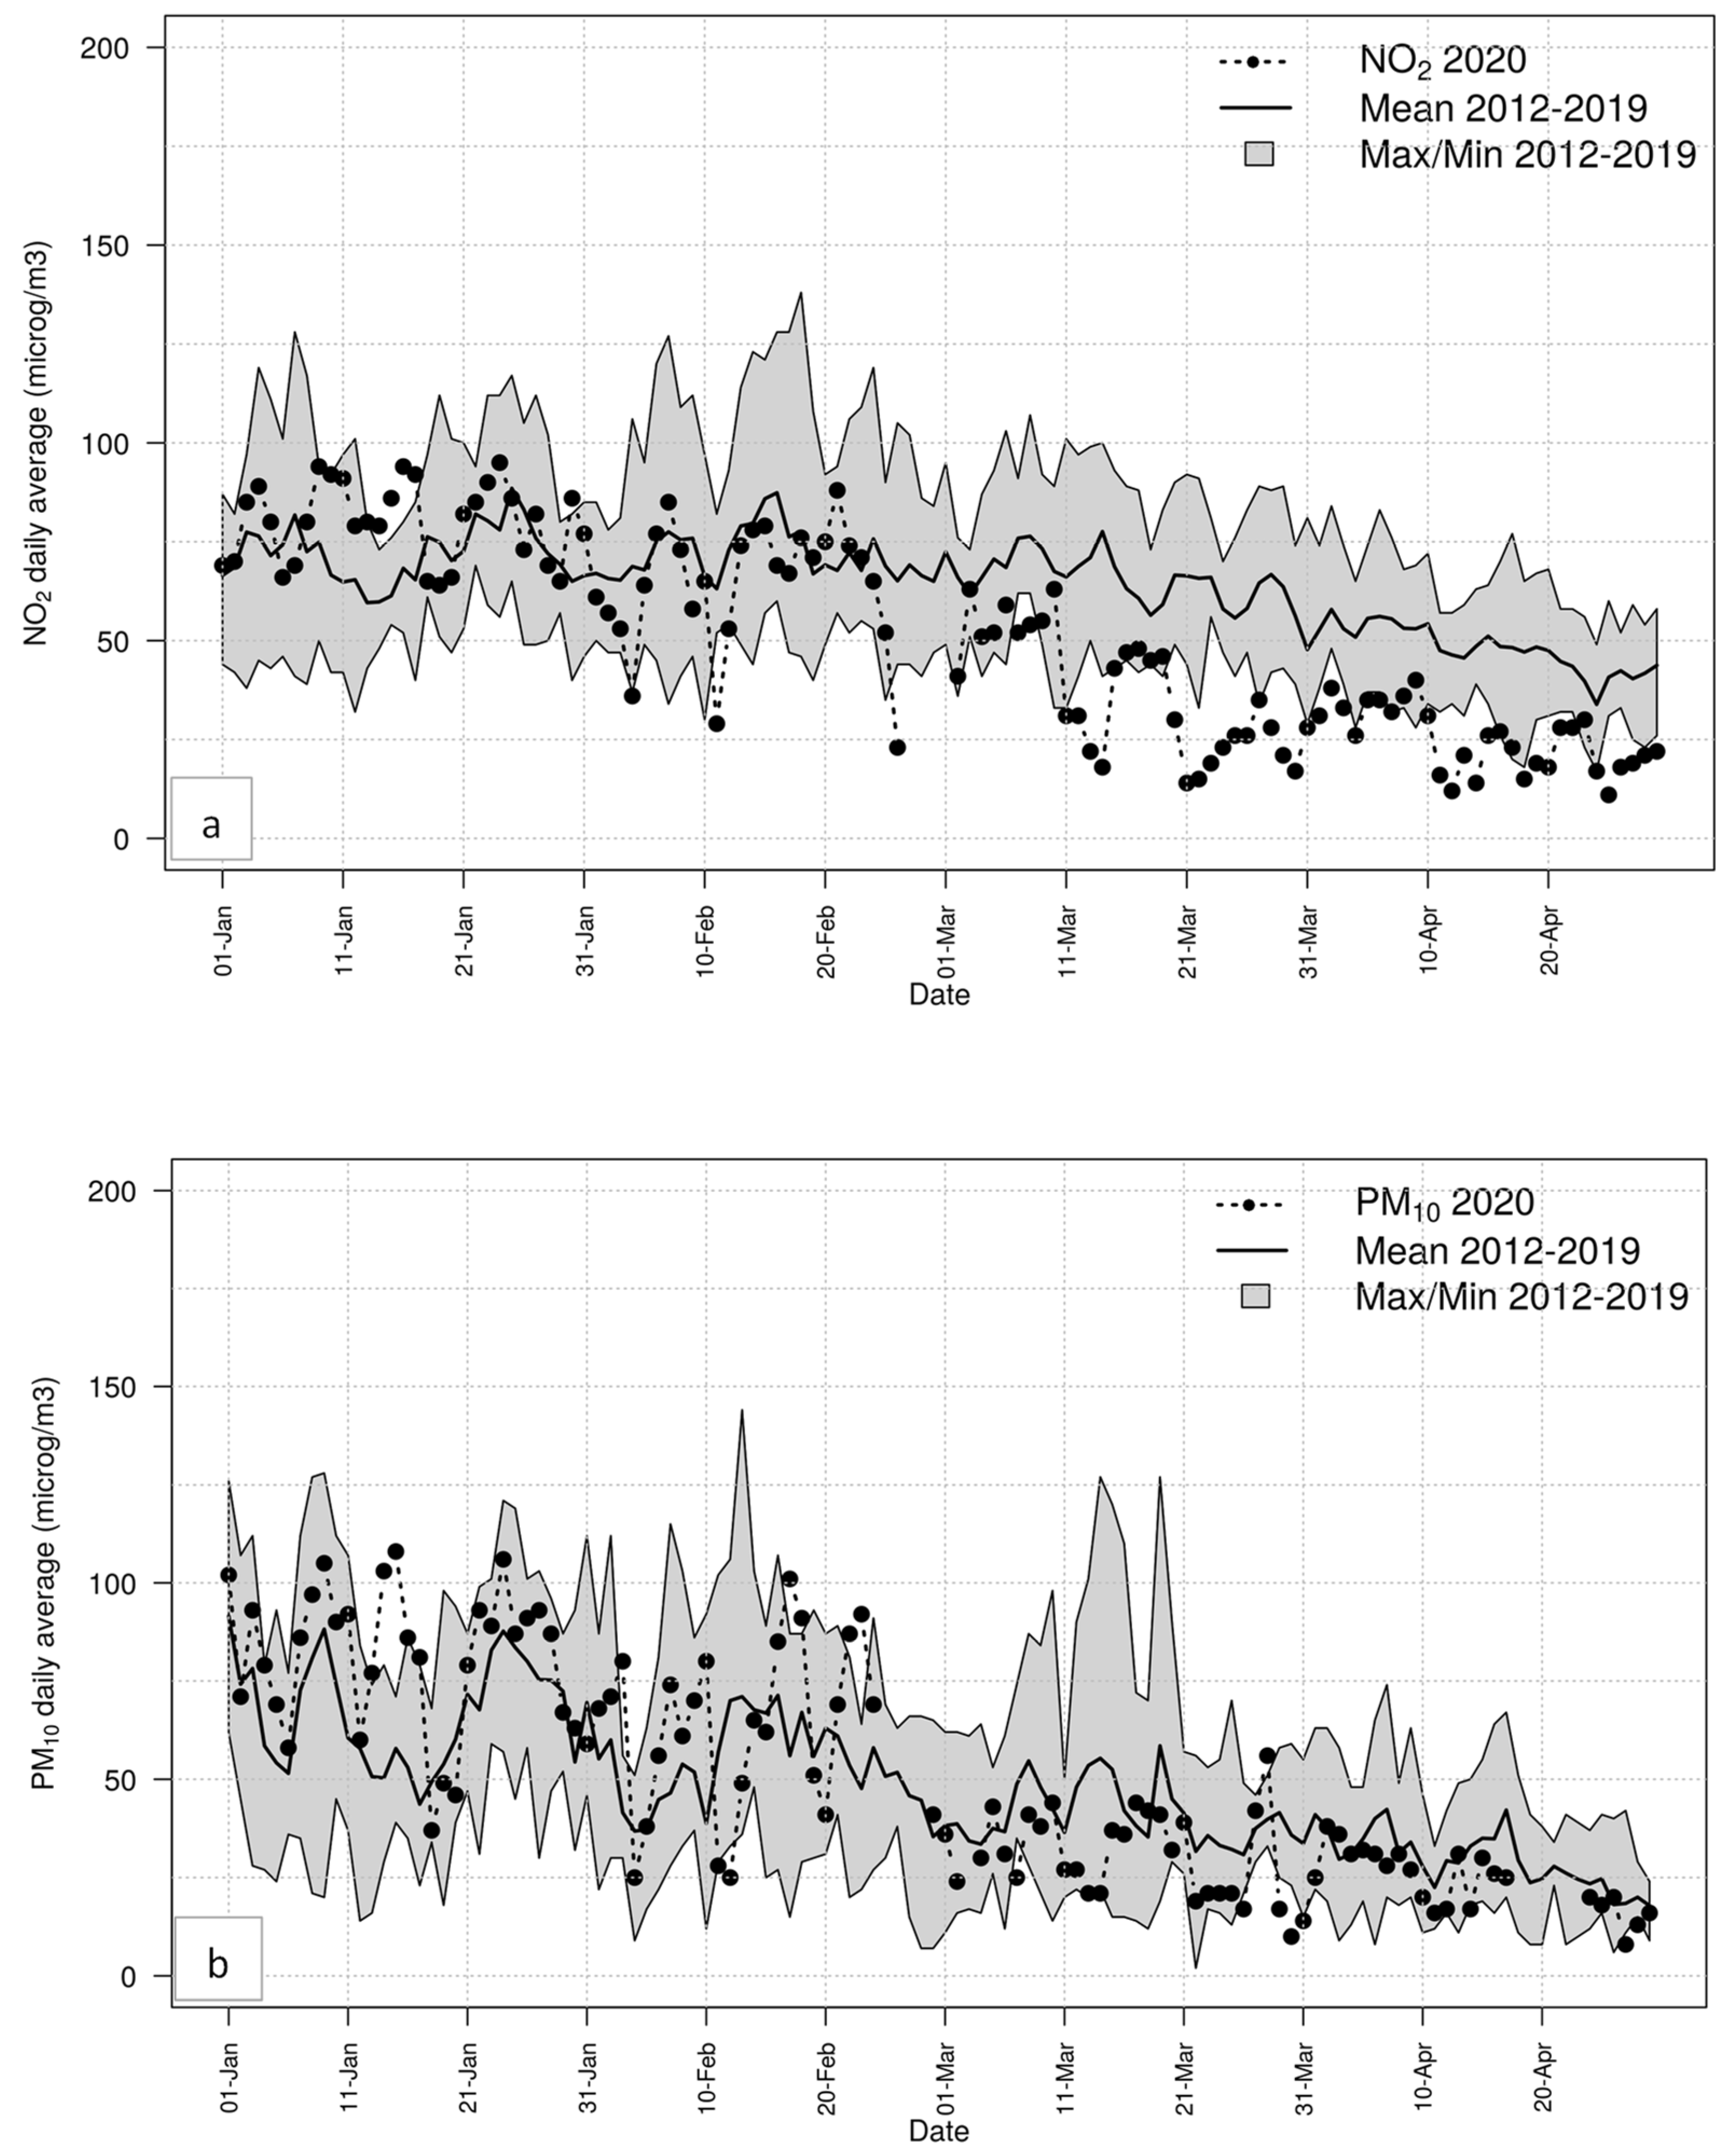
2.4. Air Quality during COVID-19 Lockdown

In 2020, the Environmental Protection and Research Agency for Piedmont (Arpa Piemonte) published a study [38] focusing on the link between the reduced atmospheric emissions due to the limiting measures following the COVID-19 emergency (mainly involving traffic and productive activities) and the ambient air pollutants’ concentrations (PM10 and nitrogen dioxide) in N-W Italy. The purpose was to verify the presence of an additional effect on the ordinary decrease in atmospheric pollutants’ concentration normally occurring with the start of the spring season. In this regard, it is important to underline that, unlike PM10, the concentrations of nitrogen oxides (NOx), mainly emitted by vehicular traffic, respond more directly to variations in emissions.
PM10 and NO2 emissions have been estimated for the period 1 January 2020–30 April 2020 (in Italy, a hard lockdown started on 9 March 2020); PM10 and NO2 concentrations for the first four months of 2020 were analyzed by comparing them with those measured in the same period by the stations of the regional air quality network for the years 2012–2019.

3. Results

The emission inventories of different regions in Europe, as described in Section 2.2, are reported in Figure 2 and Figure 3. Figure 2a demonstrates that, although North-Eastern Italy (Emilia Romagna + Veneto regions) has lower (or at least comparable) atmospheric emissions (from a larger surface), both for particulate matter and its gaseous precursors, the measured concentrations of PM10 are much higher than in North Rhine-Westphalia (NRW, North-Western Germany). In particular, the 90.41 percentile of PM10 daily average in a calendar year is higher than EU air quality standards (50 μg/m3 not to be exceeded for more than 35 days per year) in four out of five analyzed years. On the contrary, NO2 yearly concentrations are higher for NRW than for Northern Italy, due to higher emissions and different secondary aerosol formation mechanisms.
Similar results are reported for Lombardy (Northern Italy) and Baden-Württemberg (South-Western Germany) in Figure 2b: emissions are comparable (except for NH3 which is higher in Lombardy), but PM10 concentrations are much higher in Lombardy and NO2 almost equivalent.
Figure 3a, dealing with the entire Po Valley compared to Southern Germany, confirms the behaviors highlighted by Figure 2.
Finally, Figure 3b shows an interesting comparison between Piedmont (N-W Italy) and two regions of Southern Poland, with similar emissive surfaces. In this case, lower Poland has important emissions, relating to PM10 (4 times higher than for Piedmont), SO2 (10 times higher), NOx (twice those from Piedmont). Despite the stronger emissions, PM10 concentrations are just 45% higher in Poland, and NO2 turned out to be even lower than in Piedmont.
As already mentioned, air quality trends for PM10 concentrations (90.41 percentile daily average) in Torino (IT), Düsseldorf (DE), and Krakow (PL) have been obtained and reported by Figures S1 and S2 in the Supplementary Materials. The data collected highlight a decreasing trend for all considered sites, of different entities: concerning the urban-traffic stations, PM10 concentrations decreased by 52% in Torino, 49% in Krakow, and 43% in Düsseldorf during the period 2001–2019; only Düsseldorf stably complies with PM10 daily limit value of 50 μg/m3. As far as urban-background stations are concerned, concentrations decreased by 52% in Torino and 36% in Düsseldorf in the period 2006–2019. It is interesting to observe that urban-traffic and urban-background PM10 concentrations in Torino show almost the same values, whereas in the other two studied cities, urban-traffic stations report significantly higher concentrations with respect to background areas. Almost constant pollutant concentrations are generally due to stagnation conditions and poor atmospheric dispersion potential.
To understand the dynamics of pollutants dispersion in the atmosphere and the related chemical transformations, thus explaining the emissions–air quality relationship described in Figure 2 and Figure 3, it is essential to analyze the meteorological parameters introduced in Section 2.2. Figure 4 shows the diurnal pattern of PBL height during the cold season in Torino (Piedmont, IT), Essen (NRW, DE), and Katowice (Silesian, PL). As the figure points out, the PBL height in Torino as well as in the whole Po Valley is close to the ground, especially during the evening, the night, and the early morning. Pollutants emitted in this area are dispersed through a mixed-layer depth higher than 200 m (but lower than 400 m), only from 10 a.m. to 4 p.m., from December to February. In Katowice and Essen, the PBL heights are radically different, showing depths comprised between 400 and 800 m during the same cold months. Similar conditions can be found in other places north of the Alps, such as Stuttgart, Germany, or Prague, Czech Republic. In conclusion, the PBL height in Torino during the winter is four to five times lower than in Northern Europe, as clearly described in Figure S3 in the Supplementary Materials.
As already described, PBL height is inversely proportional to PM10 concentration: PM10 concentrations higher than 50 μg/m3 occur in Torino when PBL depth is lower than 200 m (see Figure S4 in Supplementary Material). The logarithmic fit between PBL height and PM10 concentration measured from 2011 to 2020 at the station of Torino-Consolata is statistically meaningful, with a slope equal to −23.3 μg/m4 (error 1.4) and intercept equal to 170.6 μg/m3 (error 6.5).
Contextually, Torino and the Po Valley show constant high-pressure values from November to February, whereas in Northern Europe, low-pressure conditions are frequent also during the cold season (as reported in Figure S5 in the Supplementary Materials). In January and February, Torino shows mean sea level pressure significantly higher than those found in the other two locations. Atmospheric pressure values are the lowest in Essen from November to February; this means that atmospheric conditions are more dynamic and favorable to pollutant dispersion and rainfall episodes are more frequent.
Finally, Figure 5 reports the comparison of 10 m wind speed derived from ERA5 reanalysis in the three areas. Wind speed at 10 m in Torino is always between 0.5 and 1 m/s, whereas in Essen or Katowice, wind speed is three to five times higher on average. As expected, wind speed tends to increase during the afternoon as a consequence of thermal local circulation.
In conclusion, the three primary meteorological parameters, PBL height, wind speed, and atmospheric mean sea level pressure, unquestionably illustrate why the air quality of Northern Italy is still worse than in other places in Europe despite the massive emissive reduction carried out in recent decades; during the cold seasons, the atmospheric dilution/dispersion capabilities are three to five times weaker than in other EU countries, favoring the stagnation of pollutants and the chemical transformation of PM10 gaseous precursors.
This last aspect can be developed and discussed through the PM analytical source apportionment described in Section 2.3; as already mentioned, this method can determine PM main constituents and, consequently, main emissive contributors. Figure 6 reports mass contributions to PM10 concentration as calculated for Milano-Pascal and Torino-Lingotto air quality stations in Northern Italy: as pointed out by the plots, in the Po basin, secondary inorganic aerosol (ammonium sulfates and nitrates) represents, on average during the cold season, the largest contribution to PM10 concentration. SIA can represent more than 50% of PM10 concentrations during air pollution critical episodes [39]. The contribution of SIA is homogeneous over the Po Valley [40].
Provided that the secondary inorganic fraction of PM is of primary importance in the Po basin, it is worth remembering the main patterns followed by atmospheric chemical transformation of gaseous pollutants to PM. Ammonia is de facto the only base in the gas phase in our atmosphere. It rapidly reacts with the available acids (mainly sulfuric and nitric, coming from SOx and NOx emissions) to form the corresponding salts. Ammonia reacts first with sulfuric acid to form bisulfate, and, if enough ammonia is present, ammonium bisulfate. If the ammonia concentration exceeds the stoichiometric threshold (twice the sulfate in moles), then some free ammonia is available to react with other acid gases too, such as nitric acid, to form ammonium nitrate [41]. Whereas ammonium sulfate is a relatively stable compound, ammonium nitrate is not. Ammonium nitrate tends to evaporate (the reaction is reversible), and its formation is favored by low temperatures and high relative humidity, typical conditions for the Po Valley.
Since the PM composition of Northern Italy could be quite different if compared to other European regions as secondary fraction of PM is of great relevance, the effect of measures aiming at reducing emissions could also be different from what can be expected. In this sense, emission reductions due to the COVID-19 lockdown can be seen as a real experiment to observe the effectiveness of possible policies on air quality.
Concerning primary PM10, the total quantities emitted in Piedmont (N-W Italy) up to the first half of April 2020 remained substantially unchanged compared to those occurring without the lockdown, as the reduction in the contribution of industry and traffic was offset by the overall increase in domestic heating emissions. On the other hand, in the case of nitrogen oxides, a net reduction in emissions, up to 30%, is observed compared to the same period of an ordinary year, as the prevalent contribution to NO2 emissions is given by vehicular traffic.
In Figure 7a, NO2 concentrations measured at the urban-traffic station of Torino-Consolata (N-W Italy) show a sharp decline in March and April 2020 compared to the first two months of the average year.
Figure 7b reports PM10 concentrations measured at the urban-background station of Torino-Lingotto (N-W Italy); the plot highlights that, even though emissions of PM precursors (NO2 in particular) have been strongly diminished by lockdown, in March and April 2020, the daily PM10 concentrations lay generally within the variability range of the reference period (with some episodes of very high concentrations). In the end, 2020 in Piedmont turned out to be worse than 2019 for PM10 daily concentrations because of fewer rainfall episodes.
Similarly, the third report by EU LIFE PREPAIR project [36] investigates the lockdown effects on air quality in the entire Po Valley. Here, maximum reductions in NOx and primary PM10 emissions of 40% and 20% have been assessed; in the face of a general reduction in gaseous pollutants’ concentration observed during the lockdown, PM concentrations did not decrease, showing positive and negative fluctuations, mostly depending on meteorological conditions. The report observes a strong reduction in elemental carbon contribution to PM during the lockdown due to traffic reduction, as well as a reduction in elements deriving from industrial activities. At the same time, contributions due to biomass burning for the residential heating increase and, most of all, due to secondary inorganic aerosol were even higher, or invariant compared to 2019 and the historical series. The hypothesis that can explain the behavior observed for PM10, according to the cited study, is that despite a strong reduction in NOx emissions, the main precursors of SIA, in particular ammonia, were present in sufficient quantities to support secondary aerosol formation during the lockdown. In other words, NOx concentrations do not seem to behave as a limiting factor for secondary aerosol formation in the Po basin.

4. Discussion

4.1. Difficulties to Comply with Air Quality Limits in Northern Italy

The previous sections described the results of analyses aiming at understanding air quality conditions of the Po Valley, starting from (i) drivers, which are areal emissions, (ii) the meteorological parameters influencing atmospheric pollutants’ dispersion and transport, (iii) the composition of PM, and (iv) the effectiveness of strong emissive reductions on air quality during lockdown periods.
The discussed data show that concentrations of atmospheric pollutants in the Po Valley had one of the best reduction trends in Europe in the last 20 years, due to very large emissive reduction, again among the highest in Europe, as pointed out by figures from EEA. Now, in front of lower or at most comparable emissions, the Po basin regions still have PM10 and PM2.5 noticeably worse than other European regions placed, for example, in Germany.
The reasons why the Po basin still exceeds EU air quality limits (as well as the stricter WHO guidelines levels) are normally attributed to orography and meteorological adverse conditions. The elaborations described in Section 2.2 aim to prove, objectively, that the atmospheric dispersion and dilution capacity of the Po basin is drastically lower than elsewhere in Europe as planetary boundary layer height is often lower than 200 m during the cold seasons, five times less than in Northern Europe.
When pollutants remain concentrated in a smaller volume and wind is too weak to transport pollutants elsewhere, contrary to what usually happens in Northern Europe where transboundary pollution is an important issue, stagnation favors the chemical transformation of gaseous pollutants to particulates, and higher precursor concentrations lead to higher reaction kinetics for secondary pollution. During critical episodes, when primary pollutants tend to accumulate near the ground, reaching high concentrations and therefore favoring the formation of further secondary particles, pollution is no longer limited to urban areas, but high concentrations are usually measured all over the Po plain and in rural areas.
The described conditions are confirmed by source apportionment campaigns developed in Northern Italy, where secondary inorganic aerosol (SIA) is the main contributor to PM composition: indeed, SIA could account for more than 30% of PM10 on the annual average, and during the peak episodes in the winter, it can represent up to 70% of PM10. PM components’ profile for the Po Valley is very different compared to other regions in Europe, in particular north of the Alps; contributions of elemental carbon (EC) and ammonium sulfate are lower in the Po basin, but a high concentration of ammonium nitrate can be found, in particular during the cold seasons.
In the Po basin, after an effective national desulfurization campaign, SOx are emitted in small quantities compared to ammonia and NOx, so that free ammonia reacts with nitric acid to form ammonium nitrate. On the contrary, in Northern Europe, where sulfur-containing fuel is massively used and SOx emissions are large (see, for example, North Rhine-Westphalia or Southern Poland emission inventories in Figure 2 and Figure 3), ammonia neutralizes sulfuric acid first, and NO2 is less “consumed” to form secondary particles, thus resulting in higher concentrations (as reported by Figure 2).
PM source apportionment carried out in Northern or Central Europe shows strong differences compared to Northern Italy. A Dutch study [42] reports that, in an urban-background station placed in Schiedam (part of Rotterdam (NL) urban agglomeration with appr. 600,000 inhabitants), PM2.5 is made up of 24% ammonium sulfate, 22% ammonium nitrate, 14% elemental carbon, and 10% organic carbon.
A German study [43] determined the composition and origin of PM2.5 aerosol particles in the upper Rhine Valley (South-Western Germany) during the summer, showing that the main contributions are referable to organic matter, followed by sodium salts; the contribution of secondary inorganic aerosol is not decisive.
Another German research group [44] analyzed 75 PM10 samples collected at an urban background station in Mülheim-Styrum, North Rhine-Westphalia. Here, seven contribution factors were identified, namely mineral dust (that is crustal matter), secondary nitrate and sulfate, industry, fossil fuel combustion, non-exhaust traffic, and marine aerosol. For the marine aerosol factor, higher contributions are due to air masses coming from the North and the West; in contrast, the fossil fuel combustion factor corresponds to eastern winds; long-distance PM transport might lead to an enlarged contribution of the mineral dust and fossil fuel combustion from continental, eastern European areas. The eastern-driven fossil fuel combustion factor could be additionally due to emissions from the industrial Ruhr area. During the fall and winter, the main contribution to PM composition is attributed to industry and fossil fuel combustion.
As far as Poland is concerned, a first study focused on PM2.5 collected in Warsaw for a full year [45] reports that organic carbon contributes 29.6% to particulate matter annual concentration, elemental carbon 7.8%, SIA 30.7% (70% of SIA is made of ammonium sulfate), elements 4.4%, other ions 5.2%, and the remaining 22.3% is unidentified.
Another Polish study [46] describes a source apportionment campaign carried out in Krakow, where combustion and biomass burning account, respectively, for 22.9 and 15.6% of the annual PM2.5 concentration, sulfates and nitrates represent 19.3 and 17.1%, and traffic 8.3%.
A Europe-wide overview of PM source apportionment studies is available [47], although data are not recent. Here, different contributions of crustal elements, sulfates from industrial activity, carbonaceous matter, and SIA can be appreciated in many European sites, from Portugal to Finland. Lastly, in 2020, an international research group [48] produced a very interesting source apportionment study involving 16 European and Central Asia urban areas.
Another very interesting study [49] confirms the peculiar conditions of the Po Valley. Here, the research group tries to assess the emissive reductions to be reached in the Po basin to comply with EU air quality limits for PM10 (daily concentration of 50 μg/m3, not to be exceeded for more than 35 days a year) and NO2 annual mean value (40 μg/m3). The evaluation is carried out by using a complex modelling suite managed by the Environmental Agency of the Emilia-Romagna Region (ARPAE). The research establishes an “action-plans scenario” where the emission reductions are very important for all pollutants: NOx decrease should be 39%, PM10 38%, PM2.5 40%, NH3 22%, and SO2 3%, compared to 2013 emissions. The emissive reductions rely mainly on improvements to be carried out on mobility for NOx, domestic biomass burning for PM, and agriculture for NH3.
The calculated necessary reductions correspond to 30,000 t/y of primary PM10, 150,000 t/y of NOx, and 54,000 t/y of NH3, which represent a big challenge, maybe unrealistic with the present technologies, territory, population, fuels, and habits. Overall, 150,000 t of NOx correspond to the total NOx emissions from two Northern Italy regions, Piedmont and Emilia Romagna, accounting for more than 8.7 million inhabitants, or from Bavaria in Germany; 30,000 t of PM10 account for the emissions from 9 million people living in Piedmont and Veneto, more than the Austrian PM10 emissions, which are around 26,000 t/y; emissions of 54,000 t/y of ammonia mean the elimination of current agricultural and farming emissions from Veneto or Baden-Württemberg.
The same research group affirms that an emissive reduction at this level would have considerable economic and social impacts, introducing an “element of disparity” towards Northern Italy’s competitiveness and society.
On the other hand, as reported by the cited study [49], the same baseline emissions, shifted to Central Europe and modelled for December 2018, lead to lower PM10 and NO2 concentrations from 60 to 80% compared to Northern Italy because atmospheric dispersion conditions are much more favorable. Interestingly, this result, obtained by a complex modelling approach, is the same order as the outcome from a simple box model, where the same emissions are dispersed in volumes three to five times smaller because of a substantially lower PBLH, as discussed in Section 2.2.
Nonetheless, it is worth pointing out that substantial improvements in the air quality of Northern Italy could be reached through strong measures involving biomass burning (to reduce primary PM10) and agriculture (to reduce inorganic secondary PM formation). In this regard, however, the penetration and respect of air quality measures imposed by regional or interregional plans is an important issue. If the maintenance of biomass stoves is not carefully carried out, measures enforcing the use of high-quality pellets (according to European standard EN ISO 17225-2) in high-performance heating plants would be useless to improve air quality as emissions from stoves would be the same as those produced by old stoves fed by low-grade biomass fuel. Moreover, the application of the best available techniques to intensive farming and manure spreading is still to be reached, as far as we know. In this regard, new rules are being studied by European Commission to modernize the Industrial Emissions Directive [50] within the Green Deal.

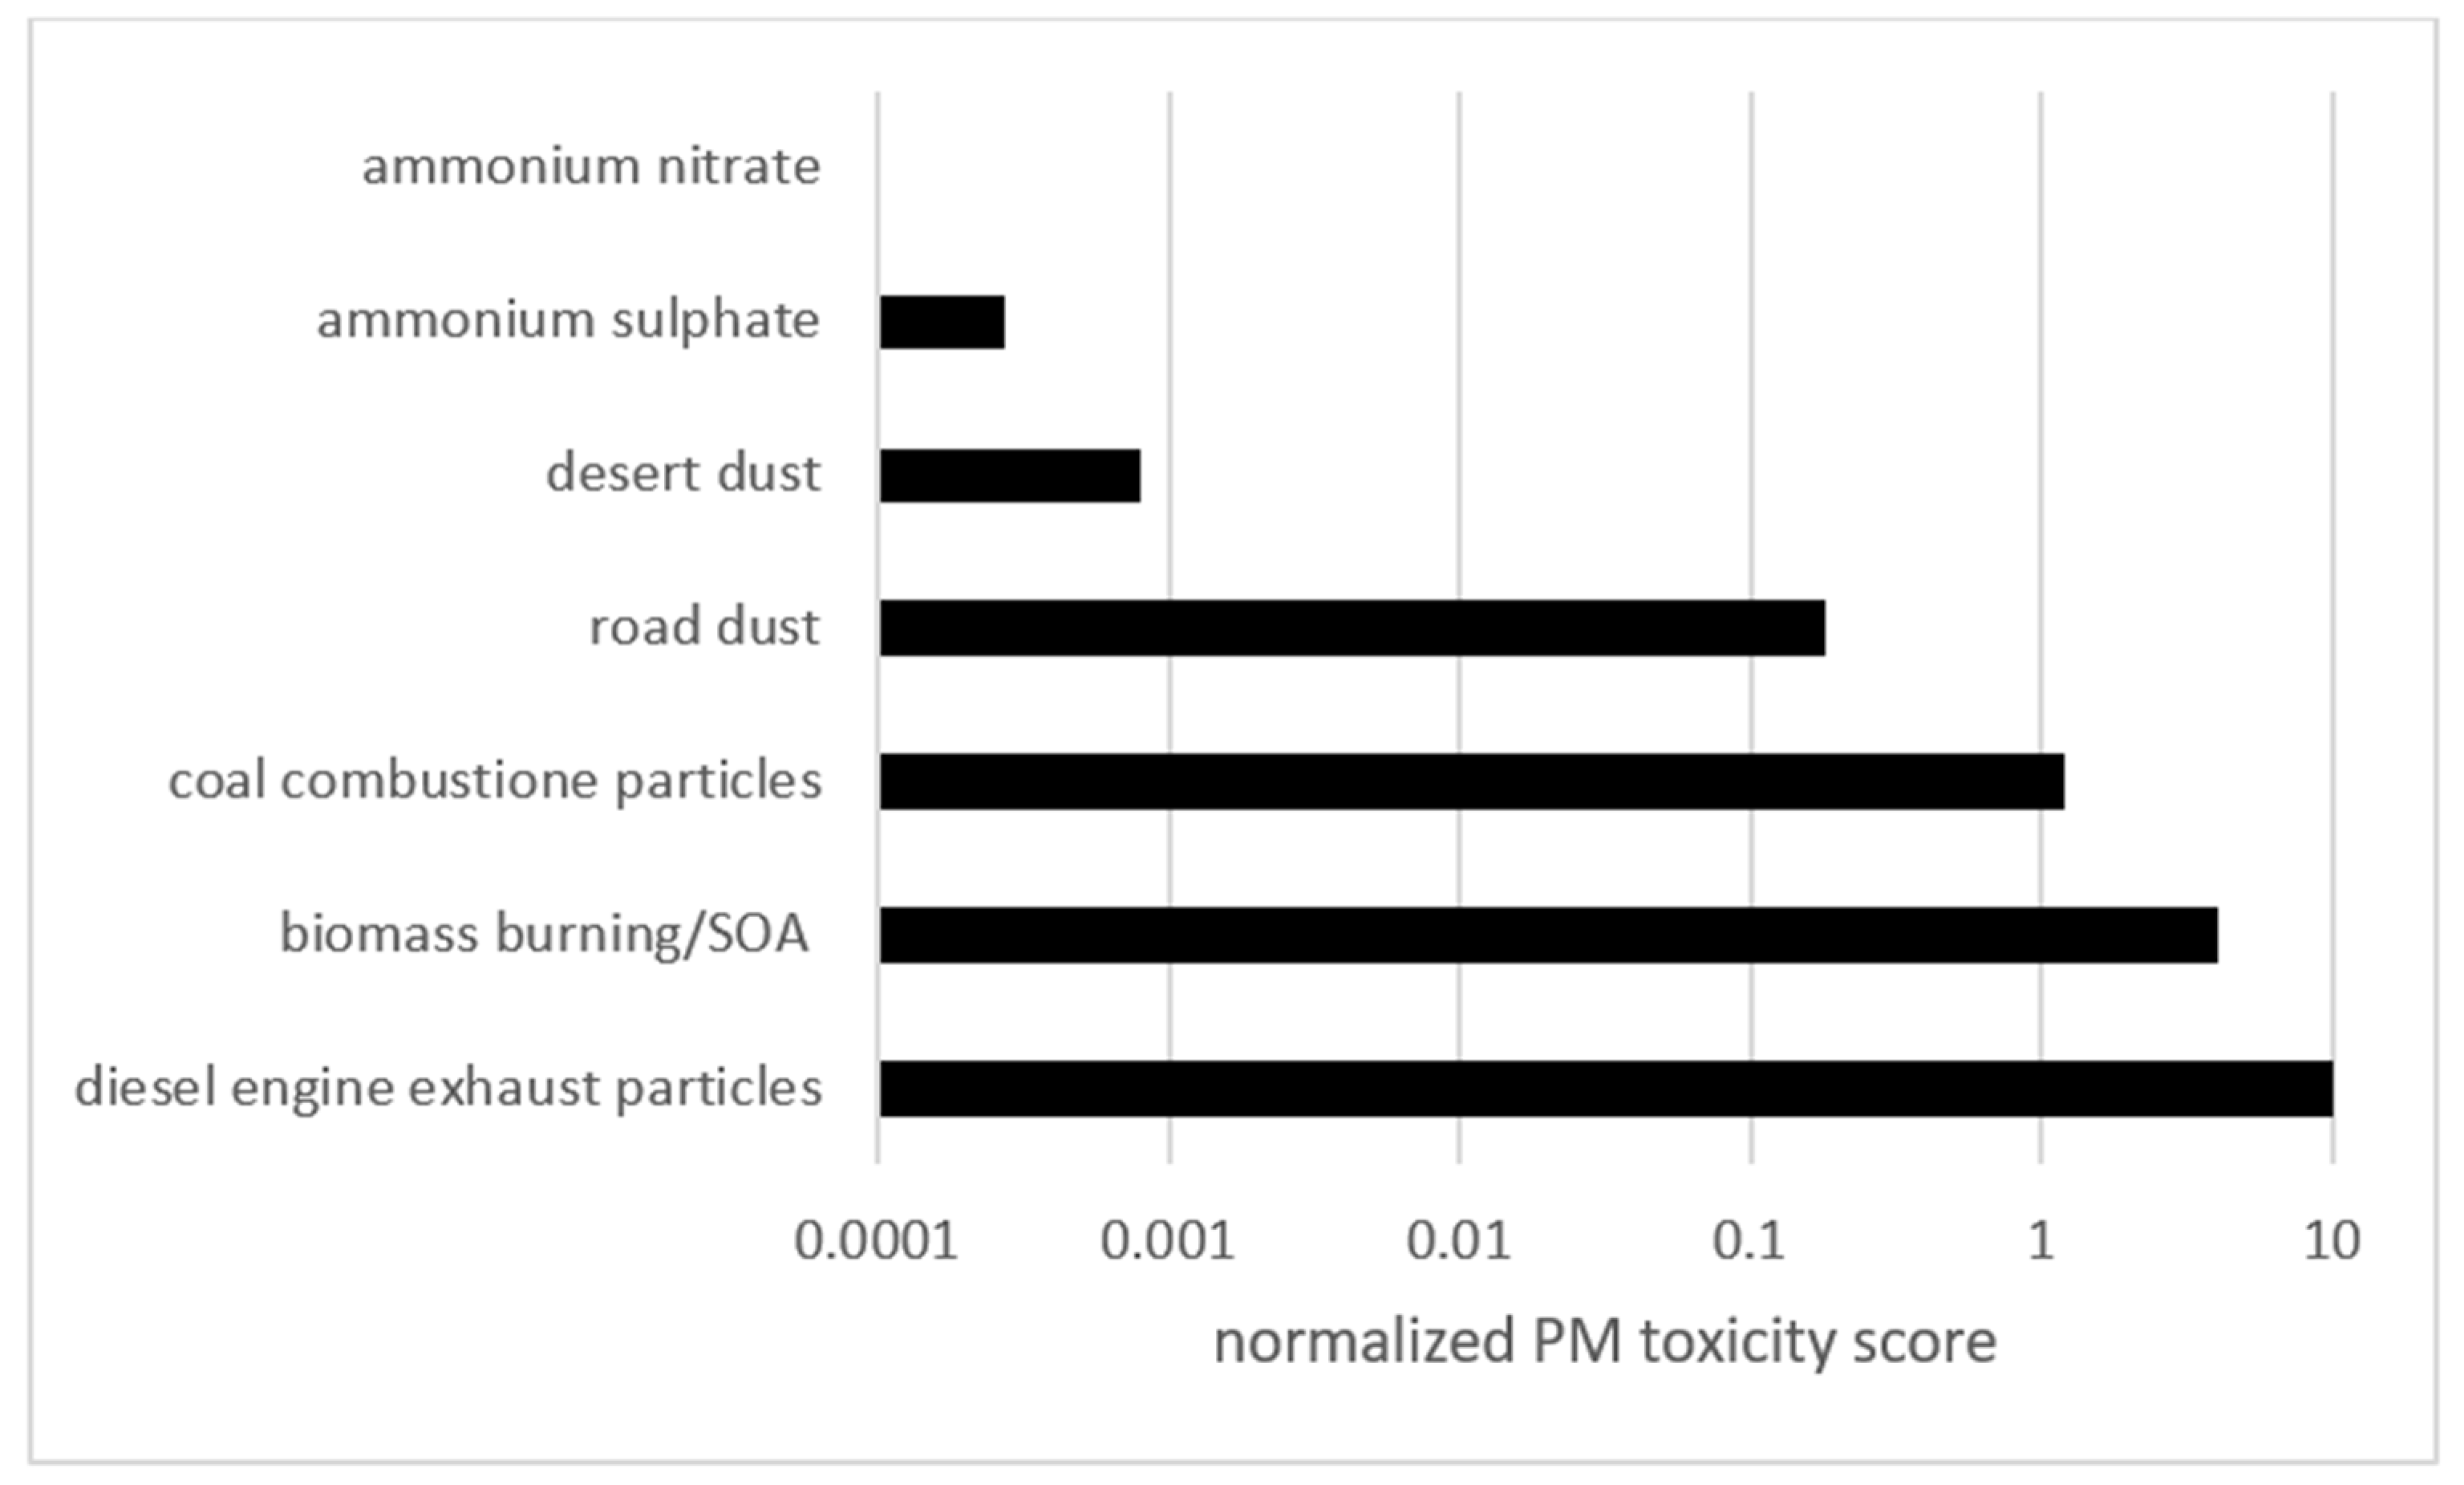
4.2. PM Toxicity and Air Quality Standard

Since the health burden due to PM-related air pollution is one of the biggest environmental health concerns, limit values and policies should be imposed based on a thorough knowledge of health effects. In 2007, a WHO report [51] stated that: “In the future, better understanding of the relative toxicity and health effects of particles from various sources could facilitate targeted abatement policies and more effective control measures to reduce the burden of disease due to air pollution”. At that time, monitoring data on component-specific PM concentrations were scarce, as well as relevant exposure data. Moreover, existing inventories suffered from gaps in emission data; on the contrary, consistent evidence for the association of PM emitted by the major combustion sources, mobile and stationary, with a range of serious health effects, including increased morbidity and mortality from cardiovascular and respiratory conditions, was already available. Different chemical characteristics of particles, the report declared, have different relative risks on a per-unit-mass basis; in particular, one of the reported hypotheses was that the oxidative potential of the particles or specific components (for example, transition metals and combustion-derived primary and secondary organic particles) could be one of the PM’s mechanisms of action because of the greater ability to deplete antioxidant defenses. The knowledge at disposal, however, did not allow in 2007 precise quantification or definitive ranking of the health effects of PM emissions from different sources or individual PM components.
In 2013 a new WHO report [52] confirmed that: (a) new evidence links black carbon particles (that is, elemental carbon) with cardiovascular health effects and premature mortality, for both short-term (24 h) and long-term (annual) exposures; (b) concerning secondary inorganic aerosol, neither the role of the cations (for example, ammonium), nor the interactions with metals or absorbed components have been well documented in epidemiological studies; (c) there is growing information on the associations of organic carbon with health effects.
Other following studies [53,54,55] focused on the health impact of outdoor air pollution depending on assumptions on the toxicity of particles.
In 2021, the last report by WHO [9] affirms textually that: “many studies have tried to identify which sources and/or physicochemical characteristics of airborne PM contribute most greatly to toxicity. This is a challenging area of research, given the great heterogeneity of airborne particles, and a definitive set of particle characteristics has yet to be identified”.
At the same time, recent research [56] has applied an interesting modelling tool (Global Exposure Mortality Model) derived from many cohort studies to assess excess mortality attributable to ambient air pollution (PM2.5 and ozone) on a global scale. The reported study points out that the fraction of avoidable loss of life expectancy (LLE) attributed to fossil fuel is nearly two-thirds globally, and up to about 80% in high-income countries.
Another recent scientific report [57] focuses on the toxicity of fine particles produced from various combustion sources (diesel engine, gasoline engine, biomass, and coal combustion) and non-combustion sources (road dust, sea spray aerosols, ammonium sulfate, ammonium nitrate, and secondary organic aerosols (SOA)), to obtain toxicity scores for different PM components through source-specific toxicity test. The study determined multiple biological and chemical endpoints (oxidative potential (OP), cell viability, genotoxicity (based on mutagenicity and DNA damage), oxidative stress, and inflammatory response). Interestingly, higher toxicity was assessed for combustion aerosols, in particular diesel engine exhausts, compared to non-combustion PM. In particular, genotoxicity (mutagenicity) and OP of diesel engine exhaust particles (i.e., soot) were significantly higher than those of other aerosol types probably because of the presence of organic components (e.g., PAH) able to break DNA strands through reactive oxygen species (ROS). Biomass burning showed toxicity comparable to that of diesel engine exhaust particles. Toxicity decreases for bituminous coal combustion (carried out at high temperature), resuspended road dust, and desert dust. Ammonium sulfate/nitrate showed low toxicity, whereas SOA toxicity turned out to be comparable to that of biomass burning. To obtain a toxicity ranking for different PM components, the authors applied the correlation coefficient and standard deviation (CCSD) method, which attributed the highest differential weight to the endpoint cell viability, followed by mutagenicity, oxidative potential, inflammatory response, and oxidative stress. The study obtained the normalized toxicity scores (0 to 10) for source-specific aerosols reported in Figure 8.
Since the authors declare that source-specific toxicity scores are additive, by combining the toxicity scores for source-specific aerosols with the mass fractions of sources in ambient particulates determined by PM source apportionment, a toxicity factor for ambient PM10/PM2.5 could be obtained as follows:
PM   toxicity   factor = i source i   toxicity   score · source i   mass   fraction
Since mass fractions are expressed as percentages and the toxicity score ranges between 0 and 10, PM toxicity factor calculated according to Equation (1) falls within the interval 0–10.
The toxicity scores proposed by the study [57] have been coupled with the source apportionment results illustrated in Section 2.3 and Section 3 [36,42,43,44,45,46,47,48], involving many urban areas in Europe and Central Asia. The obtained PM toxicity factor ranges from 0.3 (for areas where the main PM contribution is referable to sea salts or mineral matter) to 3.5 (where elemental and organic carbon prevail), suggesting that, even at the same mass concentration, the effects of PM10/PM2.5 on human health are significantly variable, and limit values should take into account differential toxicity.
Park et al. conclude by saying that the “knowledge of toxicity of particles produced from various sources obtained here can be linked with source apportionment and exposure level to derive a new health metric for ambient PM2.5 in future work. Differential toxicities of particles provide information that is more relevant for decision makers to establish PM2.5 abatement policies rather than only focusing on PM2.5 mass concentration”. Provided that PM components and linked public health impacts are strongly variable across Europe, we totally agree with the statement of this scientific report as well as the recommendations by WHO. Indeed, if far higher toxicity of elemental carbon and organic carbon from combustion (traffic, biomass, and solid fuel combustion) compared to secondary inorganic aerosol or dust resuspension could be confirmed, policies would be focused, for example, on biomass burning or diesel vehicle emissions, to consistently maximize the effectiveness of health protection measures.
After all, many environmental limit values or guidelines are based on the concept of “equivalent toxicity”: the “Toxic Equivalent” (TEQ) scheme weighs the toxicity of the less toxic compounds as fractions of the toxicity of the most toxic one. For example, limits for PCDDs, PCDFs, and PCBs work on that scheme. Moreover, according to Directive 2008/50/EU, air quality limits are already imposed on most toxic heavy metals (As, Pb, Ni, Cd), PAH (benzo(a)pyrene), and VOC (benzene), confirming that regulation should take toxicity into account.
Therefore, new health metrics for ambient PM could overcome the shortcomings of the current regulation standard, helping regional authorities to properly manage air quality questions and minimizing related health impacts.

5. Conclusions

The present paper reports an in-depth analysis of the reasons why the regions of the Po Valley, Northern Italy, still have difficulties complying with EU air quality standards, in particular for PM10 and NO2, despite strong emission reduction carried out through careful air quality plans put in practice during the last two decades.
The analysis includes a consistent comparison of emission inventories for different European regions in Italy, Germany, and Poland, the measured air quality trends in these areas and, most of all, a thorough investigation of meteorological parameters influencing atmospheric pollutants’ dispersion and transport. The study reports that in the colder seasons, wind speed, PBL height and atmospheric pressure occurring in the Po basin are three to five times less efficient to dilute and disperse pollutants if compared to regions north of the Alps. As a consequence, also against lower emissions and stronger emissive reduction trends than those of other European regions, the Po basin still has PM10 and PM2.5 noticeably worse than elsewhere. It has been demonstrated by the EU LIFE-IP PREPAIR project that only radical emission reductions could bring air quality into EU standards (or stricter guidelines values), causing considerable economic and social impacts on Northern Italy competitivity.
However, we must consider that air quality standards (particularly for PM10 and PM2.5) aim at protecting people from adverse health effects arising from air pollution. Even though, in 2019, Northern Italy regions have among the highest life expectancy in Europe (83.3 years for Piedmont (IT), 84.2 for Lombardy (IT), 80.9 for North Rhine-Westphalia (DE), 82.3 for Baden-Württemberg (DE), 74.0 for Silesian (PL), according to Eurostat data [58]), healthy air quality represents an issue to be properly addressed.
In this regard, it is necessary to consider the toxicity of atmospheric particulate in addition to PM10/PM2.5 mass concentration as a limit value, as already pointed out by WHO reports and many toxicological studies. Based on the source apportionment studies at disposal, on the annual average, more than 40% of PM10 in the Po Valley is made up of secondary inorganic aerosol and crustal matter, which constitute PM components with lower toxicity compared to organic matter from traffic (diesel engine exhaust, in particular) and solid fuel combustion.
Modern PM source apportionment techniques, along with reliable toxicity and epidemiological analyses, represent the correct tools to build a new consistent health metric for ambient PM in the future, helping policy makers to impose effective air quality measures to protect people’s health.

Supplementary Materials

The following supporting information can be downloaded at: https://0-www-mdpi-com.brum.beds.ac.uk/article/10.3390/atmos13050642/s1, Figure S1: Air quality trends for PM10 (90.41 percentile daily average) measured at 3 urban-traffic stations in Torino (IT), Düsseldorf (DE) and Krakow (PL). Figure S2: Air quality trends for PM10 (90.41 percentile daily average) measured at 3 urban-background stations in Torino (IT), Düsseldorf (DE) and Krakow (PL). Figure S3: PBL height (monthly average) in Torino (IT), Essen (DE) and Katowice (PL) average values from 1979 to 2020. Figure S4: Correlation between PBL height and PM10 daily averages measured in Torino (N-W Italy) in the period 2011–2020. Figure S5: Mean sea level pressure diurnal pattern in Torino (North Western Italy), Essen (North Western Germany) and Katowice (Southern Poland) during the cold season (average values from 1979 to 2020). Table S1. Emission reduction in the main air pollutants by Member State from 2005 to 2019. Table S2: Emissions of main atmospheric pollutants in the Po Basin (Piedmont + Lombardy + Emilia Romagna + Veneto) and other European regions.

Author Contributions

Conceptualization, A.R., P.B. and S.B.; methodology, A.R., E.B., R.C. and M.R.; validation, P.B. and S.B.; formal analysis, A.R. and S.B.; investigation, E.B., R.C. and M.R.; resources, A.R.; data curation, E.B. and S.B.; writing—original draft preparation, E.B.; writing—review and editing, E.B., M.R. and R.C.; supervision, A.R., P.B. and S.B.; project administration, A.R. All authors have read and agreed to the published version of the manuscript.

Funding

This research received no external funding.

Institutional Review Board Statement

Not applicable.

Informed Consent Statement

Not applicable.

Data Availability Statement

Many data supporting reported results can be found from the website of the European Environmental Agency; the following links are particularly useful: www.eea.europa.eu/data-and-maps/dashboards/air-quality-statistics-expert-viewer, www.eea.europa.eu/publications/air-quality-in-europe-2020-report, https://www.eea.europa.eu/ims/emissions-of-the-main-air (all accessed on 3 March 2022).

Acknowledgments

The authors acknowledge the scientific support coming from EU LIFE-IP Po Regions Engaged to Policies of Air (PREPAIR) project and the valuable analysis of the contributing scientists.

Conflicts of Interest

The authors declare no conflict of interest.

References

  1. European Environmental Agency. Air Quality in Europe–2020. Available online: https://www.eea.europa.eu/publications/air-quality-in-europe-2020-report (accessed on 31 December 2021).
  2. European Environmental Agency. Emissions of the Main Air Pollutants in Europe. Available online: https://www.eea.europa.eu/ims/emissions-of-the-main-air (accessed on 31 December 2021).
  3. European Environmental Agency. Urban Population Exposed to Air Pollutant Concentrations above EU Air Quality Standards. Available online: https://tableau-public.discomap.eea.europa.eu/views/Country_CSI4/Dashboard1?:iid=1&:isGuestRedirectFromVizportal=y&:embed=y (accessed on 6 April 2022).
  4. Thunis, P.; Triacchini, G.; White, L.; Maffeis, G.; Volta, M. Air pollution and emission reductions over the Po-valley: Air quality modelling and integrated assessment. In Conference Proceedings, Proceedings of the 18th World IMACS Congress and MODSIM09 International Congress on Modelling and Simulation, Cairns, Australia, 13–17 July 2009; Anderssen, R.S., Breddock, R.D., Newham, L.T.H., Eds.; Modelling and Simulation Society of Australia and New Zealand Inc.: Canberra, Australia, 2009; pp. 2335–2341. ISBN 9780975840078. [Google Scholar]
  5. European Environmental Agency. Impact of Selected Policy Measures on Europe’s Air Quality; EEA Report No 8/2010; EEA: Copenhagen, Denmark, 2010. [CrossRef]
  6. Bigi, A.; Ghermandi, G. Trends and variability of atmospheric PM2.5 and PM10–2.5 concentration in the Po Valley, Italy. Atmos. Chem. Phys. 2016, 16, 15777–15788. [Google Scholar] [CrossRef] [Green Version]
  7. Schaap, M.; van Loon, M.; ten Brink, H.M.; Dentener, F.J.; Builtjes, P.J.H. Secondary inorganic aerosol simulations for Europe with special attention to nitrate, Atmos. Chem. Phys. 2004, 4, 857–874. [Google Scholar] [CrossRef] [Green Version]
  8. EU Commission: European Commission–Press Release: Air Quality: Commission Takes Action to Protect Citizens from Air Pollution, Brussels, 17 May 2018, Press Release Database. Available online: http://europa.eu/rapid/press-release_IP-18-3450_en.htm (accessed on 6 April 2022).
  9. World Health Organization. WHO Global Air Quality Guidelines: Particulate Matter (PM2.5 and PM10), Ozone, Nitrogen Dioxide, Sulfur Dioxide and Carbon Monoxide. Available online: https://apps.who.int/iris/handle/10665/345329 (accessed on 31 December 2021).
  10. European Environmental Agency. Europe’s Urban Population Remains at Risk due to Levels of Air Pollution Known to Damage Health. Available online: https://www.eea.europa.eu/highlights/europes-urban-population-remains-at (accessed on 31 December 2021).
  11. European Environmental Agency. EEA Report No 05/2020, European Union Emission Inventory Report 1990–2018 under the Unece Convention on Long-Range Transboundary Air Pollution (LRTAP); EEA: Copenhagen, Denmark, 2020; ISBN 9789294802378. [CrossRef]
  12. Regione Piemonte, Inventario Regionale delle Emissioni in Atmosfera (IREA). Available online: https://servizi.regione.piemonte.it/catalogo/inventario-regionale-delle-emissioni-atmosfera-irea (accessed on 31 December 2021).
  13. Regione Lombardia. Inventario Emissioni in Aria (INEMAR). Available online: https://www.inemar.eu/xwiki/bin/view/Inemar/HomeLombardia (accessed on 31 December 2021).
  14. Regione Veneto, INEMAR. Available online: https://www.regione.veneto.it/web/ambiente-e-territorio/INEMAR (accessed on 31 December 2021).
  15. Regione Emilia-Romagna. Inventario Emissioni in Atmosfera (INEMAR). Available online: https://datacatalog.regione.emilia-romagna.it/catalogCTA/dataset/inventario-regionale-emissioni-in-atmosfera-inemar (accessed on 31 December 2021).
  16. Landesamt für Natur, Umwelt und Verbraucherschutz Nordrhein-Westfalen, Online-Emissionskataster Luft NRW. Available online: https://www.ekl.nrw.de/ekat/ (accessed on 31 December 2021).
  17. Landesanstalt für Umwelt, Messungen und Naturschutz Baden-Württemberg LUBW. Available online: https://udo.lubw.baden-wuerttemberg.de/public/?highlightglobalid=emission (accessed on 31 December 2021).
  18. Institut für Energiewirtschaft und Rationelle Energieanwendung IER, University of Stuttgart. Fortschreibung des Emissionskatasters Bayern für Das Jahr 2004. Available online: https://www.thru.de/fileadmin/SITE_MASTER/content/Dokumente/Berichte/BY_endbericht_Emissionskataster.pdf (accessed on 31 December 2021).
  19. Załupka, M.; Rackiewicz, I.; Benikas, E.; Wikarek-Paluch, E.; Wahlig, A.; Sobecki, I.; Przybyła, T.; Hołownia, K.; Wahlig, W.; Grzebiela, R. Air Quality Plan for the Malopolska Region–Malopolska in a Healthy Atmosphere, 2020. Available online: https://powietrze.malopolska.pl/en/air-quality-plan/ (accessed on 31 December 2021).
  20. Banaś, A.; Bekek, J.; Błaś, M.; Chmura, U.; Chudy, P.; Jaśkiewicz, J.; Jechna, K.; Kuczer, J.; Kuczer, M.; Lochno, A.; et al. Program Ochrony Powietrza dla Województwa Śląskiego, 2020. Available online: https://powietrze.slaskie.pl/content/pop (accessed on 31 December 2021).
  21. European Environmental Agency. EMEP/EEA Air Pollutant Emission Inventory Guidebook. Available online: https://www.eea.europa.eu/publications/emep-eea-guidebook-2019 (accessed on 31 December 2021).
  22. De Leeuw, F. A set of emission indicators for long-range transboundary air pollution. Environ. Sci. Policy 2002, 5, 135–145. [Google Scholar] [CrossRef]
  23. European Environmental Agency. Available online: https://www.eea.europa.eu/data-and-maps/dashboards/air-quality-statistics-expert-viewer (accessed on 31 December 2021).
  24. Stull, R.B. An Introduction to Boundary Layer Meteorology; Kluwer Academic: Dordrecht, The Netherlands, 1988; p. 666. [Google Scholar]
  25. Jacob, D.J. Introduction to Atmospheric Chemistry; Princeton University Press: Princeton, NJ, USA, 1999. [Google Scholar]
  26. Raupach, M.R.; Denmead, O.T.; Dunin, F.X. Challenges in linking atmospheric CO2 concentrations to fluxes at local and regional scales. Aust. J. Bot. 1992, 40, 697–716. [Google Scholar] [CrossRef]
  27. Denmead, O.T.; Raupach, M.R.; Dunin, F.X.; Cleugh, H.A.; Leuning, R. Boundary layer budgets for regional estimates of scalar fluxes. Glob. Chang. Biol. 1996, 2, 255–264. [Google Scholar] [CrossRef]
  28. Quan, J.; Gao, Y.; Zhang, Q.; Tie, X.; Cao, J.; Han, S.; Meng, J.; Chen, P.; Zhao, D. Evolution of planetary boundary layer under different weather conditions, and its impact on aerosol concentrations. Particuology 2013, 11, 34–40. [Google Scholar] [CrossRef]
  29. Pal, S.; Lee, T.R.; Phelps, S.; De Wekker, S.F.J. Impact of atmospheric boundary layer depth variability and wind reversal on the diurnal variability of aerosol concentration at a valley site. Sci. Total Environ. 2014, 496, 424–434. [Google Scholar] [CrossRef]
  30. Czernecki, B.; Półrolniczak, M.; Kolendowicz, L.; Marosz, M.; Kendzierski, S.; Pilguj, N. Influence of the atmospheric conditions on PM10 concentrations in Poznań, Poland. J. Atmos Chem. 2017, 74, 115–139. [Google Scholar] [CrossRef] [Green Version]
  31. Hersbach, H.; Bell, B.; Berrisford, P.; Hirahara, S.; Horanyi, A.; Muñoz-Sabater, J.; Nicolas, J.; Peubey, C.; Radu, R.; Schepers, D.; et al. The ERA5 Reanalysis. Q. J. R. Meteorol. Soc. 2020, 146, 1999–2049. [Google Scholar] [CrossRef]
  32. ECMWF. Available online: https://confluence.ecmwf.int/display/CKB/The+family+of+ERA5+datasets (accessed on 31 December 2021).
  33. Copernicus CDS. Available online: https://cds.climate.copernicus.eu/#!/home (accessed on 31 December 2021).
  34. Takahama, S.; Manousakas, M.; Vratolis, S.; Salvador, P.; Decesari, S.; Mircea, M.; Paglione, M.; Belis, C.A.; Gilardoni, S.; Mooibroek, D.; et al. European Guide on Air Pollution Source Apportionment with Receptor Models: Revised Version 2019; Publications Office of the European Union: Luxembourg, 2019; Available online: https://data.europa.eu/doi/10.2760/439106 (accessed on 31 December 2021).
  35. Perrino, C.; Catrambone, M.; Canepari, S. Chemical Composition of PM10 in 16 Urban, Industrial and Background Sites in Italy. Atmosphere 2020, 11, 479. [Google Scholar] [CrossRef]
  36. EU LIFE-IP Po Regions Engaged to Policies of Air (PREPAIR) project. Report 3 COVID-19: Studio Degli Effetti Delle Misure COVID-19 Sulla Composizione Chimica Del Particolato Nel Bacino Padano. Available online: https://www.lifeprepair.eu/wp-content/uploads/2021/02/Prepair_covidQA_Report3_def2.pdf (accessed on 31 December 2021).
  37. Regione Piemonte. Piano Regionale di Qualità dell’Aria (Air Quality Plan for Piedmont, N-W Italy). Available online: https://www.regione.piemonte.it/web/sites/default/files/media/documenti/2019-04/prqa_allegato1_def.pdf (accessed on 31 December 2021).
  38. Arpa Piemonte. Analisi Sul Territorio Piemontese Degli Effetti Sulla Qualità Dell’aria e Sulle Emissioni in Atmosfera dei Provvedimenti Legati All’emergenza COVID-19. Available online: http://www.arpa.piemonte.it/arpa-comunica/file-notizie/2020/Qualit_aria_COVID_Piemonte.pdf (accessed on 31 December 2021).
  39. Lanzani, G. Impatto Sulla Qualità Dell’aria Della Combustione Della Legna in Impianti Domestici: Analisi e Prospettive. Arpa Lombardia. Congress Paper. Available online: https://www.mite.gov.it/sites/default/files/archivio/allegati/CReIAMO_PA/L4/lanzani.pdf (accessed on 31 December 2021).
  40. Scotto, F.; Bacco, D.; Lasagni, S.; Trentini, A.; Poluzzi, V.; Vecchi, R. A multi-year Source Apportionment of PM2.5 at multiple sites in the southern Po Valley. Atmos. Pollut. Res. 2021, 12, 101192. [Google Scholar] [CrossRef]
  41. Seinfeld, J.H.; Pandis, S.N. Atmospheric Chemistry and Physics: From Air Pollution to Climate Change, 2nd ed.; J. Wiley: New York, NY, USA, 2006. [Google Scholar]
  42. Weijers, E.P.; Schaap, M.; Nguyen, L.; Matthijsen, J.; van der Gon, H.A.C.D.; Brink, H.M.T.; Hoogerbrugge, R. Anthropogenic and natural constituents in particulate matter in the Netherlands. Atmos. Chem. Phys. 2011, 11, 2281–2294. [Google Scholar] [CrossRef] [Green Version]
  43. Shen, X.; Vogel, H.; Vogel, B.; Huang, W.; Mohr, C.; Ramisetty, R.; Leisner, T.; Prévôt, A.S.H.; Saathoff, H. Composition and origin of PM2:5 aerosol particles in the upper Rhine valley in summer. Atmos. Chem. Phys. 2019, 19, 13189–13208. [Google Scholar] [CrossRef] [Green Version]
  44. Hellack, B.; Quass, U.; Beuck, H.; Wick, G.; Kuttler, W.; Schins, R.P.; Kuhlbusch, T.A. Elemental composition and radical formation potency of PM10 at an urban background station in Germany in relation to origin of air masses. Atmos. Environ. 2015, 105, 1–6. [Google Scholar] [CrossRef]
  45. Juda-Rezler, K.; Reizer, M.; Maciejewska, K.; Błaszczak, B.; Klejnowski, K. Characterization of atmospheric PM2.5 sources at a Central European urban background site. Sci. Total Environ. 2020, 713, 136729. [Google Scholar] [CrossRef]
  46. Samek, L.; Stegowski, Z.; Furman, L.; Styszko, K.; Szramowiat, K.; Fiedor, J. Quantitative Assessment of PM2.5 Sources and Their Seasonal Variation in Krakow. Water Air Soil Pollut. 2017, 228, 290. [Google Scholar] [CrossRef] [Green Version]
  47. Viana, M.; Kuhlbusch, T.A.J.; Querol, X.; Alastuey, A.; Harrison, R.M.; Hopke, P.K.; Winiwarter, W.; Vallius, M.; Szidat, S.; Prévôt, A.S.H.; et al. Source Apportionment of particulate matter in Europe: A review of methods and results. Aerosol Sci. 2008, 39, 827–849. [Google Scholar] [CrossRef]
  48. Almeida, S.M. Ambient particulate matter Source Apportionment using receptor modelling in European and Central Asia urban areas. Environ. Pollut. 2020, 266, 115199. [Google Scholar] [CrossRef]
  49. Raffaelli, K.; Deserti, M.; Stortini, M.; Amorati, R.; Vasconi, M.; Giovannini, G. Improving Air Quality in the Po Valley, Italy: Some Results by the LIFE-IP-PREPAIR Project. Atmosphere 2020, 11, 429. [Google Scholar] [CrossRef] [Green Version]
  50. European Commission, Green Deal: Modernising EU Industrial Emissions Rules to Steer Large Industry in Long-Term Green Transition. Available online: https://ec.europa.eu/commission/presscorner/detail/en/ip_22_2238 (accessed on 7 April 2022).
  51. World Health Organization Europe. Health Relevance of Particulate Matter from Various Sources. In Report on A WHO Workshop Bonn, Germany 26–27 March 2007; WHO Regional Office for Europe: Copenhagen, Denmark, 2007. [Google Scholar]
  52. World Health Organization Europe. Review of Evidence on Health Aspects of Air Pollution–Revihaap Project; Technical Report; World Health Organization Europe: Copenhagen, Denmark, 2013. [Google Scholar]
  53. Cooke, R.M.; Wilson, A.M.; Tuomisto, J.T.; Morales, O.; Tainio, M.; Evans, J.S. A probabilistic characterization of the relationship between fine particulate matter and mortality: Elicitation of European experts. Environ. Sci. Technol. 2007, 41, 6598–6605. [Google Scholar] [CrossRef]
  54. Tuomisto, J.T.; Wilson, A.; Evans, J.S.; Tainio, M. Uncertainty mortality response to airborne fine particulate matter: Combining European air pollution experts. Reliab. Eng. Syst. Saf. 2008, 93, 732–744. [Google Scholar] [CrossRef]
  55. Lelieveld, J.; Evans, J.S.; Fnais, M.; Giannadaki, D.; Pozzer, A. The contribution of outdoor air pollution sources to premature mortality on a global scale. Nature 2015, 525, 367–371. [Google Scholar] [CrossRef] [PubMed]
  56. Lelieveld, J.; Pozzer, A.; Pöschl, U.; Fnais, M.; Haines, A.; Münzel, T. Loss of life expectancy from air pollution compared to other risk factors: A worldwide perspective. Cardiovasc. Res. 2020, 116, 1910–1917. [Google Scholar] [CrossRef]
  57. Park, M.; Joo, H.S.; Lee, K.; Jang, M.; Kim, S.D.; Kim, I.; Borlaza, L.J.S.; Lim, H.; Shin, H.; Chung, K.H.; et al. Differential toxicities of fine particulate matters from various sources. Nat. Sci. Rep. 2018, 8, 17007. [Google Scholar] [CrossRef] [PubMed]
  58. Eurostat. Available online: https://ec.europa.eu/eurostat/web/products-eurostat-news/-/edn-20200930-1 (accessed on 31 December 2021).
Figure 1. Studied European regions in Italy (1 Piedmont, 2 Lombardy, 3 Veneto, 4 Emilia Romagna), Germany (5 Bavaria, 6 Baden-Württemberg, 7 North Rhine-Westphalia), and Poland (8 Silesian, 9 Lesser Poland).
Atmosphere 13 00642 g001
Figure 2. (a) Emission inventory for North-Eastern Italy (Emilia Romagna + Veneto regions) and North Rhine-Westphalia in Germany; (b) emission inventory for Lombardy in Italy and Baden-Württemberg in Germany. Yearly NO2 concentrations and PM10 90.41 percentile daily average are reported for the period 2015–2019.
Atmosphere 13 00642 g002
Figure 3. (a) Emission inventory for Po Valley (Piedmont + Lombardy + Emilia Romagna + Veneto) in Italy and Southern Germany (Bavaria + Baden-Württemberg); (b) emission inventory for Piedmont in Italy and Southern Poland (Lesser Poland and Silesian). Yearly NO2 concentrations and PM10 90.41 percentile daily average are reported for the period 2015–2019.
Atmosphere 13 00642 g003
Figure 4. PBL height diurnal pattern in Torino (North-Western Italy), Essen (North-Western Germany), and Katowice (Southern Poland) during the cold season (average values from 1979 to 2020).
Atmosphere 13 00642 g004
Figure 5. Wind speed diurnal pattern in Torino (North-Western Italy), Essen (North-Western Germany) and Katowice (Southern Poland) during the cold season (average values from 1979 to 2020).
Atmosphere 13 00642 g005
Figure 6. PM10 constituents form analytical source apportionment in the Po Valley for Milano-Pascal station in (a) and for Torino-Lingotto in (b).
Atmosphere 13 00642 g006
Figure 7. (a) NO2 concentrations and (b) PM10 concentrations measured, respectively, at Torino-Consolata (urban-traffic) and Torino-Lingotto (urban-background) station during COVID-19 lockdown of March and April 2020, compared to historical data (measurements from 2012 to 2019).
Atmosphere 13 00642 g007
Figure 8. Normalized toxicity score (0 to 10) for source-specific aerosol with differential weights given to the endpoint (data taken from [57]).
Atmosphere 13 00642 g008
Publisher’s Note: MDPI stays neutral with regard to jurisdictional claims in published maps and institutional affiliations.

