
Spatio-Temporal Variability of Hydroclimatology in the Upper Cauca River Basin in Southwestern Colombia: Pre- and Post-Salvajina Dam Perspective

 , ,
, ,  , ,
, ,  ,
,
Abstract
:1. Introduction
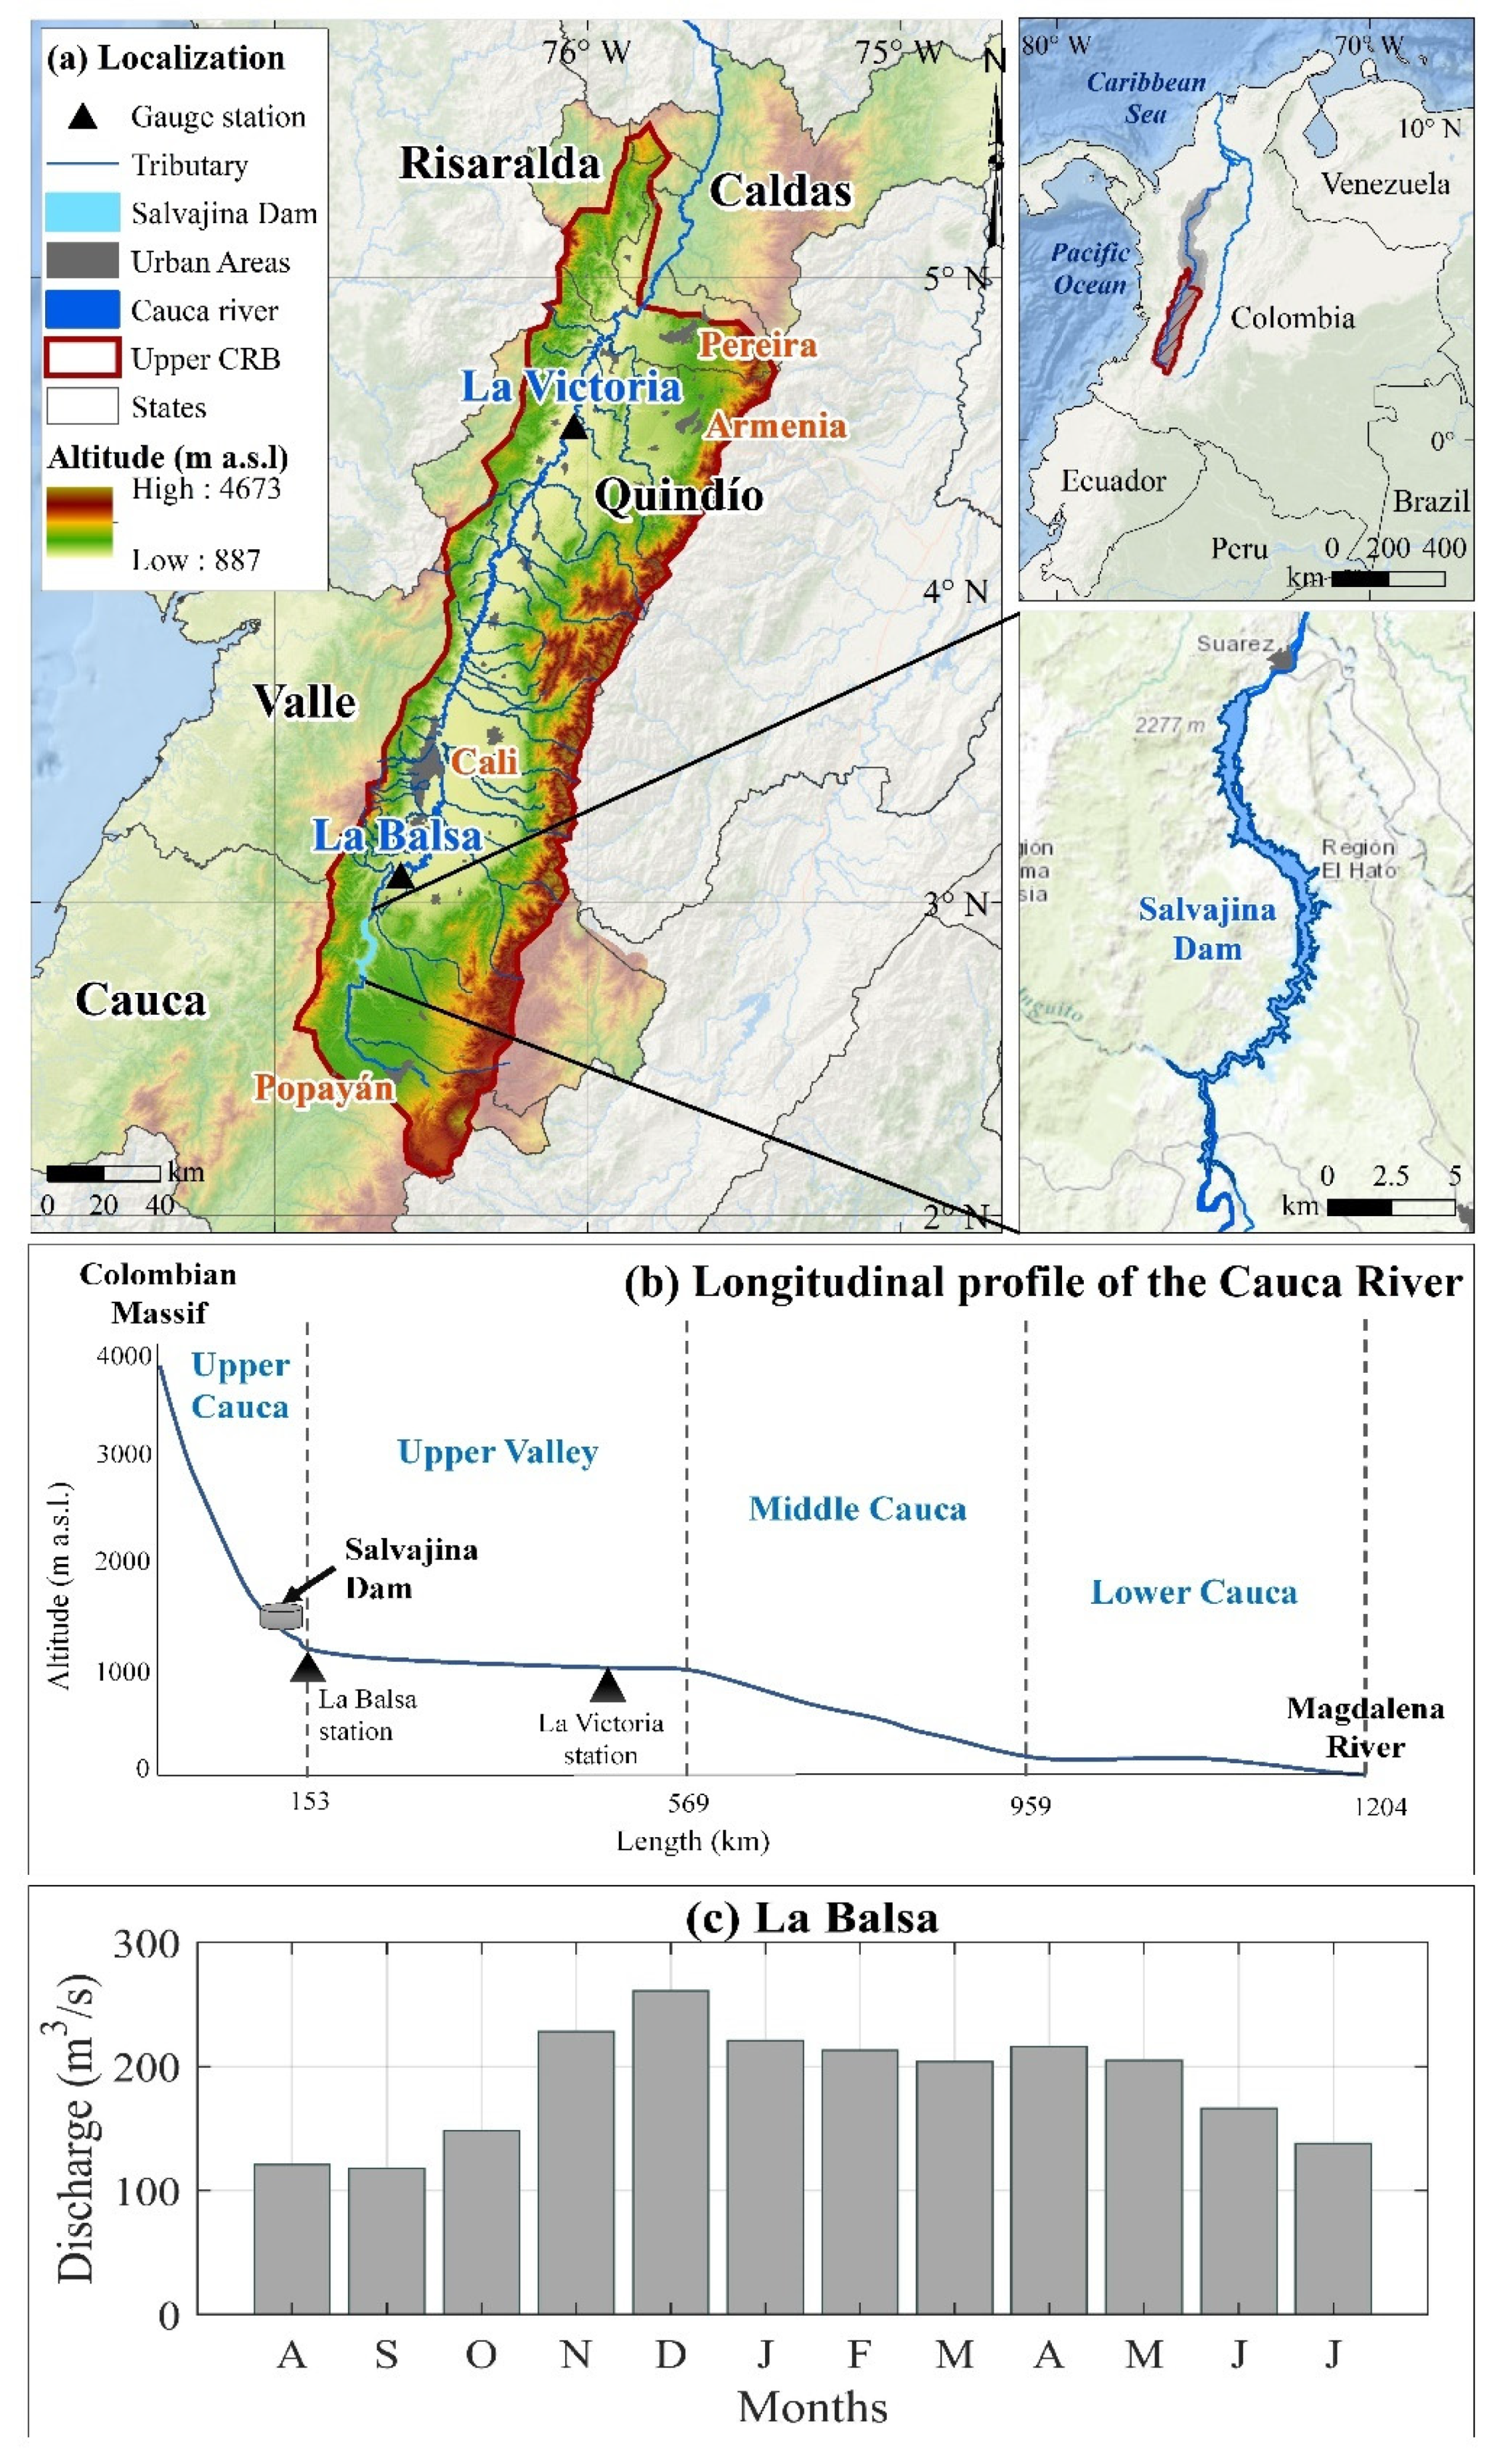
2. Study Area
3. Materials and Methods
3.1. Hydrological Data
3.2. Atmospheric and Oceanic Information
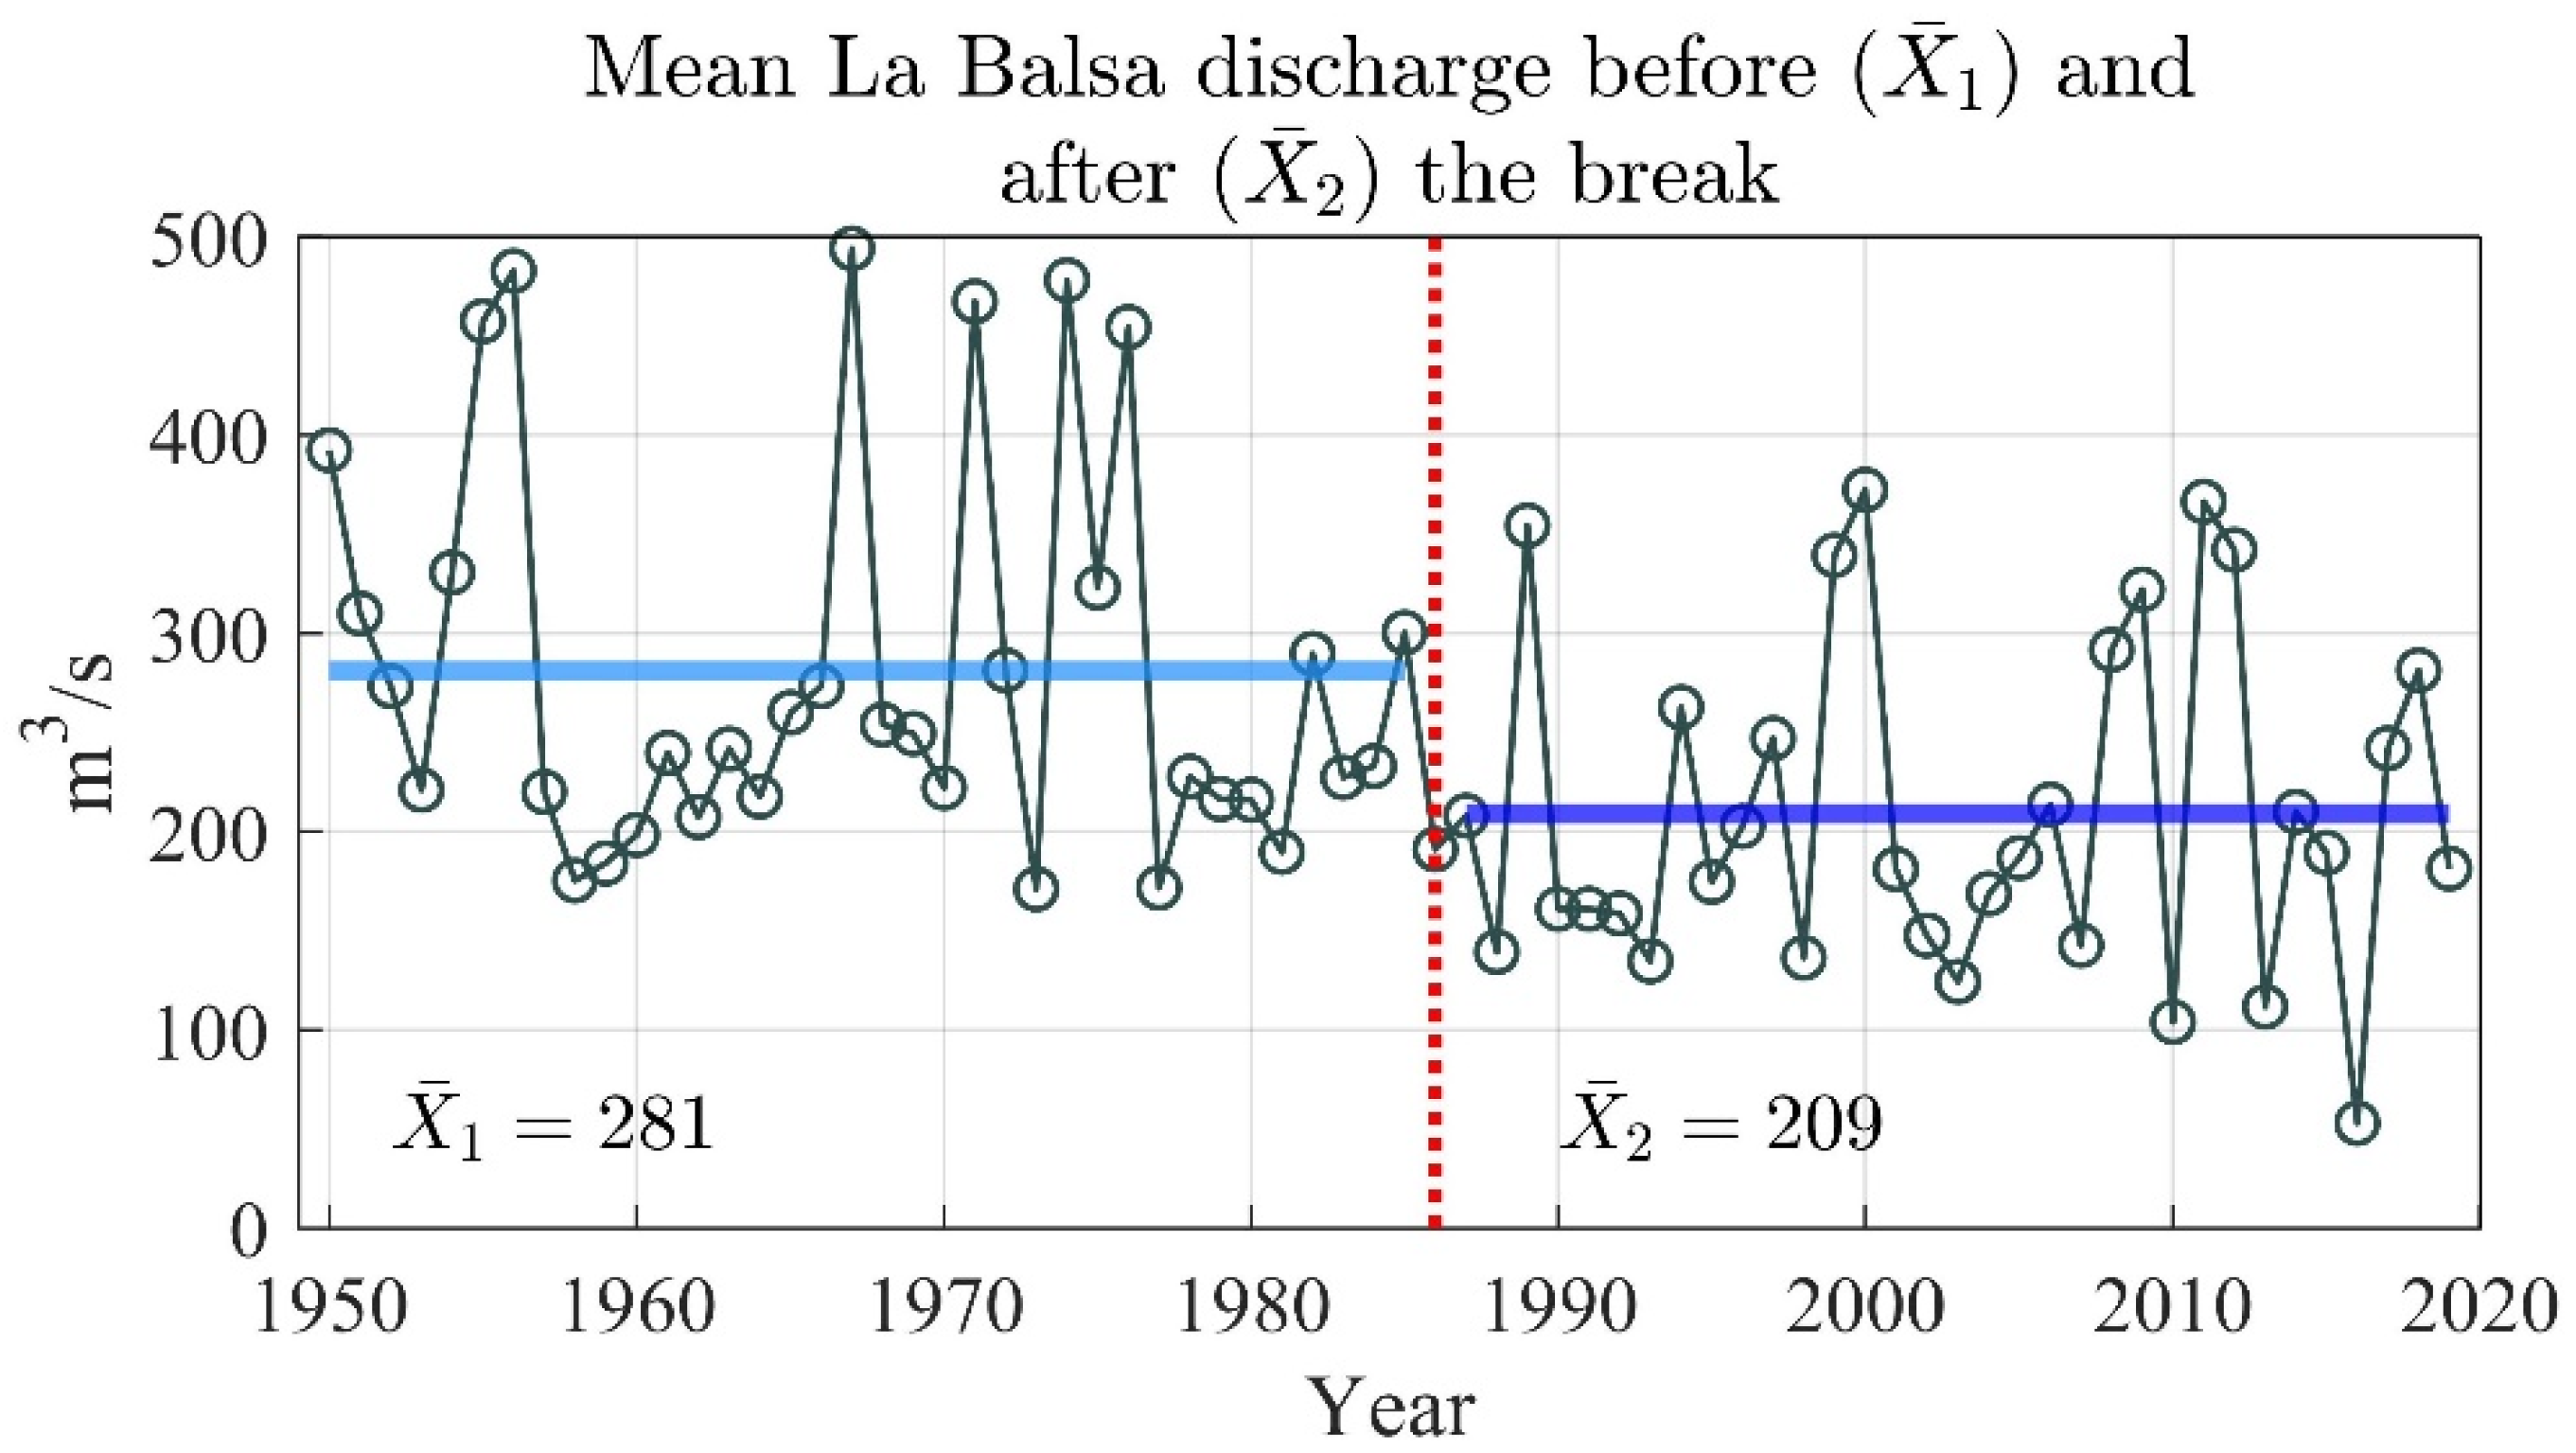
3.3. Discharge Variability Pre- and Post-Breaking Point
4. Results and Discussion
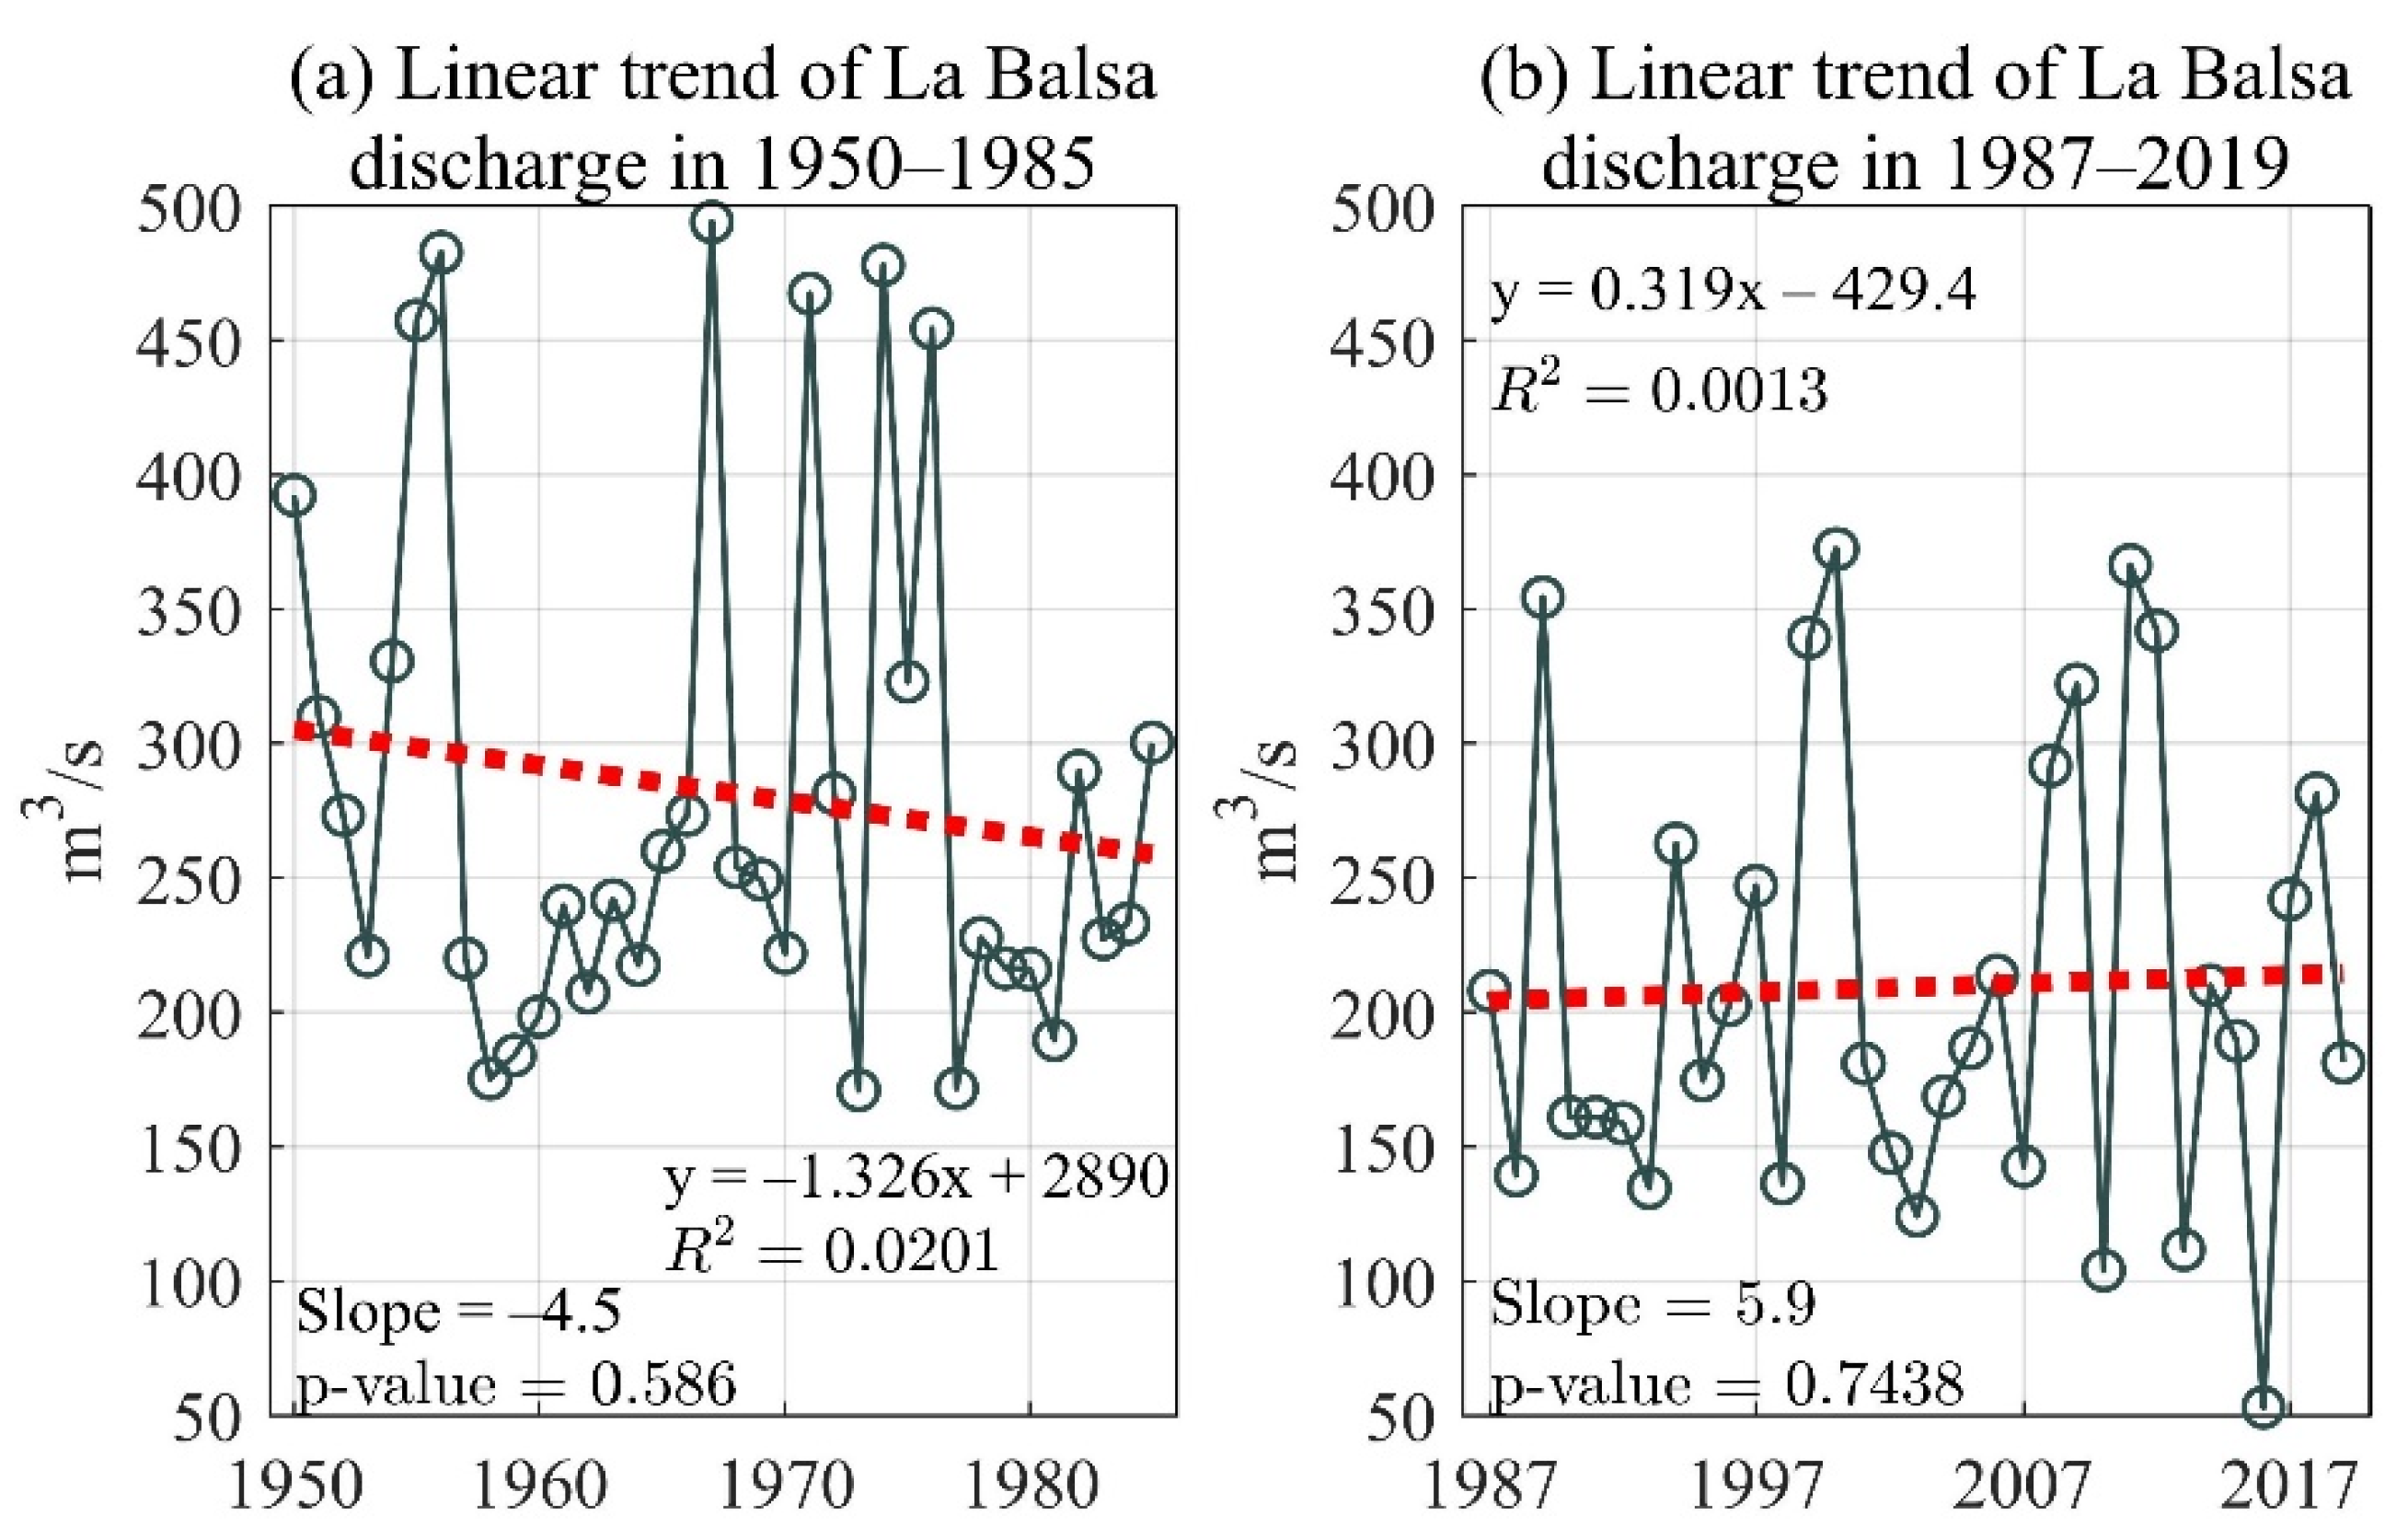
4.1. Discharge Variability
4.2. Anomalous Sea Surface Temperature (SST) and Sea Level Pressure (SLP) Conditions Pre- and Post-Salvajina
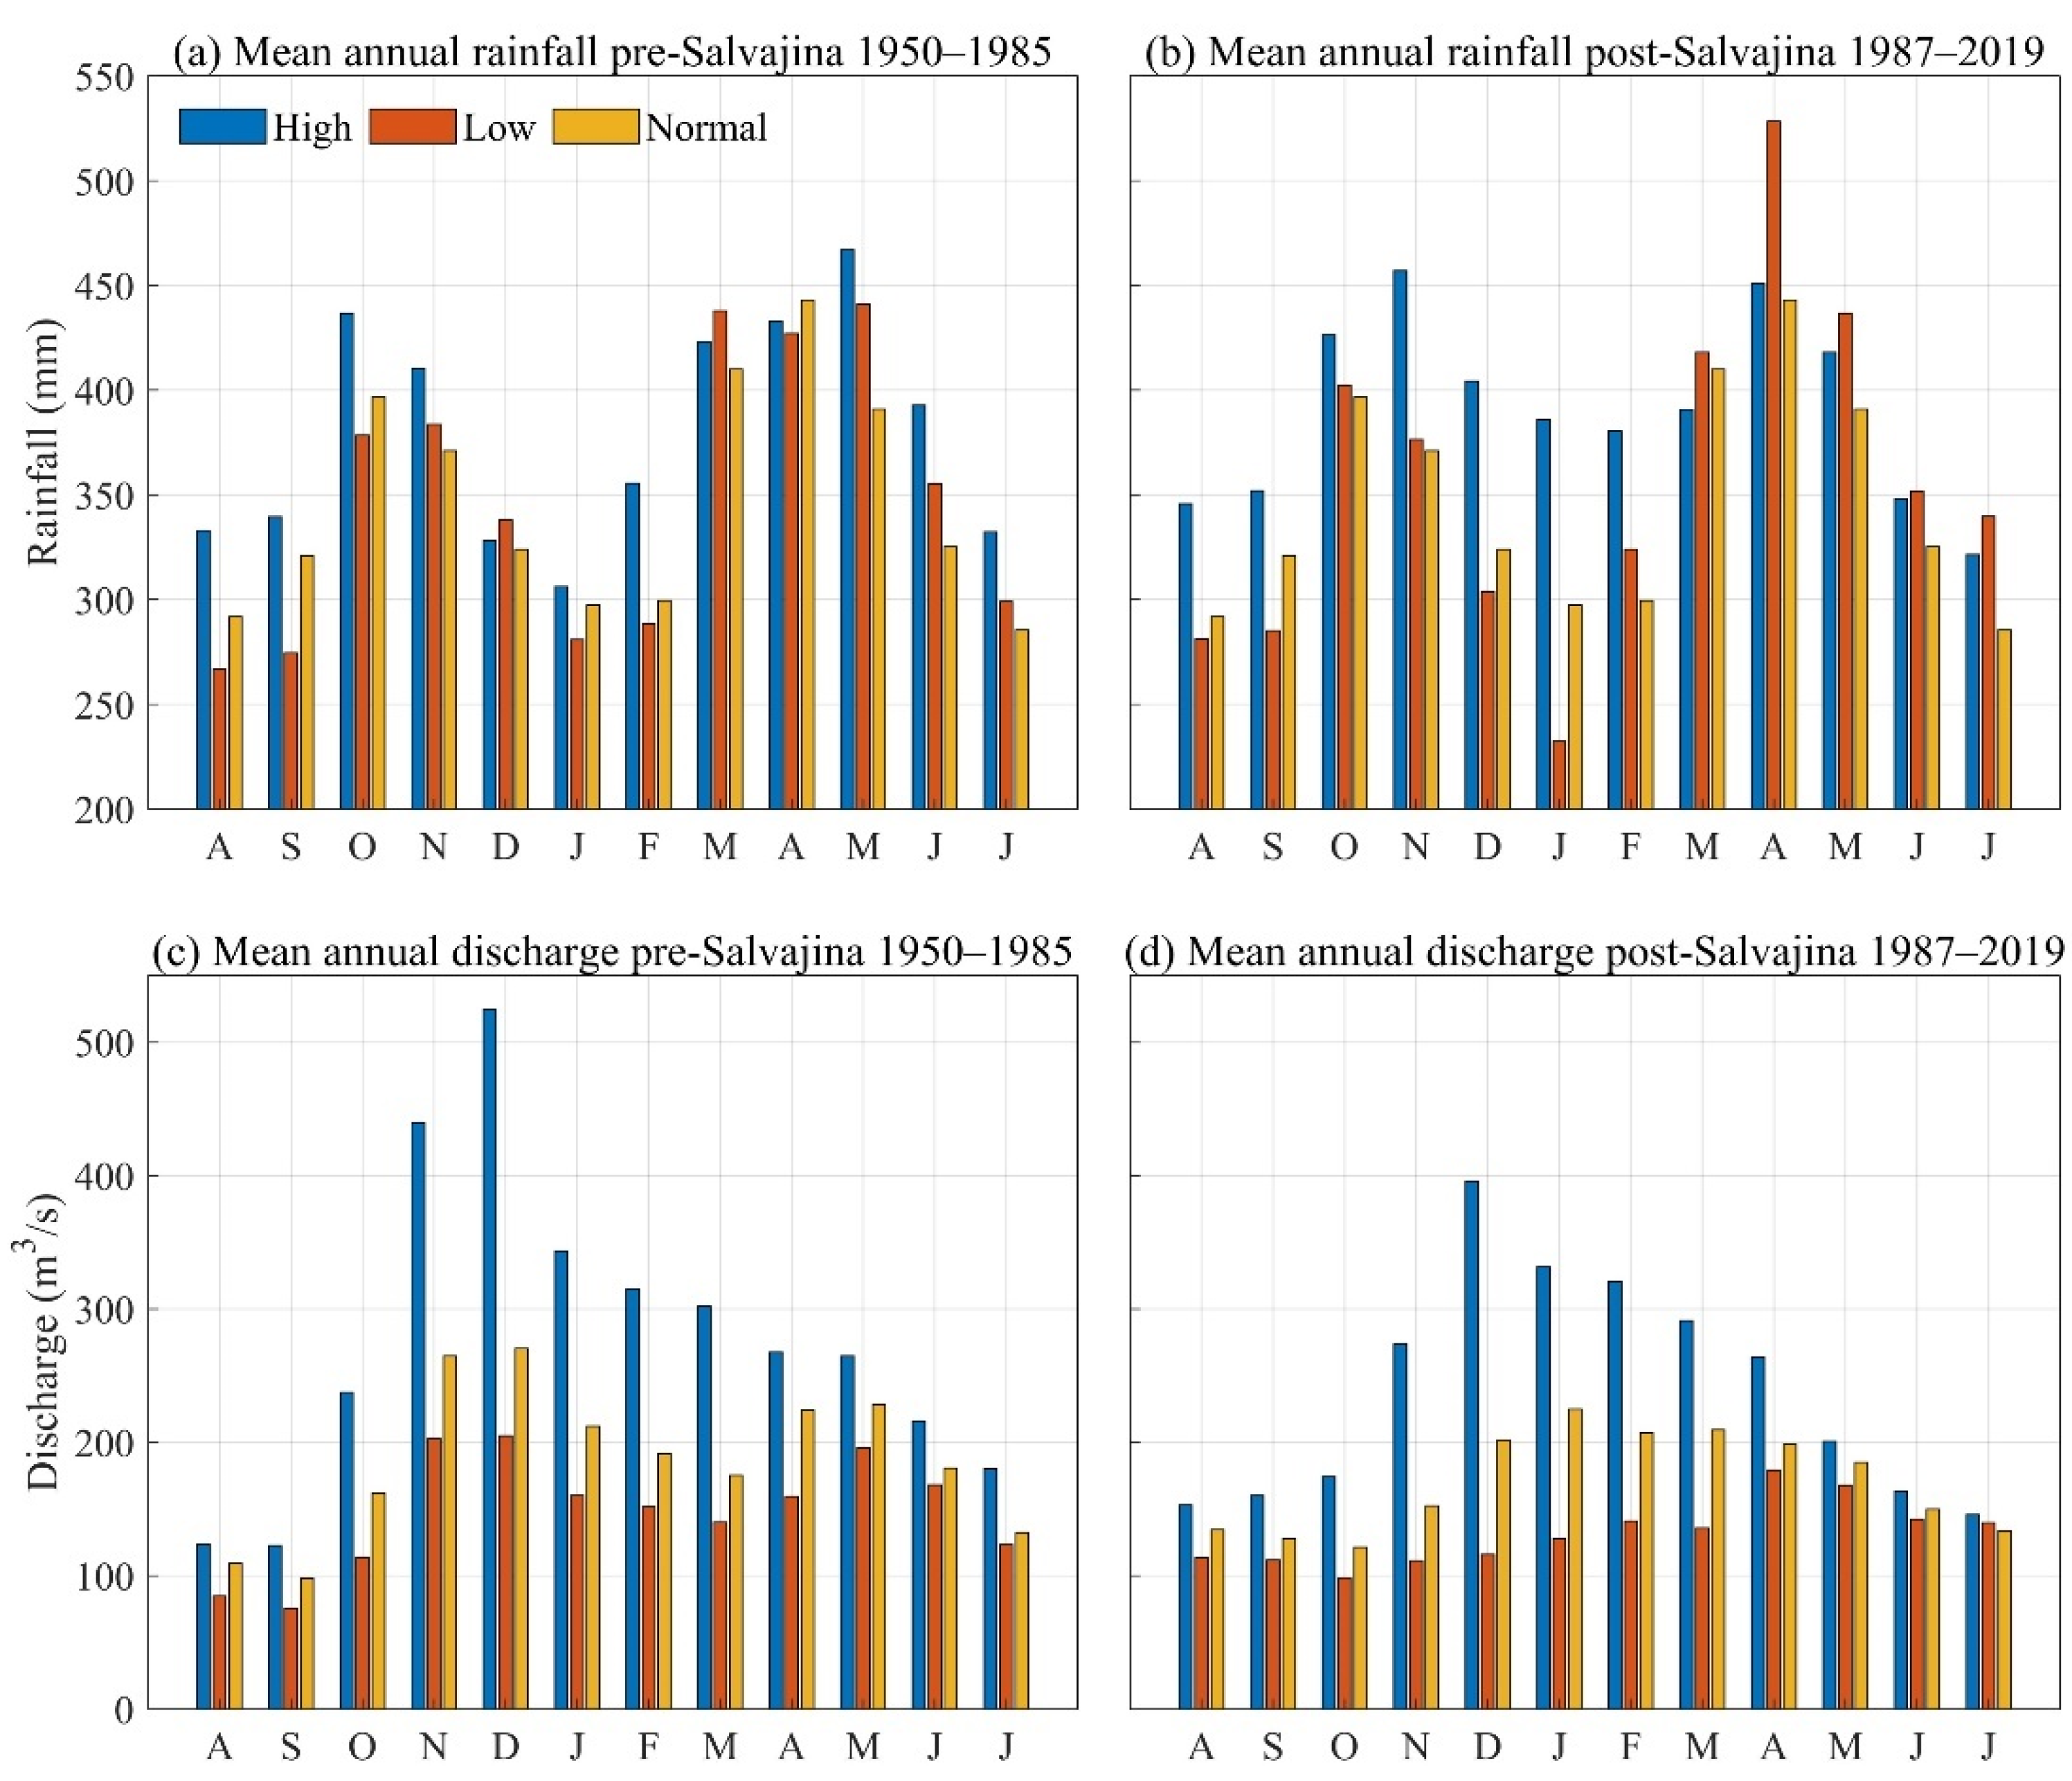
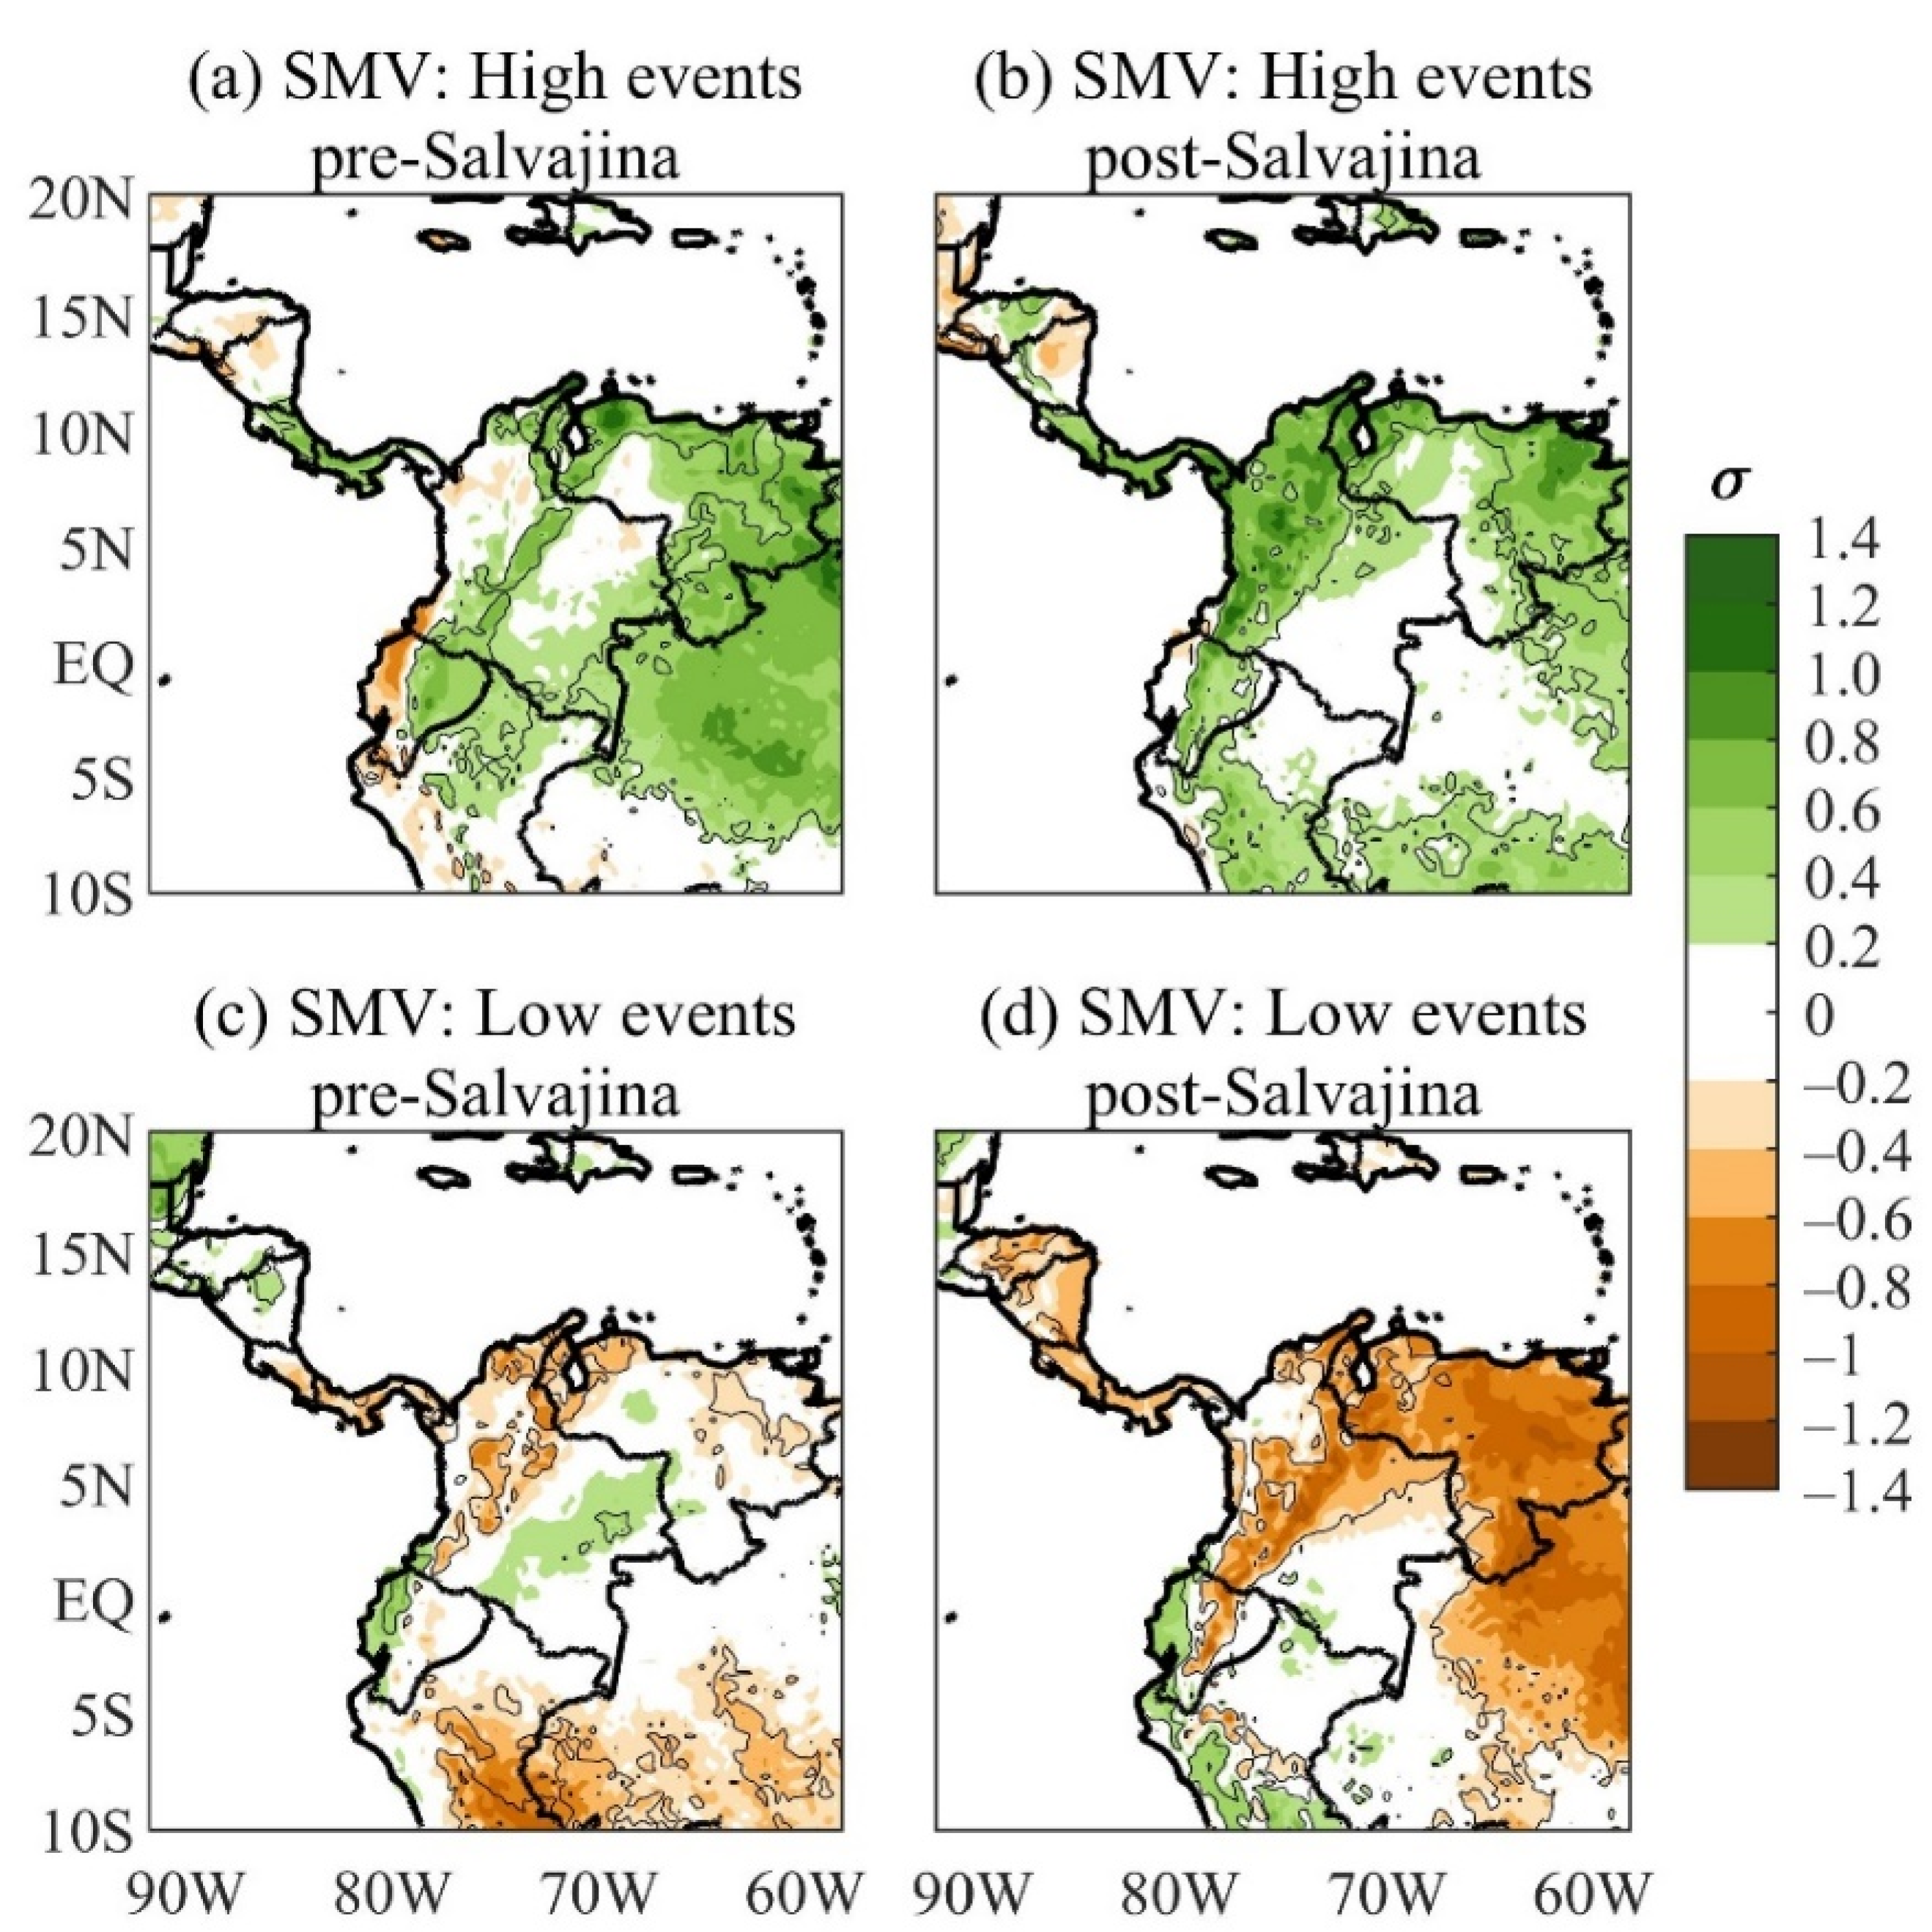
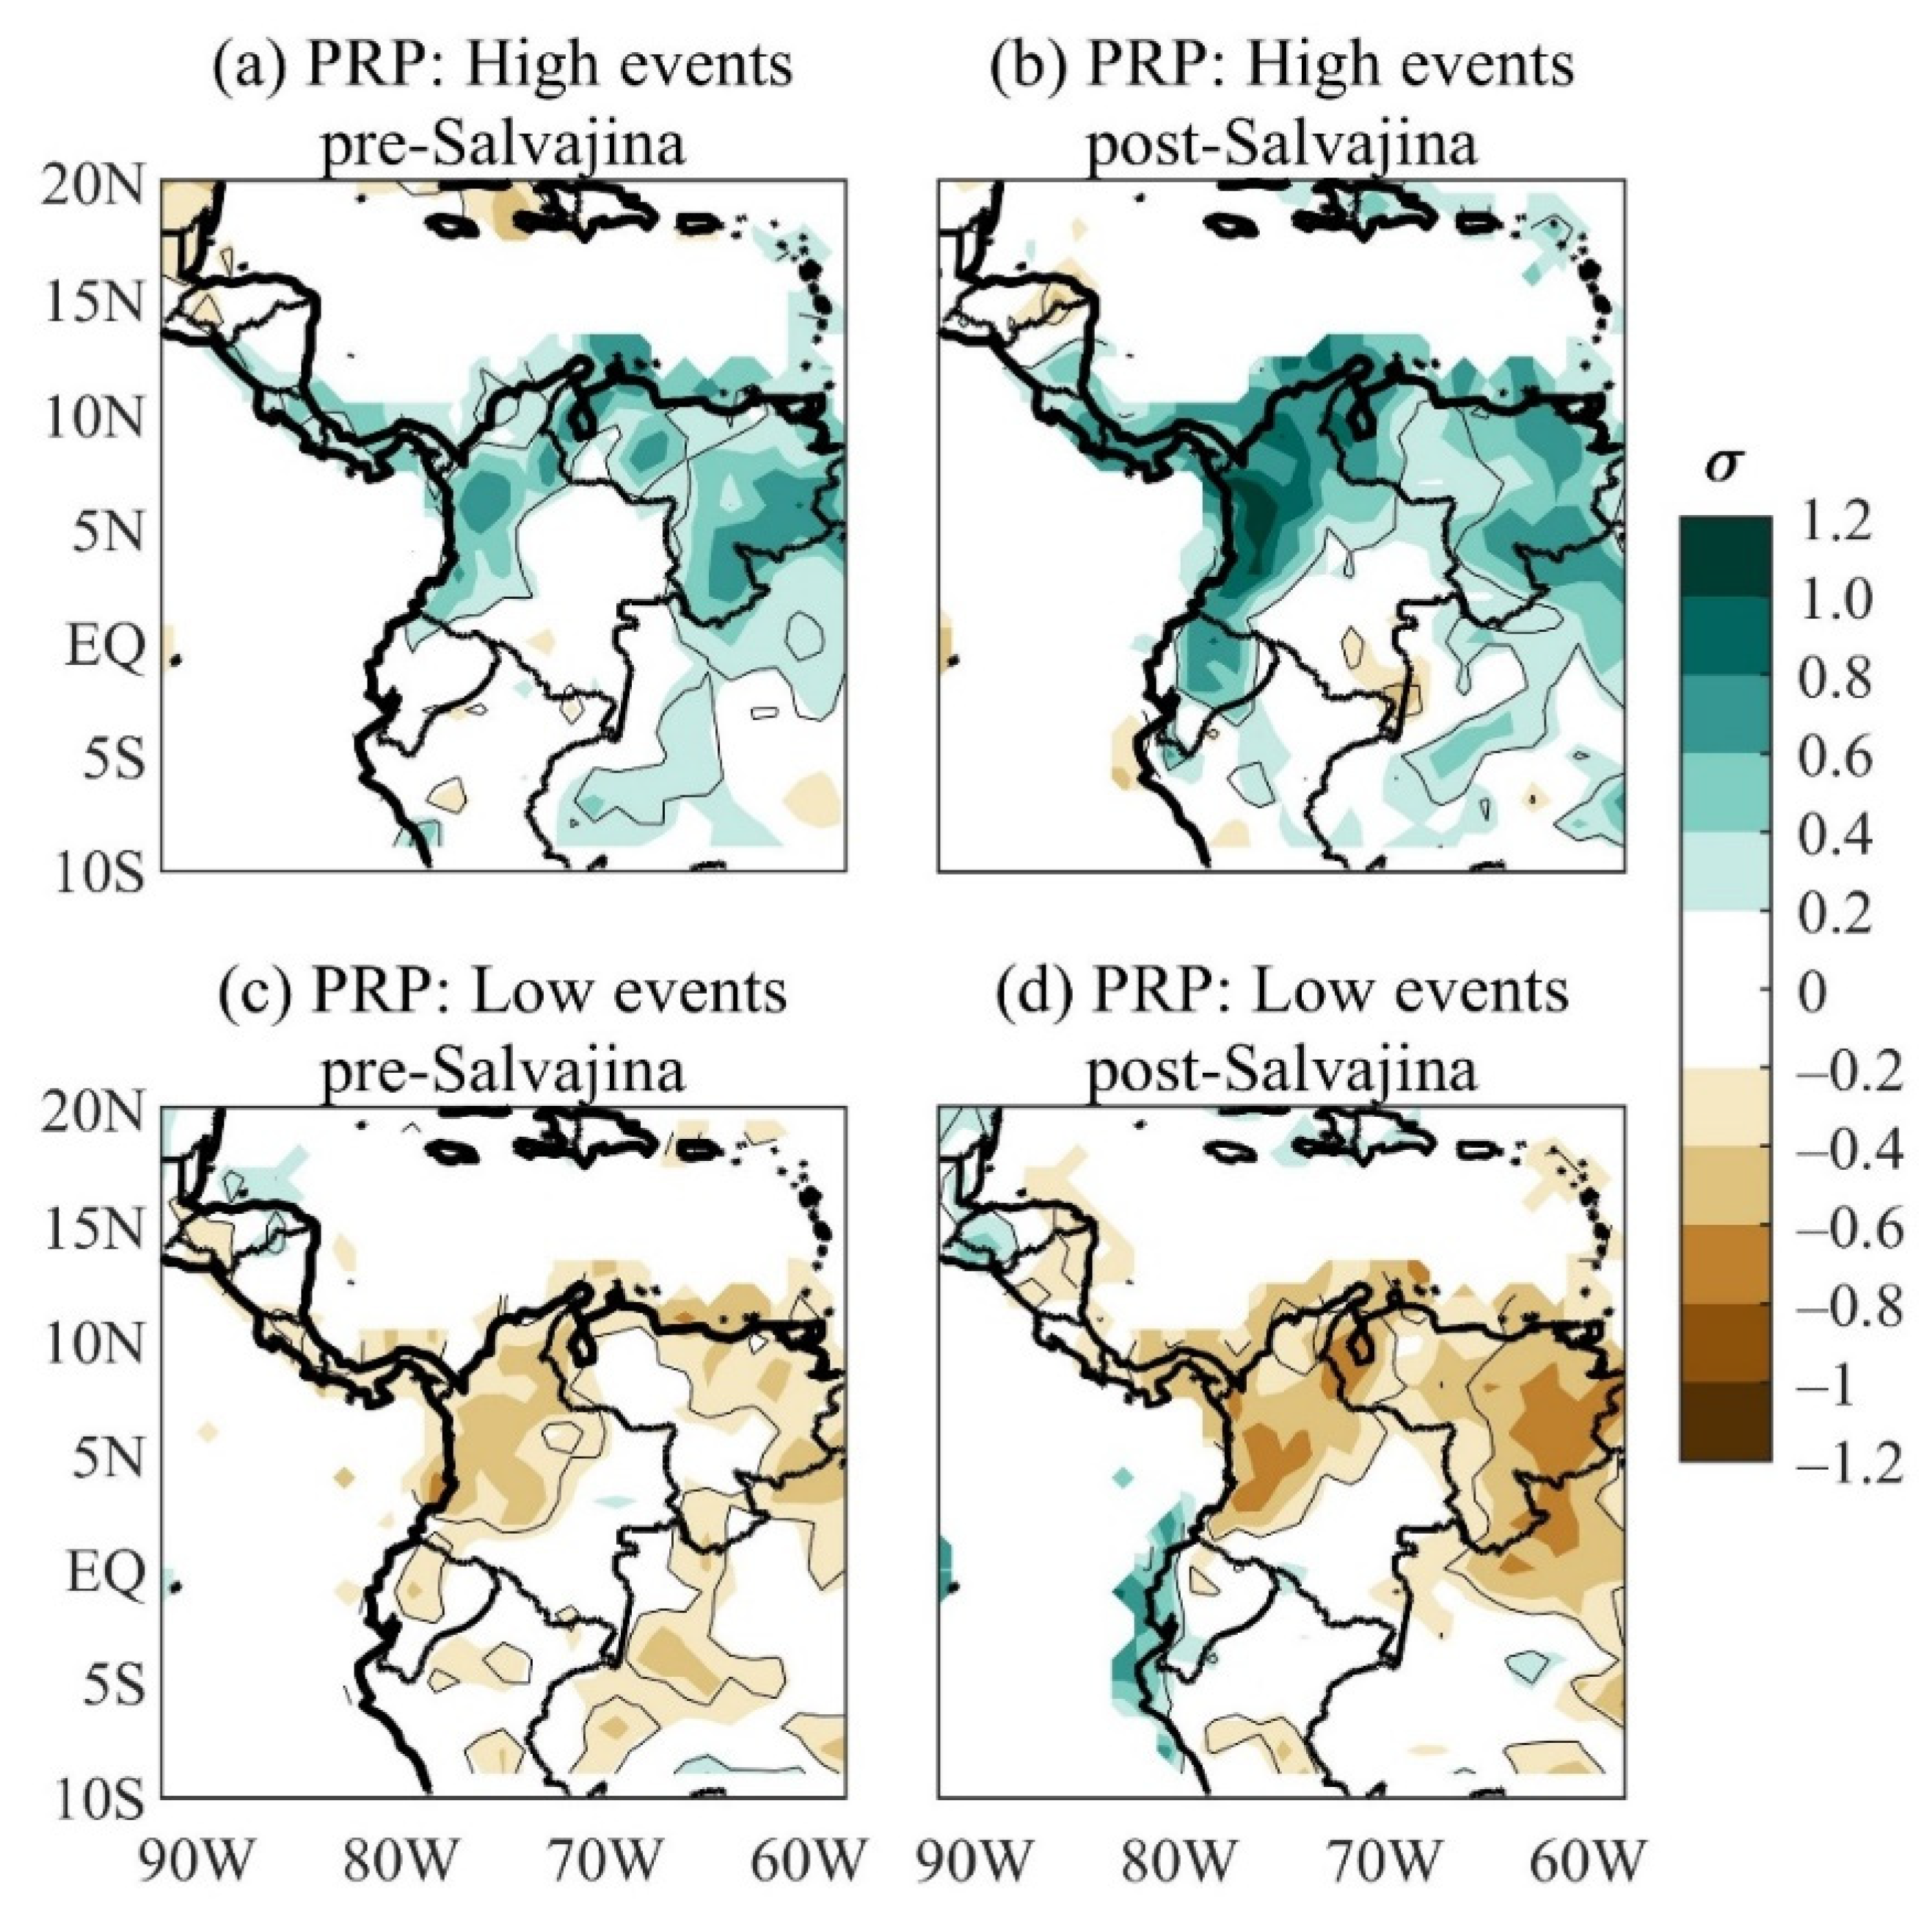
4.3. Anomalous Circulation, Precipitation, and Soil Moisture Conditions Pre- and Post-Salvajina
5. Conclusions
Author Contributions
Funding
Institutional Review Board Statement
Informed Consent Statement
Data Availability Statement
Acknowledgments
Conflicts of Interest
Appendix A

References
- Gutiérrez, J.P.; van Halem, D.; Rietveld, L.C. Particulate matter characterization of Cauca River water in Colombia (preprint). Hydrol. Earth Syst. Sci. Discuss. 2016, 1–20. [Google Scholar]
- Valencia, J.M.; García, C.E.; Montero, D. Anomalías de vegetación asociadas con el fenómeno del ENOS en el valle geográfico del río Cauca, Colombia. Rev. Teledetec. 2017, 2017, 89–100. [Google Scholar] [CrossRef] [Green Version]
- González-López, N.; Carvajal-Escobar, Y. Characterization of hydrological drought in the Cauca river high valley. Tecnol. Cienc. Agua 2020, 11, 235–264. [Google Scholar] [CrossRef]
- Enciso, A.; Carvajal Escobar, Y.; Sandoval, M. Hydrological analysis of historical floods in the upper valley of Cauca river. Ing. Compet. 2016, 18, 46. [Google Scholar]
- Sierra, J.P.; Arias, P.A.; Vieira, S.C. Precipitation over Northern South America and its seasonal variability as simulated by the CMIP5 models. Adv. Meteorol. 2015, 2015, 1–22. [Google Scholar] [CrossRef] [Green Version]
- Pulwarty, R.S.; Barry, R.G.; Hurst, C.M.; Sellinger, K.; Mogollon, L.F. Precipitation in the Venezuelan Andes in the context of regional climate. Meteorol. Atmos. Phys. 1998, 67, 217–237. [Google Scholar] [CrossRef]
- Poveda, G.; Jaramillo, L.; Vallejo, L.F. Seasonal precipitation patterns along pathways of South American low-level jets and aerial rivers. Water Resour. Res. 2014, 50, 98–118. [Google Scholar] [CrossRef]
- Morales, J.; Arias, P.; Martínez, J. Role of Caribbean low-level jet and Choco jet in the transport of moisture patterns towards Central America. Conf. Proc. Pap. 2017, 1, 4861. [Google Scholar]
- Bedoya-Soto, J.M.; Aristizábal, E.; Carmona, A.M.; Poveda, G. Seasonal Shift of the Diurnal Cycle of Rainfall Over Medellin’s Valley, Central Andes of Colombia (1998–2005). Front. Earth Sci. 2019, 7, 92. [Google Scholar] [CrossRef]
- Yepes, J.; Poveda, G.; Mejía, J.F.; Moreno, L.; Rueda, C. Choco-jex: A research experiment focused on the Chocó low-level jet over the far eastern Pacific and western Colombia. Bull. Am. Meteorol. Soc. 2019, 100, 779–796. [Google Scholar] [CrossRef]
- Cerón, W.L.; Andreoli, R.V.; Kayano, M.T.; Souza, R.A.F.; Jones, C.; Carvalho, L.M.V. The Influence of the Atlantic Multidecadal Oscillation on the Choco Low-Level Jet and Precipitation in Colombia. Atmosphere 2020, 11, 174. [Google Scholar] [CrossRef] [Green Version]
- Cerón, W.L.; Carvajal-Escobar, Y.; Andreoli, R.V.; Kayano, M.T.; González, N.L. Spatio-temporal analysis of the droughts in Cali, Colombia and their primary relationships with the El Niño-Southern Oscillation (ENSO) between 1971 and 2011. Atmosfera 2020, 33, 51–69. [Google Scholar] [CrossRef]
- Montealegre, J.E.; Pabón, J.D. La Variabilidad Climática Interanual Asociada Al Ciclo El Niño-La Niña–Oscilación Del Sur Y Su Efecto En El Patrón Pluviométrico De Colombia. Meteorol. Colomb. 2000, 2, 7–21. [Google Scholar]
- Poveda, G.; Jaramillo, A.; Gil, M.M.; Quiceno, N.; Mantilla, R.I. Seasonally in ENSO-related precipitation, river discharges, soil moisture, and vegetation index in Colombia. Water Resour. Res. 2001, 37, 2169–2178. [Google Scholar] [CrossRef]
- Hoyos, I.; Baquero-Bernal, A.; Jacob, D.; Rodríguez, B. Variability of extreme events in the Colombian Pacific and Caribbean catchment basins. Clim. Dyn. 2013, 40, 1985–2003. [Google Scholar] [CrossRef]
- Hoyos, N.; Escobar, J.; Restrepo, J.; Arango, A.; JC, O. Impact of the 2010-2011 La Niña phenomenon in Colombia, South America: The human toll of an extreme weather event. Appl. Geogr. 2013, 39, 16–25. [Google Scholar] [CrossRef]
- Tedeschi, R.G.; Cavalcanti, I.F.A.; Grimm, A.M. Influences of two types of ENSO on South American precipitation. Int. J. Climatol. 2013, 33, 1382–1400. [Google Scholar] [CrossRef]
- Arias, P.A.; Martínez, J.A.; Vieira, S.C. Moisture sources to the 2010–2012 anomalous wet season in northern South America. Clim. Dyn. 2015, 45, 2861–2884. [Google Scholar] [CrossRef]
- Córdoba-Machado, S.; Palomino-Lemus, R.; Gámiz-Fortis, S.R.; Castro-Díez, Y.; Esteban-Parra, M.J. Influence of tropical Pacific SST on seasonal precipitation in Colombia: Prediction using El Niño and El Niño Modoki. Clim. Dyn. 2015, 44, 1293–1310. [Google Scholar] [CrossRef]
- Cai, W.; McPhaden, M.J.; Grimm, A.M.; Rodrigues, R.R.; Taschetto, A.S.; Garreaud, R.D.; Dewitte, B.; Poveda, G.; Ham, Y.-G.; Santoso, A.; et al. Climate impacts of the El Niño–Southern Oscillation on South America. Nat. Rev. Earth Environ. 2020, 1, 215–231. [Google Scholar] [CrossRef]
- Cerón, W.L.; Kayano, M.T.; Andreoli, R.V.; Canchala, T.; Carvajal-Escobar, Y.; Alfonso-Morales, W. Rainfall variability in Southwestern Colombia: Changes in ENSO—Related features. Pure Appl. Geophys. 2021, 178, 1–17. [Google Scholar] [CrossRef]
- Cerón, W.L.; Andreoli, R.V.; Kayano, M.T.; Avila-Diaz, A. Role of the eastern Pacific-Caribbean Sea SST gradient in the Choco low-level jet variations from 1900–2015. Clim. Res. 2021, 83, 61–74. [Google Scholar] [CrossRef]
- Ávila, Á.; Guerrero, F.C.; Escobar, Y.C.; Justino, F. Recent precipitation trends and floods in the Colombian Andes. Water 2019, 11, 379. [Google Scholar] [CrossRef] [Green Version]
- Ocampo, C.; Carvajal-Escobar, Y.; Peña, L.E. Storm Water Management Model Simulation and Evaluation of the Eastern urban drainage system of Cali in the face of climate variability scenarios. Ing. Compet. 2019, 21, 1–11. [Google Scholar]
- Ojeda-Flechas, C.D.; Burbano-Rodríguez, J.A.; Carvajal-Escobar, Y.; Hernández-Torres, F.L. Characterization of comprehensive drought events associated with the ENSO warm phase through satellite images in the Valle del Cauca, Colombia. Dyna 2020, 87, 204–214. [Google Scholar] [CrossRef]
- Ocampo-Marulanda, C.; Carvajal-Escobar, Y.; Perafán-Cabrera, A.; Restrepo-Jiménez, L.M. Desiccation of Wetlands and Their Influence on the Regional Climate. Case Study: Ciénaga de Aguablanca, Cali, Colombia. Trop. Conserv. Sci. 2021, 14, 1–15. [Google Scholar] [CrossRef]
- Bocanegra, R.A.; Stamm, J. Evaluation of alternatives to optimize the flood management in the department of Valle del Cauca. J. Appl. Water Eng. Res. 2021, 9, 1–19. [Google Scholar] [CrossRef]
- Poveda, G. La hidroclimatología de Colombia: Una síntesis desde la escala inter-decadal hasta la escala diurna. Rev. Acad. Colomb. Cienc. 2004, 28, 201–222. [Google Scholar]
- Poveda, G.; Álvarez, D.M.; Rueda, Ó.A. Hydro-climatic variability over the Andes of Colombia associated with ENSO: A review of climatic processes and their impact on one of the Earth’s most important biodiversity hotspots. Clim. Dyn. 2011, 36, 2233–2249. [Google Scholar] [CrossRef]
- Gutiérrez, F.; Dracup, J.A. An analysis of the feasibility of long-range streamflow forecasting for Colombia using El Niño–Southern Oscillation indicators. J. Hydrol. 2001, 246, 181–196. [Google Scholar] [CrossRef]
- Vélez-Torres, I.; Vélez-Galeano, H. Acaparamiento del Agua y Despojo de la Tierra en el alto Cauca: Estudio Crítico Sobre (in)justicia Hídrica y Derecho al Agua en Colombia. Nuestro Derecho al Agua Proy. del Planeta Azul. Ottawa, ON, USA. 2012. Available online: https://biblioteca.cejamericas.org/bitstream/handle/2015/405/Nuestra_derecho_al_agua.pdf?sequence=1&isAllowed=y (accessed on 17 November 2021).
- Velásquez, A.; Jiménez, N. La Gestión de Riesgos en el Ordenamiento Territorial: Inundaciones en Cali, la C.V.C. y el Fenómeno ENSO. In Proceedings of the Seminario Internacional Ambiental CVC 50 Años, Cali, Colombia, 13–17 September 2004; p. 18. Available online: https://www.osso.org.co/docu/congresos/2004/A_Velasquez_Articulo_OSSO-UV.pdf (accessed on 17 November 2021).
- Perafán-Cabrera, A. Transformaciones paisajisticas en la zona plana vallecaucana. Hist. Espac. 2005, 1, 111–139. [Google Scholar] [CrossRef] [Green Version]
- Armenteras, D.; Rodríguez, N.; Retana, J.; Morales, M. Understanding deforestation in montane and lowland forests of the Colombian Andes. Reg. Environ. Chang. 2011, 11, 693–705. [Google Scholar] [CrossRef]
- Sanchez-Cuervo, A.M.; Aide, T.M. Identifying hotspots of deforestation and reforestation in Colombia (2001–2010): Implications for protected areas. Ecosphere 2013, 4, 1–21. [Google Scholar] [CrossRef]
- Restrepo, J.D.; Kettner, A.J.; Syvitski, J.P.M. Recent deforestation causes rapid increase in river sediment load in the Colombian Andes. Anthropocene 2015, 10, 13–28. [Google Scholar] [CrossRef]
- Capotondi, A.; Wittenberg, A.T.; Newman, M.; Di Lorenzo, E.; Yu, J.Y.; Braconnot, P.; Cole, J.; Dewitte, B.; Giese, B.; Guilyardi, E.; et al. Understanding ENSO diversity. Bull. Am. Meteorol. Soc. 2015, 96, 921–938. [Google Scholar] [CrossRef]
- Yeh, S.W.; Kirtman, B.P. ENSO amplitude changes due to climate change projections in different coupled models. J. Clim. 2007, 20, 203–217. [Google Scholar] [CrossRef]
- Dommenget, D.; Yu, Y. The effects of remote SST forcings on ENSO dynamics, variability and diversity. Clim. Dyn. 2017, 49, 2605–2624. [Google Scholar] [CrossRef]
- Abish, B.; Cherchi, A.; Ratna, S.B. ENSO and the recent warming of the Indian Ocean. Int. J. Climatol. 2018, 38, 203–214. [Google Scholar] [CrossRef] [Green Version]
- Wang, B.; An, S.I. A mechanism for decadal changes of ENSO behavior: Roles of background wind changes. Clim. Dyn. 2002, 18, 475–486. [Google Scholar]
- Meehl, G.A.; Hu, A.; Santer, B.D. The mid-1970s climate shift in the pacific and the relative roles of forced versus inherent decadal variability. J. Clim. 2009, 22, 780–792. [Google Scholar] [CrossRef]
- Restrepo, J.D.; Kjerfve, B. Magdalena river: Interannual variability (1975–1995) and revised water discharge and sediment load estimates. J. Hydrol. 2000, 235, 137–149. [Google Scholar] [CrossRef]
- Comisión Económica para América Latina y el Caribe (CEPAL). Valoración de Daños y Pérdidas: Ola Invernal en Colombia 2010–2011; Naciones Unidas: Bogotá, Colombia, 2013; ISBN 9789585754409. Available online: https://repositorio.cepal.org/handle/11362/37958 (accessed on 17 November 2021).
- Poveda, G.; Álvarez, D.M. El colapso de la hipótesis de estacionariedad por cambio y variabilidad climática: Implicaciones para el diseño hidrológico en ingeniería. Rev. Ing. 2012, 36, 65–76. [Google Scholar] [CrossRef]
- Sedano-Cruz, K.; Carvajal-Escobar, Y.; Ávila, Á. Análisis de aspectos que incrementan el riesgo de inundaciones en Colombia. Rev. Luna Azul 2013, 37, 219–238. [Google Scholar]
- Jacox, M.G.; Hazen, E.L.; Zaba, K.D.; Rudnick, D.L.; Edwards, C.A.; Moore, A.M.; Bograd, S.J. Impacts of the 2015–2016 El Niño on the California Current System: Early assessment and comparison to past events. Geophys. Res. Lett. 2016, 43, 7072–7080. [Google Scholar] [CrossRef]
- Martínez, R.; Zambrano, E.; Nieto, J.J.; Hernández, J.; Costa, F. Evolución, vulnerabilidad e impactos económicos y sociales de El Niño 2015-2016 en América Latina. Investig. Geográficas 2017, 68, 65–78. [Google Scholar] [CrossRef] [Green Version]
- Unidad Nacional para la Gestión del Riesgo de Desastres (UNGRD). In Fenomeno El Niño. Análisis Comparativo 1997–1998//2014–2016; Milena Mor: Bogotá, Colombia, 2016; ISBN 978-958-56017-0-3.
- Corporación Autónoma Regional del Valle del Cauca—CVC. Centro Internacional de Agricultura Tropical—CIAT. In Plan Integral de Cambio Climático para el Valle del Cauca PICC; CVC and CIAT: Cali, Colombia, 2018. Available online: https://www.valledelcauca.gov.co/documentos/11533/plan-integral-de-cambio-climatico-del-valle-del-cauca-picc/ (accessed on 17 November 2021).
- Departamento Administrativo Nacional de Estadística—DANE Censo Nacional de Población y Vivienda—CNPV. 2018. Available online: https://www.dane.gov.co/index.php/estadisticas-por-tema/demografia-y-poblacion/proyecciones-de-poblacion (accessed on 10 May 2021).
- Puertas, O.O.; Carvajal-Escobar, Y.; Quintero, A.M. Estudio de tendencias de la precipitación mensual en la cuenca alta-media del río Cauca, Colombia. Dyna 2011, 78, 112–120. [Google Scholar]
- Cerón, W.L.; Andreoli, R.V.; Kayano, M.T.; de Ferreria, S.R.; Canchala, N.T.; Carvajal-Escobar, Y. Comparison of spatial interpolation methods for annual and seasonal rainfall in two hotspots of biodiversity in South America. An. Acad. Bras. Ciencias 2021, 93, 1–22. [Google Scholar] [CrossRef] [PubMed]
- Guzmán, D.; Ruíz, J.F.; Cadena, M. Regionalización de Dolombia Según la Estacionalidad de la Precipitación Media Mensual, a Través Análisis de Componentes Principales (ACP); IDEAM: Bogotá, Colombia, 2014. [Google Scholar]
- Corporación Autónoma Regional del Valle del Cauca—CVC. Análisis Hidráulico de las Crecientes Históricas del Río Cauca; Convenio de Asociación No.001 de 2013 ASOCARS—UNIVERSIDAD DEL VALLE: Cali, Colombia, 2013. [Google Scholar]
- Hersbach, H.; Bell, B.; Berrisford, P.; Hirahara, S.; Horányi, A.; Muñoz-Sabater, J.; Nicolas, J.; Peubey, C.; Radu, R.; Schepers, D.; et al. The ERA5 global reanalysis. Q. J. R. Meteorol. Soc. 2020, 146, 1999–2049. [Google Scholar] [CrossRef]
- Hoffmann, L.; Günther, G.; Li, D.; Stein, O.; Wu, X.; Griessbach, S.; Heng, Y.; Konopka, P.; Müller, R.; Vogel, B.; et al. From ERA-Interim to ERA5: The considerable impact of ECMWF’s next-generation reanalysis on Lagrangian transport simulations. Atmos. Chem. Phys. 2019, 19, 3097–3214. [Google Scholar] [CrossRef] [Green Version]
- Cerón, W.L.; Kayano, M.T.; Andreoli, R.V.; Avila-Diaz, A.; Ayes, I.; Freitas, E.D.; Martins, J.A.; Souza, R.A.F. Recent intensification of extreme precipitation events in the La Plata Basin in Southern South America (1981–2018). Atmos. Res. 2021, 249, 105299. [Google Scholar] [CrossRef]
- Avila-Diaz, A.; Bromwich, D.H.; Wilson, A.B.; Justino, F.; Wang, S.-H. Climate Extremes across the North American Arctic in Modern Reanalyses. J. Clim. 2021, 34, 2385–2410. [Google Scholar] [CrossRef]
- Yuan, P.; Hunegnaw, A.; Alshawaf, F.; Awange, J.; Klos, A.; Norman, F. Remote Sensing of Environment Feasibility of ERA5 integrated water vapor trends for climate change analysis in continental Europe: An evaluation with GPS (1994–2019) by considering statistical significance. Remote. Sens. Environ. 2021, 260, 112416. [Google Scholar] [CrossRef]
- Aguirre, C.; Flores-Aqueveque, V.; Vilches, P.; Vásquez, A.; Rutllant, J.A.; Garreaud, R. Recent Changes in the Low-Level Jet along the Subtropical West Coast of South America. Atmosphere 2021, 12, 465. [Google Scholar] [CrossRef]
- Gil Ruiz, S.A.; Barriga, J.E.C.; Martínez, J.A. Wind power assessment in the Caribbean region of Colombia, using ten-minute wind observations and ERA5 data. Renew. Energy 2021, 172, 158–176. [Google Scholar] [CrossRef]
- Baker, J.C.A.; Castilho de Souza, D.; Kubota, P.Y.; Buermann, W.; Coelho, C.A.S.; Andrews, M.B.; Gloor, M.; Garcia-Carreras, L.; Figueroa, S.N.; Spracklen, D.V. An Assessment of Land–Atmosphere Interactions over South America Using Satellites, Reanalysis, and Two Global Climate Models. J. Hydrometeorol. 2021, 22, 905–922. [Google Scholar] [CrossRef]
- Schneider, U.; Finger, P.; Meyer-Christoffer, A.; Rustemeier, E.; Ziese, M.; Becker, A. Evaluating the hydrological cycle over land using the newly-corrected precipitation climatology from the Global Precipitation Climatology Centre (GPCC). Atmosphere 2017, 8, 52. [Google Scholar] [CrossRef] [Green Version]
- NOAA/ESRL/GPCC—National Oceanic and Atmospheric Administra-tion/Earth System Research Laboratory/Global Precipitation Climatology Centre Monthly Gridded Precipitation Data. Available online: https://psl.noaa.gov/data/gridded/ (accessed on 1 June 2021).
- Pohlert, T. Non-Parametric Trend Tests and Change-Point Detection. Available online: https://mran.microsoft.com/snapshot/2016-06-30/web/packages/trend/vignettes/trend.pdf (accessed on 9 November 2021).
- Mann, H.B.; Whitney, D.R. On a Test of Whether one of Two Random Variables is Stochastically Larger than the other. Ann. Math. Stat. 1947, 18, 50–60. [Google Scholar] [CrossRef]
- Mann, H.B. Nonparametric Tests against Trend. Econometrica 1945, 13, 245–259. [Google Scholar] [CrossRef]
- Kendall, M.G. Rank Correlation Methods; Griffin: London, UK, 1975; ISBN 0852641990. [Google Scholar]
- Theil, H. A rank-invariant method of linear and polynomial regression analysis, 3; confidence regions for the parameters of polynomial regression equations. Indag. Math. 1950, 1, 467–482. [Google Scholar]
- Theil, H. A Rank-Invariant Method of Linear and Polynomial Regression Analysis. In Advanced Studies in Theoretical and Applied Econometrics; Raj, B., Koerts, J., Eds.; Henri Theil’s Contributions to Economics and Econometrics; Springer: Dordrecht, The Netherlands, 1992; Volume 23. [Google Scholar]
- Sen, P.K. Estimates of the Regression Coefficient Based on Kendall’s Tau. J. Am. Stat. Assoc. 1968, 63, 1379–1389. [Google Scholar] [CrossRef]
- Avila-Diaz, A.; Justino, F.; Lindemann, D.S.; Rodrigues, J.M.; Ferreira, G.R. Climatological aspects and changes in temperature and precipitation extremes in viçosa-Minas Gerais. An. Acad. Bras. Cienc. 2020, 92, 1–19. [Google Scholar] [CrossRef] [PubMed]
- Keggenhoff, I.; Elizbarashvili, M.; Amiri-Farahani, A.; King, L. Trends in daily temperature and precipitation extremes over Georgia, 1971-2010. Weather Clim. Extrem. 2014, 4, 75–85. [Google Scholar] [CrossRef] [Green Version]
- Ahmad, I.; Tang, D.; Wang, T.; Wang, M.; Wagan, B. Precipitation trends over time using Mann-Kendall and spearman’s Rho tests in swat river basin, Pakistan. Adv. Meteorol. 2015, 2015, 1–15. [Google Scholar] [CrossRef] [Green Version]
- Yue, S.; Pilon, P.; Phinney, B.; Cavadias, G. The influence of autocorrelation on the ability to detect trend in hydrological series. Hydrol. Process. 2002, 16, 1807–1829. [Google Scholar] [CrossRef]
- Pankaj, D. Pettitt Change Point Test for Univariate Time Series Data. Available online: https://www.mathworks.com/matlabcentral/fileexchange/60973-pettitt-change-point-test-for-univariate-time-series-data (accessed on 9 November 2021).
- Fatichi, S. Mann-Kendall Test. Available online: https://www.mathworks.com/matlabcentral/fileexchange/25531-mann-kendall-test (accessed on 9 November 2021).
- Tilgenkamp, A. Theil–Sen Estimator. Available online: https://www.mathworks.com/matlabcentral/fileexchange/34308-theil-sen-estimator (accessed on 9 November 2021).
- Cardillo, G. MWWTEST: Mann-Whitney-Wilcoxon Non Parametric Test for Two Unpaired Samples. Available online: http://www.mathworks.com/matlabcentral/fileexchange/25830 (accessed on 9 November 2021).
- Boschat, G.; Simmonds, I.; Purich, A.; Cowan, T.; Pezza, A.B. On the use of composite analyses to form physical hypotheses: An example from heat wave—SST associations. Sci. Rep. 2016, 6, 1–10. [Google Scholar]
- Ananias, D.d.S.; de Souza, E.B.; Souza, P.F.S.; de Souza, A.M.L.; Vitorino, M.I.; Teixeira, G.M.; Ferreira, D.B.d.S. Climatologia da estrutura vertical da atmosfera em novembro para Belém-PA. Rev. Bras. Meteorol. 2010, 25, 218–226. [Google Scholar] [CrossRef] [Green Version]
- Ayes Rivera, I.; Molina-Carpio, J.; Espinoza, J.C.; Gutierrez-Cori, O.; Cerón, W.L.; Frappart, F.; Armijos Cardenas, E.; Espinoza-Villar, R.; Ayala, J.M.; Filizola, N. The Role of the Rainfall Variability in the Decline of the Surface Suspended Sediment in the Upper Madeira Basin (2003–2017). Front. Water 2021, 3, 1–14. [Google Scholar] [CrossRef]
- de Souza, I.P.; Andreoli, R.V.; Kayano, M.T.; Vargas, F.F.; Cerón, W.L.; Martins, J.A.; Freitas, E.; de Souza, R.A.F. Seasonal precipitation variability modes over South America associated to El Niño-Southern Oscillation (ENSO) and non-ENSO components during the 1951–2016 period. Int. J. Climatol. 2021, 41, 4321–4338. [Google Scholar] [CrossRef]
- Wilks, D.S. Statistical Methods in the Atmospheric Sciences, 3rd ed.; Wilks, D.S., Ed.; Academic Press: San Diego, CA, USA, 2011; ISBN 9780123850232. [Google Scholar]
- Panofsky, H.G.; Brier, G.W. Some Applications of Statistics to Meteorology; Mineral Industries Extension Services; College of Mineral Industries, Pennsylvania State University: State College, PA, USA, 1958. [Google Scholar]
- Poveda, G.; Mesa, O.J. Feedbacks between hydrological processes in tropical South America and large-scale ocean-atmospheric phenomena. J. Clim. 1997, 10, 2690–2702. [Google Scholar] [CrossRef]
- Canchala, T.; Cerón, W.L.; Francés, F.; Carvajal-Escobar, Y.; Andreoli, R.V.; Kayano, M.T.; Alfonso-Morales, W.; Caicedo-Bravo, E.; de Souza, R.A.F. Streamflow variability in colombian pacific basins and their teleconnections with climate indices. Water 2020, 12, 526. [Google Scholar] [CrossRef] [Green Version]
- Vicente-Serrano, S.M.; Aguilar, E.; Martínez, R.; Martín-Hernández, N.; Azorin-Molina, C.; Sanchez-Lorenzo, A.; El Kenawy, A.; Tomás-Burguera, M.; Moran-Tejeda, E.; López-Moreno, J.I.; et al. The complex influence of ENSO on droughts in Ecuador. Clim. Dyn. 2017, 48, 405–427. [Google Scholar] [CrossRef] [Green Version]
- Cai, W.; Wang, G.; Santoso, A.; Mcphaden, M.J.; Wu, L.; Jin, F.F.; Timmermann, A.; Collins, M.; Vecchi, G.; Lengaigne, M.; et al. Increased frequency of extreme La Niña events under greenhouse warming. Nat. Clim. Chang. 2015, 5, 132–137. [Google Scholar] [CrossRef]
- Poveda, G.; Mesa, O.J. On the Existence of Lloró (the Rainiest Locality on Earth): Enhanced Ocean-Land-Atmosphere Interaction by a Low-Level Jet. Geophys. Res. Lett. 2000, 27, 1675–1678. [Google Scholar] [CrossRef] [Green Version]
- Sierra, J.P.; Arias, P.A.; Vieira, S.C.; Agudelo, J. How well do CMIP5 models simulate the low-level jet in western Colombia? Clim. Dyn. 2018, 51, 2247–2265. [Google Scholar] [CrossRef]
- Abelen, S.; Seitz, F.; Abarca-del-Rio, R.; Güntner, A. Droughts and floods in the La Plata Basin in soil moisture data and GRACE. Remote Sens. 2015, 7, 7324–7349. [Google Scholar] [CrossRef] [Green Version]
- Wasko, C.; Nathan, R. Influence of changes in rainfall and soil moisture on trends in flooding. J. Hydrol. 2019, 575, 432–441. [Google Scholar] [CrossRef]


| High | Mean Discharge (m3/s) | ENSO Type | Low | Mean Discharge (m3/s) | ENSO Type | |
|---|---|---|---|---|---|---|
| Pre-Dam Period | 1953–54 | 331 | W-EN | 1957–58 | 175 | S-EN |
| 1954–55 | 457 | W-LN | 1958–59 | 184 | W-EN | |
| 1955–56 | 483 | M-LN | 1959–60 | 198 | N | |
| 1966–67 * | 494 | N | 1961–62 | 207 | N | |
| 1970–71 * | 467 | M-LN | 1972–73 | 171 | S-EN | |
| 1973–74 * | 478 | S-LN | 1976–77 | 172 | W-EN | |
| 1974–75 * | 323 | W-LN | 1979–80 | 216 | W-EN | |
| 1975–76 | 454 | S-LN | 1980–81 | 190 | N | |
| Post-Dam Period | 1988–89 * | 354 | S-LN | 1987–88 | 139 | S-EN |
| 1998–99 * | 339 | S-LN | 1992–93 | 135 | N | |
| 1999–00 | 372 | S-LN | 1997–98 | 136 | VS-EN | |
| 2007–08 | 292 | S-LN | 2002–03 | 124 | M-EN | |
| 2008–09 * | 322 | W-LN | 2006–07 | 143 | W-EN | |
| 2010–11 * | 366 | S-LN | 2009–10 | 104 | M-EN | |
| 2011–12 * | 342 | M-LN | 2012–13 | 112 | N | |
| 2017–18 | 281 | W-LN | 2015–16 | 53 | VS-EN |
Publisher’s Note: MDPI stays neutral with regard to jurisdictional claims in published maps and institutional affiliations. |
© 2021 by the authors. Licensee MDPI, Basel, Switzerland. This article is an open access article distributed under the terms and conditions of the Creative Commons Attribution (CC BY) license (https://creativecommons.org/licenses/by/4.0/).
Share and Cite
Cerón, W.L.; Kayano, M.T.; Ocampo-Marulanda, C.; Canchala, T.; Rivera, I.A.; Avila-Diaz, A.; Andreoli, R.V.; de Souza, I.P. Spatio-Temporal Variability of Hydroclimatology in the Upper Cauca River Basin in Southwestern Colombia: Pre- and Post-Salvajina Dam Perspective. Atmosphere 2021, 12, 1527. https://0-doi-org.brum.beds.ac.uk/10.3390/atmos12111527
Cerón WL, Kayano MT, Ocampo-Marulanda C, Canchala T, Rivera IA, Avila-Diaz A, Andreoli RV, de Souza IP. Spatio-Temporal Variability of Hydroclimatology in the Upper Cauca River Basin in Southwestern Colombia: Pre- and Post-Salvajina Dam Perspective. Atmosphere. 2021; 12(11):1527. https://0-doi-org.brum.beds.ac.uk/10.3390/atmos12111527
Chicago/Turabian StyleCerón, Wilmar L., Mary T. Kayano, Camilo Ocampo-Marulanda, Teresita Canchala, Irma Ayes Rivera, Alvaro Avila-Diaz, Rita V. Andreoli, and Itamara Parente de Souza. 2021. "Spatio-Temporal Variability of Hydroclimatology in the Upper Cauca River Basin in Southwestern Colombia: Pre- and Post-Salvajina Dam Perspective" Atmosphere 12, no. 11: 1527. https://0-doi-org.brum.beds.ac.uk/10.3390/atmos12111527