
Comparison of Inland Ship Emission Results from a Real-World Test and an AIS-Based Model

1
National Engineering Laboratory for Mobile Source Emission Control Technology, China Automotive Technology & Research Center Co., Ltd., Tianjin 300300, China
2
State Environmental Protection Key Laboratory of Vehicle Emission Control and Simulation, Chinese Research Academy of Environmental Sciences, Beijing 100012, China
3
State Key Joint Laboratory of Environmental Simulation and Pollution Control (ESPC), School of Environment, Tsinghua University, Beijing 100084, China
*
Author to whom correspondence should be addressed.
Atmosphere 2021, 12(12), 1611; https://0-doi-org.brum.beds.ac.uk/10.3390/atmos12121611
Submission received: 9 November 2021
/
Revised: 29 November 2021
/
Accepted: 30 November 2021
/
Published: 2 December 2021
(This article belongs to the Special Issue Greener Energy, Air Quality, and Carbon Neutrality)
Abstract
:Inland shipping is pivotal to the comprehensive transport system of China. However, ship emission has become a major air polluter in inland river regions, and relevant emission inventories are urgently needed. Currently, the Automatic identification System based (AIS-based)emission model is widely used in calculating the ocean-going ship emission inventory. However, due to the lack of AIS data in the river area, the inland ship emission inventory mainly uses the fuel consumption method. With the continuous improvement of AIS data quality in the river area, the AIS-based emission model can be adopted in the development of inland ship emission inventory. However, there are few studies on the evaluation of the accuracy of the inland ship emissions using the AIS-based emission model. This study makes a comparison between test data and model-calculated data to evaluate the accuracy of the AIS-based emission models. Inland ship activities are divided into being at berth, maneuvering (port departure and port arrival), and on cruise modes in an AIS-based emission model. The model-calculated CO2, HC, and NOx emission rates can cover those onboard emission test data, but the values from the model are much lower. The total average ratios of test data to model-calculated data for CO2, CO, HC, and NOx are 2.66, 19.12, 2.46, and 3.16 when engine loads are below 60%. In upstream cruise mode, average emission rates of CO2, CO, HC, and NOx from the real-world test are 1.91–6.48, 8.78–27.83, 3.05–8.96, and 4.06–5.96 times higher than those from the AIS-based model, respectively. However, those are only 1.08–1.51, 6.74–9.67, 2.03–3.75, and 1.65–2.75 times higher than those from the AIS-based model in downstream cruise mode.
1. Introduction
The prosperity of maritime trade is a major force driving China’s economic boom. Inland shipping has become an important part of China’s integrated transportation system as the inland waterway regulation progresses. The freight capacity of the Yangtze River’s trunk line surpassed 2.5 billion tons in 2017, an 8.2% increase from the same period last year, ranking the top among the world’s inland waterways. The cargo throughput of sizeable ports has increased from 1.86 billion tons to 2.44 billion tons, with that of river-sea transport amounting to 1.41 billion tons and taking up over half of the total [1]. During the same period, the cargo throughput of ports in the Jiangsu section of the Yangtze River has reached 1.71 billion tons with a 9.0% increase year on year, and its growth rate is 4.4% higher than the same period of the last year. Accounting for 68.4% of the annual cargo throughput of the Yangtze River’s trunk line [2], ports in the Jiangsu section of the Yangtze River is pivotal in cargo transportation along the Yangtze River.
Though being considered as one of the relative green and environmentally friendly ways of transportation, shipping exhausts a huge number of pollutants into the atmosphere, including SO2, NOx, PM, CO, and HC [3,4,5,6,7,8,9,10], as marine engines are typically high-power, using heavy oil, which has low oil quality and high sulfur concentration. According to the statistics, national ship emission consisted of 0.238 million tons of CO, 0.076 million tons of HC, 1.004 million tons of SO2, 0.145 million tons of PM, and 1.429 million tons of NOx in 2014 [11]. The CO2 emission of ships is also nonnegligible [12]. According to Liu‘ study [13], the fraction of CO2 emitted by shipping in Asia grew from 4% to 7% in 2002–2005 to 16% in 2013. In China, NOx and PM emissions from shipping were 34% and 29% of those emitted by motor vehicles, respectively, which means that ships have been one of the most contributor of air pollution in inland river regions. Moreover, the study found that PM2.5, PM10, DPM (diesel particulate matter), SO2, and NOx accounted for a significant share of the pollution in urban areas. The main reason is that the interaction of pollutants with the terrestrial weather and climate system forms secondary pollutants, such as fine particulate matter and ozone formation. Those pollutants are then transported to the inland regions by sea-land winds and further react, resulting in considerable climate change effects. Furthermore, ship emission areas highly overlap those densely populated areas, and those ships are offshore or nearshore most of the time. Pollutants are given out and disseminated by the wind, affecting the air quality and public health in the ports’ downwind area [13,14,15,16,17,18,19,20,21].
Emission inventory is an important tool for shipping pollution prevention and control. The research of Fu [22] and other researchers on air quality monitoring and the evaluation system for major events in China demonstrated that the emission inventory for dynamic control of air pollutants could provide the most fundamental and dynamic source ledger data for heavy pollution early warning and major event pollution control, as well as prevent air pollution and control fine and precise particles. Jalkanen [16,23] initially utilized the AIS-based STEAM (Ship Traffic Emission Assessment Model) model to calculate the emission of ships in Baltic Sea nations, and then upgraded and further applied the STEAM model, which included the calculation of PM and CO, and the analysis of shipping load and fuel. In addition, it was used to evaluate the influence of policies in the emission control region on air quality in European countries. Goldsworthy [24] used path regeneration to retrieve AIS trajectories of ships missing in coastal transit, and efficiently approximated ship emissions in locations without AIS data. Zeng [25] utilized the emission factor technique based on shipping activity to compute the ship emission inventory of entering and exiting Xiamen Port in 2018 and evaluated the ecological efficiency of the port based on environmental and social indicators and external cost evaluation tools. According to the analysis, the total SOx, NOx, HC, CO, PM2.5, PM2.0, and CO2e (carbon dioxide equivalent) emissions from ships at Xiamen Port in 2018 were 3222, 11,977, 490, 1118, 411, 542, and 710,374 t, respectively. Container ships were the most polluting shipping vessel, and the main engine pollutes the most. Lv [26] used AIS data to compile the emission inventory of Qingdao port shipping in 2016 and studied their regional emission features, and emission features of different shipping types, under different operating situations. Ships inside the baseline and 12 nautical miles beyond the baseline emitted 1.56, 2.34, 0.21, 0.18, 0.009, and 0.17 million tons of SO2, NOx, PM10, PM2.5, HC, and CO, respectively. The emissions from ships were mostly found along trunkline routes, ports, and anchorages. Yang [27] developed a gridded ship emission inventory of Shanghai Port in 2003 with a resolution of 1 km × 1 km based on ship engine power, significantly enhancing ship emission inventory accuracy and assessing the spatial distribution features of ship emissions. Kurtenbach [28] investigated the inland water transport emissions of NOx, CO2, and PM under real-world conditions on the river Rhine, Germany, in 2013. Specific meteorological parameters, such as relative humidity, temperature, and wind speed, were recorded and the number and types of ships passing the test ships were also counted. Pillot [29] set up reliable functions to derive simply pollutant emissions from engine speed for CO2, NOx, PM, and CO pollutant and for each vessel at various engine cruising speeds, which was helpful for establishing inland ship emission models.
Currently, ship emission inventory in China concentrates on ocean-going ships, underestimating inland river ships. The majority of studies on the air pollution emissions of inland river ships are using the fuel consumption method [6,30,31,32], which has a certain level of uncertainty. As AIS data quality of inland river vessels improves, using AIS data-based emission inventory for inland river vessels will be a major trend [33,34,35]. However, there are few studies on the accuracy of inland river vessels emission inventory using this method.
In this study, we measured real-world emissions of CO2, CO, HC, and NOx from nine inland ships by using a portable emission measurement system. In the meantime, an AIS-based emission model was applied to predict the emissions of those tested inland ships. Then, we evaluated the accuracy of AIS-based emission model by the comparison of emission rates from test data and model-calculated data. We also analyzed the influence of water flow direction on model-calculated results. Our study can provide an important reference for the future implementation of an AIS data-based inland river vessel emission inventory.
2. Research and Method
2.1. Experimental Section
2.1.1. Test Instruments
A test system combined with a SEMTECH-DS gaseous pollutant analyzer (SENSORS, INC., Saline, MI, USA) and an EFM2 tail gas mass flowmeter (SENSORS, INC., Saline, MI, USA) was employed in this study. SEMTECH-DS gas modules can measure gaseous pollutants from mobile sources. Supplementary Figure S1 depicts schematic diagram of the device. NDIR (Non-Dispersive Infrared Detector) was used to detect CO (Carbon monoxide) and CO2 (Carbon dioxide). THC (Hydrocarbon) data were collected by FID (Flame Ion Detector). The contents of NO (Nitric oxide) and NO2 (Nitrogen dioxide) were measured using the NDUV (Non-Dispersive Ultraviolet Detector). SEMTECH-DS should be warmed up for roughly an hour before working. To assure the accuracy of measurement results, pure N2 was used for zero adjustment after the warm-up, followed by accuracy and precision calibration using standard gas. The location (longitude, latitude, and altitude) and speed of test ships were recorded by GPS (Global Positioning System) integrated in SEMTECH-DS. In addition, mass flow rates were measured by SEMTECH EFM2 based on pitot tube technology. Table 1 lists the performance parameters of SEMTECH-DS.
For data transmission and collection, all test instruments in this study will be connected to a laptop computer. In addition to the above instrument, the entire test system contains a generator and a 12 V battery. The precise instruments information is listed in Table 2.
2.1.2. Study Area
There are two tested area in our test, including the Yangtze River and Pearl River, which were shown in Supplementary Figure S2. On the Yangtze River, the ship emissions from normally operating ships in the section of the Yangtze River trunk stream from Nanjing to Yangzhou in Jiangsu province were measured. On the Pearl River, ship emission tests were carried out from the Nanshan port (Guangzhou). Tested ships left the port and sailed northwards and then turned back to the Nanshan port.
2.1.3. Test Ships
A total of nine cargo ships were tested in this study, and the specific information of the tested ships is shown in Table 3. No. 1–No. 6 inland ships were tested from the Zhenjiang port to the Danyang port on the Grand Canal. No. 7–No. 9 inland ships were tested around the Nansha port on the Pearl River. Therefore, emissions during upstream and downstream voyages were tested on No. 7–No. 9 inland ships. The departure and arrival time of the test ships were also shown in Table 3. The tests of inland ships on the Yangtze River lasted for 85–100 min approximately, and those on the Pearl River lasted for around 60–120 min. The marine oil used in all tested inland ships generally consists of diesel fuels, which came from oil tanker ships near the port.
2.1.4. Test Operating Mode
The operating modes are generally classified into four types: port arrival, berthing, Port departure, and cruise. The test conditions are described in Table 4. In berth mode, an inverter is allocated to convert a battery pack of 12 V into 220 V alternating current to power the ship [36]. Hence, the engine emissions in berth mode are not taken into account.
2.2. AIS-Based Emission Model
2.2.1. Emission Calculation
In this study, inland ship emissions were calculated by using Equation (1), shown below:
where E is the engine emission, g; PMCR is the maximum continuous rated power of the main engine, kW; LF is the engine load, EF depicts the base emission factors of the propulsion engine using a certain sulfur content fuel, as described in the Supplementary Table S3, g/kWh; LLA is the low load adjustment for emission factor when the LF is lower than 20% (seen Supplementary Table S2); and T is the operation duration time on the vessel trip, in seconds. LF is calculated using Equation (2) as follows:
where Vactual is the actual speed, km/h, and Vmax is the design max speed, km/h.
In this study, PMCR and Vmax can be obtained from ship registration certificate (see Table 3). Vactual can be read from the GPS of the portable emission measurement system. For the operation duration time, we calculated the pollutant emissions per second.
2.2.2. Emission Factor
In the AIS-based emission model, emission factors of the main engine are presented in Table 5. For inland ships, marine engines generally used diesel oil, with the sulfur content below 0.15%. From Table 3, we can see that the marine engines of tested inland ships are medium-speed diesel engines, because the rated engine speed are 850–1400 RPM (see Table S1). As all tested inland ships were built in 2000–2010, their emission factors could be categorized under Tier 1.
2.2.3. Low Load Adjustment
When marine engine loads are below 20%, emission factors tend to increase as the load decreases [13]. A possible reason is that diesel engines are less efficient at low engine loads and fuel consumption tends to increase as the load decreases. Table S2 presents the emission factor adjustment factors at low loads.
3. Results and Discussion
3.1. Ship Activities Mode Selection
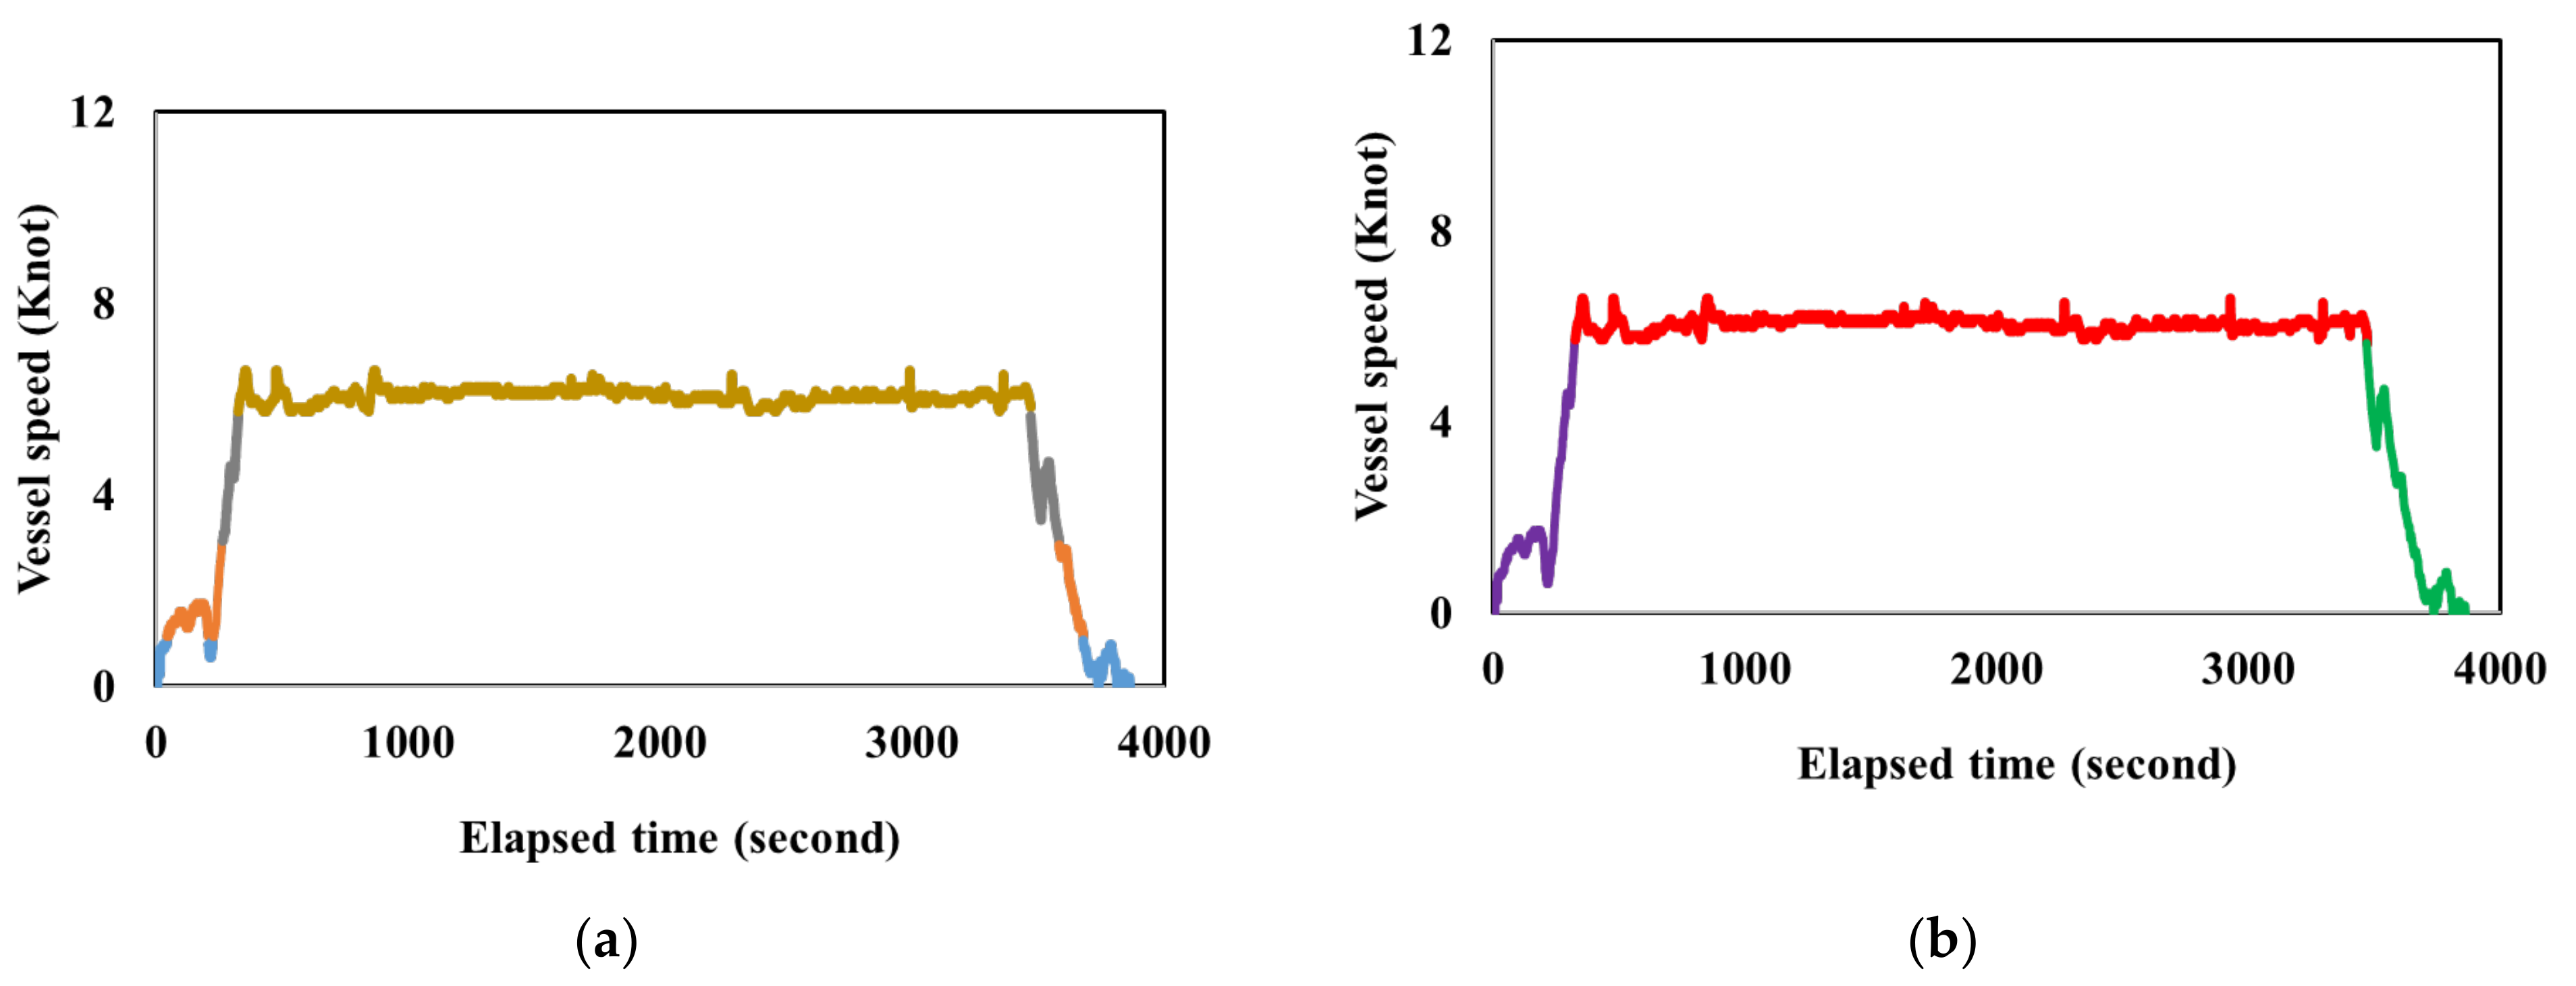
Figure 1 shows the operating modes of tested ship No. 1 based on two classification methods. Figure 1a shows the ship operating modes based on the AIS-based emission models. As shown, ship activities are broken down into four operation modes, including being “at berth”, “at anchorage”, “maneuvering”, and “at sea”, which are defined by ship speed and engine load (see Table S3). Figure 1b shows the ship operating modes according to the recent inland ship emission studies [13,37]. In those emission tests, ship operating modes are generally divided into cruise and maneuvering (port departure and port arrival) modes based on ship speed. According to the previous studies [37,38], ship operating modes are primarily used to figure out the engine load of auxiliary engines and boilers. Marine auxiliary engines are primarily used to power the ship, while boilers are used for heating purposes. However, numerous inland ship emission studies indicate that few inland ships are installed with auxiliary engines and boilers. Because ship owners usually use the main engine to generate power and storage batteries or small-size generators to supply electricity for daily life when the main engine is off. Therefore, the classification of operating modes has less reflection on inland ship emissions. In fact, inland ship operators often dock their ships in the port and tie up with other ships rather than anchor on the water. It is more reasonable to divide the inland ship activities into at berth, maneuvering (port departure and port arrival), and cruise modes.
3.2. Characteristic of Instantaneous Emission Rate from a Real-World Test and the AIS-Based Emission Model
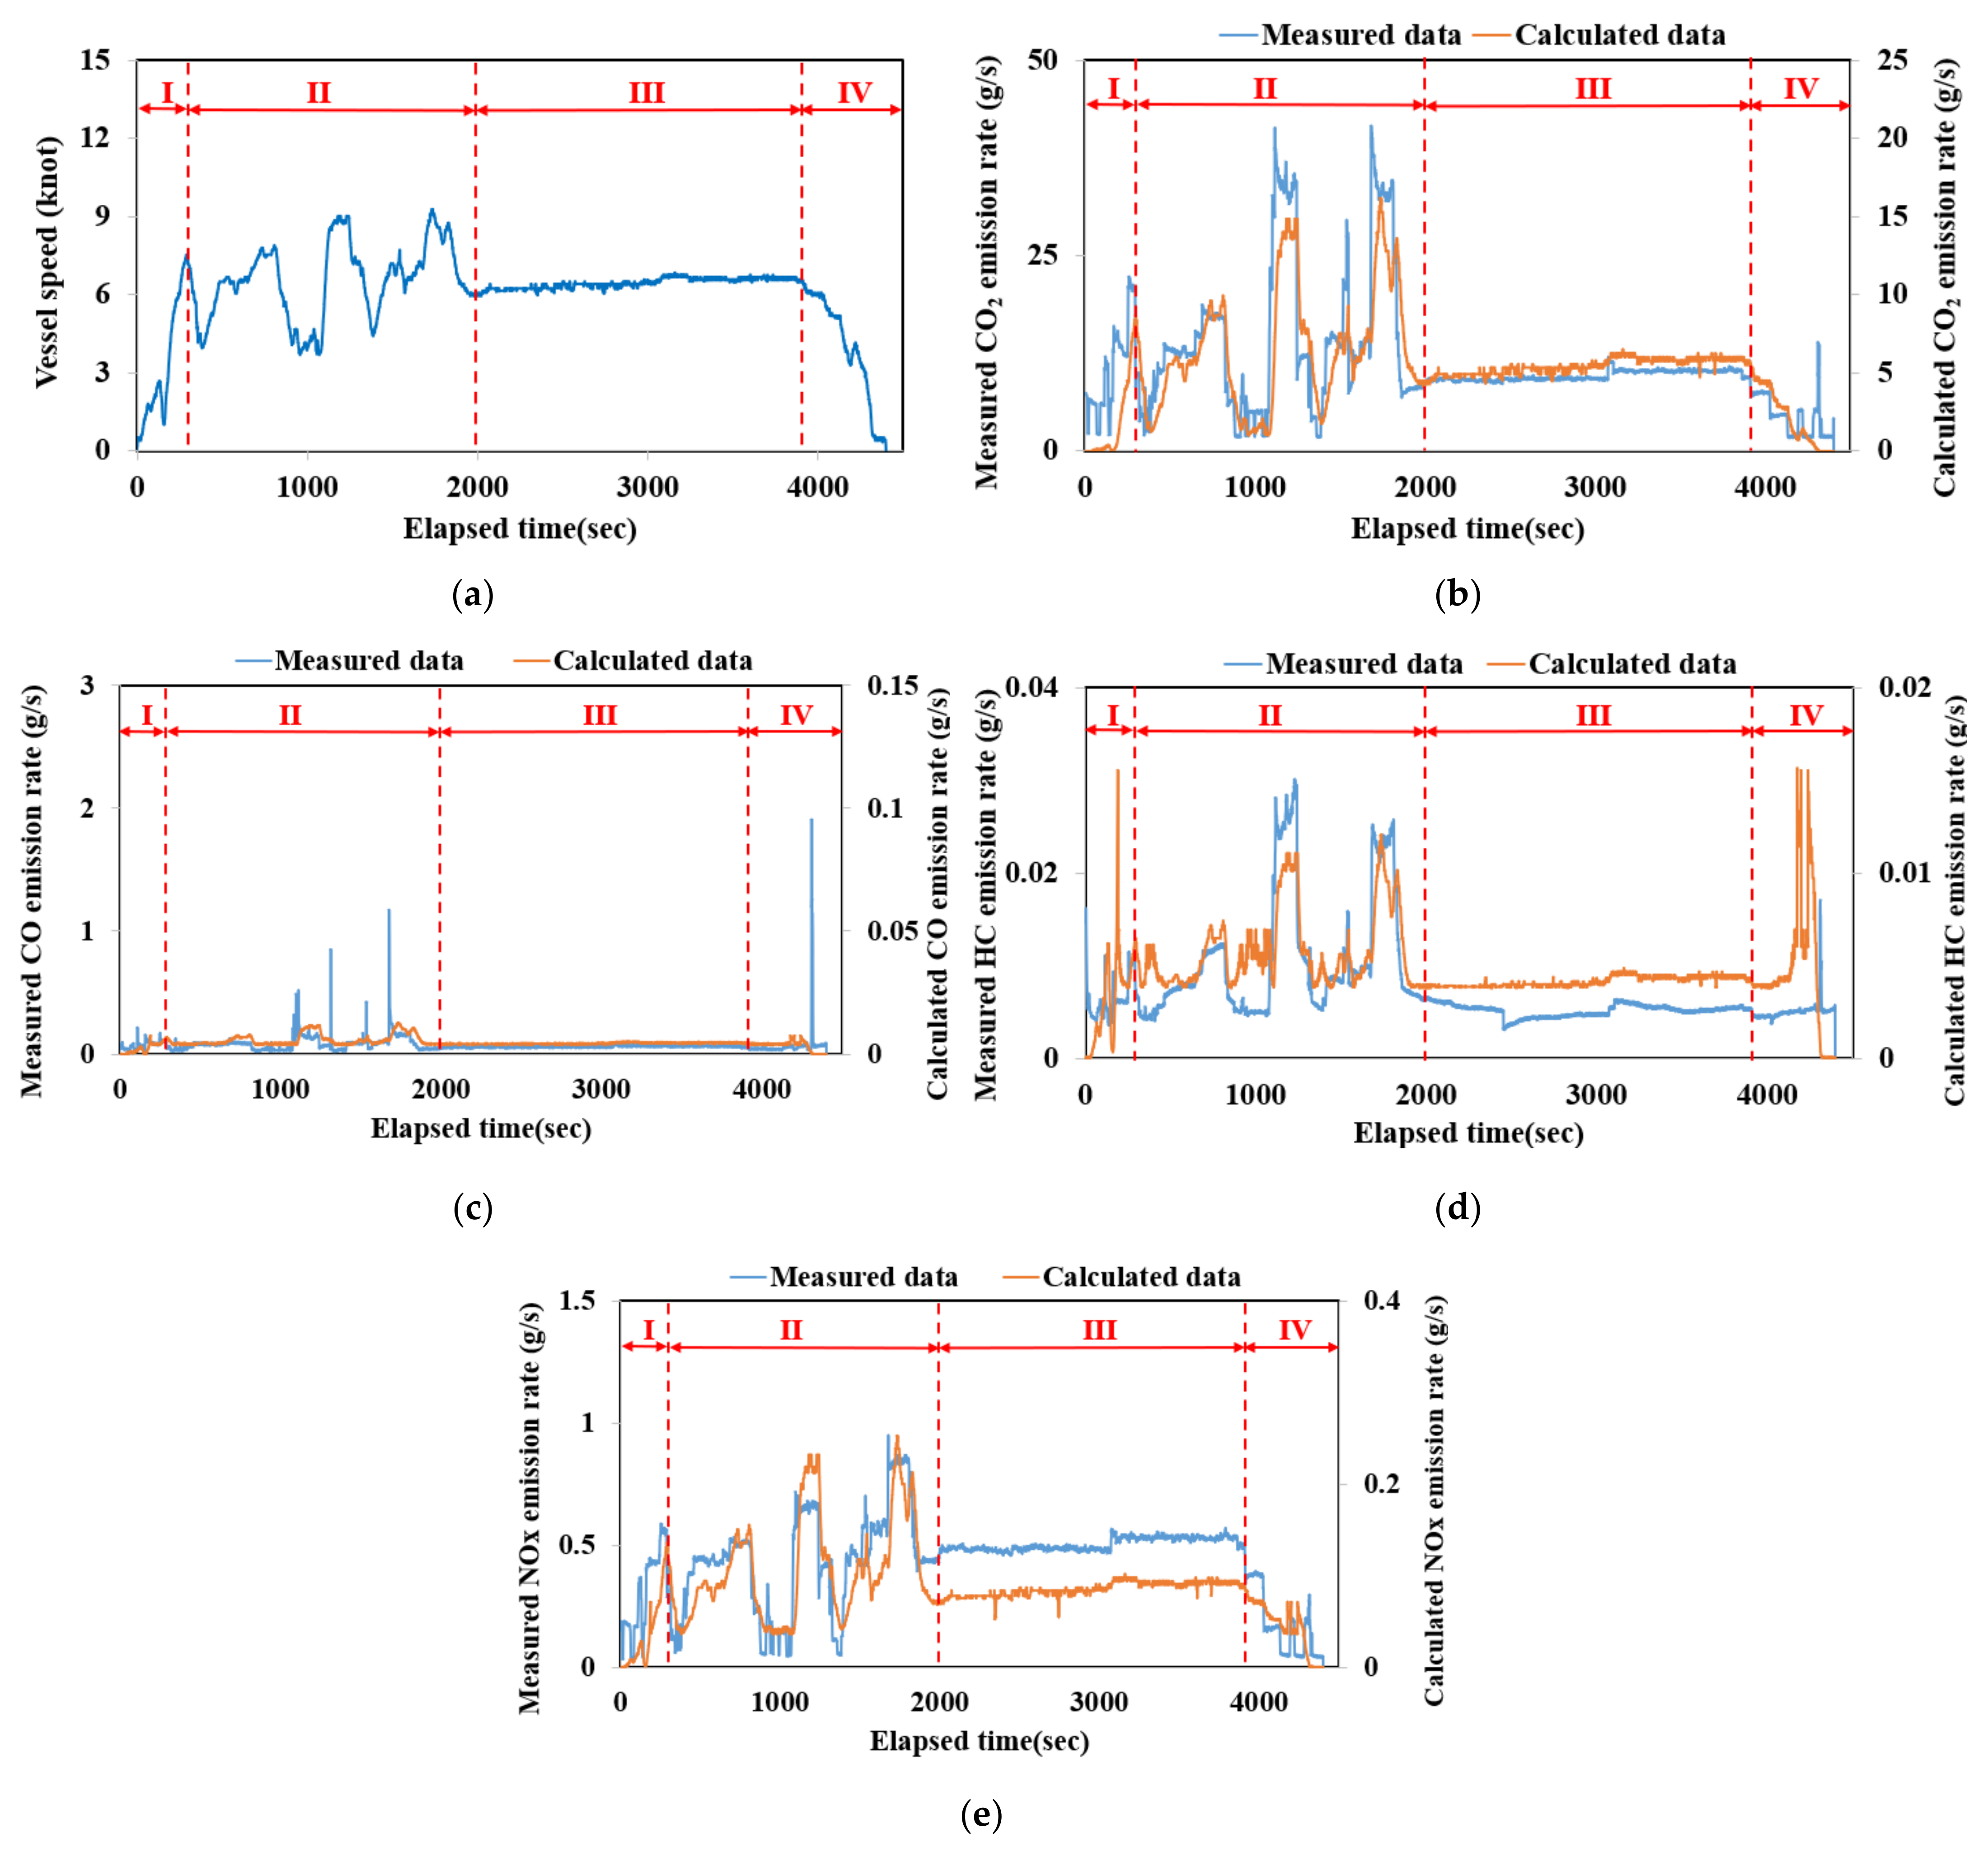
Figure 2 shows the comparison of instantaneous emission rates of tested ship No. 2 from real-world emission tests and those from the AIS-based emission model data. In cruise mode, we conducted a special emission test (cycle II) to compare the actual test data with model-calculated data. In this cycle, ships continuously accelerate and decelerate in the safe cruise speed range. It is observed that the profile of CO2, HC, and NOx emission rates from model-calculated data can match well with onboard emission test data on the whole cycle, especially for cycle II and III. This means that the AIS-based emission model can better simulate the variation trend of the tested results to a great extent. However, the volumes of emission rates of CO2, HC, and NOx from the AIS-based emission model are much lower than those from emission tests. For CO, frequent large fluctuations from test data occurred in cycle I, cycle II, and cycle IV, but did not appear in the model-calculated results. It is speculated that while in maneuvering mode, fast-changing engine speeds cause incomplete combustion, which accelerates the CO emission rate. Therefore, more CO emission peaks appeared on cycle I, cycle II, and cycle IV. However, due to its inertia, the ship speed cannot change as fast as the engine speed, which means that a variation of the ship speed cannot follow the instantaneous variation of the engine speed well. Hence, the model-calculated CO emission rates do not show large peaks in those cycles.
3.3. Comparison of Emissions from Real-World Tests and the AIS-Based Emission Models under Different Engine Loads
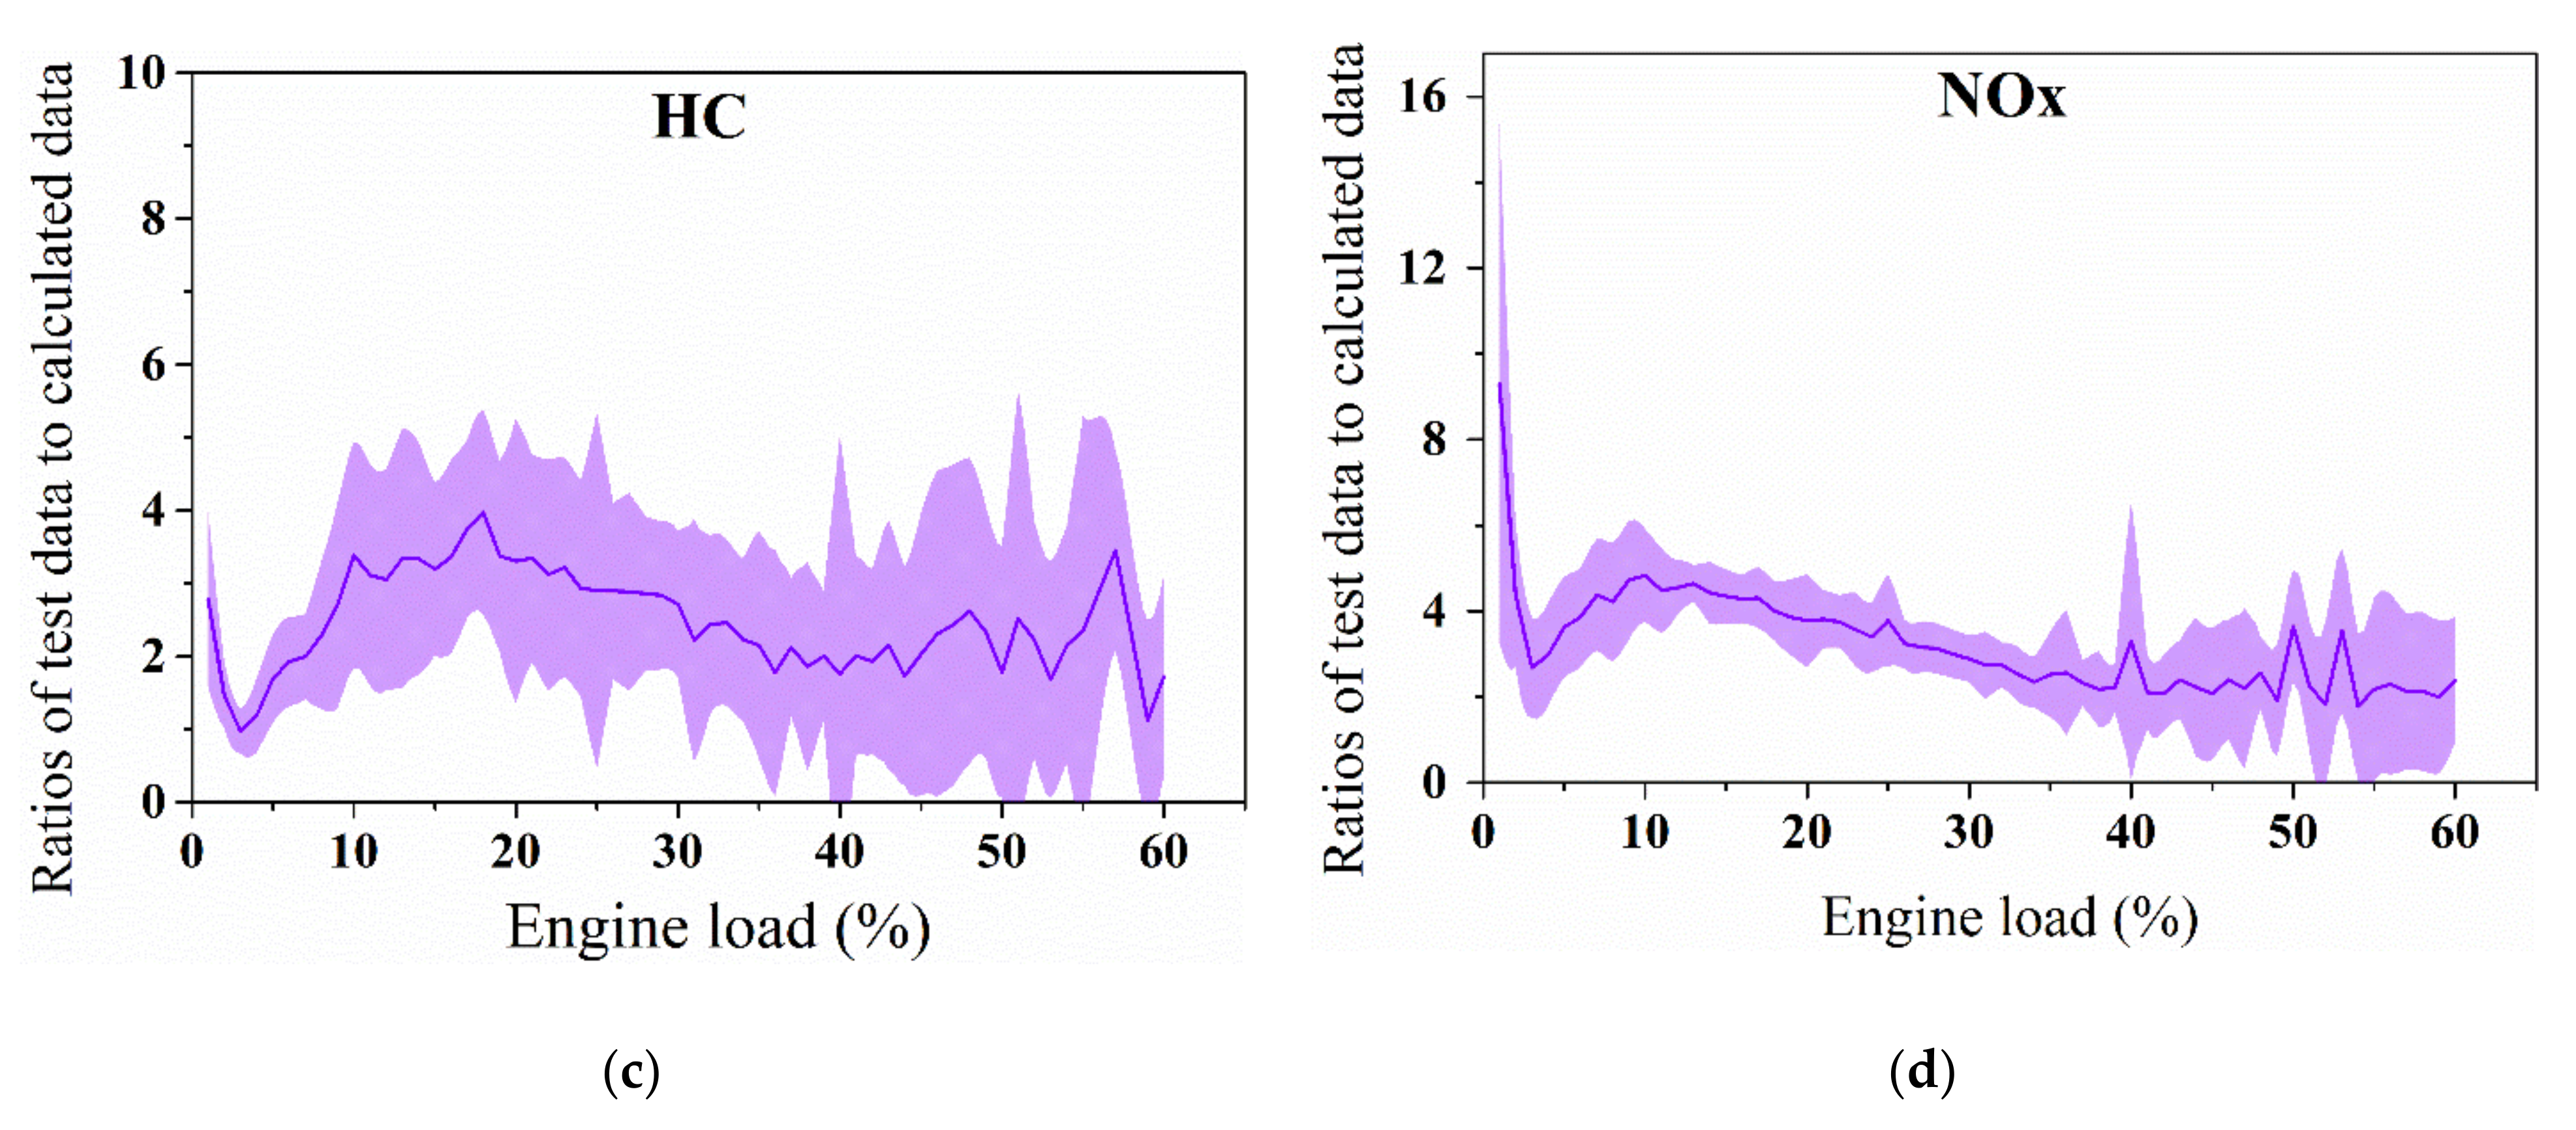
To analyze the differences between test data and model-calculated data, the ratios of test data to model-calculated data are applied in our works. If the ratio is greater than 1, the test data will be higher than model-calculated data. Figure 3 presents the average ratios of all tested ship emissions under different engine loads. Due to the maritime safety and cost concern, the maximum engine loads of tested inland ships are 42–60%. As for CO2, CO, and NOx, the ratios of tested data to calculated data tend to decrease as the load increases. The maximum ratios occur when the engine load is 2%, and then as the load increases, the ratios dramatically decrease. When the engine load is above 5%, corresponding ratios are stable despite a few fluctuations. The average ratios of CO2, CO, and NOx are 9.58, 26.41, and 4.60 when engine loads are below 5%, and 2.03, 18.46, and 3.03 when engine loads are above 5%, respectively. It is noticeable that in the AIS-based emission model, the low load adjustment factors are used to correct emission data when engine loads are below 20%. However, our results indicate that the model-calculated data could not cover the test data well when the engine load was below 5% for those three pollutants. For HC, the ratios fluctuate at the range of 1.10–3.65, while no large peaks appear on low engine loads. This is because on the AIS-based model, the adjustment factors for HC are larger than those for CO2, CO, and NOx when engine loads are below 5% (see Table S2).
It can also be seen that the test data are higher than the model-calculated data for CO2 and pollutants. The average ratios of CO2, CO, HC, and NOx are 2.66, 19.12, 2.46, and 3.16, respectively, which indicates that model-calculated data are relatively close to the test data, except for CO. The probable reason causing higher CO ratios is the faster changing of engine speeds and lower changing of vessel speeds, as mentioned in Section 3.2.
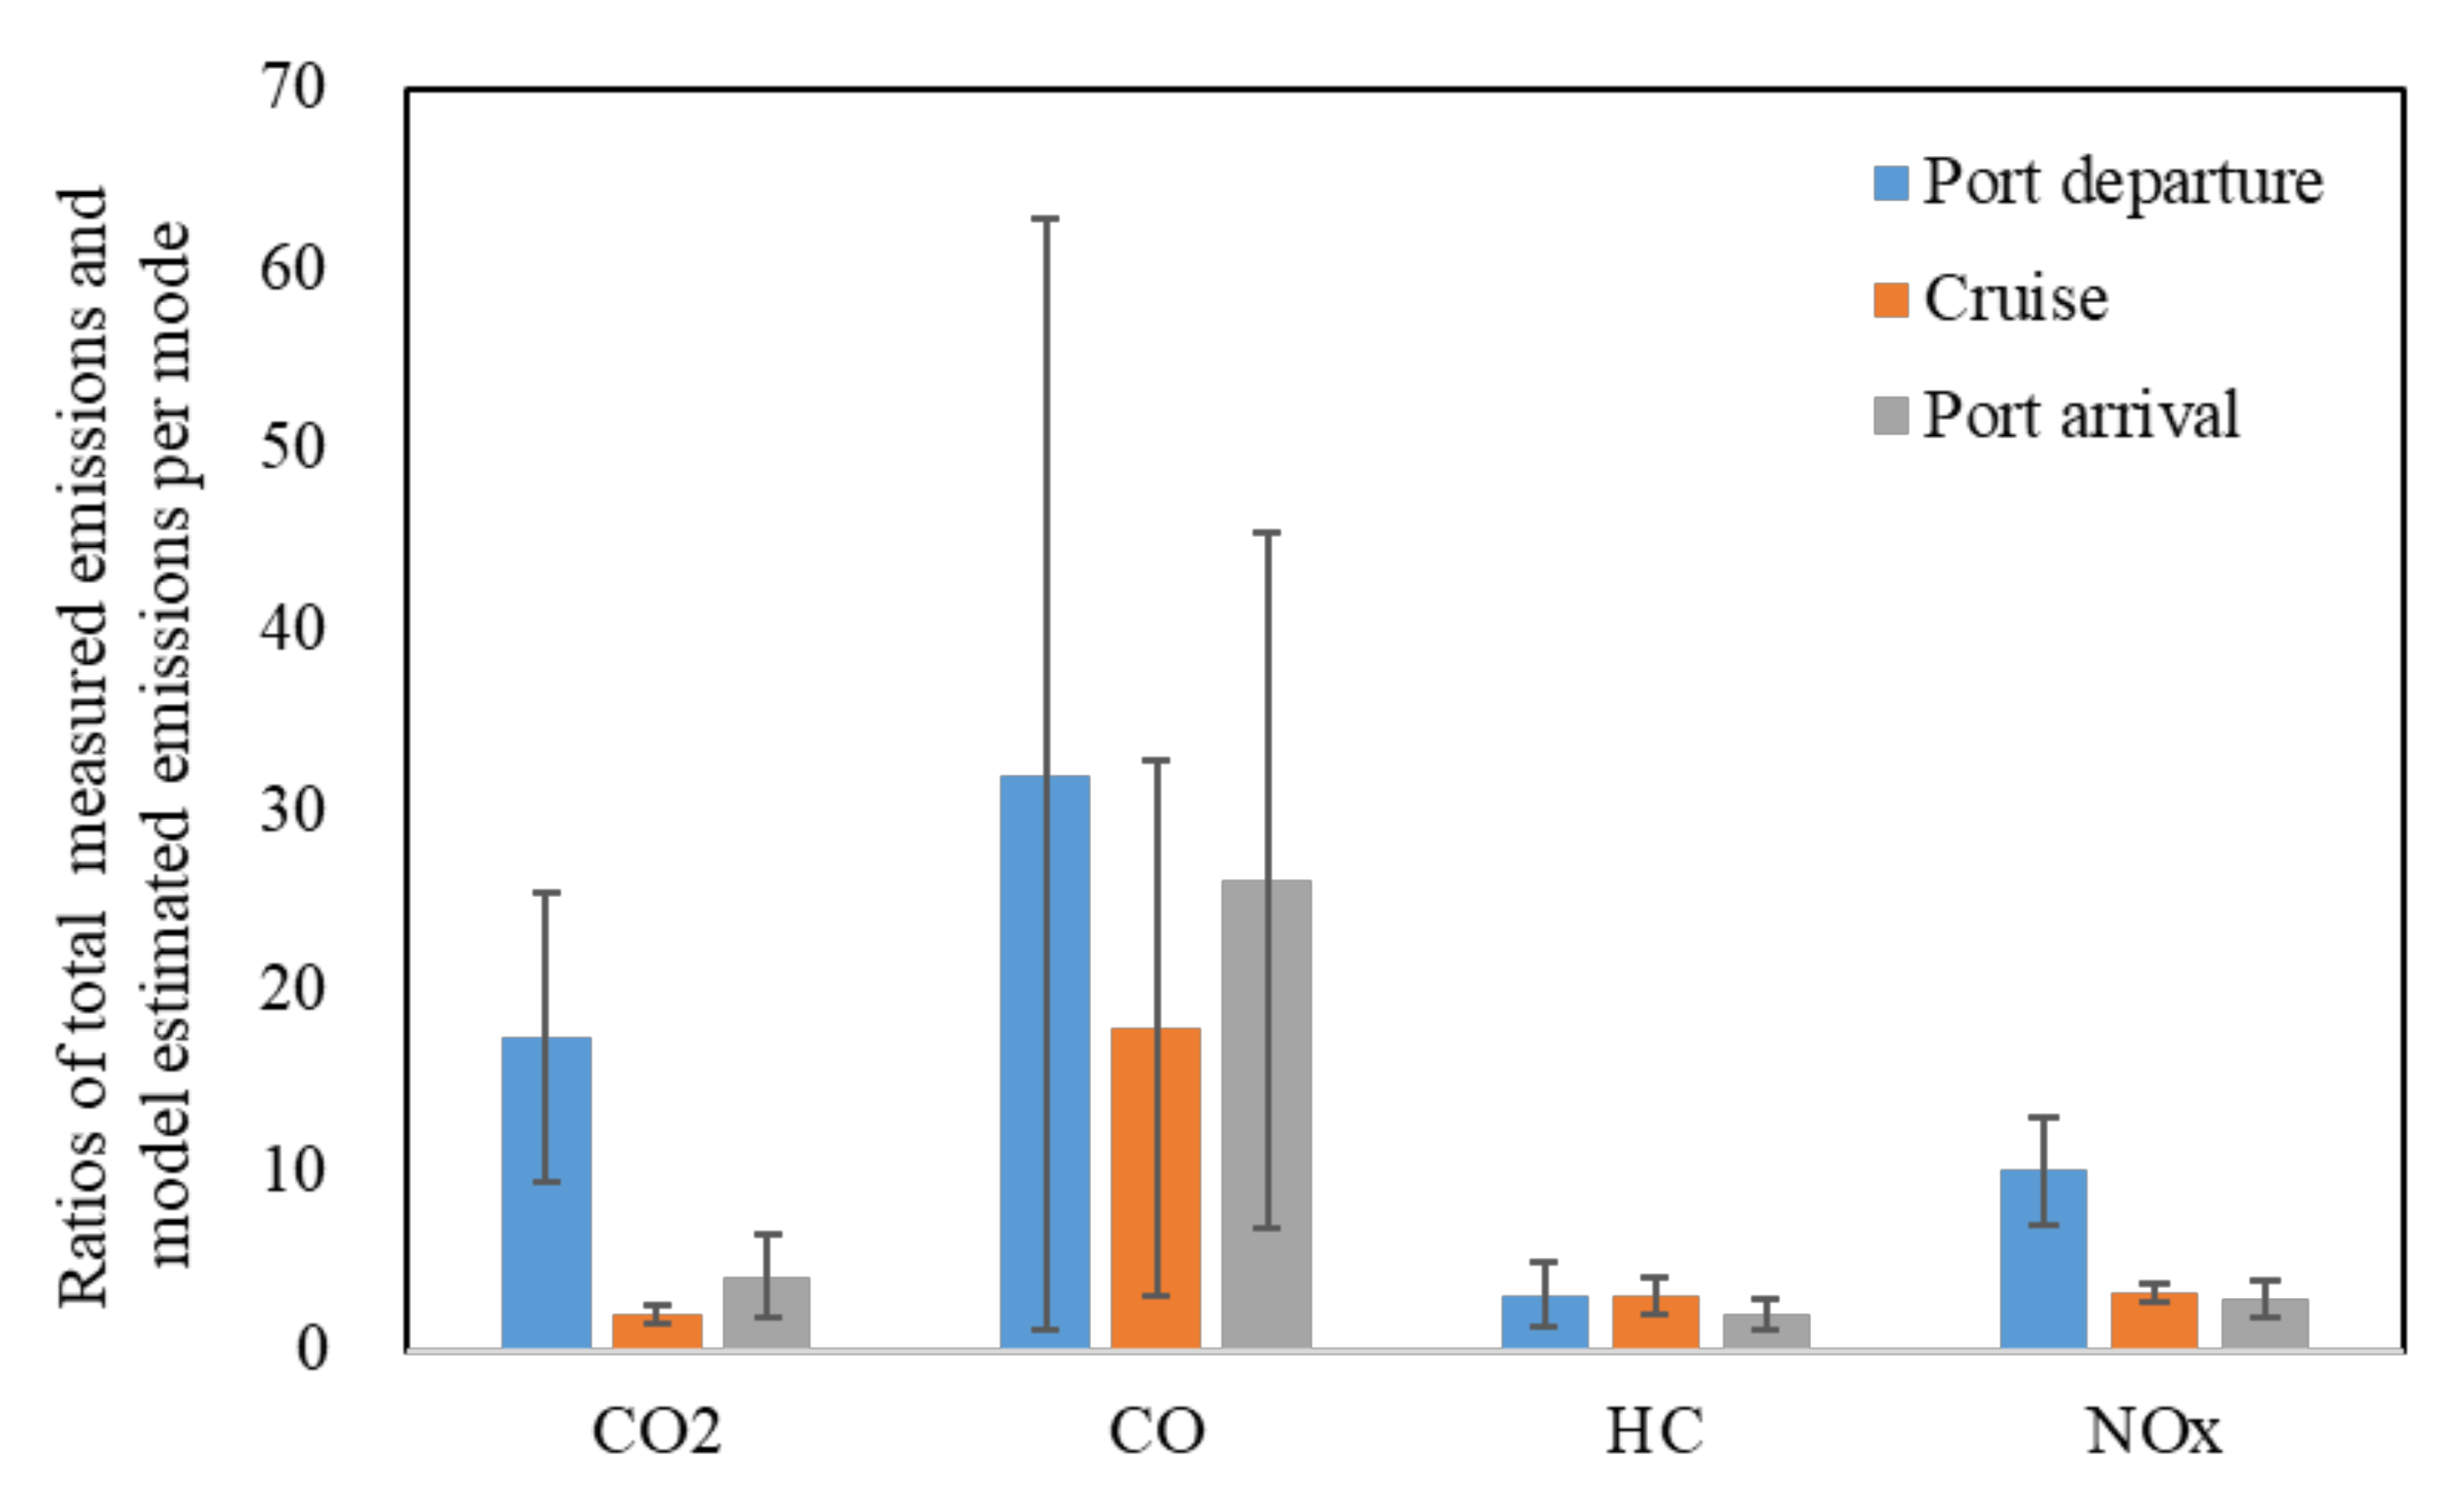
We also calculated the total emissions per mode applying the AIS-based model, and the results were compared to the corresponding measured emissions. Figure 4 shows the ratios of the tested emissions to the corresponding calculated emission of three operating modes. It is clear that the ratios of CO2, CO, and NOx in port departure mode are 8.81,1.79, and 3.15 times higher than those in cruise mode, and 4.24, 1.23, and 3.56 times higher than those in port arrival mode, which means that the differences between measured emissions and model estimated emissions are significantly higher in port departure mode than those in cruise and port arrival modes. One reason is that the engine loads change rapidly in port departure mode, while the estimated engine loads from AIS-based model cannot reflect well the actual engine performance due to the slow variation of vessel speeds. However, in port arrival mode, actual engine loads slowly decrease to decelerate the vessel speeds. Therefore, the estimated engine loads can better follow the actual engine load. Another reason is that the estimated engine loads in the AIS-based model are less than 1% within a certain period of time in port departure mode. However, we have to use the low load adjustment factors of 2% engine load (seen Supplementary Table S2), which results in the lower estimated emissions.
3.4. Analysis of the Emission Rates from the AIS-Based Model under Different Water Flow Directions
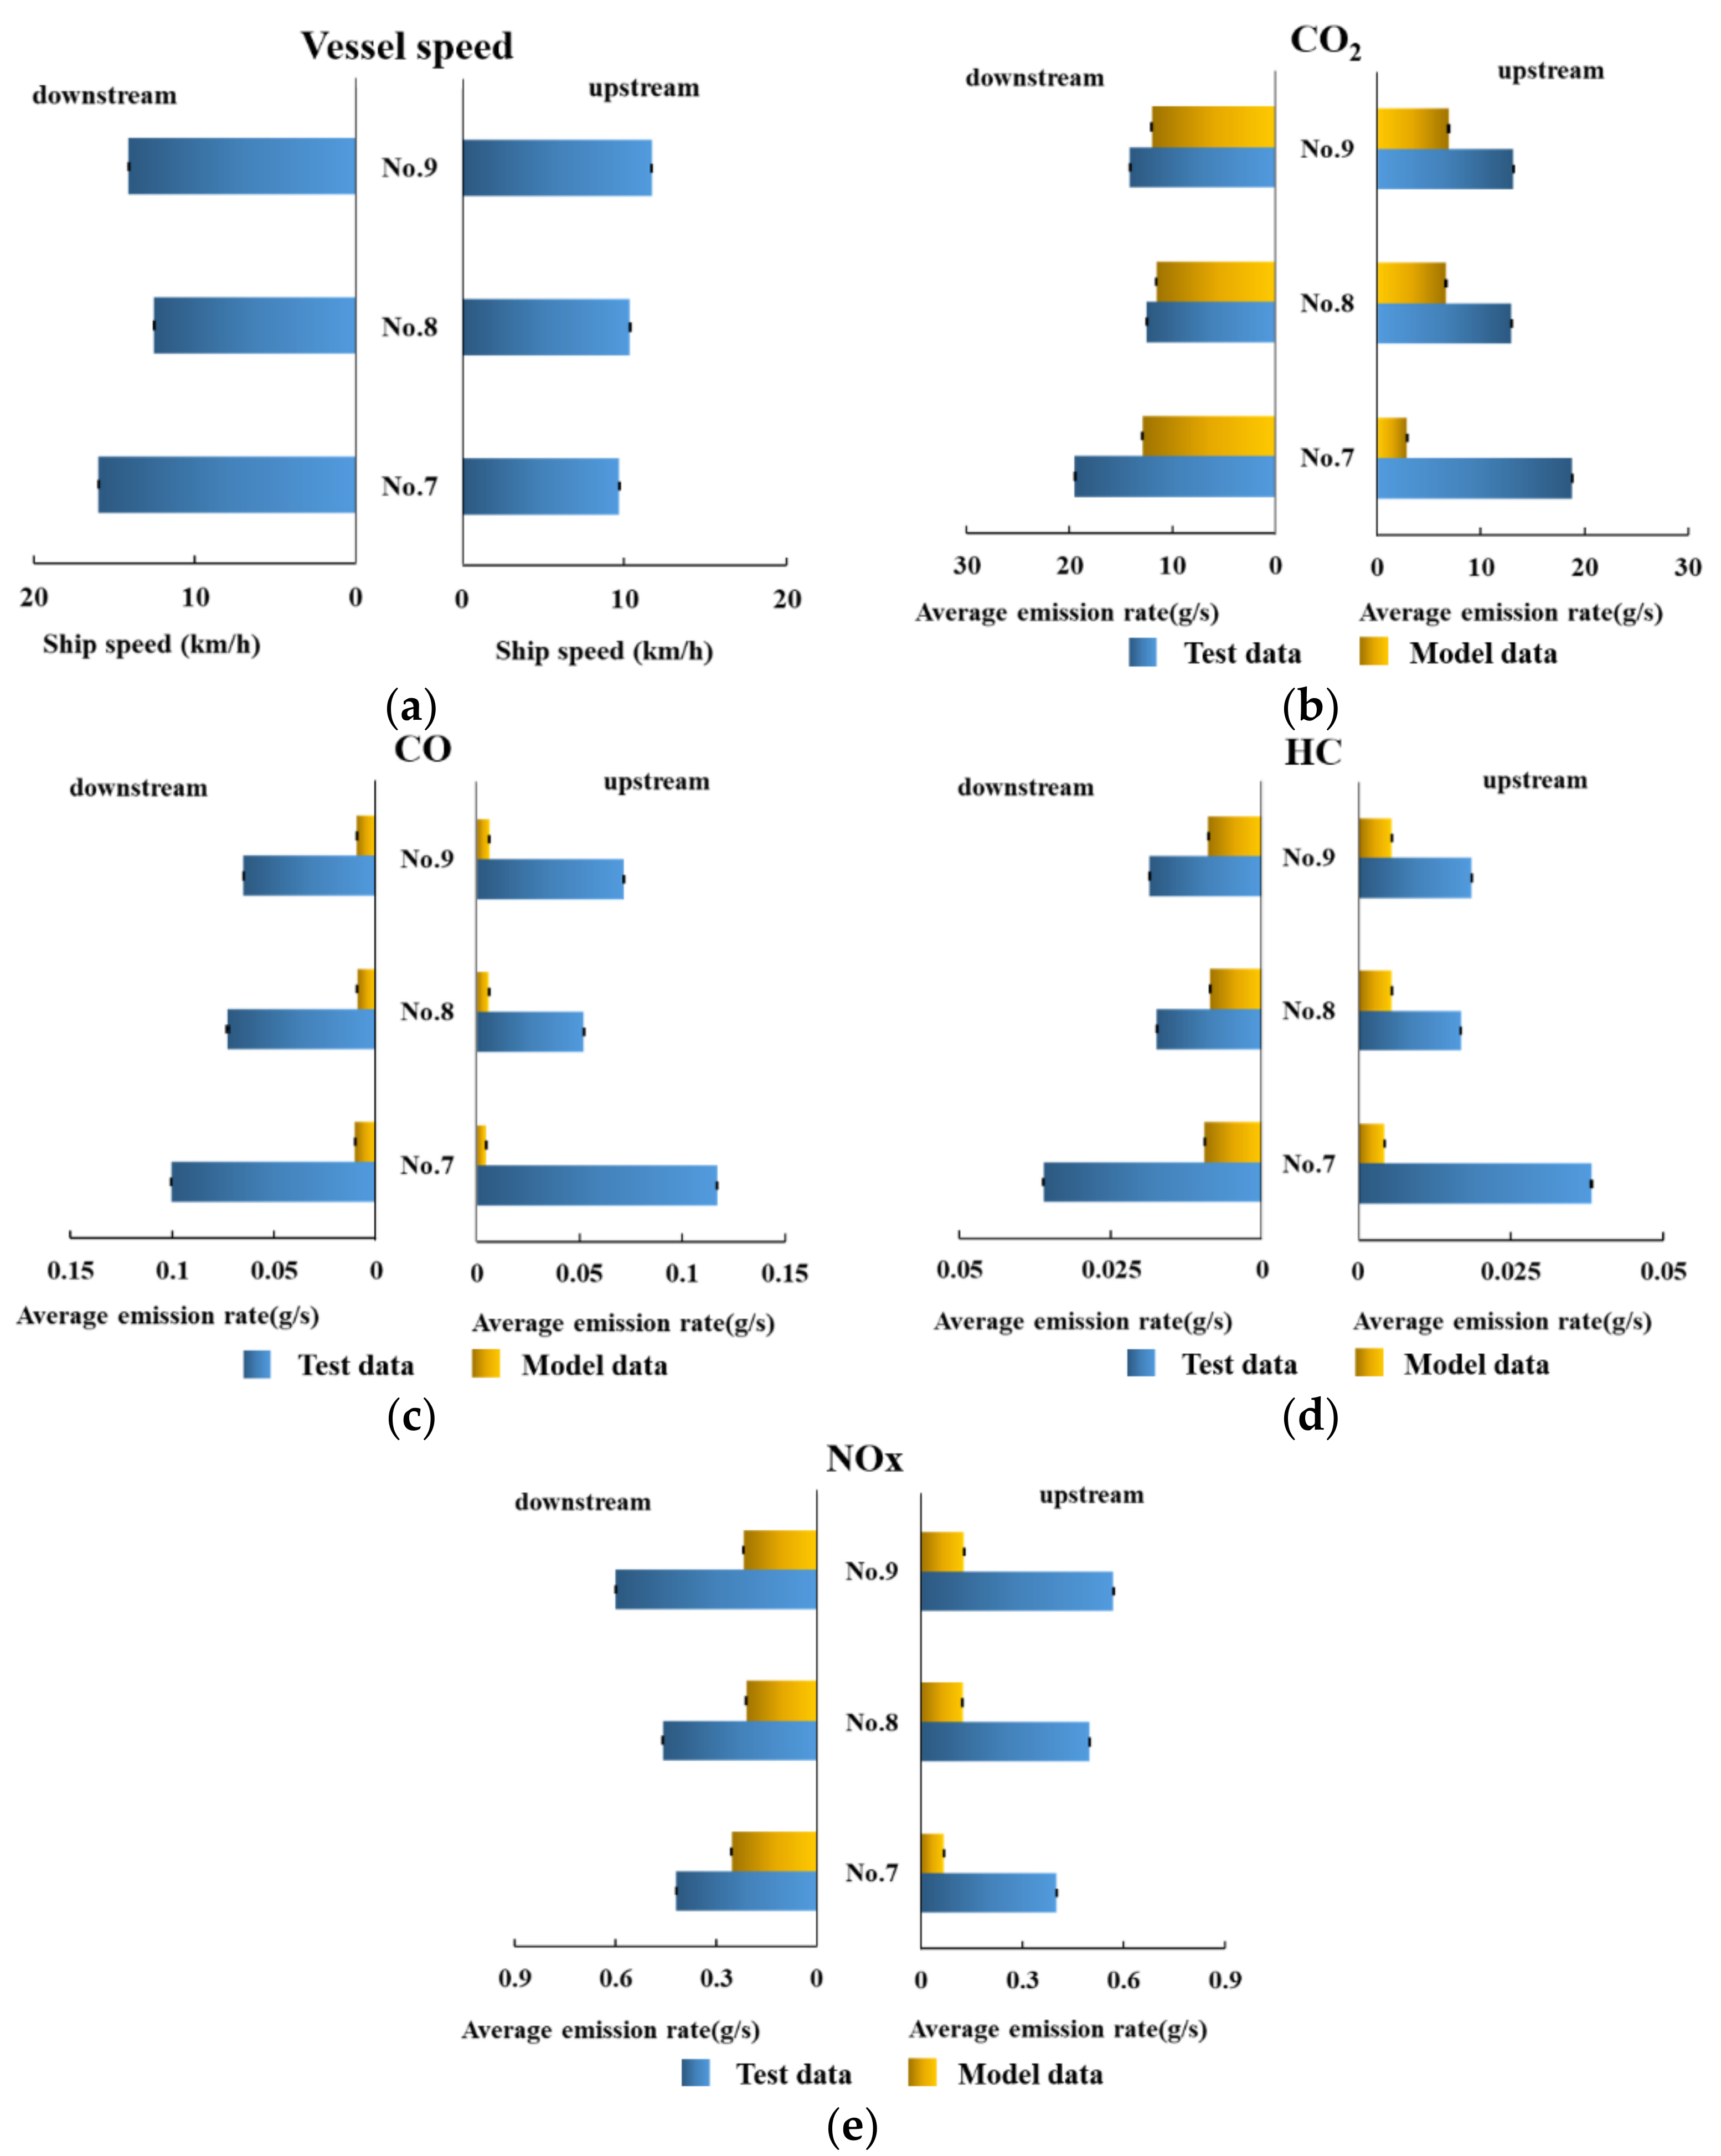
During the real voyage, the water flow direction and rate have a great effect on vessel speed and engine performance. For inland ships, the sailing direction can be divided into upstream and downstream. In the tests, we asked the navigators to operate marine engines in the same output powers on the upstream and downstream voyages. Therefore, the emission rates of pollutants are generally the same in the upstream and downstream cruise modes for each individual vessel. In our study, the vessel speed and marine engine emission from three ships (No. 7–No. 9) were tested in Pearl River. Figure 5 shows the tested ship speed and average emission rates of pollutants for the upstream and the downstream voyages. As seen in Figure 5a, vessel speeds for the upstream voyage are generally lower than for the downstream voyage, because ships have to sail against the current. The average vessel speed of the tested ships in the downstream cruise mode is 14.2 km/h, while this is 10.6 km/h in the upstream cruise mode. Due to the same engine power output, fuel consumption is close in the upstream and the downstream cruise mode, resulting in similar CO2 emissions. In this test, measured CO2 emission rates in the downstream cruise mode are only 0.96–1.07 times higher than those of the upstream cruise mode. For CO, HC, and NOx, the average emission rates of tested ships for the downstream voyage are only 1.06, 1.00, and 1.01 times higher, respectively, than those for the upstream voyage. However, the estimated CO2 and pollutants emission rates of upstream and downstream ships varied greatly. From Equation (2), we can see that the estimated engine loads are mainly determined by vessel speed. However, the inland ship speed is often affected by the river speed [39,40]. Through the AIS system, the speed of the ship over ground can be obtained, but the influence of the external environment on the ship speed has also been calculated. This leads to an obvious overestimation of engine loads during downstream sailing and corresponding underestimation during upstream operations, resulting in the significant variation of emission rates.
It can also be seen that the model-calculated data are lower than the test data. In the upstream cruise mode, average emission rates of CO2, CO, HC, and NOx from the real-world test are 1.91–6.48, 8.78–27.83, 3.05–8.96, and 4.06–5.96 times higher than those from the AIS-based model, respectively. However, in the downstream cruise mode, the average emission rates of CO2, CO, HC, and NOx from the real-world test are 1.08–1.51, 6.74–9.67, 2.03–3.75, and 1.65–2.75 times higher than those from the AIS-based model, respectively. It is obvious that the difference between model-calculated data and test data for the downstream voyage is smaller than those for the upstream voyage. A potential reason is that the vessel speed for the downstream voyage is higher than for the upstream voyage. As seen from Equation (2), the engine load is higher with an increasing vessel speed. As the test emission rates on the upstream and the downstream voyage are similar, the model-calculated emission rates of CO2 and pollutants on the downstream voyage are close to the test emission rates. To better predict the inland ship emissions, water flow correcting factors should be applied on Equation (1) of the AIS-based emission model. More inland ship emission tests should be carried out to provide the accurate water flow correcting factors in future.
4. Conclusions
In this study, real-world emissions from inland ships were tested by using portable emission measurement system. The AIS-based emission models were also applied to calculate the emissions of tested inland ships. A comparison was made between test data and model-calculated data to evaluate the accuracy of the AIS-based emission models. To better reflect the inland ships performance, we divide the inland ship activities into berth, maneuvering (port departure and port arrival), and cruise modes in the AIS-based emission model. The profile of CO2, HC, and NOx emission rates from model-calculated data can match well with on-board emission test data, but the values of CO2 and pollutants from the model are much lower than those from emission tests. The ratios of test data to model-calculated data for CO2, CO, and NOx tend to decrease as the load increases. The average ratios of CO2, CO, and NOx are 9.58, 26.41, and 4.60 when engine loads are below 5%, and 2.03, 18.46, and 3.03 when engine load are above 5%, respectively. The ratios of HC are 1.10–3.65, while no large peaks appear on low engine loads. The total average ratios of CO2, HC, and NOx are 2.66, 2.46, and 3.16 under engine loads of 1–60%, indicating that model-calculated data are relatively close to the test data. In upstream cruise mode, the average emission rates of CO2, CO, HC, and NOx from the real-world test are 1.91–6.48, 8.78–27.83, 3.05–8.96, and 4.06–5.96 times higher than those from the AIS-based model, respectively. However, in downstream cruise mode, the average emission rates of CO2, CO, HC, and NOx from the real-world test are 1.08–1.51, 6.74–9.67, 2.03–3.75, and 1.65–2.75 times higher than those from the AIS-based model, respectively. This result indicates that the differences between model-calculated data and test data for the downstream voyage are smaller than those for the upstream voyage.
Supplementary Materials
The following are available online at https://0-www-mdpi-com.brum.beds.ac.uk/article/10.3390/atmos12121611/s1, Table S1: Marine engine type; Table S2: Emission factor adjustment factors for main engines at low loads; Table S3: Descriptions of vessel activity mode; Figure S1: Schematic diagram of the SEMTECH-DS gaseous pollutant analyzer; Figure S2: The study area and test routing of inland ships on (a) the Yangtze River and (b) the Pearl River.
Author Contributions
Conceptualization, M.F.; Methodology, M.F. and D.P.; Formal analysis, M.F., Y.W. and H.J.; Writing—original draft preparation, M.F. and H.J.; Writing—review and editing, D.P., Y.W. and H.J.; Software, D.P. and Y.W.; Visualization, H.J.; Supervision, M.F. All authors have read and agreed to the published version of the manuscript.
Funding
This research has been financed by the National Engineering Laboratory for Mobile Source Emission Control Technology (NELMS2017A04) and (NELMS2017A15).
Institutional Review Board Statement
Not applicable.
Informed Consent Statement
Not applicable.
Data Availability Statement
Not applicable.
Acknowledgments
The authors thank all of the scientists and crew members who were involved in the program. We also thank the editors and reviewers for their comments, which helped to improve our paper.
Conflicts of Interest
The authors declare that they have no known competing financial interests or personal relationships that could have influenced the work reported in this paper.
References
- The Trunk Line of the Yangtze River Carries 2.5 Billion Tons of Cargo Annually. Available online: http://paper.people.com.cn/rmrbhwb/html/2018-01/05/content182787.htm (accessed on 5 January 2018).
- Prosperous Jiangsu Port Production. Available online: http://epaper.zgsyb.com/html/2018-02/28/content21728.htm (accessed on 28 February 2018).
- Yi, S. Forecast of Effectiveness and Cost-Benefit Analysis of Chinese Shipping Emission Control Areas. Master’s Thesis, Tsinghua University, Beijing, China, 2017. [Google Scholar]
- Li, H.; Shang, Y.; Jin, X.; Fu, M. Review of methods and progress on shipping emission inventory studies. Acta Sci. Circumstantiae 2018, 38, 1–12. [Google Scholar]
- Kowalski, J.; Tarelko, W. NOx emission from a two-stroke ship engine: Part 2—Laboratory test. Appl. Therm. Eng. 2009, 29, 2160–2165. [Google Scholar] [CrossRef] [Green Version]
- Yau, P.S.; Lee, S.C.; Corbett, J.J.; Wang, C.; Cheng, Y.; Ho, K.F. Estimation of exhaust emission from ocean-going vessels in Hong Kong. Sci. Total Environ. 2012, 431, 299–306. [Google Scholar] [CrossRef] [PubMed]
- Lonati, G.; Cernuschi, S.; Sidi, S. Air quality impact assessment of at-berth ship emissions: Case-study for the project of a new freight port. Sci. Total Environ. 2010, 409, 192–200. [Google Scholar] [CrossRef]
- Tzannatos, E. Ship emissions and their externalities for the port of Piraeus-Greece. Atmos. Environ. 2010, 44, 400–407. [Google Scholar] [CrossRef]
- Poplawski, K.; Setton, E.; McEwen, B.; Hrebenyk, D.; Graham, M.; Keller, P. Impact of cruise ship emissions in Victoria, BC, Canada. Atmos. Environ. 2011, 45, 824–833. [Google Scholar] [CrossRef]
- Wang, R.; Yuan, Z.; Zheng, J.; Li, C.; Huang, Z.; Li, W.; Xie, Y.; Wang, Y.; Yu, K.; Duan, L. Characterization of VOC emissions from construction machinery and river ships in the Pearl River Delta of China. J. Environ. Sci. 2020, 96, 138–150. [Google Scholar] [CrossRef] [PubMed]
- Huang, Z.; Ding, Y.; Yin, H.; Wang, H.; Ma, D.; Xiao, H. Air Pollutant Emission Inventory of Marine in China; State Environmental Protection Key Laboratory of Vehicle Emission Control and Simulation, Chinese Research Academy of Environmental Sciences: Beijing, China, 2016.
- Howitt, O.J.A.; Revol, V.G.N.; Smith, I.J.; Rodger, C.J. Carbon emissions from international cruise ship passengers’ travel to and from New Zealand. Energy Policy 2010, 38, 2552–2560. [Google Scholar] [CrossRef]
- Liu, H.; Fu, M.; Jin, X.; Shang, Y.; Shindell, D.; Faluvegi, G.; Shindell, C.; He, K. Health and climate impacts of ocean-going vessels in East Asia. Nat. Clim. Chang. 2016, 6, 1037–1041. [Google Scholar] [CrossRef]
- Chen, D.; Tian, X.; Lang, J.; Zhou, Y.; Li, Y.; Guo, X.; Wang, W.; Liu, B. The impact of ship emissions on PM2.5 and the deposition of nitrogen and sulfur in Yangtze River Delta, China. Sci. Total Environ. 2019, 649, 1609–1619. [Google Scholar] [CrossRef]
- Mamoudou, I.; Zhang, F.; Chen, Q.; Wang, P.; Chen, Y. Characteristics of PM2.5 from ship emissions and their impacts on the ambient air: A case study in Yangshan Harbor, Shanghai. Sci. Total Environ. 2018, 640–641, 207–216. [Google Scholar] [CrossRef] [PubMed]
- Johansson, L.; Jalkanen, J.-P.; Kukkonen, J. Global assessment of shipping emissions in 2015 on a high spatial and temporal resolution. Atmos. Environ. 2017, 167, 403–415. [Google Scholar] [CrossRef]
- Liang, Y.; Liao, R.; Yan, M.; Zheng, Z.; Xu, G. Accounting the vessels air pollutant emissions in Shenzhen Port. Environ. Sci. Surv. 2016, 35, 27–31. [Google Scholar]
- Wan, Z.; Ji, S.; Liu, Y.; Zhang, Q.; Chen, J.; Wang, Q. Shipping emission inventories in China’s Bohai Bay, Yangtze River Delta, and Pearl River Delta in 2018. Mar. Pollut. Bull. 2020, 151, 110882. [Google Scholar] [CrossRef] [PubMed]
- Zhang, Y.; Yang, X.; Brown, R.; Yang, L.; Morawska, L.; Ristovski, Z.; Fu, Q.; Huang, C. Shipping emissions and their impacts on air quality in China. Sci. Total Environ. 2017, 581–582, 186–198. [Google Scholar] [CrossRef]
- Paxian, A.; Eyring, V.; Beer, W.; Sausen, R.; Wright, C. Present-Day and Future Global Bottom-Up Ship Emission Inventories Including Polar Routes. Environ. Sci. Technol. 2010, 44, 1333–1339. [Google Scholar] [CrossRef] [PubMed]
- Chen, D.; Zhang, Y.; Lang, J.; Ying, Z.; Li, Y.; Guo, X.; Wang, W.; Liu, B. Evaluation of different control measures in 2014 to mitigate the impact of ship emissions on air quality in the Pearl River Delta, China. Atmos. Environ. 2019, 216, 116911. [Google Scholar] [CrossRef]
- Fu, Q.; Li, J.; Tian, X.; Huang, C. Development of Monitoring, Forecasting and Evaluation for Fine Ambient Air Quality Management of Major Events in China. Environ. Monit. China 2020, 36, 1–9. [Google Scholar]
- Jalkanen, J.-P.; Johansson, L.; Kukkonen, J. A comprehensive inventory of ship traffic exhaust emissions in the European sea areas in 2011. Atmos. Chem. Phys. 2016, 16, 71–84. [Google Scholar] [CrossRef] [Green Version]
- Goldsworthy, B. Spatial and temporal allocation of ship exhaust emissions in Australian coastal waters using AIS data: Analysis and treatment of data gaps. Atmos. Environ. 2017, 163, 77–86. [Google Scholar] [CrossRef]
- Zeng, F.; Lv, J. Ship emission inventory and valuation of eco-efficiency in Xiamen Port. China Environ. Sci. 2020, 40, 2304–2311. [Google Scholar]
- Lv, J.; Fu, F.; Zuo, H.; Li, S.; He, H. Ship Emission Inventory and Its Application in Qingdao. Environ. Prot. Sci. 2019, 45, 107–115. [Google Scholar]
- Yang, D.-q.; Kwan, S.H.; Lu, T.; Fu, Q.-y.; Cheng, J.-m.; Streets, D.G.; Wu, Y.-m.; Li, J.-j. An Emission Inventory of Marine Vessels in Shanghai in 2003. Environ. Sci. Technol. 2007, 41, 5183–5190. [Google Scholar] [CrossRef] [PubMed]
- Kurtenbach, R.; Vaupel, K.; Kleffmann, J.; Klenk, U.; Schmidt, E.; Wiesen, P. Emissions of NO, NO2 and PM from inland shipping. Atmos. Chem. Phys. 2016, 16, 14285–14295. [Google Scholar] [CrossRef] [Green Version]
- Pillot, D.; Guiot, B.; Le Cottier, P.; Perret, P.; Tassel, P. Exhaust emissions from in-service inland waterways vessels. In Proceedings of the TAP 2016 21st International Transport and Air Pollution Conference, Lyon, France, 24 May 2016; pp. 205–225. [Google Scholar]
- Hulskotte, J.H.J.; Denier van der Gon, H.A.C. Fuel consumption and associated emissions from seagoing ships at berth derived from an on-board survey. Atmos. Environ. 2010, 44, 1229–1236. [Google Scholar] [CrossRef]
- Kesgin, U.; Vardar, N. A study on exhaust gas emissions from ships in Turkish Straits. Atmos. Environ. 2001, 35, 1863–1870. [Google Scholar] [CrossRef]
- Deniz, C.; Durmuşoğlu, Y. Estimating shipping emissions in the region of the Sea of Marmara, Turkey. Sci. Total Environ. 2008, 390, 255–261. [Google Scholar] [CrossRef]
- Beecken, J.; Mellqvist, J.; Salo, K.; Ekholm, J.; Jalkanen, J.P.; Johansson, L.; Litvinenko, V.; Volodin, K.; Frank-Kamenetsky, D.A. Emission factors of SO2, NOx and particles from ships in Neva Bay from ground-based and helicopter-borne measurements and AIS-based modeling. Atmos. Chem. Phys. 2015, 15, 5229–5241. [Google Scholar] [CrossRef] [Green Version]
- Chen, D.; Wang, X.; Nelson, P.; Li, Y.; Zhao, N.; Zhao, Y.; Lang, J.; Zhou, Y.; Guo, X. Ship emission inventory and its impact on the PM2.5 air pollution in Qingdao Port, North China. Atmos. Environ. 2017, 166, 351–361. [Google Scholar] [CrossRef]
- Chen, D.; Wang, X.; Li, Y.; Lang, J.; Zhou, Y.; Guo, X.; Zhao, Y. High-spatiotemporal-resolution ship emission inventory of China based on AIS data in 2014. Sci. Total Environ. 2017, 609, 776–787. [Google Scholar] [CrossRef]
- Fu, M.; Ding, Y.; Ge, Y.; Yu, L.; Yin, H.; Ye, W.; Liang, B. Real-world emissions of inland ships on the Grand Canal, China. Atmos. Environ. 2013, 81, 222–229. [Google Scholar] [CrossRef]
- Fu, M.; Liu, H.; Jin, X.; He, K. National- to port-level inventories of shipping emissions in China. Environ. Res. Lett. 2017, 12, 114024. [Google Scholar] [CrossRef]
- Peng, Z.; Ge, Y.; Tan, J.; Fu, M.; Wang, X.; Chen, M.; Yin, H.; Ji, Z. Emissions from several in-use ships tested by portable emission measurement system. Ocean. Eng. 2016, 116, 260–267. [Google Scholar] [CrossRef]
- Huang, H.; Zhou, C.; Xiao, C.; Huang, L.; Wen, Y.; Wang, J.; Peng, X. Effect of Seasonal Flow Field on Inland Ship Emission Assessment: A Case Study of Ferry. Sustainability 2020, 12, 7484. [Google Scholar] [CrossRef]
- Huang, L.; Wen, Y.; Geng, X.; Zhou, C.; Xiao, C. Integrating multi-source maritime information to estimate ship exhaust emissions under wind, wave and current conditions. Transp. Res. Part D Transp. Environ. 2018, 59, 148–159. [Google Scholar] [CrossRef]
Figure 1.
Operating modes of tested ship No. 1 based on two classification methods. (a) The operating modes classified by activity model, which are “at berth” (Blue), “at anchorage” (Orange), “maneuvering” (Gray), and “at sea” (Gold).; (b) The operating modes classified by recent inland ship emission studies, which are “Port departure” (Purple), “Cruise” (Red), and “Port arrival” (Green).

Figure 2.
Instantaneous vessel speed and emission rates of tested ship No. 2 from onboard emission test data and calculated data from the AIS-based emission mode. Cycle I is the port departure mode; cycle II is the special cruise test mode which continuously accelerates and decelerates on the safe vessel cruise speed range; cycle III is the normal cruise mode; cycle IV is the port arrival mode. (a) The instantaneous vessel speed conditions of the whole cycle; (b), (c), (d), (e) The comparison of measured data and calculated data of CO2, CO, HC, and NOx, respectively.

Figure 3.
Ratios of the test data to calculated data of (a) CO2, (b) CO, (c) HC, and (d) NOx under different engine loads from typical inland ships. The shadings denote the 95% confidence intervals of the mean value.
Figure 3.
Ratios of the test data to calculated data of (a) CO2, (b) CO, (c) HC, and (d) NOx under different engine loads from typical inland ships. The shadings denote the 95% confidence intervals of the mean value.


Figure 4.
Ratios of the total measured emissions to estimated emission from the AIS model in each mode. Error bars show the 95% confidence intervals of the mean values.
Figure 4.
Ratios of the total measured emissions to estimated emission from the AIS model in each mode. Error bars show the 95% confidence intervals of the mean values.

Figure 5.
Comparisons of (a) vessel speed and average emission rates of (b) CO2, (c) CO, (d) HC, and (e) NOx for upstream and downstream voyages during cruise mode.
Figure 5.
Comparisons of (a) vessel speed and average emission rates of (b) CO2, (c) CO, (d) HC, and (e) NOx for upstream and downstream voyages during cruise mode.


Table 1.
Performance parameters of SEMTECH-DS.
| Pollutant | Measuring Range | Resolution | Measurement Accuracy |
|---|---|---|---|
| CO2 | 0~20% | 0.01% | ±3% |
| CO | 0~8% | 10 ppm | ±50 ppm or ±3% |
| THC | 0~100 ppm | 0.1 ppm | ±5 ppm or ±2% |
| 0~1000 ppm | 1 ppm | ±5 ppm or ±2% | |
| 0~10,000 ppm | 1 ppm | ±25 ppm or ±2% | |
| NO | 0~2500 ppm | 1 ppm | ±15 ppm or ±3% |
| NO2 | 0~500 ppm | 1 ppm | ±10 ppm or ±3% |
Table 2.
Models and specifications of the other instruments.
| Instrument | Manufacturer | Model |
|---|---|---|
| Generator | YAMAHA | 6800 E |
| Battery | FENGFAN | — |
Table 3.
Basic information of the test ships.
| ID | Ship Type | Built Year | Engine Rated Power (kw)/Rated Speed (RPM) | Maximum Speed (km/h) | Ship Gross Weight (ton) | Test Route | Departure Time | Arrival Time |
|---|---|---|---|---|---|---|---|---|
| 1 | Cargo ship | 2001 | 88.3/500 | 17 | 270 | Zhenjiang to Danyang | 10:44 | 12:20 |
| 2 | Cargo ship | 2010 | 136/850 | 18 | 380 | Zhenjiang to Danyang | 5:23 | 7:02 |
| 3 | Cargo ship | 2009 | 300/1400 | 18 | 320 | Zhenjiang to Danyang | 18:26 | 19:51 |
| 4 | Cargo ship | 2008 | 260/1400 | 18 | 420 | Zhenjiang to Danyang | 4:50 | 7:41 a |
| 5 | Cargo ship | 2010 | 145/850 | 18 | 540 | Zhenjiang to Danyang | 17:59 | 19:29 |
| 6 | Cargo ship | 2004 | 136/850 | 18 | 560 | Zhenjiang to Danyang | 10:09 | 11:44 |
| 7 | Cargo ship | 2004 | 136/850 | 20 | 380 | Nansha port | 12:39 | 14:38 |
| 8 | Cargo ship | 2007 | 184/1000 | 18 | 350 | Nansha port | 11:53 | 13:00 |
| 9 | Cargo ship | 2007 | 184/1000 | 20 | 350 | Nansha port | 14:30 | 15:30 |
a Ship No. 4 was refueled before port arrival.
Table 4.
Test operating mode of ships.
| Operating Mode | Description |
|---|---|
| Port arrival | From the slowing down of cruising speed until berthing |
| Cruise | The process of sailing a ship at a constant speed |
| Port departure | From idle state to sailing at cruising speed |
| Berth | Adopting engines to power daily life at berth |
Table 5.
Emission factors for the main engine, g/kWh.
| Engine Type | Fuel Type | Tier | Model Year | NOx | CO | HC | CO2 |
|---|---|---|---|---|---|---|---|
| SSD a | MDO/MGO (0.15% Sulfur content) | Tier 0 c | ≤1999 | 17.0 | 0.54 | 0.6 | 607 |
| MSD b | ≤1999 | 13.2 | 0.54 | 0.5 | 670 | ||
| SSD a | Tier 1 | 2000–2010 | 16.0 | 0.54 | 0.6 | 607 | |
| MSD b | 2000–2010 | 12.2 | 0.54 | 0.5 | 670 | ||
| SSD a | Tier 2 | 2011–2015 | 14.4 | 0.54 | 0.6 | 607 | |
| MSD b | 2011–2015 | 10.5 | 0.54 | 0.5 | 670 |
a Slow-speed diesel engine. b Medium-speed diesel engine. c All ships constructed prior to 1 January, 2000 which did not have an IMO Tier requirement at the time of construction.
Publisher’s Note: MDPI stays neutral with regard to jurisdictional claims in published maps and institutional affiliations. |
© 2021 by the authors. Licensee MDPI, Basel, Switzerland. This article is an open access article distributed under the terms and conditions of the Creative Commons Attribution (CC BY) license (https://creativecommons.org/licenses/by/4.0/).
Share and Cite
MDPI and ACS Style
Jiang, H.; Peng, D.; Wang, Y.; Fu, M. Comparison of Inland Ship Emission Results from a Real-World Test and an AIS-Based Model. Atmosphere 2021, 12, 1611. https://0-doi-org.brum.beds.ac.uk/10.3390/atmos12121611
AMA Style
Jiang H, Peng D, Wang Y, Fu M. Comparison of Inland Ship Emission Results from a Real-World Test and an AIS-Based Model. Atmosphere. 2021; 12(12):1611. https://0-doi-org.brum.beds.ac.uk/10.3390/atmos12121611
Chicago/Turabian StyleJiang, Han, Di Peng, Yunjing Wang, and Mingliang Fu. 2021. "Comparison of Inland Ship Emission Results from a Real-World Test and an AIS-Based Model" Atmosphere 12, no. 12: 1611. https://0-doi-org.brum.beds.ac.uk/10.3390/atmos12121611
Note that from the first issue of 2016, this journal uses article numbers instead of page numbers. See further details here.