
Caatinga Albedo Preserved and Replaced by Pasture in Northeast Brazil


1
Climate Sciences Graduate Program, Federal University of Rio Grande do Norte, Natal 59078-970, Brazil
2
Federal Institute of Education, Science and Technology of Rio Grande do Norte, Caicó 59300-000, Brazil
3
Department of Atmospheric and Climatic Sciences, Campus Universitário Lagoa Nova, Federal University of Rio Grande do Norte, Natal 59078-970, Brazil
*
Author to whom correspondence should be addressed.
Atmosphere 2021, 12(12), 1622; https://0-doi-org.brum.beds.ac.uk/10.3390/atmos12121622
Submission received: 24 September 2021
/
Revised: 12 November 2021
/
Accepted: 1 December 2021
/
Published: 6 December 2021
(This article belongs to the Special Issue Variabilities due to Solar and Climatic Cycles and Natural Causes Observed in South America)
Abstract
:The caatinga is considered South America’s largest seasonally dry tropical forest (SDTF) and one of the most vulnerable endemic biomes in relation to climate change. The surface albedo in caatinga is relevant to understanding the role of this biome in the climate of the Northeast region of Brazil. Thus, a comparative analysis was conducted between the albedos of preserved and anthropized caatinga (pasture). Data were collected using CNR4-type net radiometers during the dry and rainy seasons. The mean albedo values were higher in the Pasture both in the dry and rainy season, with values of 0.181 and 0.177, respectively. In the caatinga, the mean albedo values were 0.137 in the dry season and 0.146 in the rainy season. The hourly average values for albedo, taken between 6:30 a.m. and 4 p.m., with intervals of 30 min, were also higher in the pasture. For convenience, this study uses local standard time (LST), which is 3 h behind from coordinated universal time (UTC). The greatest dispersions in the frequencies of the mean hourly albedo values occurred in the early morning and late afternoon. Some of the consequences of this study is the confirmation that there is an increase in albedo in caatinga replaced by pasture and this causes a reduction in the net radiation and also the finding that a region where there is adequate pasture management also enables albedo management and from solar radiation. And that further studies can indicate the impacts on temperature and precipitation, especially in warmer periods during the dry season.
1. Introduction
Reports by the Brazilian Panel on Climate Change (BPCC) project progressive rainfall reduction for the caatinga of 10% to 20% by the year 2040, reaching 40% by the end of the 21st century. Additionally, according to the BPCC, an increase in temperature of between 0.5 °C and 1.0 °C is projected by 2040, as well as an increase of between 3.5 °C and 4.5 °C by the end of the century [1]. The BPCC, the Brazilian Platform for Biodiversity and Ecosystem Services (PBBSE) and the National Panel on Climate Change Adaptation (PNA) warn of the vulnerability of the caatinga to a more arid future scenario, implying a greater fragmentation and change of the areas limits, resulting in the displacement of the biome and in the intensification of a desertification processes [1,2]. However, Campos et al. [3] argue that there is a lack of knowledge about the caatinga regarding its vulnerability and/or resilience in a significant water deficit scenario, as it is the least studied of the Brazilian biomes [4] and the least protected, since less than 1% of the caatinga is under legal preservation reserve [5].
Over the course of five centuries, the caatinga biome has had much of its native vegetation deforested [6], with about 46% of its native vegetation currently remaining. Initially, deforestation was very much directed towards woody resources as a primary source of energy [7,8]. However, in recent decades, there has been an intensification of deforestation of the caatinga in favor of the implementation of agricultural activities. According to a report by the National Institute of the Semi-Arid (INSA), pastures occupied 15,6% of the caatinga in 1985, and in 2020, they increased their occupation to 23.1%. Additionally, other factors have contributed decisively to the degradation of the caatinga: disorderly occupation, inadequate land management, overgrazing and overexploitation, and the continuity of woody resources as a primary source of energy [7,8].
Some studies have shown that the replacement of native vegetation by agricultural areas invariably implies an increase in albedo [9,10,11,12], which is an important biophysical surface property, influencing the surface energy balance when changing the portion of reflected shortwave radiation [13,14]. Thus, albedo is always relevant information in atmosphere-vegetation-soil interactions and which is used in climate system models [15,16,17].
The surface albedo (α) is defined as the ratio between reflected shortwave solar radiation (RS↑) and incident shortwave solar radiation (RS↓) at the surface:
However, the interest of the scientific community in understanding albedo goes beyond its value as a possible indicator of change in land use, level of degradation, or occupation [18,19,20,21,22,23,24,25,26]. A better understanding of albedo, especially in agricultural areas, would allow it to be used as a possible strategy to mitigate the effects of climate change through solar radiation management (SRM). Thus, the reduction of greenhouse gas-induced warming would be possible with the increase of reflected solar radiation, which is a consequence of the increase of the mean surface albedo [11]. This strategy focuses on the adoption of agricultural practices, such as no-tillage, so that the increase in the albedo of agricultural areas during the summer results in a cooling in relation to native vegetation areas, thus attenuating the maximum temperature reached during very hot periods [9,10,27,28]. In this context, Carrer et al. [11] project that the effect resulting from the increase in the albedo of properly managed cultivation areas in Europe would be equivalent to a mitigation of 3.16 Mt CO2-eq. over 100 (one hundred) years.
In general, the albedo is higher for an exposed, sandy and lighter-toned soil. On the other hand, for a clayey and dark soil, the albedo reaches lower values. Physical properties of the materials surfaces influence the albedo. Furthermore, chemical composition acts on the reflected radiation, including its spectral range, as with chlorophyll. The albedo of many vegetated surfaces tends to be higher in infrared, and its spectral feature is dependent on the type of vegetation, age, and the season of the year [29,30].
For plant communities with forage characteristics, such as those used in sheep or goat pastures, the concentration of the upper leaves defines the canopy region. The canopy height is directly related to pasture, varying with the level of light interception (LI) and leaf area index (LAI) [31,32,33,34]. Based on studies comparing the albedo of the caatinga to the albedo of other crops [21,35,36,37,38,39,40], one can perceive that there is an influence of LAI and IL on albedo values of each canopy and that this influence depends on the cycle of each crop.
However, the density in the distribution of individuals that make up a pasture also influences the albedo, as both the canopy and the soil act in the reflection of the incident radiation. Some studies [41,42] point to the possibility that the albedo indicates pastures in degraded soil, as they reduce the net radiation and reduce the energy available for processes of evapotranspiration.
From this perspective, the study of the components of the net radiation in the caatinga, more specifically the surface albedo, is relevant for a better understanding of the availability of energy to the various processes that take place in this biome, including the possibility of providing evidence of soil degradation, such as can occur when replacing the caatinga with pasture [20,42,43,44].
According to the above, the objective of the present work is to analyze the variability of the surface albedo in an area of caatinga replaced by pasture compared to that of preserved caatinga, considering the variation between the rainy and dry seasons.
Data from this area of caatinga replaced by pasture are analyzed for the first time in a pasture with forage management in the dry season.
2. Materials and Methods
2.1. Experimental Sites
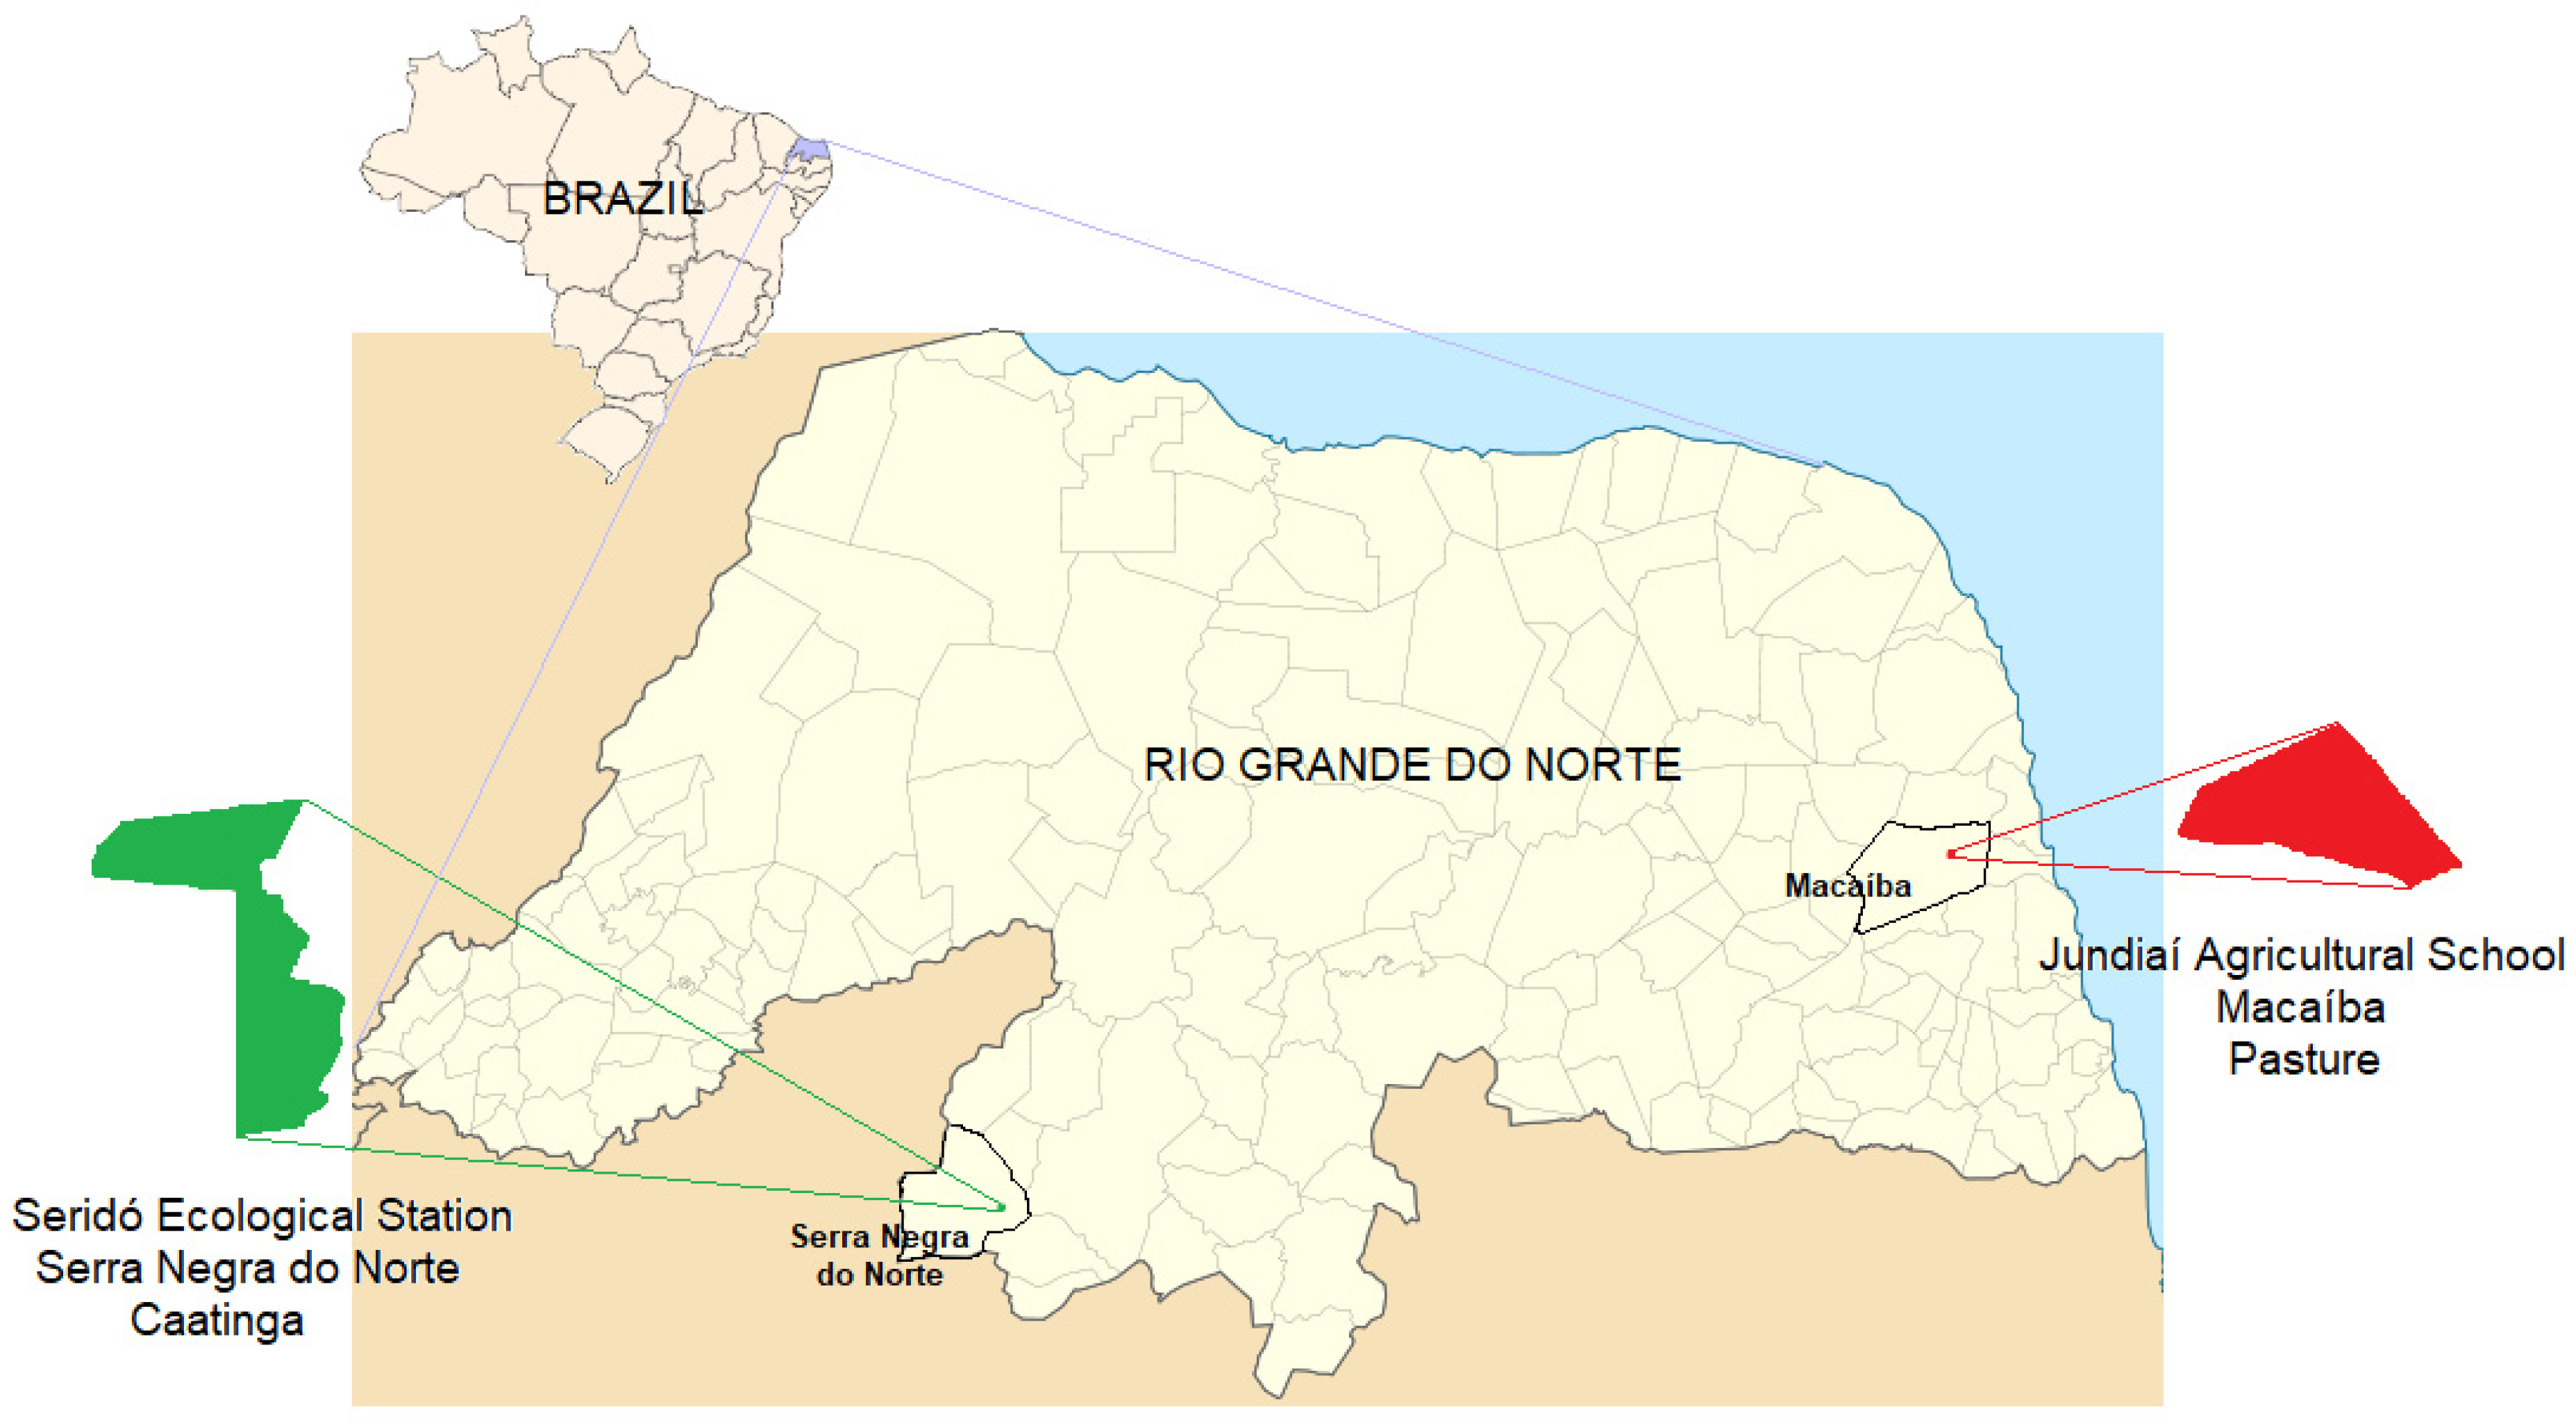
The study was carried out with data collected in two experimental campaigns at two different sites in the state of Rio Grande do Norte, Brazil. The first set of data was obtained in a preserved caatinga area at the Seridó Ecological Station (ESEC-Seridó) between the municipalities of Serra Negra do Norte (hereafter called Caatinga), located at 6°34′42″ S, 37°15′05″ W, 205 m above mean sea level. The caatinga subtype in ESEC-Seridó is a called Crystalline Caatinga, and the vegetation is a seasonally dry tropical forest (SDTF) [45,46]. It is composed of woody plants, basically small deciduous and/or semi-deciduous, highly branched trees and shrubs, many of which are thorny. The herbs are mainly therophytes [3,46,47,48,49,50,51]. Based on the Köppen classification, the climate in ESEC-Seridó is characterized as semi-arid dry and hot (Bsh) [52], with an average annual rainfall of 700 mm.
The second dataset was collected on the campus of the Specialized Academic Unit in Agrarian Sciences of the Federal University do Rio Grande do Norte (UFRN), known as the Jundiaí Agricultural School (EAJ), at coordinates 5°53′57” S and 35°22′59” W (hereafter called Pasture), in the municipality of Macaíba. The total area of the EAJ is approximately 1280 hectares, with an average altitude of 40 m, with an original experimental area of Caatinga Ecotone Agreste to Atlantic Forest (Moro et al., 2016), which was replaced by pasture (Brachiaria brizantha) for the grazing of sheep. This managed pasture is composed of four species of tropical grass: Marandu, Piatã, Aruana, and Massai [53,54]. Based on the data available between 1988 and 2020 on the website of the Agricultural Research Company in Rio Grande do Norte (EMPARN) obtained at the Peri-Peri station, which is just over 1 km from the EAJ, the region has an annual rainfall of 1177 mm. The climate is characterized as As, according to the Köppen classification [52].
Figure 1 represents the two experimental sites in the state of Rio Grande do Norte, however the figure is out of scale.
2.2. Description of Instruments and Periods of the Experiment
At the two experimental sites, the data of incident solar radiation (RS↓) and solar radiation reflected by the surface (RS↑) were collected using a pair of pyranometers inside of the net radiometers of the CNR4 model (Kipp & Zonen, Deft, The Netherlands). The pyranometers have a spectral reading band between 305 nm and 2800 nm and are connected in a back-to-back configuration. These data were obtained from samples collected every 5 (five) seconds and sent to a data logger (CR3000, Campbell Scientific, Logan, UT, USA), which stored it every 30 min. The instruments were powered by solar panels coupled to automotive batteries.
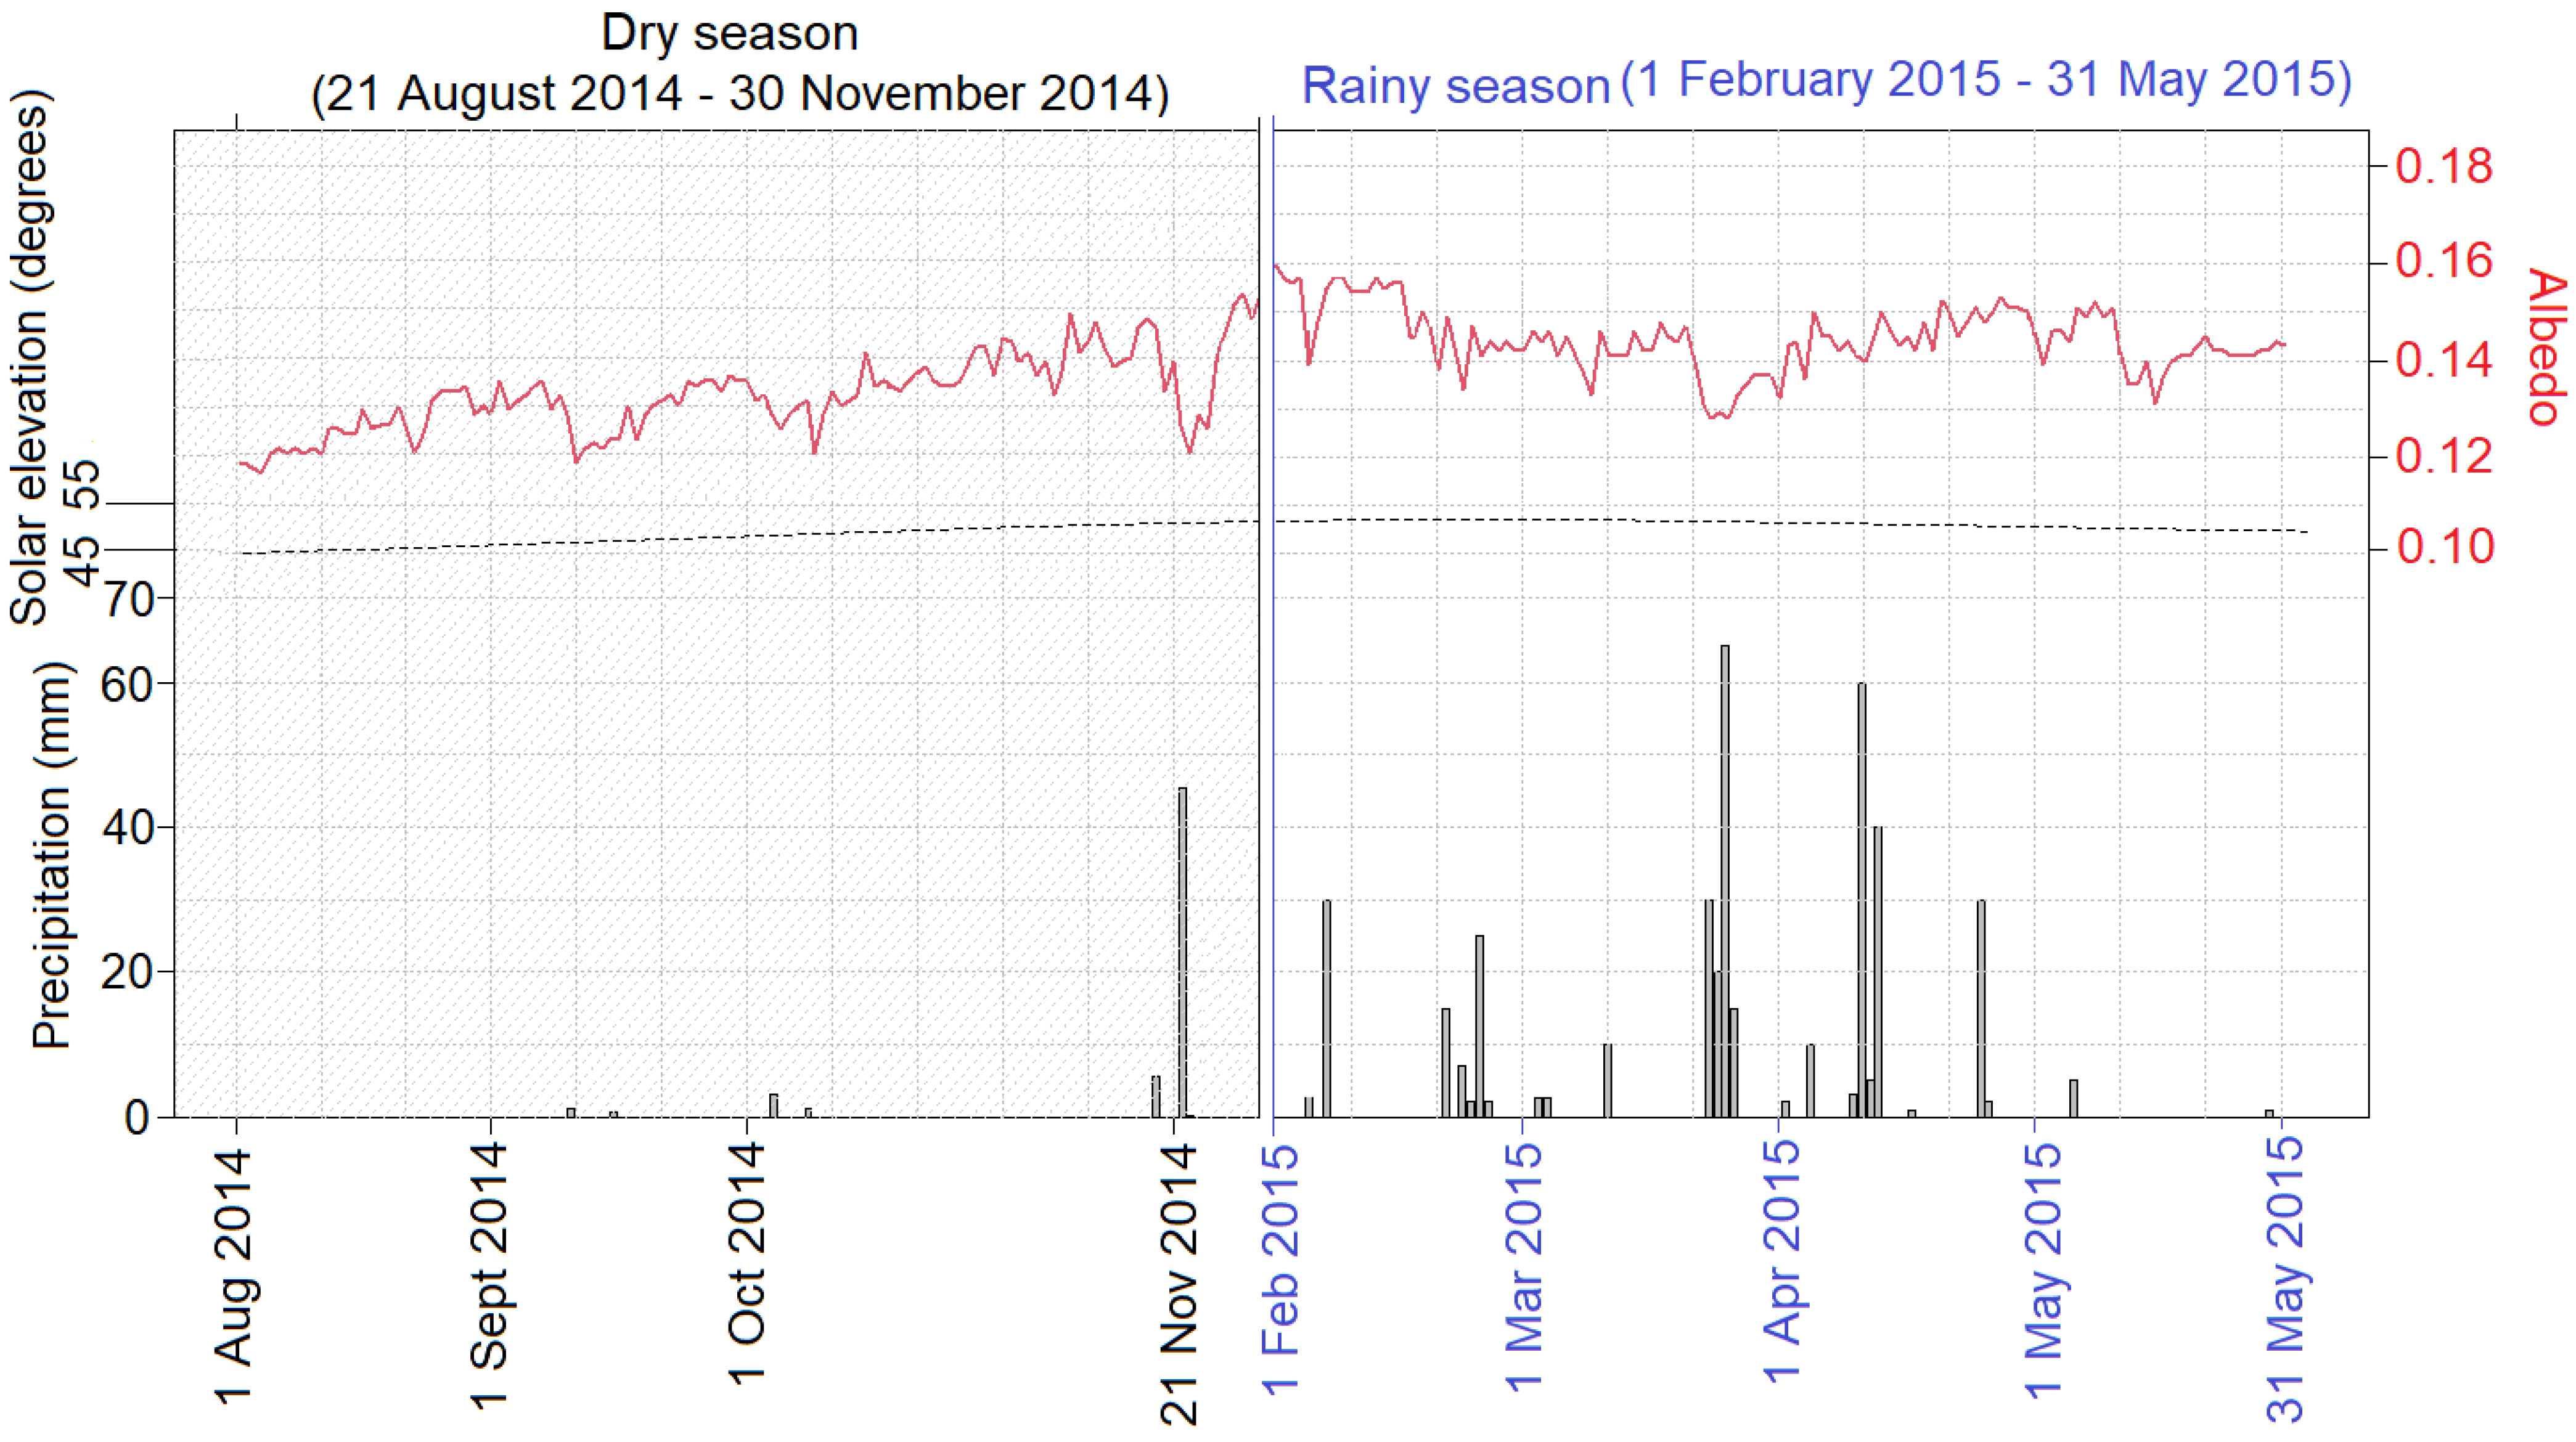
The data used from the Caatinga are included in the records between 6:30 a.m. and 4:00 p.m. in local standard time (LST) during the rainy season (from 1 February to 31 May 2015) and during the dry season (from 1 August to 31 November 2014).
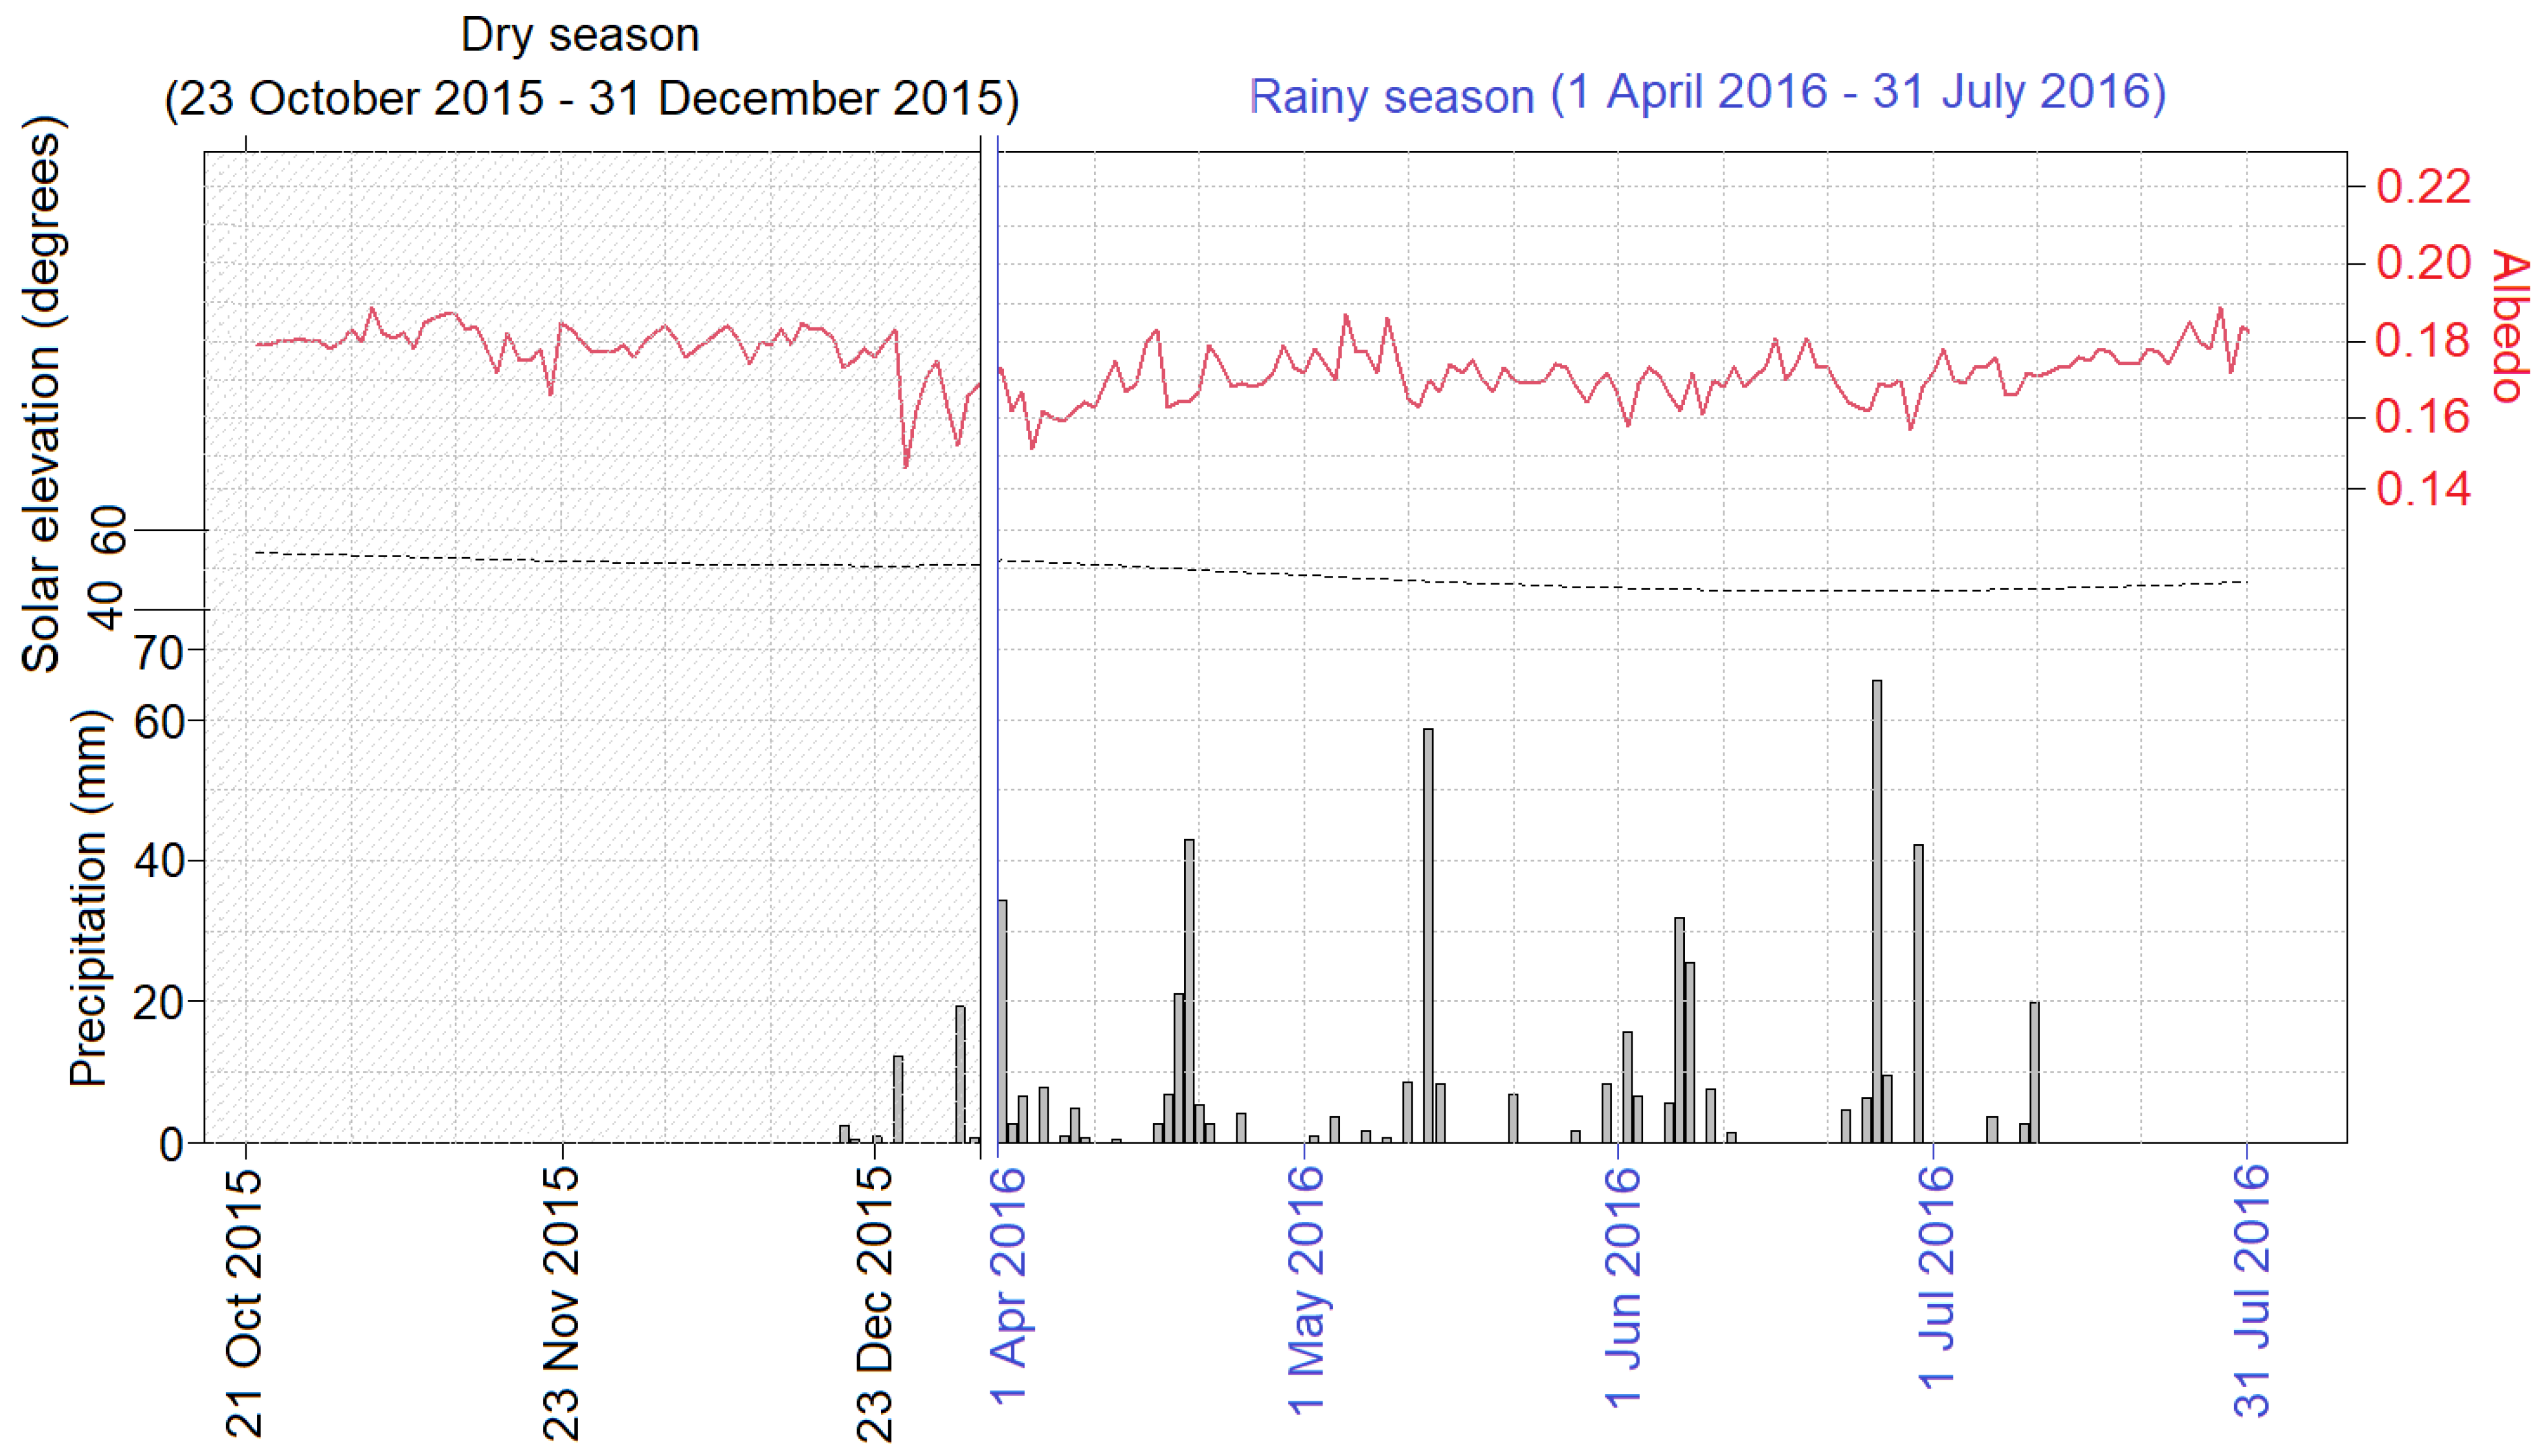
In the Pasture, data collected between 6:30 a.m. and 4:00 p.m. (LST) were also used, during the dry season (from 23 October to 31 December 2015), as well as in the period covering the rainy season (from 1 April to 31 July 2016).
Based on the climatological analysis [52] and on data obtained from the EMPARN station, the rainy season in the Pasture region takes place between the months of April and July, with an average monthly rainfall exceeding 60 mm. The rainy period accumulated 71.2% of the annual mean precipitation, and the highest mean precipitation occurred in June, with 207.3 mm, or 17.6%. The dry period comprises the months of October to December, all with rainfall below 2% of the annual historical average.
2.3. Apparent Angle Elevation Information
The data regarding the apparent elevation angles of the sun were obtained from the website SunEarthTools.com [55] and consisted of values every 30 (thirty) minutes at the two experimental sites between 06:30 a.m. and 4:00 p.m. (LST), in 2014 and 2015 for the Caatinga and in the years 2015 and 2016 for Pasture.
The site consists of several tools aimed at the solar energy market. Information that can be obtained ranges from the economic analysis of a photovoltaic system to solar charts. Therefore, by entering the latitude and longitude coordinates for the two experimental sites, data on the apparent angles of solar elevation were obtained. These angles are relative to the local horizon, both at dawn and at dusk, and not to the zenith.
These data were organized in the form of daily averages and their standard deviations, in addition to the averages every thirty minutes between the hours of 6:30 a.m. and 4 p.m. (LST), along with standard deviations, during the entire period of the experiment and in the dry and rainy seasons in Caatinga and Pasture.
2.4. Albedo Values
Albedo values were analyzed based on two time series: one of daily averages and another of 30 min averages during the analyzed periods.
Daily albedo averages ( were determined based on the ratio between the summation of daily radiation reflected ( and the summation of daily incident radiation ( as:
The average albedo for every 30 min was determined from a simple average of albedo values at that time. Although this is a series of data that would require a weighted average as a function of the solar elevation angle, according to Equation (2), low-latitude regions allow for the approximation of sine values. For low latitudes, as with the experimental sites in this study, the variation of the sine of the solar elevation angle () at the same time changes very little so that we can consider it as a constant and thus use the average simple, Equation (3).
The albedo average throughout the analyzed periods, as well as the totals in Caatinga and Pasture, was obtained as simple average, based on daily mean values.
2.5. Statistical Analysis
The standard t-test of the R software was used to compare two means of the data of interest in the two experimental sites, thus verifying the null hypothesis of their differences. Within this pattern, R performed the Student’s T Test for the means of two independent populations, with a significance level equal to 5%. Thus, for the null hypothesis of the difference between two means to be rejected, the p-value should be less than 0.05.
The R pattern also checks whether the samples are of unequal variances or sizes, able to perform the Welch’s t-test automatically. Due to the large number of data, the distribution was considered normal; therefore, normality tests were not applied to populations originating from the means.
The correlation between data of interest in Caatinga and Pasture was also verified through the R pattern, which used the Pearson correlation. Both the correlation coefficient and its significance were defined with a significance level of 5%. Therefore, with a p-value below 0.05, the hypothesis that there is no correlation would be rejected.
3. Results and Discussion
3.1. Albedo Time Series
The albedo values were organized into two time series, with daily averages encompassing the dry and rainy seasons in the Pasture (Figure 2) and in the Caatinga (Figure 3).
The albedo mean for the entire period of the series in the Caatinga was 0.14, with a standard deviation of 0.01 and values ranging from a minimum of 0.12 to a maximum of 0.16. In Pasture, the mean of the series was 0.18, with a standard deviation of 0.007. The lowest value in the series was 0.14, and the highest was 0.20. The difference between the mean albedo values in the Pasture and Caatinga during the period was 0.036, with a standard deviation of 0.017.
Precipitation directly influenced the albedo values throughout the period. The average rainfall in the Pasture was 2.74 mm/day—higher when compared to the Caatinga—with an average of 1.84 mm/day. The highest mean albedo value for the Pasture, even with greater rainfall, was confirmed by the statistically significant difference between the means in the two experimental sites (according to Table 1), within a confidence level of 95%. A higher albedo value for Pasture was expected and is in line with what has been pointed out by other research [24,37,53,54,56,57]. This is because the pasture has characteristics of sparse vegetation cover with more spaced and drier plants and more exposed soil, factors that contribute to the elevation of albedo values.
Caatinga has a longer dry season than the Pasture, with 30 days more. At this station, the daily mean albedo value in the Caatinga was 0.13 with a standard deviation of 0.01, the minimum value was 0.12, and the maximum was 0.15. The average value for albedo in the Pasture during the dry season was 0.18, with a standard deviation of 0.007 and values between a minimum of 0.14 and a maximum of 0.19. The difference in the mean albedo values at this station was 0.045, with a standard deviation of 0.015, which is statistically significant and indicates that the highest albedo value for the Pasture is consistent.
In the rainy season, the Caatinga presented an average value of 0.14 for the albedo, with a standard deviation of 0.007, revealing a maximum value of 0.16 and a minimum of 0.13. In the Pasture, the mean albedo was 0.17, and the standard deviation was also 0.006 for the rainy season; the maximum value was 0.19 and the minimum was 0.15. The difference between the mean values in this season was smaller compared to the dry season, being 0.027, with a standard deviation of 0.013, which was also statistically significant.
The daily mean precipitation values were higher in the Pasture, both in the dry and in the rainy season, when compared to the Caatinga. In the rainy season, the average rainfall in the Pasture was 4.02 mm/day, 24.4% higher than in the Caatinga, where the average precipitation was 3.23 mm/day. In the dry season, rainfall values were 0.511 mm/day in Pasture, 8.72% higher than in Caatinga, where the average rainfall was 0.470 mm/day. Even with higher precipitation in Pasture, the mean albedo values were higher in this experimental location in both dry and rainy seasons. This shows how the vegetation-cover characteristics of the Pasture increase the albedo values, overcoming the precipitation factor.
An interesting point that can also be highlighted is that the average albedo value for the rainy season in the Caatinga was 7.46% higher than the average albedo during the dry season at this same experimental site. The dry season analyzed occurred in 2014, when the total rainfall was 513 mm, below the historical average of 700 mm per year. During the dry season, the rainfall was 57.4 mm. During the dry season, precipitation occurred in all months of the period, with records on four days in September, three days in October, and four days in November. In the Caatinga, the rainy season was analyzed in 2015, when the total rainfall was even lower, with a total of 466 mm. In addition to a lower average volume, rainfall in the rainy season was more concentrated, with 23 days of some rainfall record. In May, there were only two days with precipitation, with only 6 mm for the whole month. In February, there were two periods of precipitation—one with four days and the other with two days—and in March and April, there were three periods with between two and five days of precipitation. Thus, in much of the rainy season, there was no record of precipitation in the year 2015.
During the dry season in the Caatinga, the values of incident global radiation also suggest a number of days with cloud cover, close to the number of days in the rainy season—a fact that can also influence the albedo. Another factor influencing the albedo is the darkening of the stems of the native forest in the Caatinga. Although it loses its foliage and acquires a grayish appearance, part of the vegetation also acquires a darker, brownish color at its bases during the driest periods.
In addition to the factors mentioned above, the solar elevation angle may also have contributed to a lower albedo value in the dry season. In the Caatinga, the daily average solar elevation in the rainy season was 48.44°, with a standard deviation of 3.74°. This value is lower than in the dry season, which obtained a daily average of 49.86° and a standard deviation of 2.68°. The difference in the average of 1.42° between the two seasons in the Caatinga was statistically significant within the 95% confidence interval, indicating that there was an influence of solar elevation angles contributing to the increased mean albedo values in the rainy season.
The average albedo values for the Caatinga in the dry and rainy seasons are very close. Furthermore, an atypical behavior of precipitation or a reduction in the grayish aspect of the vegetation due to darker stems, in addition to a greater mean angle of solar elevation, are factors that can help to understand the lower mean albedo value in the dry season compared to the rainy season that was obtained in this study.
Table 2 presents the mean solar elevation values for the two experimental sites, their differences, and standard deviations. In the analyzed period, the daily averages of the apparent solar elevation were considered in the whole series and in the dry and rainy seasons.
Thus, in Pasture, the average apparent solar elevation was 45.89°, with a standard deviation of 3.72°. In Caatinga, this average was 49.16°, with standard deviation of 3.22°. The difference in solar elevation values in the entire series was 2.58° and was statistically significant, as shown in Table 2. Such data thus indicate that the solar elevation angle contributed to the accentuation the difference between the albedos in the two experimental sites.
The mean values of solar elevation in the dry season were higher in Pasture, with a difference of 0.11° in relation to Caatinga. However, this difference did not present a statistically significant contribution. This indicates that the mean solar elevation contributed similarly to the albedo values at the two experimental sites during the dry season.
In Pasture, the average daily value of solar elevation was lower in the rainy season, with 43.68° and a standard deviation of 2.76°, when compared to the dry season. The difference between the two stations was 6.07°, which is statistically significant. This demonstrates that solar elevation angles contributed to the increased mean albedo values of the Pasture in the rainy season. Still, mean albedo values in the dry season are higher compared to the wet season in the Pasture.
3.2. Daytime Albedo Cycle
Figure 4a,b shows the frequency distribution of the mean hourly albedo values at the two experimental sites. The time in which there was greater dispersion of mean albedo values in Pasture was 6:30 a.m., with 50% of values ranging between 0.19 and 0.22 and a median of 0.22, even with one lower outlier. The smallest dispersion occurred at 11:30 a.m., with 75% of the mean values between 0.17 and 0.18 and a median of 0.17, and one lower outlier. Figure 4a also shows that the medians are highest in the early morning, reaching their lowest value between 11:00 a.m. and 12:30 p.m., with 0.17, increasing again in the late afternoon, reaching a value of 0.19 at 4:00 p.m.
The lower outliers were also associated with sporadic rainfall that occurred in the dry season. Figure 2 presents the values of precipitation in the Pasture during the dry season and shows that the precipitation was concentrated in the month of December 2015, so the lower discrepant values occurred in this month. The lower outliers at 6:30 a.m. and 7:00 a.m. occurred on December 24th, one day after a rainfall of 12.3 mm. Discrepant values in the hourly average of albedo also occurred at 3:00 p.m. and 3:30 p.m., with 0.11, and at 4:00 p.m., with a value of 0.12, and also occurred on December 29, precisely on the day of greatest rainfall for the period, with 19.4 mm.
In the Caatinga, the greatest dispersion of hourly mean albedo values in the dry season occurred at 3:30 p.m., with 50% of values concentrated between 0.13 and 0.16, and also at 4:00 p.m., with 50% of values concentrated between 0.14 and 0.17, in addition to an upper outlier at 4:00 p.m. The smallest dispersion occurred at 9:30 a.m. and 10 a.m., with 50% of the values equal to 0.13 and two upper outliers and two lower outliers. The median of the mean hourly values of albedo in the Caatinga during the dry season had its highest value at 6:30 a.m., with 0.14, remaining stable with 0.13 from 7:00 a.m. to 2:30 p.m. The values of the median increase again at 3:00 p.m., with a value of 0.14, peaking at 0.16 at 4:00 p.m.
Although the median has some stability throughout the day, the frequency distribution indicates the variation of the mean albedo values are in some conformity with the changes in the mean hourly elevation of the sun. Thus, we have higher mean albedo values in the early morning, decreasing throughout the day, and increasing again in the afternoon.
Regarding the discrepant values for the Caatinga in the dry season, Figure 4b indicates lower outliers that are associated with the rainfall that occurred in this period in 2014. The lower albedo discrepant values occurred at 6:30 a.m. and 7:00 a.m. on September 9th, with 0.11, and were due to the 1.2 mm precipitation that occurred the day before. The largest lower albedo discrepancy occurred on August 14 at 3:00 p.m., with 0.10. However, there was no precipitation around that day, and the low albedo value may be associated with cloud cover, since at 2:00 p.m. and 2:30 p.m., the albedo was also relatively low, with an intensity of 0.11. The positive outliers that occurred mainly between 6:30 a.m. and 8:30 a.m. may be associated with sporadic variations in vegetation or soil cover, increasing the reflected radiation.
Figure 5 shows the frequency distribution for mean albedo values at each hour of the day, ranging from 6:30 a.m. to 4:00 p.m. in the rainy season. Figure 5a shows the values for Pasture, and Figure 5b for Caatinga.
In Pasture, the greatest dispersion in the frequency of hourly mean albedo values in the rainy season occurred at 6:30 a.m., with 50% of the values between 0.13 and 0.24 and the other 50% between 0.24 and 0.29. The smallest dispersion, with 50% of values varying by 0.01, comprising two quartiles, occurred between 9:00 a.m. and 10:30 a.m. and between 11:30 a.m. and 3:30 p.m., although the mean albedo values were slightly different in these intervals. Figure 5a indicates that the largest dispersions occurred in the morning and late afternoon, in addition to showing that the smallest dispersions are concentrated in the central part of the day, with the exception of 11 a.m.
It is interesting to point out that a possible factor for the upper outliers on the mean hourly albedo values would be the sheep grazing cycle. However, according to Souza et al. [39], the occupation period of the pasture is approximately 11 days, with an average of 60 days of rest from the pasture. This would imply a cycle that does not seem to predominantly influence the albedo, probably due to the height of the pasture in the pre-grazing phases, which averages between 25 cm and 50 cm, and post-grazing, with heights between 15 cm and 25 cm. For both cases, the solar and IL radiation intercept value has little change and was identified as being between 90% and 95% [39]. Therefore, the herding activity would not influence the albedo directly to justify the superior outliers. As the grazing activity in the study area is effective for the dry season period, in the other seasons, there was no controlled grazing.
For the rainy season, the greatest dispersion in the Caatinga occurred at 4:00 p.m., with 50% of the hourly mean albedo values between 0.13 and 0.16 and the other 50% between 0.16 and 0.20. The smallest dispersion of frequency distribution in the albedo occurred at 11:30 a.m.; at this time, 50% of the mean values were 0.14. Albedo frequency dispersion was also low during most of the day, with 50% of the values varying very little—only 0.01 of variation between 8:00 a.m. and 10:30 a.m. and between 12:00 a.m. and 3:30 p.m. This shows a minimal variation for the mean albedo values at the times mentioned.
Similar to Figure 4b, Figure 5b also shows that in the rainy season, there was some stability in the median of albedo values in the Caatinga. The median had a minimum value of 0.14 between 8:30 a.m. and 2 p.m., and the maximum occurred at 7:00 a.m., at 3:30 p.m., and at 4:00 p.m., with 0.16 of the median. Thus, the hourly average albedo value changed little during the day—only 0.02—confirming the minimal variation in the hourly albedo during the day in the Caatinga during the rainy season.
The median values in both Pasture and Caatinga also portray the influence of solar elevation, where the lowest angles in the early morning and late afternoon influenced the albedo values more strongly.
Table 3 shows the average values for solar elevation angles between the hours of 6:30 a.m. and 4:00 p.m., every 30 min. In the pasture, during the dry season, the highest mean solar elevation value was 75.87°. It happened at 11:00 a.m., and at that same time, the median had its lowest value, 0.17. The highest value for the median was recorded at 6:30 a.m., with an average solar elevation angle of 20.51°. For the Caatinga, the highest median in the dry season was at 4:00 p.m., where the average elevation was 20.06°, and the highest average for solar elevation was at 11:30 a.m., with 78.16°.
However, the dispersion of albedo values at each time was affected differently by variations in incidence angles. In the late afternoon and early morning, there was a greater influence when compared to variations in periods close to the local zenith. In the Pasture, both in the dry and rainy seasons, the hour with the higher dispersion was 6:30 a.m. However, it was not the time with the higher variation for solar elevation angles, since at this time, 06:30 a.m., the standard deviation was 1.48° for the dry season and 1.37° for the rainy season. In the Pasture, the highest standard deviation for the dry season was 3.93° at 11:00 a.m., and for the rainy season, it was 5.28° at 11:30 a.m. Even with the greatest variation in the mean angles of solar elevation, at 11:00 a.m. and 11:30 a.m. hours, there was a low dispersion in albedo values.
In Caatinga, similarly to Pasture, the variances of mean solar angles are greater for times close to the local zenith and less in the early morning and late afternoon, as shown in Table 3 through standard deviations. During the dry and rainy seasons in the Caatinga, the greatest dispersion occurred at 4:00 p.m., where the standard deviation for solar elevation was 0.62° in the dry season and 3.41° in the rainy season. The lowest dispersion values during the dry season occurred at 9:30 a.m., with a standard deviation of 4.18°, and at 10:00 a.m., with a standard deviation of 4.66°. In the rainy season, the smallest dispersion occurred at 11:30 a.m., when the standard deviation for solar elevation was 8.47°.
Although the smallest variances in solar elevation occurred in the early morning and late afternoon, it was in this same period that the highest dispersions occurred. On the other hand, the hour with highest variance for solar elevation occurred close to the central range of the day. This was where the smallest frequency dispersions were obtained for the mean values of albedo. This is due to the fact that albedo values are lower for higher incidence angles, thus implying less influence, even with a higher variance in solar elevation.
Another relationship shown by Figure 3 and Figure 4 and confirmed in Table 4 is the different results obtained at the two experimental sites in relation to the mean hourly values of albedo and the mean hourly angles of solar elevation.
In the Pasture, the correlation between solar elevation angles and albedo values was stronger than that in Caatinga, both in the dry and rainy seasons. There was a negative correlation, which was already expected for the two experimental sites and that was confirmed as statistically significant. Both in Pasture and Caatinga, it was the rainy season that presented a stronger response of albedo values in relation to variations in solar elevation during the day compared to the dry season.
Thus, the greater dispersion of mean albedo values both in Pasture and Caatinga during the dry season was influenced by the variation in the angle of solar elevation. However, this would not be the only factor. Partial cloud cover may have influenced the variation of albedo values, especially in the early morning and late afternoon, due to the greater scattering that occurred in these periods. Another factor would be the accumulation of moisture in the soil and vegetation cover at night, which could influence albedo values in the early morning.
4. Conclusions
The analysis of the time series confirmed the expectation that the Pasture has higher average albedo values throughout the period, as well as in the dry and rainy seasons, when compared to the Caatinga. Furthermore, the statistical significance of the influence of precipitation and solar elevation angle on albedo values was identified.
The average precipitation throughout the series, considering the dry and rainy seasons, was more intense in the Pasture. Statistically, the difference in precipitation between the two experimental sites was significant, indicating that there was a greater influence of precipitation to attenuate the albedo values in the Pasture, mainly in the rainy season. However, the albedo values were still higher at this experimental site compared to the Caatinga.
Contrary to precipitation, the influence of solar elevation angles accentuated the difference between the mean albedo values for the two experimental sites. The solar elevation angles were, on average, smaller in the Pasture during the whole series, presenting a statistically significant difference when compared to the Caatinga. However, this difference in elevation angles was not statistically significant during the dry period.
The influence of solar elevation also revealed a different response in the Pasture and Caatinga. The negative correlation between solar elevation and albedo values was stronger in Pasture compared to Caatinga, both in the dry and rainy seasons. This more intense negative correlation is characteristic of regions with more exposed soil and thicker vegetation cover.
Both in Caatinga and Pasture, there is little variation in mean albedo values between their dry and rainy seasons. In the Caatinga, this difference between the dry and rainy seasons is small enough, to the point of allowing that, given some factors, the average albedo values in the dry season are lower than in the rainy season, contrary to what other research shows. Factors such as atypical precipitation, whether in spacing of rainy periods, in accumulated volume, or the time when precipitation occurs; the darkening of the stem of part of the vegetation due to the dry period; and cloud cover during periods with greater influence of solar elevation are factors that help us to understand this behavior of the average albedo in the Caatinga.
The results of this research show that an area of caatinga replaced by pasture acquires biophysical characteristics that imply a reduction in the net radiation compared to caatinga with native forest. This reduction is substantially due to the increase in the average albedo value, which remains higher, even in rainy seasons. This change in land cover also implies higher daily variability in albedo values since in pasture, the mean albedo values at each time of day have a higher difference in dispersion and a higher variation between their means and medians in relation to the caatinga. As a result, the net radiation will also have a higher variability during the day, which may imply changes in local biomes. The pasture also has a lower seasonal variability when compared to the caatinga, although they are very close. Depending on the coverage area, this difference can be more significant for the net radiation and for the region’s climate.
From perspective of analysis of the behavior of albedo in a managed pasture area, the results presented may also substantiate research on the potential use of this biophysical factor in the management of solar radiation, researching the influence of vegetation cover and its relationship with albedo on precipitation and temperature reduction during the hottest periods of the dry season.
This increase in albedo values can also indicate a boundary between a pasture region and a degraded area. Thus, a region with adequate pasture management, especially in the dry season, implies an elevation of the albedo but without necessarily leading to an area of degraded anthropogenic caatinga.
Author Contributions
Conceptualization, A.M.S. and B.G.B.; data curation, A.M.S. and B.G.B.; formal analysis, A.M.S., B.G.B. and C.M.S.eS.; funding acquisition, B.G.B. and C.M.S.eS.; investigation, A.M.S.; methodology, A.M.S., B.G.B. and C.M.S.eS.; project administration, B.G.B. and C.M.S.eS.; software, A.M.S.; supervision, B.G.B. and C.M.S.eS.; writing—original draft, A.M.S.; writing—review & editing, A.M.S., B.G.B. and C.M.S.eS. All authors have read and agreed to the published version of the manuscript.
Funding
National Observatory of Water and Carbon Dynamics in the Caatinga Biome (INCT-MCTI/CNPq/CAPES/FAPs 16/2014, grant: 465764/2014-2) and (MCTI/CNPq N° 28/2018, grant 420854/2018-5).
Institutional Review Board Statement
Not applicable.
Informed Consent Statement
Not applicable.
Data Availability Statement
Owing to the nature of this research, the participants of this study did not agree to their data being shared publicly; therefore, supporting data are not available.
Acknowledgments
The authors are thankful to the Brazilian National Institute of Semi-Arid (INSA) for funding the project which originated the EC data used in this study. We are also thankful to ICMBio (Chico Mendes Institute for Biodiversity Conservation) for providing access to the experimental site and to ESEC-Seridó (Ecological Station of Seridó) for supporting experimental activities. The author Cláudio Moisés Santos e Silva thanks to the Conselho Nacional de Desenvolvimento Científico e Tecnológico (CNPq) for the Research Productivity Scholarships (processes number 310781/2020-5) and financial support of CNPq, through the project NOWCDCB: National Observatory of Water and Carbon Dynamics in the Caatinga Biome (INCT -MCTI/CNPq/CAPES/FAPs 16/2014, grant: 465764/2014-2) and (MCTI/CNPq N° 28/2018, grant 420854/2018-5).
Conflicts of Interest
The authors declare no conflict of interest.
References
- PBMC/BPBES. Potência Ambiental da Biodiversidade: Um Caminho Inovador para o Brasil: Special Report from the Brazilian Panel on Climate Change and the Brazilian Platform on Biodiversity and Ecosystem Services, 1st ed.; Scarano, F.R., Santos, A.S., Eds.; PBMC COPPE—UFRJ: Rio de Janeiro, Brazil, 2018. [Google Scholar]
- Ministry of Environment. National Plan of Adaptation to Climate Change—PNA. Volume II: Estratégias Setoriais e Temáticas; Ministry of Environment: Brasília, Brazil, 2016; p. 371.
- Campos, S.; Mendes, K.R.; Da Silva, L.L.; Mutti, P.R.; Medeiros, S.S.; Amorim, L.B.; Dos Santos, C.A.; Perez-Marin, A.M.; Ramos, T.M.; Marques, T.V.; et al. Closure and partitioning of the energy balance in a preserved area of Brazilian seasonally dry tropical forest. Agric. For. Meteorol. 2019, 271, 398–412. [Google Scholar] [CrossRef]
- Dombroski, J.L.D.; Praxedes, S.C.; Freitas, R.M.O.; Pontes, F.M. Water relations of Caatinga trees in the dry season. S. Afr. J. Bot. 2011, 77, 430–434. [Google Scholar] [CrossRef] [Green Version]
- Koch, R.; Almeida–Cortez, J.S.; Kleinschmit, B. Revealing areas of high nature conservation importance in a seasonally dry tropical forest in Brazil: Combination of modelled plant diversity hot spots and threat patterns. J. Nat. Conserv. 2017, 35, 24–39. [Google Scholar] [CrossRef]
- Da Silva, M.V.; Pandorfi, H.; Lopes, P.M.O.; da Silva, J.L.B.; de Almeida, G.L.P.; de Oliveira Silva, D.A.; dos Santos, A.; de Moraes Rodrigues, J.A.; Batista, P.H.D.; Jardim, A.M.D.R.F. Pilot monitoring of caatinga spatial-temporal dynamics through the action of agriculture and livestock in the brazilian semiarid. Remote Sens. Appl. Soc. Environ. 2020, 19, 100353. [Google Scholar] [CrossRef]
- Menezes, R.S.C.; Sampaio, E.V.S.B.; Gioingo, V.; Pérez-Marin, A.M. Biogeochemical cycling in terrestrial ecosystems of the Caatinga Biome. Braz. J. Biol. 2012, 72, 643–653. [Google Scholar] [CrossRef]
- Tomasella, J.; Silva Pinto Vieira, R.M.; Barbosa, A.A.; Rodriguez, D.A.; de Oliveira Santana, M.; Sestini, M.F. Desertification trends in the Northeast of Brazil over the period 2000–2016. Int. J. Appl. Earth Obs. Geoinf. 2018, 73, 197–206. [Google Scholar] [CrossRef]
- Bird, D.N.; Kunda, M.; Mayer, A.; Schlamadinger, B.; Canella, L.; Johnston, M. Incorporating changes in albedo in estimating the climate mitigation benefits of land use change projects. Biogeosci. Discuss 2008, 5, 1511–1543. [Google Scholar]
- Davin, L.E.; Seneviratne, S.I.; Ciais, P.; Olioso, A.; Wang, T. Preferential cooling of hot extremes from cropland albedo management. Proc. Natl. Acad. Sci. USA 2014, 111, 9757–9976. [Google Scholar] [CrossRef] [Green Version]
- Carrer, D.; Pique, G.; Ferlicoq, M.; Ceamanos, X.; Ceschia, E. What is the potential of cropland albedo management in the fight against global warming? A case study based on the use of cover crops. Environ. Res. Lett. 2018, 13, 044030. [Google Scholar]
- Andrade, R.G.; Batistella, M.; Amaral, T.B.; Menezes, S.J.M.C. Estimativa do Albedo em Áreas de Pastagem e Floresta no Mato Grosso do Sul. In Proceedings of the Congresso Brasileiro de Meteorologia, Florianópolis, Santa Catarina, Brazil, 27 November–1 December 2006. [Google Scholar]
- Rotemberg, E.; Yakir, D. Contribution of Semi-Arid Forests to the Climate System. Am. Assoc. Adv. Sci. 2010, 237, 451–454. [Google Scholar]
- Zhao, W.; Hu, Z.; Li, S.; Guo, Q.; Liu, Z.; Zhang, L. Comparison of surface energy budgets and feedbacks to microclimate among different land use types in an agro-pastoral ecotone of northern China. Sci. Total Environ. 2017, 599–600, 891–898. [Google Scholar] [CrossRef]
- Leitão, M.M.V.B.R.; Santos, J.M.; Oliveira, G.M. Estimativas do Albedo em Três Ecossistemas da Floresta Amazônica. Revista Brasileira de Engenharia Agrícola e Ambiental 2002, 6, 256–261. [Google Scholar] [CrossRef] [Green Version]
- Wang, S.; Davidson, A. Impact of Climate Variations on Surface Albedo of a Temperate Grassland. Agric. For. Meteorol. 2007, 142, 133–142. [Google Scholar] [CrossRef]
- Nascimento, F.C.A. Padrões Espaciais e Sazonais dos Balanços de Energia e Carbono na Caatinga do Estado do Rio Grande do Norte. Ph.D. Thesis, Federal University of Campina Grande, Campina Grande, Brazil, 2018. [Google Scholar]
- Jackson, R.D.; Idso, C.B.; Otterman, J. Surface Albedo and Desertification. Science 1975, 189, 1012–1015. [Google Scholar] [CrossRef] [PubMed] [Green Version]
- Charney, J.; Quirk, W.J.; Chow, S.; Kornfield, J. A Comparative Study of the Effects of Albedo Chages on Drougth in Semi-Arid Regions. J. Atmos. Sci. 1977, 34, 1366–1385. [Google Scholar] [CrossRef] [Green Version]
- Cunha, A.P.M.A.; Alvalá, R.C.S.; Oliveria, G.S. Impactos das Mudanças de Cobertura Vegetal nos Processos de Superfície na Região Semiárida do Brasil. Rev. Bras. Meteorol. 2013, 28, 139–152. [Google Scholar] [CrossRef]
- Santos, F.A.; Alves, T.L.; Azevedo, T.B.; Santos, C. Comportamento Sazonal do Albedo e dos Índice de Vegetação na Bacia Hidrográfica do alto curso do Rio Paraíba. Rev. Bras. Geogr. Fis. 2014, 7, 1015–1027. [Google Scholar] [CrossRef]
- Pereira, A.C.M.; Paschoal, S.S.L.; Araújo, P.C. Análise espaço-temporal da desertificação no semiárido do Nordeste do Brasil através de imagens de satélite LANDSAT 5. Soc. Territ. 2014, 26, 181–196. [Google Scholar]
- Liu, F.; Chen, Y.; Lu, H.; Shao, H. Albedo indicating land degradation around the Badain Jaran Desert for better land resources utilization. Sci. Total Environ. 2017, 578, 67–73. [Google Scholar] [CrossRef]
- Ferreira Júnior, J.J.; Ferreira Dantas, M.J.F. Análise do albedo da superfície e índices de vegetação por sensoriamento remoto na bacia hidrográfica do rio Pacoti/CE. Rev. Tecnol. 2018, 39, 1–18. [Google Scholar] [CrossRef]
- Rodrigues, T.M.F.; Senna, M.C.A.; Cataldi, M. Simulação dos impactos climáticos da desertificação do Nordeste brasileiro. Revista Engenharia Sanitária e Ambiental 2019, 24, 1037–1047. [Google Scholar] [CrossRef] [Green Version]
- Cunha, J.; Nóbrega, R.L.B.; Rufino, I.; Erasmi, S.; Galvão, C.; Valente, F. Surface albedo as a proxy for land-cover clearing in seasonally dry forests: Evidence from the Brazilian Caatinga. Remote Sens. Environ. 2020, 238, 111250. [Google Scholar] [CrossRef] [Green Version]
- Lobell, D.B.; Bala, G.; Duffy, P.B. Biogeophysical impacts of cropland management changes on climate. Geophys. Res. Lett. 2006, 33, 06708. [Google Scholar] [CrossRef]
- Lenton, T.M.; Vaughan, N.E. The radiative forcing potential of different climate geoengineering options. Atmos. Chem. Phys. 2009, 9, 5539–5561. [Google Scholar] [CrossRef] [Green Version]
- Iqbal, M. An Introduction to Solar Radiation; Academic Press Canada: Toronto, ON, Canada, 1983. [Google Scholar]
- Macagnan, M.H. Introdução à Radiação Solar—University of Vale do Rio dos Sinos; UNISINOS: São Leopoldo, Brazil, 2010. [Google Scholar]
- Silva, S.C.; Nascimento, D., Jr. Avanços na pesquisa com plantas forrageiras tropicais em pastagens: Características morfofisiológicas e manejo do pastejo. Rev. Bras. Zootecnologia 2007, 36, 121–138. [Google Scholar] [CrossRef] [Green Version]
- Souza, J.S. Estratégias de Manejo de Capim-Massai Pastejado por Ovinos sob Lotação Intermitente. Master’s Thesis, Federal University of Rio Grande do Norte, Macaíba, Rio Grande do Norte, Brazil, 2016. [Google Scholar]
- Matos, R.C.M.; Candeias, A.L.B.; Azevedo, J.R.G. Estimativas do saldo de radiação instantâneo no entorno do reservatório de Itaparica-PE com o uso de imagens orbitais. Rev. Bras. Cartogr. 2016, 68, 641–654. [Google Scholar]
- Carvalho, H.F.S.; Moura, M.S.B.; Leitão, M.M.V.B.R.; Rodrigues, C.T.A.; Da Silva, T.G.F. Albedo de Caatinga Preservada Comparado com Cultivo de Cana-De-Açúcar Irrigada. In Proceedings of the XX Congresso Brasileiro de Agrometeorologia, Juazeiro, Bahia, Brazil, 14–18 August 2017. [Google Scholar]
- Siqueira, A.A.; Leitão, M.M.V.B.R. Determinação do Albedo em áreas de Caatinga e Reflorestada com Algaroba no Semi-árido do Nordeste Brasileiro. In Proceedings of the Anais XI Congresso Brasileiro e II Reunião Latino-Americana de Agrometeorologia, Florianópolis, Brazil, 19–24 July 1999. [Google Scholar]
- Moreira, M.A. Noções básica sobre vegetação e sua interação com a radiação solar. In Fundamentos do Sensoriamento Remoto e Metodologia de Aplicação; INPE: São José dos Campos, Brazil, 2001; pp. 61–90. [Google Scholar]
- Berbet, M.L.C. A Influência Sazonal do Albedo da Superfície na Mudança do Padrão de Chuva, em Consequência da Conversão da Floresta Tropical em Pastagens. Ph.D. Thesis, Federal University of Viçosa, Viçosa, Brazil, 2002. [Google Scholar]
- Souza, P.J.O.P.; Ribeiro, A.; Rocha, E.J.P.; Loureiro, R.S.; Bispo, C.J.C.; Sousa, A.M.L. Albedo da cultura da soja em área de avanço da fronteira agrícola na Amazônia. Rev. Bras. Eng. Agric. Ambient. 2010, 1, 65–73. [Google Scholar] [CrossRef] [Green Version]
- De Souza, L.S.B.; de Moura, M.S.B.; Sediyama, G.C.; Silva, T.G.F. Balanço de radiação em ecossistema de Caatinga preservada durante um ano de seca no semiárido Pernambucano. Rev. Bras. Geogr. Fis. 2015, 8, 41–55. [Google Scholar] [CrossRef]
- Carvalho, T.R.A.; Almeida, C.L.; Almeida, A.M.M.; Porto, M.F.; Araújo, J.C. Índice de área foliar em caatinga preservada. Conex. Cienc. Tecnol. 2017, 11, 35–42. [Google Scholar] [CrossRef] [Green Version]
- Muniz, R.A.; Sousa, E.F.; Mendonça, J.C.; Esteves, B.S.; Lousada, L.L. Balanço de Energia e Evapotranspiração do Capim Mombaça sob Sistema de Pastejo Rotacionado. Rev. Bras. Meteorol. 2014, 29, 47–54. [Google Scholar] [CrossRef] [Green Version]
- Veloso, G.A.; Ferreira, M.E.; Silva, B.B.; Ferreira Júnior, L.G. Saldo de radiação em áreas de pastagens: Manejo e produtividade do ambiente. In Proceedings of the Anais do XVII Simpósio Brasileiro de Sensoriamento Remoto, João Pessoa, Brazil, 25–29 April 2017. [Google Scholar]
- Galvão, J.A.C. Estudo do Balanço de Radiação em Áreas de Floresta e Pastagem na Amazônia. Master’s Thesis, National Institute for Space Research (INPE), São José dos Campos, Brazil, 1999. [Google Scholar]
- Lima, J.G.F. Alterações Micrometeorológicas Causadas pelas Mudanças de Uso do Solo no Seridó Potiguar. Master’s Thesis, Federal University of Rio Grande do Norte, Natal, Brazil, 2017. [Google Scholar]
- Queiroz, L.P.; Cardoso, D.; Fernandes, M.F.; Moro, M.F. Diversity and Evolution of Flowering Plants of the Caatinga Domain. In Caatinga—The Largest Tropical Dry Forest Region in South America; Springer: New York, NY, USA, 2017; pp. 23–63. [Google Scholar]
- Moro, M.F.; Nic Lughadha, E.; de Araújo, F.S.; Martins, F.R. A Phytogeographical Metaanalysis of the Semiarid Caatinga Domain in Brazil. Bot. Rev. 2016, 82, 91–148. [Google Scholar] [CrossRef]
- Althoff, T.D.; Menezes, R.S.C.; Carvalho, A.L.; Pinto, A.S.; Santiago, G.A.C.F.; Ometto, J.P.H.B.; Randow, C.; Sampaio, E.V.S.B. Climate change impacts on the sustainability of the firewood harvest and vegetation and soil carbon stocks in a tropical dry forest in Santa Teresinha Municipality, Northeast Brazil. For. Ecol. Manag. 2016, 360, 367–375. [Google Scholar] [CrossRef]
- Tavares-Damasceno, J.P.; Silveira, J.L.G.S.; Câmara, T.; Stedile, P.C.; Macario, P.; Toledo-Lima, G.S.; Pichorim, M. Effect of drought on demography of Pileated Finch (Coryphospingus pileatus: Thraupidae) in northeastern Brazil. J. Arid Environ. 2017, 147, 63–70. [Google Scholar] [CrossRef]
- Mendes, K.R.; Campos, S.; Da Silva, L.L.; Mutti, P.R.; Ferreira, R.R.; Medeiros, S.S.; Perez-Marin, A.M.; Marques, T.V.; Ramos, T.M.; Vieira, M.M.D.L.; et al. Seasonal variation in net ecosystem CO2 exchange of a Brazilian seasonally dry tropical forest. Sci. Rep. 2020, 10, 9454. [Google Scholar] [CrossRef] [PubMed]
- Mendes, K.R.; Campos, S.; Mutti, P.R.; Ferreira, R.R.; Ramos, T.M.; Marques, T.V.; Reis, J.S.; Vieira, M.M.D.L.; Silva, A.C.N.; Marques, A.M.S.; et al. Assessment of SITE for CO2 and Energy Fluxes Simulations in a Seasonally Dry Tropical Forest (Caatinga Ecosystem). Forests 2021, 12, 86. [Google Scholar] [CrossRef]
- Marques, T.V.; Mendes, K.R.; Mutti, P.R.; Medeiros, S.S.; Da Silva, L.L.; Perez-Marin, A.M.; Campos, S.; Lúcio, P.S.; Lima, K.; Reis, J.S.; et al. Environmental and biophysical controls of evapotranspiration from Seasonally Dry Tropical Forests (Caatinga) in the Brazilian Semiarid. Agric. For. Meteorol. 2020, 287, 107957. [Google Scholar] [CrossRef]
- Alvares, C.A.; Stape, J.L.; Sentelhas, P.C.; de Moraes Gonçalves, J.L.; Sparovek, G. Köppen’s climate classification map for Brazil. Meteorol. Z. 2013, 22, 711–728. [Google Scholar] [CrossRef]
- Emerenciano Neto, J.V.; Difante, G.S.; Montagner, D.B.; Bezerra, M.G.S.; Galvão, R.C.P.; Vasconcelos, R.I.G. Características Estruturais do Dossel e Acúmulo de Forragem em Gramíneas Tropicais sob Lotação Intermitente e Pastejada por Ovinos. Biosci. J. 2013, 29, 962–973. [Google Scholar]
- De Medeiros Trindade, T.F.; dos Santos Difante, G.; Emerenciano Neto, J.V.; Fernandes, L.S.; Araújo, I.M.M.; Véras, E.L.L.; Costa, M.G.; Silva, M.G.T.; Medeiros, M.C. Biometry and carcass characteristics of lambs supplemented in tropical grass pastures during the dry season. Biosci. J. 2018, 34, 172–179. [Google Scholar] [CrossRef] [Green Version]
- SunEarthTools.com. Ferramentas para Designers e Consumidores de Energia Solar. Available online: https://www.sunearthtools.com/dp/tools/pos_sun.php?lang=pt (accessed on 28 August 2021).
- Lima, P.C.S.; Leitão, M.M.V.B.R.; Azevedo, P.V.; Oliveira, G.M.; Espínola Sobrinho, J.; Moura, M.S.B.; Menezes, H.E.A.; Pinto, M.G.C.L. Albedo de Pastagem e Caatinga. In Proceedings of the XVI Congresso Brasileiro de Agrometeorologia, Belo Horizonte, Brazil, 22–25 September 2009. [Google Scholar]
- Veloso, G.A.; Ferreira, M.E.; Rosa, R.; Silva, B.B. Determinação do Albedo de Superfície em Áreas Irrigadas do Projeto Jaíba (Minas Gerais) Mediante Imagens Landsat 5—Tm. Rev. Ra’e Ga 2015, 35, 126–146. [Google Scholar] [CrossRef] [Green Version]
Figure 1.
Representation of the location of the Caatinga and Pasture sites. Created by the author.

Figure 2.
Albedo, precipitation, and solar elevation in Pasture. Daily mean albedo values are represented by the solid red line, daily rainfall volumes are represented by vertical bars, and daily mean values of solar elevation are represented by the dashed line.
Figure 2.
Albedo, precipitation, and solar elevation in Pasture. Daily mean albedo values are represented by the solid red line, daily rainfall volumes are represented by vertical bars, and daily mean values of solar elevation are represented by the dashed line.

Figure 3.
Albedo, precipitation, and solar elevation in Caatinga. Daily mean albedo values are represented by the solid red line, daily rainfall volumes are represented by vertical bars, and daily mean values of solar elevation are represented by the dashed line.
Figure 3.
Albedo, precipitation, and solar elevation in Caatinga. Daily mean albedo values are represented by the solid red line, daily rainfall volumes are represented by vertical bars, and daily mean values of solar elevation are represented by the dashed line.

Figure 4.
Distribution of hourly mean albedo values in the dry season in local standard time. (a) Pasture; (b) Caatinga.
Figure 4.
Distribution of hourly mean albedo values in the dry season in local standard time. (a) Pasture; (b) Caatinga.

Figure 5.
Distribution of hourly mean albedo values in the rainy season in local standard time. (a) Pasture; (b) Caatinga.
Figure 5.
Distribution of hourly mean albedo values in the rainy season in local standard time. (a) Pasture; (b) Caatinga.


Table 1.
Average of daily albedo values for Caatinga and Pasture.
| Period | Caatinga | Pasture | Difference | (p-Value) |
|---|---|---|---|---|
| Dry | 0.134 ± 0.008 | 0.179 ± 0.007 | 0.045 ± 0.015 | <0.001 |
| Rainy | 0.144 ± 0.007 | 0.171 ± 0.006 | 0.027 ± 0.013 | <0.001 |
| Total | 0.138 ± 0.01 | 0.174 ± 0.007 | 0.036 ± 0.016 | <0.001 |
Table 2.
Average of the relative elevation of the sun in the Caatinga and Pasture.
| Period | Caatinga | Pasture | Difference | (p-Value) |
|---|---|---|---|---|
| Total | 49.16° ± 3.22° | 45.89° ± 3.72° | 2.58° ± 6.94° | <0.001 |
| Dry | 49.86° ± 2.68° | 49.75° ± 1.24° | 0.11° ± 3.92° | 0.7517 |
| Rainy | 48.44° ± 3.74° | 43.68° ± 2.76° | 4.72° ± 6.5° | <0.001 |
| Difference | 1.42° ± 6.42° | 6.07° ± 4.0° | ||
| (p-Value) | 0.00084 | <0.001 |
Table 3.
Hourly mean values of the sun’s apparent elevation angles in the dry and wet seasons at the two experimental sites.
Table 3.
Hourly mean values of the sun’s apparent elevation angles in the dry and wet seasons at the two experimental sites.
| Time Local | Dry Season | Rainy Season | ||
|---|---|---|---|---|
| Pasture | Caatinga | Pasture | Caatinga | |
| 06:30 | 20.51 ± 1.48 | 16.88 ± 3.27 | 13.68 ± 1.37 | 13.17 ± 0.42 |
| 07:00 | 27.55 ± 1.62 | 24.14 ± 3.30 | 20.9 ± 1.55 | 20.39 ± 0.54 |
| 07:30 | 34.56 ± 1.77 | 31.38 ± 3.36 | 27.72 ± 1.77 | 27.57 ± 0.73 |
| 08:00 | 41.53 ± 1.94 | 38.59 ± 3.47 | 34.42 ± 2.03 | 34.71 ± 0.99 |
| 08:30 | 48.41 ± 2.14 | 45.74 ± 3.62 | 40.92 ± 2.34 | 41.77 ± 1.34 |
| 09:00 | 55.17 ± 2.38 | 52.81 ± 3.85 | 47.16 ± 2.73 | 48.71 ± 1.81 |
| 09:30 | 61.69 ± 2.69 | 59.72 ± 4.18 | 52.99 ± 3.22 | 55.47 ± 2.44 |
| 10:00 | 67.74 ± 3.11 | 66.38 ± 4.66 | 58.19 ± 3.82 | 61.93 ± 3.32 |
| 10:30 | 72.85 ± 3.64 | 72.50 ± 5.4 | 62.40 ± 4.51 | 67.89 ± 4.57 |
| 11:00 | 75.87 ± 3.93 | 77.36 ± 6.42 | 65.10 ± 5.13 | 72.94 ± 6.33 |
| 11:30 | 75.17 ± 3.02 | 78.16 ± 6.02 | 65.67 ± 5.28 | 76.18 ± 8.47 |
| 12:00 | 71.40 ± 1.8 | 74.33 ± 4.04 | 63.93 ± 4.77 | 74.71 ± 8.42 |
| 12:30 | 66.04 ± 1.01 | 68.78 ± 2.65 | 60.37 ± 4.01 | 69.83 ± 7.07 |
| 13:00 | 59.88 ± 0.68 | 62.44 ± 1.77 | 55.60 ± 3.31 | 63.85 ± 5.99 |
| 13:30 | 53.33 ± 0.69 | 50.04 ± 2.74 | ||
| 14:00 | 48.75 ± 0.9 | 50.57 ± 4.63 | ||
| 14:30 | 41.67 ± 0.71 | 43.61 ± 4.2 | ||
| 15:00 | 32.69 ± 1.16 | 34.51 ± 0.63 | 30.99 ± 1.65 | 35.04 ± 3.87 |
| 15:30 | 25.68 ± 1.31 | 27.30 ± 0.61 | 24.23 ± 1.42 | 29.40 ± 3.62 |
| 16:00 | 18.65 ± 1.44 | 20.06 ± 0.62 | 17.35 ± 1.24 | 22.2 ± 3.41 |
Table 4.
Correlation between the median values of the hourly averages of albedo and the hourly averages of solar elevation in Pasture and Caatinga.
Table 4.
Correlation between the median values of the hourly averages of albedo and the hourly averages of solar elevation in Pasture and Caatinga.
| Pasture | Caatinga | |||
|---|---|---|---|---|
| Dry Season | Rainy Season | Dry Season | Rainy Season | |
| Correlation | −0.84 | −0.86 | −0.59 | −0.82 |
| p-Value | <0.001 | <0.001 | 0.00756 | <0.001 |
Publisher’s Note: MDPI stays neutral with regard to jurisdictional claims in published maps and institutional affiliations. |
© 2021 by the authors. Licensee MDPI, Basel, Switzerland. This article is an open access article distributed under the terms and conditions of the Creative Commons Attribution (CC BY) license (https://creativecommons.org/licenses/by/4.0/).
Share and Cite
MDPI and ACS Style
Souza, A.M.; Santos e Silva, C.M.; Bezerra, B.G. Caatinga Albedo Preserved and Replaced by Pasture in Northeast Brazil. Atmosphere 2021, 12, 1622. https://0-doi-org.brum.beds.ac.uk/10.3390/atmos12121622
AMA Style
Souza AM, Santos e Silva CM, Bezerra BG. Caatinga Albedo Preserved and Replaced by Pasture in Northeast Brazil. Atmosphere. 2021; 12(12):1622. https://0-doi-org.brum.beds.ac.uk/10.3390/atmos12121622
Chicago/Turabian StyleSouza, Alcindo Mariano, Cláudio Moisés Santos e Silva, and Bergson Guedes Bezerra. 2021. "Caatinga Albedo Preserved and Replaced by Pasture in Northeast Brazil" Atmosphere 12, no. 12: 1622. https://0-doi-org.brum.beds.ac.uk/10.3390/atmos12121622
Note that from the first issue of 2016, this journal uses article numbers instead of page numbers. See further details here.