Article

Astroclimatic Conditions at the Hoa Lac and Nha Trang Astronomical Observatories

by
Artem Y. Shikhovtsev
1,2,*,
Pavel G. Kovadlo
1,
Evgeniy A. Kopylov
2,
Mansur A. Ibrahimov
2 and
Huy Le Xuan
3
1
Institute of Solar-Terrestrial Physics SB RAS, 664033 Irkutsk, Russia
2
Institute of Astronomy, Russian Academy of Sciences, 119017 Moscow, Russia
3
Vietnam National Space Center VAST, 18 Hoang Quoc Viet, Cau Giay District, Hanoi 11307, Vietnam
*
Author to whom correspondence should be addressed.
Submission received: 3 November 2021 / Revised: 8 December 2021 / Accepted: 10 December 2021 / Published: 15 December 2021

Abstract

:
The paper presents the first results of astroclimatic studies at the sites of the Hoa Lac and Nha Trang astronomical observatories. Our study employs Era-5 data covering a 10-yr time period (2011–2020). An analysis of the main astroclimatic characteristic, namely, the wind speed in the upper layers of the atmosphere, was performed. We calculated space distributions of the wind speed averaged in the height bin from 100 to 200 hPa. Using hourly data on pressure levels we analyzed probability distributions of the wind speed at high-level maxima at the sites of the observatories. At the Nha Trang observatory the period with a potentially high astroclimatic conditions falls on the spring when high recurrence of weak winds is observed. At the Hoa Lac observatory the best conditions are observed in the summer and the autumn. In this period, the median wind speeds are low. Additionally, we calculated spectra of the air temperature using the Fast Fourier Transform. We analyzed the deformations of the spectra with heights in a wide range of scales. At the site of the Nha Trang Astronomical Observatory, the amplitude of daily air temperature variations in the surface layer is approximately 1.5–2.5 times smaller compared to the Hoa Lac Observatory. We showed that the low-frequency maximum in the spectra is pronounced only in the lower layers of the atmosphere.

1. Introduction

One of the momentous problems in atmospheric physics is the parameterization of turbulent parameters, including kinetic turbulent energy E k and potential turbulent energy E t , as well as the structure constants of wind speed fluctuations C V 2 , air temperature fluctuations C T 2 , and air refractive index fluctuations C n 2 [1,2].
Knowledge of the vertical profiles of wind speed within the free atmosphere, as well as wind speed and direction in the atmospheric boundary layer is critical for both qualitative and numerical models of optical turbulence describing the variations in Fried length, seeing, isoplanatic angle, coherence time, and the outer scale of turbulence [3,4]. Considerable attention is paid to the study of characteristics of the wind speed field, for example, in papers [5,6,7]. Models proposed for estimating optical turbulence parameters are based on the vertical gradients of wind speed or a parameterization of turbulent parameters through the dissipation velocity of temperature fluctuations and wind speed fluctuations [8].
It should be noted that a lot of astronomical observatories have no time series of turbulent parameters or have time-limited datasets. The practice of applying reanalysis data in studies of astroclimate in the world is widespread. For example, astroclimatic parameters by means of reanalysis are defined for the Canary Islands observatories, Oukaimeden observatory, and other sites [9,10].
One of the atmospheric parameters, which describes the astroclimatic conditions at the site of an observatory or at a given site with potentially high image quality, is wind speed at the 200 hPa level V 200 (at heights of about 12 km) [10,11,12,13]. Usually, V 200 is related to effective turbulent velocity V 0 by the formula [14,15]:
V 0 = k V 200 ,
where k is the proportionality coefficient, and V 200 is the wind speed at the 200 hPa level. The quantity of V 0 is related to the vertical profile of the optical turbulence strength:
V 0 5 / 3 = 0 H V ( z ) 5 / 3 C n 2 ( z ) d z 0 H C n 2 ( z ) d z ,
where z is the height of the layer in the atmosphere, V is the wind speed, and C n 2 is the structure constant of the air refractive index fluctuations.
However, the approach based on the usage of V 200 for estimating the parameters of atmospheric turbulence, may be applied only partially, as it characterizes the structure of the air flows in the upper layers of the atmosphere. Atmospheric turbulence in a micro-meteorological spectral range evolves under the influence of a number of factors, including convective and shear instabilities. We believe that the energy of micro-meteorological turbulence may be calculated on the basis of the energy of different ranges in the turbulence spectrum. We described the method for estimating averaged parameters of turbulence by calculating the energy of baroclinic instability [16,17].
Today, Russia and Vietnam are cooperating bilaterally within a project for the development of a Russian ground-based network of optical telescopes. Within this project the first astroclimatic studies, aimed at estimating atmospheric parameters over Vietnam, have been performed. In long-term studies of the astroclimate, we plan to use ground-based instruments based on the Shack-Hartmann wavefront sensor, as well as available data from space sensing of the Earth. Both assessments are planned to be implemented at two Vietnam observatories, namely, the Hoa Lac observatory situated near Hanoi and Nha Trang observatory near Hon Chong. Nha Trang and Hoa Lac astronomical observatories are located in the subtropical belt near sea level. Both observatories belong to the Vietnam National Space Center and are equipped with modern 50 cm Ritchie-Chrétien telescopes [18].
In the study, we consider astroclimatic conditions at the sites of the Hoa Lac and Nha Trang observatories. For these observatories we estimated the statistics of wind speed in the upper atmospheric layer. In order to characterize the structure of the air flows we also calculated and analyzed the energy spectra of the turbulence in a wide range of scales at different heights. We used Era-5 reanalysis data with higher temporal and spatial resolution [19]. Era-5 datasets are verified and used in a number of studies [20,21,22].

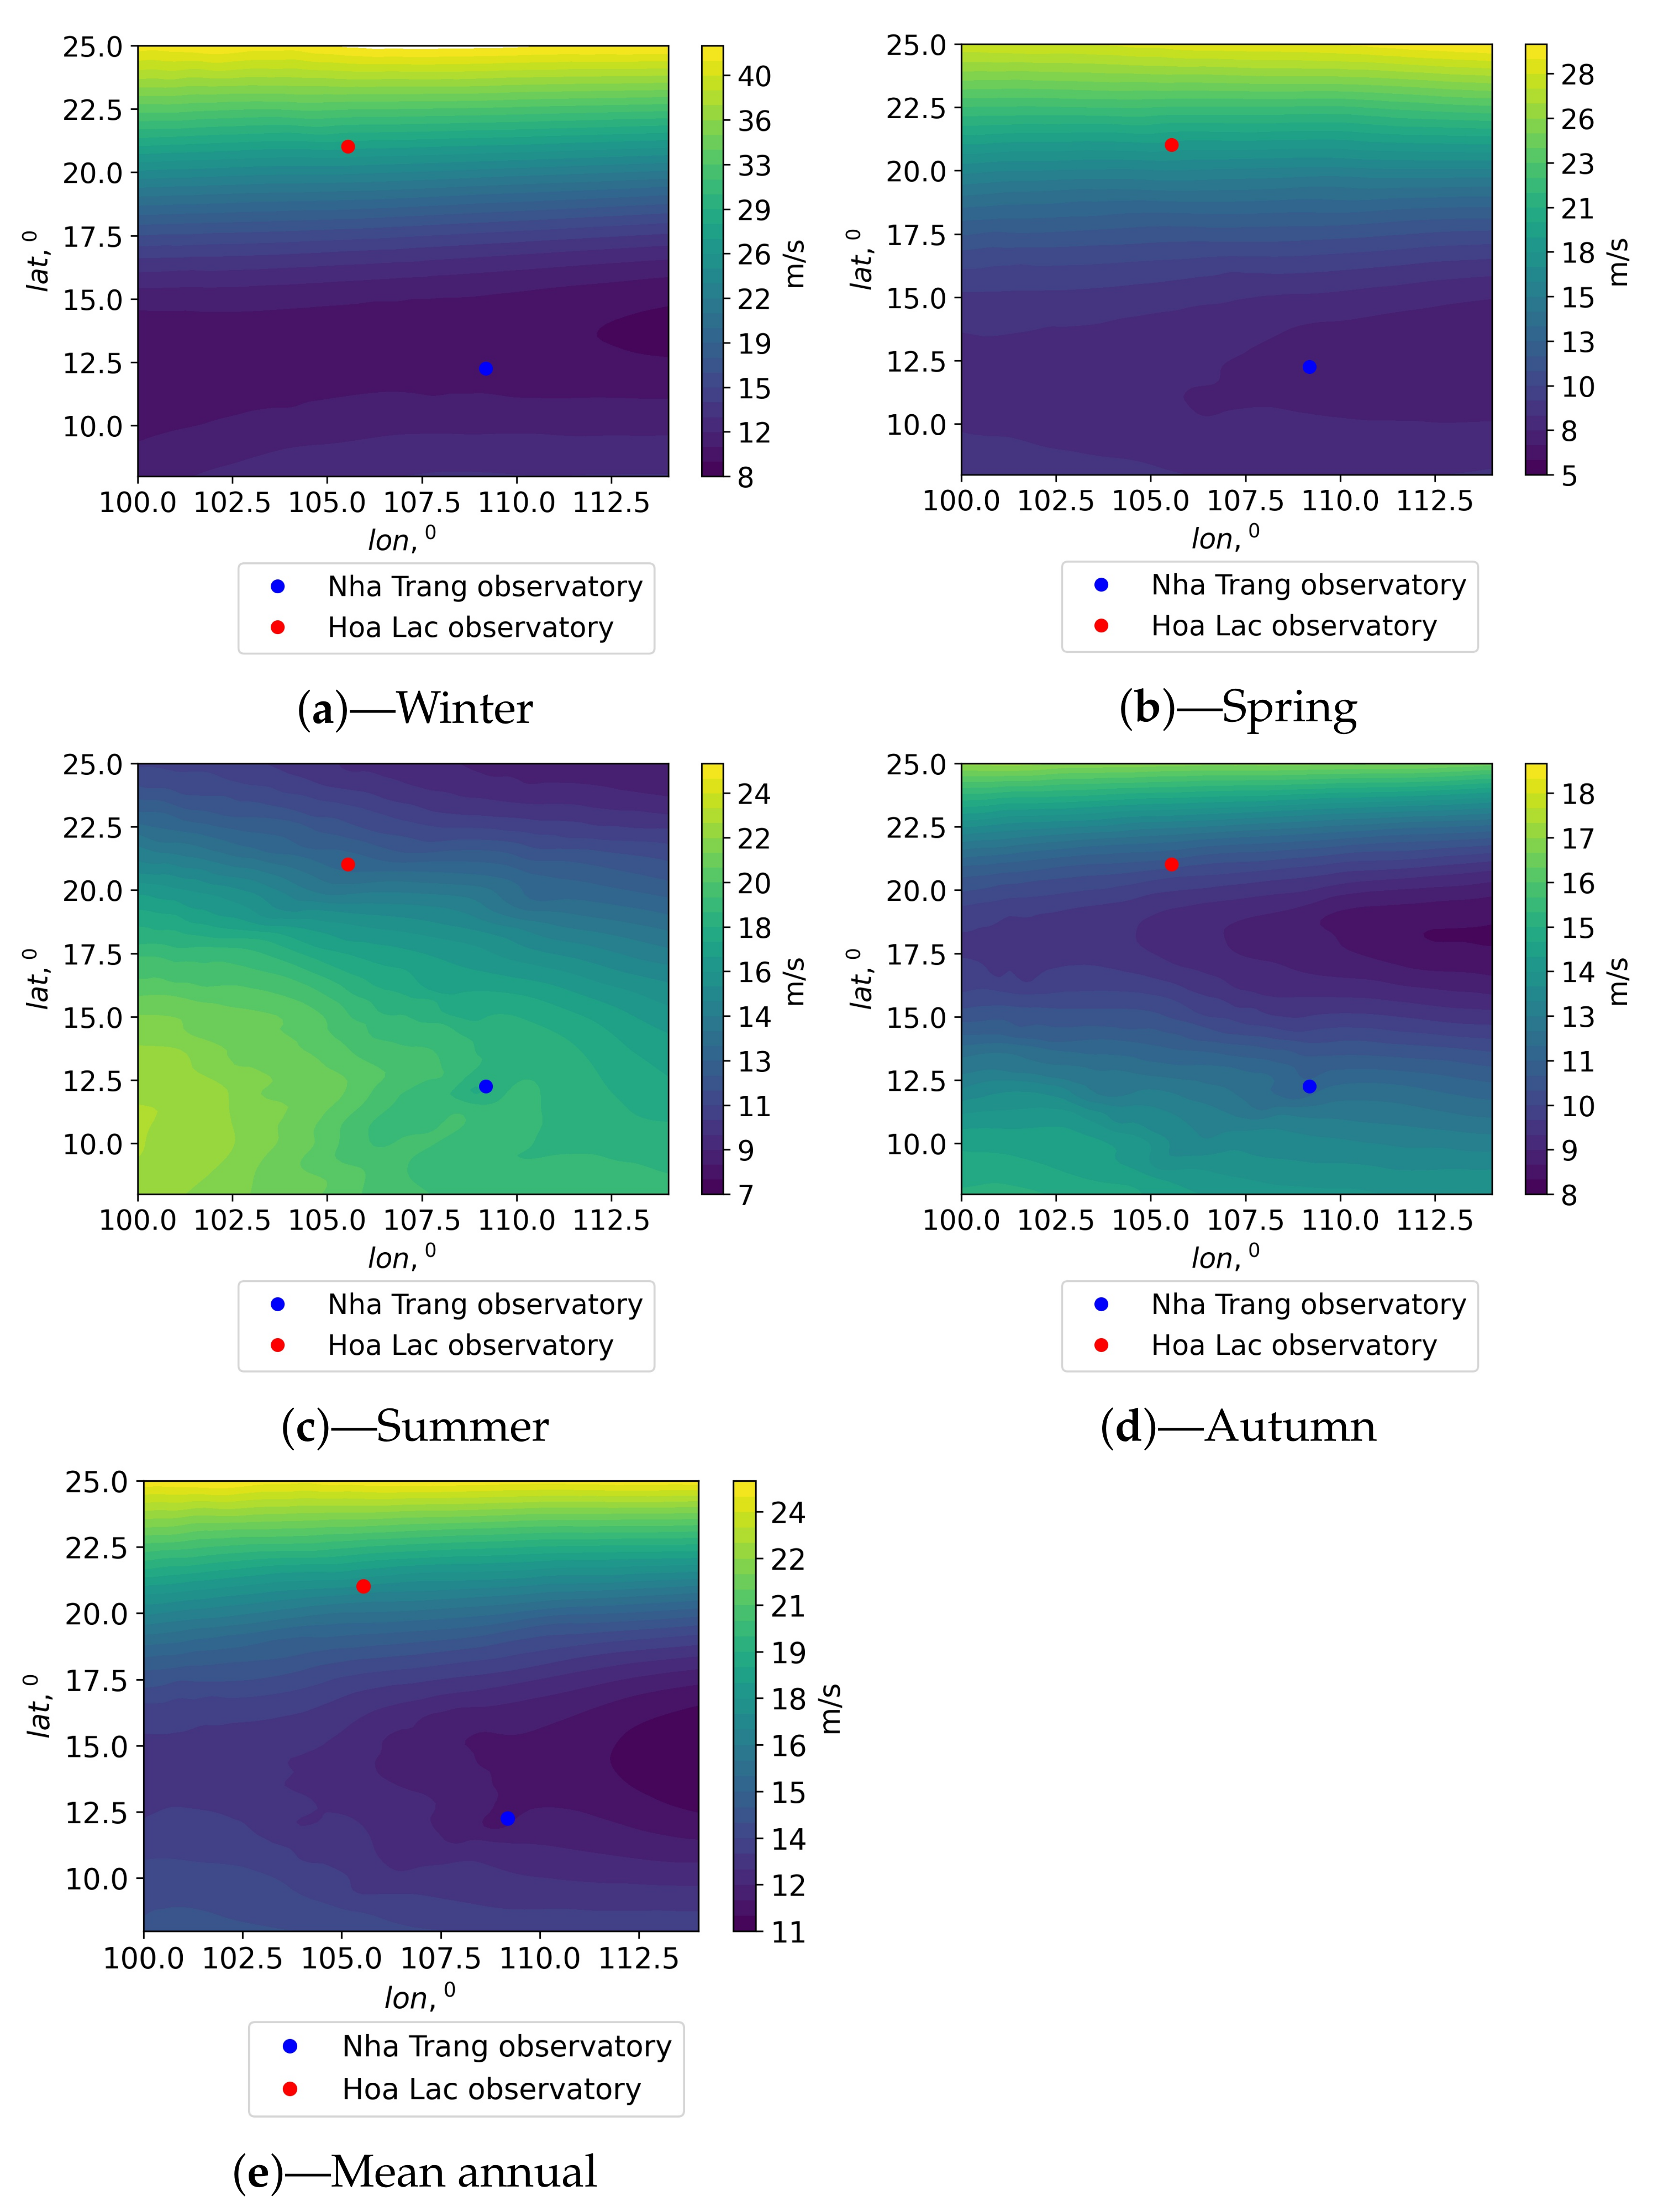
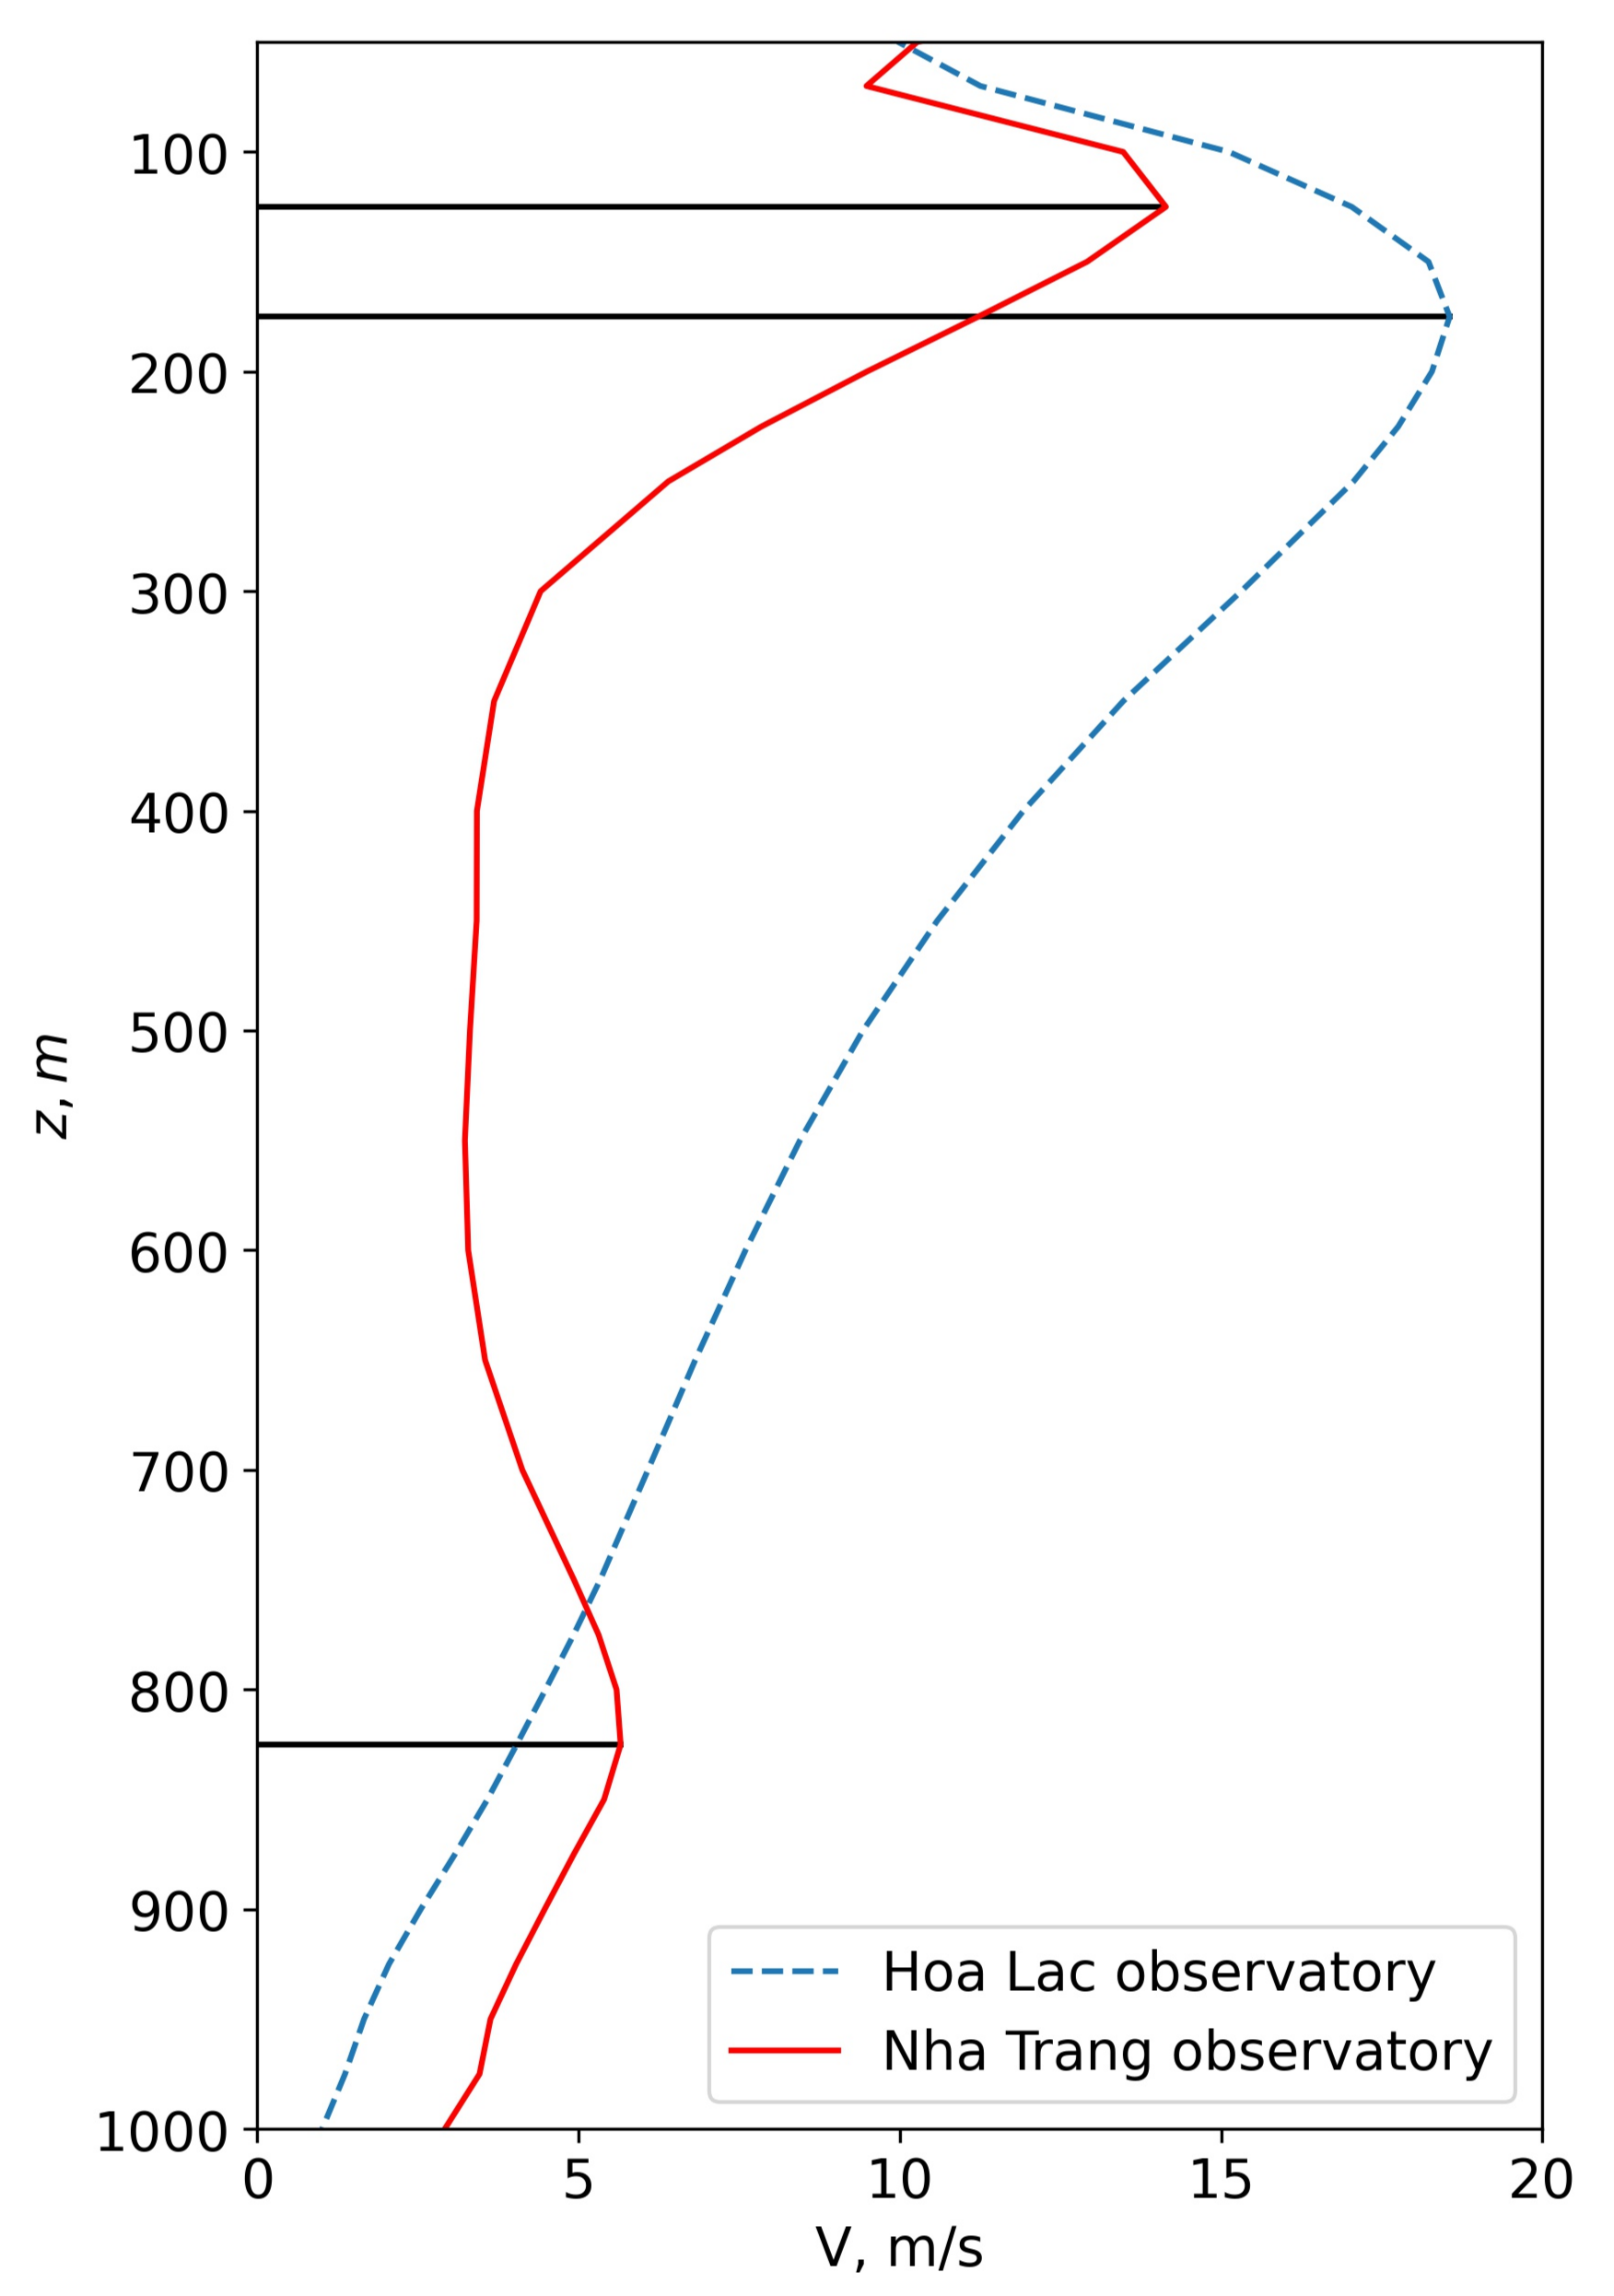
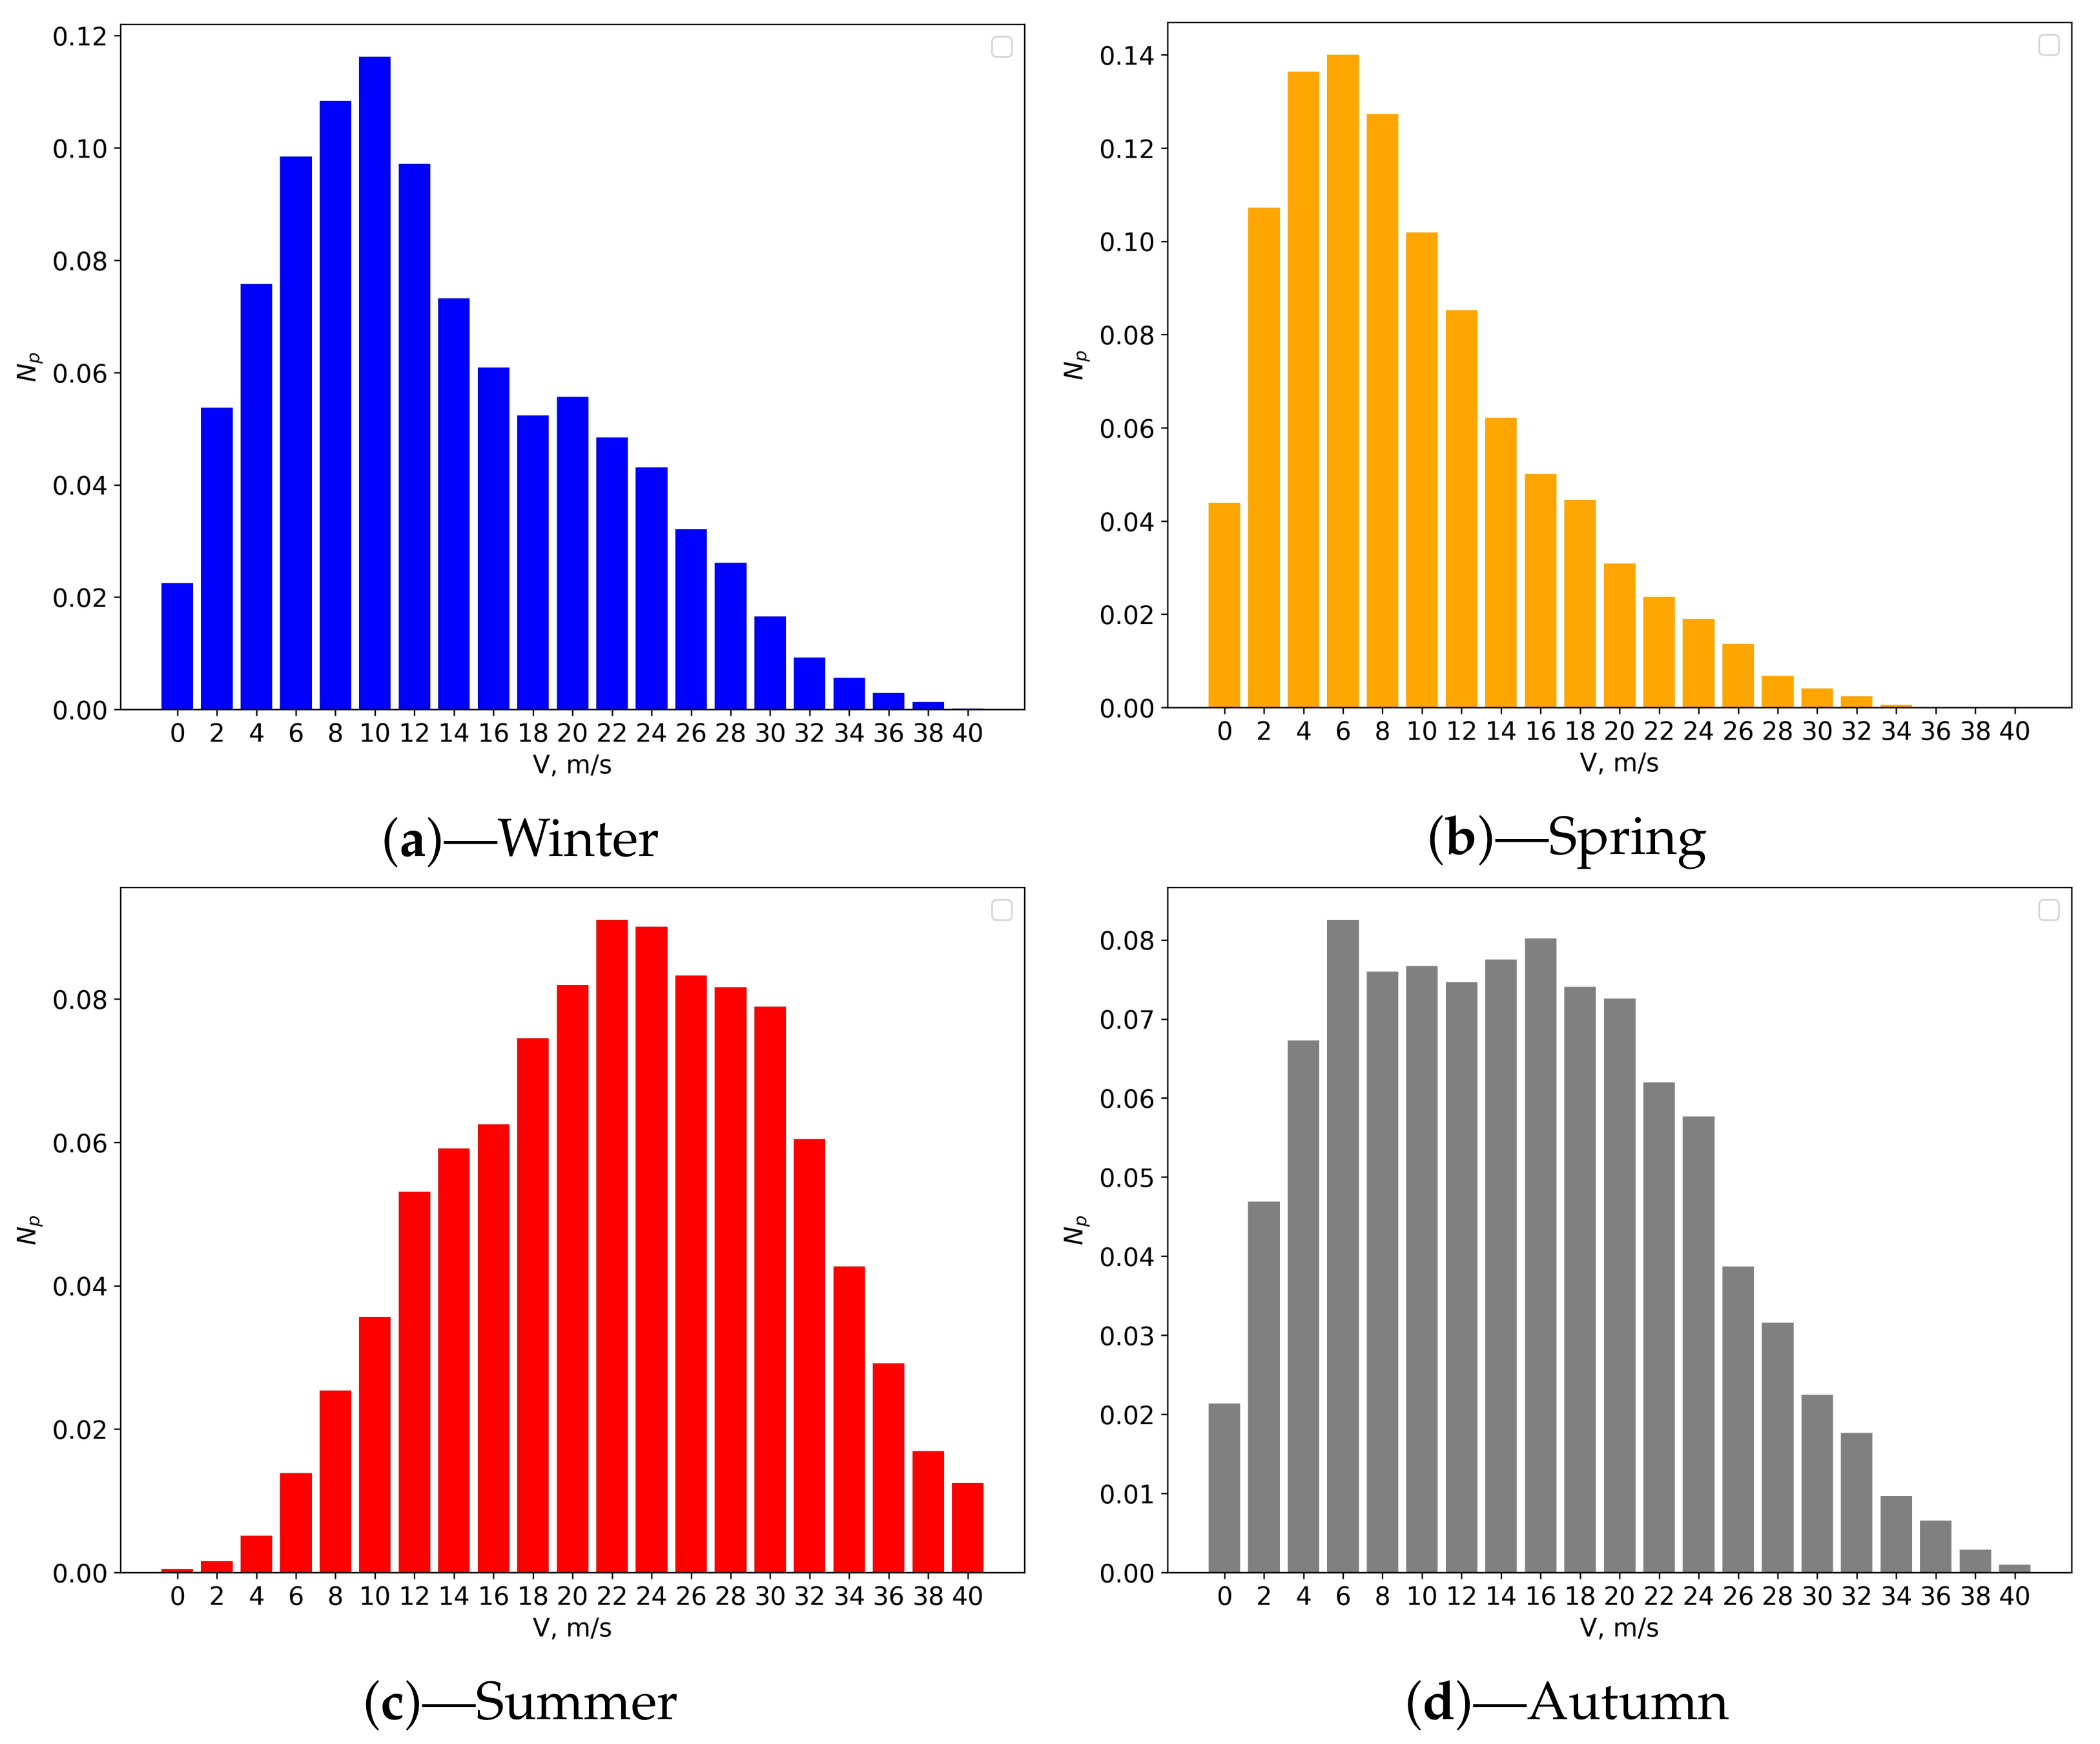
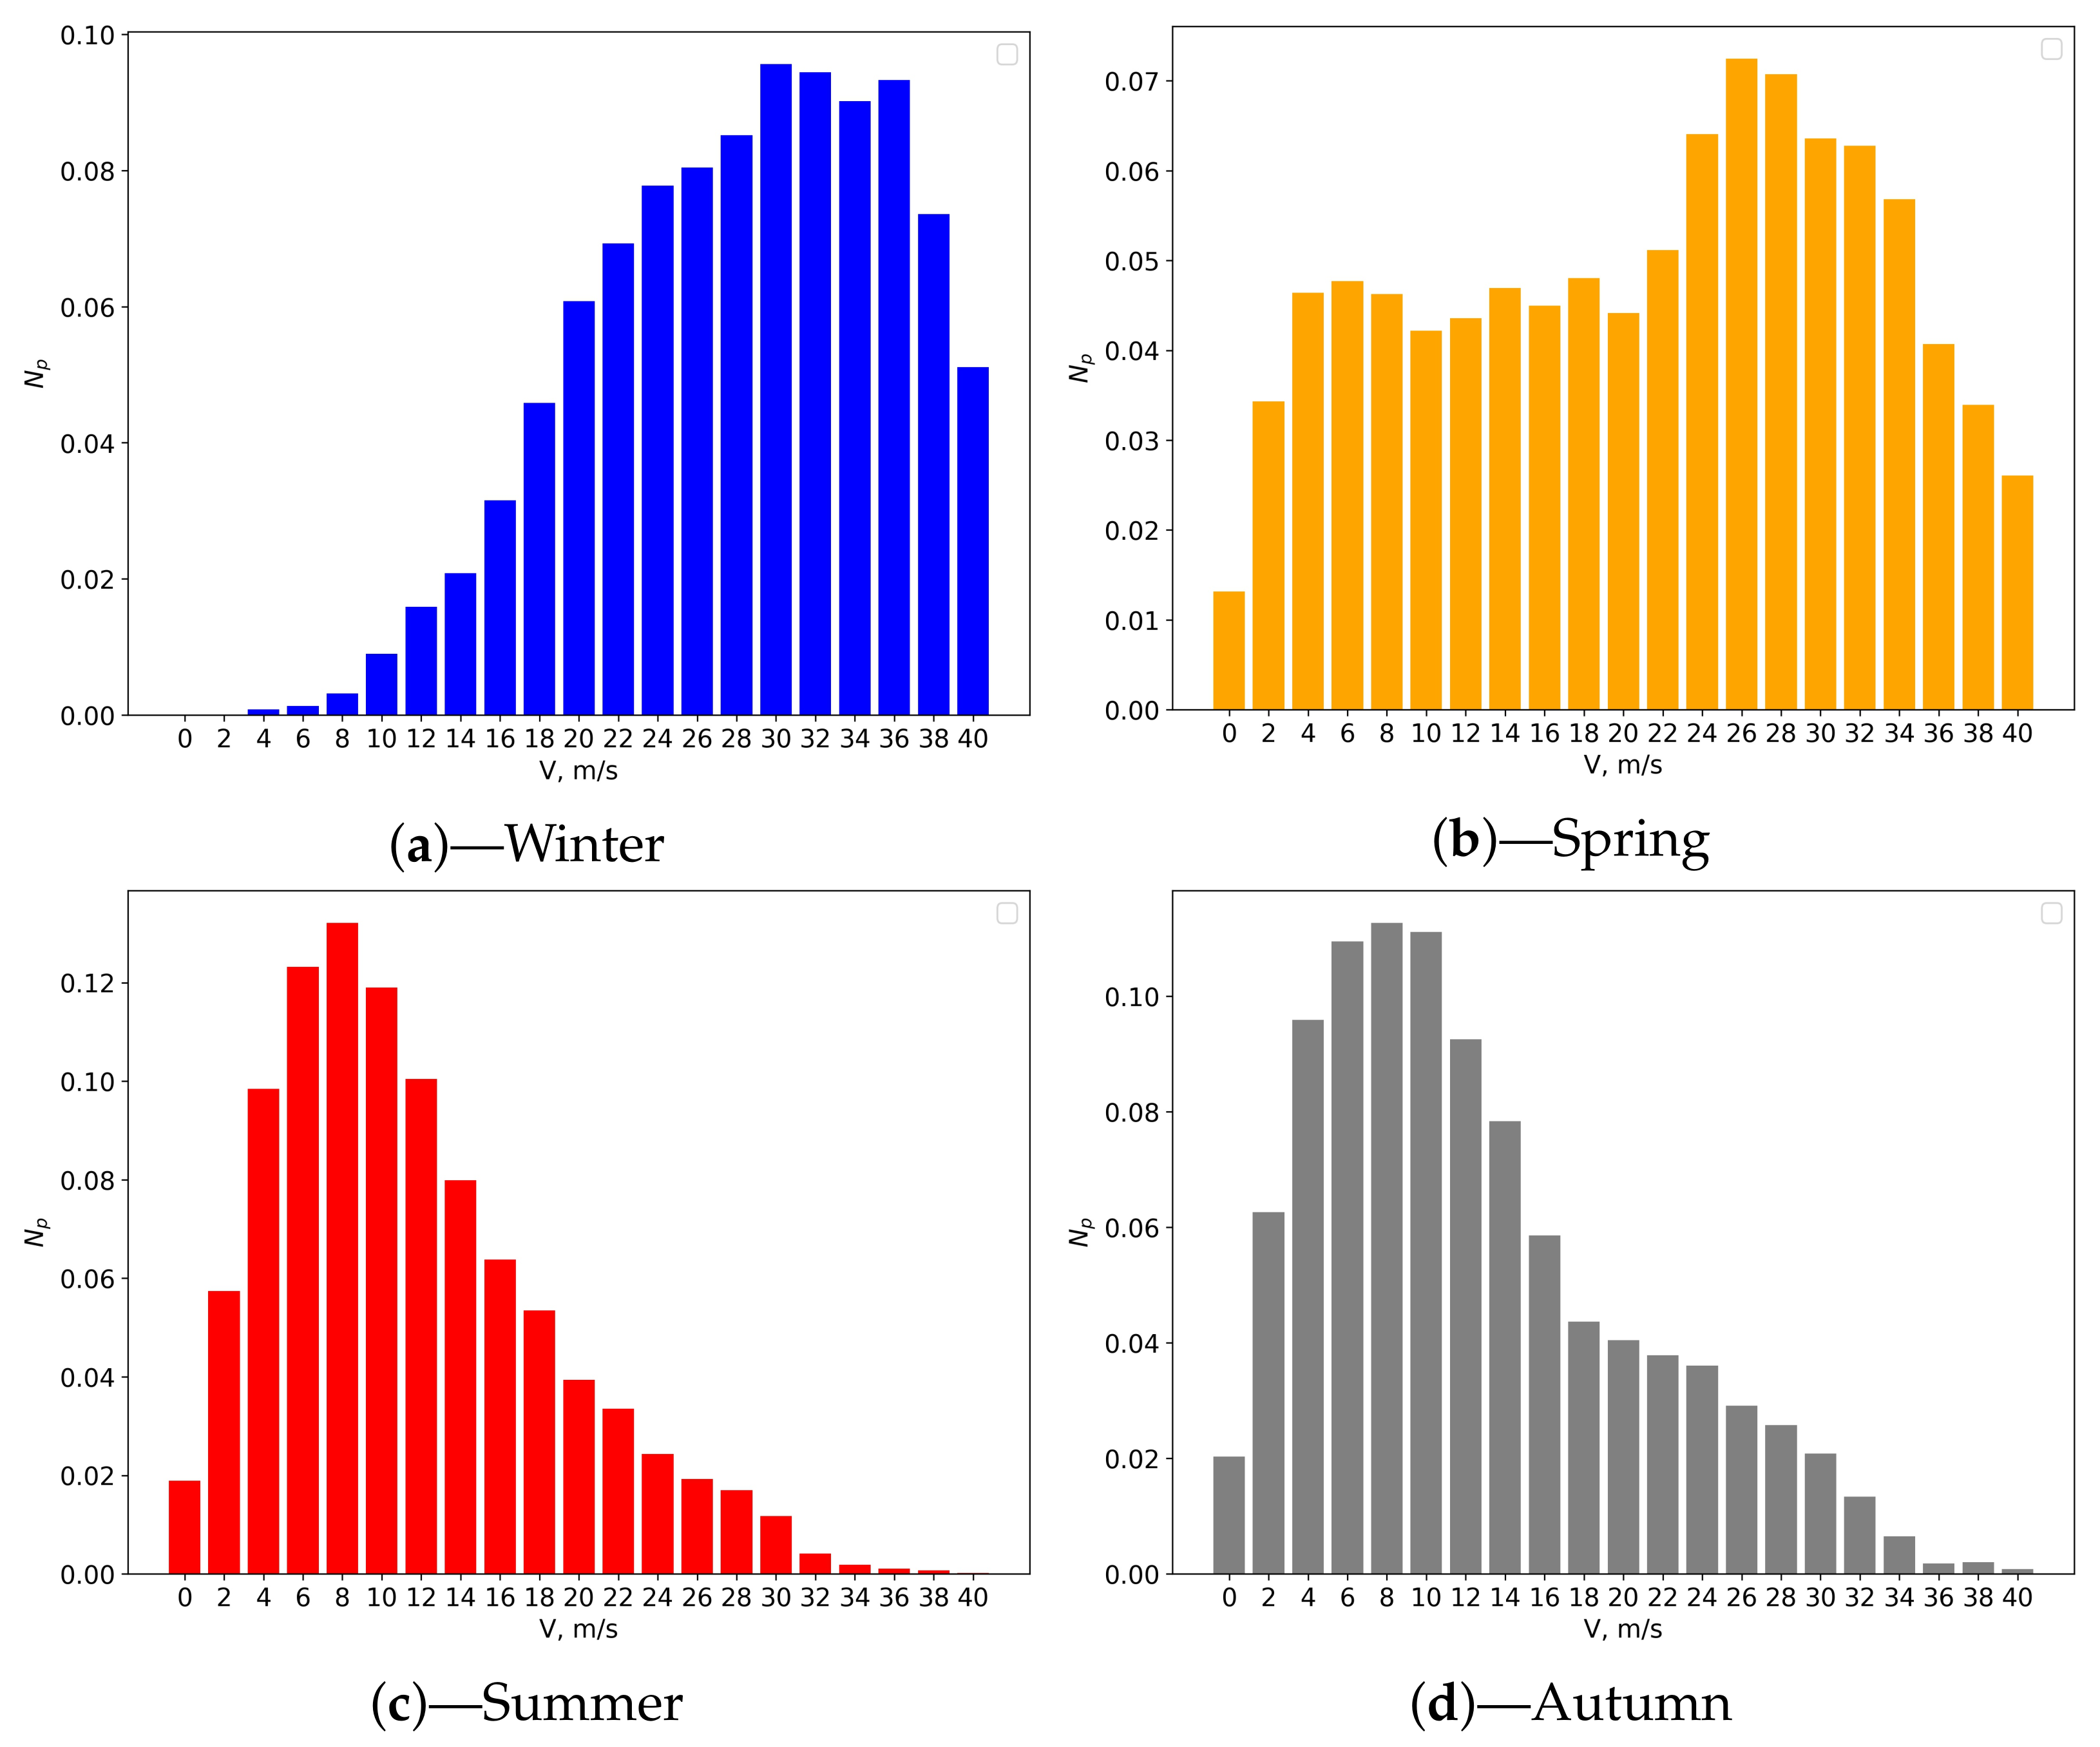
2. Wind Speed Statistics in the Upper Atmospheric Layer

The 200 hPa pressure level corresponds to the height of large-scale jet streams. We expect that the intensity of turbulence is higher near jet streams. Vertical gradients in wind speed induce increased mixing processes in the stratified atmosphere and growth of turbulence energy.
Using Era-5 reanalysis data for the period from 2011 to 2020 we calculated space distributions of the wind speed averaged in the height bin from 100 to 200 hPa. Figure 1a–e show space distributions of the wind speed averaged for heights from 100 to 200 hPa in the region of the Nha Trang observatory and the Hoa Lac observatory. We selected this height bin as it covers the central parts of the peaks in the wind speed profiles.
Analysis of the distributions shows that wind speeds in the upper layers of the atmosphere have significant seasonal variations. As shown in Figure 1a,b, the Hoa Lac observatory is located near a large-scale jet stream in the winter and in spring. In the autumn, the jet stream weakens and shifts slightly to the north (Figure 1d). In terms of wind speed, the best conditions at the site of the Hoa Lac observatory are observed in the summer. In this period the observatory is located in a field with low values of wind speed (Figure 1c).
The Nha Trang observatory is located in the minimum of the wind speeds in the winter and in spring. Although, values of wind speed increase in the summer and the autumn, the Era-5 reanalysis shows that a field with low wind speeds is formed above the Nha Trang observatory. This field is oriented along a line from northeast to southwest.
To determine the atmospheric parameters above the observatories (near jet streams) we estimated annual averaged vertical profiles of the wind speed shown in the Figure 2.
Maxima of the mean wind speed are observed at different heights. At the site of the Hoa Lac observatory maximum wind speed corresponds to the 175 hPa pressure level. The mean wind speed in the maximum is equal to 18.5 m/s.
The maximum wind speed at the site of the Nha Trang observatory is shifted to a higher level (the pressure is equal to 125 hPa). Within the standard atmosphere model the relative height offset of the wind speed maximum is equal to about 2.1 km. At the Nha Trang observatory site the mean wind speed is lower than the estimated value for the Hoa Lac observatory. The mean wind speed in the maximum is equal to 14.2 m/s. Additionally, a local peak associated with low level jet streams in the vertical profile of the wind speed is revealed. The mean wind speed in the local peak located at the 825 hPa level is not high and equal to 5.6 m/s. Thus, we estimated averaged heights of the maxima in the wind speed at the sites of the Nha Trang observatory and the Hoa Lac observatory.
Using hourly data on pressure levels for the period from 2011 to 2020 we calculated probability distributions of the wind speed at high-level maxima at the sites of the observatories. Figure 3a–d and Figure 4a–d show the probability distributions of the wind speed at 175 and 125 hPa levels at the sites of the Hoa Lac and Nha Trang observatories, respectively. Statistics of the distributions are given in Table 1 and Table 2.
As shown in Figure 3b, at the site of the Nha Trang observatory, the lowest median of the wind speed is observed in the spring (its value equal to 9.1 m/s). At this time the skewness coefficient is at its largest (its value reaches 0.88). In the winter and in the autumn the medians of the wind speed increase to 12.4 and 15.5 m/s, respectively. The largest median is observed in the summer (24.0 m/s). The average annual median is 14.8 m/s. It should be noted that the skewness coefficient in the summer approaches zero. The kurtosis coefficient is positive only in the spring. This indicates that the fluctuations in the hourly wind speed values are more intense in the spring in comparison to the normal distribution. In fact, in the spring, there is the largest number of cases with low values of wind speed. At the Nha Trang observatory the period with a potentially low effective turbulent velocity falls on the spring when high recurrence of weak winds is observed (skewness coefficient is equal to 0.88).
In comparison to the Nha Trang observatory, the shapes of the probability distributions of the wind speed at the Hoa Lac observatory site are different. The mean annual median of the wind speed increases and reaches 18.6 m/s. In the spring, the function of the probability distribution contains two pronounced peaks with values ranging from 6 to 8 m/s and from 26 to 28 m/s, respectively. Median value reaches 24.9 m/s. This indicates that the observatory is under the action of a jet stream. At the periphery of the jet we expect an increased strength of turbulence. The best conditions are observed in the summer and the autumn. In this period the median wind speeds are 11.1 and 11.8 m/s, respectively. At the same time, the repeatability of strong winds increases in autumn (in comparison to the summer).
Comparison of median values obtained with other astronomical sites shows that the median at the Nha Trang observatory (14.8 m/s) is lower than medians estimated for the La Silla (31.2 m/s), Paranal (28.1 m/s), or Maidanak (25.9 m/s) [9]. At the Hoa Lac observatory the median (18.6 m/s) is close to the values at the Sierra Negra (18.3 m/s), Special Astrophysical Observatory (19.8 m/s), Oukaimeden (20.3 m/s), La Palma (20.8 m/s), Mauna Kea (21.0 m/s), and higher than the median at the Costa Rica (7.7 m/s) [9,23].

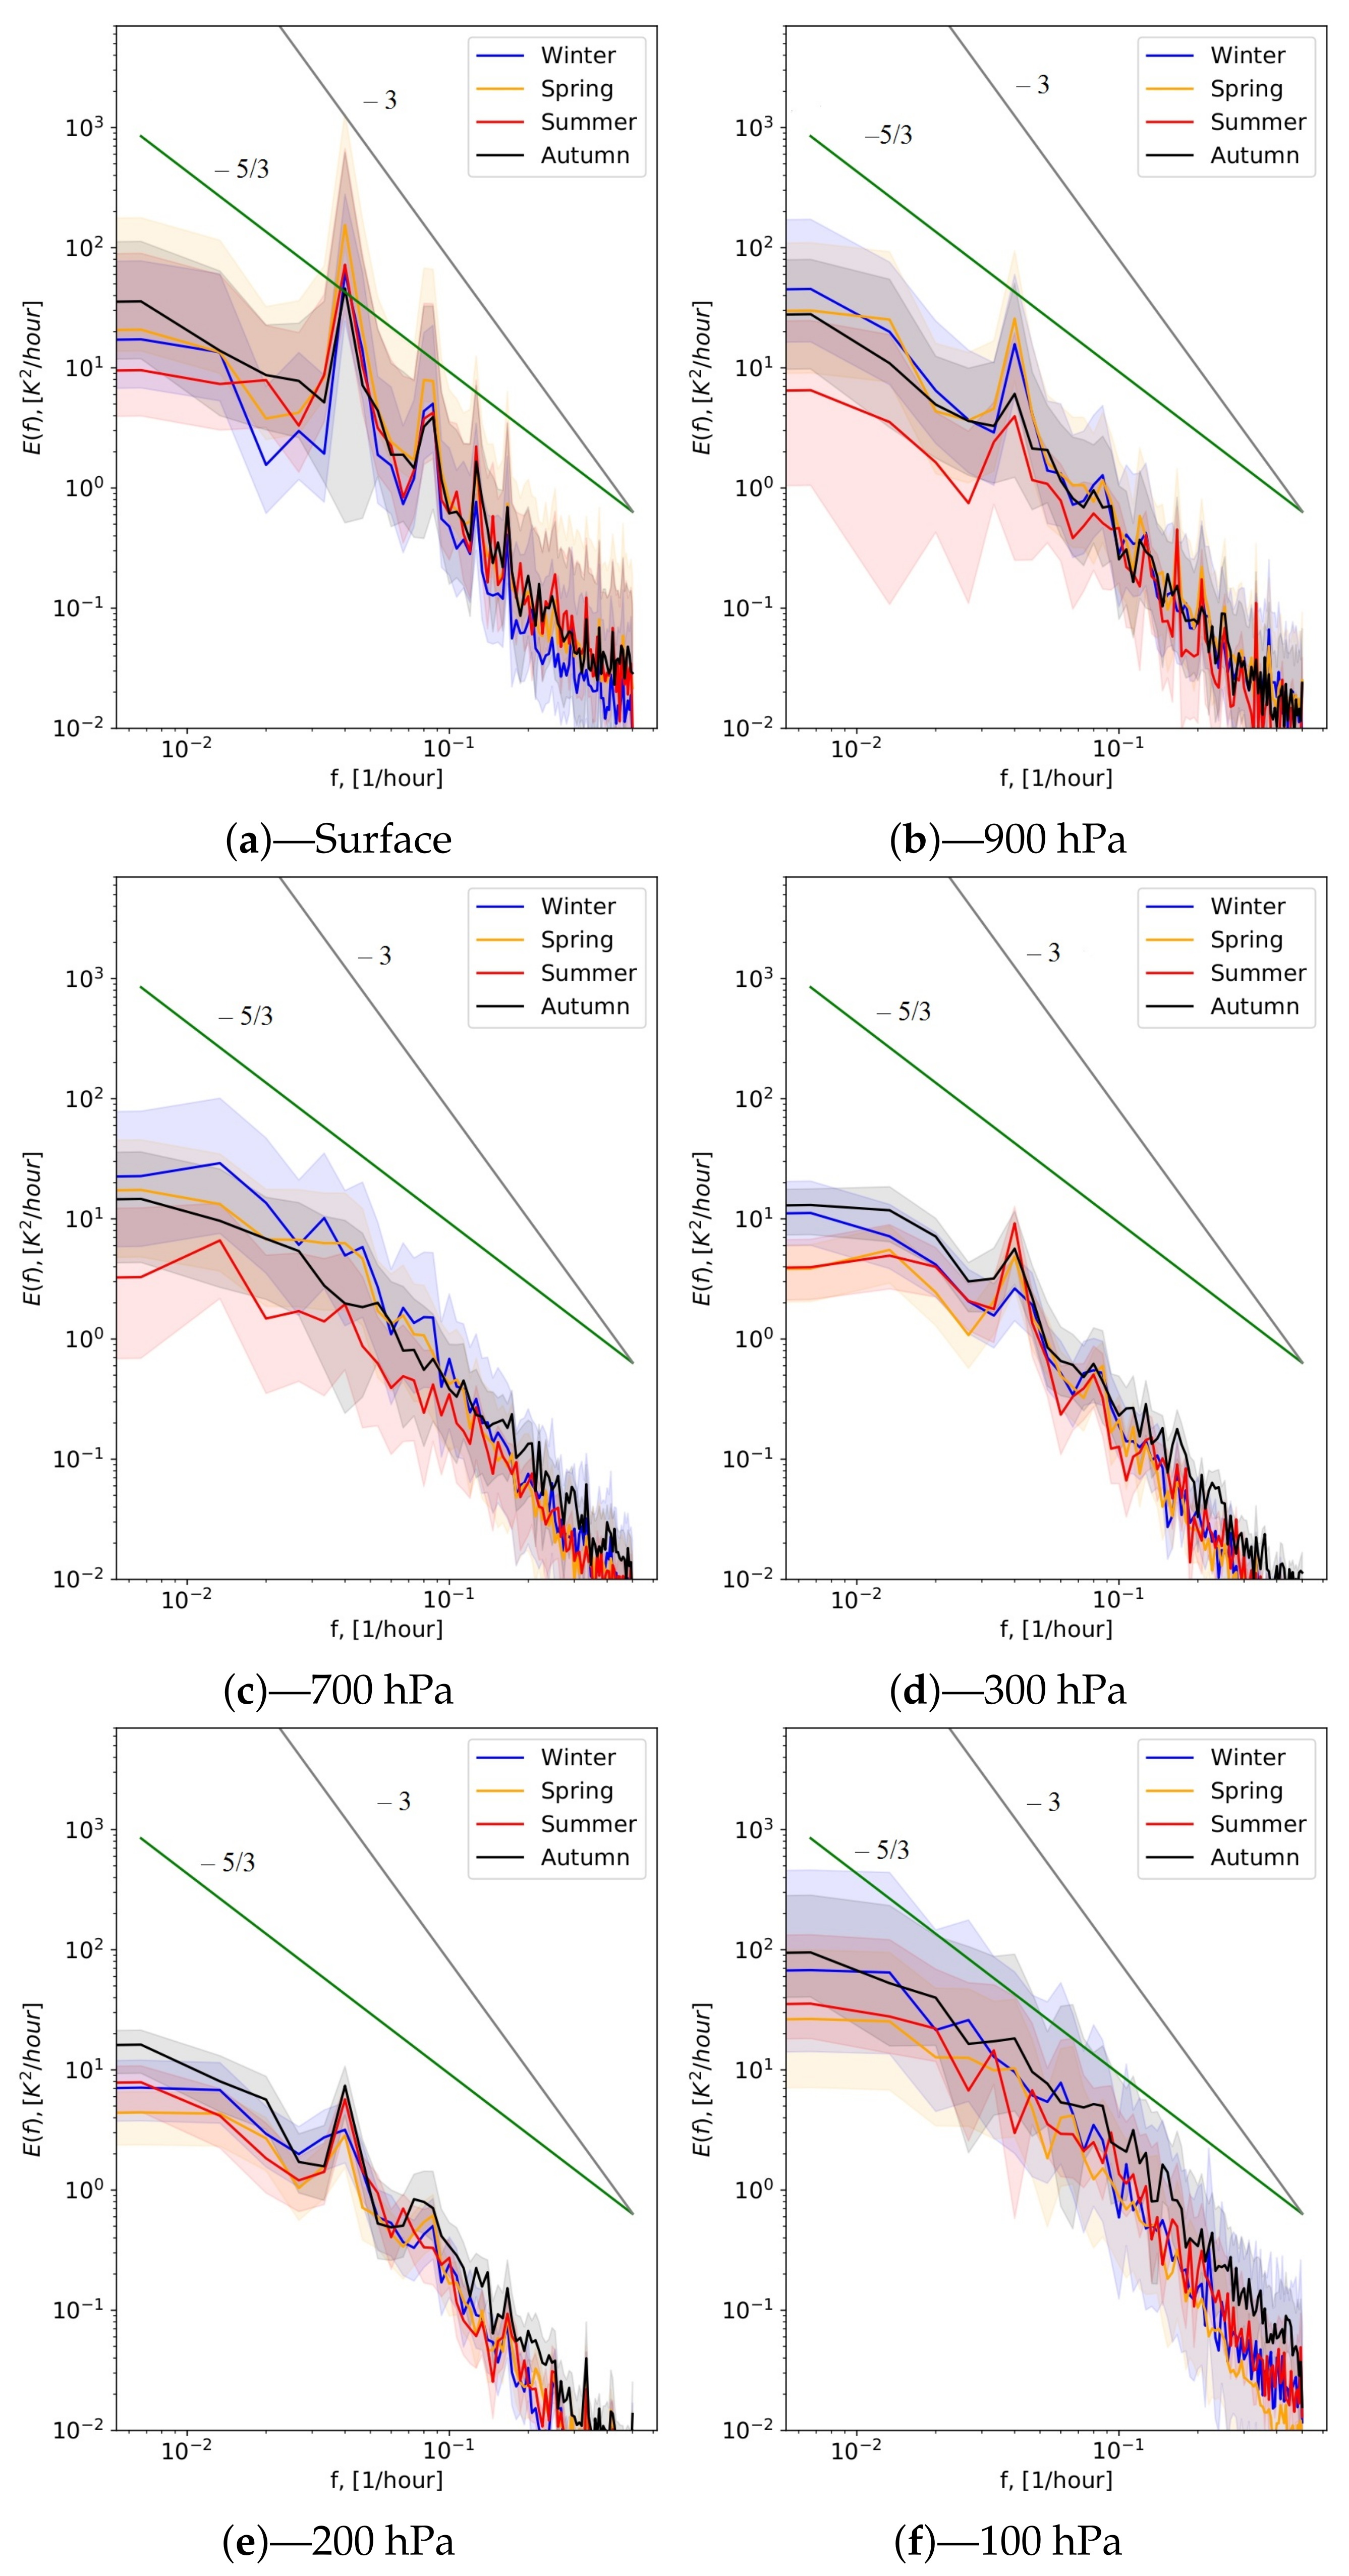
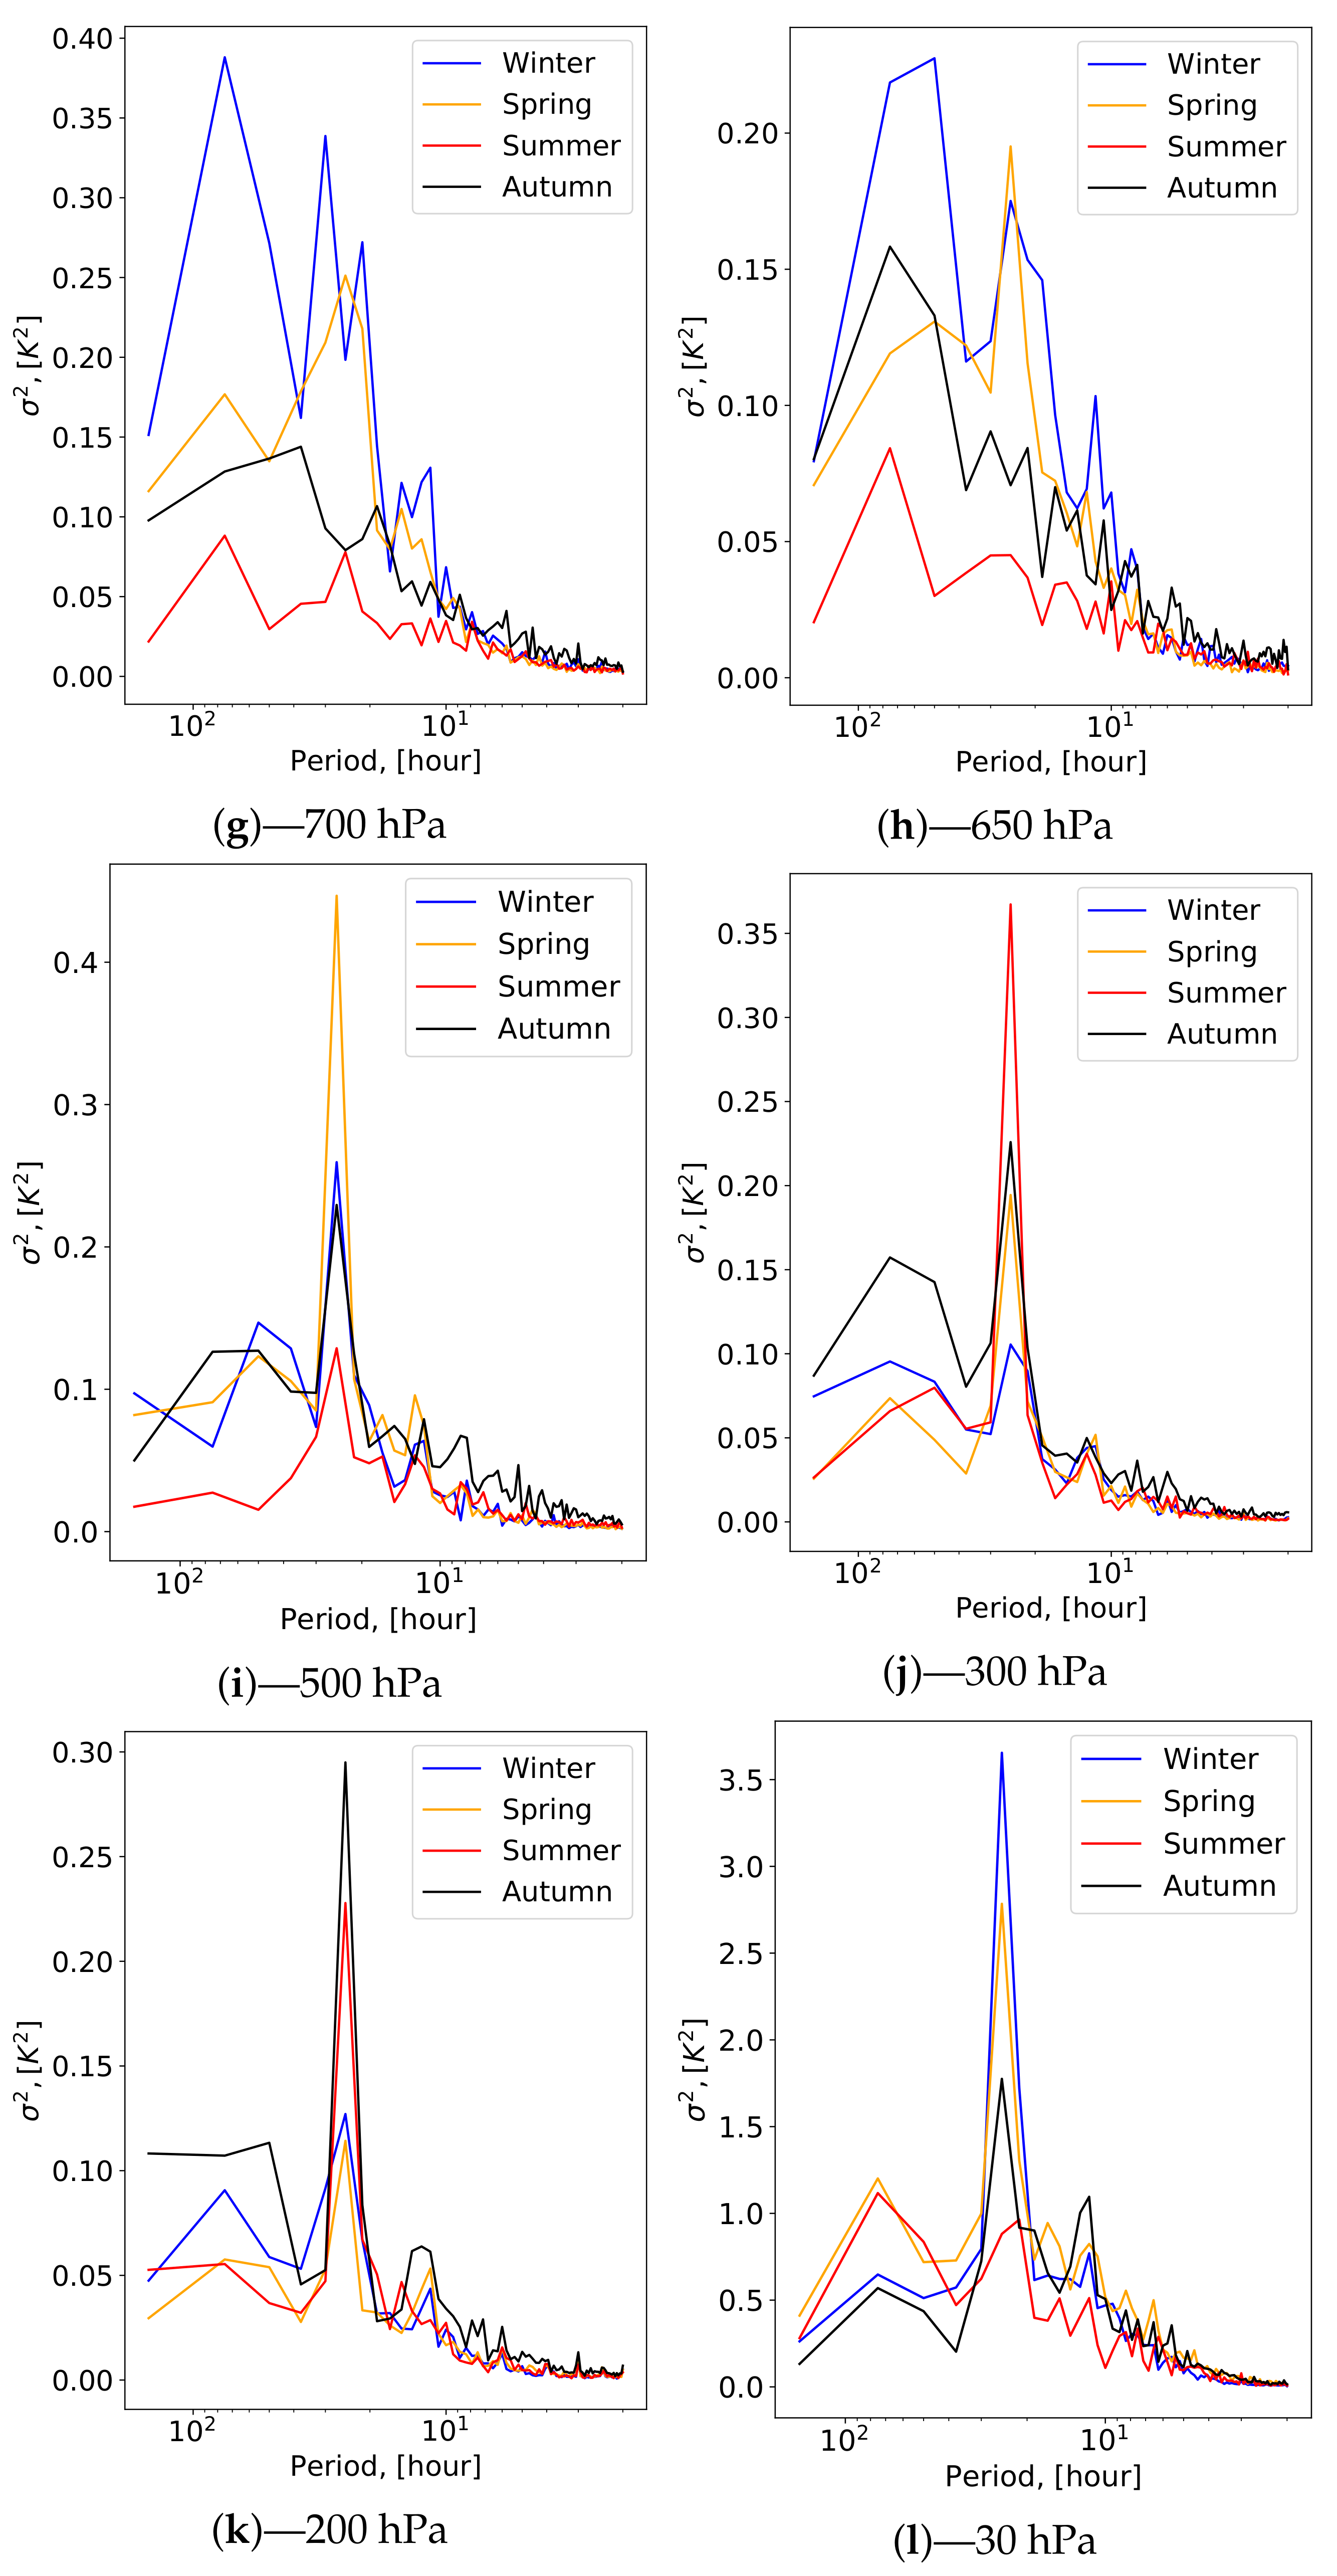
3. Energy Spectra of the Air Temperature Fluctuations at the Sites of Nha Trang and Hoa Lac Observatories

In studies of atmospheric turbulence, considerable attention is paid to energy spectra over a wide range of spatial and temporal scales [24,25,26,27,28]. The analysis of atmospheric characteristics obtained from aircraft measurements [24] shows that the energy spectra of both wind speed and air temperature obey two power-law dependencies:
(i) Power spectral densities of the air temperature fluctuations and the wind speed fluctuations in the large-scale range are proportional to f 3 ;
(ii) Power spectral densities of the air temperature fluctuations and the wind speed fluctuations at mesoscales and in the micro-meteorological range are proportional to f 5 / 3 .
We can estimate the energy of small scale turbulence knowing the energy characteristics of the fluctuations in a given spectral range (in any large scale range) [16]. We believe that the energy of the turbulence, including the range with scales of less than 10 m, depends on the power spectral density of the fluctuations and the spectral peak width in the low-frequency range. In a case with a pronounced low-frequency peak, we can expect the appearance of a spectral plateau (step) in the micrometeorological range, associated with the increased energy of micro-meteorological turbulence.
In order to reveal the features in the structure of atmospheric large-scale air flows we calculated the frequency dependencies of the power spectral density of the air temperature fluctuations using Era-5 data. Figure 5a–f and Figure 6a–f show the frequency dependencies of the power spectral density of air temperature fluctuations at different pressure levels.
At the sites of the Nha Trang and Hoa Lac observatories the frequency dependencies of power spectral density have a −5/3 slope in the lower part of the optically active atmosphere. With height the slopes of these spectra change. The spectra become steeper. The scaling index ranges from −5/3 to −3. The power law dependencies become close to f 3 in the high-frequency part at pressure levels of 100–200 hPa. In comparison with the spectra obtained for middle latitudes [24,29] with developed large-scale fluctuations, the spectra at the Nha Trang and Hoa Lac observatories differ significantly. In the low-frequency range, the atmospheric fluctuations have a rather low specific energy. We calculated the values of energy for two ranges:
(i)
from f 1 = 66.6 × 10 4 1/h to f 2 = 13.3 × 10 3 1/h;
(ii)
from f 3 = 0.36 1/h to f 4 = 0.5 1/h.
The values of the specific baroclinic energy are given in the Table 3 and Table 4. At the Nha Trang Observatory the energy of air temperature low-frequency fluctuations is comparable with the energy of the mesoscale gap.
Therefore, the baroclinic atmospheric instability energy can be neglected in the calculations of small-scale turbulence characteristics. At the Hoa Lac observatory site, this energy is higher compared to the Nha Trang observatory. We assume that the energy of low-frequency fluctuations in the lower atmosphere contributes to the energy of micro-meteorological turbulence for Hoa Lac Observatory in the winter and in the spring. In winter and spring the energy of fluctuations significantly decreases above 850 hPa level. In summer and autumn the dispersion of temperature fluctuations is usually less than 1 ( ) 2 .

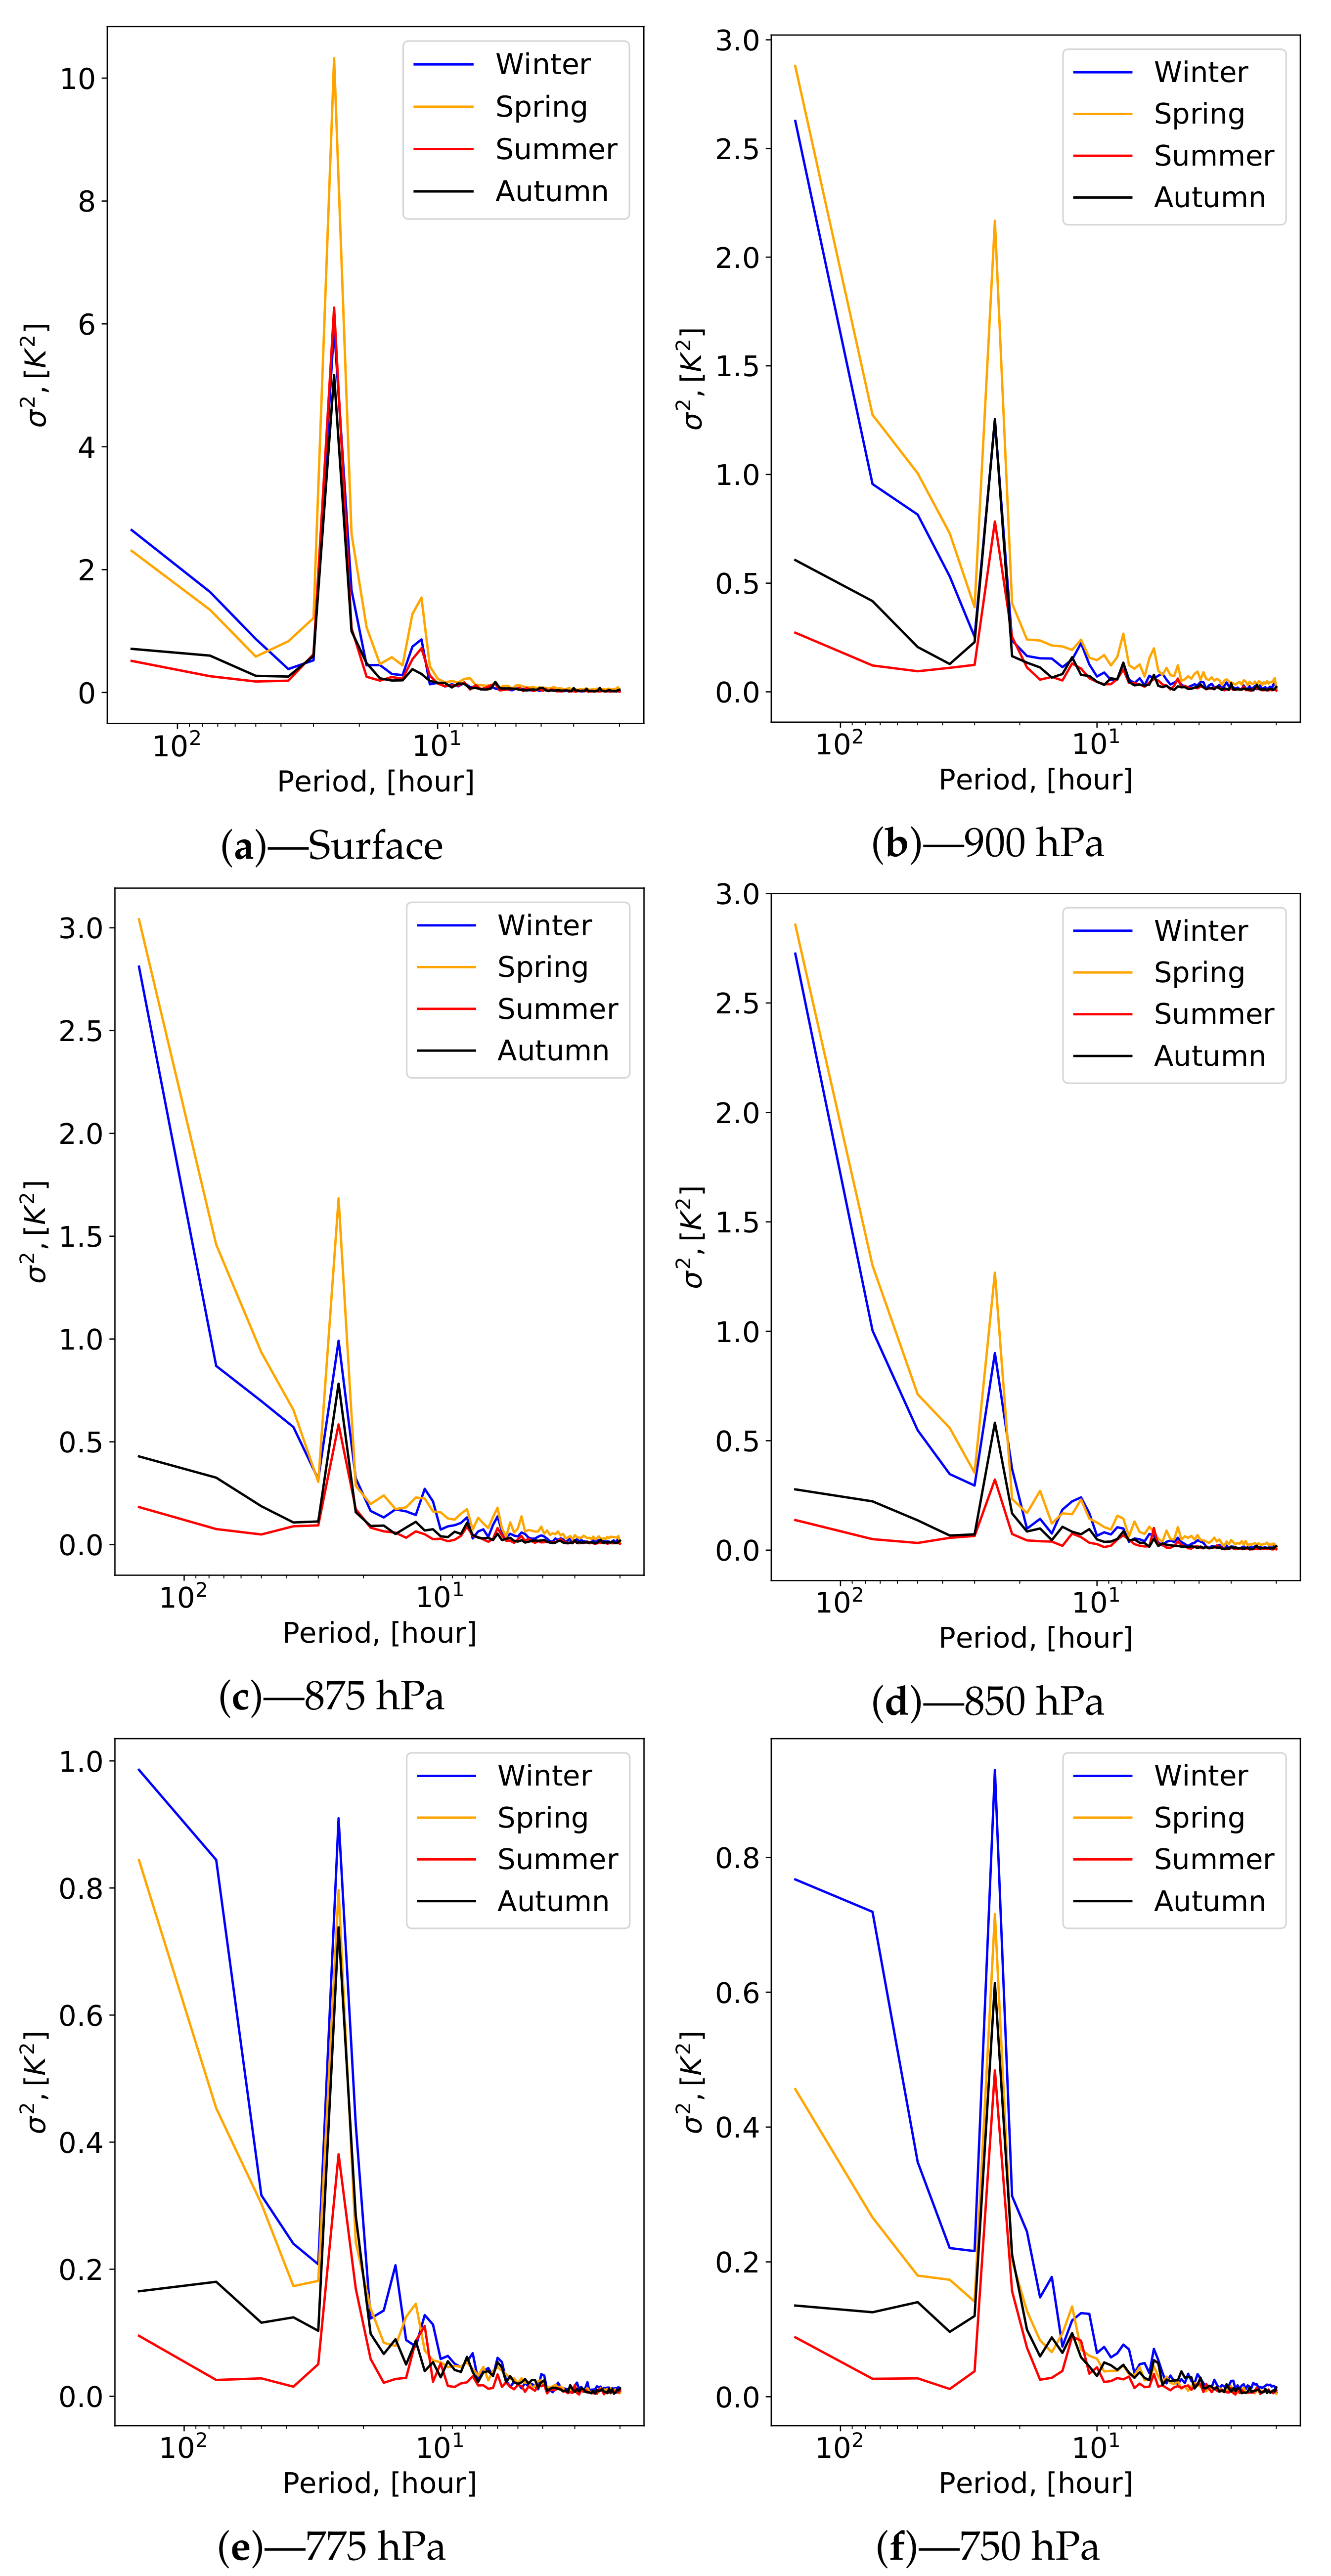
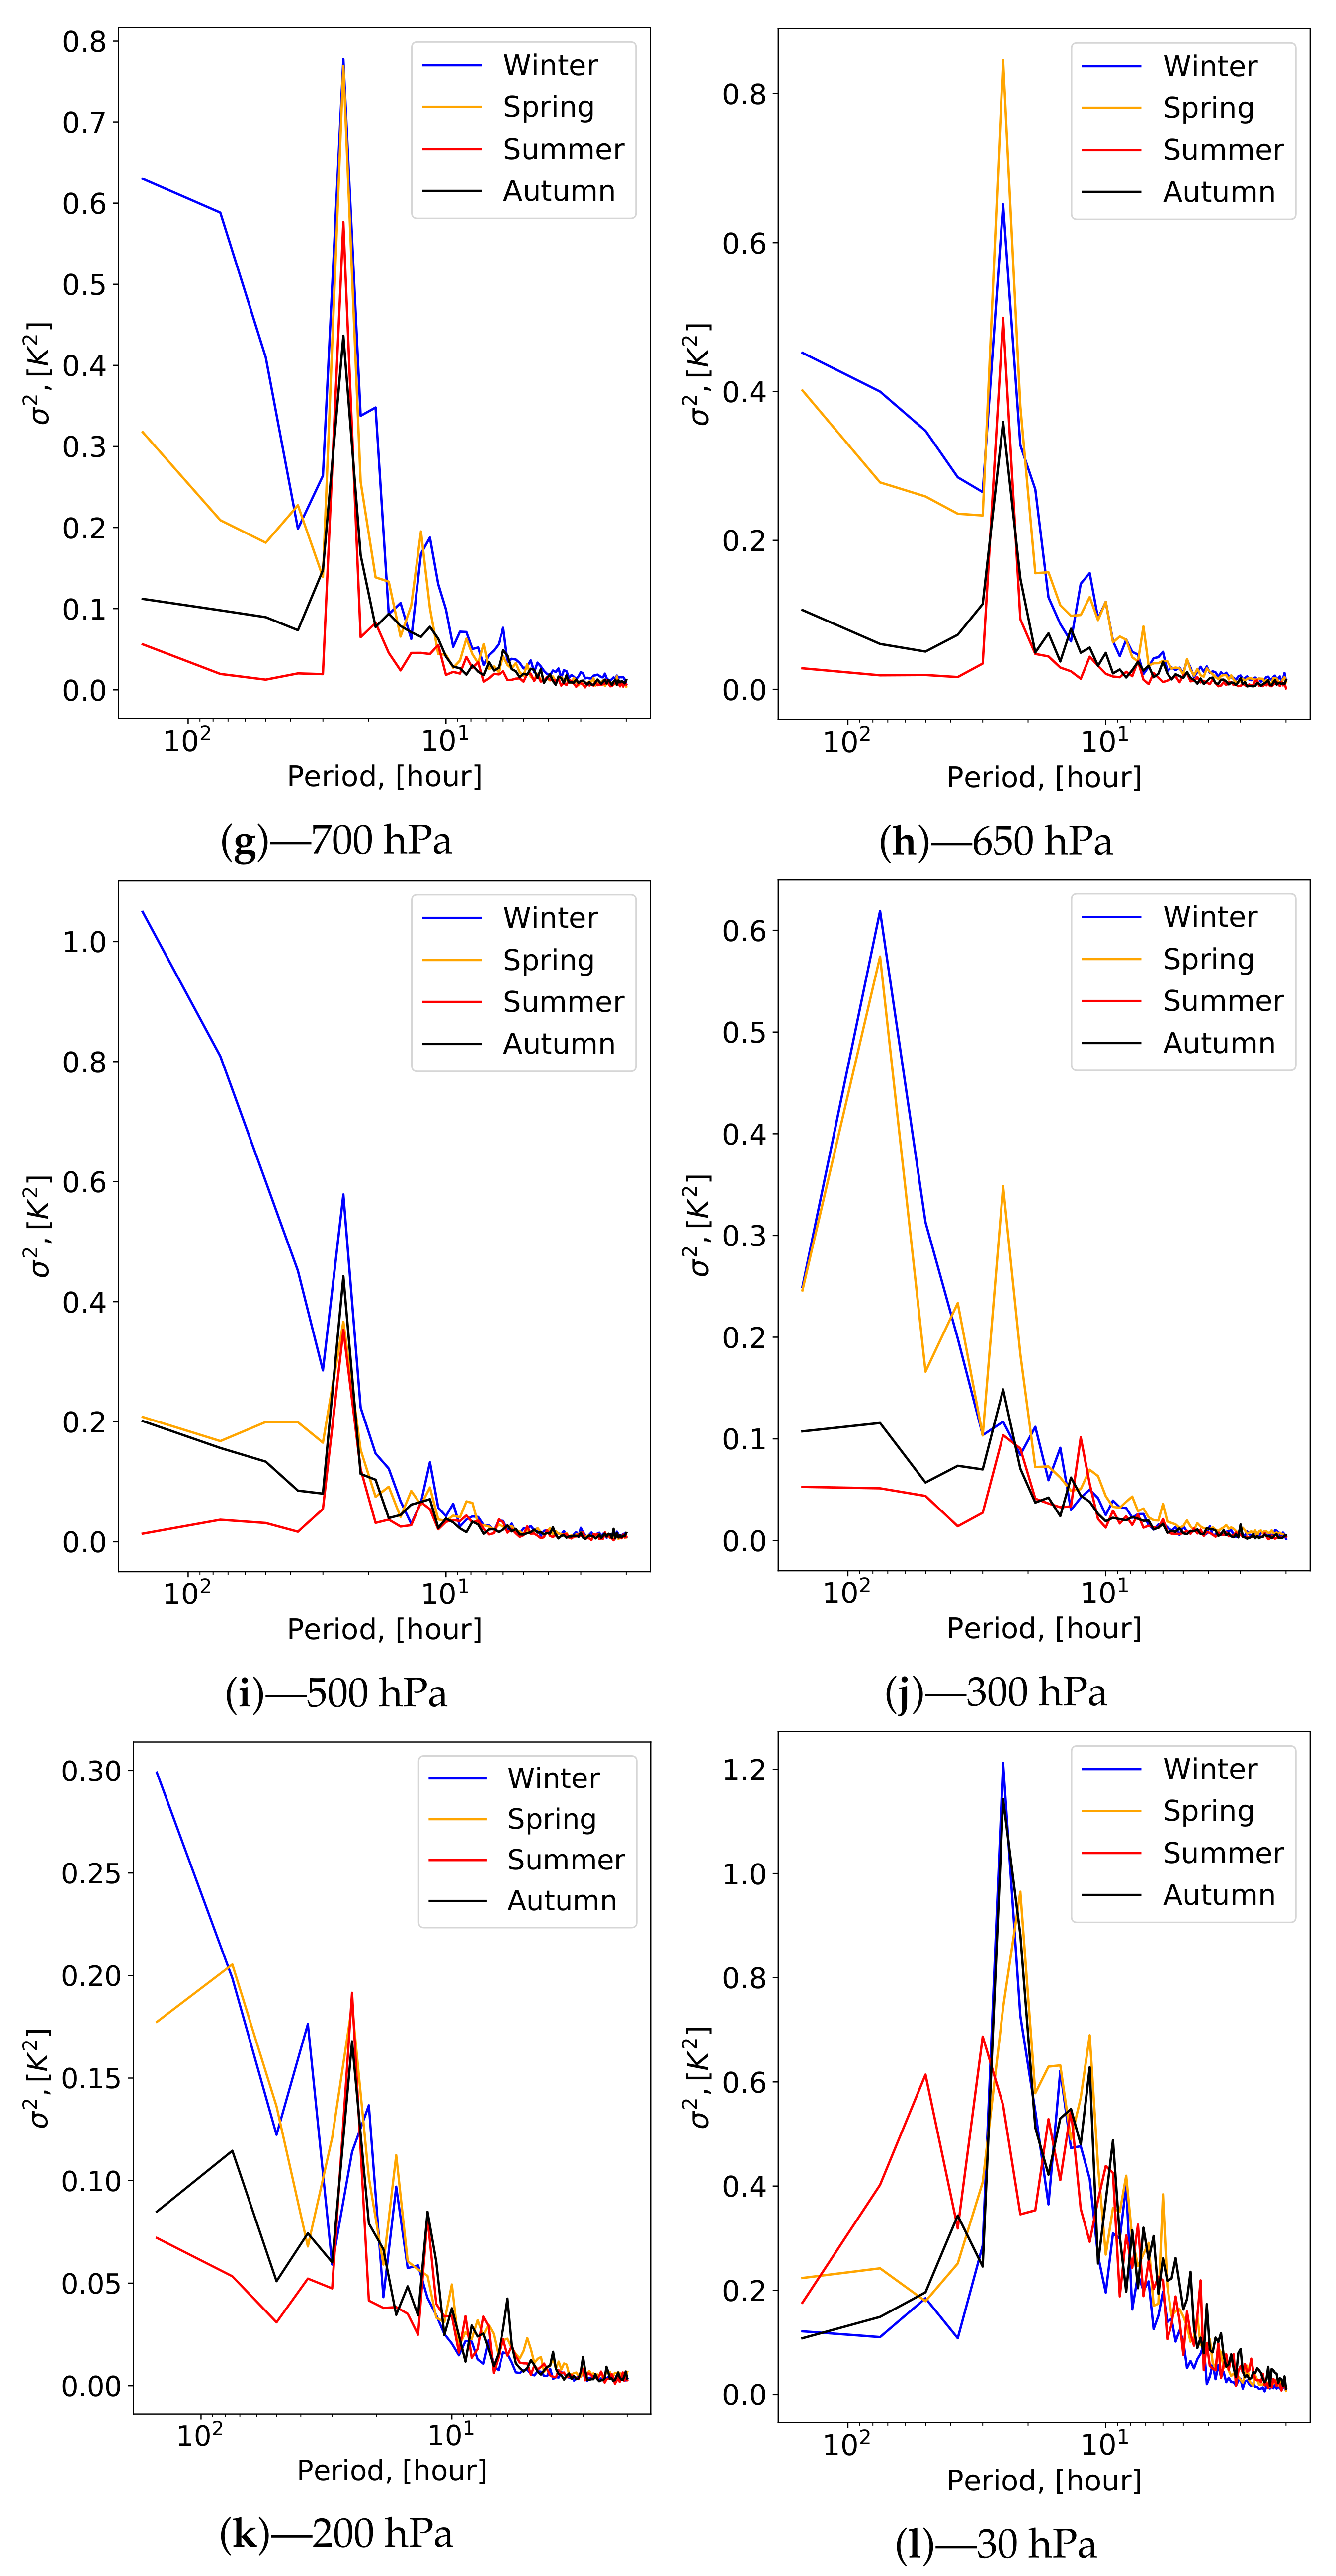
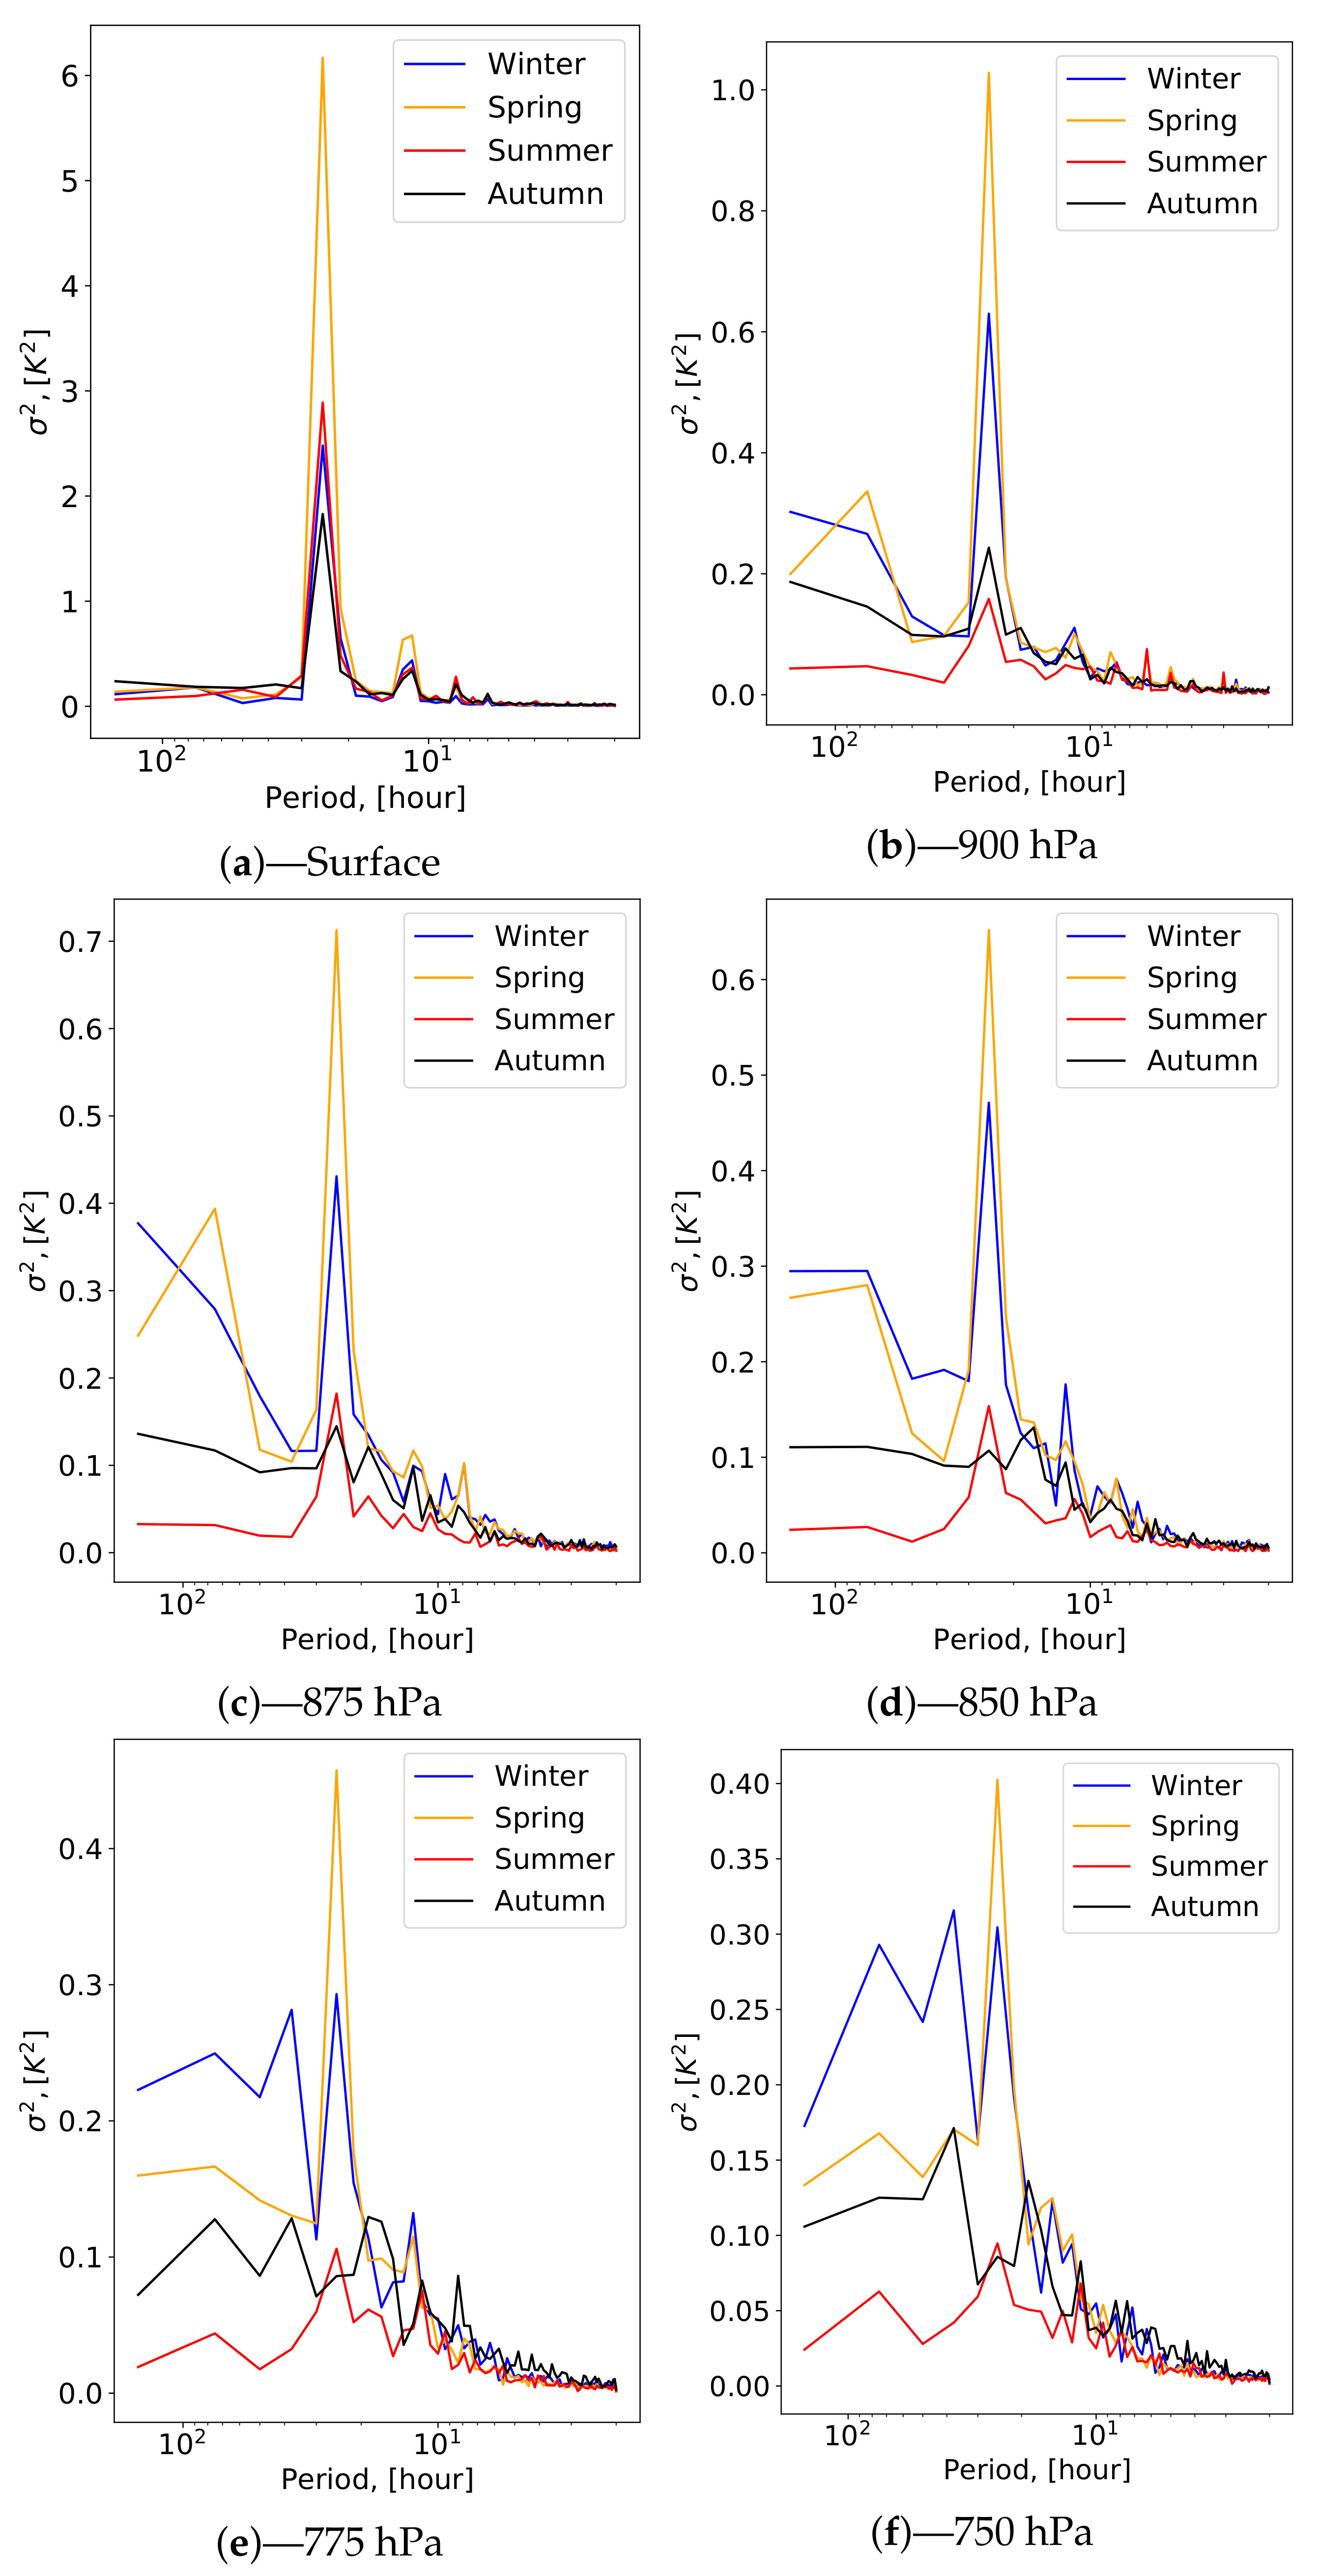
4. Energy Spectra of Air Temperature Fluctuations at the Sites of Nha Trang and Hoa Lac Observatories

At the site of the Hoa Lac observatory, energy spectra of air temperature fluctuations, as dependencies σ 2 ( τ ) , are shown in Figure 7a–l. The dispersion of air temperature is given by Formula (3):
σ 2 = E ( f ) · f .
The period τ is defined as:
τ = 1 / f .
These dependencies made it possible to compare the time scale and energy of atmospheric disturbance clearly. These energy spectra contain a few energy maxima. The daily maximum is most pronounced in the surface layer of the atmosphere. The energy of the fluctuations approaches 10.4 ( ) 2 in the spring and 5.3 ( ) 2 in autumn. The amplitude of the daily variations decreases with height. At pressure level 775 hPa (Figure 7e) maximum value is equal to 0.4 ( ) 2 in the summer and 0.8 ( ) 2 in winter. Significantly pronounced diurnal variations are observed at the 30 hPa level. The low-frequency maximum in the spectrum corresponds to a period of about 100 hours. The energy changes significantly only at heights higher than 2.5 km (775 hPa). Above the 775 hPa pressure level, weak low-frequency disturbances are observed in the winter–spring period. In the summer and autumn, the energy of low-frequency disturbances is insignificant. Probably, the dynamics of the low-frequency maximum is determined by processes in the atmospheric boundary layer (including wave perturbations).
At the site of the Nha-Trang astronomical observatory, the amplitude of daily variations in air temperature in the surface layer of the atmosphere is about 1.5–2.5 times smaller than at the Hoa Lac observatory. At the site of the Nha-Trang observatory, daily variations in air temperature are noticeable in the lower atmospheric layers. The amplitude of the diurnal variations decreases rapidly with height. At the pressure level of 875 hPa (Figure 8c), the energy of fluctuations drops to 0.7 ( ) 2 during spring. In the summer, the energy of fluctuations significantly decreases at the 900 hPa pressure level. Daily variations are also pronounced in the upper atmosphere, the specific energy of temperature fluctuations varies from 0.9 ( ) 2 in the summer to 3.6 ( ) 2 in winter. At the Nha-Trang Astronomical observatory, the low-frequency maximum of air temperature fluctuations has small amplitudes. Its specific energy in a layer up to 200 hPa does not exceed 0.4 ( ) 2 for all seasons. In the large-scale structure of air flows, low-frequency perturbations are most pronounced in the upper atmospheric layers.

5. Conclusions

In this paper, we discuss the astroclimatic characteristics at the sites of Hoa Lac and Nha Trang observatories. Using Era-5 reanalysis data, we have estimated the spatial distributions of wind speed in the upper atmosphere. Below, we summarize the key points of this study.
(i) The mean annual heights of the jet streams at the sites of the Hoa Lac and Nha Trang astronomical observatories were estimated. The heights of jet streams differ from 200 hPa level and correspond to pressure levels of 175 hPa and 125 hPa for Hoa Lac and Nha Trang observatories, respectively. At the Hoa Lac Observatory, the mean wind speed at the jet axis is 4.3 m/s higher compared to Nha Trang Observatory;
(ii) The effective turbulent velocity which is proportional to the wind speed in the jet stream is expected to be higher at the Hoa Lac Observatory site than at the Nha Trang Observatory site. In particular, assuming that k = 0.4 , the median values of V 0 will be 5.9 and 7.44 m/s for Nha Trang and Hoa Lac observatories, respectively;
(iii) Spectra calculated at the Nha Trang and Hoa Lac observatories contain low-frequency and diurnal maxima. At the site of the Nha Trang Astronomical Observatory, the amplitude of daily air temperature variations in the surface layer is approximately 1.5–2.5 times smaller compared to the Hoa Lac Observatory. Analysis of the spectra showed that the amplitude of the daily maximum decreases significantly with height. At the site of Hoa Lac observatory the amplitude of the daily maximum significantly decreases at height corresponding to the pressure level of 775 hPa. At the Nha Trang Observatory, the atmospheric layer with significant diurnal variations is thinner. The daily maximum has small amplitudes at 875 hPa. At the sites of the Nha Trang and Hoa Lac observatories the spectra have −5/3 slope in the lower part of the optically active atmosphere. With height the slopes of the spectra change. The slopes become steeper;
(iv) The low-frequency maximum in the spectra is pronounced only in the lower layers of the atmosphere. We associate the variations in the low-frequency maximum in the spectrum with processes in the atmospheric boundary layer (including wave perturbations). At the 200 hPa pressure level, the specific energy of low-frequency air temperature fluctuations does not exceed 0.3 ( ) 2 ;
(v) The energy of low-frequency air temperature fluctuations at the site of the Nha Trang observatory is negligible. The energy of low-frequency air temperature fluctuations should be considered in winter and spring for Hoa Lac Observatory.

Author Contributions

A.Y.S. and P.G.K. performed the calculations and study the spectra. E.A.K., H.L.X. and M.A.I. were engaged in formulated solutions to the task. All authors have read and agreed to the published version of the manuscript.

Funding

This research was carried out with the financial support of the Ministry of Science and Higher Education of the Russian Federation, Agreement from 13 October 2021, No. 075-15-2021-982.

Institutional Review Board Statement

Not applicable.

Informed Consent Statement

Not applicable.

Data Availability Statement

Data are available upon request.

Conflicts of Interest

The authors declare no conflict of interest.

References

  1. Hagelin, S.; Masciadri, E.; Lascaux, F. Optical turbulence simulations at Mt Graham using the Meso-NH model. Mont. Not. R. Astron. Soc. 2011, 412, 2695–2706. [Google Scholar] [CrossRef] [Green Version]
  2. Ullwer, C.; Sprung, D.; Sucher, E.; Kociok, T.; Grossmann, P.; van Eijk, A.M.J.; Stein, K. Global simulations of C n 2 using the weather research and forecast model WRF and comparison to experimental results. Proc. SPIE 2019, 11133, 11330I. [Google Scholar] [CrossRef]
  3. Abahamid, A.; Vernin, J.; Benkhaldoun, Z.; Jabiri, A.; Azouit, M.; Agabi, A. Seeing, outer scale of optical turbulence, and coherence outer scale at different astronomical sites using instruments on meteorological balloons. Astron. Astrophys. 2004, 422, 1123–1127. [Google Scholar] [CrossRef] [Green Version]
  4. Xu, M.; Shao, S.; Weng, N.; Zhou, L.; Liu, Q.; Zhao, Y. Atmospheric Optical Turbulence Characteristics over the Ocean Relevant to Astronomy and Atmospheric Physics. Appl. Sci. 2021, 11, 10548. [Google Scholar] [CrossRef]
  5. García, R.C.; Richer, M.G.; Martínez, R.G.; Avila, R. Estimating local seeing at Observatorio Astronómico Nacional in San Pedro Mártir using CFD simulations of the atmospheric boundary layer. Mont. Not. R. Astron. Soc. 2020, 496, 5552–5563. [Google Scholar] [CrossRef]
  6. Nosov, V.V.; Lukin, V.P.; Nosov, E.V.; Torgaev, A.V.; Afanas’ev, V.L.; Balega, Y.U.; Vlasyuk, V.V.; Panchuk, V.E.; Yakopov, G.V. Astroclimate Studies in the Special Astrophysical Observatory of the Russian Academy of Sciences. Atmos. Ocean. Opt. Vol. 2019, 32, 8–18. [Google Scholar] [CrossRef]
  7. Kornilov, V.G.; Kornilov, M.V.; Shatsky, N.I.; Vozyakova, O.V.; Gorbunov, I.A.; Safonov, B.S.; Potanin, S.A.; Cheryasov, D.V.; Senik, V.A. Meteorological conditions at the Caucasus Observatory of the SAI MSU from the results of the 2007–2015 campaign. Astron. Lett. 2016, 42, 616–630. [Google Scholar] [CrossRef]
  8. Masciadri, E.; Vernin, J.; Bougeault, P. 3D mapping of optical turbulence using an atmospheric numerical model. I. A useful tool for the ground-based astronomy. Astron. Astrophys. Suppl. Ser. 1999, 137, 185–202. [Google Scholar] [CrossRef] [Green Version]
  9. Bounhir, A.; Benkhaldoun, Z.; Carrasco, E.; Sarazin, M. High-altitude wind velocity at Oukaimeden observatory. MNRAS 2009, 398, 862–872. [Google Scholar] [CrossRef] [Green Version]
  10. Chueca, S.; García-Lorenzo, B.; Muñoz-Tuñón, C.; Fuensalida, J.J. Statistics and analysis of high-altitude wind above the Canary Islands observatories. Mont. Not. R. Astron. Soc. 2004, 349, 627–631. [Google Scholar] [CrossRef] [Green Version]
  11. Qian, X.; Yao, Y.; Wang, H.; Zou, L.; Li, Y. Statistics and analysis of high-altitude wind above the western Tibetan Plateau. Mon. Not. R. Astron. Soc. 2020, 498, 5786–5797. [Google Scholar] [CrossRef]
  12. Garcia-Lorenzo, B.; Fuensalida, J.J.; Munoz-Tunon, C.; Mendizabal, E. Astronomical Site Ranking Based on Tropospheric Wind Statistics. Mon. Not. R. Astron. Soc. 2005, 356, 849–858. [Google Scholar] [CrossRef] [Green Version]
  13. Hidalgo, S.L.; Muñoz-Tuñón, C.; Castro-Almazán, J.A.; Varela, A.M. Canarian Observatories Meteorology; Comparison of OT and ORM using Regional Climate Reanalysis. Publ. Astron. Soc. Pac. 2021, 133, 105002. [Google Scholar] [CrossRef]
  14. García-Lorenzo, B.; Eff-Darwich, A.; Fuensalida, J.J.; Castro-Almazán, J. Adaptive optics parameters connection to wind speed at the Teide Observatory. Mon. Not. R. Astron. Soc. 2009, 397, 1633–1646. [Google Scholar] [CrossRef] [Green Version]
  15. Hach, Y.; Jabiri, A.; Ziad, A.; Bounhir, A.; Sabil, M.; Abahamid, A.; Benkhaldoun, Z. Meteorological profiles and optical turbulence in the free atmosphere with NCEP/NCAR data at Oukaimenden—I. Meteorological parameters analysis and tropospheric wind regimes. Mon. Not. R. Astron. Soc. 2012, 420, 637–650. [Google Scholar] [CrossRef] [Green Version]
  16. Kovadlo, P.G.; Lukin, V.P.; Shikhovtsev, A.Y. Development of the Model of Turbulent Atmosphere at the Large Solar Vacuum Telescope Site as Applied to Image Adaptation. Atmos. Ocean. Opt. 2019, 32, 202–206. [Google Scholar] [CrossRef]
  17. Shikhovtsev, A.; Kovadlo, P.; Lukin, V. Temporal Variations of the Turbulence Profiles at the Sayan Solar Observatory Site. Atmosphere 2019, 10, 499. [Google Scholar] [CrossRef] [Green Version]
  18. Thao, N.T.; Dung, M.T.; Loc, P.V. The 50 cm telescope of Hoa Lac observatory: An introduction. Vietnam J. Sci. Technol. Eng. 2019, 61, 14–28. [Google Scholar] [CrossRef]
  19. Hersbach, H.; Bell, B.; Berrisford, P.; Hirahara, S.; Horányi, A.; Muñoz-Sabater, J.; Nicolas, J.; Peubey, C.; Radu, R.; Schepers, D.; et al. The ERA5 global reanalysis. Q. J. R. Meteorol. Soc. 2020, 146, 730–1999. [Google Scholar] [CrossRef]
  20. Han, Y.; Yang, Q.; Liu, N.; Zhang, K.; Qing, C.; Li, X.; Wu, X.; Luo, T. Analysis of wind-speed profiles and optical turbulence above Gaomeigu and the Tibetan Plateau using ERA5 data. Mon. Not. R. Astron. Soc. 2021, 501, 4692–4701. [Google Scholar] [CrossRef]
  21. Gualtieri, G. Reliability of ERA5 Reanalysis Data for Wind Resource Assessment: A Comparison against Tall Towers. Energies 2021, 14, 4169. [Google Scholar] [CrossRef]
  22. Virman, M.; Bister, M.; Räisänen, J.; Sinclair, V.A.; Järvinen, H. Radiosonde comparison of ERA5 and ERA-Interim reanalysis datasetsover tropical oceans. Tellus A Dyn. Meteorol. Oceanogr. 2021, 73, 1–7. [Google Scholar] [CrossRef]
  23. Shikhovtsev, A.Y.; Bolbasova, L.A.; Kovadlo, P.G.; Kiselev, A.V. Atmospheric parameters at the 6-m Big Telescope Alt-azimuthal site. Mon. Not. R. Astron. Soc. 2020, 493, 723–729. [Google Scholar] [CrossRef]
  24. Nastrom, G.D.; Gage, K.S. A Climatology of Atmospheric Wavenumber Spectra of Wind and Temperature Observed by Commercial Aircraft. J. Atmos. Sci. 1985, 42, 950–960. [Google Scholar] [CrossRef] [Green Version]
  25. Cheynet, E.; Jakobsen, J.B.; Reuder, J. Velocity Spectra and Coherence Estimates in the Marine Atmospheric Boundary Layer. Bound.-Layer Meteorol. 2018, 169, 429–460. [Google Scholar] [CrossRef]
  26. Larsén, X.G.; Larsen, S.E.; Petersen, E.L. Full-Scale Spectrum of Boundary-Layer Winds. Bound.-Layer Meteorol. 2016, 159, 349–371. [Google Scholar] [CrossRef] [Green Version]
  27. Wang, J.-X.; Yang, Q.-S.; Sun, L.; Li, B.; Liu, M. Analysis of the wind speed spectrum in the urban area of Beijing based on the measured data of the Ma Dian Qiao Bei meteorological tower in 2013. Gongcheng Lixue/Eng. Mech. 2020, 37, 250–256. [Google Scholar] [CrossRef]
  28. Mikkelson, T.; Larsen, S.E.; Jørgensen, H.E.; Astrup, P.; Larsén, H.G. Scaling of turbulence spectra measured in strong shear flow near the Earth’s surface. Phys. Scr. 2017, 92, 124002. [Google Scholar] [CrossRef] [Green Version]
  29. Shikhovtsev, A.Y.; Kovadlo, P.G.; Kopylov, E.A.; Ibrahimov, M.A.; Ehgamberdiev, S.A.; Tillayev, Y.A. Energy spectra of atmospheric turbulence for calculating C n 2 parameter. I. Maidanak and Suffa observatories in Uzbekistan. Atmosphere 2021, 12, 1614. [Google Scholar] [CrossRef]
Figure 1. Space distributions of the wind speed averaged for heights from 100 to 200 hPa in the region of the Nha Trang observatory and the Hoa Lac observatory.
Atmosphere 12 01680 g001
Figure 2. Annual averaged vertical profiles of the wind speed above the astronomical observatories.
Atmosphere 12 01680 g002
Figure 3. The probability distributions of the wind speed at the 125 hPa level at the site of the Nha Trang observatory.
Atmosphere 12 01680 g003
Figure 4. The probability distributions of the wind speed at 175 hPa level at the site of the Hoa Lac observatory.
Atmosphere 12 01680 g004
Figure 5. Frequency dependencies of power spectral density of air temperature fluctuations at the Nha Trang observatory site.
Atmosphere 12 01680 g005
Figure 6. Frequency dependencies of power spectral density of air temperature fluctuations at the Hoa Lac observatory site.
Atmosphere 12 01680 g006
Figure 7. Energy spectra of air temperature fluctuations at the Hoa Lac observatory.
Atmosphere 12 01680 g007aAtmosphere 12 01680 g007b
Figure 8. Energy spectra of air temperature fluctuations at the Nha Trang observatory.
Atmosphere 12 01680 g008aAtmosphere 12 01680 g008b
Table 1. Statistics of the wind speed at the 175 hPa pressure level at the Nha Trang observatory.
SeasonMedian, m/sSkewness CoefficientKurtosis Coefficient
Winter12.40.59−0.35
Spring9.10.880.34
Summer24.00.01−0.48
Autumn15.50.34−0.57
Table 2. Statistics of the wind speed at the 175 hPa at the Hoa Lac observatory.
SeasonMedian, m/sSkewness CoefficientKurtosis Coefficient
Winter31.70.390.29
Spring24.90.08−0.72
Summer11.10.810.26
Autumn11.80.850.27
Table 3. The mean values of energy f 1 f 2 E ( f ) d f and f 3 f 4 E l ( f ) d f at the Nha Trang observatory.
Level, hPaSeason f 1 f 2 E ( f ) df , ( ) 2 f 3 f 4 E l ( f ) df , ( ) 2
SurfaceWinter0.290.16
Spring0.320.30
Summer0.160.30
Autumn0.420.34
900Winter0.570.18
Spring0.540.18
Summer0.090.10
Autumn0.330.15
875Winter0.660.17
Spring0.640.15
Summer0.060.08
Autumn0.250.15
850Winter0.590.17
Spring0.550.13
Summer0.050.08
Autumn0.220.15
775Winter0.470.13
Spring0.330.10
Summer0.060.09
Autumn0.200.17
750Winter0.470.13
Spring0.300.10
Summer0.090.10
Autumn0.230.16
700Winter0.540.10
Spring0.290.09
Summer0.110.09
Autumn0.230.16
650Winter0.470.08
Spring0.300.06
Summer0.090.08
Autumn0.230.17
500Winter0.160.07
Spring0.170.06
Summer0.040.10
Autumn0.180.18
300Winter0.170.04
Spring0.100.03
Summer0.090.04
Autumn0.240.10
200Winter0.140.04
Spring0.090.05
Summer0.110.05
Autumn0.220.08
100Winter1.30.23
Spring0.510.10
Summer0.610.24
Autumn1.340.51
30Winter0.910.22
Spring1.610.56
Summer1.400.33
Autumn0.700.54
Table 4. The mean values of energy f 1 f 2 E ( f ) d f and f 3 f 4 E l ( f ) d f at the Hoa Lac observatory.
Level, hPaSeason f 1 f 2 E ( f ) df , ( ) 2 f 3 f 4 E l ( f ) df , ( ) 2
SurfaceWinter4.280.55
Spring3.651.14
Summer0.780.42
Autumn1.310.65
900Winter3.580.42
Spring4.150.87
Summer0.390.21
Autumn1.020.28
875Winter3.680.32
Spring4.500.68
Summer0.260.16
Autumn0.750.24
850Winter3.720.26
Spring4.150.59
Summer0.190.11
Autumn0.500.21
775Winter1.830.27
Spring1.300.19
Summer0.120.15
Autumn0.350.17
750Winter1.490.32
Spring0.720.16
Summer0.110.16
Autumn0.260.17
700Winter1.220.31
Spring0.530.18
Summer0.080.15
Autumn0.210.20
650Winter0.850.30
Spring0.700.26
Summer0.050.14
Autumn0.170.16
500Winter1.860.24
Spring0.380.19
Summer0.050.18
Autumn0.360.21
300Winter0.870.14
Spring0.820.16
Summer0.100.08
Autumn0.220.08
200Winter0.500.08
Spring0.380.12
Summer0.130.08
Autumn0.200.09
100Winter0.750.16
Spring0.750.35
Summer0.270.15
Autumn0.530.28
30Winter0.230.28
Spring0.470.46
Summer0.580.53
Autumn0.260.73
Publisher’s Note: MDPI stays neutral with regard to jurisdictional claims in published maps and institutional affiliations.

