
The Thickness of Talus Deposits in the Periglacial Area of SW Spitsbergen (Fugleberget Mountainside) in the Light of Slope Development Theories


Abstract
:1. Introduction
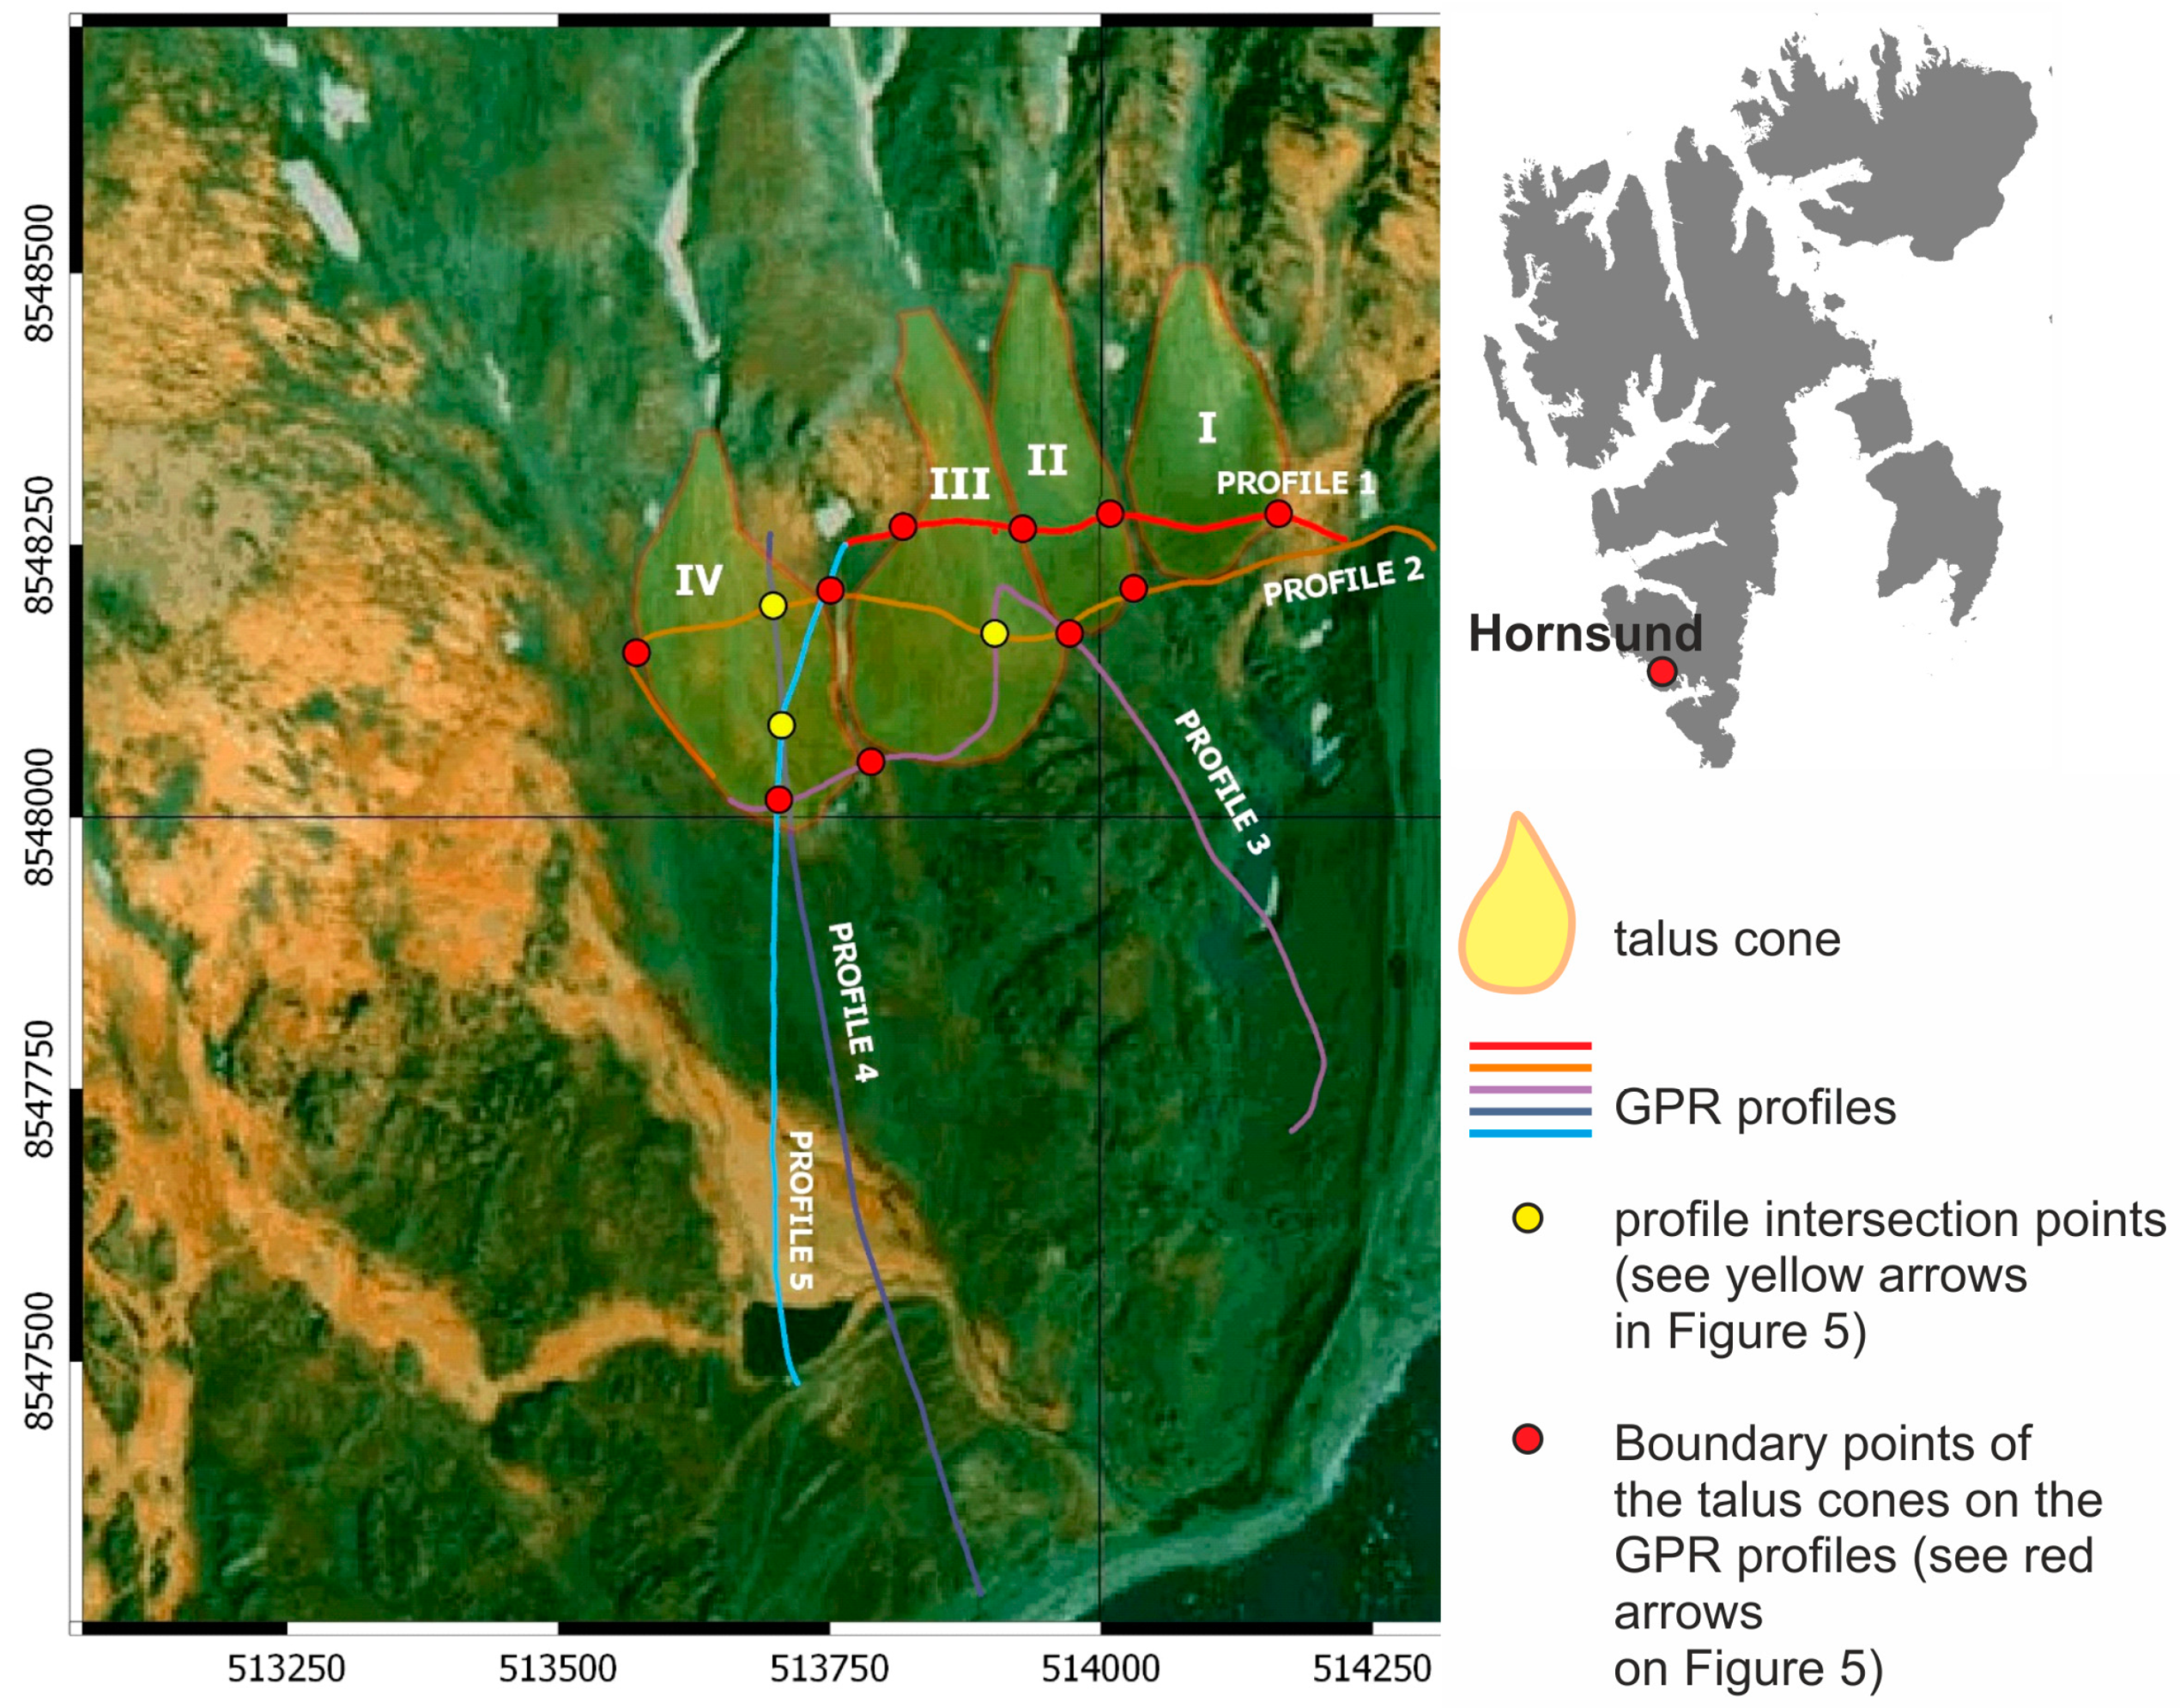
1.1. Study Area
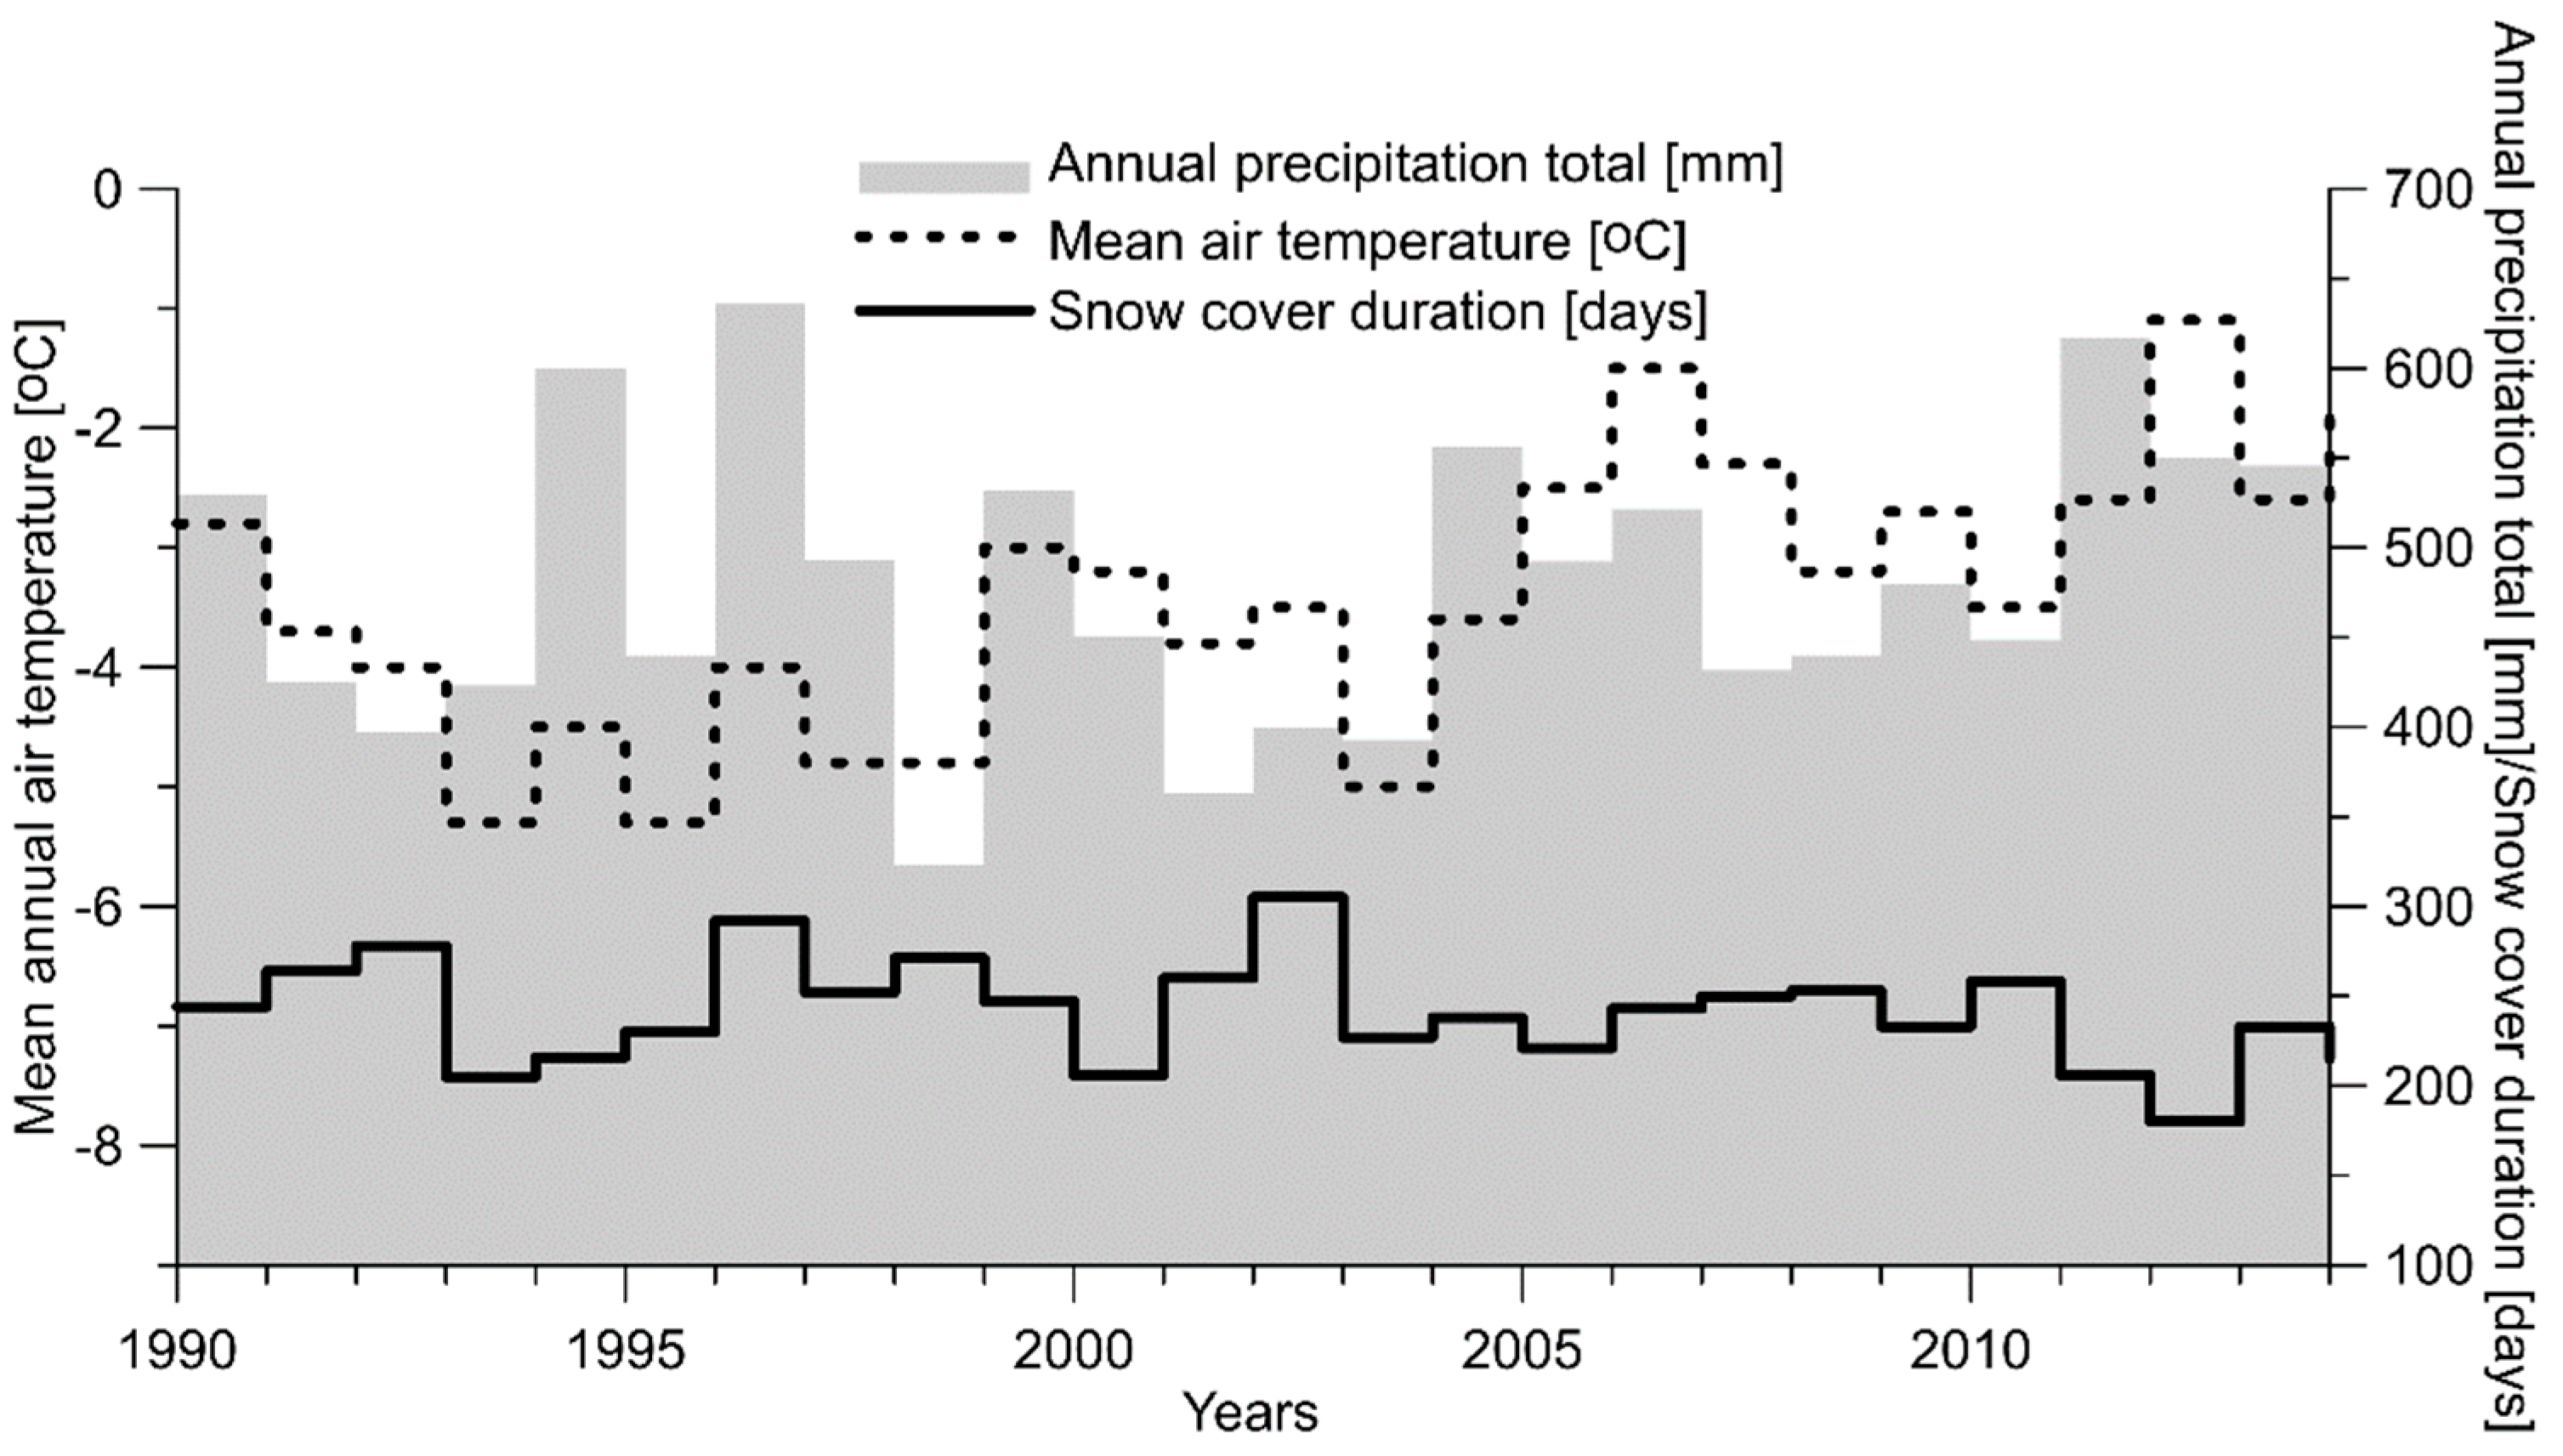
1.2. Climatic Conditions
1.3. Snow Cover
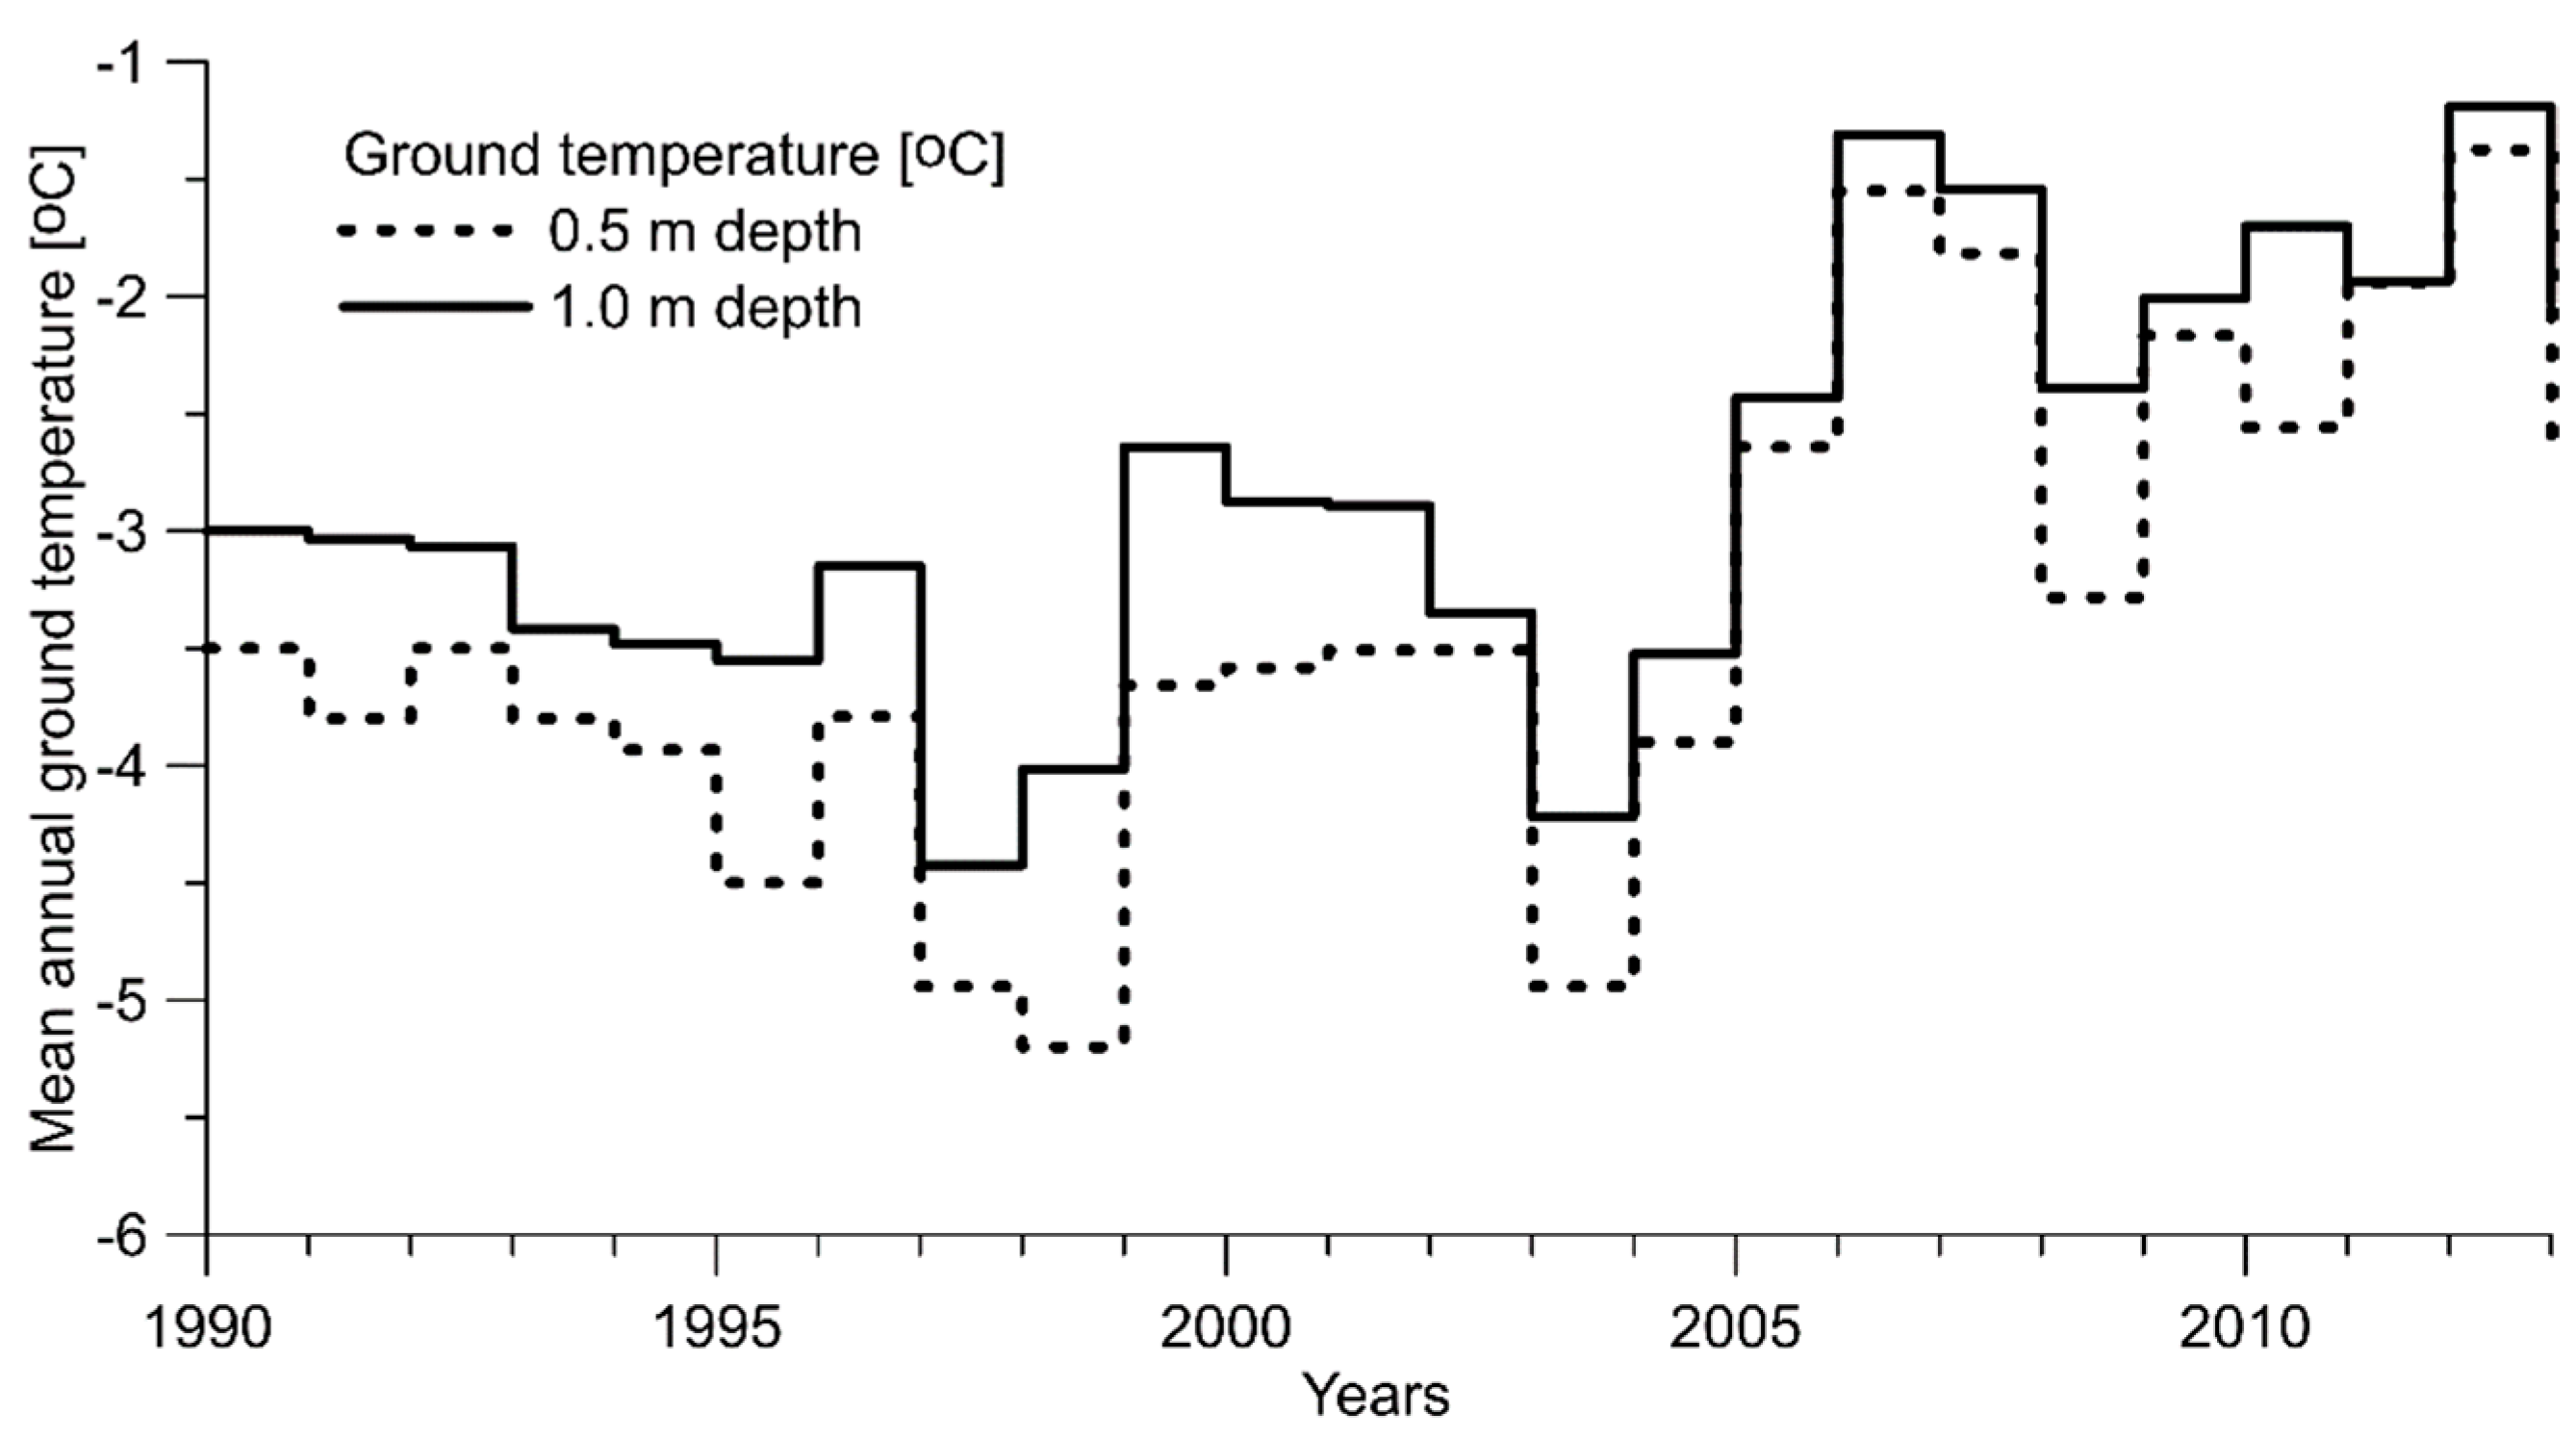
1.4. Active Layer
2. Methods
3. Results
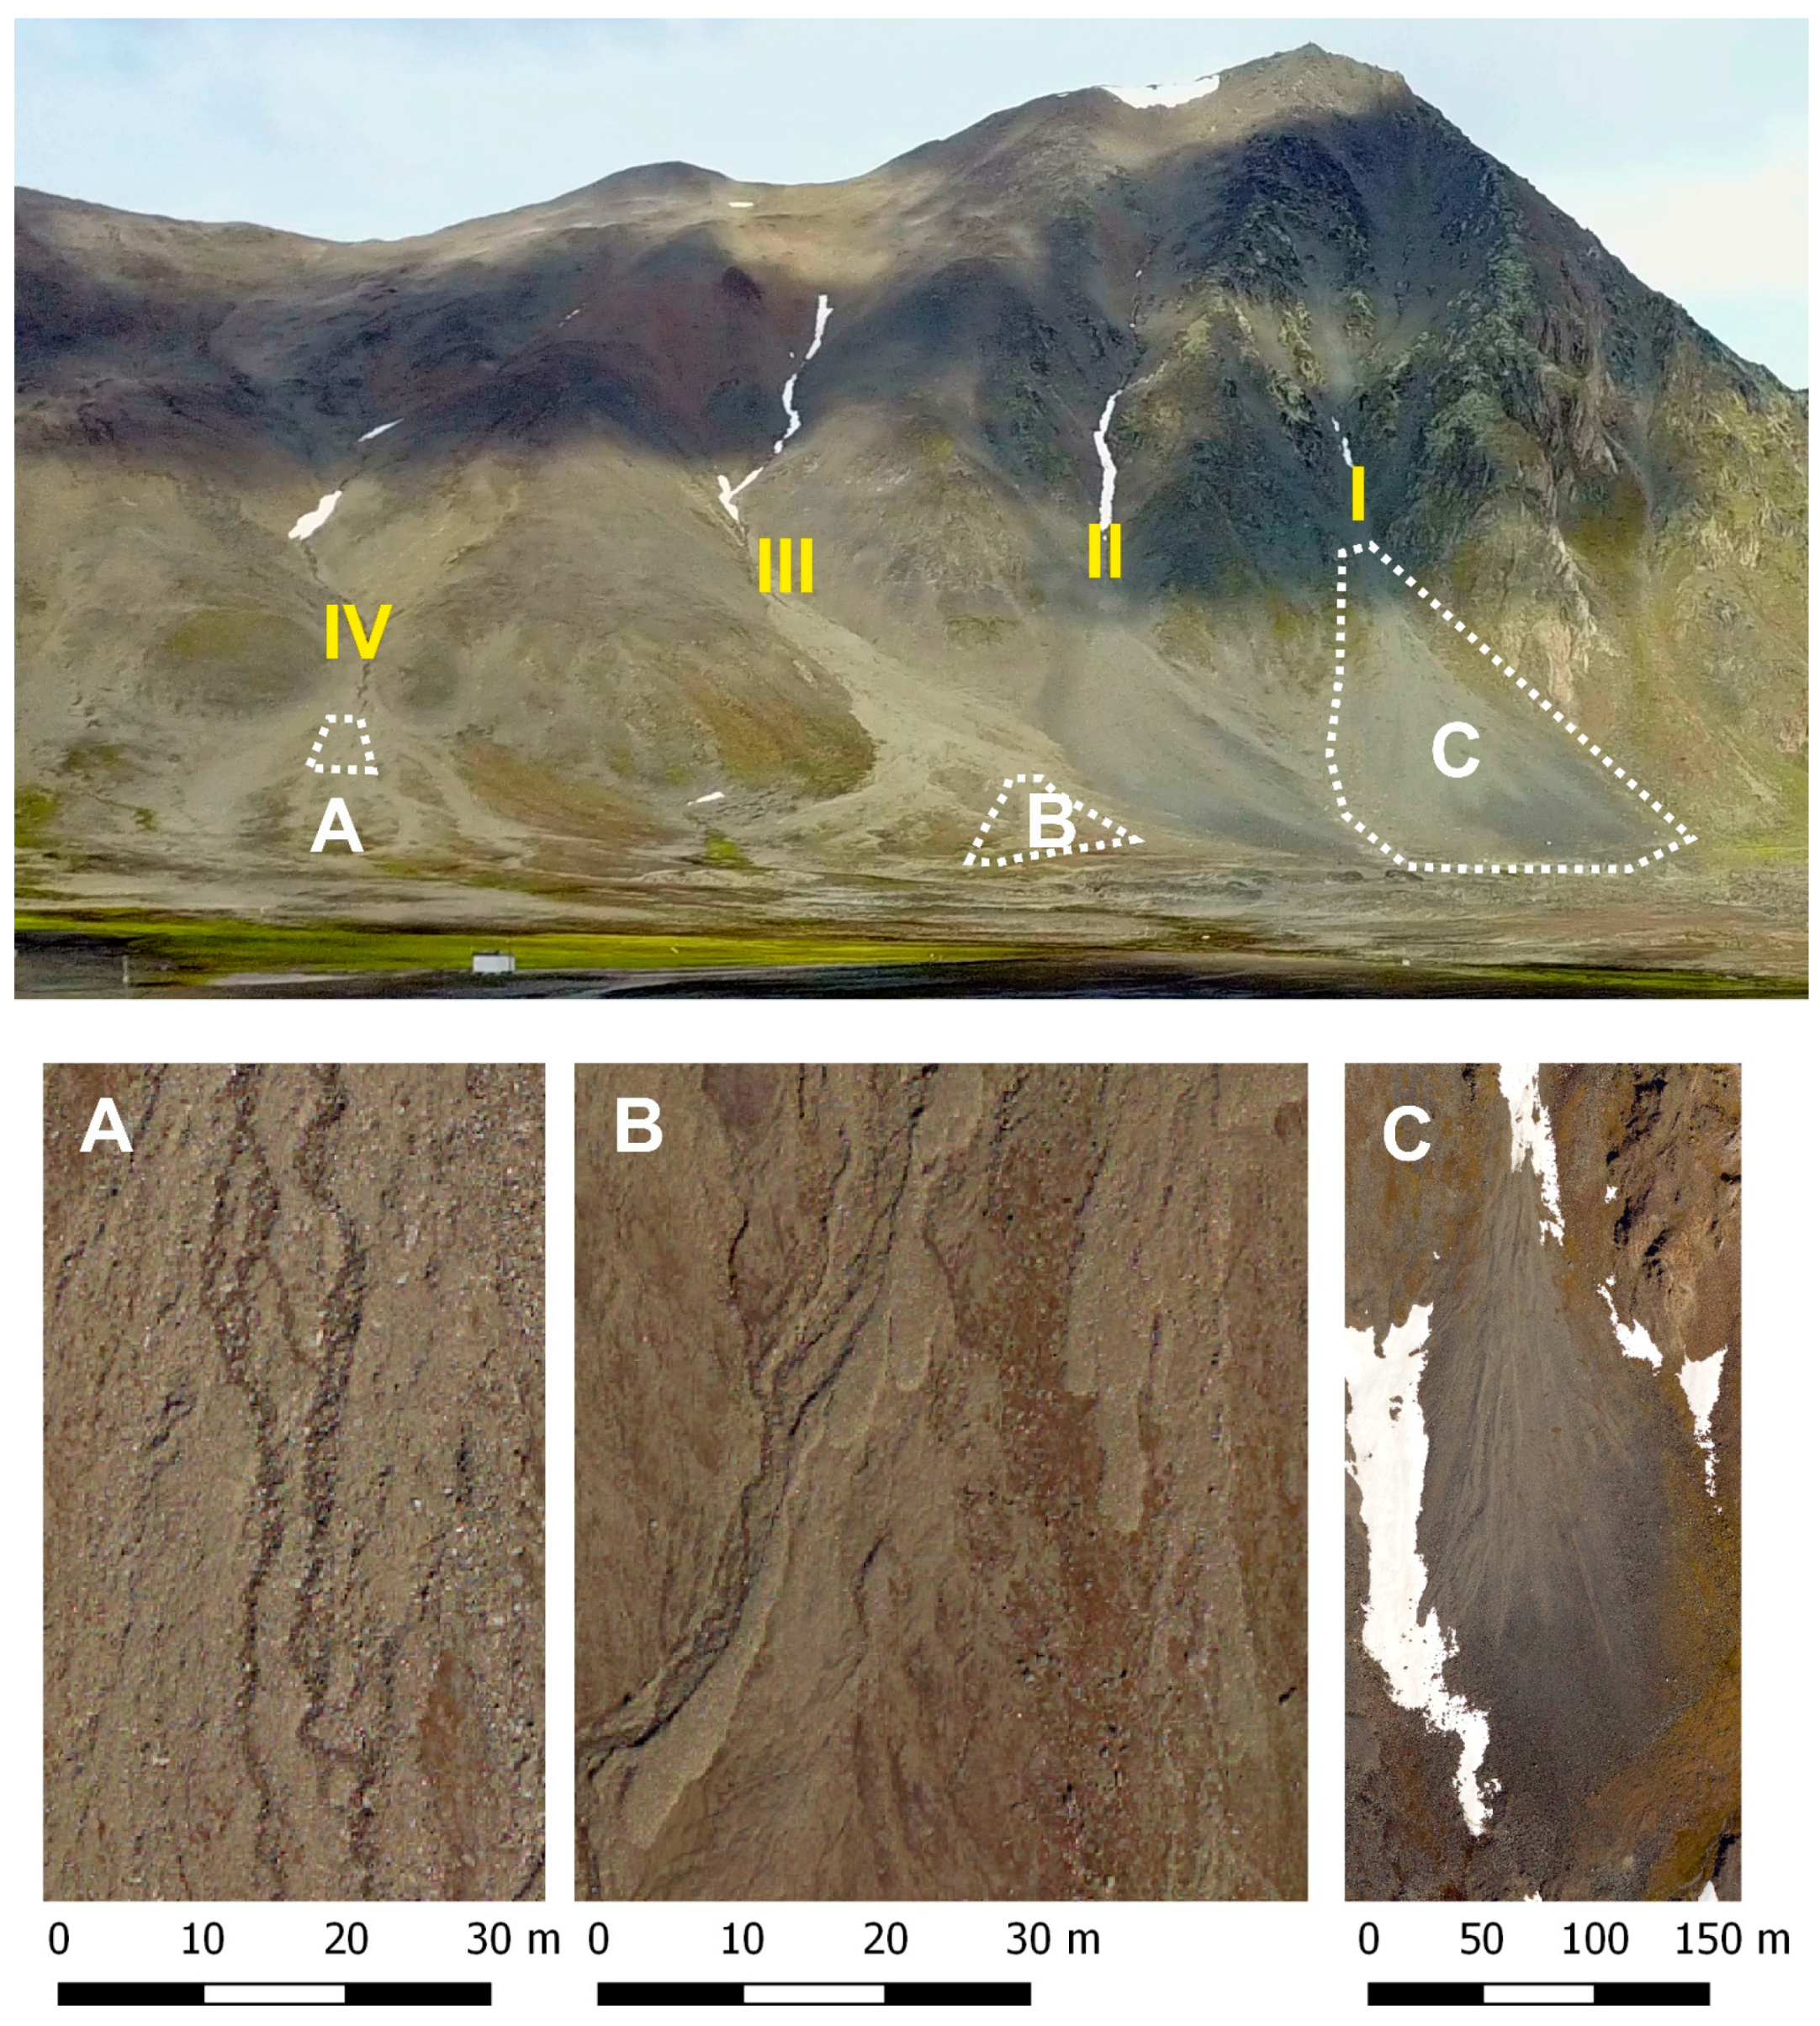
3.1. “Talus I”
3.2. “Talus II”
3.3. “Talus III”
3.4. “Talus IV”
4. Discussion
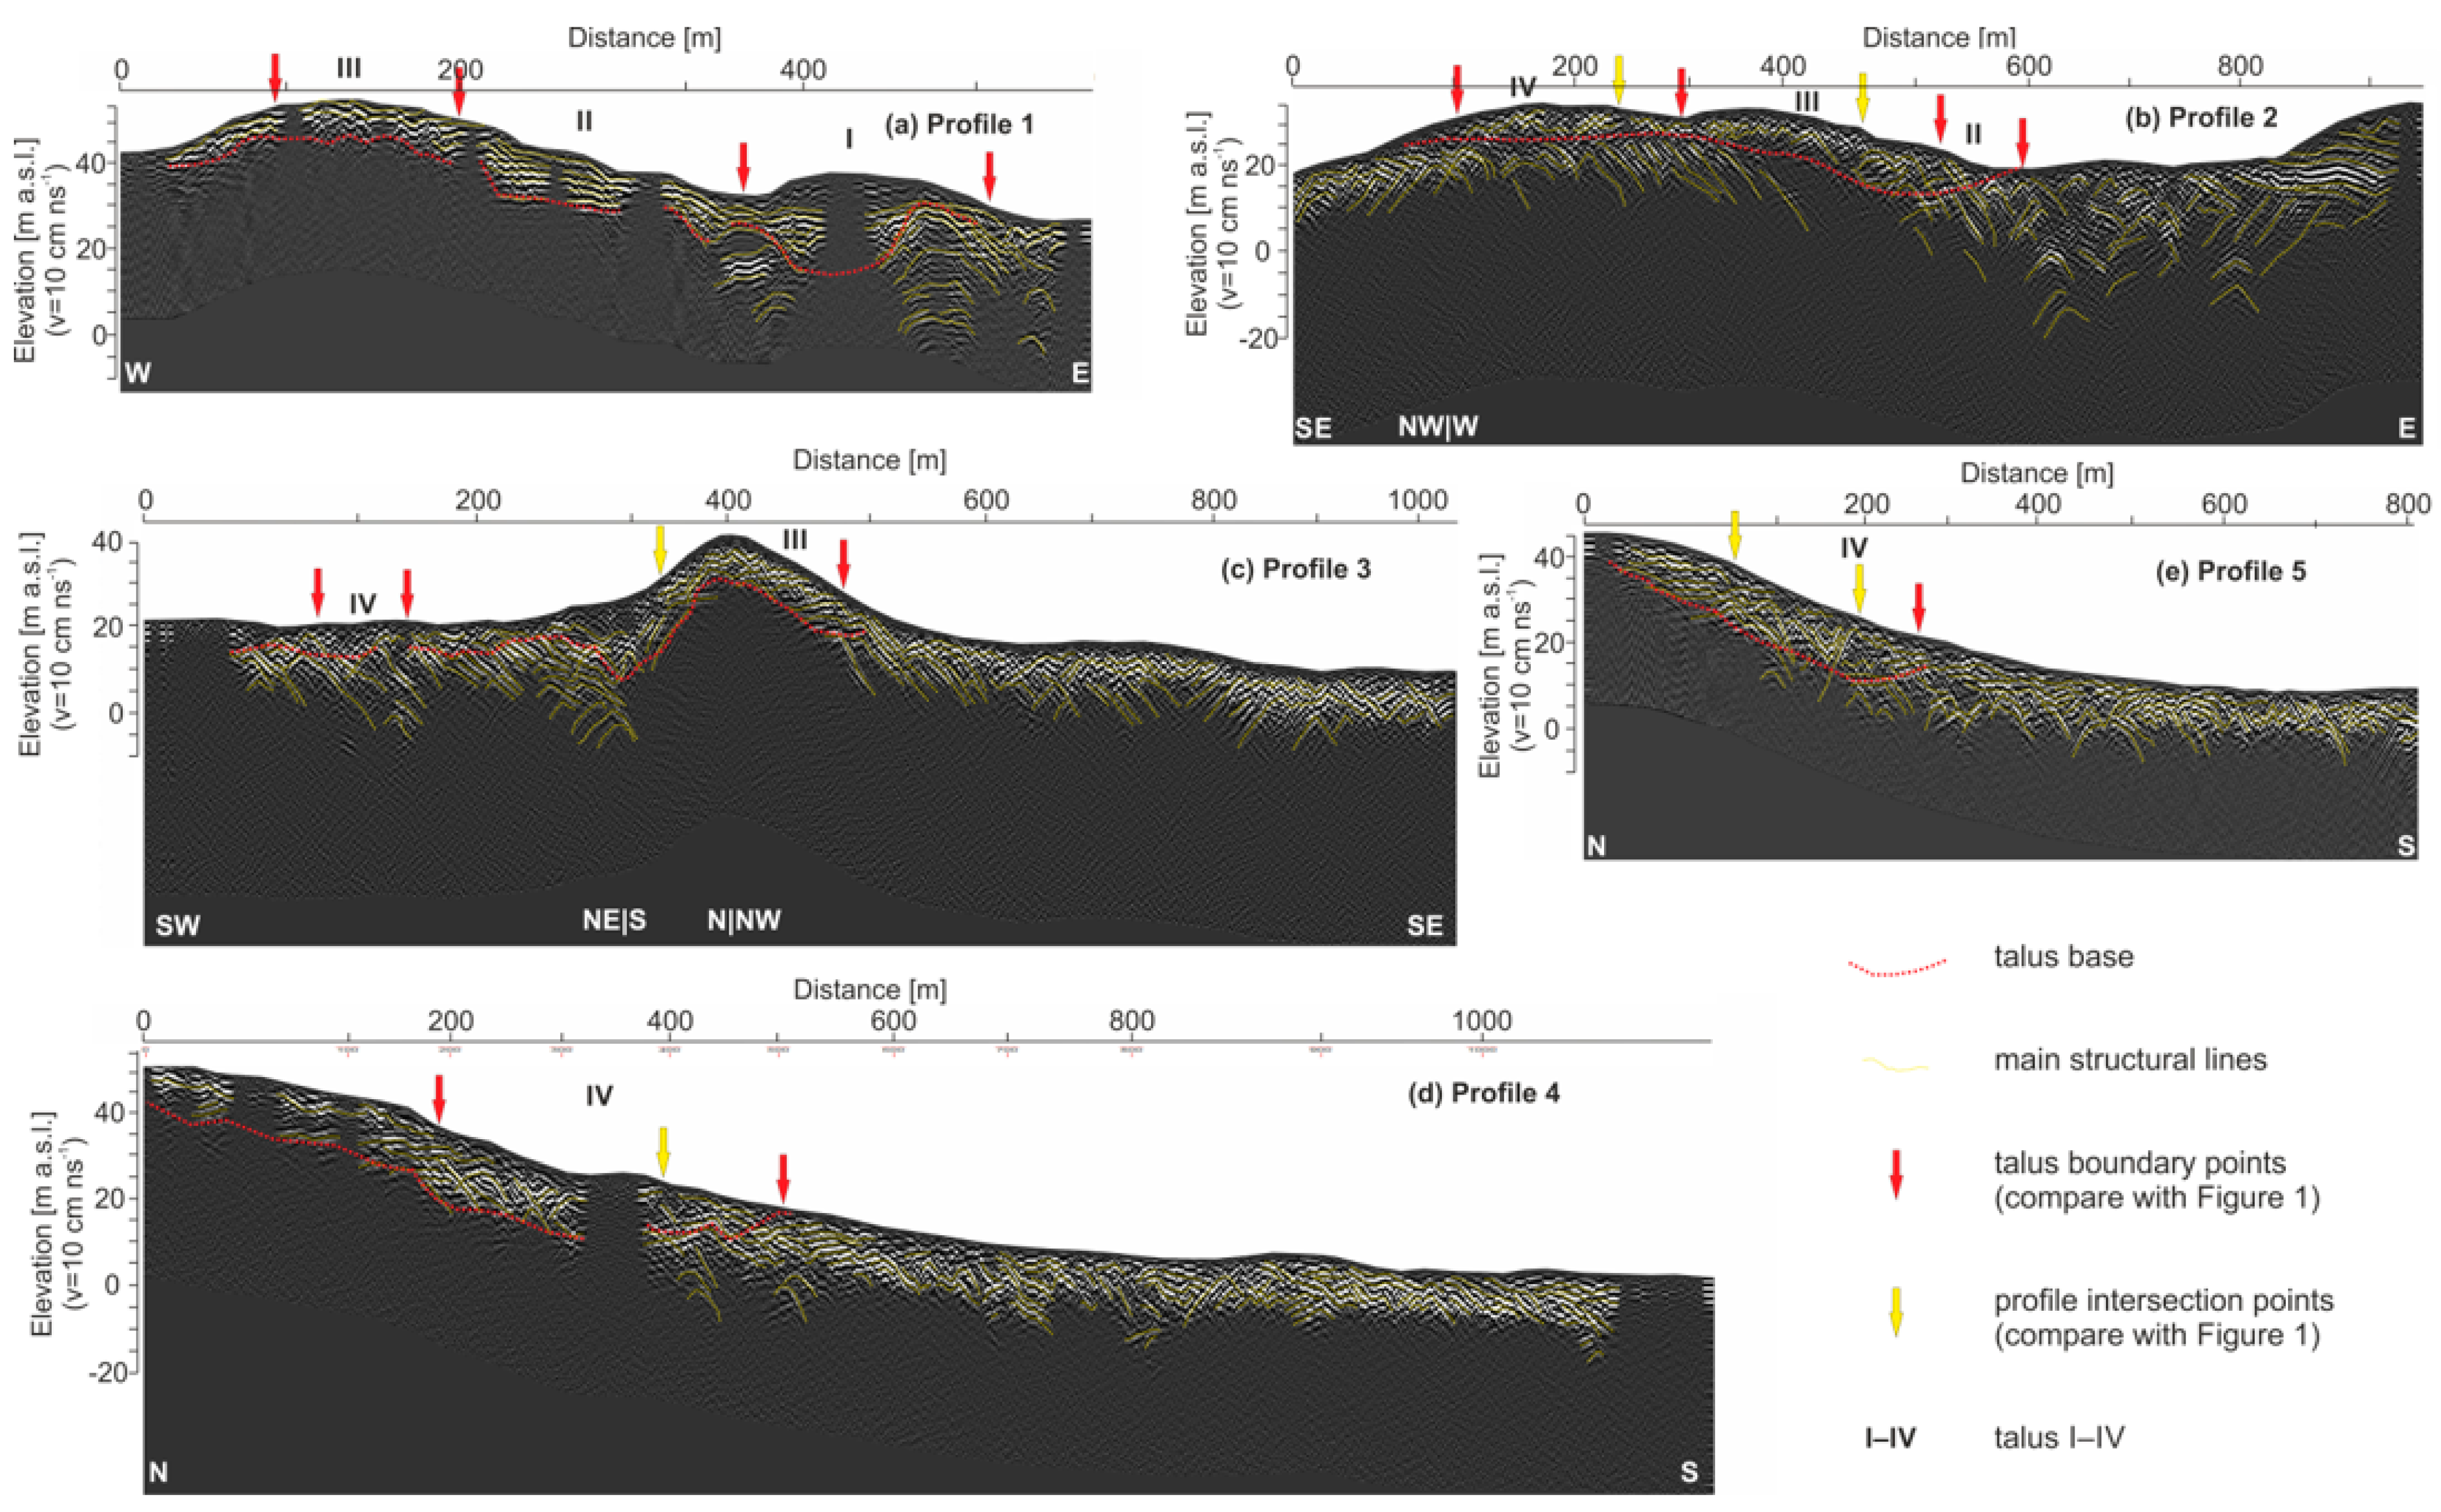
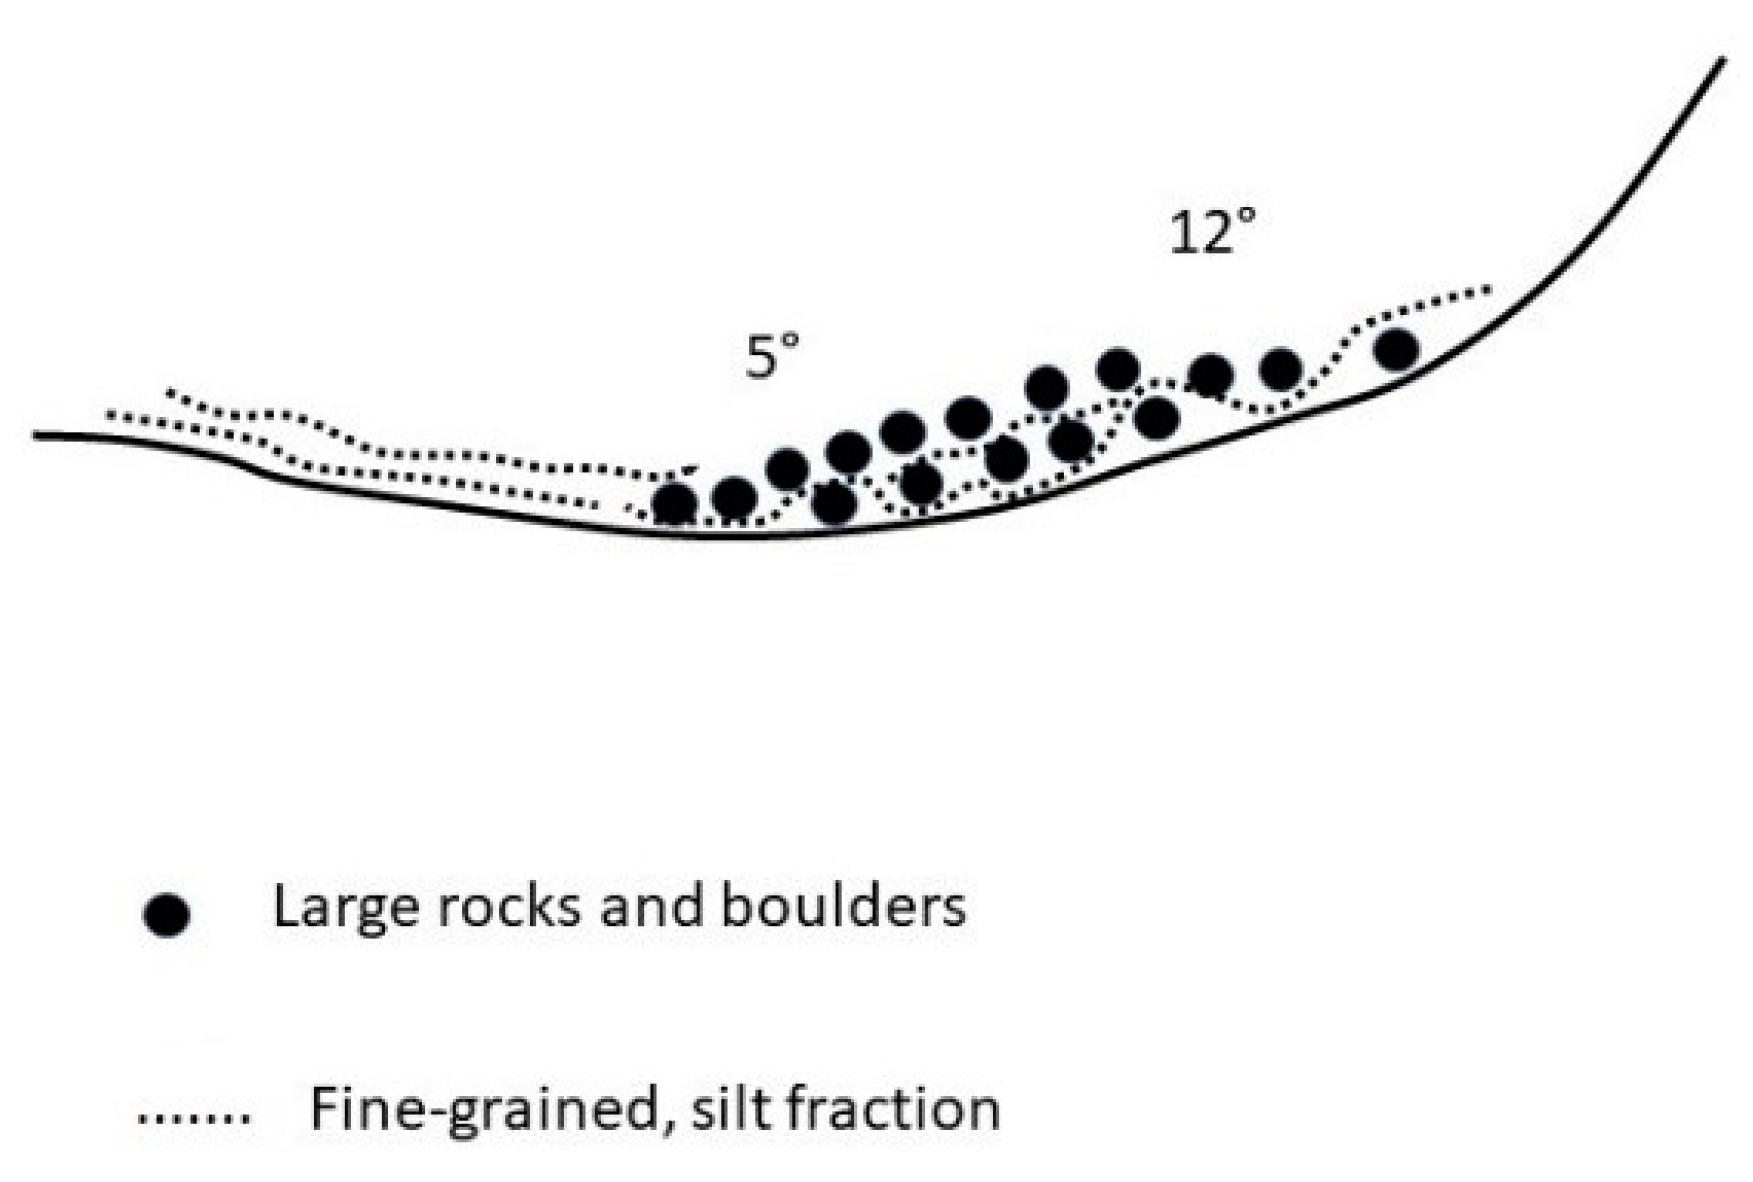
4.1. Geometry and Internal Structure of the Talus Slopes
4.2. Fugleberget Talus Slopes vs. Current Slope Classifications
4.3. Slopes Morphodynamics
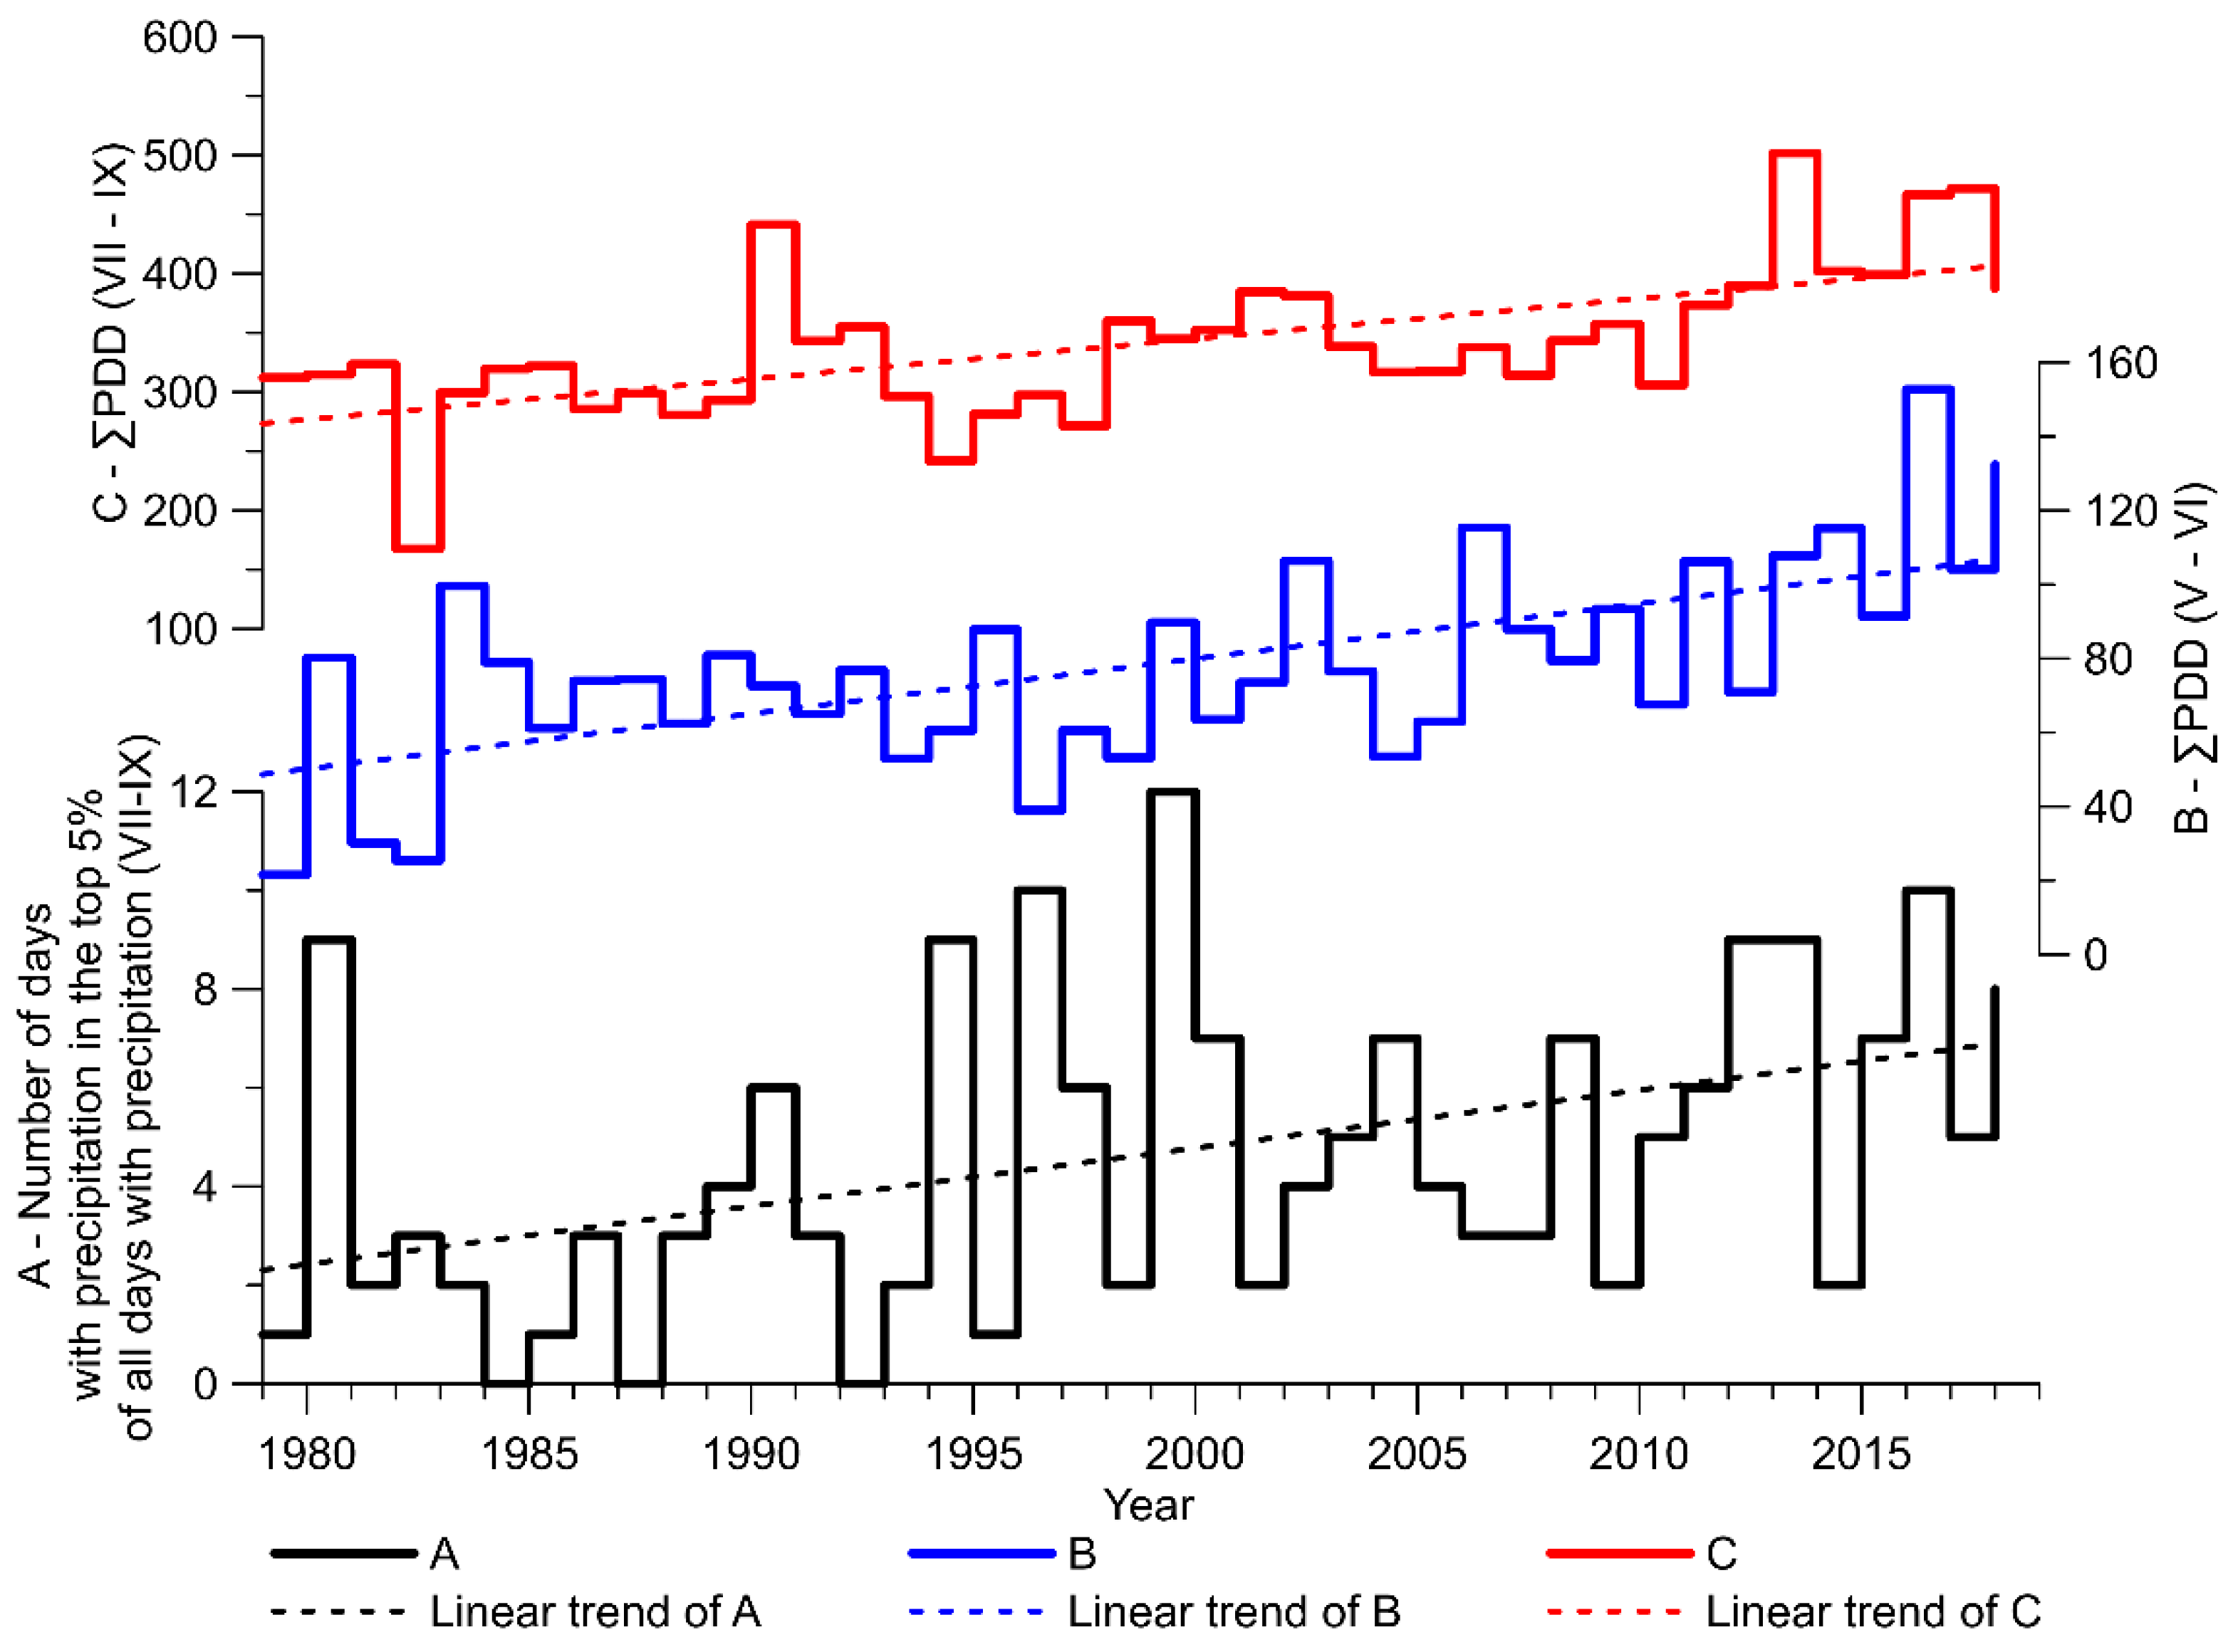
4.4. Climatic Determinants for the Contemporary Slope Activity
5. Conclusions
- The thickness of the weathered material achieved a maximum of 25–30 m on the morphologically active slopes and 15 m on the stabilized slope.
- The stabilized slope is manifested by advanced plant succession.
- There was a tendency towards a slight but systematic growth in the thickness of the debris cover, consisting of fine rock material in the “frontal” part of the talus deposit.
- According to the talus slopes’ observed structure, sharp-edged weathering material derived from the slopes overlapped the marine terrace’s sediment.
- The data from the end of the 1970s show that the climatic indicators contributing to the instability of the slopes and the activation of mass movements on talus cones, such as the frequency of extreme summer rainfalls, the sum of PDD both during the melting of the snow cover (May–June), as well as in the period of permafrost thawing (July–September) show an upward trend.
Author Contributions
Funding
Institutional Review Board Statement
Data Availability Statement
Acknowledgments
Conflicts of Interest
References
- Łoziński, W. Die periglaziale Fazies der mechanischen Verwitterung. In Proceedings of the 11th International Geological Congress, Stockholm, Sweden, 1 January 1910; Volume 1912, pp. 1039–1053. [Google Scholar]
- Ballantyne, C.K. A general model of paraglacial landscape response. Holocene 2002, 12, 371–376. [Google Scholar] [CrossRef]
- Migoń, P. Geomorfologia; PWN: Warszawa, Poland, 2009; pp. 108–142. (In Polish) [Google Scholar]
- Everdigen, R.O. Multi-Language Glossary of Permafrost and Related Ground-Ice Terms. Definitions; The University of Calgary: Calgary, AB, Canada, 1998; pp. 62–63. [Google Scholar]
- Luckman, B.H. Talus slopes. In The Encyclopedia of Quaternary Science; Elias, S.A., Ed.; Elsevier: Amsterdam, The Netherlands, 2013; pp. 556–573. [Google Scholar]
- French, H.M. The Periglacial Environment, 4th ed.; John Wiley & Sons: Hoboken, NJ, USA; Chichester, UK, 2018; p. xxii+515. [Google Scholar]
- Büdel, J. Die Klima-Morphologischen Zonen der Polarländer: Beiträge Zur Geomorphologie Der Klimazonen Und Vorzeitklimate II. Erdkunde 1948, 2, 22–53. [Google Scholar] [CrossRef]
- IPCC 2018. Climate Change: Impacts, Adaptation and Vulnerability; The IPCC Third Assessment Report; Cambridge University Press: Cambridge, UK; New York, NY, USA, 2001. [Google Scholar]
- Dolnicki, P. Charakterystyka Warstwy Czynnej Wieloletniej Zmarzliny na Spitsbergenie, Svalbard (na Przykładzie Równiny Nadmorskiej Fuglebergsletta, Hornsund); Wydawnictwo Uniwersytetu Pedagogicznego: Kraków, Poland, 2020. (In Polish) [Google Scholar]
- Repelewska-Pękalowa, J.; Pękala, K. Reakcja wieloletniej zmarzliny na zmiany klimatu. In Zmiany Klimatyczne w Arktyce i Antarktyce w Ostatnim Pięćdziesięcioleciu XX Wieku i ich Implikacje Środowiskowe; Styszyńska, A., Marsz, A.A., Eds.; Akademia Morska: Gdynia, Poland, 2007; pp. 279–288. (In Polish) [Google Scholar]
- Łupikasza, E. Zmienność występowania opadów deszczu i śniegu w Hornsundzie w okresie lipiec 1978–grudzień 2002. Problemy Klimatologii Polarnej 2003, 13, 93–105. (In Polish) [Google Scholar]
- Osuch, M.A.; Wawrzyniak, T. 40-year High Arctic climatological dataset of the Polish Polar Station Hornsund (SW Spitsbergen, Svalbard). Earth Syst. Sci. Data 2020, 12, 805–815. [Google Scholar] [CrossRef] [Green Version]
- Thiedig, F.; Kresling, A. Meteorologische und geologische Bedingungen bei der Entstehung von Muren im Juli 1972 auf Spitzbergen. Polarforschung 1973, 43, 40–49. [Google Scholar]
- Rapp, A. Slope erosion due to extreme rainfall, with examples from tropical and arctic mountains. Math.-Phys. Kl. 1974, 29, 40–49. [Google Scholar]
- Jahn, A. Quantitative analysis of periglacial processes in Spitsbergen. In Nauki o Ziemi; Uniwersytet Wrocławski, Zeszyty Naukowe Series B. No. 5: Krakow, Poland, 1961; pp. 1–54. [Google Scholar]
- De Haas, T.; Kleinhans, M.G.; Carbonneau, P.E.; Rubensdotterc, L.; Hauber, E.G. Surface morphology of fans in the high-Arctic periglacial environment of Svalbard. Controls and processes. Earth Sci. Rev. 2015, 146, 163–182. [Google Scholar] [CrossRef] [Green Version]
- Akerman, J. Relations between slow slope processes and active-layer thickness 1972–2002, Kapp Linné, Svalbard. Nor. J. Geogr. 2005, 59, 116–128. [Google Scholar] [CrossRef]
- Rączkowska, Z. Współczesna rzeźba peryglacjalna wysokich gór Europy. Prace Geograficzne IGiPZ PAN 2007, 212, 65–70. (In Polish) [Google Scholar]
- Rączkowska, Z. Zróżnicowanie współczesnej rzeźby peryglacjalnej w górach wysokich Europy. Landf. Anal. 2008, 9, 120–122. (In Polish) [Google Scholar]
- Van Steijn, H.; de Ruig, J.; Hoozemans, F. Morphological and mechanical aspects of debris flows in parts of the French Alps. Z. Geomorphol. 1988, 32, 143–161. [Google Scholar] [CrossRef]
- Halles, T.C.; Roering, J.J. Climatic–controlled variations in scree production, Southern Alps, New Zealand. Geology 2005, 33, 701–704. [Google Scholar] [CrossRef]
- Moore, J.R.; Sanders, J.W.; Dietrich, W.E.; Glaser, S.D. Influence of rock mass strength on the erosion rate of alpine cliffs. Earth Surface Process. Landf. 2009, 34, 1339–1352. [Google Scholar] [CrossRef]
- French, H.M. The Peryglacial Environment, 3rd ed.; Wiley and Sons: Hoboken, NJ, USA, 2007; Online Book; Available online: https://0-onlinelibrary-wiley-com.brum.beds.ac.uk/doi/book/10.1002/9781118684931 (accessed on 1 April 2021).
- Ballantyne, C.K.; Harris, C. The Periglaciation of Great Britain; Cambridge University Press: Cambridge, UK, 1994; p. 330. [Google Scholar]
- Birkenmajer, K.; Jania, J.; Pulina, M. Hornsund, Spitsbergen. In Geologia, 1:75000 (Mapa z Objaśnieniem); Uniwersytet Śląski: Katowice, Poland, 1991. (In Polish) [Google Scholar]
- Martini, A. Contemporary periglacial weathering processes of the mountain massifs in the vicinity of Hornsund, SW Spitsbergen. Acta Univ. Wratislawiensis 1986, 966, 45–73. [Google Scholar]
- Werenskioldbreen and Surrounding Areas. Spitsbergen, Svalbard, Norway. Ortophotomap 1:25,000; Jania, J., Kolondra, L., Aas, H.F., Eds.; Uniwersytet Śląski: Katowice, Poland; Norsk Polarinstitutt: Tromsø, Norway, 2002. [Google Scholar]
- Czeppe, Z. Przebieg głównych procesów morfogenetycznych w południowo-zachodnim Spitsbergenie. Zesz. Nauk. Uniw. Jagiellońskiego 1966, 13, 125. (In Polish) [Google Scholar]
- Głowicki, B. Radiation conditions in the Hornsund area (Spitsbergen). Pol. Polar Res. 1985, 6, 331–339. [Google Scholar] [CrossRef] [Green Version]
- Niedźwiedź, T. The main factors forming the climate of the Hornsund (Spitsbergen). Zeszyty Naukowe UJ—Prace Geograficzne 1993, 94, 49–63. [Google Scholar]
- Marsz, A.; Styszyńska, A. Climate and Climate Change at Hornsund, Svalbard; Publishing House Gdynia Maritime Academy: Gdynia, Poland, 2013; p. 402. [Google Scholar]
- Niedźwiedź, T. Wpływ cyrkulacji atmosfery na wysokie opady w Hornsundzie (Spitsbergen). Probl. Klimatol. Polarn. 2002, 12, 65–75. (In Polish) [Google Scholar]
- Leszkiewicz, J.; Głowacki, P. Metamorfoza pokrywy śnieżnej w rejonie południowego Spitsbergenu w sezonie 1992/1993. Probl. Klimatol. Polarn. 2001, 11, 41–54. (In Polish) [Google Scholar]
- Sass, O. Determination of the internal structure of alpine talus deposits using different geophysical methods (Lechtaler Alps, Austria). Geomorphology 2006, 80, 45–58. [Google Scholar] [CrossRef]
- Sass, O. Bedrock detection and talus thickness assessment in the European Alps using geophysical methods. J. Appl. Geophys. 2007, 62, 254–269. [Google Scholar] [CrossRef]
- Otto, J.C.; Sass, O. Comparing geophysical methods for talus slope investigations in the Turtmann valley (Swiss Alps). Geomorphology 2006, 76, 257–272. [Google Scholar] [CrossRef]
- Sass, O.; Krautblatter, M. Debris flow-dominated and rockfall-dominated talus slopes: Genetic models derived from GPR measurements. Geomorphology 2007, 86, 176–192. [Google Scholar] [CrossRef]
- Schrott, L.; Sass, O. Application of field geophysics in geomorphology: Advances and limitations exemplified by case studies. Geomorphology 2008, 93, 55–73. [Google Scholar] [CrossRef]
- Gądek, B.; Grabiec, M.; Kędzia, S. Rzeźba i wybrane element klimatu najwyżej położonych cyrków polodowcowych na przykładzie Koziej Dolniki. Prace Geograficzne 2013, 239, 49–56. [Google Scholar]
- Micheletti, N.; Tonini, M.; Lane, S.N. Geomorphological activity at a rock glacier front detected with a 3D density-based clustering algorithm. Geomorphology 2017, 278, 287–297. [Google Scholar] [CrossRef]
- Pfeiffer, J.; Zieher, T.; Bremer, M.; Wichmann, V.; Rutzinger, M. Derivation of Three-Dimensional Displacement Vectors from Multi-Temporal Long-Range Terrestrial Laser Scanning at the Reissenschuh Landslide (Tyrol, Austria). Remote Sens. 2018, 10, 16–88. [Google Scholar] [CrossRef] [Green Version]
- Gabbud, C.; Micheletti, N.; Lane, S.N. Lidar measurement of surface melt for a temperate Alpine glacier at the seasonal and hourly scales. J. Glaciol. 2015, 61, 963–974. [Google Scholar] [CrossRef] [Green Version]
- Pętlicki, M. Subglacial Topography of an Icefall Inferred from Repeated Terrestrial Laser Scanning. IEEE Geosci. Remote Sens. Lett. 2018, 15, 1461–1465. [Google Scholar] [CrossRef]
- Owczarek, P. Talus cone activity recorded by tree-rings of Arctic dwarf shrubs: A study case from SW Spitsbergen, Norway. Geologija 2010, 52, 34–39. [Google Scholar] [CrossRef]
- Błaszczyk, M.; Laska, M.; Sivertsen, A.; Jawak, S.D. Combined use of aerial photogrammetry and terrestrial laser scanning for detecting geomorphological changes in Hornsund, Svalbard. Remote Sens. 2022, 14, 601. [Google Scholar] [CrossRef]
- Senderak, K.; Kondracka, M.; Gądek, B. Talus slope evolution under the influence of glaciers with the example of slopes near the Hans Glacier, SW Spitsbergen, Norway. Geomorphology 2017, 285, 225–234. [Google Scholar] [CrossRef]
- Senderak, K.; Kondracka, M.; Gądek, B. Postglacial talus slope development imaged by the ERT method: Comparison of slopes from SW Spitsbergen, Norway and Tatra Mountains, Poland. Open Geosci. 2019, 11, 1084–1097. [Google Scholar] [CrossRef]
- Senderak, K.; Kondracka, M.; Gądek, B. Processes controlling the development of talus slopes in SW Spitsbergen. The role of deglaciation and periglacial conditions. Land Degrad Dev. 2021, 32, 208–222. [Google Scholar] [CrossRef]
- Lindner, L.; Pękala, K. Quaternary glaciations of South Spitsbergen and their correlation with Scandinavian glaciations of Poland. Acta Gaologlea Polonica 1983, 33, 169–182. [Google Scholar]
- Kulaszewicz, I.; (University of Gdansk, Poland). Personal communication, 2016.
- Grabiec, M. Stan i Współczesne Zmiany Systemów Lodowcowych Południowego Spitsbergenu w Świetle Badań Metodami Radarowymi; Wydawnictwo Uniwersytetu Śląskiego: Katowice, Poland, 2017. [Google Scholar]
- Dolnicki, P.; Grabiec, M.; Puczko, D.; Gawor, Ł.; Budzik, T.; Klementowski, J. Variability of temperature and thickness of permafrost active layer at coastal sites of Svalbard. Pol. Polar Res. 2013, 34, 353–374. [Google Scholar] [CrossRef] [Green Version]
- Gądek, B.; Grabiec, M.; Kędzia, S.; Rączkowska, Z. Reflection of climate changes in the structure and morphodynamics of talus slopes (the Tatra Mountains, Poland). Geomorphology 2016, 263, 39–49. [Google Scholar] [CrossRef]
- Herz, T.; King, L.; Gubler, H. Microclimate within coarse debris of talus slopes in the alpine periglacial belt and its effect on permafrost. In Proceedings of the 8th International Conference on Permafrost; IPA: Zurich, Switzerland, 2003; pp. 383–388. [Google Scholar]
- Traczyk, A.; Korabiewski, B. Pełznięcie pokryw gruzowych na stokach Fugleberget w Hornsundzie (SW Spitsbergen), In Środowisko Przyrodnicze Obszarów Polarnych; Kowalska, A., Latocha, A., Marszałek, H., Pereyma, J., Eds.; Uniwersytet Wrocławski: Wroclaw, Poland, 2008; pp. 89–95. (In Polish) [Google Scholar] [CrossRef]
- Pisabarro, A.; Pellitero, R.; Serrano, E.; Gómez-Lende, M.; Gonzalez-Trueba, J.J. Ground temperatures, landforms and processes in an Atlantic mountain. Cantabrian Mountains (Northern Spain). Catena 2017, 149, 623–636. [Google Scholar] [CrossRef] [Green Version]
- André, M.F. Holocene Climate Fluctuations and Geomorphic Impact of Extreme Events in Svalbard. Geografiska Annaler. Ser. A Phys. Geogr. 1995, 77, 241–250. [Google Scholar] [CrossRef]
- Rebetez, M. Climatic Change and Debris Flows in High Mountain Regions: The Case Study of The Ritigraben Torrent (Swiss Alps); Springer: Berlin/Heidelberg, Germany, 1997; Volume 36, pp. 371–389. [Google Scholar]
- Owczarek, P.; Laatocha, A.; Wistuba, M.; Malik, I. Reconstruction of modern debris flow activity in the arctic environment with the use of dwarf shrubs (south-western Spitsbergen)—A new dendrochronological approach. Zeitschrift für Geomorphologie 2013, 57, 75–95. [Google Scholar] [CrossRef]
- Łupikasza, E. Long-term variability of extreme precipitation in Hornsund (Spitsbergen) and their relation with atmospheric circulation. Probl. Klimatol. Polarn. 2007, 17, 87–103. [Google Scholar]
- Łupikasza, E. Change in precipitation intensity in Hornsund (Spitsbergen) in the 1978–2008 period. Problemy Klimatologii Polarnej 2009, 19, 169–188. [Google Scholar]
- Wawrzyniak, T.; Osuch, M. Daily Precipitation (1979–2018) at the Arctic Meteorological Station Hornsund, Spitsbergen; PANGAEA: Bremen, Germany, 2019. [Google Scholar] [CrossRef]
- Wawrzyniak, T.; Osuch, M. Daily Mean Air Temperature (1979–2018) at the Arctic Meteorological Station Hornsund, Spitsbergen; PANGAEA: Bremen, Germany, 2019. [Google Scholar] [CrossRef]


Publisher’s Note: MDPI stays neutral with regard to jurisdictional claims in published maps and institutional affiliations. |
© 2022 by the authors. Licensee MDPI, Basel, Switzerland. This article is an open access article distributed under the terms and conditions of the Creative Commons Attribution (CC BY) license (https://creativecommons.org/licenses/by/4.0/).
Share and Cite
Dolnicki, P.; Grabiec, M. The Thickness of Talus Deposits in the Periglacial Area of SW Spitsbergen (Fugleberget Mountainside) in the Light of Slope Development Theories. Land 2022, 11, 209. https://0-doi-org.brum.beds.ac.uk/10.3390/land11020209
Dolnicki P, Grabiec M. The Thickness of Talus Deposits in the Periglacial Area of SW Spitsbergen (Fugleberget Mountainside) in the Light of Slope Development Theories. Land. 2022; 11(2):209. https://0-doi-org.brum.beds.ac.uk/10.3390/land11020209
Chicago/Turabian StyleDolnicki, Piotr, and Mariusz Grabiec. 2022. "The Thickness of Talus Deposits in the Periglacial Area of SW Spitsbergen (Fugleberget Mountainside) in the Light of Slope Development Theories" Land 11, no. 2: 209. https://0-doi-org.brum.beds.ac.uk/10.3390/land11020209