
The Perception of the Vertical Dimension (3D) through the Lens of Different Stakeholders in the Property Market of China

 ,
,  ,
,  ,
,  ,
, 
Abstract
:1. Introduction
2. Materials and Methods
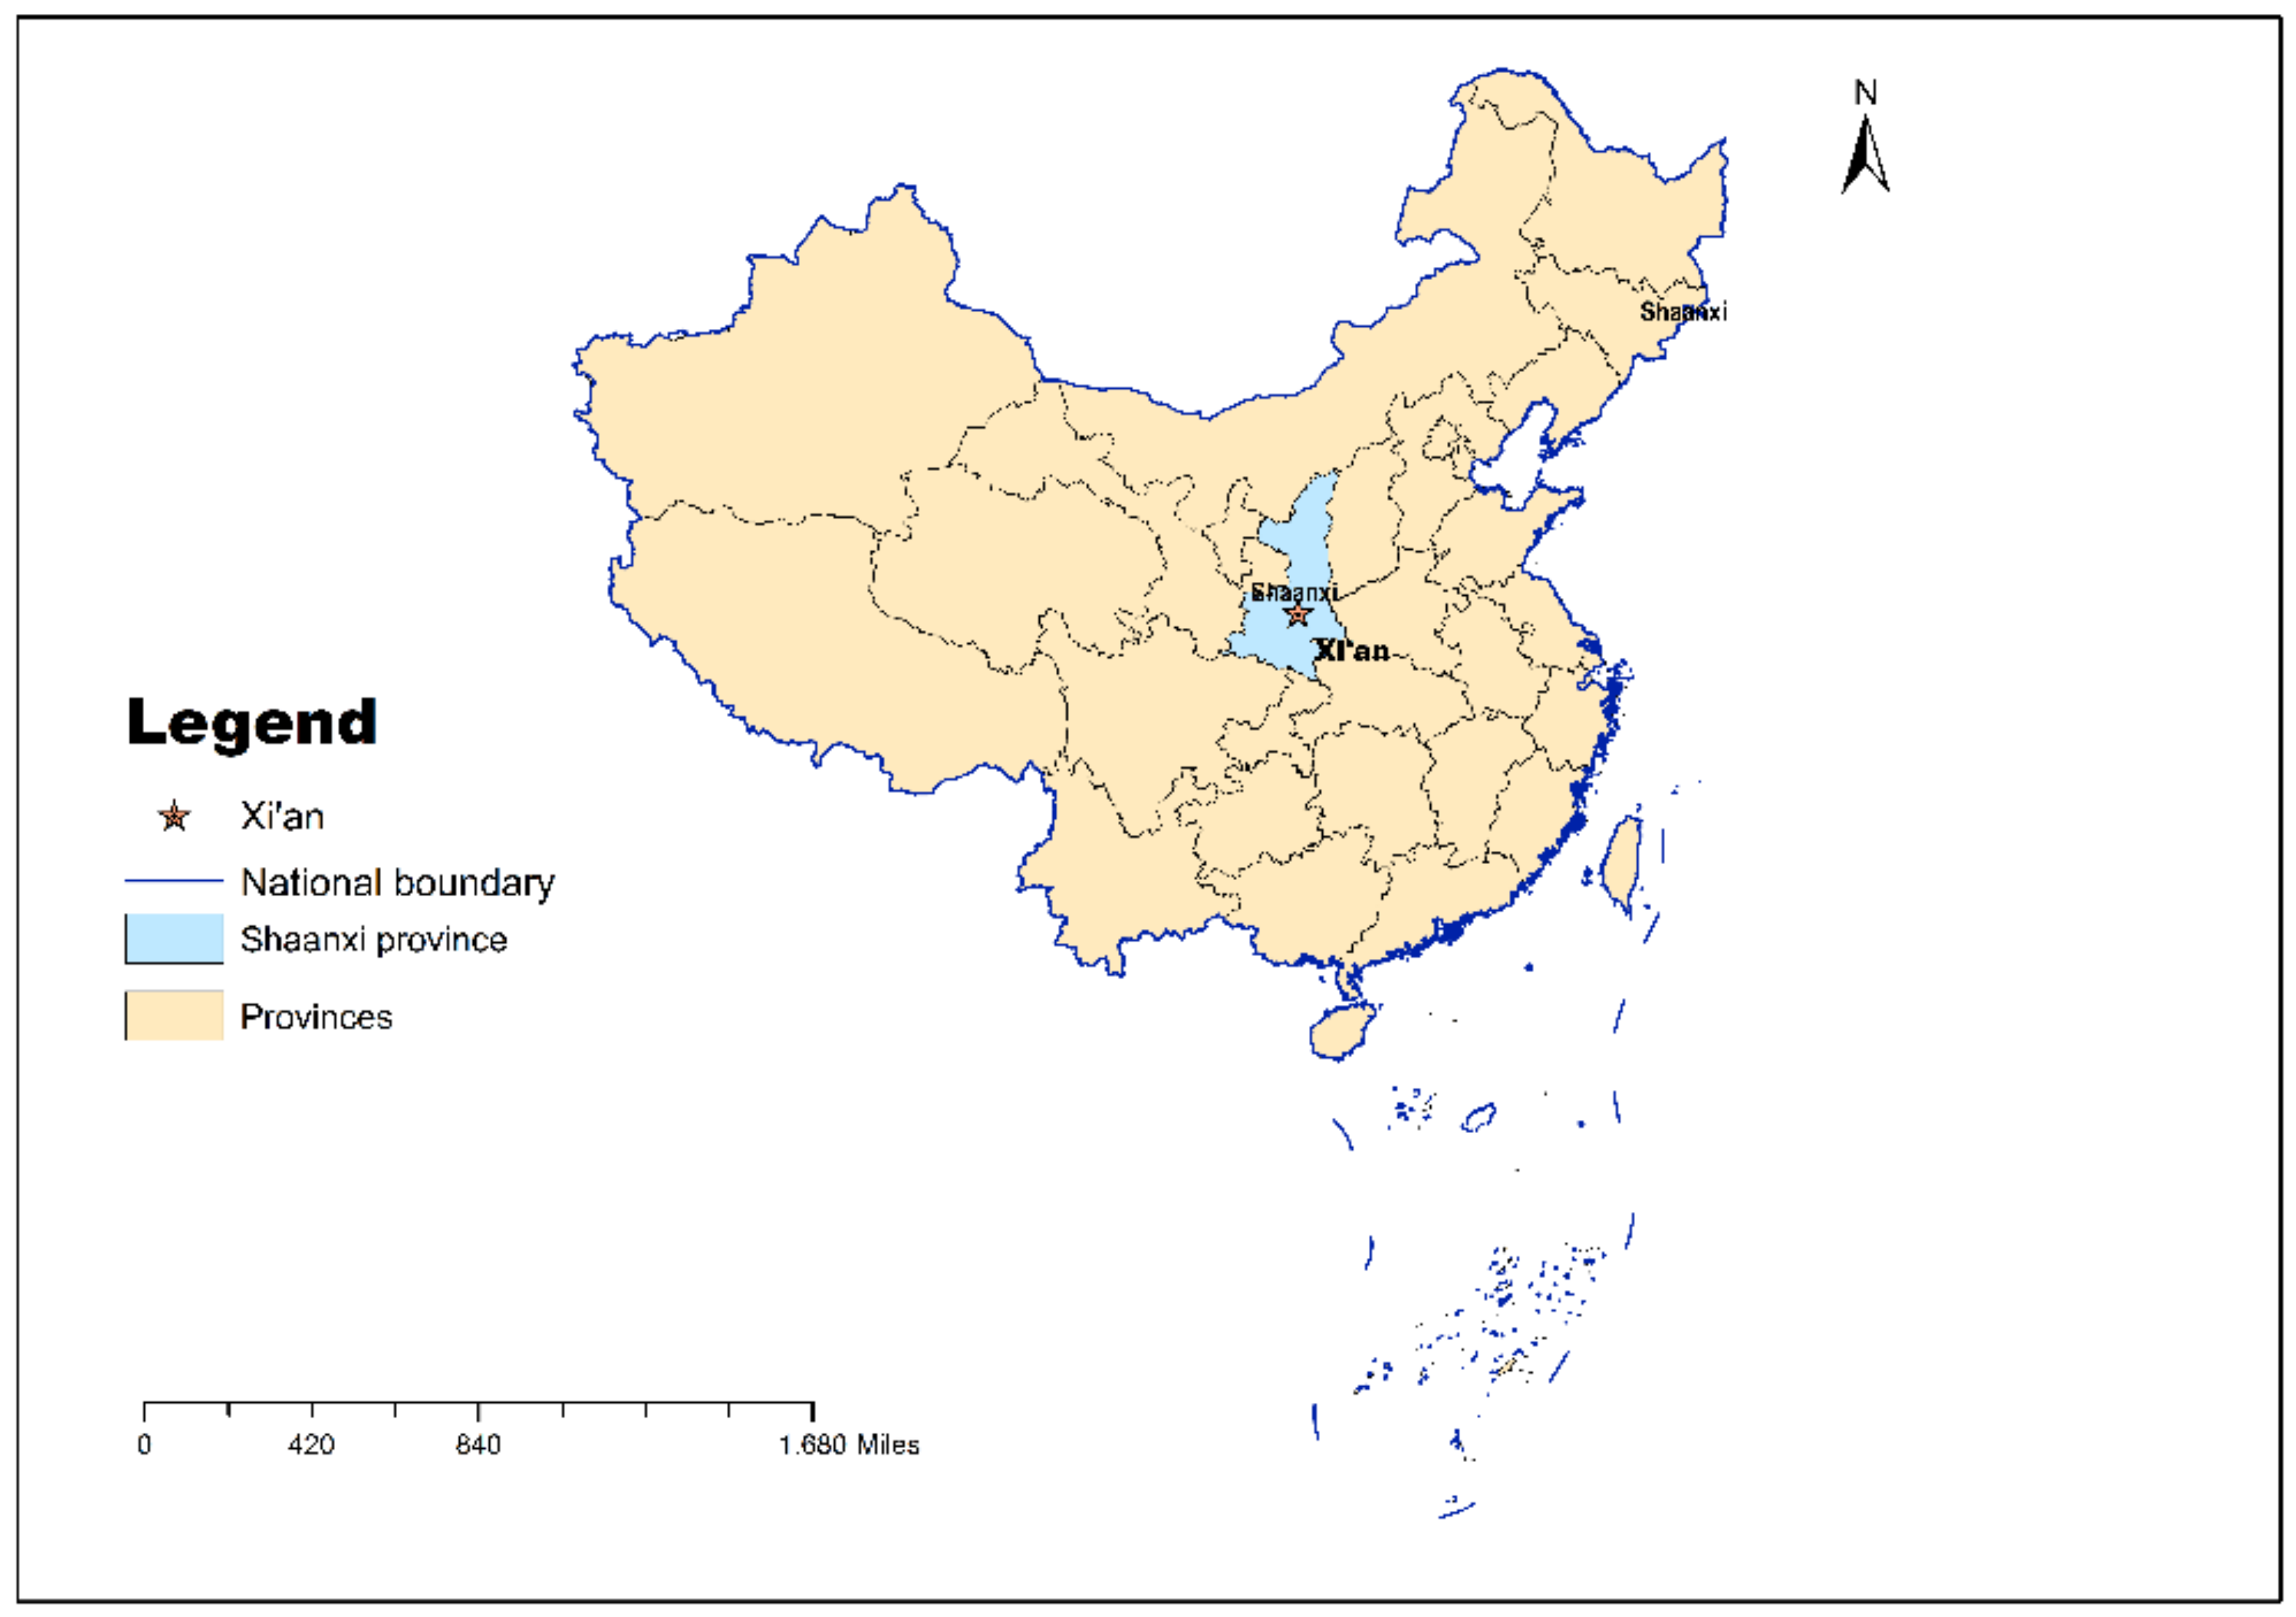
2.1. Study Area
2.2. Research Design and Data Preparation
2.3. Semi-Structured Expert Interviews and Focus Groups
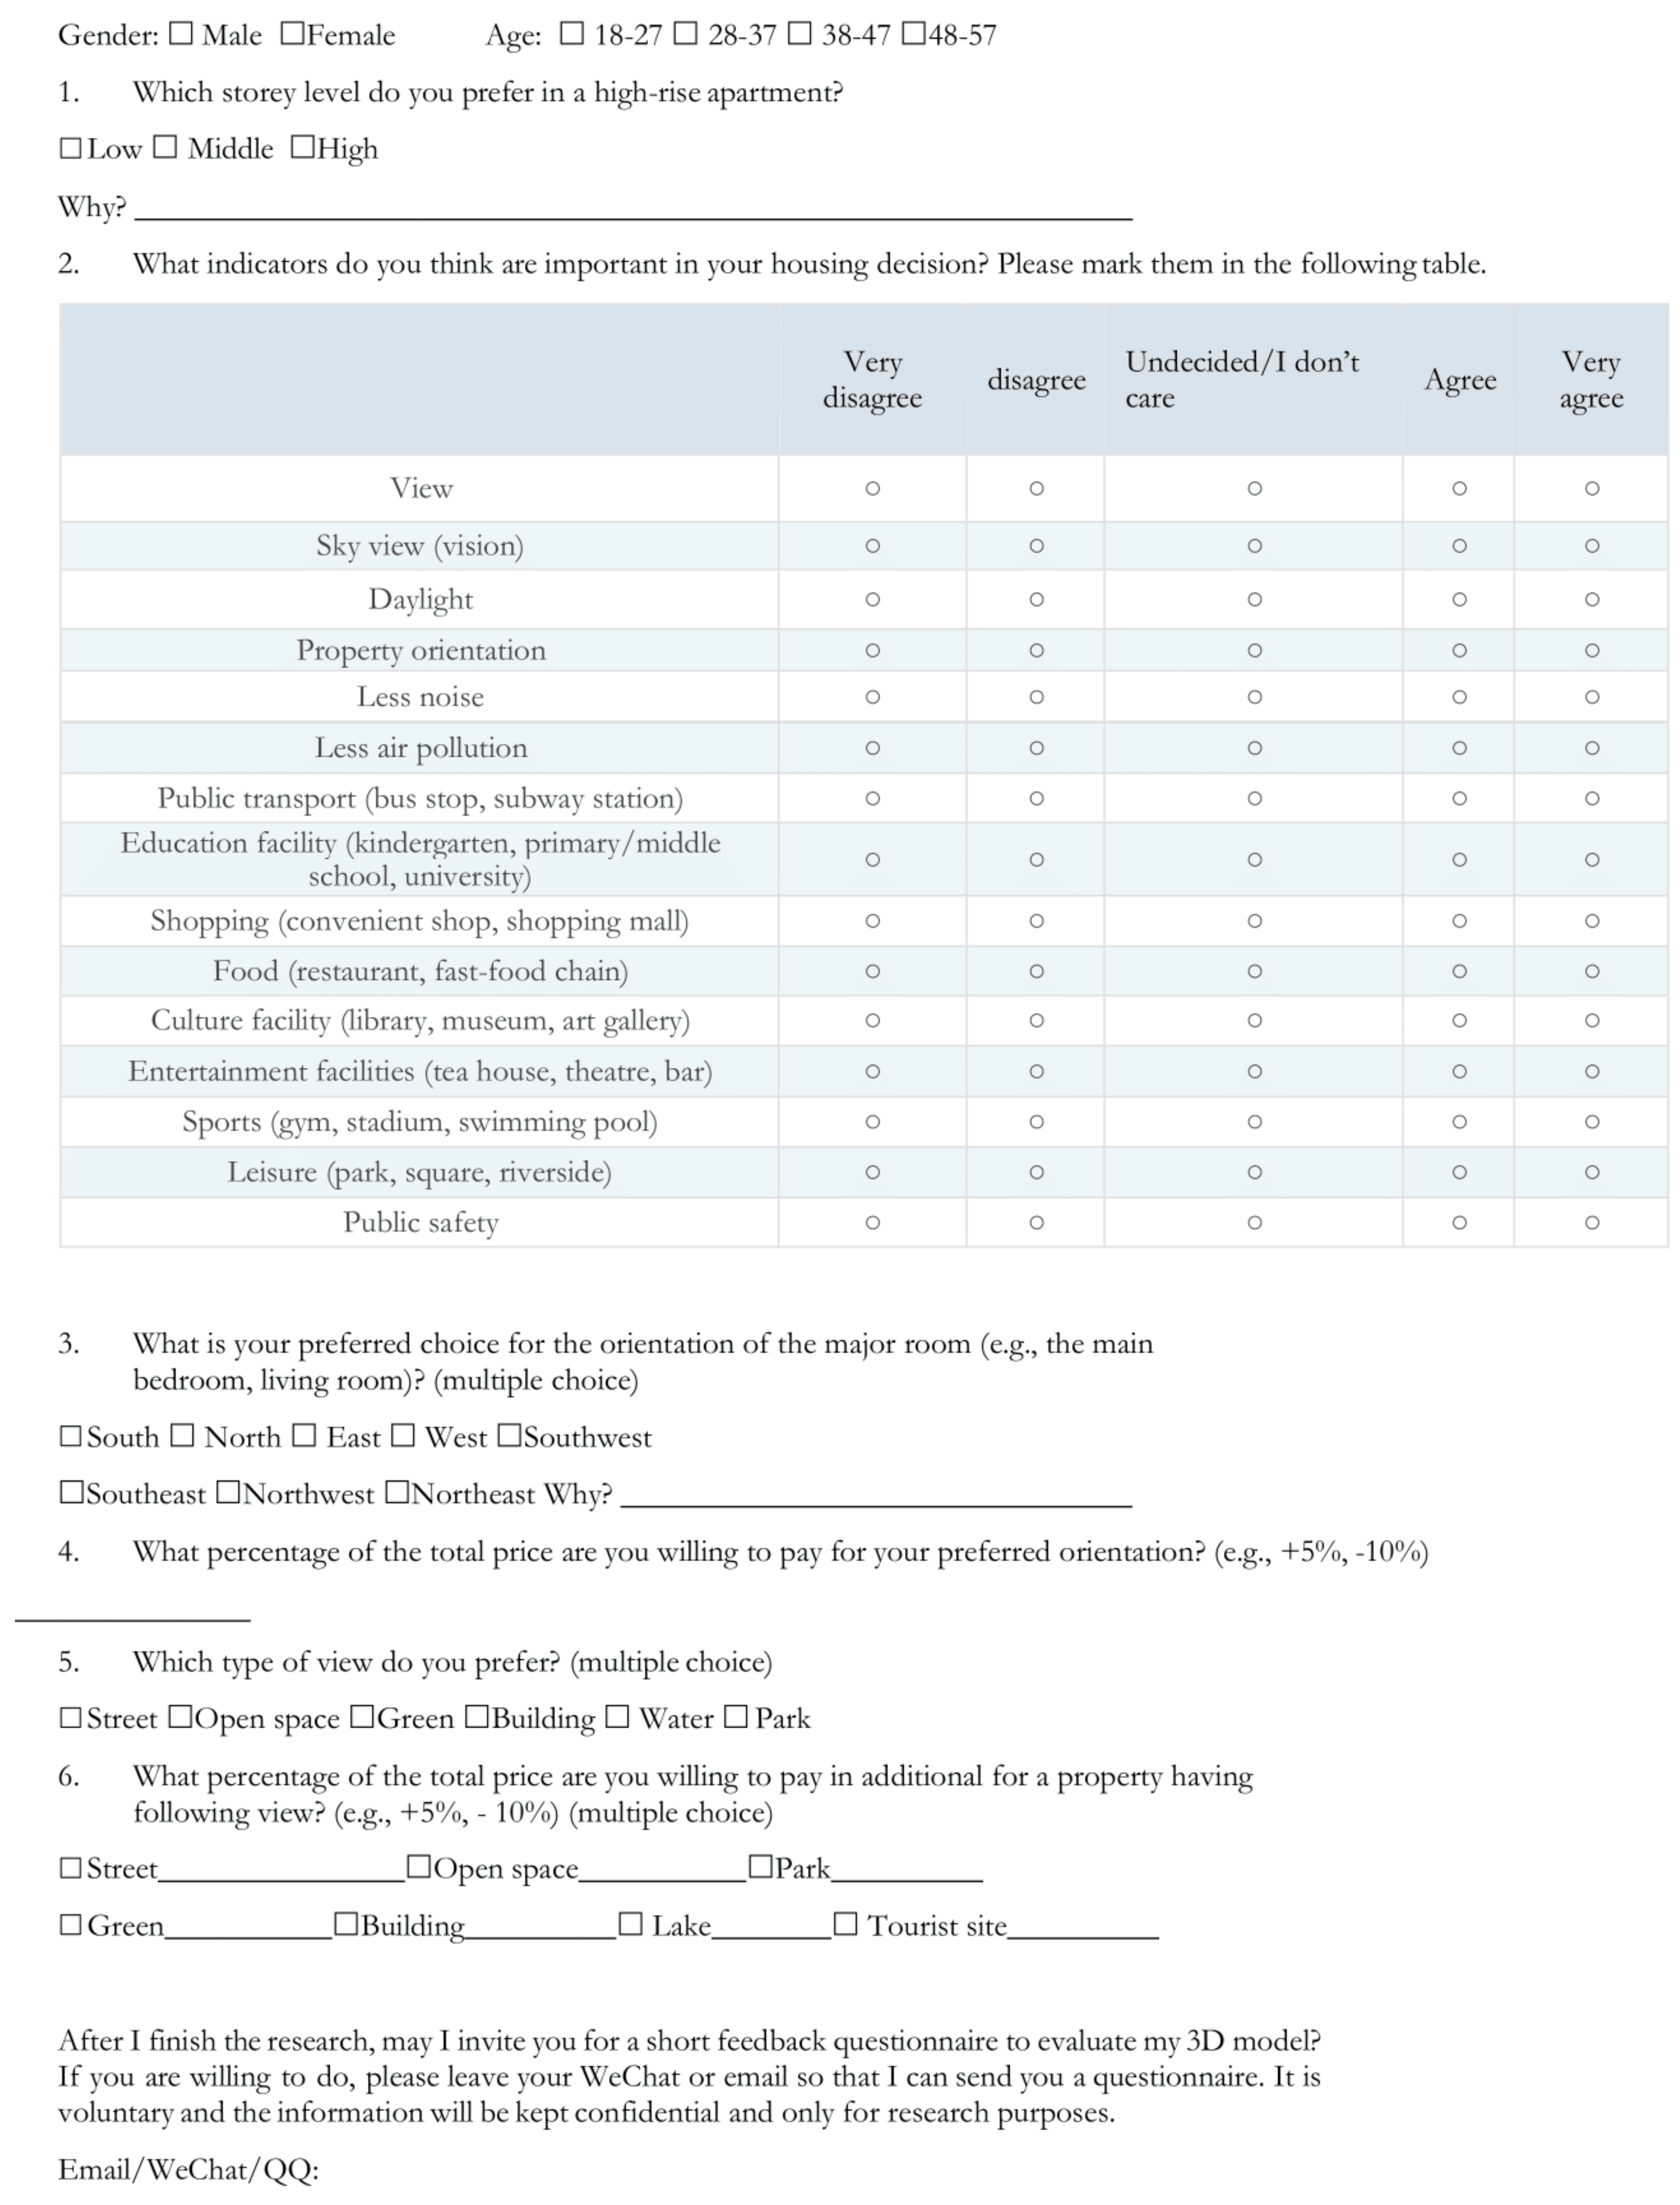
2.4. Questionnaire (Paper-Based and Online)
- Question 1: investigates the respondents’ preferred story level. Three options are given, including the low story level (1st–10th), middle story level (11th–20th), and high story level (21st–30th). A high-rise building with 30 stories is used as a typical example, in a high-rise neighborhood. The respondents are asked to indicate their reasons.
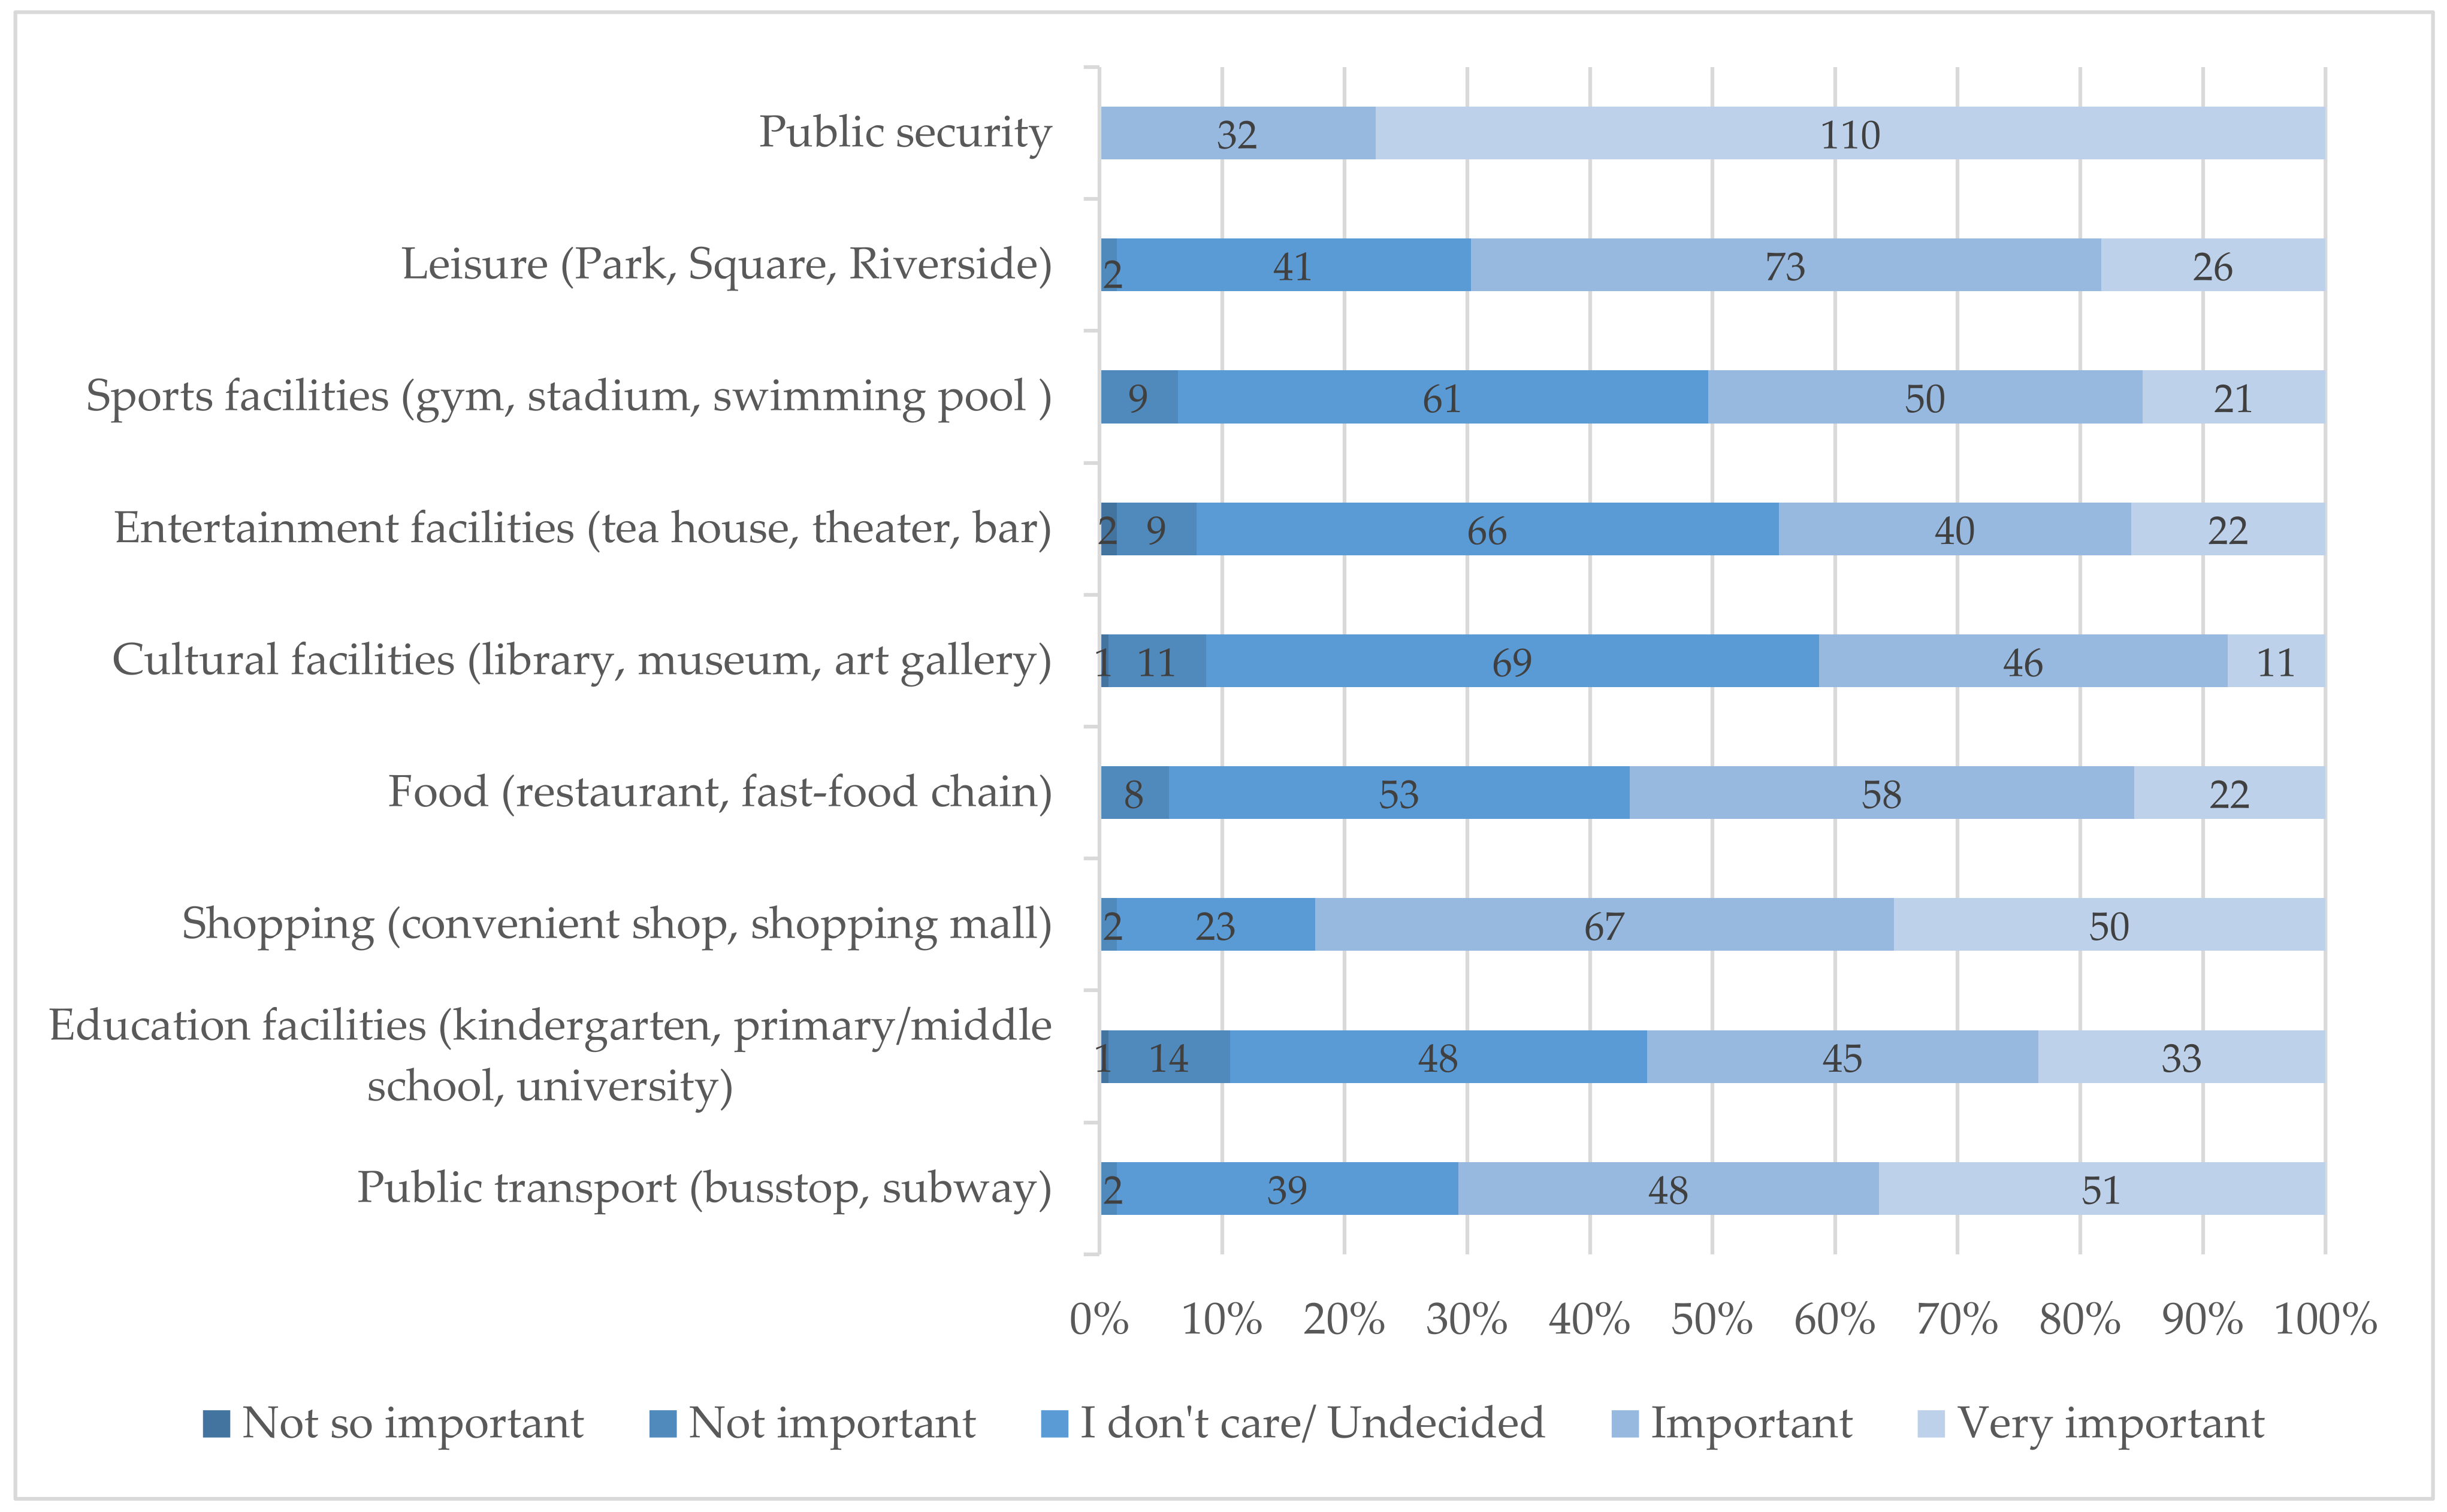
- Question 2: investigates the respondents’ preferences for various locational and environmental factors (both 2D and 3D) on a five-point Likert scale (a single choice), namely, not important at all (−2), not important (−1), Undecided/I don’t care (0), important (1), and very important (2).
- Question 3: the respondents are asked for preferred property orientation (a single choice), for which the major rooms’ (main bedroom and living room) orientation is taken as a proxy. In Chinese culture, these rooms are regarded as the most important rooms in properties within high-rise buildings. The respondent’s reasons should be given.
- Question 4: continues, based on question 3, and asks about their willingness to pay (WTP) for preferred orientation (a single choice). The spillover amount is the ratio of the extra amount to the total property price. The currency is the Chinese Yuan (CNY).
- Similarly, Questions 5 and 6, investigate the preferences and WTP for specific view types (multiple choices).
3. Knowledge from Developers and Local Government
3.1. The Pricing Workflow of Developers
3.2. The Housing Policy of the Local Government
3.3. The Factors behind the Price Variation
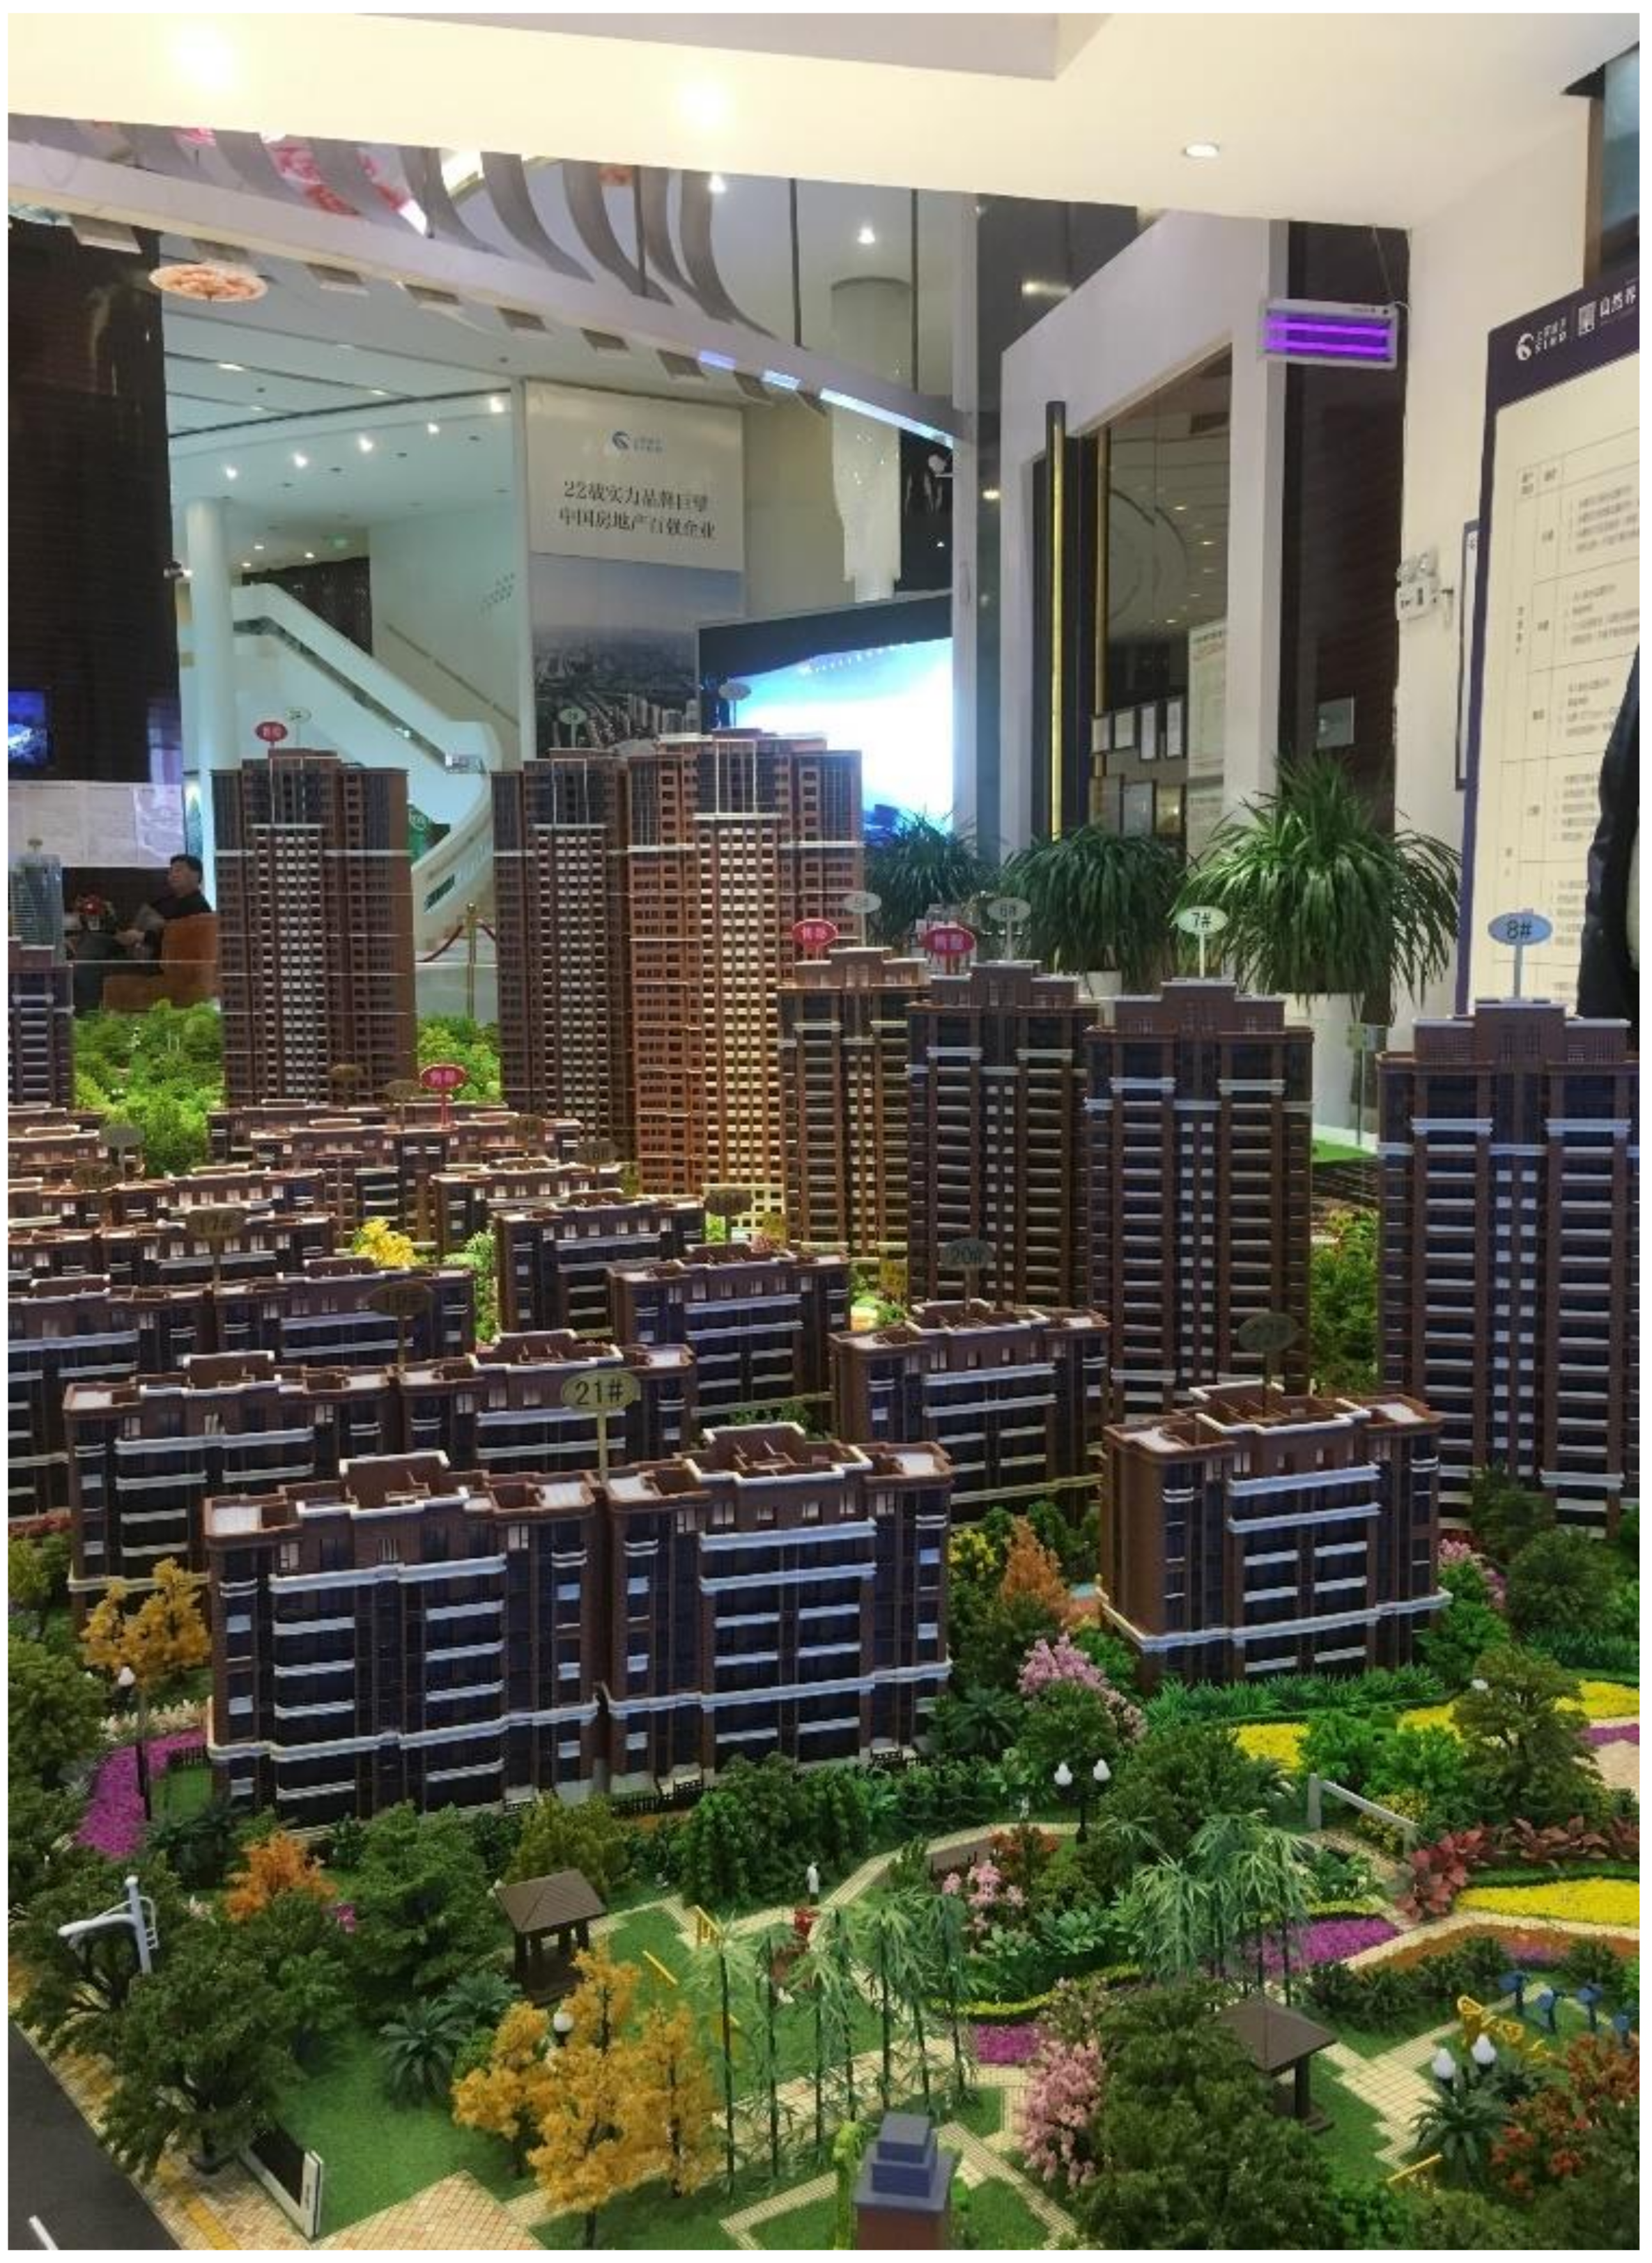
4. Current Status of 3D Modeling in Xi’an
4.1. Real Estate Developers
4.2. Home Buyers
4.3. Local Government (in Practice, from Government-Related Institutions)
5. Questionnaire on Buyers’ Preferences
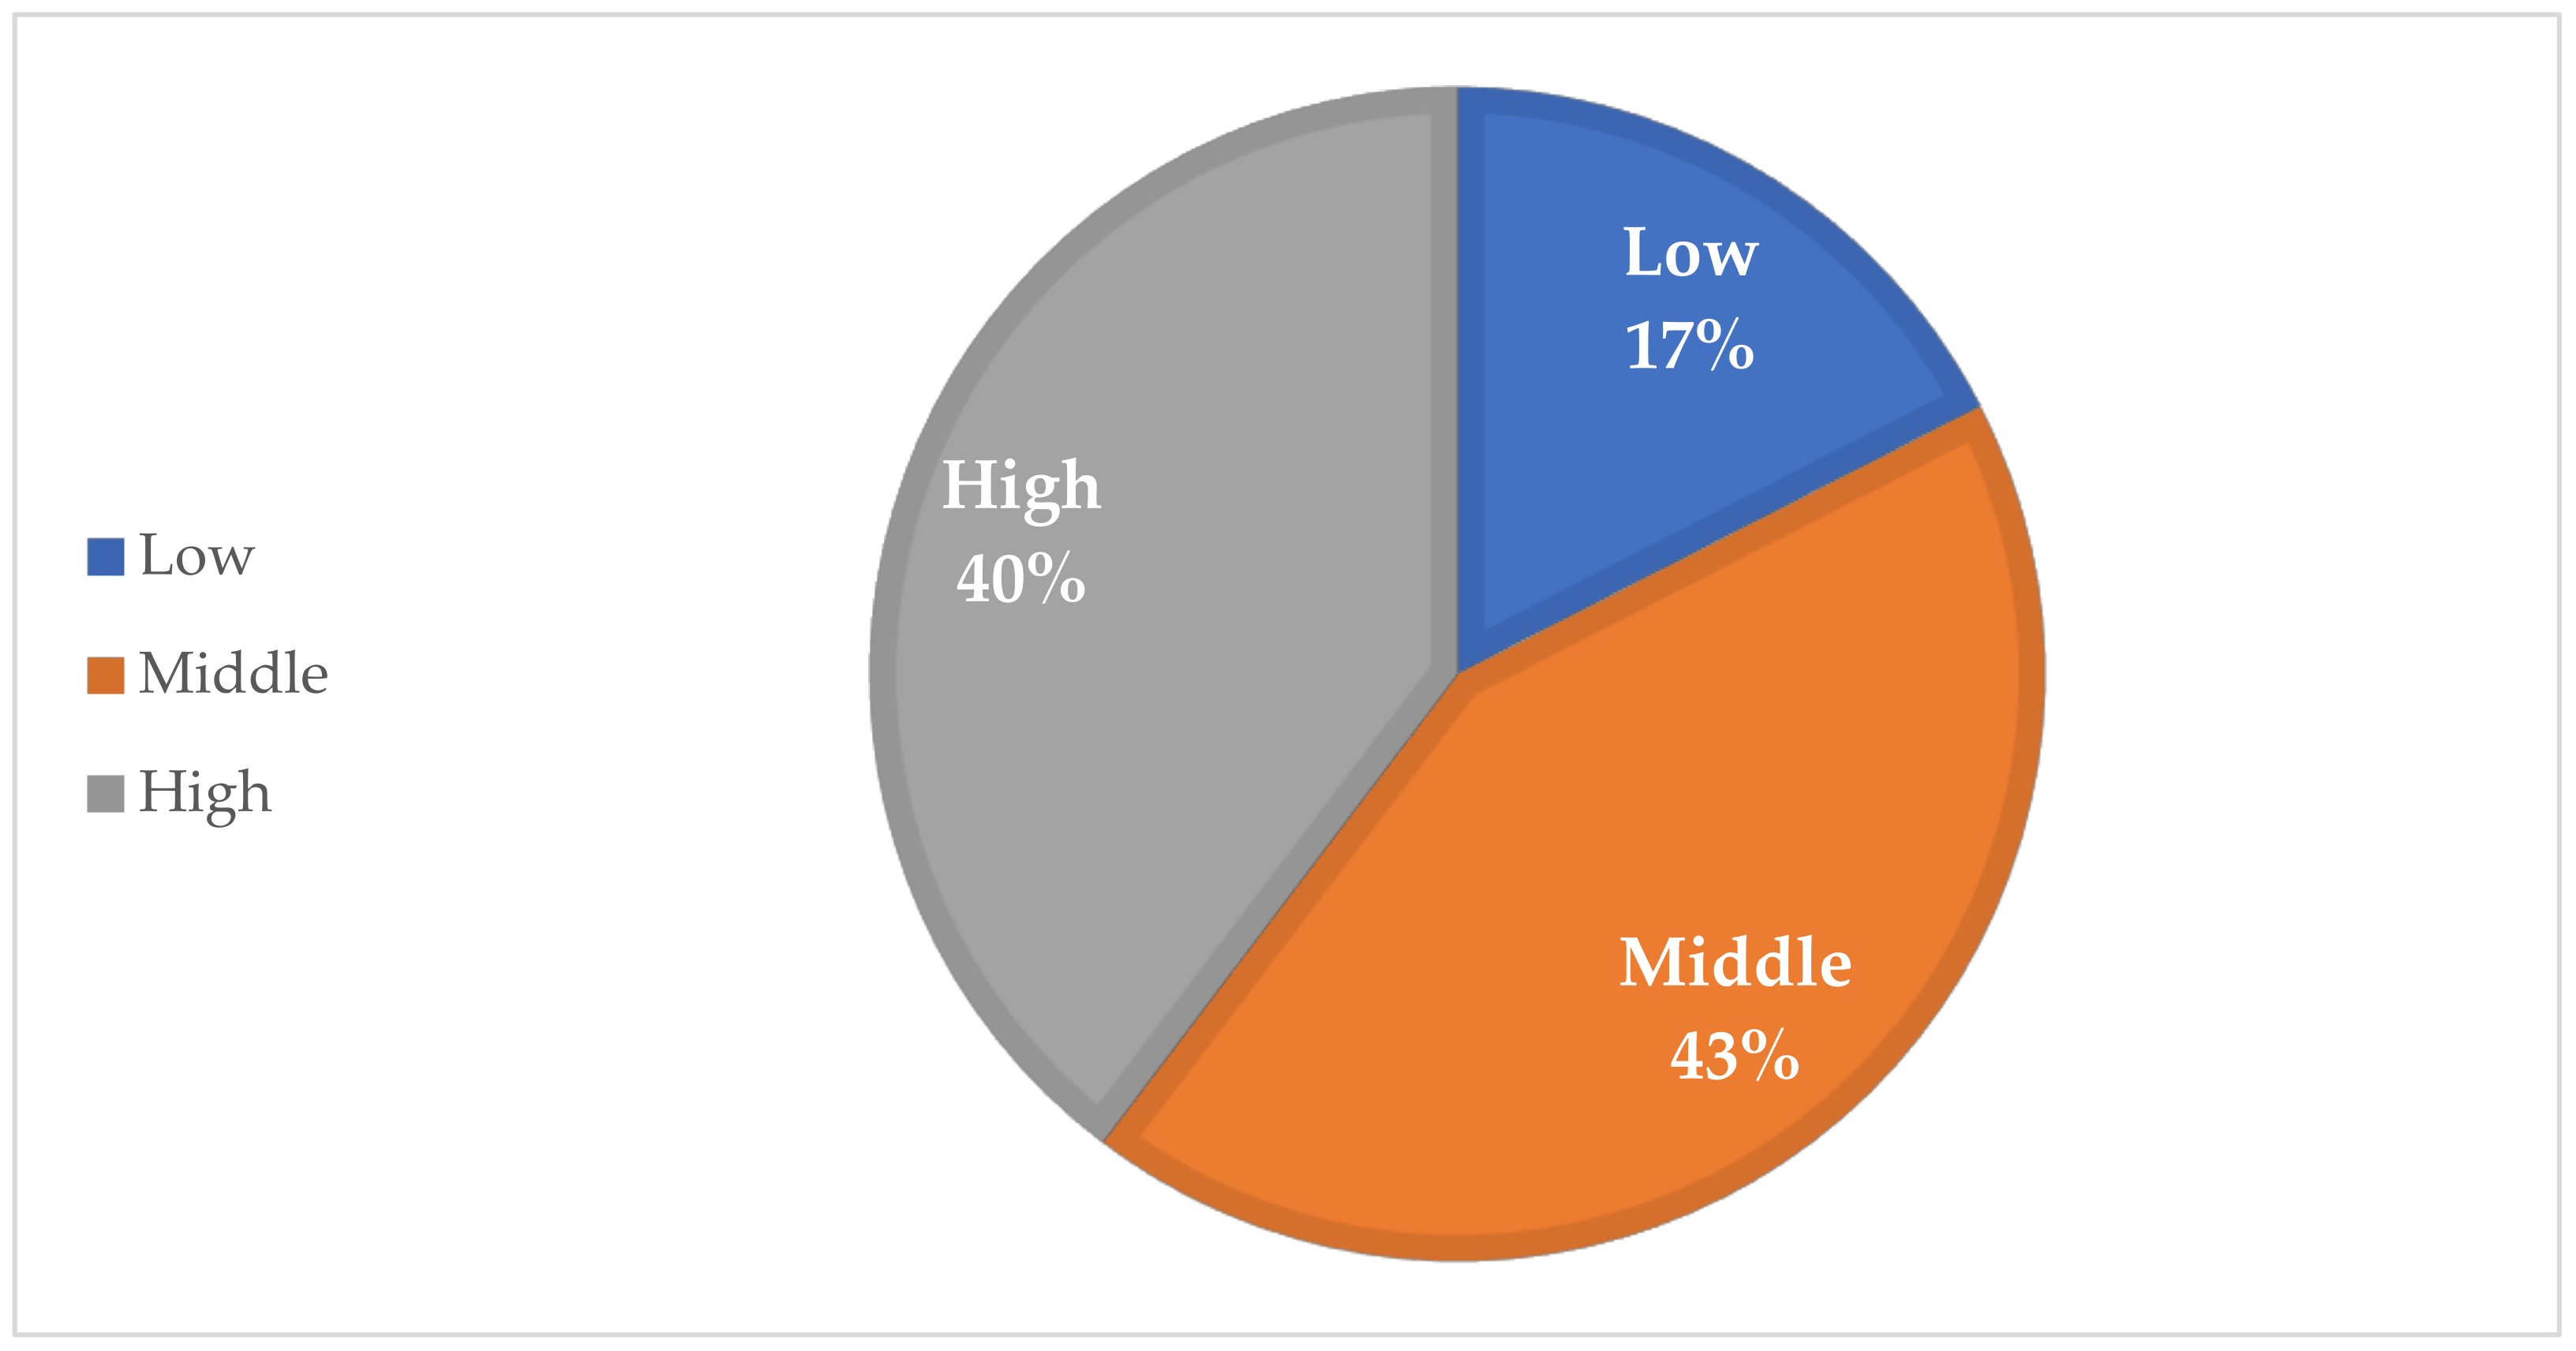
5.1. The Story Levels
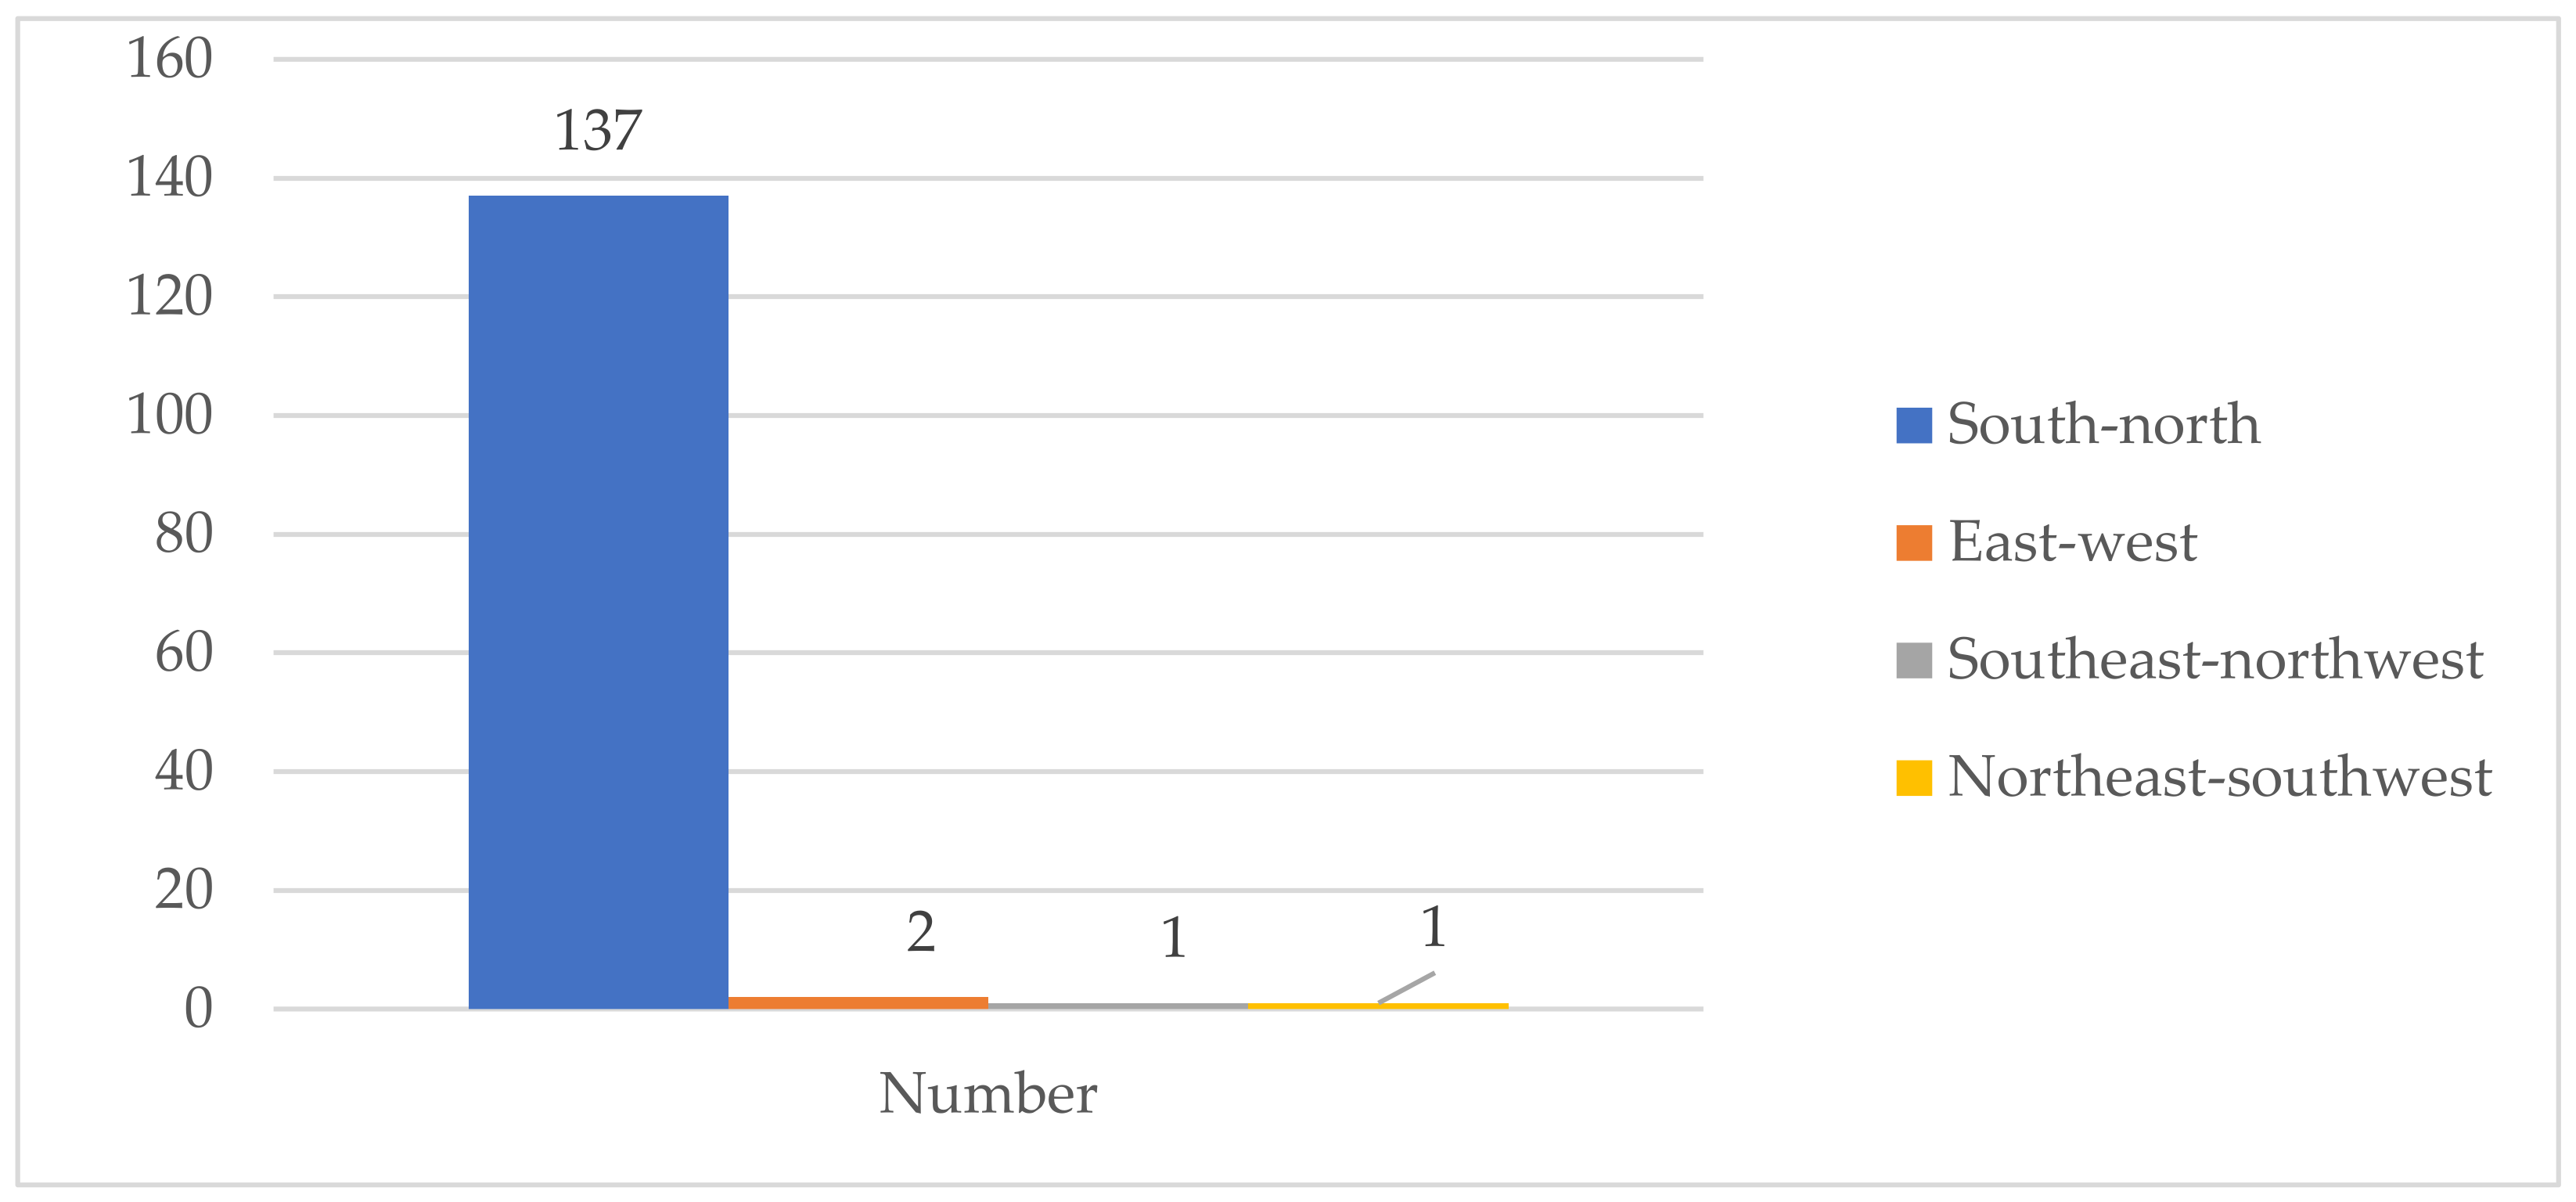
5.2. Property Orientation
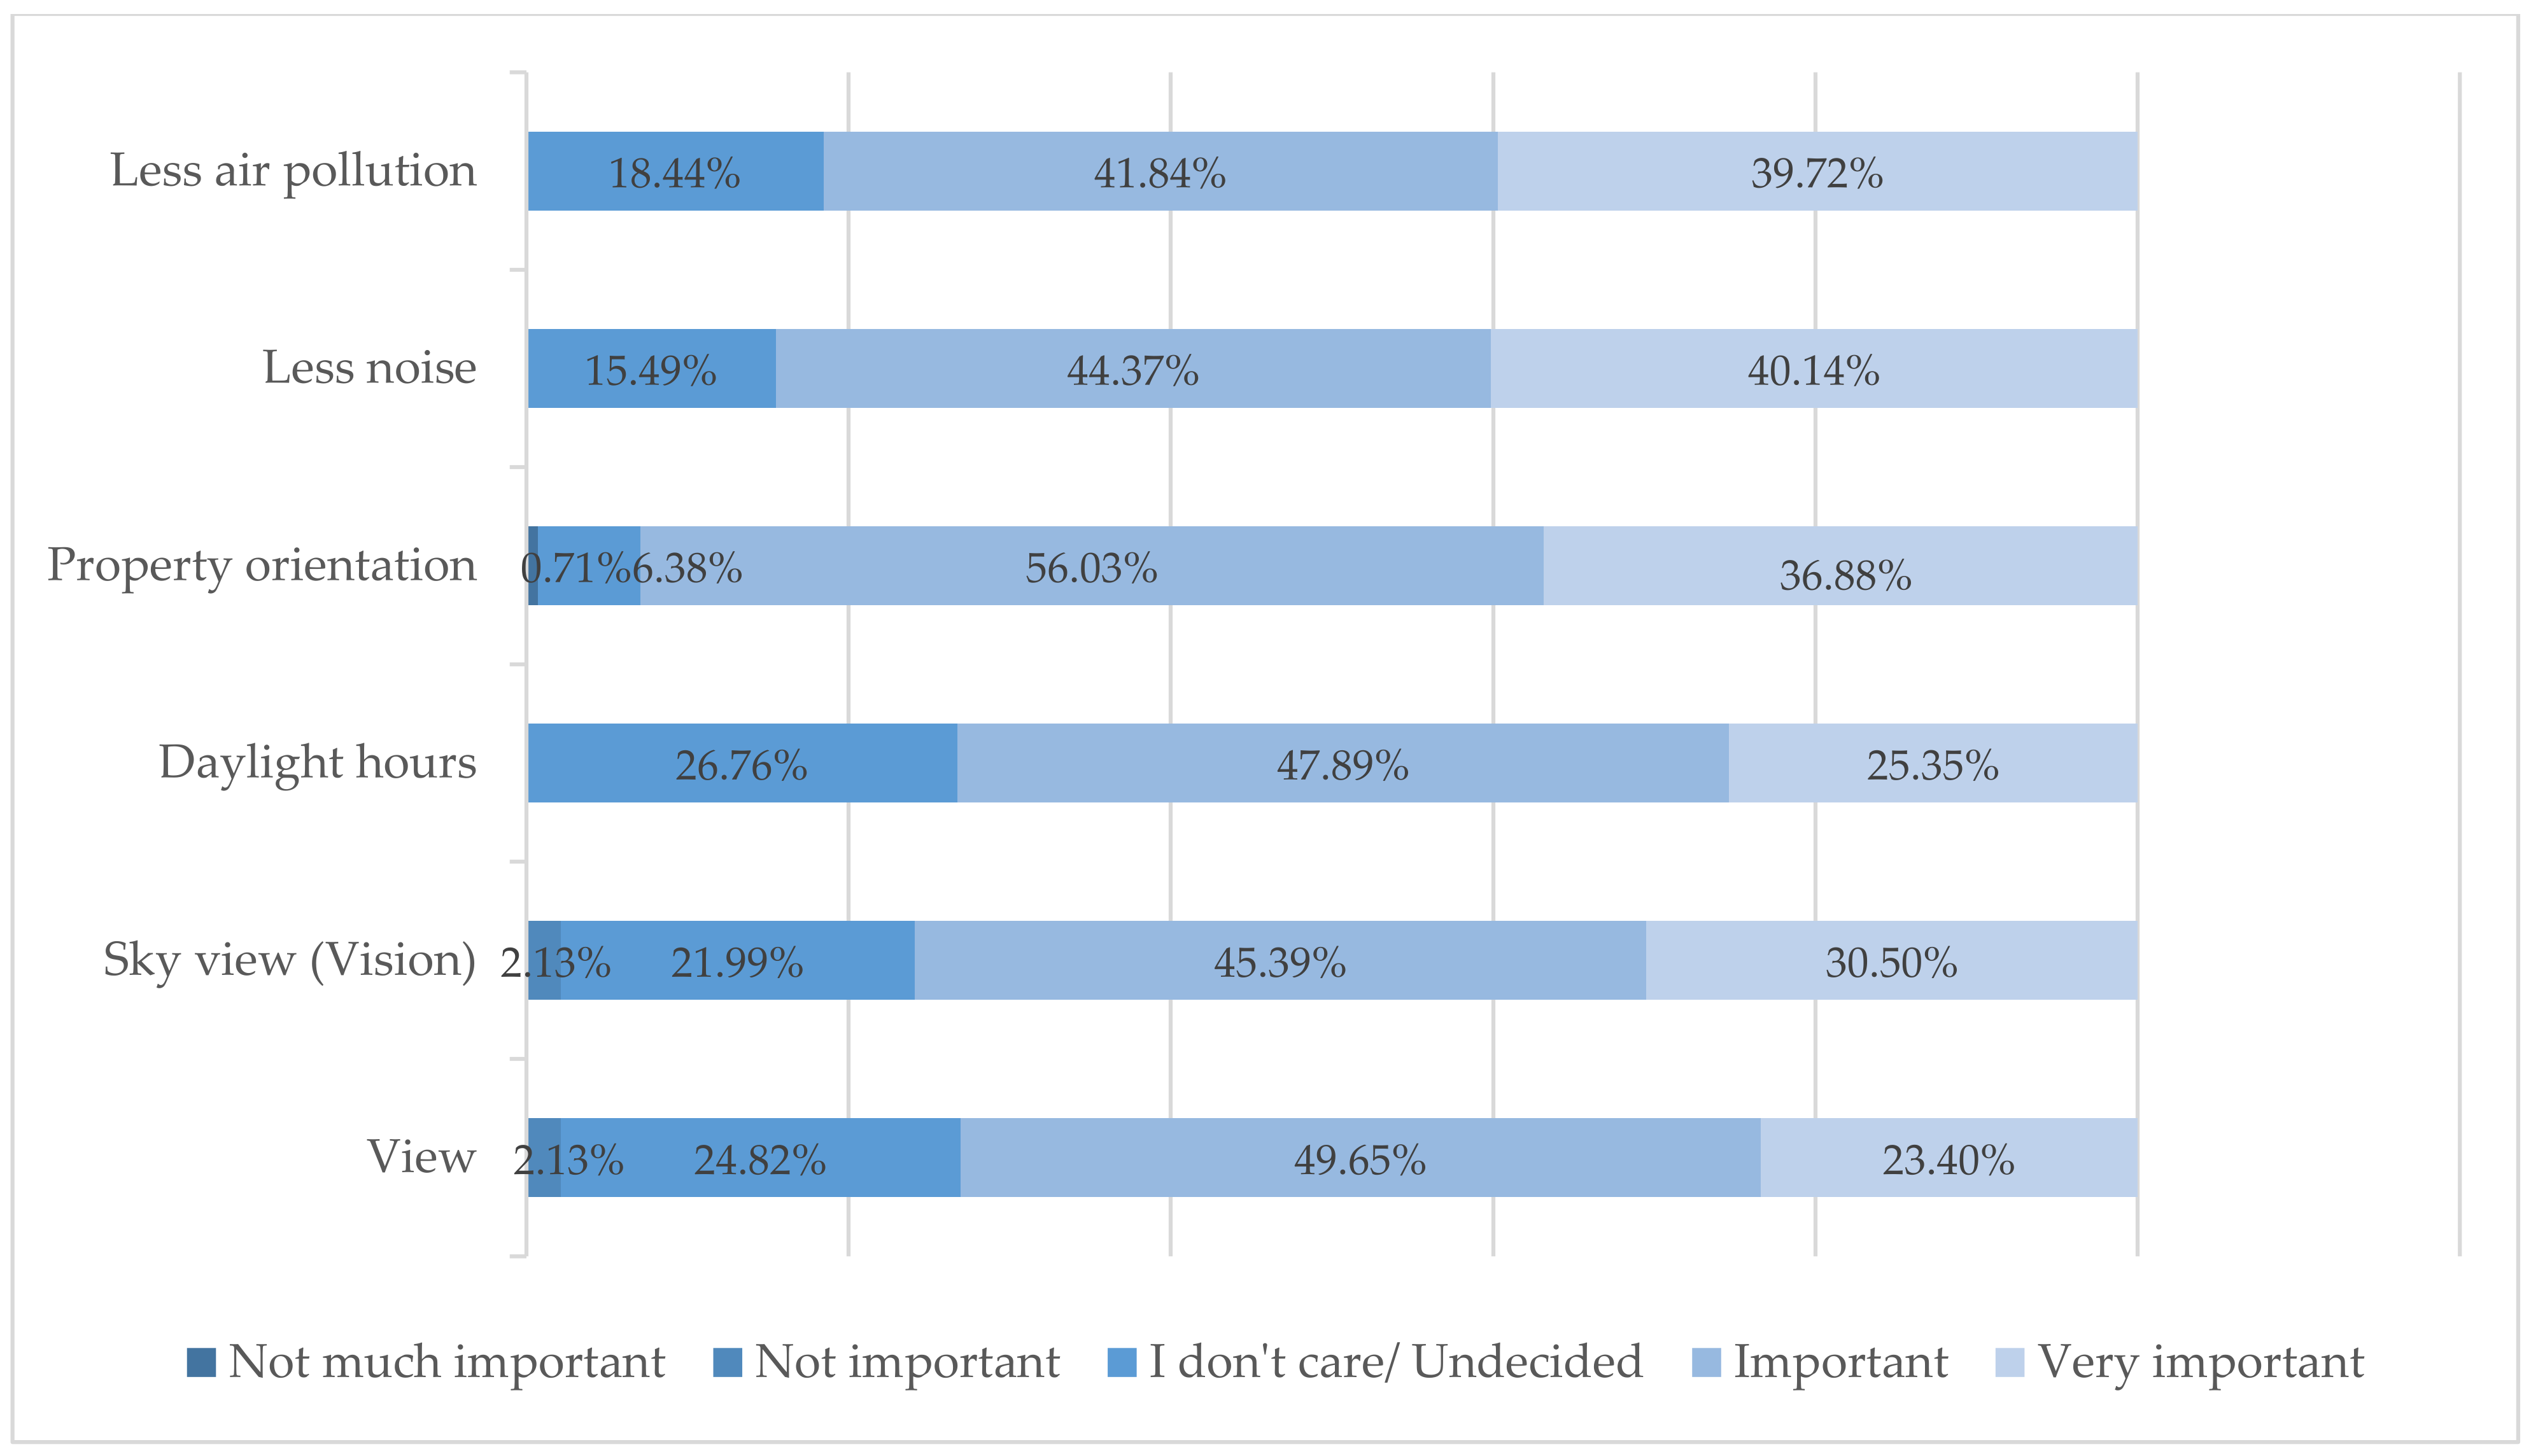
5.3. Environmental and Locational Factors (2D and 3D)
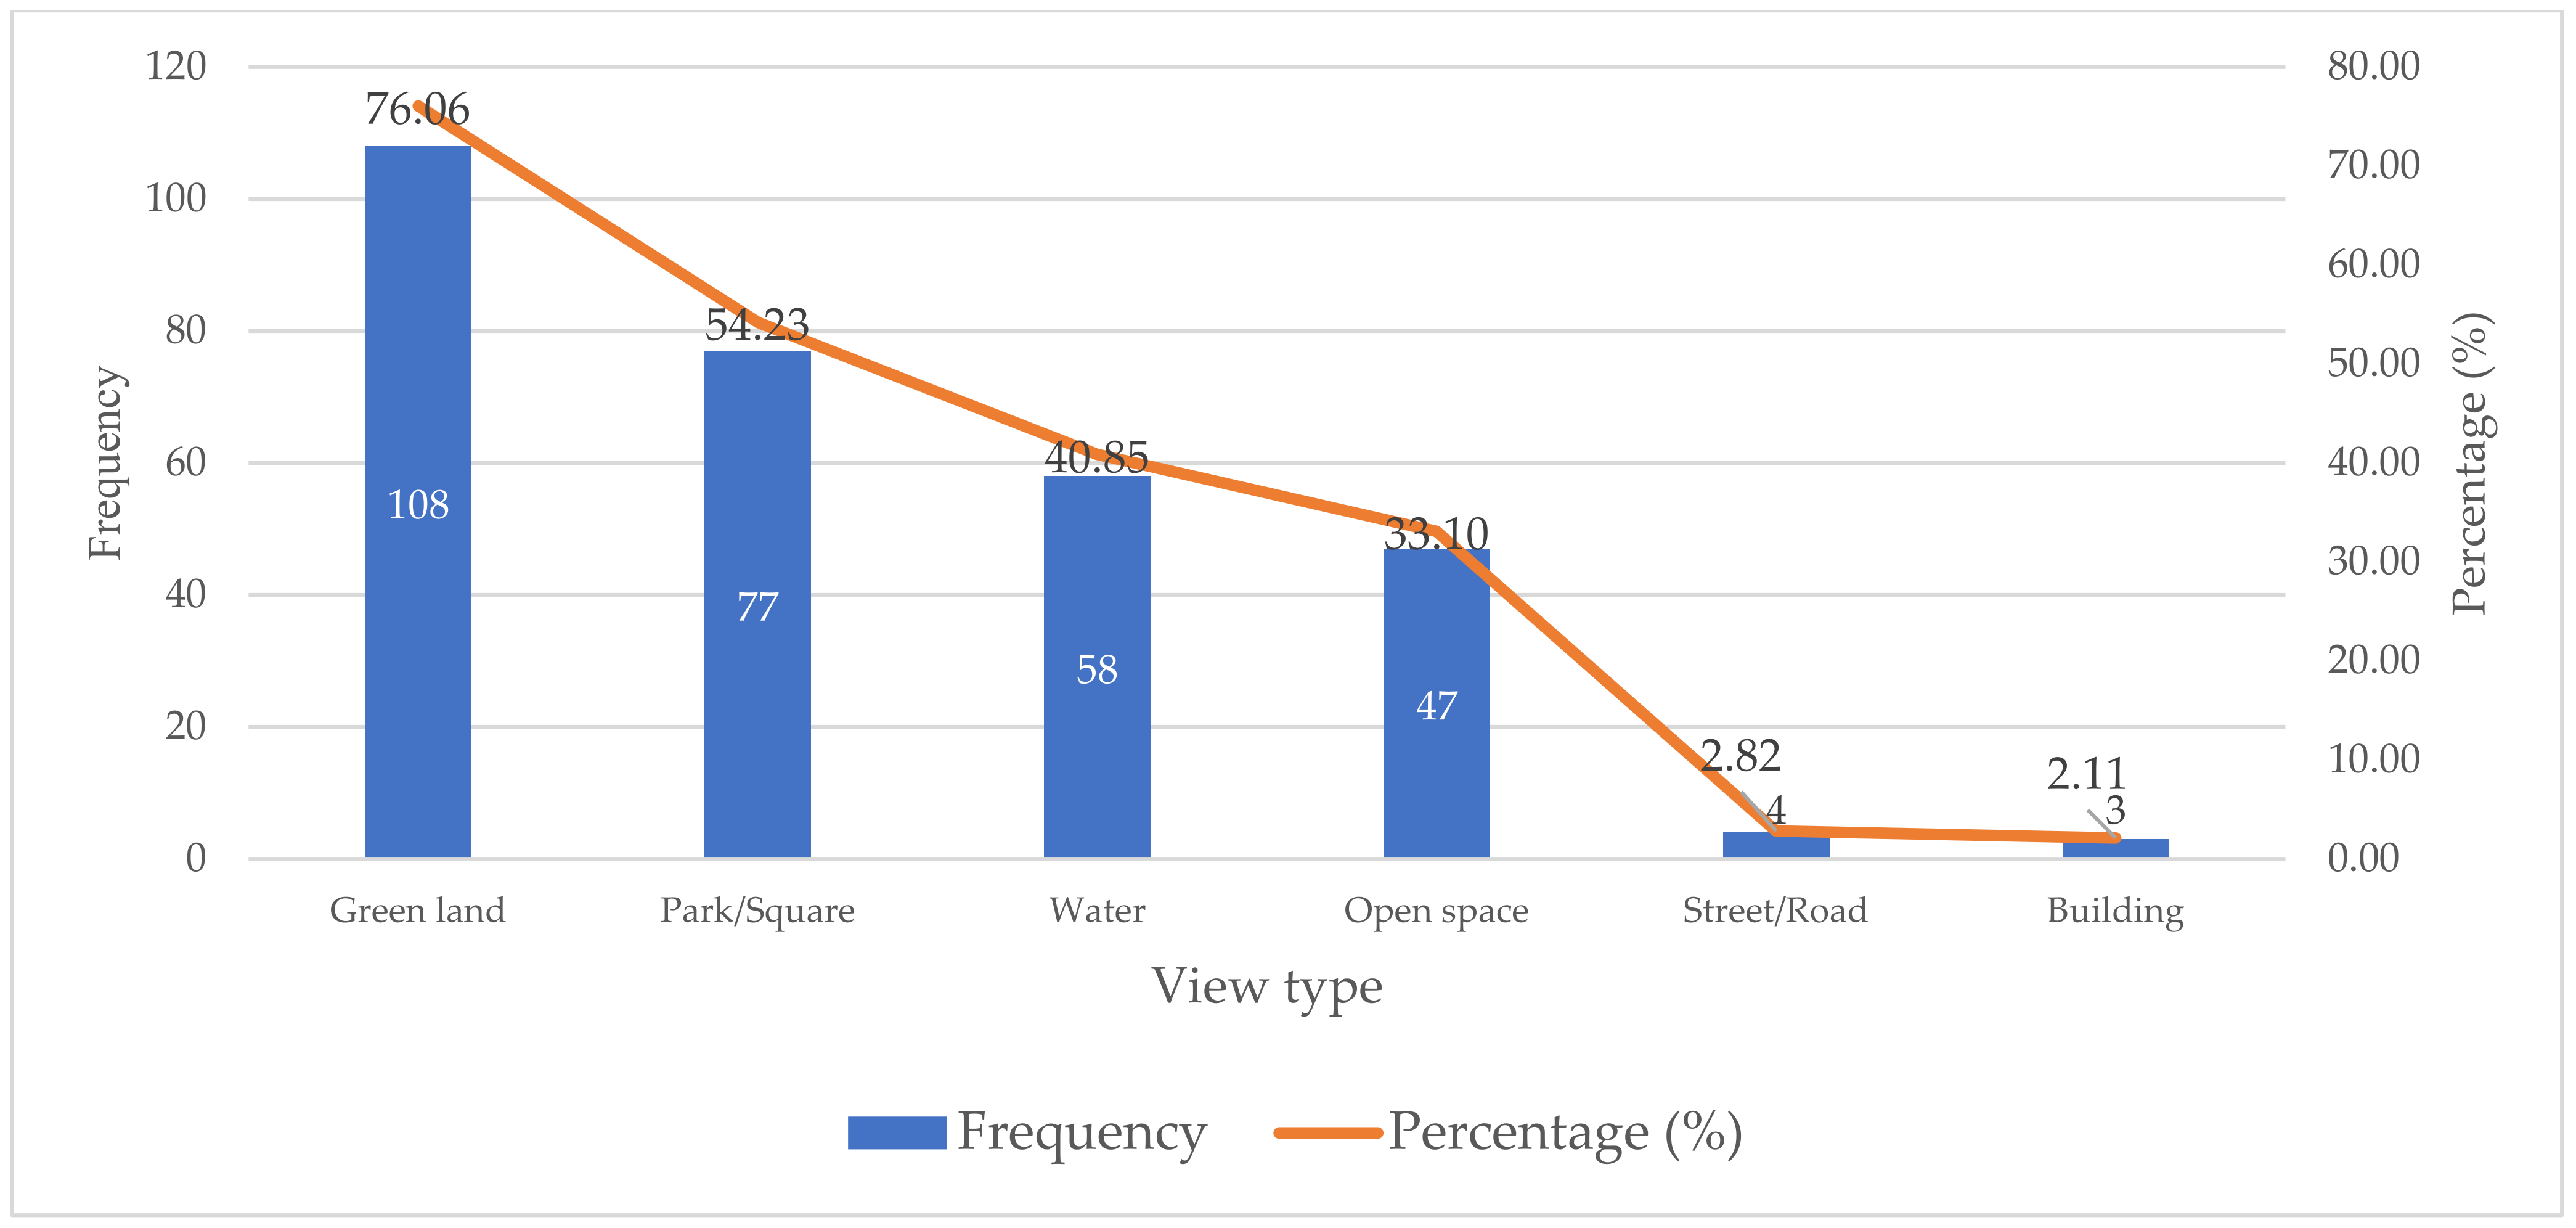
5.4. View Types
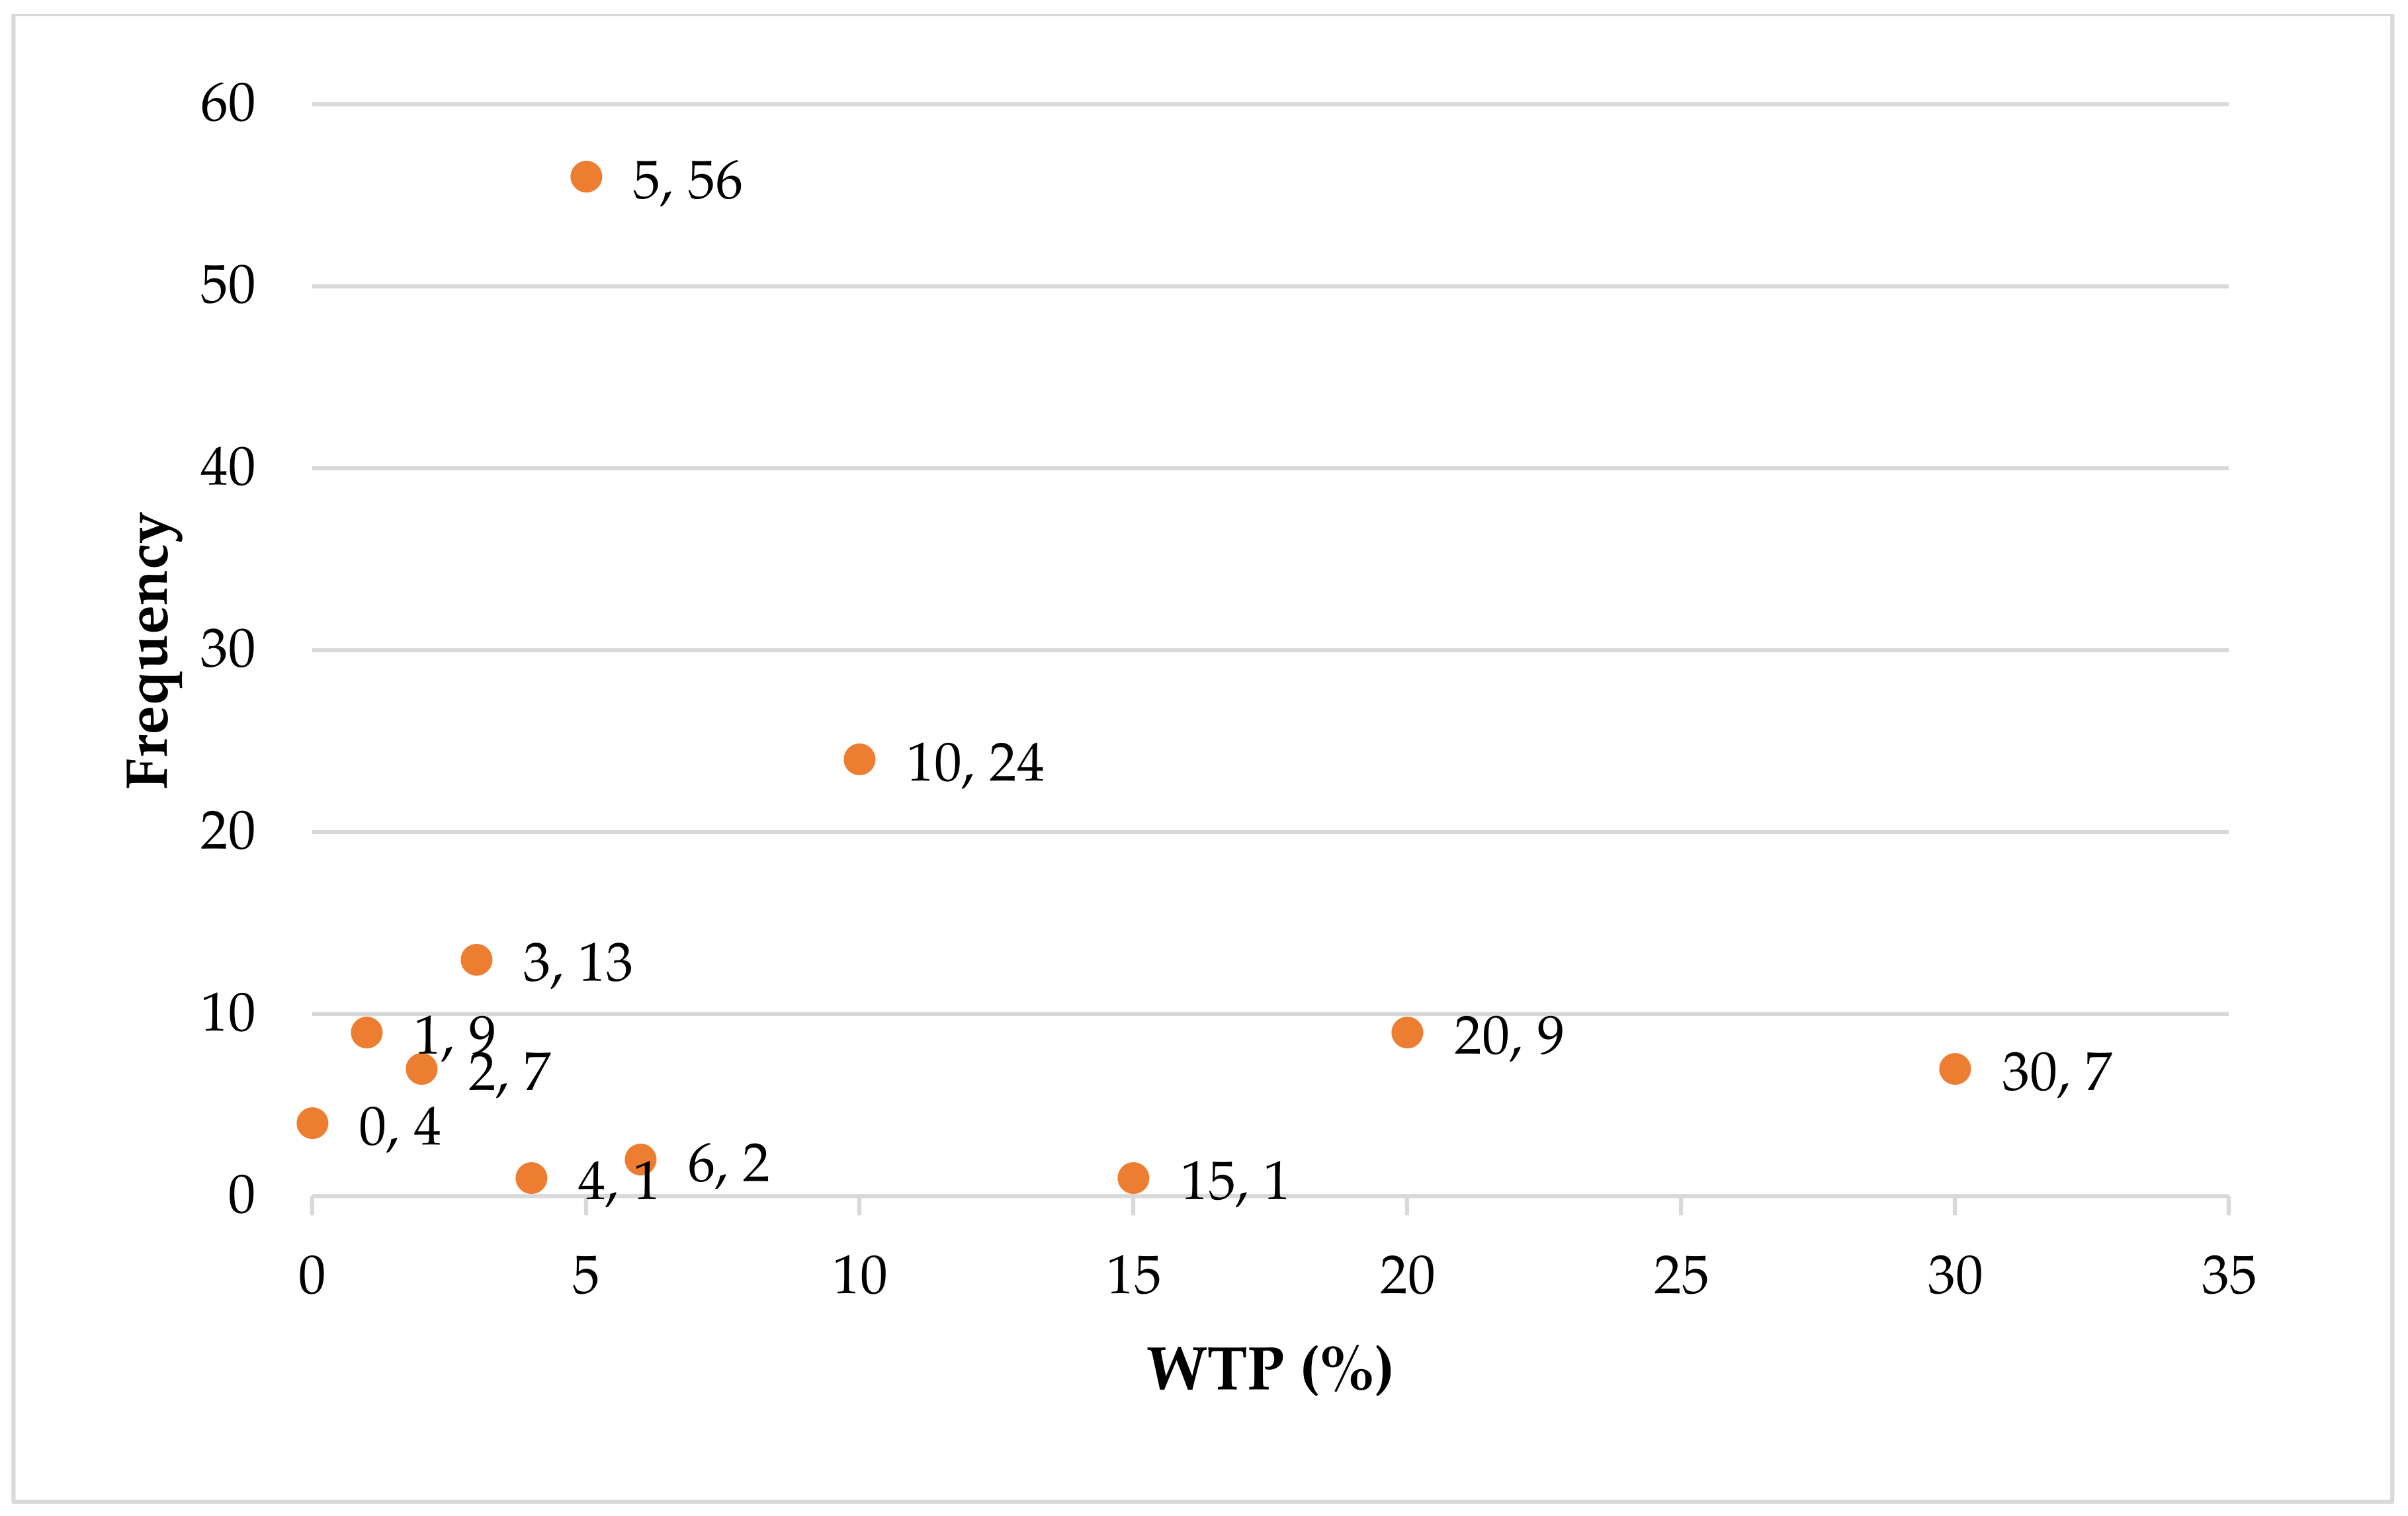
5.5. WTP for View Types and Property Orientations
6. Discussion
7. Conclusions
Author Contributions
Funding
Institutional Review Board Statement
Informed Consent Statement
Data Availability Statement
Acknowledgments
Conflicts of Interest
Appendix A. The Background Information of Respondents

| Respondents | Institution/Position | Contexts | |
|---|---|---|---|
| 1 | Two males | Government-related institution A/Engineer | Current status of 3D modelling related to the property market in Xi’an; land use distribution; Xi’an housing policy. |
| 2 | One male and one female | Developer A/Architecture and landscape designer | General pricing policy; the role of 3D factors in the architecture; buyers’ preferences. |
| 3 | Two males | Developer B/sales manager | General pricing policy; buyers’ preferences; the roles of 3D factors in the property price; the current status of 3D modelling in Xi’an. |
| 4 | One female | Developer C/sales manager | General pricing policy; buyers’ preferences; the roles of 3D factors in the property price; the current status of 3D modelling in Xi’an. |
| 5 | One male | Developer D/landscape designer | The balance between landscape and budget; landscape design; buyers’ preferences on different views. |
| 6 | One female | Developer E/sales manager | General pricing policy; buyers’ preferences; the roles of 3D factors in the property price; current status of 3D modelling in Xi’an. |
| 7 | One male | University/associate professor | The future trend for property valuation; 3D modelling in valuation and its ongoing challenges; the reasons for property price increase in Xi’an. |
| 8 | Two males | Government-related institution B/manager | The reasons for increasing property and land price in Xi’an; 3D modelling in urban planning. |
| Respondents | Purchase Experience | Background | |
|---|---|---|---|
| 1 | Two senior and one young male | They all have experience in housing purchase. | Two have jobs (bachelor degree), and one is retired (technical secondary school). |
| 2 | Four young females | One has purchase experience, two rents, and one lives with parents. | All hold bachelor degrees and have jobs. |
Appendix B. The Interview Guides for Experts in Semi-Structured Interviews
- What is your general architecture design principles for high-rise apartments?
- Does the architecture plan affect the property price in certain scenarios?
- What is the price difference between the price developers report for approval and the final price approved by the Price Bureau of Xi’an?
- Which type of residence is most popular based on your experience? What are the common attributes of them?
- Which administrative districts are popular for residence selection?
- Do you think the preferences of buyers for residence has changed in time?
- Do you think buyers will pay more for a better view?
- Do you have 3D models for buyers at the sales office? What software do you use to create them? What is the cost of finance and time?
- Do you think interactive 3D models can improve the performance or better communicate with buyers? Is it necessary?
- What do you think is the main factor causing the huge property price growth in the past two years in Xi’an?
- What is your general price-making policy?
- Is the price influenced by view/environment/skyline, etc.?
- The price of different storeys in one building is different. What is the price difference and how you determine it? Do you adjust the price of some specific storey?
- What are the main considerations when designing the landscape inside the neighbourhood? What are the indicators that buyers value?
- How do you optimise the distribution of the apartments limited by floor area ratio to reach the best vision or daylight?
- What kind of view do the buyers like? Do they value the view?
- Does the housing preference of buyers change over time?
- What role does the landscape play? How do the real estate developers balance the relationship between cost and price?
- What are the main steps of the landscape design for a neighbourhood?
- Do you use 3D models for landscape design?
- What are the main contexts do you value in landscape design?
- How does the landscape balance functionality and aesthetics?
- Which type of residence is the most popular based on your experience? What are the common attributes of them?
- Do you think that the preferences of buyers for residence has changed in time?
- In your experience, which indicators do buyers consider when buying an apartment?
- What is your general price-making policy? What are the main steps/procedures and what method/technique is used?
- What influence does fixed-price policy have on your pricing policy?
- How do you determine the price difference between different storeys? Which indicators are important?
- What are the living experiences for apartments on different storey levels?
- Do you have some certain algorithm to calculate the price difference of the apartments on different storey levels?
- How do you handle the supporting facilities around the neighbourhood? Is it possible to have a situation where the facilities cannot keep the pace with the neighbourhood construction?
- Have you ever used a 3D model at the sales office to the customers? What is the customers’ feedback?
- Does the 3D model help you better sell the properties? Is it necessary? Why?
- What is the price difference among each administrative district in Xi’an? What is the main reason causing this kind of difference?
- What do you think is the main indicator causing the huge property price growth in the past two years in Xi’an?
- Would you please briefly introduce us about the knowledge of the land valuation?
- What do you think of the role of 3D modeling in property valuation?
- Which indicators do you think promote the land parcel price and the property price in Xi’an?
- Is the scope of property registration still determined according to the 2D floor plan? Does it contain 3D information?
- Have you ever used 3D data in land valuation? Why?
- Do you think it is necessary to include 3D data into the land valuation?
- Is there any difficulty in data acquisition or administration when using 3D data or building a 3D system?
- In your opinion, what can be improved or added to the current land/property valuation framework?
- What do you think is the main indicator causing the huge property price growth in the past two years in Xi’an?
- What is the main reason causing the land parcel price growth in Xi’an?
- How does the Price Bureau of Xi’an approve the property price under the fixed-price policy?
- The population growth in Xi’an has caused a huge pressure on the housing. What are the current countermeasures taken by the government? How effective is it? How long will this situation be expected to last?
- The unbalanced supply-demand relationship in the first-hand property market has also contributed to the active second-hand market. How does the government view the phenomenon of the reverse price of second-hand property prices? Is there already a prepared policy for this phenomenon?
- When selling the land parcels to the real estate developers, there will be a series of limited indicators (such as floor area ratio). How does the Xi’an government set these indicators? How to supervise in the construction process?
- What is the city orientation of Xi’an at past and in future in perspective of urban planning?
- What indicators are specifically considered for construction land planning? What is the reference to the quantity of new construction land?
- Why does the Xi’an municipal government open the Hukou policy?
- In your opinion, in addition to population growth, what other indicators have contributed to the property price growth in Xi’an?
- How do property price and urban planning affect each other?
- How does urban planning intend to keep up infrastructure construction with huge population growth?
- What is the future development orientation of the different administrative districts in Xi’an? How does the government allocate the resources?
- Have you ever considered the development of the city in terms of height in the planning?
- What is the application status of 3D technology in the urban planning of Xi’an? In your opinion, what can be the possible future application scenarios?
- What is the fixed-price policy in Xi’an residential property market?
- How does the Xi’an municipal government determine land use and sell residential land parcel?
- Which indicators will you take into consideration when making the residential land use planning? Which factors among them do you think will influence the property price?
- What kind of planning will influence property price? How does the government handle conflicts or problems?
- Do you use remote sensing data (e.g., satellite image, UAV, LiDAR) in the planning? Have you ever considered the 3D modelling part?
- What techniques do you use to build the 3D model?
- Do you take residential property price as an important indicator in the urban planning process?
- Which governmental department is responsible for determining the residential property price?
- In your opinion, what can be improved according to current property valuation procedure?
- Which indicators do you think caused the continuous rise in residential property prices in Xi’an in 2018?
- Do you think it will be helpful to consider the status and future development of the city in the vertical dimension during the planning process?
- Will Xi’an have such a large-scale 3D application for urban planning in the future? What problems will you face?
- What is the level of details (LoD) the current 3D model application has? What is the cost?
Appendix C. The Interview Guide for Focus Groups
- What do you think of the residential property price growth in Xi’an?
- What attributes do you value in a high-rise apartment? Why?
- What kind of apartment do you dislike? Why?
- Does your preference for housing change over time?
- In your opinion, what are the reasons behind the price difference of apartments on different storeys? What are the factors related to the height you value when buying an apartment?
- What kind of view do you most want to see/not want to see? Why?
- How much are you willing to pay for these apartments on different storeys? (Show pictures of the south-facing balconies of the apartments on different storeys)
- How much are you willing to pay for these different kinds of view? (Show pictures of different views, including green land, street, square)
- Have you experienced 3D technology during your purchase, such as VR? Do you think the existing sand table, model room, and display area are enough for you to understand the whole scenario? Is it necessary for a 3D model?
- In your opinion, what are the factors promoting the residential property price in Xi’an? What are your expectations for the future trend of Xi’an residential property prices?
- Have you ever had a problem with the real estate developers’ description after you bought an apartment? What impact does it have? (Examples, supporting facilities are not perfect/slow, the unreasonable design of the apartment)
- Will the planning of Xi’an affect your housing choices? If so, what kind of planning will affect?
- In the future, if you do housing choice, which administrative district will you choose? Why?
Appendix D. The Questionnaire Template in English

References
- Chen, Z.; Xu, B. Enhancing urban landscape configurations by integrating 3D landscape pattern analysis with people’s landscape preferences. Environ. Earth Sci. 2016, 75, 1–13. [Google Scholar] [CrossRef]
- Qu, S.; Hu, S.; Li, W.; Zhang, C.; Li, Q.; Wang, H. Temporal variation in the effects of impact factors on residential land prices. Appl. Geogr. 2020, 114, 102124. [Google Scholar] [CrossRef]
- Wang, Y.; Wang, S.; Li, G.; Zhang, H.; Jin, L.; Su, Y.; Wu, K. Identifying the determinants of housing prices in China using spatial regression and the geographical detector technique. Appl. Geogr. 2017, 79, 26–36. [Google Scholar] [CrossRef]
- Wang, X.R.; Hui, E.C.M.; Sun, J.X. Population migration, urbanization and housing prices: Evidence from the cities in China. Habitat Int. 2017, 66, 49–56. [Google Scholar] [CrossRef]
- Wang, Z.; Zhang, Q. Fundamental factors in the housing markets of China. J. Hous. Econ. 2014, 25, 53–61. [Google Scholar] [CrossRef]
- Graham, S. Luxified skies. City 2015, 19, 618–645. [Google Scholar] [CrossRef]
- Higgins, C.D. A 4D spatio-temporal approach to modelling land value uplift from rapid transit in high density and topographically-rich cities. Landsc. Urban Plan. 2019, 185, 68–82. [Google Scholar] [CrossRef]
- Liang, X.; Liu, Y.; Qiu, T.; Jing, Y.; Fang, F. The effects of locational factors on the housing prices of residential communities: The case of Ningbo, China. Habitat Int. 2018, 81, 1–11. [Google Scholar] [CrossRef]
- Sun, G.; Webster, C. The security grills on apartments in gated communities: Trading-off 3D and 2D landscapes of fear in China. Cities 2019, 90, 113–121. [Google Scholar] [CrossRef]
- Chen, L.; Ng, E.; An, X.; Ren, C.; Lee, M.; Wang, U.; He, Z. Sky view factor analysis of street canyons and its implications for daytime intra-urban air temperature differentials in high-rise, high-density urban areas of Hong Kong: A GIS-based simulation approach. Int. J. Climatol. 2012, 32, 121–136. [Google Scholar] [CrossRef]
- Lin, T.P.; Tsai, K.T.; Hwang, R.L.; Matzarakis, A. Quantification of the effect of thermal indices and sky view factor on park attendance. Landsc. Urban Plan. 2012, 107, 137–146. [Google Scholar] [CrossRef]
- Fu, X.; Jia, T.; Zhang, X.; Li, S.; Zhang, Y. Do street-level scene perceptions affect housing prices in Chinese megacities? An analysis using open access datasets and deep learning. PLoS ONE 2019, 14, e0217505. [Google Scholar] [CrossRef] [PubMed]
- Lan, F.; Lv, J.; Chen, J.; Zhang, X.; Zhao, Z.; Pui, D.Y.H. Willingness to pay for staying away from haze: Evidence from a quasi-natural experiment in Xi’an. J. Environ. Manag. 2020, 262, 110301. [Google Scholar] [CrossRef] [PubMed]
- Morano, P.; Guarnaccia, C.; Tajani, F.; Di Liddo, F.; Anelli, D. An analysis of the noise pollution influence on the housing prices in the central area of the city of Bari. In Proceedings of the Journal of Physics: Conference Series; IOP Publishing: Rome, Italy, 2020; Volume 1603, p. 012027. [Google Scholar]
- Fernandez, L.; Mukherjee, M.; Scott, T. The effect of conservation policy and varied open space on residential property values: A dynamic hedonic analysis. Land Use policy 2018, 73, 480–487. [Google Scholar] [CrossRef]
- Chen, W.Y.; Li, X. Impacts of urban stream pollution: A comparative spatial hedonic study of high-rise residential buildings in Guangzhou, south China. Geogr. J. 2018, 184, 283–297. [Google Scholar] [CrossRef]
- Wen, H.; Xiao, Y.; Hui, E.C.M.; Zhang, L. Education quality, accessibility, and housing price: Does spatial heterogeneity exist in education capitalization? Habitat. Int. 2018, 78, 68–82. [Google Scholar] [CrossRef]
- Wen, H.; Xiao, Y.; Hui, E.C.M. Quantile effect of educational facilities on housing price: Do homebuyers of higher-priced housing pay more for educational resources? Cities 2019, 90, 100–112. [Google Scholar] [CrossRef]
- Jim, C.Y.; Chen, W.Y. External effects of neighbourhood parks and landscape elements on high-rise residential value. Land Use policy 2010, 27, 662–670. [Google Scholar] [CrossRef]
- Almatarneh, R.T. Choices and changes in the housing market and community preferences: Reasons for the emergence of gated communities in Egypt: A case study of the Greater Cairo Region, Egypt. Ain Shams Eng. J. 2013, 4, 563–583. [Google Scholar] [CrossRef]
- Wang, D.; Li, S.M. Socio-economic differentials and stated housing preferences in Guangzhou, China. Habitat. Int. 2006, 30, 305–326. [Google Scholar] [CrossRef]
- Abramsson, M.; Andersson, E. Changing preferences with ageing – housing choices and housing plans of older people. Housing, Theory Soc. 2016, 33, 217–241. [Google Scholar] [CrossRef]
- Wu, F. Housing environment preference of young consumers in Guangzhou, China: Using the analytic hierarchy process. Prop. Manag. 2010, 28, 174–192. [Google Scholar] [CrossRef]
- Gifford, R. The consequences of living in high-rise buildings. Archit. Sci. Rev. 2007, 50, 2–17. [Google Scholar] [CrossRef]
- Yuen, B.; Yeh, A.; Appold, S.J.; Earl, G.; Ting, J.; Kwee, L.K. High-rise living in Singapore public housing. Urban Stud. 2006, 43, 583–600. [Google Scholar] [CrossRef]
- Yuen, B. Romancing the high-rise in Singapore. Cities 2005, 22, 3–13. [Google Scholar] [CrossRef]
- Dai, J.; Lv, P.; Ma, Z.; Bi, J.; Wen, T. Environmental risk and housing price: An empirical study of Nanjing, China. J. Clean. Prod. 2020, 252, 119828. [Google Scholar] [CrossRef]
- Ministry of Housing and Urban-Rural Development of the National Development and Reform Commission. Notice of the Development Plan of the Guanzhong Plain Urban Agglomeration. 2018. Available online: https://www.ndrc.gov.cn/xxgk/zcfb/tz/201802/t20180207_962661.html?code=&state=123 (accessed on 15 January 2022).
- Zhu, Q.; Wei, T. Future Impacts of Population Aging and Urbanization on Household Consumption in China. Popul. Res. 2016, 40, 62–75. [Google Scholar]
- Wen, H.; Zhao, Z. Talent introduction and housing price: A tale of Xi’an. Appl. Econ. Lett. 2019, 26, 954–962. [Google Scholar] [CrossRef]
- Xi’an Municipal Bureau of Statistics; NBS Survey Office in Xi’an. Xi’an Statistics Yearbook 2018; China Statistics Press: Xi’an, China, 2019. [Google Scholar]
- Beike Institute. Urban High-Rise Neighbourhood Analysis; Beike Research: Beijing, China, 2020. [Google Scholar]
- ATLAS.ti Scientific Software Development GmbH. Available online: https://atlasti.com/ (accessed on 15 January 2022).
- Clifford, N.; Cope, M.; French, S.; Valentine, G. Key Methods in Geography, 3rd ed.; SAGE Publications Inc.: London, UK, 2016; ISBN 9781446298589. [Google Scholar]
- Ranxing Information and Technology Co., Ltd. Available online: https://www.wjx.cn/html/aboutus.aspx (accessed on 15 January 2022).
- Rabiee, F. Focus-group interview and data analysis. Proc. Nutr. Soc. 2004, 63, 655–660. [Google Scholar] [CrossRef]
- Qin, J.; Fang, C.; Wang, Y.; Li, G.; Wang, S. Evaluation of three-dimensional urban expansion: A case study of Yangzhou City, Jiangsu Province, China. Chin. Geogr. Sci. 2015, 25, 224–236. [Google Scholar] [CrossRef]
- Yamagata, Y.; Murakami, D.; Yoshida, T.; Seya, H.; Kuroda, S. Value of urban views in a bay city: Hedonic analysis with the spatial multilevel additive regression (SMAR) model. Landsc. Urban Plan. 2016, 151, 89–102. [Google Scholar] [CrossRef]
- Feng, Q.; Yeung, W.J.J.; Wang, Z.; Zeng, Y. Age of Retirement and Human Capital in an Aging China, 2015–2050. Eur. J. Popul. 2019, 35, 29–62. [Google Scholar] [CrossRef] [PubMed] [Green Version]
- Lei, J. The Operation Situation of Xi’an Property Market in 2018. Huashang. 2018. Available online: http://so.hsw.cn/cse/search?q=2018%E5%B9%B4%E8%A5%BF%E5%AE%89%E6%A5%BC%E5%B8%82%E8%BF%90%E8%A1%8C%E6%83%85%E5%86%B5&click=1&entry=1&s=10178614232472326433&nsid=1 (accessed on 15 January 2022).
- Ministry of Housing and Urban-Rural Development of the People’s Republic of China Residential Design Specification. 2012. Available online: http://english.www.gov.cn/state_council/2014/09/09/content_281474986284089.htm (accessed on 15 January 2022).
- Boeters, R.; Arroyo Ohori, K.; Biljecki, F.; Zlatanova, S. Automatically enhancing CityGML LOD2 models with a corresponding indoor geometry. Int. J. Geogr. Inf. Sci. 2015, 29, 2248–2268. [Google Scholar] [CrossRef] [Green Version]
- Çağdaş, V. An Application Domain Extension to CityGML for immovable property taxation: A Turkish case study. Int. J. Appl. Earth Obs. Geoinf. 2013, 21, 545–555. [Google Scholar] [CrossRef]
- Kalogianni, E.; van Oosteom, P.; Dimopoulou, E.; Lemmen, C. 3D land administration: A review and a future vision in the context of the spatial development lifecycle. ISPRS Int. J. Geo-Information 2020, 9, 107. [Google Scholar] [CrossRef] [Green Version]
- Yin, L.; Hastings, J. Capitalizing on views: Assessing visibility by using 3D visualization and GIS technologies for hotel development in the City of Niagara falls, New York. J. Urban Technol. 2007, 14, 59–82. [Google Scholar] [CrossRef]
- Ying, Y.; Koeva, M.; Kuffer, M.; Asiama, K.O.; Li, X.; Zevenbergen, J. Making the Third Dimension (3D) Explicit in Hedonic Price Modelling: A Case Study of Xi’an, China. Land 2020, 10, 24. [Google Scholar] [CrossRef]
- Yu, S.-M.; Han, S.-S.; Chai, C.-H. Modeling the value of view in high-rise apartments: A 3D GIS approach. Environ. Plan. B Plan. Des. 2007, 34, 139–153. [Google Scholar] [CrossRef]
- Zhang, H.; Li, Y.; Liu, B.; Liu, C. The application of GIS 3D modeling and analysis technology in real estate mass appraisal—Taking landscape and sunlight factors as the example. In Proceedings of the International Archives of the Photogrammetry, Remote Sensing and Spatial Information Sciences, Suzhou, China, 14–16 May 2014; Volume XL, pp. 363–367. [Google Scholar]
- Kurakula, V.K.; Kuffer, M. 3D Noise Modeling for Urban Environmental Planning and Management. In Proceedings of the Real Corp 008, Tagungsband, Vienna, Austria, 19–21 May 2008; Volume 2, pp. 517–523. Available online: https://www.researchgate.net/publication/228622472_3D_Noise_Modeling_for_Urban_Environmental_Planning_and_Management (accessed on 15 January 2022).
- Zhao, S.X.B.; Zhan, H.; Jiang, Y.; Pan, W. How big is China’s real estate bubble and why hasn’t it burst yet? Land use policy 2017, 64, 153–162. [Google Scholar] [CrossRef]
- Wang, G.; Van Den Bosch, F.H.M.; Kuffer, M. Modelling urban traffic air pollution dispersion. 2008; Volume 37, pp. 153–158. Available online: https://www.isprs.org/proceedings/XXXVII/congress/8_pdf/2_WG-VIII-2/01.pdf (accessed on 15 January 2022).
- Zahran, E.-S.M.; Smith, M.J.; Bennett, L.D. 3D Visualization of Traffic-Induced Air Pollution Impacts of Urban Transport Schemes. Artic. J. Comput. Civ. Eng. 2013, 27, 452–465. [Google Scholar] [CrossRef]
- Xiao, Y. Urban Morphology and Housing Market, 1st ed.; Tongji University Press and Springer Nature Singapore Pte Ltd.: Singapore, 2017; ISBN 9789811027611. [Google Scholar]
- D’arbois De Jubainville, H.; Vanier, C. Women’s avoidance behaviours in public transport in the Ile-de-France region. Crime Prev. Community Saf. 2017, 19, 183–198. [Google Scholar] [CrossRef]
- Vanier, C.; De Jubainville, H.D.A. Feeling unsafe in public transportation: A profile analysis of female users in the Parisian region. Crime Prev. Community Saf. 2017, 19, 251–263. [Google Scholar] [CrossRef]
- Harris, C.R.; Jenkins, M.; Glaser, D. Gender Differences in Risk Assessment: Why do Women Take Fewer Risks than Men ? Judgm. Decis. Mak. 2006, 1, 48–63. [Google Scholar]
- Nasar, J.; Fisher, B. Design for vulnerability: Cues and reactions to fear of crime. Sociol. Soc. Res. 1992, 76, 48–58. [Google Scholar]
- Roberts, N.; Donovan, C.; Durey, M. Gendered landscapes of safety: How women construct and navigate the urban landscape to avoid sexual violence. Criminol. Crim. Justice 2020. [Google Scholar] [CrossRef]
- Pfister, G. Women in sport-gender relations and future perspectives. Sport Soc. 2010, 13, 234–248. [Google Scholar] [CrossRef]
- Fallon, A.E.; Rozin, P. Sex Differences in Perceptions of Desirable Body Shape. J. Abnorm. Psychol. 1985, 94, 102–105. [Google Scholar] [CrossRef]
- Veneri, P.; Comandon, A.; Garcia-López, M.À.; Daams, M.N. What do divided cities have in common? An international comparison of income segregation. J. Reg. Sci. 2020, 61, 162–188. [Google Scholar] [CrossRef]
- León-Sánchez, C.; Giannelli, D.; Agugiaro, G.; Stoter, J. Testing the New 3D bag dataset for energy demand estimation of residential buildings. 2021; Volume 46, pp. 69–76. Available online: https://www.int-arch-photogramm-remote-sens-spatial-inf-sci.net/XLVI-4-W1-2021/69/2021/ (accessed on 15 January 2022).
- Datasets | CityJSON. Available online: https://www.cityjson.org/datasets/ (accessed on 30 April 2021).
- Aries, M.; Aarts, M.; van Hoof, J. Daylight and health: A review of the evidence and consequences for the built environment. Light. Res. Technol. 2015, 47, 6–27. [Google Scholar] [CrossRef]
- Zhu, G.; Dale-Johnson, D. Transition to the property tax in China: A dynamic general equilibrium analysis. J. Urban Econ. 2020, 115, 103214. [Google Scholar] [CrossRef]
- Pietromonaco, P.R.; Overall, N.C. Applying relationship science to evaluate how the COVID-19 pandemic may impact couples’ relationships. Am. Psychol. 2021, 76, 438–450. [Google Scholar] [CrossRef] [PubMed]
- Elbay, R.Y.; Kurtulmuş, A.; Arpacıoğlu, S.; Karadere, E. Depression, anxiety, stress levels of physicians and associated factors in Covid-19 pandemics. Psychiatry Res. 2020, 290, 113130. [Google Scholar] [CrossRef] [PubMed]
- Wener, R.; Carmalt, H. Environmental psychology and sustainability in high-rise structures. Technol. Soc. 2006, 28, 157–167. [Google Scholar] [CrossRef]
- Sha, H.; Zhang, X.; Qi, D. Optimal control of high-rise building mechanical ventilation system for achieving low risk of COVID-19 transmission and ventilative cooling. Sustain. Cities Soc. 2021, 74, 103256. [Google Scholar] [CrossRef]
- Hwang, S.E.; Chang, J.H.; Oh, B.; Heo, J. Possible aerosol transmission of COVID-19 associated with an outbreak in an apartment in Seoul, South Korea, 2020. Int. J. Infect. Dis. 2021, 104, 73–76. [Google Scholar] [CrossRef]


| Name | Category | Reason | Note |
|---|---|---|---|
| High story level (approximately 25–30) | 3D | Better privacy and broader vision. | |
| Low story level (approximately 1–4) | 3D | Better living convenience, less noise, and less elevator waiting time. | The elderly can climb the stairs instead of waiting for the elevator. |
| All-facing-south orientation | 3D | More daylight hours. | |
| South–north orientation | 3D | More daylight hours and facilitates ventilation. | |
| Pre-decorated | /* | Saves time renovation time, especially popular among the youth. | |
| Green space/park/water | 2D | Clear and broad vision, improved air quality, and less pollution. | |
| Historical site | 2D | Better living experience. | |
| Safety | / | Better living experience. | Access control system, 24/7 security patrol, and fingerprint/face lock system. |
| Public sanitation | 2D | Greater living comfort. | Regular cleaning in public areas. |
| Developer’s reputation | / | Better credibility. | |
| Public transport/shop/restaurant | 2D | Better living convenience. | |
| Hospital | 2D | Medical care, especially for the elderly. | |
| Locations in the center of the neighborhood | 2D | Convenient transportation, positive geomancy, and less external noise and pollution. | The central location reflects the Doctrine of the Mean (zhongyong) in Chinese. |
| Locations near good landscaping (e.g., man-made lake) | 2D | Better view and living experience. | |
| Regional urban planning and development policy | / | Appreciation potential. | |
| Premium primary/secondary school district | 2D | Enjoy exclusive educational resources. | Education quality is highly valued in Chinese culture. |
| Lucky numbers | / | Feng shui (geomancy) | The pronunciation of eight and six indicate prosperity and success. |
| Name | Category | Reason | Note |
|---|---|---|---|
| High story level (approximately 25–30) | 3D | More wind and road noise, longer travelling time, and higher elevator fee and waiting time. | |
| Low story level (approximately 1–4) | 3D | Possible high humidity and narrow field of vision due to architectural blocks (including the building itself) and tall trees. | |
| Hetero-morphic architectural design | 2D | Negative geomancy and inefficient space utilization. | Rooms in non-rectangular shapes and with exposed bearing pillars. |
| North orientation | 3D | Fewer daylight hours and poorer ventilation. | |
| West orientation | 3D | West exposure with higher room temperature in summer afternoons and greater electricity consumption. | |
| Main road inside the neighborhood/street/gate | 2D | More noise and air pollution and negatively impacts the living experience. | |
| Garbage station/electrical power station/biogas digester/factory | 2D | Possible stink, air pollution, and the noise of machines at night and bad views. | |
| Kindergarten, primary and secondary school | 2D | More noise during the daytime. | |
| Historical site | 2D | More noise during the daytime due to tourists and bad public sanitation if not well-maintained. | |
| Undeveloped area | 2D | Potential safety risk and bad view. | Urban villages, wasteland, and rural-urban fringes. |
| Locations at the edges of the neighborhood | 2D | Negative geomancy and longer travelling time. | |
| Close proximity between two buildings | 2D | Depressed living comfort, narrow field of vision, and short daylight hours. | |
| Unlucky numbers | / | Negative geomancy. | For instance, the pronunciation of four is the same as death in Chinese. |
| Factor | Category | Mark |
|---|---|---|
| Public security | 2D, L | 1.78 |
| Property orientation | 3D, E | 1.25 |
| Less noise | 3D, E | 1.25 |
| Less air pollution | 3D, E | 1.20 |
| Shopping | 2D, L | 1.17 |
| Public transportation | 2D, L | 1.07 |
| Sky view (vision) | 3D, E | 1.07 |
| Daylight hours | 3D, E | 0.97 |
| View | 3D, E | 0.97 |
| Leisure | 2D, L | 0.85 |
| Food | 2D, L | 0.69 |
| Education facilities | 2D, L | 0.66 |
| Sports facilities | 2D, L | 0.63 |
| Entertainment facilities | 2D, L | 0.55 |
| Cultural facilities | 2D, L | 0.43 |
| Factor | ANOVA-Age | Gender | ||||
|---|---|---|---|---|---|---|
| Levene’s Test for Equality of Variances | t-Test for Equality of Means | |||||
| F | Sig | F | Sig | t | Sig | |
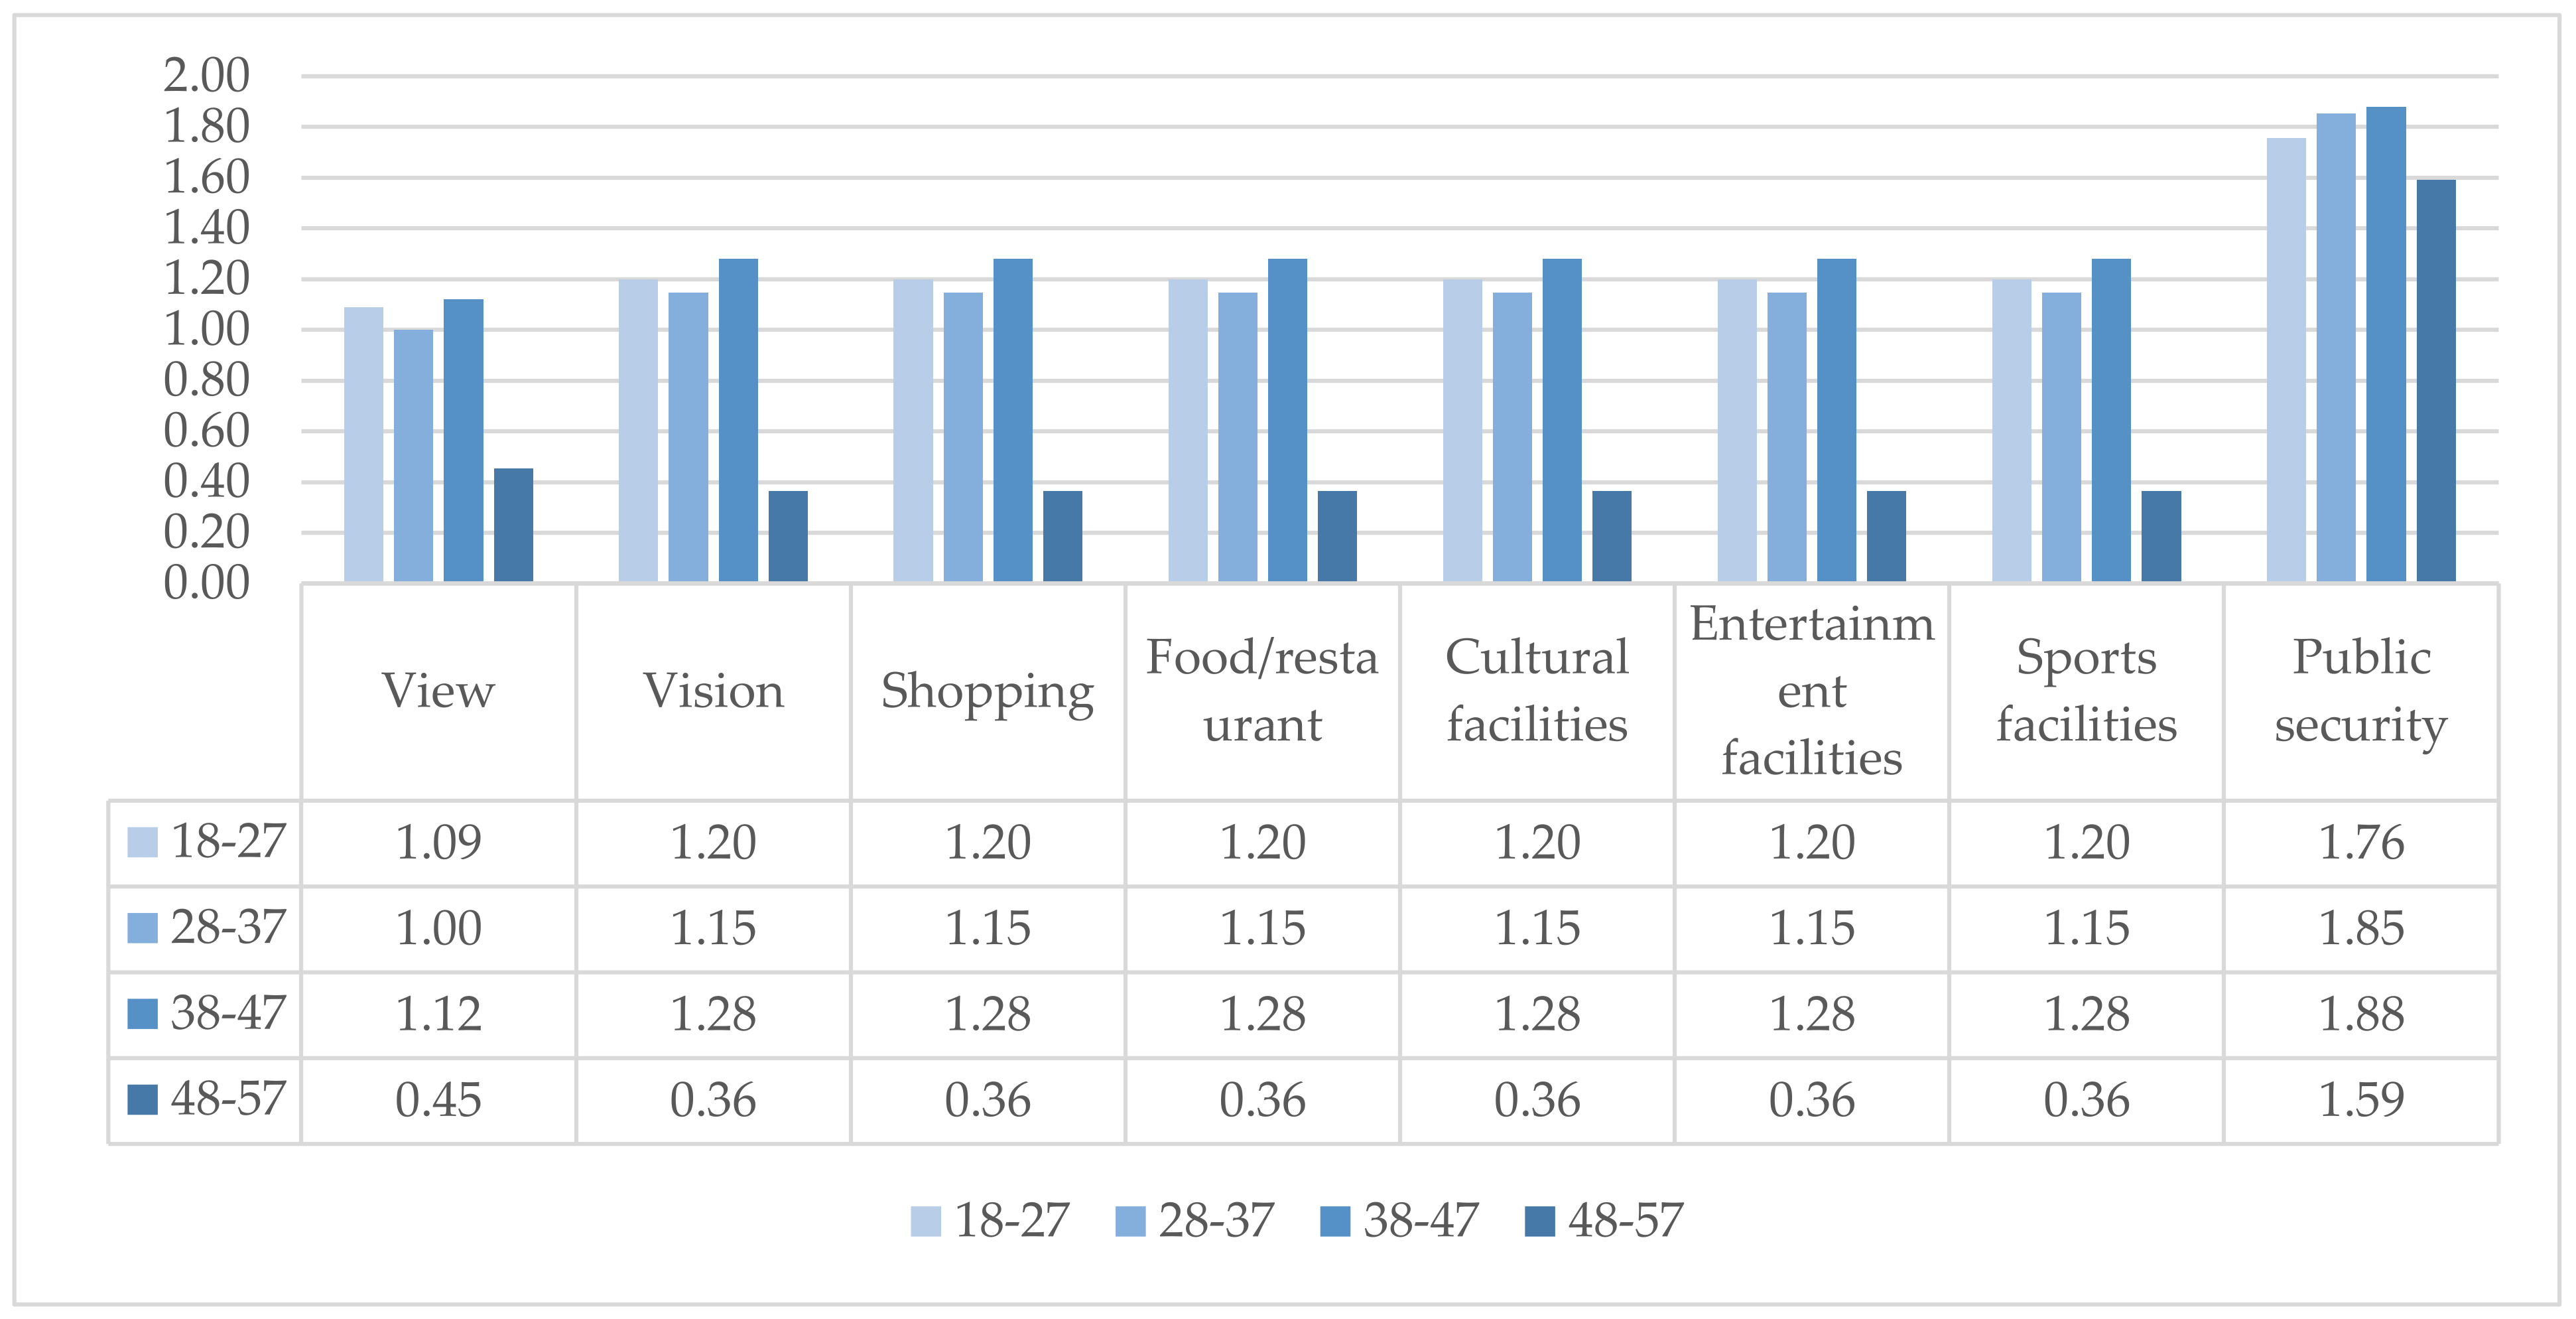
| View | 4.119 | 0.004 * | 1.580 | 0.211 | 0.409 | 0.683 |
| Vision | 6.976 | 0.000 * | 0.933 | 0.336 | −0.429 | 0.669 |
| Daylight hours | 0.059 | 0.993 | 0.022 | 0.882 | −0.552 | 0.582 |
| Orientation | 0.207 | 0.934 | 0.299 | 0.585 | 0.585 | 0.560 |
| Less noise | 1.345 | 0.257 | 1.373 | 0.243 | −1.474 | 0.143 |
| Less air pollution | 1.249 | 0.294 | 0.986 | 0.322 | −2.308 | 0.023 |
| Public transportation | 1.489 | 0.209 | 0.583 | 0.446 | −0.276 | 0.783 |
| Schools | 2.421 | 0.052 | 0.726 | 0.396 | −0.823 | 0.412 |
| Shopping | 2.546 | 0.043 * | 0.079 | 0.780 | −0.951 | 0.343 |
| Food/restaurant | 4.592 | 0.002 * | 0.187 | 0.666 | 1.039 | 0.301 |
| Cultural facilities | 3.302 | 0.013 * | 0.137 | 0.712 | 0.300 | 0.765 |
| Entertainment facilities | 4.111 | 0.004 * | 1.533 | 0.218 | 0.195 | 0.846 |
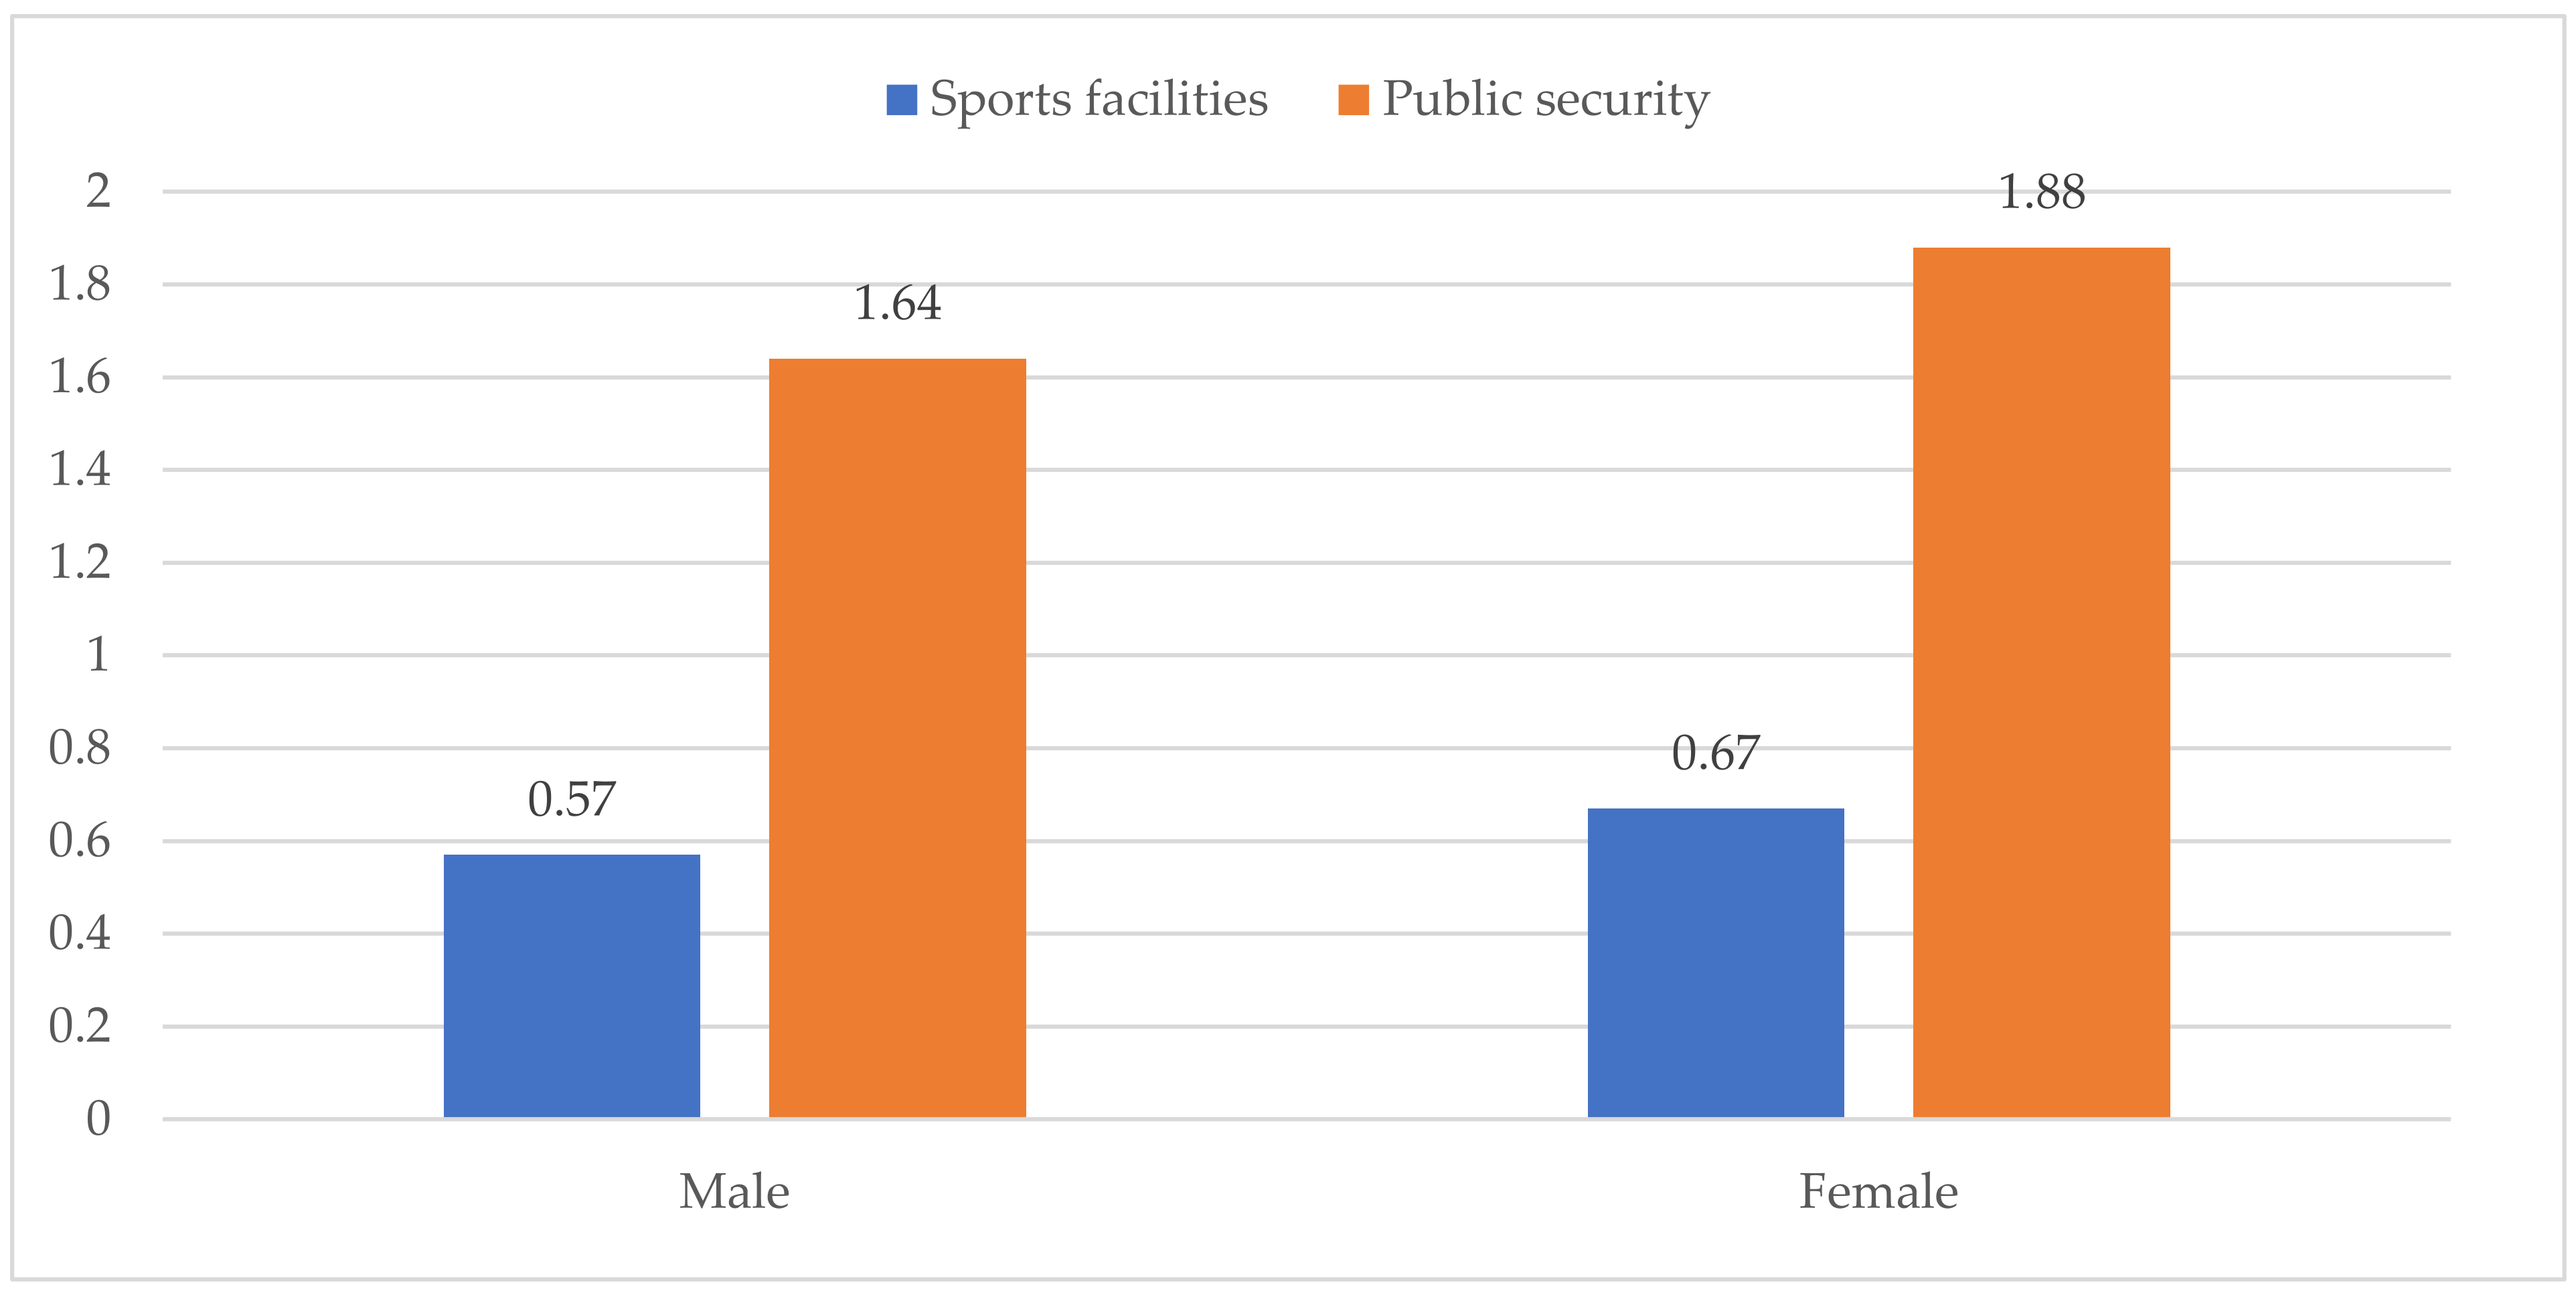
| Sports facilities | 3.287 | 0.013 * | 8.857 | 0.003* | −0.713 | 0.477 |
| Leisure | 1.680 | 0.159 | 0.152 | 0.697 | 0.400 | 0.690 |
| Public security | 2.853 | 0.026 * | 49.337 | 0.000* | −3.476 | 0.001 |
| Name | Frequency | Percentage (%) | Medium (%) | Average (%) | Minimum (%) | Maximum (%) |
|---|---|---|---|---|---|---|
| Green land | 99 | 35.11 | 5 | 4.91 | 0 | 30 |
| Park/Square | 63 | 22.34 | 5 | 6.91 | 2 | 50 |
| Water | 56 | 19.86 | 5 | 7.03 | 2 | 40 |
| Open space | 42 | 14.89 | 5 | 4.19 | 1 | 10 |
| Street/Road | 7 | 2.48 | 5 | 5.29 | −5 | 20 |
| Building | 8 | 2.84 | 1.5 | 2.75 | 0 | 10 |
Publisher’s Note: MDPI stays neutral with regard to jurisdictional claims in published maps and institutional affiliations. |
© 2022 by the authors. Licensee MDPI, Basel, Switzerland. This article is an open access article distributed under the terms and conditions of the Creative Commons Attribution (CC BY) license (https://creativecommons.org/licenses/by/4.0/).
Share and Cite
Ying, Y.; Koeva, M.; Kuffer, M.; Asiama, K.O.; Li, X.; Zevenbergen, J. The Perception of the Vertical Dimension (3D) through the Lens of Different Stakeholders in the Property Market of China. Land 2022, 11, 312. https://0-doi-org.brum.beds.ac.uk/10.3390/land11020312
Ying Y, Koeva M, Kuffer M, Asiama KO, Li X, Zevenbergen J. The Perception of the Vertical Dimension (3D) through the Lens of Different Stakeholders in the Property Market of China. Land. 2022; 11(2):312. https://0-doi-org.brum.beds.ac.uk/10.3390/land11020312
Chicago/Turabian StyleYing, Yue, Mila Koeva, Monika Kuffer, Kwabena Obeng Asiama, Xia Li, and Jaap Zevenbergen. 2022. "The Perception of the Vertical Dimension (3D) through the Lens of Different Stakeholders in the Property Market of China" Land 11, no. 2: 312. https://0-doi-org.brum.beds.ac.uk/10.3390/land11020312