
Extracting Land Use Change Patterns of Rural Town Settlements with Sequence Alignment Method


School of Urban Planning & Design, Peking University Shenzhen Graduate School, Shenzhen 518055, China
*
Authors to whom correspondence should be addressed.
Land 2022, 11(2), 313; https://0-doi-org.brum.beds.ac.uk/10.3390/land11020313
Submission received: 28 December 2021
/
Revised: 8 February 2022
/
Accepted: 9 February 2022
/
Published: 20 February 2022
(This article belongs to the Special Issue Sustainable Rural Transformation under Rapid Urbanization)
Abstract
:Understanding land use change patterns of rural town settlements (RTSs) is crucial for rural and small-town planning; however, few studies have explored pattern mining approaches to RTS trajectory analysis. In this study, we adopted a novel method by building sequence alignment method (SAM) to detect representative trajectory clusters of land use change of 1158 RTSs in seven waves from 1980 to 2015 in Guangdong, China. The results suggest that there are 10 clusters of RTSs with varying trajectories of land use change, implying their differences in the development processes and underlying socioeconomic, demographical, and institutional factors. A spatial distribution map of RTSs shows that stable cultivated ecological and stable ecologically dominant RTSs are distributed in the northern, eastern, and western parts of Guangdong, whereas stable rural construction and stable mixed construction RTSs are mostly located around the provincial boundary. Notably, 73% of the RTSs that have undergone changes in land use types are located in the Pearl River Delta (PRD), including urbanized and agricultural upgraded RTSs. The analysis presented here summarizes the driving forces of the spatial evolution of RTSs, including the location, landforms, industries, and policy factors. This study provides dynamic policy implications to understand longitudinal and sequential spatial restructuring and regional coordinated development in the fast-growing PRD area.
1. Introduction
Land use change is an important clue that indicates the development pattern of a region [1] and has long been the analytical focus in the fields of geography, natural resource, and urban and rural planning. Understanding a region’s development pattern is critical in tracing the pathway of spatial restructuring that results from socioeconomic transformation. This helps planners and decision-makers diagnose the growth or decline issues of specific regions, designate optimal development paths, and formulate plans for sustainable regional development [2]. Although an increasing number of empirical studies have tracked urban neighborhood-level land use changes in urban areas [3,4,5], only a few of them have investigated the trajectories of land use changes in rural town settlements (RTSs), particularly in China. In general, the term “rural town settlement” refers to the broad concept of township settlements in rural areas, excluding those in urban areas. Currently, China is at a transitional stage of promoting urban–rural integration under the context of rapid urbanization, with the urbanization rates sharply growing from 19.39% in 1980 to 63.89% in 2020 [6]. Hence, developing or revitalizing RTSs has become one of the most important national development agendas. Therefore, more studies are needed to investigate the land use change patterns of RTSs.
In general, major challenge of such studies is the lack of longitudinal data in finer-grain space–time resolutions and methods for pattern mining among land use trajectories [7]. Most of the current studies on land use changes focus on the macro scale, including research at the global [8,9,10], national [11,12,13,14], regional [15,16,17,18,19], and city scales [20,21,22,23]. At the global scale, most studies focus on the change of cultivated land and forest, as well as the environmental consequence of land use change [8,9,10]. Recent studies have also shown that land use change exhibits regional features, including deforestation and agricultural expansion in tropics and reforestation or afforestation in temperate regions [10]. Meanwhile, some national studies have investigated land use changes across the country over several decades. In these studies, the authors summarized land use changes by region and found that built-up lands expand rapidly [11,14,24]. In contrast, some studies have compared land use changes among variant cities. For example, Kleemann et al. [25] compared the patterns of urban land use in Takoradi and Bolgatanga, Ghana, between 2007 and 2013 and found different patterns of urban development with small-scale scattered settlement units in Bolgatanga and large-scale settlement units in Takoradi.
It should be noted, however, that only a limited number of studies have focused on specific land use changes at smaller scales than the rural/city level, particularly those in rural or small-town areas [26]. Most of these studies relied only on case studies by using one or several specific villages as cases to recover their land use history and underlying driving forces. For example, Liu et al. [27] surveyed the rural land use changes of several villages from 1967 to 2008 in Yuncheng, Shandong, and found that many arable lands were converted into rural settlements, facilities lands and unusual lands. Moreover, taking the village of Fengzhuang as an example, Yin et al. [26] used remote sensing images and participatory rural evaluation methods to analyze the process of rural land use change since the 1990s. They found that many villagers transformed non-construction land into industrial land to produce furniture and that the area of construction land increased approximately five times. While previous studies have tracked the development trajectory or pattern of land use changes in specific cases of Chinese villages, a few of them have quantitatively compared the trajectories of a set of RTSs and categorized the patterns of their land use changes.
Most land use change analyses depend on cross-sectional data across multiple years [11,14,16]. For example, most of the current approaches adopt remote sensing image data and GIS-based spatial analysis technologies, combined with land use dynamic degrees [28,29], transfer matrix [30,31] and landscape metrics [15,21,32], to analyze spatial variations and structural changes in land use distribution. These approaches can reveal the quantitative characteristics of regional land use change or describe the morphological differentiation characteristics of land use. In general, applying multi-year cross-sectional data to land use dynamic degrees allows researchers to estimate the quantitative scale of land use change and characterize the structure of land use change over a time period. In addition, the land use transfer matrix can reveal the size of transfer between different land use types and reflect the transfer trend of land use change within a region. Chanhda et al. [30] applied the land use dynamic degrees and land use transfer matrix to assess land use changes in the Nam Ha National Biodiversity Conservation Areas from 1992 to 2002.They found that the area of forested land was significantly reduced and that the reduced forested land was mainly converted into urban land and unstocked forest. Overall, the results of such studies have important implications for promoting land use planning and sustainable economic development. Some studies [15,21,32] have expanded the area of focus to the morphological differentiation characteristics of land use landscape space in different periods. Generally, landscape metrics have increasingly been used to analyze the shape, scale, and growth rate of land cover changes within regions, as well as for the dynamic analysis of spatial and temporal patterns of land use change. These studies show that the structure and scale of construction land expand rapidly, and that the degree of land use agglomeration increases during the period of rapid urbanization.
However, some studies have treated longitudinal land use trajectories of settlements (e.g., RTSs) as analytical units, thus failing to cluster settlement units into groups and failing to detect similarities within and dissimilarities between groups. This finding calls for new approaches for trajectory pattern mining. In reality, an increasing number of trajectory pattern mining approaches have been applied in neighborhood change studies [3,5]. Generally, there are different types of trajectory mining approaches, including hierarchical cluster analyses [33], k-means [34,35,36], and sequence alignment method (SAM) [3,5,37]. Delmelle [3] examined the longitudinal trajectories of neighborhood change in Chicago and Los Angeles from 1970 to 2010. She applied SAM to mine patterns in the evolution of neighborhood types and found that the two cities exhibit different processes of neighborhood upgrading. Overall, she found 10 patterns in Chicago and 9 patterns in Los Angeles. Patterns in Chicago are marked by a process of center city revitalization, whereas neighborhood upgrading occurred in the form of suburban improvement in Los Angeles. Although SAM have been increasingly applied in urban neighborhood change studies, they are less used in analyzing land use change patterns of RTSs. Urban neighborhood SAM studies often focus on spatial evolutionary patterns of neighborhoods’ socioeconomic components, such as ethnicity and poverty [34,38], whereas the RTS analysis emphasizes land use change patterns. The aim of this study was, therefore, to fill this gap, with a particular focus on identifying the varying development patterns in rural town areas in China.
In this study, we adopted long-term remote sensing data from 1980 to 2015 (seven waves) to extract the land use types of 1158 RTSs in Guangdong, China, and then constructed a seven-wave sequence of land use trajectories for each individual RTS. Relying on these trajectory data, we adopted a SAM based on progressive alignment to cluster RTSs with similar land use trajectories into groups. The aim of these analyses is to answer the following research questions: (1) How many types of development patterns can be extracted from the trajectory mining of RTS land use sequences? (2) What are these development patterns of land use changes and the underlying socioeconomic and institutional factors resulting in such patterns?
This study contributes to the literature in two ways. First, the results obtained in this study can enrich the development pattern-mining studies of RTSs while focusing on settlements’ land use changes. This can help researchers and practitioners better understand the different types of evolution processes of spatial restructuring of RTSs in Guangdong, China. Given that RTSs are under-researched, it is important to comprehend their development patterns before formulating national or regional policies to revitalize their growth and moderate village declines, according to the local development conditions. Second, unlike most of the current studies only highlighting urban neighborhood changes, this study is considered one of the first studies applying the SAM approach to detect patterns of RTS changes. Given that the development of RTSs has become increasingly critical worldwide, particularly in rapid-urbanization countries, such as China, the novel SAM approach provides a dynamic perspective to understand longitudinal and sequential spatial restructuring and regional coordinated development.
The rest of the paper is organized as follows: The next section describes the data for the analysis and introduces the method. An analysis of the pattern mining results comes next. Discussions and conclusions are offered in the final section.
2. Materials and Methods
2.1. Data
In this study, the measures of land use changes rely on a large set of remote sensing image data extracted from Landsat TM imagery in terms of manual visual interpretation by the Data Center for Resources and Environmental Sciences of the Chinese Academy of Sciences. The dataset contains seven waves of land use data from 1980, 1990, 1995, 2000, 2005, 2010, and 2015, with a spatial resolution of 30 m. Overall, six primary types of land use exist, that is, cultivated land, forest land, grassland, water, residential land, and unused land, as well as 25 secondary types. Because this study increasingly focuses on the land use changes that result from the socioeconomic development of RTSs affected by human activities, instead of natural land cover change, we aggregated land parcels for ecological uses (including forest land, grassland, water, and unused land) into one type as ecological land. At the same time, to more accurately observe the impact of urban and rural activities on land use, we divided residential land into three categories: urban residential land, rural residential land, and nonresidential construction land. Finally, we considered five types of land use in this study: cultivated land, urban land, rural residential land, nonresidential construction land, and ecological land. The study used the areal size of these five land use types as input variables.
We selected the Guangdong Province, China as our research area. Guangdong is a fast-developing megaregion with widely distributed rural areas. Although many rural areas have developed into urban areas during the rapid urbanization phase, there are still many villages and towns at the urban fringes. Given the uneven development processes of different cities and regions, the trajectories of land use change in Guangdong are expected to be complicated and diverse. Thus, Guangdong is regarded as a representative case for development pattern mining analysis. Guangdong contains 21 cities, in which there are 1158 RTSs in the rural areas and 310 neighborhood subdistricts in the urban areas, according to the 2008 official census. Because the boundaries of several administrative RTSs have changed over time, to perform a consistent comparison, we used the official boundary data of 2008 as a reference and computed the land use shares of all seven waves according to this boundary reference. Unlike the case in urban neighborhoods, this study focuses more on RTSs. Hence, we selected 1158 RTSs as analytical units.
2.2. Methods
We applied a SAM to cluster sequences of land use change in RTSs into groups and visualized and extracted varying development patterns of RTSs in Guangdong from 1980 to 2015. Generally, the SAM approach was sourced from the Needleman–Wunsch algorithm, which was proposed by Needleman and Wunsch in 1970 and used in the field of bioinformatics [39]. This method was first used to compare the similarity among protein or DNA sequences and detect the homology between the different sequences. Notably, early SAM algorithms were only able to compare two DNA sequences, but then they gradually became capable of multiple sequence alignments [40]. In the 1980s, SAM was introduced into the realm of social science [41], first in the field of sociology [42] and then in geography, to analyze neighborhood socioeconomic changes, trip-chain pattern mining, and behavioral trajectory patterns [3,42,43].
SAM is essentially a string editing technique that calculates the similarity between two sequences as a function of the number of steps required to completely convert one sequence into another. The editing operations of the algorithm are deletion, insertion, and substitution. The larger the number of steps followed to make two sequences equal, the greater the difference between the two. The Needleman–Wunsch algorithm is a classical dynamic programming algorithm used for globally aligning of two sequences. Most of the existing pattern clustering techniques are performed based on numerical values or individual distances [43,44]. SAM is able to capture RTS with similar evolutionary trajectories, not only in terms of type or value, but also considering the chronological order of RTS evolution [45,46].
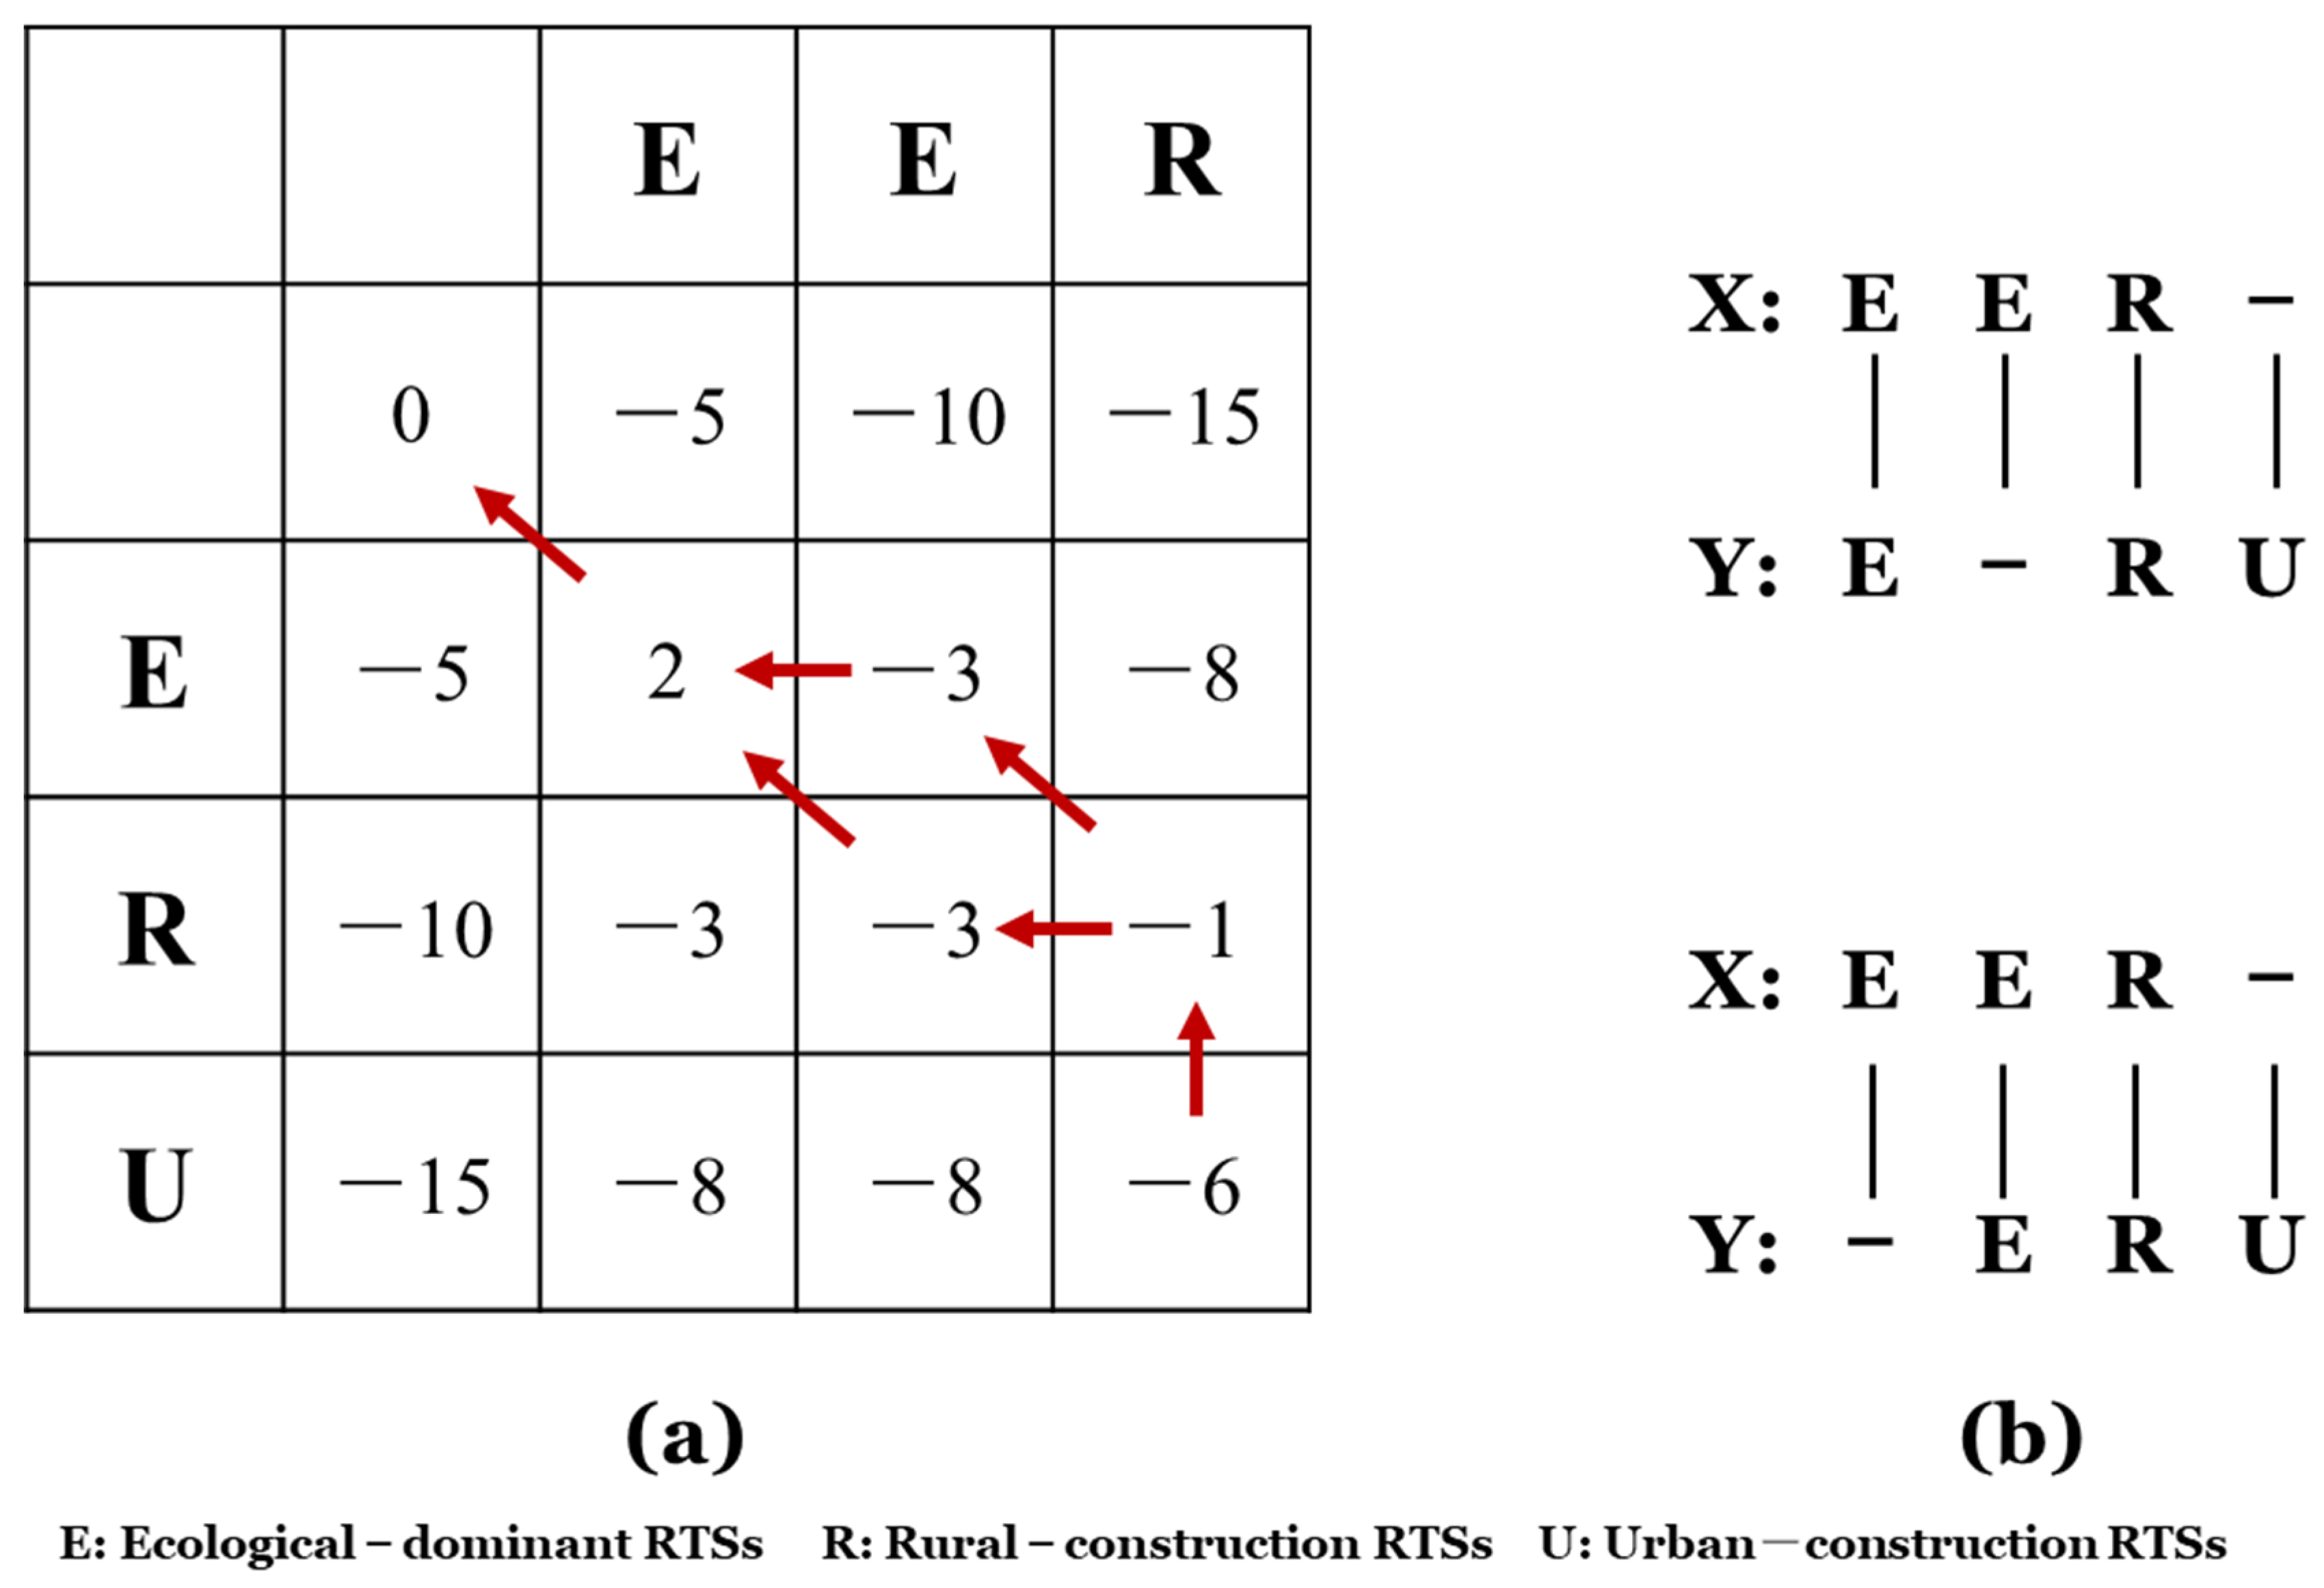
SAM first needs to define the similarity between two sequences by adopting an alignment and matching method. As shown in Table 1, given the land use sequences (X and Y) of two RTSs, the analytical difficulty lies in how to quantitatively calculate the similarity between these two sequences. It is assumed that the elements (i.e., land use type in each wave) in the two sequences compose the trajectory of land use change.
SAM then computes the similarity score on the basis of an alignment process between the two sequences. As an example, the Needleman–Wunsch algorithm consists of three computational steps, outlined as follows.
- (a)
- The first step is to initialize the score matrix, construct a two-dimensional score matrix F, and initialize the score matrix according to the scoring rules. In this study, we set several constants as scoring rules as follows:where is the substitution score for letters and . When the elements and match, the score is 2, whereas when they do not match, the score is −5. Here, the symbol denotes a gap. When aligning sequences, introducing gaps in the sequences can allow an alignment algorithm to match more terms than a gap-less alignment can. In this case, we set the gap penalty as −5.
- (b)
- The second step is to compute the scores and fill in the matrix. The similarity score of each cell of the scoring matrix is calculated using the scoring rule and calculation formula as follows (Figure 1):where is the substitution score for letters and , is the gap penalty obtained by in the vertical direction, and is the gap penalty obtained by in the horizontal direction.
The score matrix is filled in using the process of recursive computation, the three paths for computing can be observed in Equation (2). As can be observed from Figure 1, the maximum of the three paths is required to obtain the score of .
- (c)
- The third step is to search for the optimal alignment from the matrix and to estimate the optimal alignment by tracing backward from the diagonal element to the previous highest value. In this example, sequences X and Y represent the spatial evolution sequences of two RTSs. The sequence alignment results obtained by path backtracking are shown in Figure 2. According to the sequence alignment results, the final score is −6.
In this research, we studied the spatial evolution sequence of multiple RTSs, and therefore we needed to use a technique for multiple sequence alignment. We analyzed the evolutionary process of RTSs using progressive alignment. The main steps of progressive alignment are as follows: (1) pairwise align all sequences and calculate the distance matrix on the basis of the results of pairwise sequence alignment; (2) construct a guide tree to reflect the evolutionary relationships between sequences according to the distance matrix; (3) guide the two sequences with the closest evolutionary relationship to be aligned using the global dynamic programming algorithm; and (4) progressively add the other sequences in pairwise sequence alignment. After all sequences are added to the alignment, the multiple sequence alignment is considered to be completed.
We applied the unweighted pair-group method using arithmetic averages (UPGMA) to construct a guide tree. UPGMA is a cluster analysis method, proposed by Michener and Sokal in 1957 [47], that adapts arithmetic averages. This method first constructs a distance matrix of pairs of distances of sequences according to the results of pairwise sequence alignment. Next, the minimum distance value is sought in the distance matrix, the two sequences are clustered into a new class , and the distances between and other sequences are calculated. This is then followed by finding the sequence with the closest distance for one more clustering until all sequences are clustered into one class, and then constructing a phylogenetic tree on the basis of the clustering results.
We used the sequence alignment and phylogenetic analysis module in MATLAB to run SAM. Specifically, the following steps were used to analyze land use changes in this study. (1) We standardized land use data to reduce the impact of land parcel size on the data analysis. (2) We used the k-means algorithm to cluster the land use data of 1158 RTSs in the seven waves and classify RTSs with different land use spatial structures. (3) We constructed a DNA sequence of the spatial evolution trajectory of each RTS, calculated the distance between two sequences, constructed a distance matrix of all sequences, and on the basis of the distance matrix, established a phylogenetic tree for multiple sequences. (4) We compared the DNA sequences of the spatial evolution trajectory of RTSs through a SAM, and compared the similarities, differences, and trajectory trends among the sequences to explore the spatial evolution patterns of RTSs in Guangdong.
3. Results
3.1. Clustering Rural Town Settlements by Land Use Patterns
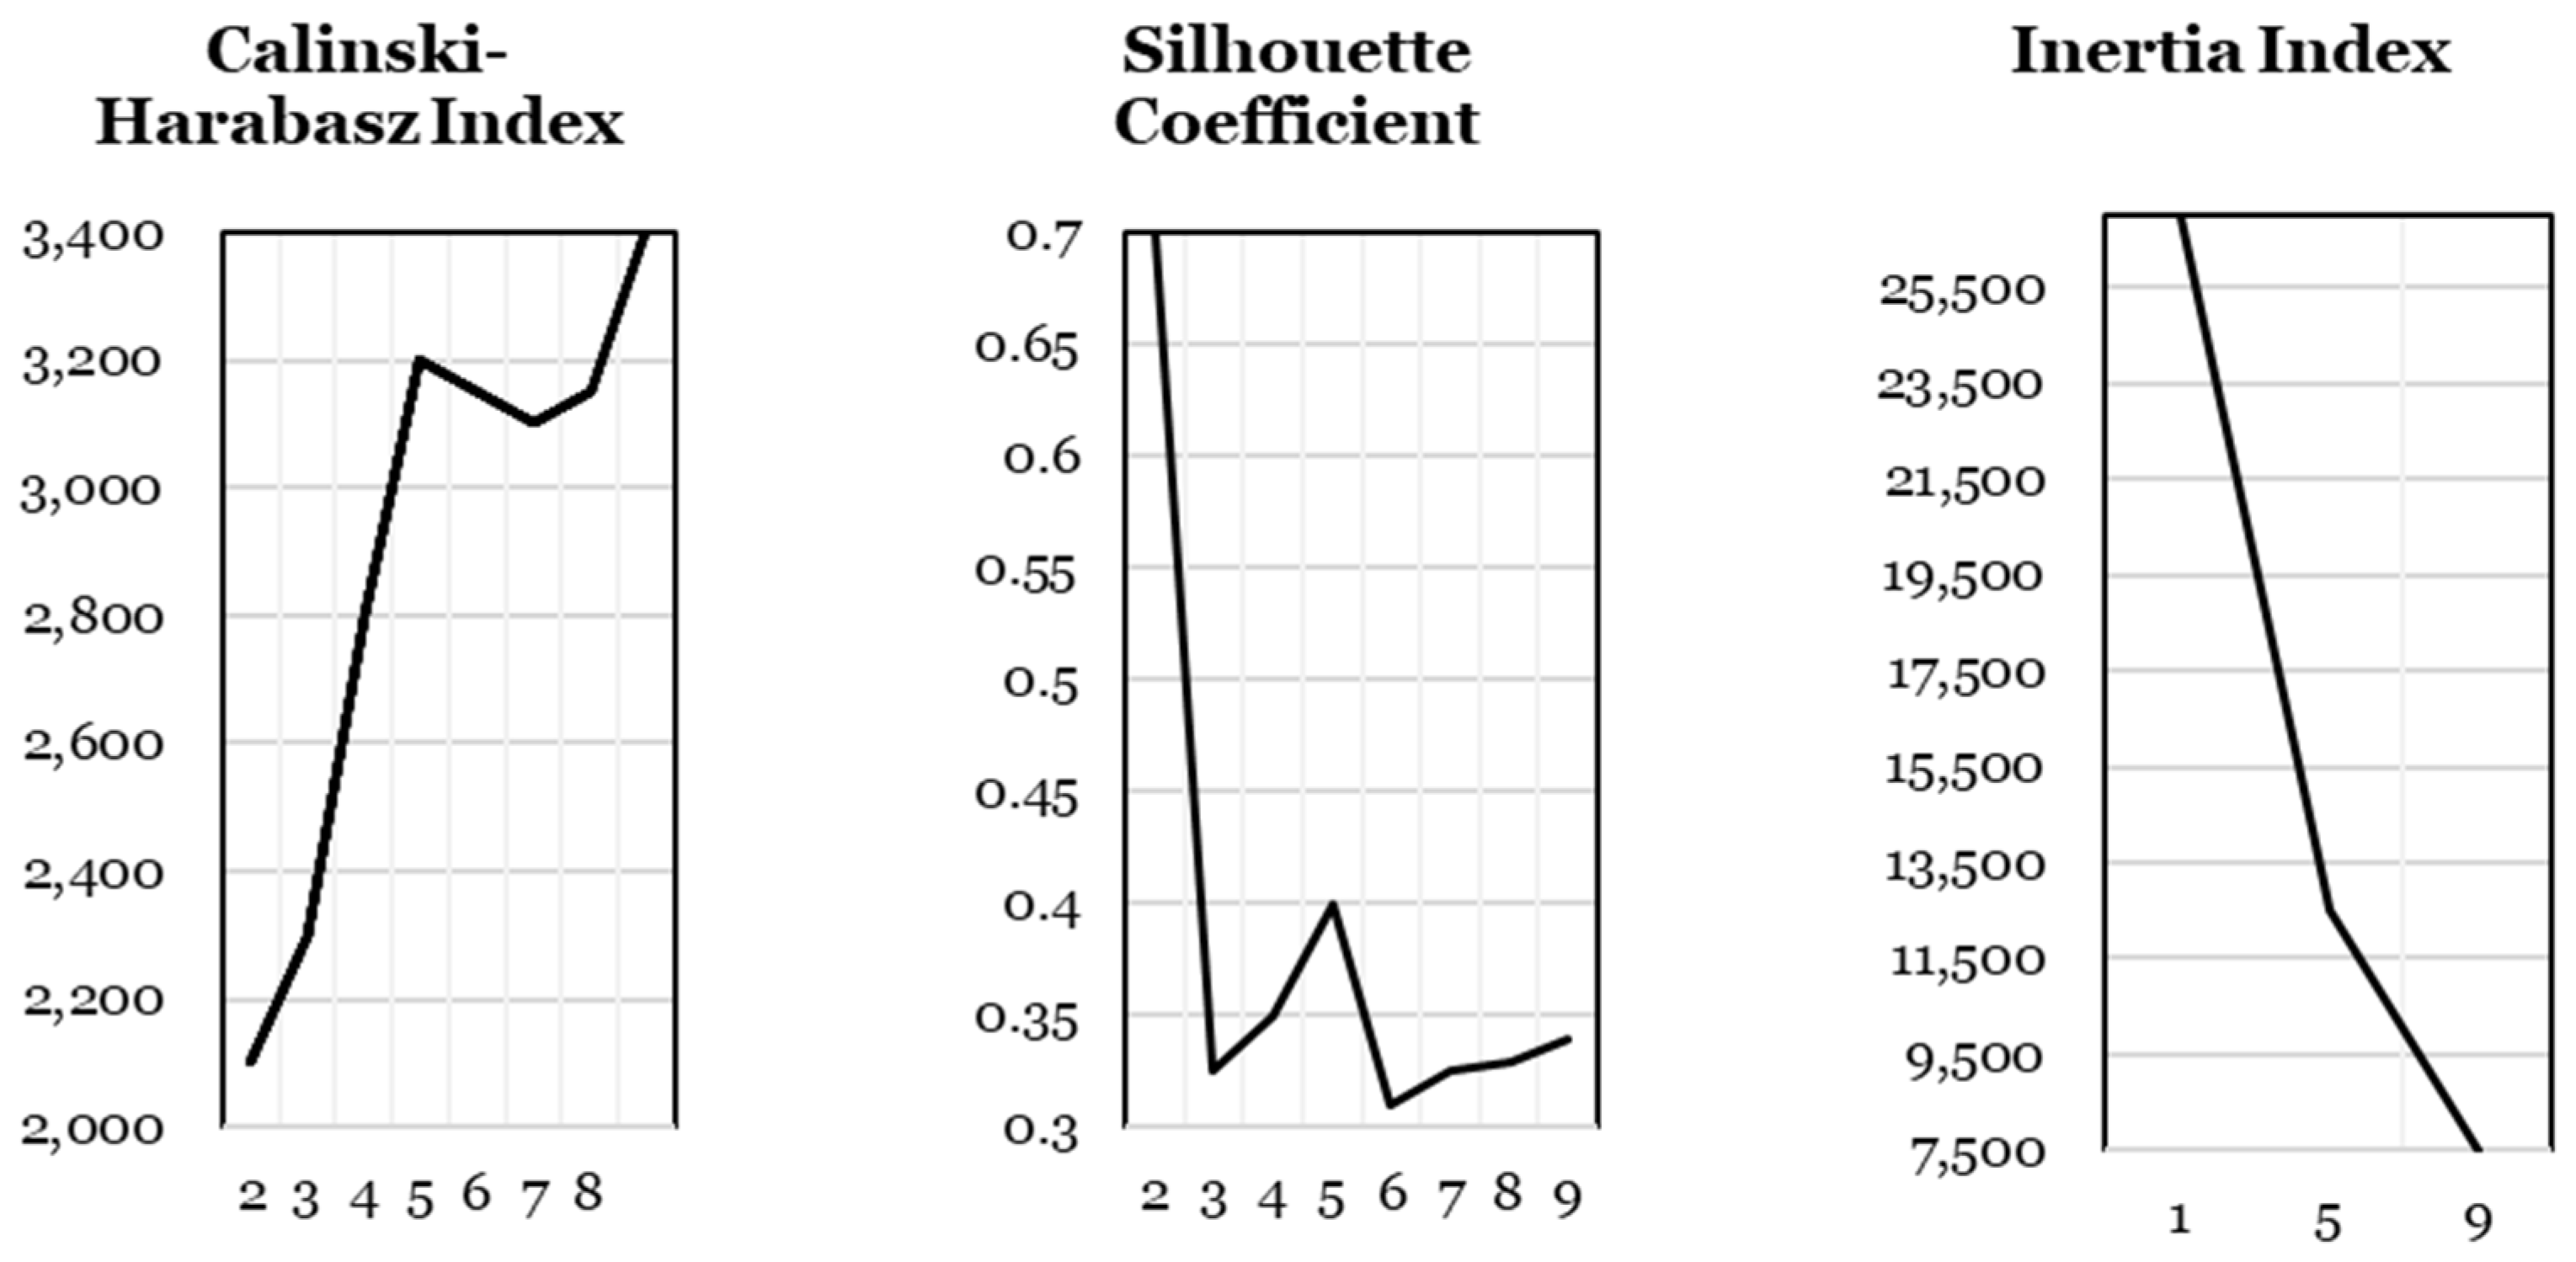
In this study, we first used the k-means clustering approach to partition RTSs in Guangdong into groups according to their land use compositions for all seven waves from 1980 to 2015. The variables selected for the clustering analysis were the standardized areal size of five land use types in RTSs: cultivated land, urban residential land, rural residential land, nonresidential construction land, and ecological land. Several indices were used to determine the number of clusters k. The Calinski–Harabasz index (CH index) is the ratio of between-group dispersion to within-group dispersion, and the score is calculated by evaluating the between-class variance and within-class variance. A higher value of this score indicates a better clustering result [48]. The silhouette coefficient is another widely-used index of evaluating the effectiveness of clustering [49]. It combines two factors, inertia and separation: The closer the evaluation result is to 1, the better the clustering effect is. The inertia index can be considered as a measure of intra-class aggregation. The smaller the inertia value, the better the partition is. We then computed the CH index, silhouette coefficient, and inertia index to identify the optimal number of clusters as 5, as shown in Figure 3. Thus, the five types of RTSs detected by the k-means analysis can be defined by their features of land use composition (Table 2) as follows:
- (a)
- Type-1: Cultivated ecological RTSs (C). The land use types of the RTSs identified as Type-1 comprise a relatively large share of cultivated land (28.40%) and ecological land (68.34%) compared to other RTS types, whereas the share of construction land is relatively small (0.47% urban residential land, 2.29% rural residential land, and 0.50% nonresidential land). Type-1 RTSs also have relatively smaller areas, with an average of 100.55 km2. This type of RTS primarily represents the traditional primitive rural areas, serving agricultural production.
- (b)
- Type-2: Ecologically dominant RTSs (E). The land use proportions of Type-2 RTSs are often large and dominated by ecological land, with an average share of 84.61% among all types of land. Here, ecological land includes forest land, grassland, water, and unused land. In these RTSs, cultivated land is the second largest land use type, averaging around 14.40%. This implies that Type-2 RTSs are typical rural town areas for ecological reservation.
- (c)
- Type-3: Rural construction RTSs (R). In this type of settlement, the average area of rural residential land is the largest, at 12.39 km2, whereas the areas of urban residential land and nonresidential construction land are relatively trivial. The area of cultivated land in this type of RTS is also the largest, but that of ecological land is relatively small. This demonstrates that Type-3 RTSs are the agricultural upgrade and development RTSs, which promote the expansion of rural residential land.
- (d)
- Type-4: Mixed construction RTSs (M). The proportion of nonresidential construction land of in this type of RTS is much higher than in others, with an average of 8.35%. The areal sizes of urban and rural residential land also rank among the top. This type of RTS also has a relatively high proportion of cultivated and ecological land, and it contains a mixture of construction land types, indicating that it is a transformational development rural town area.
- (e)
- Type-5: Urban construction RTSs (U). These RTSs contain the highest proportion of urban construction land (37.98%) compared to other types, whereas the share of cultivated land is relatively low. The proportion of ecological land is the lowest compared to other RTSs, at 31.89%. A large amount of ecological and agricultural land is transformed into urban construction land. This is a typical urbanized rural town area that is often located near the fringes of urban areas.
3.2. Clustering Land Use Change Patterns of Rural Town Settlements by Land Use Trajectories
3.2.1. Description of the Land Use Trajectories of Rural Town Settlements
According to the clustering results of RTSs, we can obtain the land use category of an RTS in each year and construct its land use change trajectory from 1980 to 2015 (with seven waves). For example, by analyzing the trajectories of 138 urban construction (Type-5) and mixed construction (Type-4) RTSs in 2015 (Figure 4), we can observe that in 1980, most of these 138 RTSs were categorized into Type-1 or Type-3. This demonstrates the rapid urbanization process in RTS areas where most urbanized RTSs have been evolved from traditional rural and agricultural areas. Such an evolutionary process shows the transformation of land use functions from mainly agricultural land and rural construction land eventually to urban construction land.
Specifically, Figure 4a shows the change of land use types of 138 RTSs over seven waves. Before 2005, only a small number of RTSs were observed, with a significant change in land use types to urbanized types (i.e., Type-4 and Type-5). However, immediately after 2005, significant RTSs evolution was witnessed, with most of the RTSs shifting from Type-1 and Type-3 to Type-4 or Type-5. Since 2000, the expansion of urban residential land and nonresidential construction land has entered an accelerated period. The amount of cultivated land declined rapidly, and even the areas of rural residential land started to decrease. It can also be observed that a certain amount of agricultural and ecological land was converted into the construction land from 2000 to 2015. In addition, Figure 4b shows the development process of 104 rural construction (Type-3) RTSs in 2015. Unlike urbanized RTSs, 89% of the rural upgraded RTSs became rural construction RTSs before 2005. This indicates that the rural residential land expanded rapidly from 1980 to 2005, and a large amount of cultivated and ecological land was converted into rural residential land for agricultural production and housing.
3.2.2. Extracting the Land Use Change Patterns of Rural Town Settlements with Sequence Alignment Methods
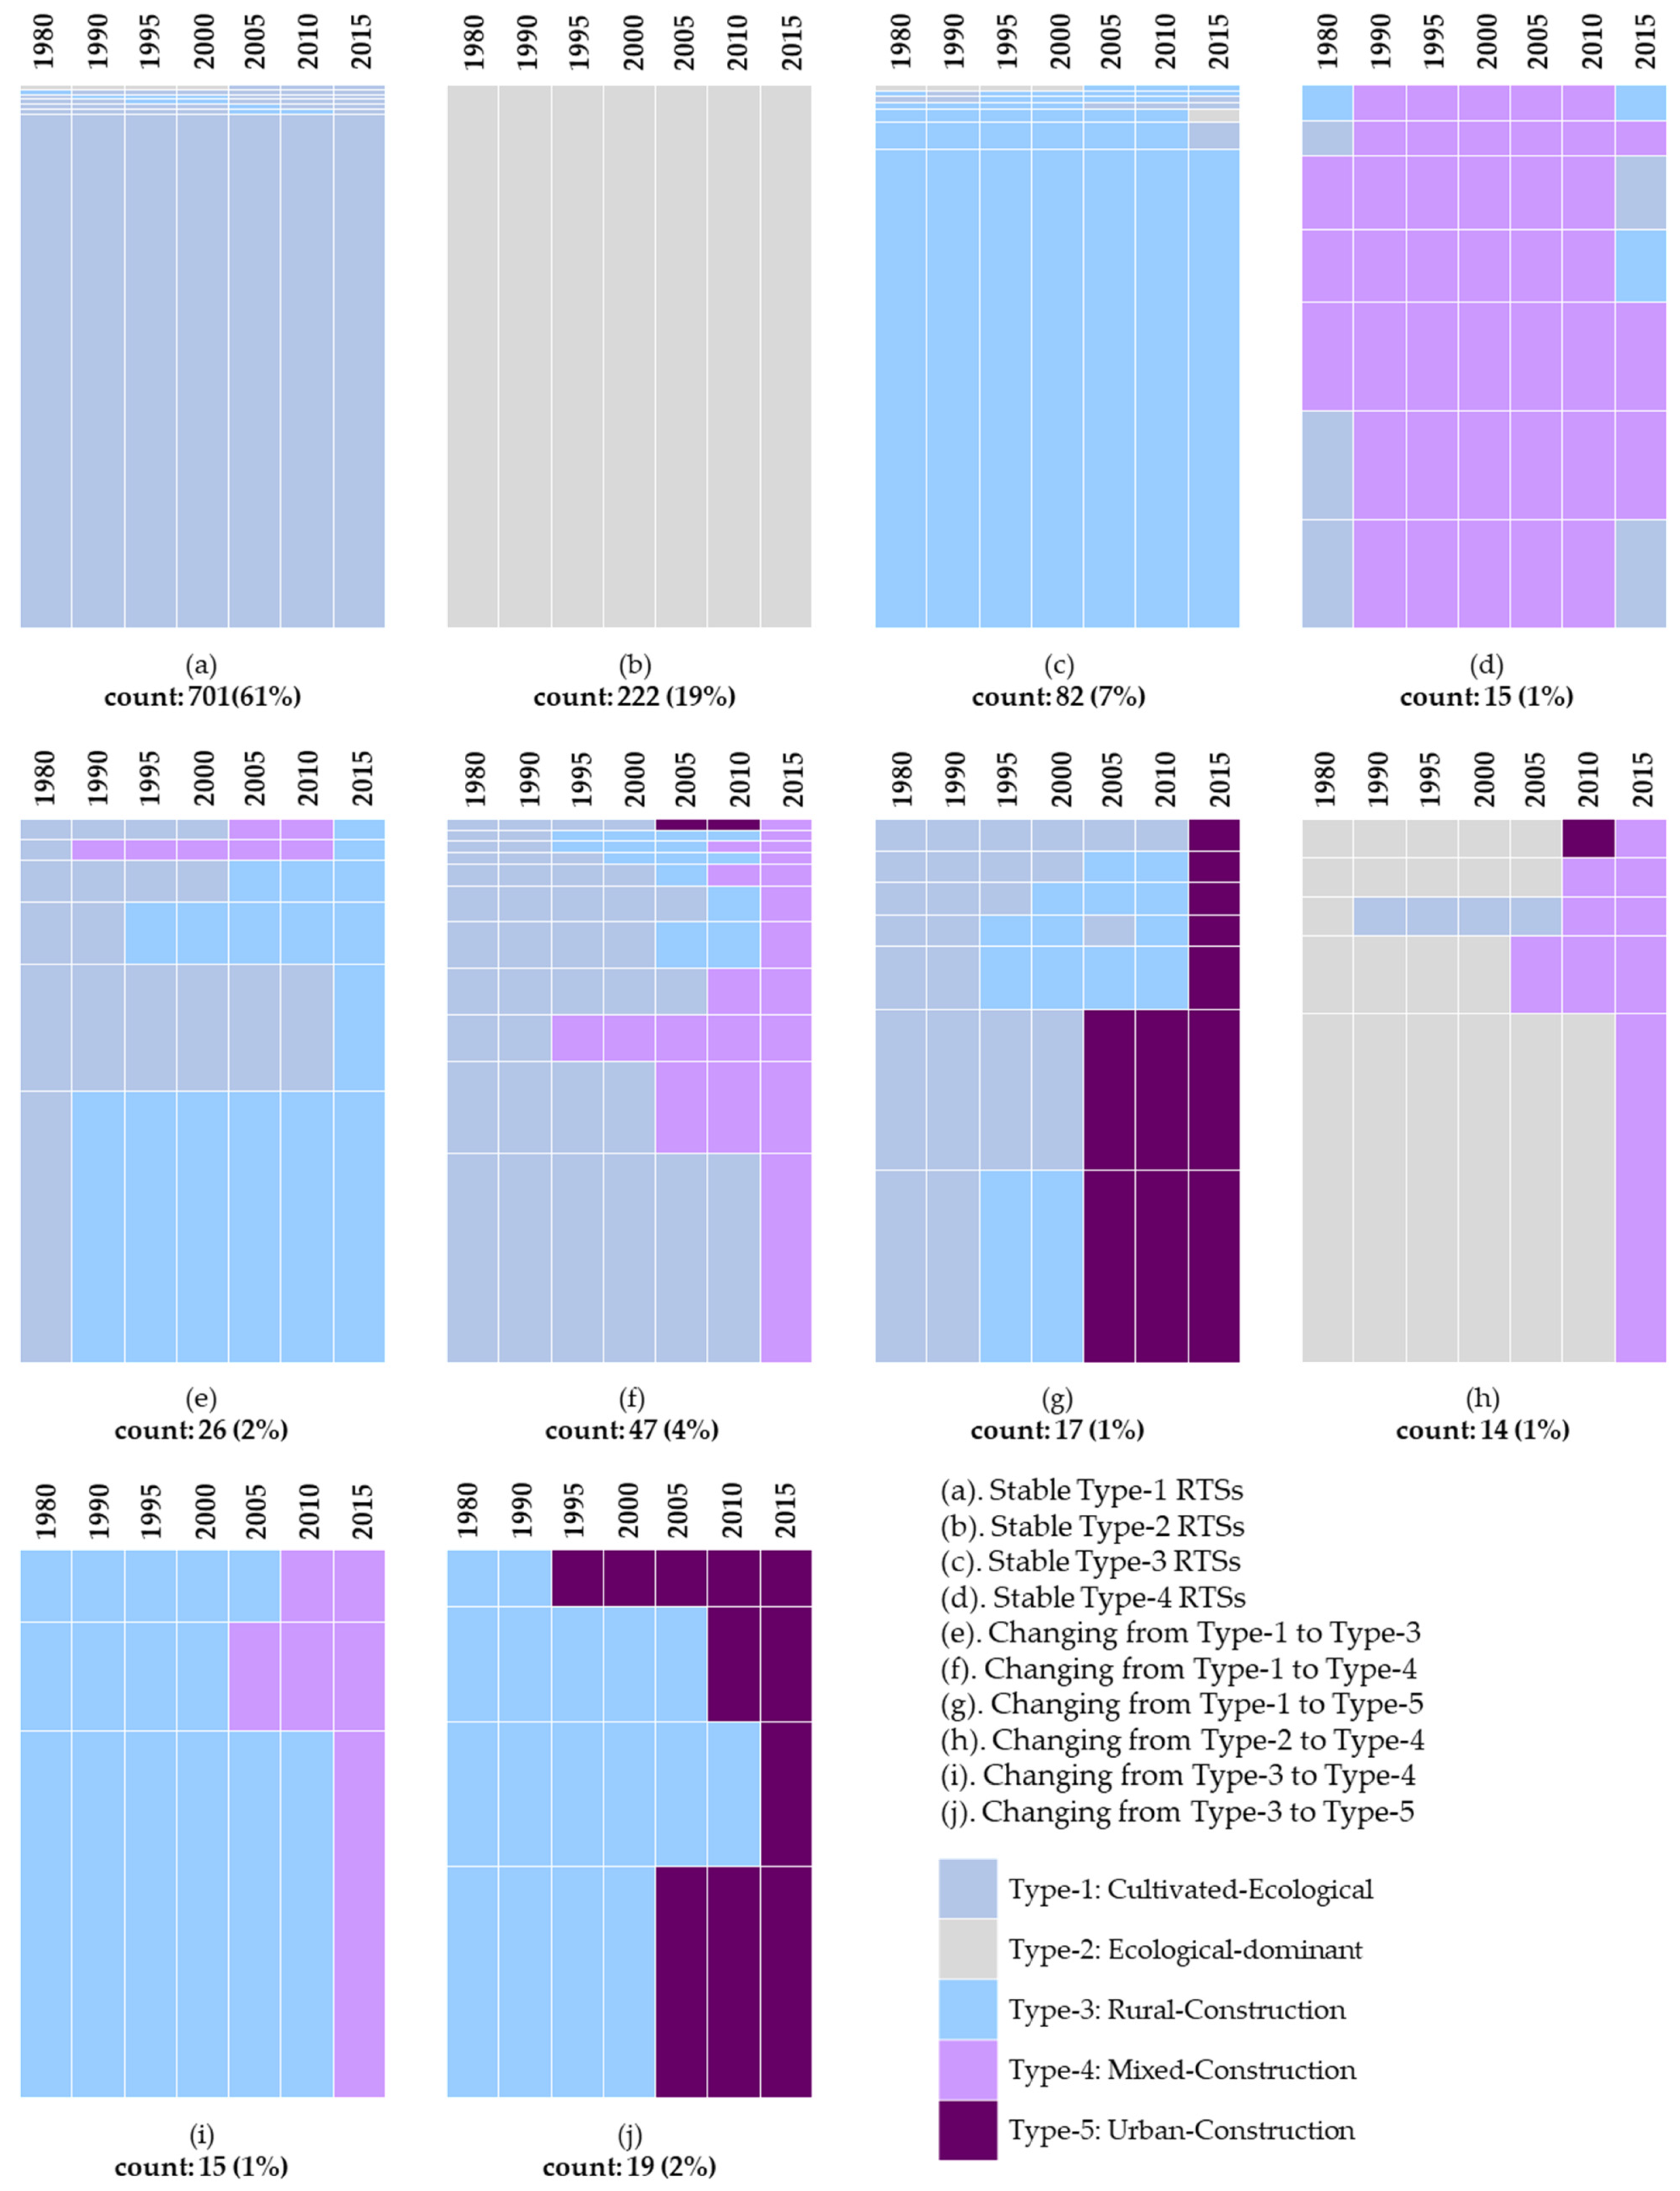
In this study, we applied the SAM approach to partition the land use sequences of 1158 RTSs in Guangdong into groups by calculating the similarity in the change trend of land use among the sequences. The modeling results revealed 10 types of land use sequences of RTSs (i.e., 10 types of ‘DNA’ of RTSs). Figure 5 shows these 10 types of RTSs relying on the sequential similarity of land use change. In general, these 10 types of RTS sequences can be divided into two categories: RTSs of stable land use patterns (or stable RTSs thereafter) and RTSs of changing land use patterns (or changing RTSs thereafter).
Stable RTSs mostly have unchanged land use categories from 1980 to 2015, or perhaps only slight changes in one or two occasional time slots. There are four types of stable RTSs Type-1 (cultivated ecological), Type-2 (ecologically dominant), Type-3 (rural construction), and Type-4 (mixed construction). Interestingly, we found no stable Type-5 RTSs. In other words, we found that not many rural town areas have been constantly dominated by urban construction land types since 1980. This is reasonable because immediately after 1980, at the beginning of the open-up and reform policies, most rural town areas in Guangdong and most of the regions in China were dominated by cultivated land. Thus, most of the urbanized RTSs in 2015 evolved from traditional rural areas, along with significant land use changes.
On the other hand, changing RTSs represent some rural town areas with significant land use changes from 1980 to 2015, including six changing patterns from Type-1 (cultivated ecological) to Type-3 (rural construction), from Type-1 to Type-4 (mixed construction), from Type-1 to Type-5 (urban construction), from Type-2 (ecologically dominant) to Type-4, from Type-3 to Type-4, and from Type-4 to Type-5. These changes demonstrate the general development patterns of land use of RTSs along more than a period of 30 years.
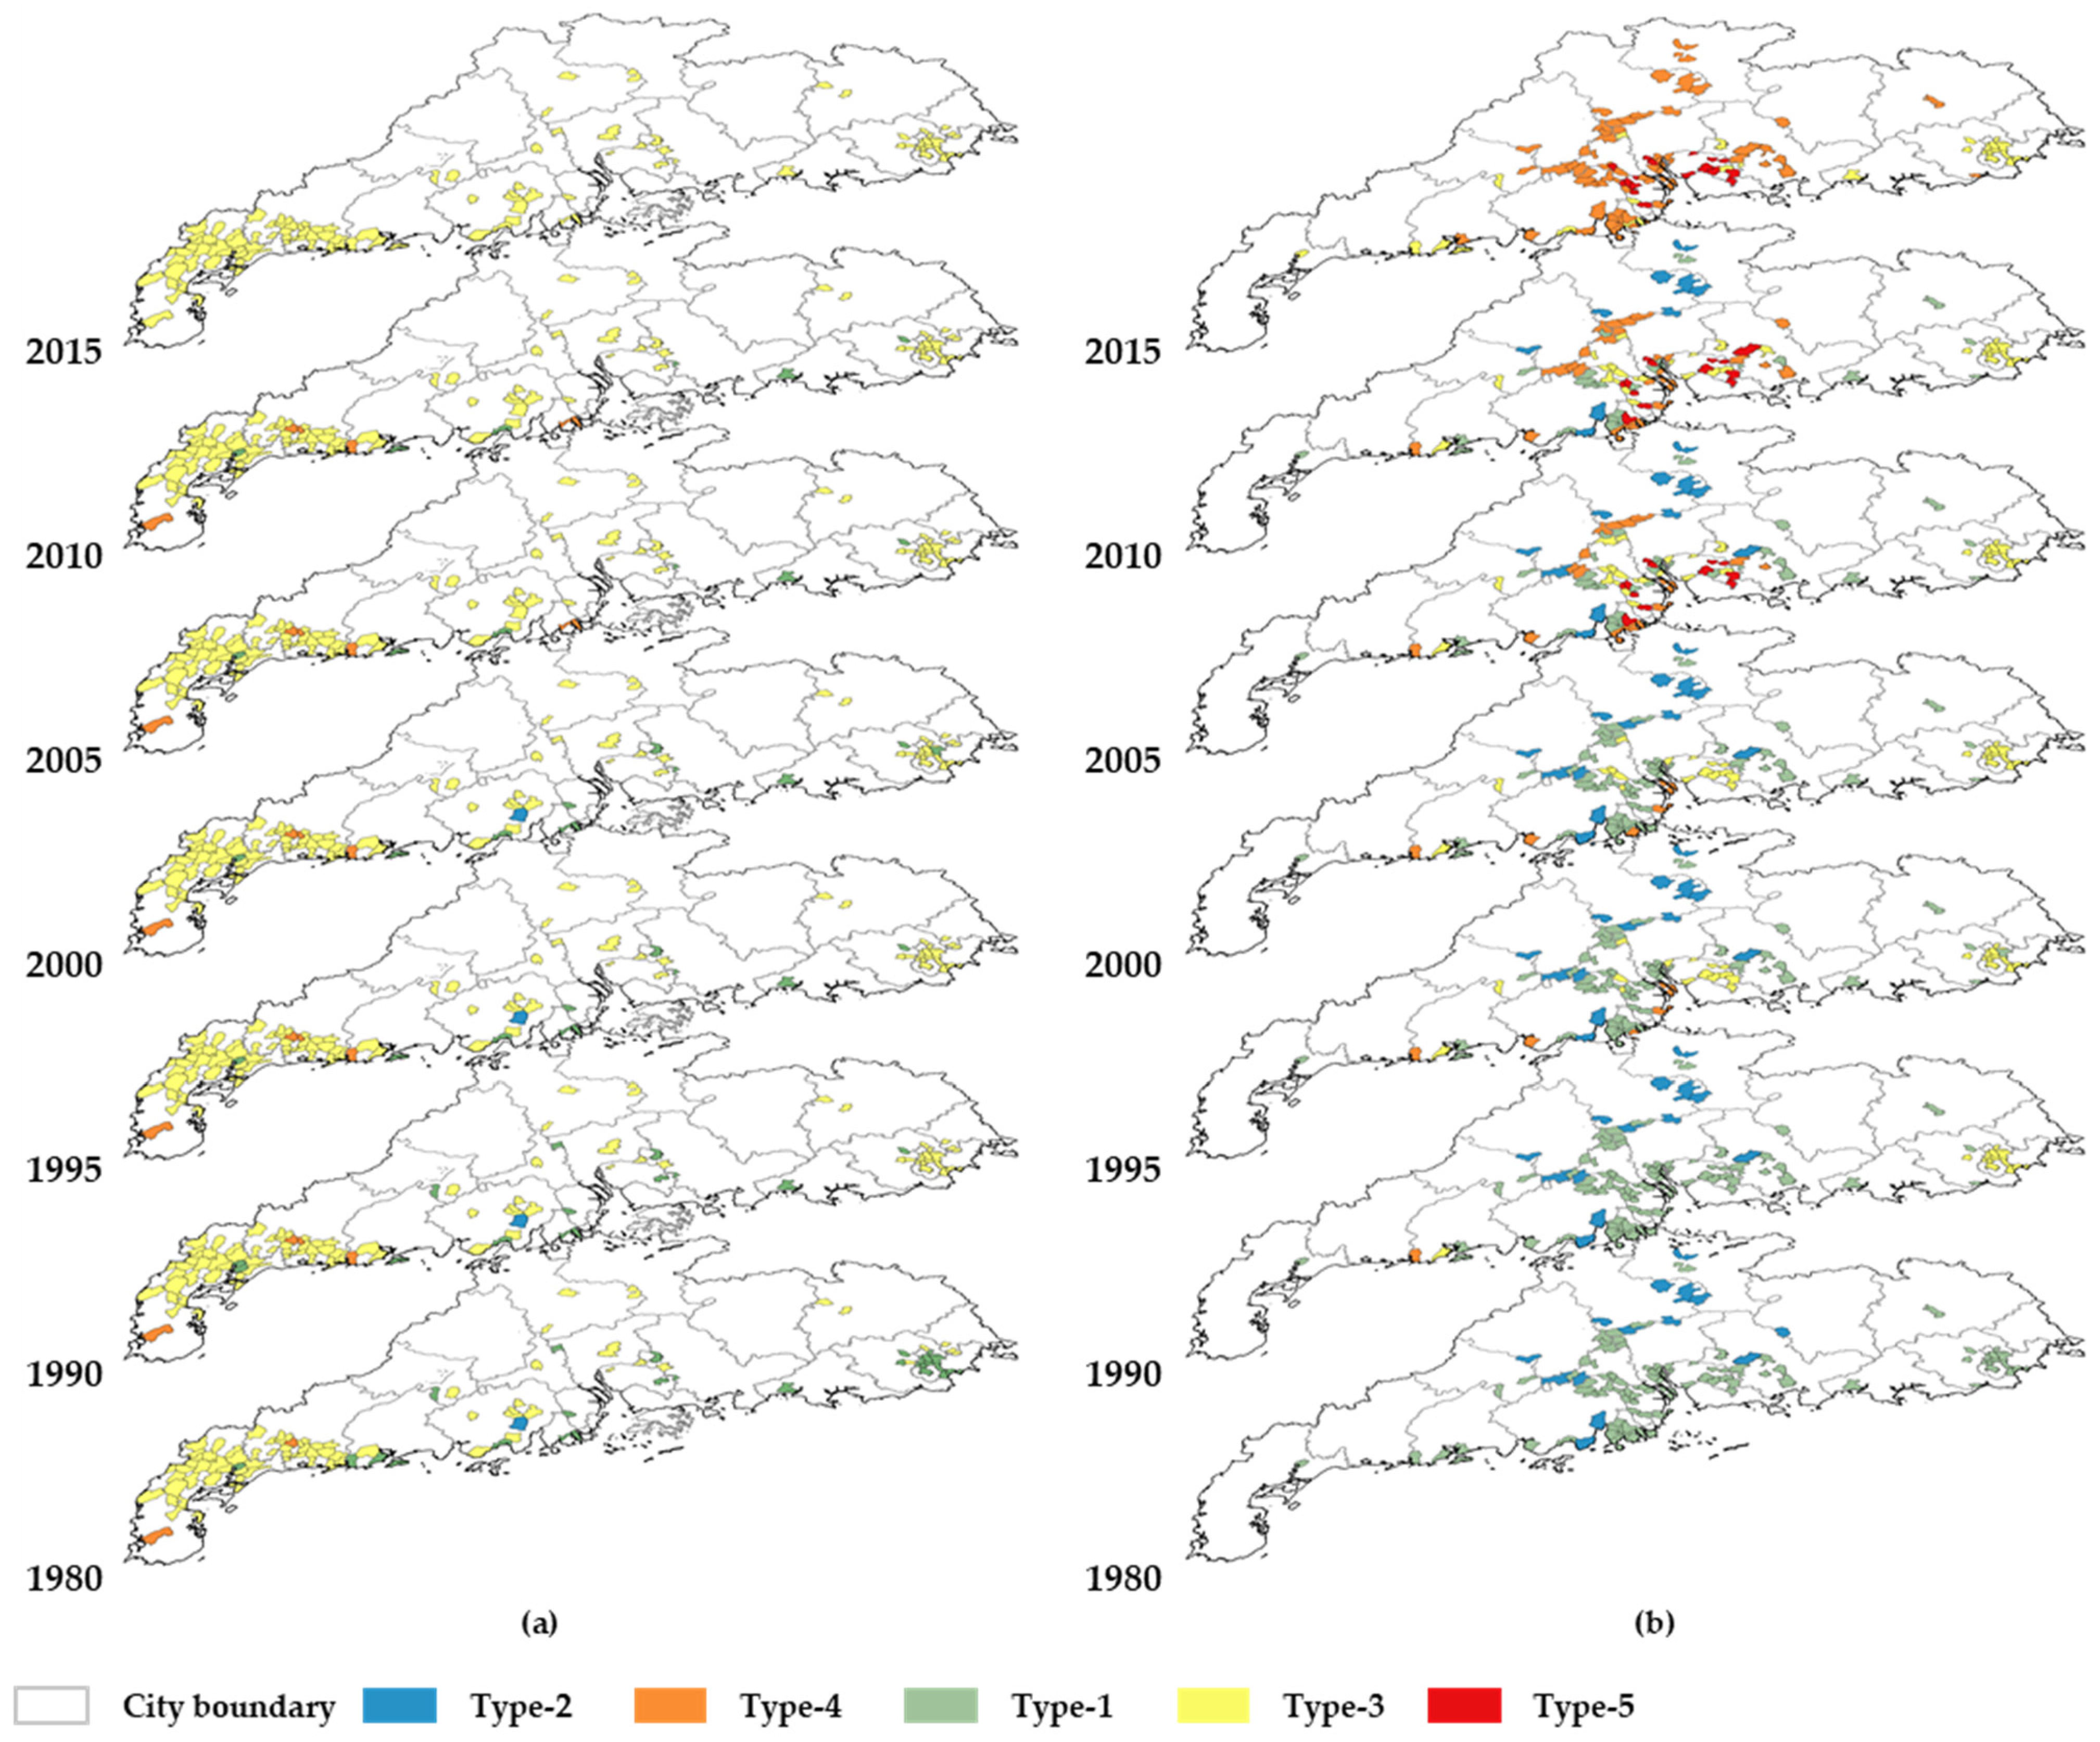
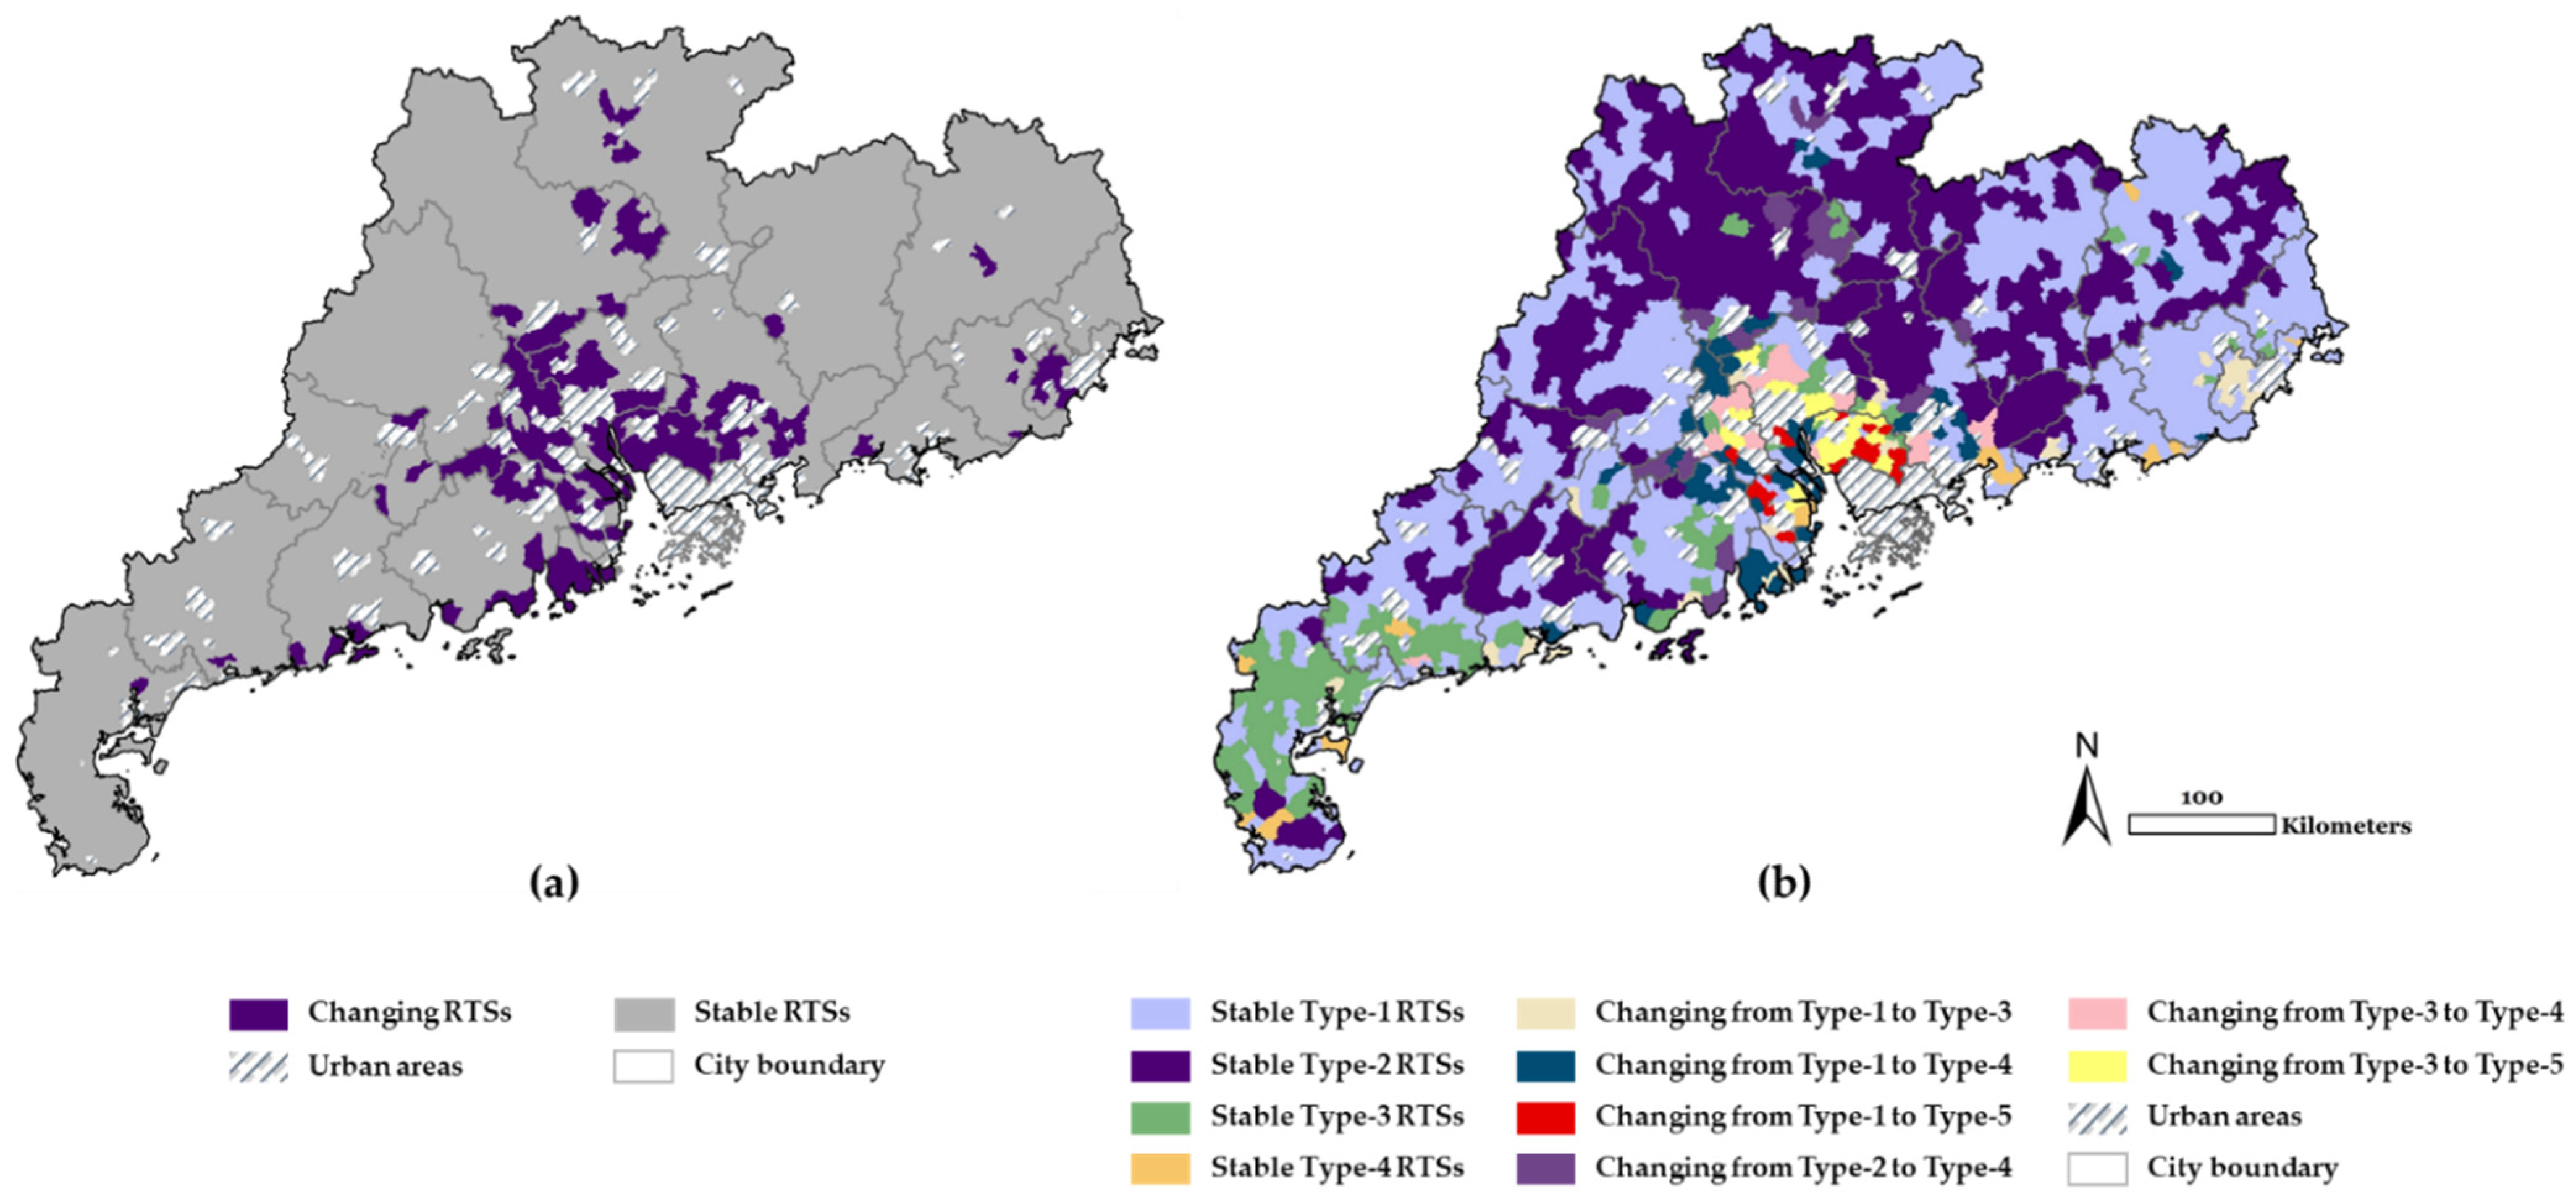
Most RTSs in Guangdong have stable land use patterns, accounting for 88% of all RTSs. Stable RTSs are also widely distributed in the eastern, northern, and western parts of Guangdong, outside the Pearl River Delta (PRD) area (Figure 6). Thus, most stable RTSs are from less wealthy regions, whereas the changing RTSs are mainly distributed in the well-developed PRD region. Hence, because of the rapid urbanization in the PRD area, the region has experienced a significant increase in the proportion of construction land, resulting in a dramatic change in the land use patterns in RTSs, in addition to some RTSs outside the PRD area that have also undergone a transformation in their land use structure, as shown in Figure 6.
Overall, the 10 types of RTSs by sequence, as shown in Figure 5, were found to exhibit varying evolution features from 1980 to 2015. Figure 6b shows the specific spatial distribution of these 10 types of RTSs. The land use change details and geographical distribution characteristics of these 10 types of RTSs are summarized as follows:
- (a)
- DNA-1 (stable Type-1 RTSs): This type of RTS has a stable sequence of a Type-1 land use structure from 1980 to 2015 without much change. This type has 701 RTSs (61%) and is the largest group among the 10 partitions of RTS DNA. This group is mostly distributed outside the PRD region, mainly in the cities of Shantou, Shanwei, Jieyang, Chaozhou, and Meizhou in Eastern Guangdong, as well as the cities of Jiangmen, Yunfu, Zhaoqing, Yangjiang, and Maoming on the west side of the Pearl River;
- (b)
- DNA-2 (stable Type-2 RTSs): The DNA sequences of this type of RTS were stable from 1980 to 2015 and were the second largest type, accounting for 19% of the total. In terms of spatial distribution, these RTSs resemble a ring around the periphery of the PRD, mostly in Shaoguan, Qingyuan, and Heyuan in Northern Guangdong. In the PRD, some RTSs in the outer suburbs of Guangzhou, Huizhou, Zhaoqing, and Jiangmen also belong to this pattern;
- (c)
- DNA-3 (stable Type-3 RTSs): The longitudinal sequence of stable Type-3 refers to the RTSs that have remained as Type-3 for most of the 35 years of the study. A total of 82 RTSs (7%) belong to this type, which have their own characteristic rural industries and, therefore, contain the largest area of rural residential land. The RTSs of this pattern are mainly concentrated in Zhanjiang and Maoming in Western Guangdong, with some scattered in other areas, such as Xiegang town in Dongguan and Caitang town in Chaozhou;
- (d)
- DNA-4 (stable Type-4 RTSs): A total of 15 RTSs are assigned to this group, representing their long-term maintenance in Type-4. These RTSs have a high percentage of nonresidential construction land, around 8%. They are also mainly distributed in the border areas of Guangdong, including the coastal and provincial border;
- (e)
- DNA-5 (changing from Type-1 to Type-3): In total, 26 RTSs comprise this category in the study area, indicating that they have experienced a significant increase in rural residential land use. This is reflected in the RTS DNA, which changed from Type-1 at the beginning to Type-3 later on. Such RTSs are mainly located in the coastal cities of Guangdong, most of them in Shantou;
- (f)
- DNA-6 (changing from Type-1 to Type-4): This type of RTS has a changing sequence from Type-1 to Type-4, representing an expansion of nonresidential land from 1980 to 2015. This type has 47 RTSs (4%) and is mostly located outside the non-core areas of the PRD, such as Pingtan Town in the suburbs of Huizhou. Pingtan is a large agricultural RTS and also a satellite town in Huizhou. It contains several industrial parks, which attract enterprises to settle in the town, causing the gradual conversion of cultivated land into construction land and the change of the DNA sequence;
- (g)
- DNA-7 (changing from Type-1 to Type-5): This seventh group of longitudinal trajectories constitutes RTSs that have followed a DNA sequence from Type-1 to Type-5, signaling an upgrading process from 1980 to 2015. Spatially, the 17 RTSs in this group are all located in the core cities of the PRD, including Guangzhou, Dongguan, Foshan, and Zhongshan. The well-developed Chang’an Town in Dongguan belongs to this category. During the process of reform and opening up, Chang’an realized rural industrialization and gradually developed into an urban area, with much of the cultivated and ecological land changing to construction land;
- (h)
- DNA-8 (changing from Type-2 to Type-4): The DNA sequences of this group changed from Type-2 (ecologically dominant) in 1980 to Type-4 (mixed construction) in 2015. Only 14 RTSs (1%) constitute this type, the fewest of all RTS DNA sequences. They are scattered in the central part of Guangdong, including a small number of RTSs in the PRD and Northern Guangdong. A typical example of this pattern is Genghe Town in Foshan, which has achieved rapid expansion of construction land through the optimization of industrial structure and investment attraction;
- (i)
- DNA-9 (changing from Type-3 to Type-4): These 15 RTSs, constituting 1% of the RTSs in the study area, follow a DNA sequence transition from Type-3 (rural construction) to Type-4 (mixed construction) in the time period. The spatial distribution map of this type of RTSs shows that most of them (93%) are located in the core cities of the PRD, including Guangzhou, Foshan, Dongguan, and Huizhou;
- (j)
- DNA-10 (changing from Type-3 to Type-5): Overall, the 19 RTSs (2%) in this group exhibit a changing DNA sequence over the 35 years of the study, and they represent RTSs that follow an expansion trend of urban residential land. Located at the core spatial extent of the PRD, these RTSs have a superior location (e.g., Xintang town in Guangzhou and Humen town in Dongguan). Both of these towns received spillover industries from urban areas, resulting in land use changes.
3.3. Discussion: Driving Forces Formulating Land Use Sequences of Rural Town Settlements
In general, the analysis of the driving force is an important reference for formulating the development strategy of backward RTSs. The analysis results of the spatial evolution patterns depict the distribution of various evolution patterns in space, combined with the internal and external conditions of the RTSs (Table 3), and discuss the driving factors of the spatial evolution patterns.
Most of the stable Type-2 RTSs are located in Northern Guangdong, which is a mountainous area. Because of the influence of topographical and geomorphological factors, it is difficult to convert cultivated land into construction land, which limits the spatial evolution process of these RTSs. Generally, RTSs in plain areas can rely on topographic advantages to expand the construction land. For example, in the PRD plains, the processes of rural industrialization driven by rural and urban expansion, urbanization with immigrations from inside and outside the Guangdong Province, and regional urban–rural integration are rapid, and a large number of rural areas have developed into urban areas.
Location is also an important driving force. On the one hand, RTSs adjacent to the city center can be influenced by the city planning. Not only do they have easy access to the city’s basic services, but they can also receive industries that have moved away from the city. Therefore, RTSs close to the city center are well developed. In addition, RTSs located on the borders of two cities can be developed with the help of transportation roads between the cities by provincial or regional transportation planning schemes. On the other hand, RTSs in remote mountainous areas are difficult to develop because of their remote location and poor transportation services.
As the driving force of urban development, industries have also played an important role in spatial evolution. For RTSs of stable land use patterns, their economic development relies on agriculture, lacking endogenous dynamics and external driving forces to promote their development. RTSs of changing land use patterns are guided by industrialization. Meanwhile, some RTSs have better landforms and location conditions, attracting foreign investments and the construction of large-scale industrial parks, which are also guided by dynamic city master plans.
During the spatial evolution of the RTSs in Guangdong, policies have driven land use changes in rural areas [50]. The emergence of the Household Responsibility System has liberated labor in RTSs and helped rural residents realize rural industrialization. A large number of rural laborers moved to the large cities, causing an exodus from remote rural areas and resulting in the land use structure of RTSs being stable for a long time. Finally, it is worth noting that the development of rural areas in the PRD relies on economic reform and opening up in order to attract foreign investments and invest in factories and selling products through foreign trade, in addition to the population influx.
In summary, the study found that RTSs of Guangdong Province have diverse land use evolutionary patterns and are highly polarized in terms of spatial distribution, with a large difference in land use sequences between the PRD and non-PRD regions. These findings are consistent with some existing findings [51]. For example, Ye [52] revealed the differences in land use structure within Guangdong Province, and Cao [53] confirmed the differences in economic aspects among the four regions of Guangdong Province. In addition, the evolution of the spatial structure of land use in the RTS varies with driving forces. The driving forces should be contextually variant in different countries. As found in Lambin’s [54] study on land management, agriculture, and forestry in developing countries, economic globalization, land use regulations, and policies can help developing countries achieve sustainable land use transition. Uisso [55] also analyzed the changes in the amount of arable land in Tanzania and their influencing factors, and found that the economic and demographic factors play more important roles in land use changes. Thus, the findings in this study can enrich the worldwide research on land development trajectories in rural town areas by adding China’s development experiences.
4. Conclusions
In this study, we investigated the spatial evolution process of RTSs from the perspective of long time series longitudinal land use changes. We also applied a SAM to mine the spatial evolution patterns of the RTSs in Guangdong Province and then analyze the influence of basic socio-economic attributes and policy factors. This study helps fill the gap in the study of the vertical and continuous spatial evolution of RTSs. We also applied the new method of neighborhood development pattern mining to the study of rural areas. The results show that, according to the spatial structure of land use, the RTSs in Guangdong can be clustered into five types. Moreover, 10 development patterns of RTSs were observed in Guangdong, which can be divided into RTSs of stable land use patterns and RTSs of changing land use patterns. Notably, most of the RTSs with changing land use patterns (around 73%) are located in the PRD. These findings emphasize the importance of the longitudinal data analysis of RTSs and pattern mining studies of land use trajectories. As shown here, if the land use development patterns of RTSs are not scrutinized, the development of backward areas may be overlooked, exacerbating the problem of polarization between rural areas in the PRD and those in other regions.
We also found that the location, landforms, industries, and policy factors influence the spatial evolution patterns of RTSs. In other words, RTSs located in plains and close to developed cities are more likely to develop rapidly and transform into other types of RTSs. These findings coincide with several recent studies performed in the PRD [56,57,58,59]. However, these studies mostly focused on the PRD region and used cross-sectional data. Therefore, we believe that it is more necessary to focus on the development process of backward regions outside the PRD region while using longitudinal data combined with pattern mining methods in order to coordinate regional development and revitalize the development of rural areas.
In addition, the results of spatial evolution patterns can help guide rural town area planning for rural revitalization. This study reveals the significance of the analysis based on the town scale and its spatial evolution trajectories. In particular, it provides a method for comparing the similarities and differences of the spatial evolution process and patterns of RTSs.
The empirical analysis also reflects many advantages of the SAM applied to spatial evolution pattern mining, such as the high efficiency of the algorithm, consideration of the time series factors, and long time series pattern mining. However, the algorithm has some shortcomings. First, progressive SAM is a greedy algorithm, the result of the sequence alignment is an approximate solution, and it is difficult to obtain an optimal solution. Second, multiple sequence alignment is a nondeterministic polynomial (NP) problem [60]. The evaluation of the result of sequence alignment temporarily lacks a perfect objective function, and none of the present objective functions can cover all aspects of the problem. Hence, converting sequence alignment into network-related data and using complex network analysis algorithms for clustering is considered a potential solution [61,62,63,64].
Some other shortcomings also require further exploration. For example, studying the spatial evolution pattern mining of RTSs is based on the spatial structure of land use. Different spatial structure types of land use help constitute evolutionary sequences and enable evolutionary pattern mining. Therefore, future studies should consider other spatial elements, such as the road network structure, spatial pattern of RTSs, and settlement structure. In addition, the multiple driving factors that promote spatial evolution and spatial differentiation are worthy of an in-depth study. Future sequence alignment studies should also consider both driving factors and multiple spatial evolution sequences to explore the mapping model of multiple driving force and the spatial evolution patterns of RTSs so as to realize a coupling analysis of multiple driving forces and spatial patterns in rural areas.
Author Contributions
Conceptualization, S.X. and W.Z.; Data curation, D.T.; Formal analysis, S.X.; Methodology, S.X. and W.Z.; Software, S.X.; Supervision, W.Z.; Visualization, S.X.; Writing—original draft, S.X., W.Z. and Y.Z.; Writing—review and editing, W.Z. and Y.Z. All authors have read and agreed to the published version of the manuscript.
Funding
This research was funded by the National Key R&D Program of China (Grant No. 2018YFD1100304-2).
Institutional Review Board Statement
Not applicable.
Informed Consent Statement
Not applicable.
Data Availability Statement
Not applicable.
Conflicts of Interest
The authors declare no conflict of interest.
References
- Ellis, E.C.; Kaplan, J.O.; Fuller, D.Q.; Vavrus, S.; Goldewijk, K.K.; Verburg, P.H. Used planet: A global history. Proc. Natl. Acad. Sci. USA 2013, 110, 7978–7985. [Google Scholar] [CrossRef] [PubMed] [Green Version]
- Meyfroidt, P.; Chowdhury, R.R.; de Bremond, A.; Ellis, E.C.; Erb, K.-H.; Filatova, T.; Garrett, R.; Grove, J.M.; Heinimann, A.; Kuemmerle, T. Middle-range theories of land system change. Glob. Environ. Chang. 2018, 53, 52–67. [Google Scholar] [CrossRef]
- Delmelle, E.C. Mapping the DNA of urban neighborhoods: Clustering longitudinal sequences of neighborhood socioeconomic change. Ann. Am. Assoc. Geogr. 2016, 106, 36–56. [Google Scholar] [CrossRef]
- Filion, P.; Hammond, K. Neighbourhood land use and performance: The evolution of neighbourhood morphology over the 20th century. Environ. Plan. B Plan. Des. 2003, 30, 271–296. [Google Scholar] [CrossRef]
- Li, Y.; Xie, Y. A New Urban Typology Model Adapting Data Mining Analytics to Examine Dominant Trajectories of Neighborhood Change: A Case of Metro Detroit. Ann. Am. Assoc. Geogr. 2018, 108, 1313–1337. [Google Scholar] [CrossRef]
- Main Data of the Seventh National Population Census. Available online: http://www.stats.gov.cn/tjsj/tjgb/rkpcgb/qgrkpcgb/202106/t20210628_1818826.html (accessed on 11 May 2021).
- Luo, Y.; Lü, Y.; Liu, L.; Liang, H.; Li, T.; Ren, Y. Spatiotemporal scale and integrative methods matter for quantifying the driving forces of land cover change. Sci. Total. Environ. 2020, 739, 139622. [Google Scholar] [CrossRef]
- Goldewijk, K.K. Estimating global land use change over the past 300 years: The HYDE database. Glob. Biogeochem. Cycles 2001, 15, 417–433. [Google Scholar] [CrossRef]
- Meyer, W.B.; Turner, B.L. Human population growth and global land-use/cover change. Annu. Rev. Ecol. Syst. 1992, 23, 39–61. [Google Scholar] [CrossRef]
- Song, X.-P.; Hansen, M.C.; Stehman, S.V.; Potapov, P.V.; Tyukavina, A.; Vermote, E.F.; Townshend, J.R. Global land change from 1982 to 2016. Nature 2018, 560, 639–643. [Google Scholar] [CrossRef]
- Liu, J.; Kuang, W.; Zhang, Z.; Xu, X.; Qin, Y.; Ning, J.; Zhou, W.; Zhang, S.; Li, R.; Yan, C. Spatiotemporal characteristics, patterns, and causes of land-use changes in China since the late 1980s. J. Geogr. Sci. 2014, 24, 195–210. [Google Scholar] [CrossRef]
- Ning, J.; Liu, J.; Kuang, W.; Xu, X.; Zhang, S.; Yan, C.; Li, R.; Wu, S.; Hu, Y.; Du, G. Spatiotemporal patterns and characteristics of land-use change in China during 2010–2015. J. Geogr. Sci. 2018, 28, 547–562. [Google Scholar] [CrossRef] [Green Version]
- Wang, J.; Chen, Y.; Shao, X.; Zhang, Y.; Cao, Y. Land-use changes and policy dimension driving forces in China: Present, trend and future. Land Use Policy 2012, 29, 737–749. [Google Scholar] [CrossRef]
- Brown, D.G.; Johnson, K.M.; Loveland, T.R.; Theobald, D.M. Rural land-use trends in the conterminous United States, 1950–2000. Ecol. Appl. 2005, 15, 1851–1863. [Google Scholar] [CrossRef] [Green Version]
- Wen, Y.; Zhang, Z.; Liang, D.; Xu, Z. Rural residential land transition in the Beijing-Tianjin-Hebei region: Spatial-temporal patterns and policy implications. Land Use Policy 2020, 96, 104700. [Google Scholar] [CrossRef]
- Long, H.; Liu, Y.; Wu, X.; Dong, G. Spatio-temporal dynamic patterns of farmland and rural settlements in Su–Xi–Chang region: Implications for building a new countryside in coastal China. Land Use Policy 2009, 26, 322–333. [Google Scholar] [CrossRef]
- Li, T.; Long, H.; Liu, Y.; Tu, S. Multi-scale analysis of rural housing land transition under China’s rapid urbanization: The case of Bohai Rim. Habitat Int. 2015, 48, 227–238. [Google Scholar] [CrossRef]
- Abd El-Kawy, O.; Rød, J.; Ismail, H.; Suliman, A. Land use and land cover change detection in the western Nile delta of Egypt using remote sensing data. Appl. Geogr. 2011, 31, 483–494. [Google Scholar] [CrossRef]
- Cegielska, K.; Noszczyk, T.; Kukulska, A.; Szylar, M.; Hernik, J.; Dixon-Gough, R.; Jombach, S.; Valánszki, I.; Kovács, K.F. Land use and land cover changes in post-socialist countries: Some observations from Hungary and Poland. Land Use Policy 2018, 78, 1–18. [Google Scholar] [CrossRef]
- Dadashpoor, H.; Azizi, P.; Moghadasi, M. Land use change, urbanization, and change in landscape pattern in a metropolitan area. Sci. Total Environ. 2019, 655, 707–719. [Google Scholar] [CrossRef]
- Tian, L.; Ge, B.; Li, Y. Impacts of state-led and bottom-up urbanization on land use change in the peri-urban areas of Shanghai: Planned growth or uncontrolled sprawl? Cities 2017, 60, 476–486. [Google Scholar] [CrossRef]
- Liu, T.; Yang, X. Monitoring land changes in an urban area using satellite imagery, GIS and landscape metrics. Appl. Geogr. 2015, 56, 42–54. [Google Scholar] [CrossRef]
- Liu, Y.; Yang, Y.; Li, Y.; Li, J. Conversion from rural settlements and arable land under rapid urbanization in Beijing during 1985–2010. J. Rural. Stud. 2017, 51, 141–150. [Google Scholar] [CrossRef]
- Zhou, Y.; Li, X.; Liu, Y. Land use change and driving factors in rural China during the period 1995–2015. Land Use Policy 2020, 99, 105048. [Google Scholar] [CrossRef]
- Kleemann, J.; Inkoom, J.N.; Thiel, M.; Shankar, S.; Lautenbach, S.; Fürst, C. Peri-urban land use pattern and its relation to land use planning in Ghana, West Africa. Landsc. Urban Plan. 2017, 165, 280–294. [Google Scholar] [CrossRef]
- Yin, J.; Zhao, X.; Zhang, W.; Wang, P. Rural Land Use Change Driven by Informal Industrialization: Evidence from Fengzhuang Village in China. Land 2020, 9, 190. [Google Scholar] [CrossRef]
- Liu, Y.; Yang, R.; Long, H.; Gao, J.; Wang, J. Implications of land-use change in rural China: A case study of Yucheng, Shandong province. Land Use Policy 2014, 40, 111–118. [Google Scholar] [CrossRef]
- Huang, B.; Huang, J.; Gilmore Pontius, R.; Tu, Z. Comparison of Intensity Analysis and the land use dynamic degrees to measure land changes outside versus inside the coastal zone of Longhai, China. Ecol. Indic. 2018, 89, 336–347. [Google Scholar] [CrossRef]
- Liu, J.; Liu, M.; Zhuang, D.; Zhang, Z.; Deng, X. Study on spatial pattern of land-use change in China during 1995–2000. Sci. China Ser. D Earth Sci. 2003, 46, 373–384. [Google Scholar]
- Hemmavanh, C.; Ye, Y.; Yoshida, A. Forest land use change at Trans-Boundary Laos-China Biodiversity Conservation Area. J. Geogr. Sci. 2010, 20, 889–898. [Google Scholar] [CrossRef]
- Zhang, X.; Deng, Y.; Hou, M.; Yao, S. Response of Land Use Change to the Grain for Green Program and Its Driving Forces in the Loess Hilly-Gully Region. Land 2021, 10, 194. [Google Scholar] [CrossRef]
- Kamusoko, C.; Aniya, M. Land use/cover change and landscape fragmentation analysis in the Bindura District, Zimbabwe. Land Degrad. Dev. 2007, 18, 221–233. [Google Scholar] [CrossRef]
- Mikelbank, B.A. Neighborhood Déjà Vu: Classification in Metropolitan Cleveland, 1970–2000. Urban Geogr. 2013, 32, 317–333. [Google Scholar] [CrossRef]
- Delmelle, E.C. Five decades of neighborhood classifications and their transitions: A comparison of four US cities, 1970–2010. Appl. Geogr. 2015, 57, 1–11. [Google Scholar] [CrossRef]
- Ling, C.; Delmelle, E.C. Classifying multidimensional trajectories of neighbourhood change: A self-organizing map andk-means approach. Ann. GIS 2016, 22, 173–186. [Google Scholar] [CrossRef] [Green Version]
- Wei, F.; Knox, P.L. Neighborhood Change in Metropolitan America, 1990 to 2010. Urban Aff. Rev. 2013, 50, 459–489. [Google Scholar] [CrossRef] [Green Version]
- Zhang, W.; Ji, C.; Yu, H.; Zhao, Y.; Chai, Y. Interpersonal and Intrapersonal Variabilities in Daily Activity-Travel Patterns: A Networked Spatiotemporal Analysis. ISPRS Int. J. Geo-Inf. 2021, 10, 148. [Google Scholar] [CrossRef]
- Lee, K.O.; Smith, R.; Galster, G. Subsidized housing and residential trajectories: An application of matched sequence analysis. Hous. Policy Debate 2017, 27, 843–874. [Google Scholar] [CrossRef]
- Needleman, S.B.; Wunsch, C.D. A general method applicable to the search for similarities in the amino acid sequence of two proteins. J. Mol. Biol. 1970, 48, 443–453. [Google Scholar] [CrossRef]
- Hogeweg, P.; Hesper, B. The alignment of sets of sequences and the construction of phyletic trees: An integrated method. J. Mol. Evol. 1984, 20, 175–186. [Google Scholar] [CrossRef]
- Abbott, A. Event sequence and event duration: Colligation and measurement. Hist. Methods 1984, 17, 192–204. [Google Scholar] [CrossRef]
- Han, S.-K.; Moen, P. Work and family over time: A life course approach. Ann. Am. Acad. Political Soc. Sci. 1999, 562, 98–110. [Google Scholar] [CrossRef]
- Shoval, N.; Isaacson, M. Sequence alignment as a method for human activity analysis in space and time. Ann. Assoc. Am. Geogr. 2007, 97, 282–297. [Google Scholar] [CrossRef]
- Zhang, W.; Thill, J.-C. Detecting and visualizing cohesive activity-travel patterns: A network analysis approach. Comput. Environ. Urban Syst. 2017, 66, 117–129. [Google Scholar] [CrossRef]
- Evermann, J.; Thaler, T.; Fettke, P. Clustering traces using sequence alignment. In Proceedings of the International Conference on Business Process Management, Rio de Janeiro, Brazil, 18–22 September 2016; pp. 179–190. [Google Scholar]
- Swarndeep Saket, J.; Pandya, S. An overview of partitioning algorithms in clustering techniques. Int. J. Adv. Res. Comput. Eng. Technol. 2016, 5, 1943–1946. [Google Scholar]
- Hay, B.; Wets, G.; Vanhoof, K. Clustering navigation patterns on a website using a sequence alignment method. In Proceedings of the Intelligent Techniques for Web Personalization: IJCAI 2001, Seattle, WA, USA, 4–10 August 2001; pp. 1–6. [Google Scholar]
- Wang, W.; Zaïane, O.R. Clustering web sessions by sequence alignment. In Proceedings of the 13th International Workshop on Database and Expert Systems Applications, Aix-en-Provence, France, 6 September 2002; IEEE Computer Society: Washington, DC, USA, 2002; pp. 394–398. [Google Scholar]
- Michener, C.D.; Sokal, R.R. A quantitative approach to a problem in classification. Evolution 1957, 11, 130–162. [Google Scholar] [CrossRef]
- Caliński, T.; Harabasz, J. A dendrite method for cluster analysis. Commun. Stat. Theory Methods 1974, 3, 1–27. [Google Scholar] [CrossRef]
- Rousseeuw, P.J. Silhouettes: A graphical aid to the interpretation and validation of cluster analysis. J. Comput. Appl. Math. 1987, 20, 53–65. [Google Scholar] [CrossRef] [Green Version]
- Zhou, L.; Zhang, W.; Fang, C.; Sun, H.; Lin, J. Actors and network in the marketization of rural collectively-owned commercial construction land (RCOCCL) in China: A pilot case of Langfa, Beijing. Land Use Policy 2020, 99, 104990. [Google Scholar] [CrossRef]
- Liu, G.; Wang, H.; Cheng, Y.; Zheng, B.; Lu, Z. The impact of rural out-migration on arable land use intensity: Evidence from mountain areas in Guangdong, China. Land Use Policy 2016, 59, 569–579. [Google Scholar] [CrossRef]
- Ye, Y.; Zhang, J.; Wang, T.; Bai, H.; Wang, X.; Zhao, W. Changes in Land-Use and Ecosystem Service Value in Guangdong Province, Southern China, from 1990 to 2018. Land 2021, 10, 426. [Google Scholar] [CrossRef]
- Cao, Z.; Wu, Z.; Kuang, Y.; Huang, N.; Wang, M. Coupling an Intercalibration of Radiance-Calibrated Nighttime Light Images and Land Use/Cover Data for Modeling and Analyzing the Distribution of GDP in Guangdong, China. Sustainability 2016, 8, 108. [Google Scholar] [CrossRef] [Green Version]
- Lambin, E.F.; Meyfroidt, P. Global land use change, economic globalization, and the looming land scarcity. Proc. Natl. Acad. Sci. USA 2011, 108, 3465–3472. [Google Scholar] [CrossRef] [PubMed] [Green Version]
- Uisso, A.M.; Tanrıvermiş, H. Driving factors and assessment of changes in the use of arable land in Tanzania. Land Use Policy 2021, 104, 105359. [Google Scholar] [CrossRef]
- Ye, Y.; Zhang, H.; Liu, K.; Wu, Q. Research on the influence of site factors on the expansion of construction land in the Pearl River Delta, China: By using GIS and remote sensing. Int. J. Appl. Earth Obs. Geoinf. 2013, 21, 366–373. [Google Scholar] [CrossRef]
- Yang, R.; Zhang, J.; Xu, Q.; Luo, X. Urban-rural spatial transformation process and influences from the perspective of land use: A case study of the Pearl River Delta Region. Habitat Int. 2020, 104, 102234. [Google Scholar] [CrossRef]
- Yang, R.; Chen, Y.; Gong, J. Evolution and regional model of rural development in the Pearl River Delta Region, China, under rapid transformation development. Geogr. Res. 2019, 38, 725–740. [Google Scholar] [CrossRef]
- Liu, Z.; Huang, H.; Werners, S.E.; Yan, D. Construction area expansion in relation to economic-demographic development and land resource in the Pearl River Delta of China. J. Geogr. Sci. 2016, 26, 188–202. [Google Scholar] [CrossRef]
- Wang, L.; Jiang, T. On the complexity of multiple sequence alignment. J. Comput. Biol. 1994, 1, 337–348. [Google Scholar] [CrossRef] [Green Version]
- Zhang, W.; Thill, J.-C. Mesoscale structures in world city networks. Ann. Am. Assoc. Geogr. 2019, 109, 887–908. [Google Scholar] [CrossRef]
- Zhang, W.; Fang, C.; Zhou, L.; Zhu, J. Measuring megaregional structure in the Pearl River Delta by mobile phone signaling data: A complex network approach. Cities 2020, 104, 102809. [Google Scholar] [CrossRef]
Figure 1.
Three paths to fill the matrix.

Figure 2.
(a) The path of tracing backwards; (b) the optimal alignment results of the two sequences.
Figure 2.
(a) The path of tracing backwards; (b) the optimal alignment results of the two sequences.

Figure 3.
Calinski–Harabasz index, silhouette coefficient and inertia index of k-means clustering.

Figure 4.
(a) Land use change sequences/trajectories (from 1980–2015) of the urbanized RTSs (i.e., Type-4 and Type-5) in 2015; (b) land use change sequences/trajectories (from 1980–2015) of the agricultural upgraded RTSs (i.e., Type-3) in 2015.
Figure 4.
(a) Land use change sequences/trajectories (from 1980–2015) of the urbanized RTSs (i.e., Type-4 and Type-5) in 2015; (b) land use change sequences/trajectories (from 1980–2015) of the agricultural upgraded RTSs (i.e., Type-3) in 2015.

Figure 5.
Distribution of land use sequences from 1980 to 2015 of ten types of RTSs.

Figure 6.
(a) Spatial distribution of stable and changing RTSs; (b) spatial distribution of 10 types of RTS ‘DNA’ identified by land use sequences.
Figure 6.
(a) Spatial distribution of stable and changing RTSs; (b) spatial distribution of 10 types of RTS ‘DNA’ identified by land use sequences.


Table 1.
Land use sequence X and Y.
| Land Use Sequence | Land Use Type in Wave 1 | Land Use Type in Wave 2 | Land Use Type in Wave 3 |
|---|---|---|---|
| X of RTS1 | E | R | U |
| Y of RTS2 | E | E | R |
E: Ecologically dominant RTSs, R: Rural construction RTSs, U: Urban construction RTSs.
Table 2.
Average areas and proportions of five land use types of RTSs.
| Typology | Symbol Used in Land Use Sequences | Cultivated Land (km2) | Urban Residential Land (km2) | Rural Residential Land (km2) | Nonresidential Construction Land (km2) | Ecological Land (km2) | Average Land Area (km2) |
|---|---|---|---|---|---|---|---|
| Type-1: Cultivated ecological | C | 28.56 (28.4%) | 0.47 (0.47%) | 2.30 (2.3%) | 0.50 (0.50%) | 68.72 (68.72%) | 100.55 |
| Type-2: Ecologically dominant | E | 43.16 (14.40%) | 0.28 (0.09%) | 2.25 (0.75%) | 0.43 (0.14%) | 253.52 (84.61%) | 299.64 |
| Type-3: Rural construction | R | 60.95 (47.53%) | 1.20 (0.94%) | 12.39 (9.66%) | 1.21 (0.94%) | 52.48 (40.93%) | 128.23 |
| Type-4: Mixed construction | M | 47.86 (33.63%) | 2.68 (1.88%) | 6.41 (4.50%) | 11.88 (8.35%) | 73.50 (51.64%) | 142.33 |
| Type-5: Urban construction | U | 22.60 (22.09%) | 38.87 (37.98%) | 4.95 (4.84%) | 3.28 (3.21%) | 32.63 (31.89%) | 102.33 |
Note: Nonresidential construction land refers to land used in factories and mines, large industrial areas, oil fields, saltworks, quarries, along with special land for transportation infrastructure. Ecological land includes forest land, grassland, water, and unused land.
Table 3.
Potential driving forces leading to 10 types of land use sequences of RTSs.
| Land Use DNAs | Location in Guangdong Province | Landforms | Location Related to Cities | Industries | Land Use Policies |
|---|---|---|---|---|---|
| Stable Primitive Agriculture | northern | mountainous area | remote mountainous area | traditional agriculture | Household Responsibility System |
| Stable Agriculture | eastern and western | mountainous area, hill | remote area | traditional agriculture | Household Responsibility System |
| Stable Rural Construction | western | plain, hill | outer suburb | traditional agriculture | Household Responsibility System |
| Stable Mixed Construction | Border area | plain | urban fringe | agriculture and fisheries | Household Responsibility System |
| Primitive Agriculture to Mixed Construction | central | mountainous area, plain | urban fringe | rural industry | Household Responsibility System |
| Agriculture to Rural Construction | eastern | plain | urban fringe | rural industry | Household Responsibility System |
| Agriculture to Mixed Construction | urban suburbs in PRD | plain | outer suburb | industrial agglomeration | Economic Reform and opening up |
| Agriculture to Urban Construction | Dongguan, Zhongshan | plain | suburb | foreign investment, industrial agglomeration | Economic Reform and opening up |
| Rural Construction to Mixed Construction | Guangzhou, Foshan | plain | outer suburb | industrial agglomeration | Economic Reform and opening up, Urban renewal |
| Rural Construction to Urban Construction | Dongguan | plain | suburb | foreign investment, industrial agglomeration | Economic Reform and opening up, Urban renewal |
Publisher’s Note: MDPI stays neutral with regard to jurisdictional claims in published maps and institutional affiliations. |
© 2022 by the authors. Licensee MDPI, Basel, Switzerland. This article is an open access article distributed under the terms and conditions of the Creative Commons Attribution (CC BY) license (https://creativecommons.org/licenses/by/4.0/).
Share and Cite
MDPI and ACS Style
Xie, S.; Zhang, W.; Zhao, Y.; Tong, D. Extracting Land Use Change Patterns of Rural Town Settlements with Sequence Alignment Method. Land 2022, 11, 313. https://0-doi-org.brum.beds.ac.uk/10.3390/land11020313
AMA Style
Xie S, Zhang W, Zhao Y, Tong D. Extracting Land Use Change Patterns of Rural Town Settlements with Sequence Alignment Method. Land. 2022; 11(2):313. https://0-doi-org.brum.beds.ac.uk/10.3390/land11020313
Chicago/Turabian StyleXie, Senkai, Wenjia Zhang, Yi Zhao, and De Tong. 2022. "Extracting Land Use Change Patterns of Rural Town Settlements with Sequence Alignment Method" Land 11, no. 2: 313. https://0-doi-org.brum.beds.ac.uk/10.3390/land11020313
Note that from the first issue of 2016, this journal uses article numbers instead of page numbers. See further details here.