Article

Investigation of the Drag-Reduction Phenomenon on Plasma-Modified Surface

by
Gutembergy Ferreira Diniz
1,
Ivan Alves de Souza
1,
João Freire de Medeiros Neto
1,
Anderson Wagner Menezes
1,
Jailson Alves de Souza
1,
Jayme Ortiz
2,
Thércio Henrique de Carvalho Costa
1,*,
Kleiber Lima de Bessa
1 and
Michelle Cequeira Feitor
1
1
Mechanical Post-graduation, Federal University of Rio Grande do Norte—UFRN, Natal 59078-970, Brazil
2
Mechanical Department, São Paulo University—USP, São Paulo 05508-070, Brazil
*
Author to whom correspondence should be addressed.
Submission received: 5 October 2021 / Revised: 16 January 2022 / Accepted: 1 February 2022 / Published: 3 March 2022
(This article belongs to the Special Issue Symmetry in Fluid Flow II)

Abstract

:
Drag is one of the main energy-dissipating phenomena in engineering applications. Drag-reduction mechanisms have been studied to reduce this cost. Superhydrophobic surfaces (SHS) have high water repellency and have been studied as an alternative mechanism for reducing drag. The high level of repellency is due to the hierarchical structures in the micro- and nano-scales, making these surfaces able to trap air layers that impose the condition of slipping. The present work investigated the phenomenon of drag reduction on surfaces made of Sylgard® 184 elastomer and modified by low-pressure plasma treatments. Atmospheres with 40% Argon and 60% Acetylene, and 20% Argon and 80% Acetylene were used, varying the treatment times from 10 to 15 min of exposure to Acetylene. The surface, morphological and chemical modifications were confirmed by XPS and AFM analyses, showing the impression of a rough structure on the nanometric scale with deposition of chemical elements from the gas plasma. Furthermore, the obtained SHS showed lower resistance to flow, tested by the imposition of flow in channels.

1. Introduction

The interaction between a fluid in movement and a solid generates considerable energy losses due to resistance to flow, also called drag. Minimizing drag losses is beneficial for a multitude of industries, such as the naval and aeronautics industries [1,2,3,4,5,6]. Still, in the 1940s, it was discovered that the addition of small amounts of soluble polymers with a high molecular weight was affected by flow resistance without affecting the viscosity or density of the fluid in turbulence [7]. This phenomenon became known as the Toms effect, in honor of its discoverer, and the polymers used were called drag-reducing polymers (DRPs) because they manage to generate pressure drops between 50–80% [8].
The drag-reduction phenomenon studied by Toms was analyzed and used in the oil industry [9] and maritime industries [10]. The use of DRPs was also investigated in biomedicine, where it has been studied since the 1980s. Their action was studied in the cardiovascular system of model animals, where an increase in blood flow and a reduction in vascular resistance was observed, without direct effects on blood viscosity or blood vessel tone [11]. The use of DRPs has also been investigated in arterial beds of normotensive and hypertensive rat tails, demonstrating their efficiency in reducing the pressure-flow response [12,13].
Since its discovery, the application of the drag-reduction phenomenon has been expanded and interpreted in different ways. Drag reduction in turbulent flows was achieved through other mechanisms, such as adding bubbles [5], air layers [14], and longitudinal grooves called riblets [15].
Surfaces with special wettability, such as superhydrophobicity, superhydrophilicity [16], superoleophobicity, and superoleophilicity, have aroused interest in several areas of study, such as material science, biophysics, mechanics, oil, and automobiles. The state of superhydrophobicity is activated through the combination of surface roughness in the nano- and/or micro-scales, with a low surface-energy chemistry, typical of hydrocarbon or fluorocarbon coatings [17]. Superhydrophobic surfaces (SHSs) have a high level of water repellency, desirable self-cleaning, antifouling, anti-stain properties, and have been studied as a new drag-reducing mechanism [16,18,19,20,21,22].
As an alternative to obtain a superhydrophobic surface, the plasma deposition technique can assist in the synthesis and texturing process of such surfaces [23]. This modification can be made in a variety of materials, from ceramics [24] to glass [25,26], textile materials [27], polymeric composites [28,29], and even metals, for example, AISI 304 stainless steel [30]. Existing coating systems used for the preparation of superhydrophobic surfaces use the plasma-enhanced chemical vapor deposition technique (PECVD) [31,32].
The inorganic polymer polydimethylsiloxane (PDMS) is a synthetic silicone that, after the curing period, already has characteristics of a hydrophobic material [18]. The superficial modification of PDMS elastomers can print characteristics of an SHS with greater potential for specific biomedical applications [33]; these polymers have been studied because they have characteristics such as low surface tension, high flexibility, and transparency. Besides, they are used in biomedical applications [34,35].
The current literature that studies the drag-reduction (DR) phenomenon is largely focused on its investigation using DRPs [36,37]. Studies show the diverse and important applications of the DR phenomenon showing its potential benefits in biomedical applications [11,38,39].
Although PDMS has been extensively investigated, the increase in their hydrophobic state using plasma as a surface modification technique, mainly in parallel with DR, is still not widespread. Based on this, this study aims to carry out a qualitative investigation of the DR phenomenon on a PDMS surface modified, physically and chemically, by plasma. This work seeks to obtain a significant increase in the level of hydrophobia and, consequently, an improvement in the reduction of resistance to flow over surfaces. To this end, the commercial PDMS elastomer Sylgard® 184, manufactured as a flat surface and in the form of a tube, will be superficially modified through low-pressure plasma treatment, and subsequently subjected to flows for investigation of the drag.

2. Materials and Methods

The research was carried out in practically two main stages. The first consisted of investigating the influence of plasma treatment on surface, chemical, and morphological changes in Sylgard® 184 silicone packaging. In this stage, several treatments were carried out, aiming to find the best parameter for obtaining super-hydrophobia in the treated silicone. The second stage turned to investigate the drag-reduction phenomenon.

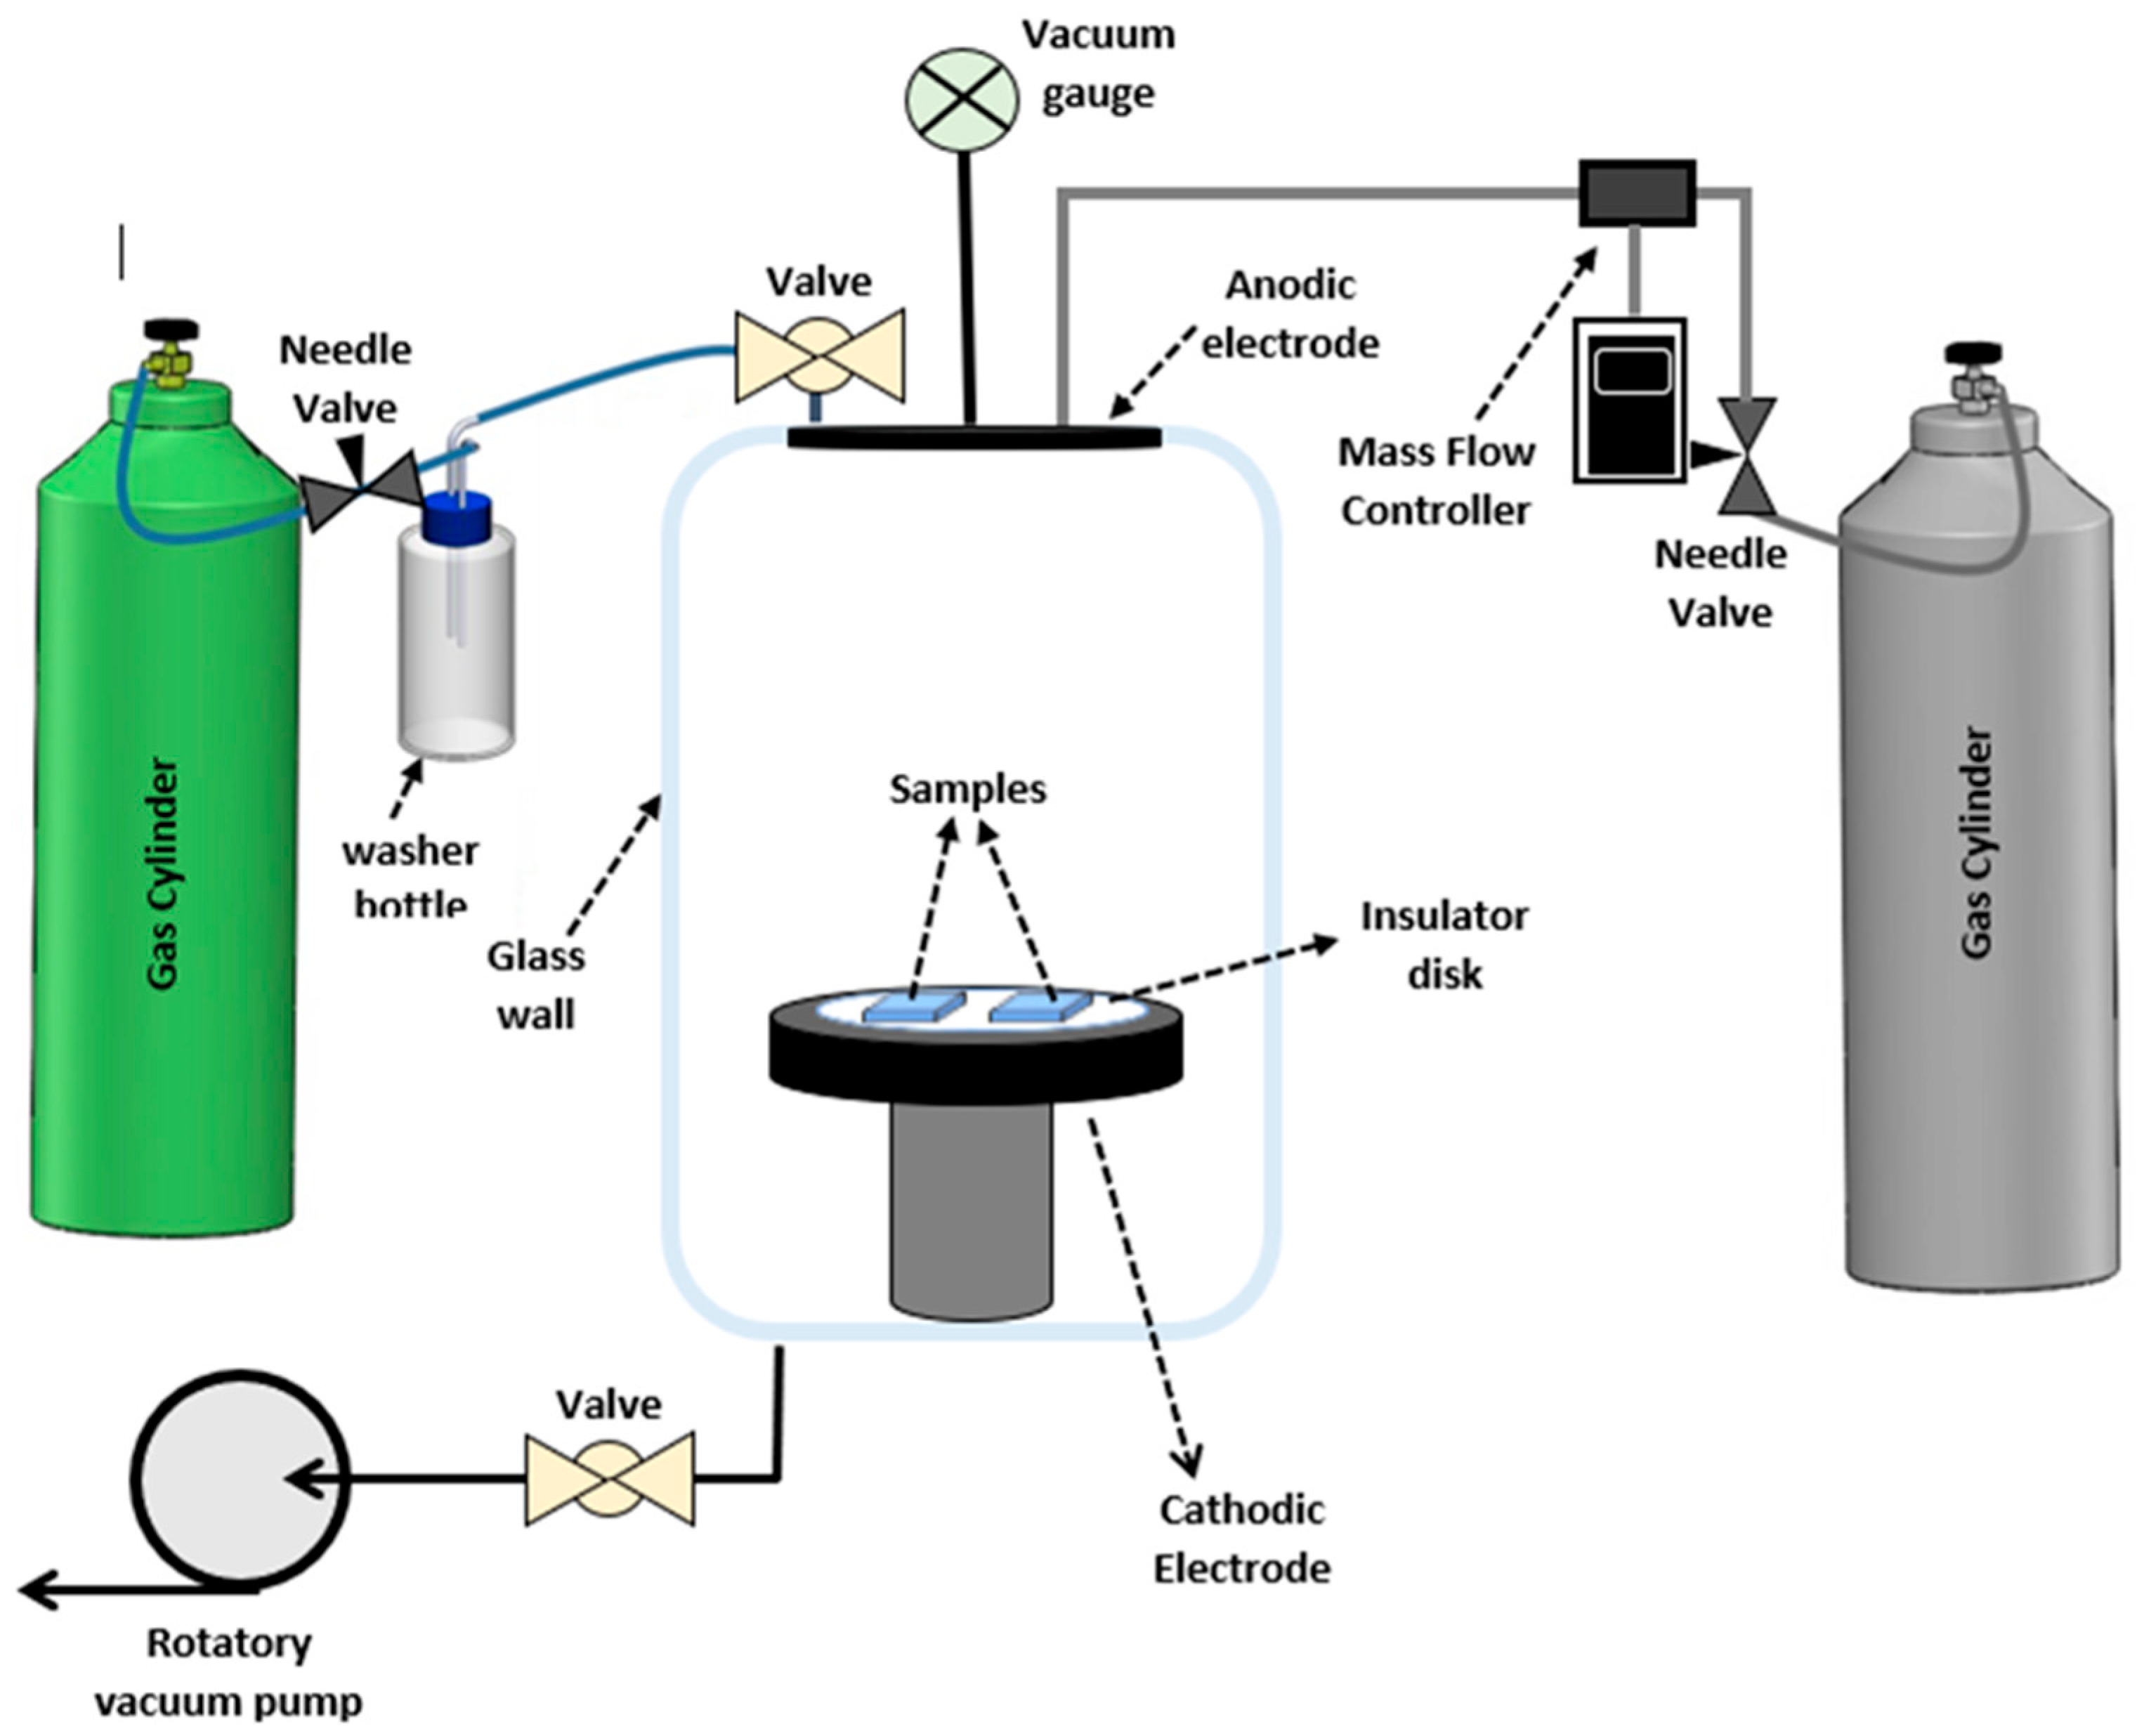
2.1. Surface Modification

Sylgard® 184 is a PDMS elastomer manufactured by Dow Corning; the choice of this material for conducting the research is related to the flexibility, biocompatibility properties of the PDMS and the possibility of surface modification by plasma. The preparation was carried out obeying the volumetric ratio of 10:1 and curing for 48 h at room temperature as recommended by the manufacturer. After curing and demolding, the samples were cut with a dimension of 25 mm × 25 mm × 2 mm.
The cut samples were initially cleaned with anionic detergent and water to remove more impurities and grease, followed by an ultrasonic bath in distilled water for 10 min and dried with the aid of a hot blower, only then to be positioned in the plasma reactor.
The plasma reactor configuration used two gas entrance, and in this work a DC plasma discharge was used, as illustrated by the schematic in Figure 1 [40,41,42]. The mixture from the flask, carrier gas plus vapor from the gas plasma, entered the reactor chamber in a controlled manner through a fine adjustment valve, two valves for pressure control, and adjustment of gas concentration in the reactor were used, as shown in Figure 1. One valve is positioned between the washer bottle and the reactor and the other valve between the reactor and vacuum pump. Regarding the proportion of gases, it should be noted that this refers to the flow defined in the controllers, since chloroform is a volatile liquid at low pressure. Thus, a valve was added between the washer bottler and reactor to maintain constant pressure during the deposition process. The plasma was generated after the precise control of the atmosphere, that is, stabilization between the vapor pressure of the Chloroform and the pressure of the reactor, ensuring the constant concentration of the gas during the process. The gases used to perform this work were argon (Ar) and acetylene (C2H2). The treatments were performed using Ar and then acetylene as the carrier gas; this gas exchange was made to understand the best configuration of final super-hydrophobia obtained. The gas plasma used was chloroform (CHCl3), which, together with acetylene, was intended to facilitate the breaking of bonds in Sylgard®184 and to form an apolar film anchored on the surface.
The treatments were carried out in two variants, using three samples for each. In the first, Ar was used as a carrier gas, and acetylene entered the chamber free. The second variant inverted the gases used in the first variant; acetylene became the carrier gas, and Ar started to enter free. The objective of the pretreatment was to try to print a roughness pattern to improve adherence of the deposited film to the polymerizing solution. The plasma processing variables are shown in Table 1.
Another guiding parameter in carrying out the treatments was the pressure inside the chamber. It was observed that the use of the washing bottle contributed to the increase in pressure and the extinction of the plasma. Thus, it was necessary to insert a flow-adjustment valve to control the entrance of gas and, consequently, regulate the pressure level of the treatments, which was always maintained at 1.0 ± 0.02 mBar.

2.2. Analytical Methods

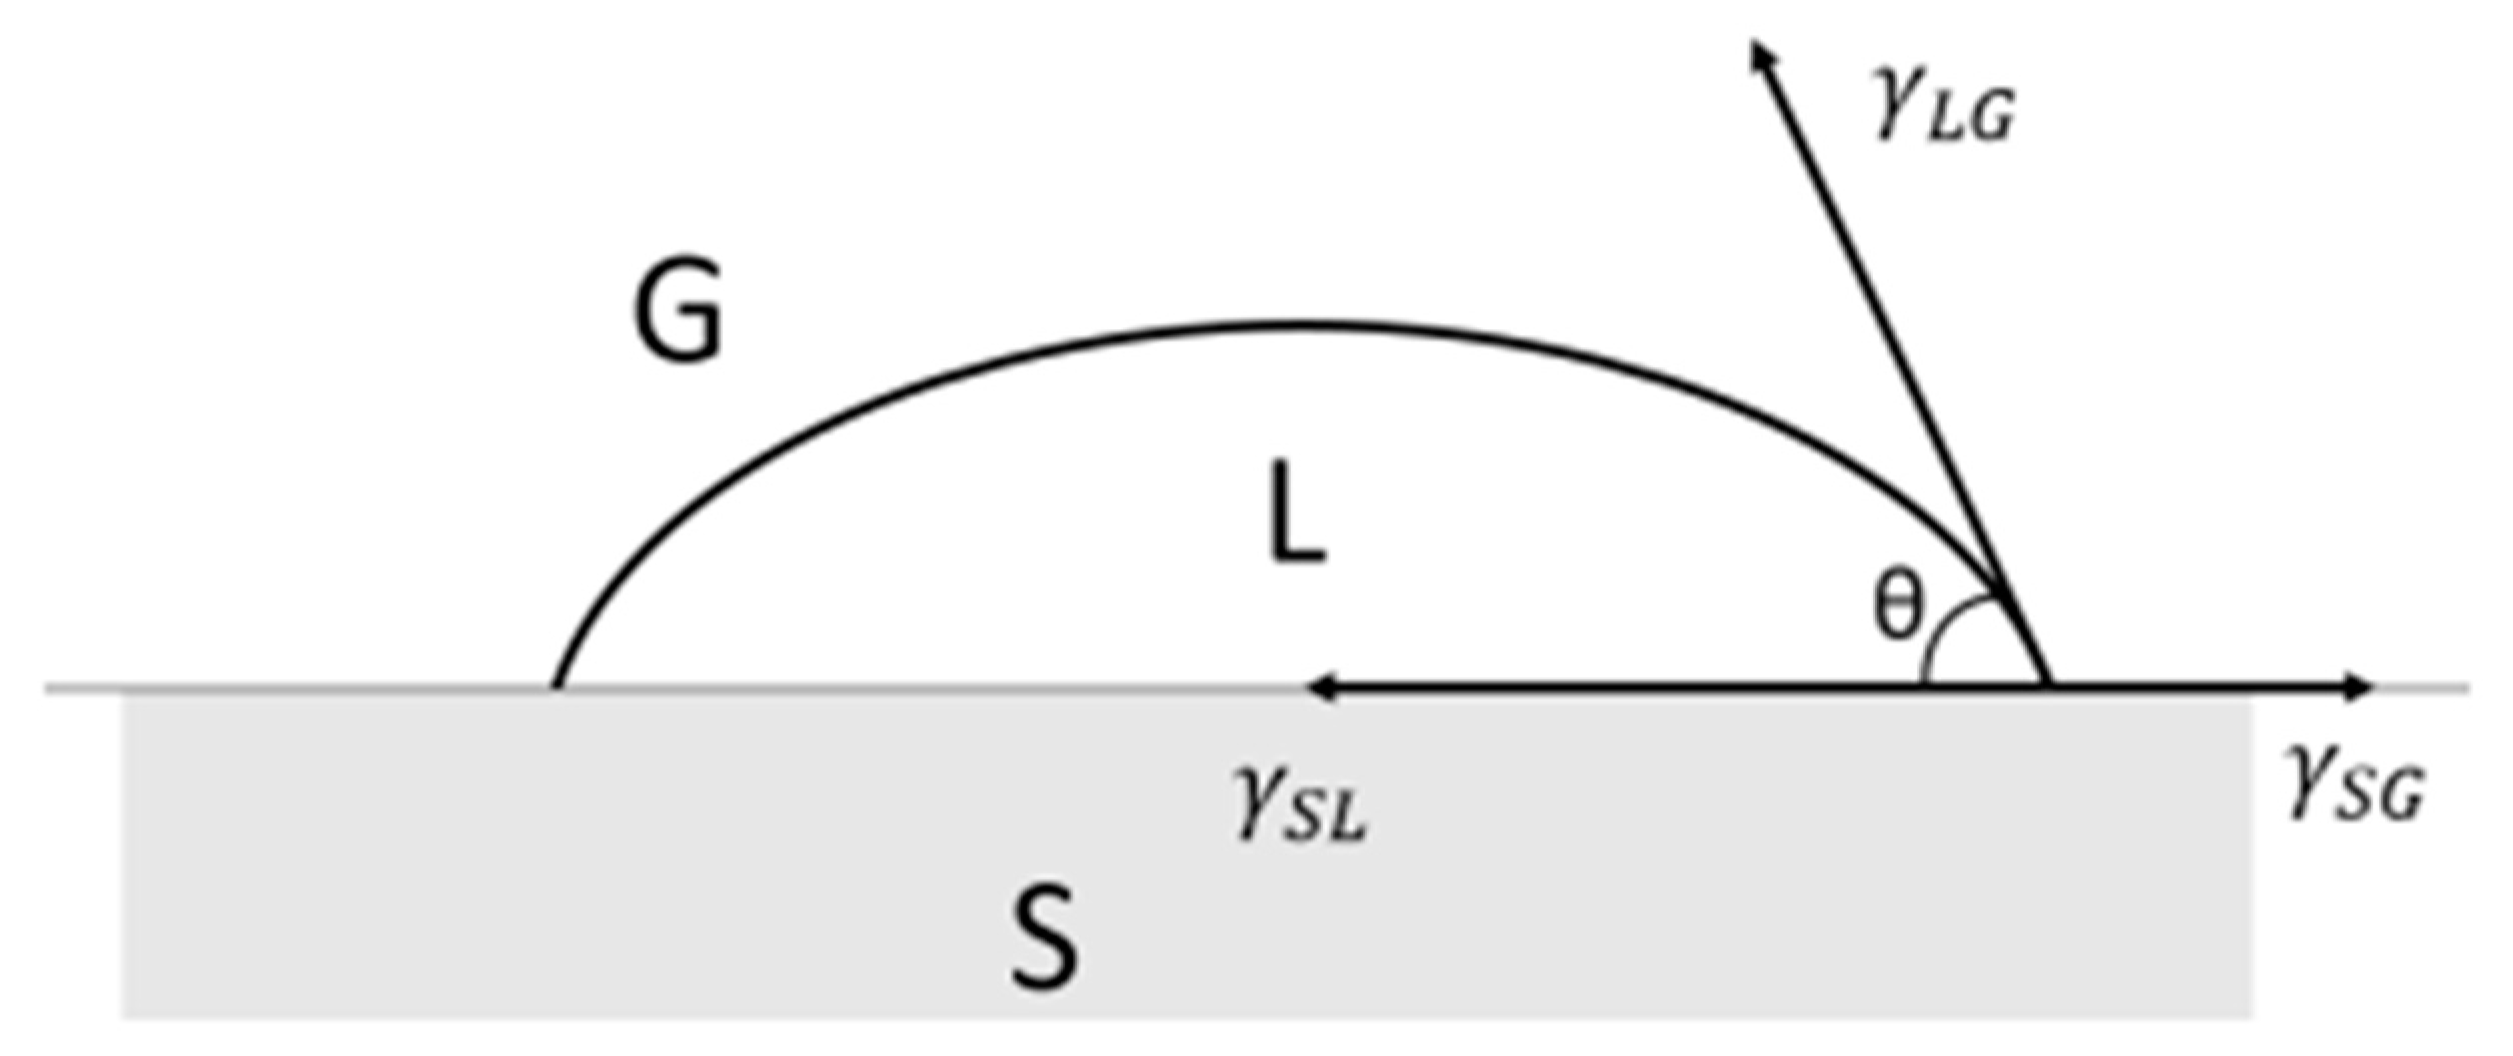
2.2.1. Contact Angle

Contact-angle characterization investigates important material properties, such as adhesion, friction, wettability, biocompatibility, among others [43,44,45]. Surface properties are monitored through contact-angle measurements, and these are: surface tension; acid–base interactions; polar-free surface energy; and dispersive components [46]; surface orientation of functional groups; roughness; and surface contamination [47].
The sessile drop contact angle method is the most common method for surface tension measurements of materials. The liquid drop acts as a probe, responding to interactions with surface functional groups and physically with surface roughness [46]. A liquid droplet deposited on a surface, as shown in Figure 2, represents a relationship between the interfacial tensions of the three phases present (solid, liquid and gas/vapor). This relationship is given by Equation (1), called the Young equation.
γ L G cos θ = γ S G γ S L
where: γ L G is the liquid–gas surface tension; γ S G is the solid–gas surface tension; γ S L is the solid–liquid surface tension; and θ is the contact angle.
Surfaces with greater affinity to water, called hydrophilic, have θ < 90 ° and, therefore, greater wettability. Young’s formulation shows that the smallest contact of water with the surface, i.e., γ S G < γ S L , occurs for contact angles greater than 90 ° . Thus, SSH’s are defined as having minimal or no contact with water and, by definition, θ > 150°. Thus, SHS’s are those that have minimal or no contact with water and, by definition, have θ > 150°. SHs’s are also characterized by having low inclination angles for slipping (roll-off angle), less than 5 ° [48].
In this paper, the samples were analyzed using contact-angle measurements performed with drops of 20 μL in volume, carefully deposited by a pipettor. The drop deposited on the surface was filmed in real-time, and the contact angle formed with the surface was measured.

2.2.2. X-ray Photoelectron Spectroscopy (XPS)

The characterization of samples by the XPS technique is highly relevant to the analysis of thin-layered surfaces and an essential tool for identifying and quantifying chemical elements and their interactions on the surface of solids, such as the chemical composition of the surface. XPS has been used extensively in polymer surface studies, as it is a non-destructive spectroscopic technique and performs analysis of binding energies and their intensities. The samples were analyzed using the following techniques: XPS, performed by the Nanostructured Soft Materials Laboratory of the Brazilian Nanotechnology National Laboratory (LNNano); using a Theta Probe appropriate for use on ultrathin films; using a ThermoFísher K-alpha X-ray Photoelectron Spectrometer equipment. Survey and core-level spectra were obtained with Al Kα monochromatic X-rays (1486.69 eV) with a resolution of 0.7 eV. The residual pressure in the analysis chamber during scans was kept below 10−5 Pa. The peak area ratios for various elements were corrected by experimentally determined instrumental sensitivity factors (within ± 10% accuracy). Core-level C 1s, Cl 2p and O 1s spectra, after Shirley background subtraction, were curve-resolved using a Gaussian line shape with Lorentzian broadening function. The deconvolution was conducted by keeping approximately equal full-width half maxima (FWHM) for all the components in various spectra to give the best fit.

2.2.3. Atomic Force Microscopy (AFM)

The topographic profile of the surface of the films was studied with the aid of an atomic force microscope (AFM), model SPM 9700, manufactured by SHIMADZU. The equipment belongs to the Materials Engineering Department and is located in the Materials Structural Characterization Laboratory. The images were taken in intermittent contact operation mode, with a scanning area equal to 5.0 µm × 5.0 µm, resonance frequency equal to 320 kHz, and constant force estimated at 42 N/m.

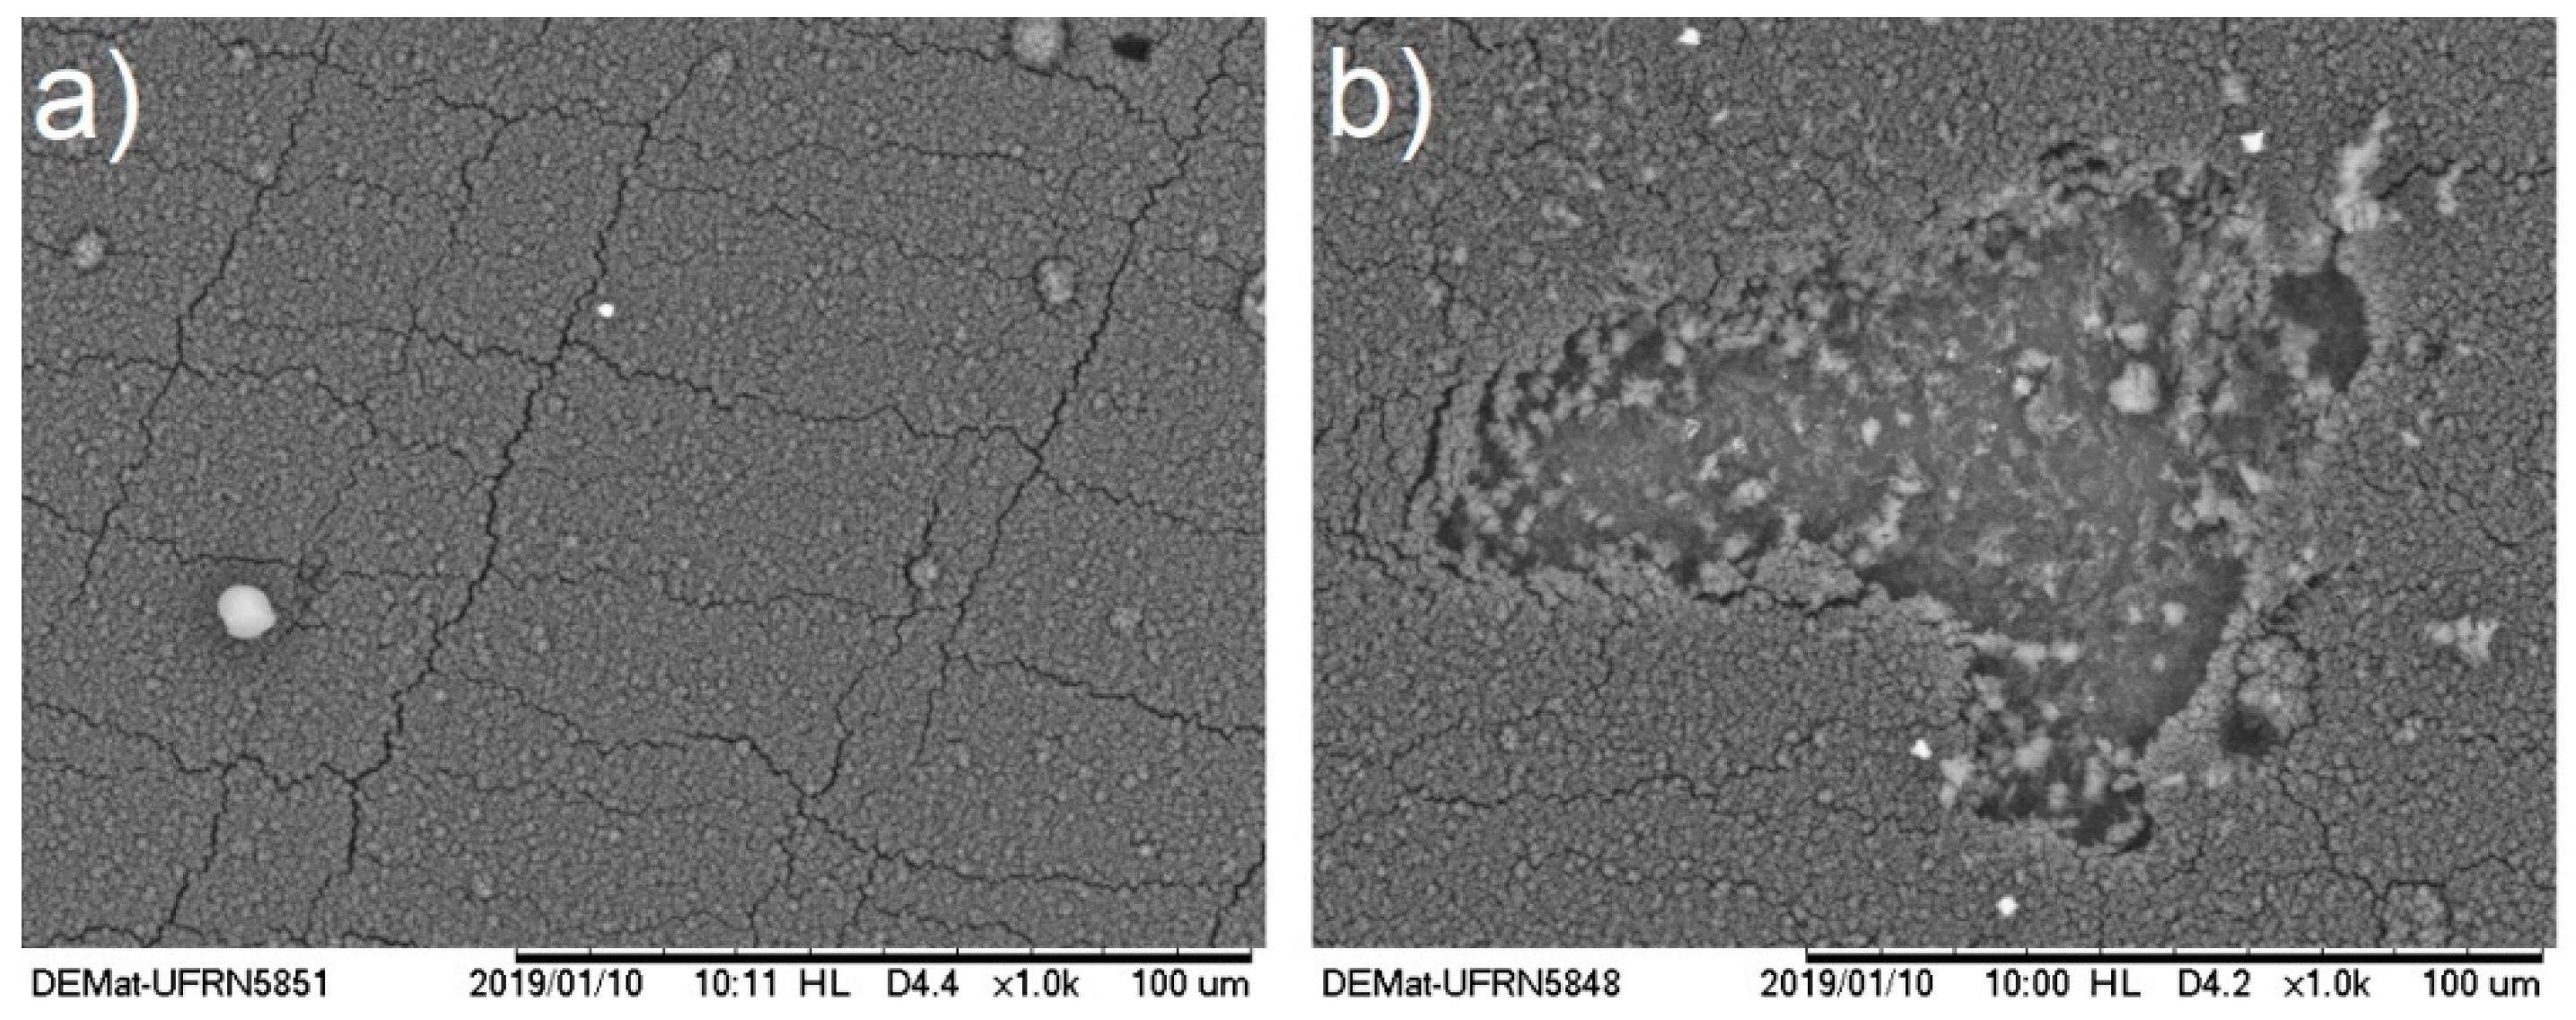
2.2.4. Field-Emission Scanning Electron Microscope (FEG-SEM)

The surface morphology was analyzed with the help of a field-emission scanning electron microscope (FEG-SEM), Zeiss Auriga 40 models, with high resolution. The equipment is also part of the set of characterizations available at the Materials Engineering Department.

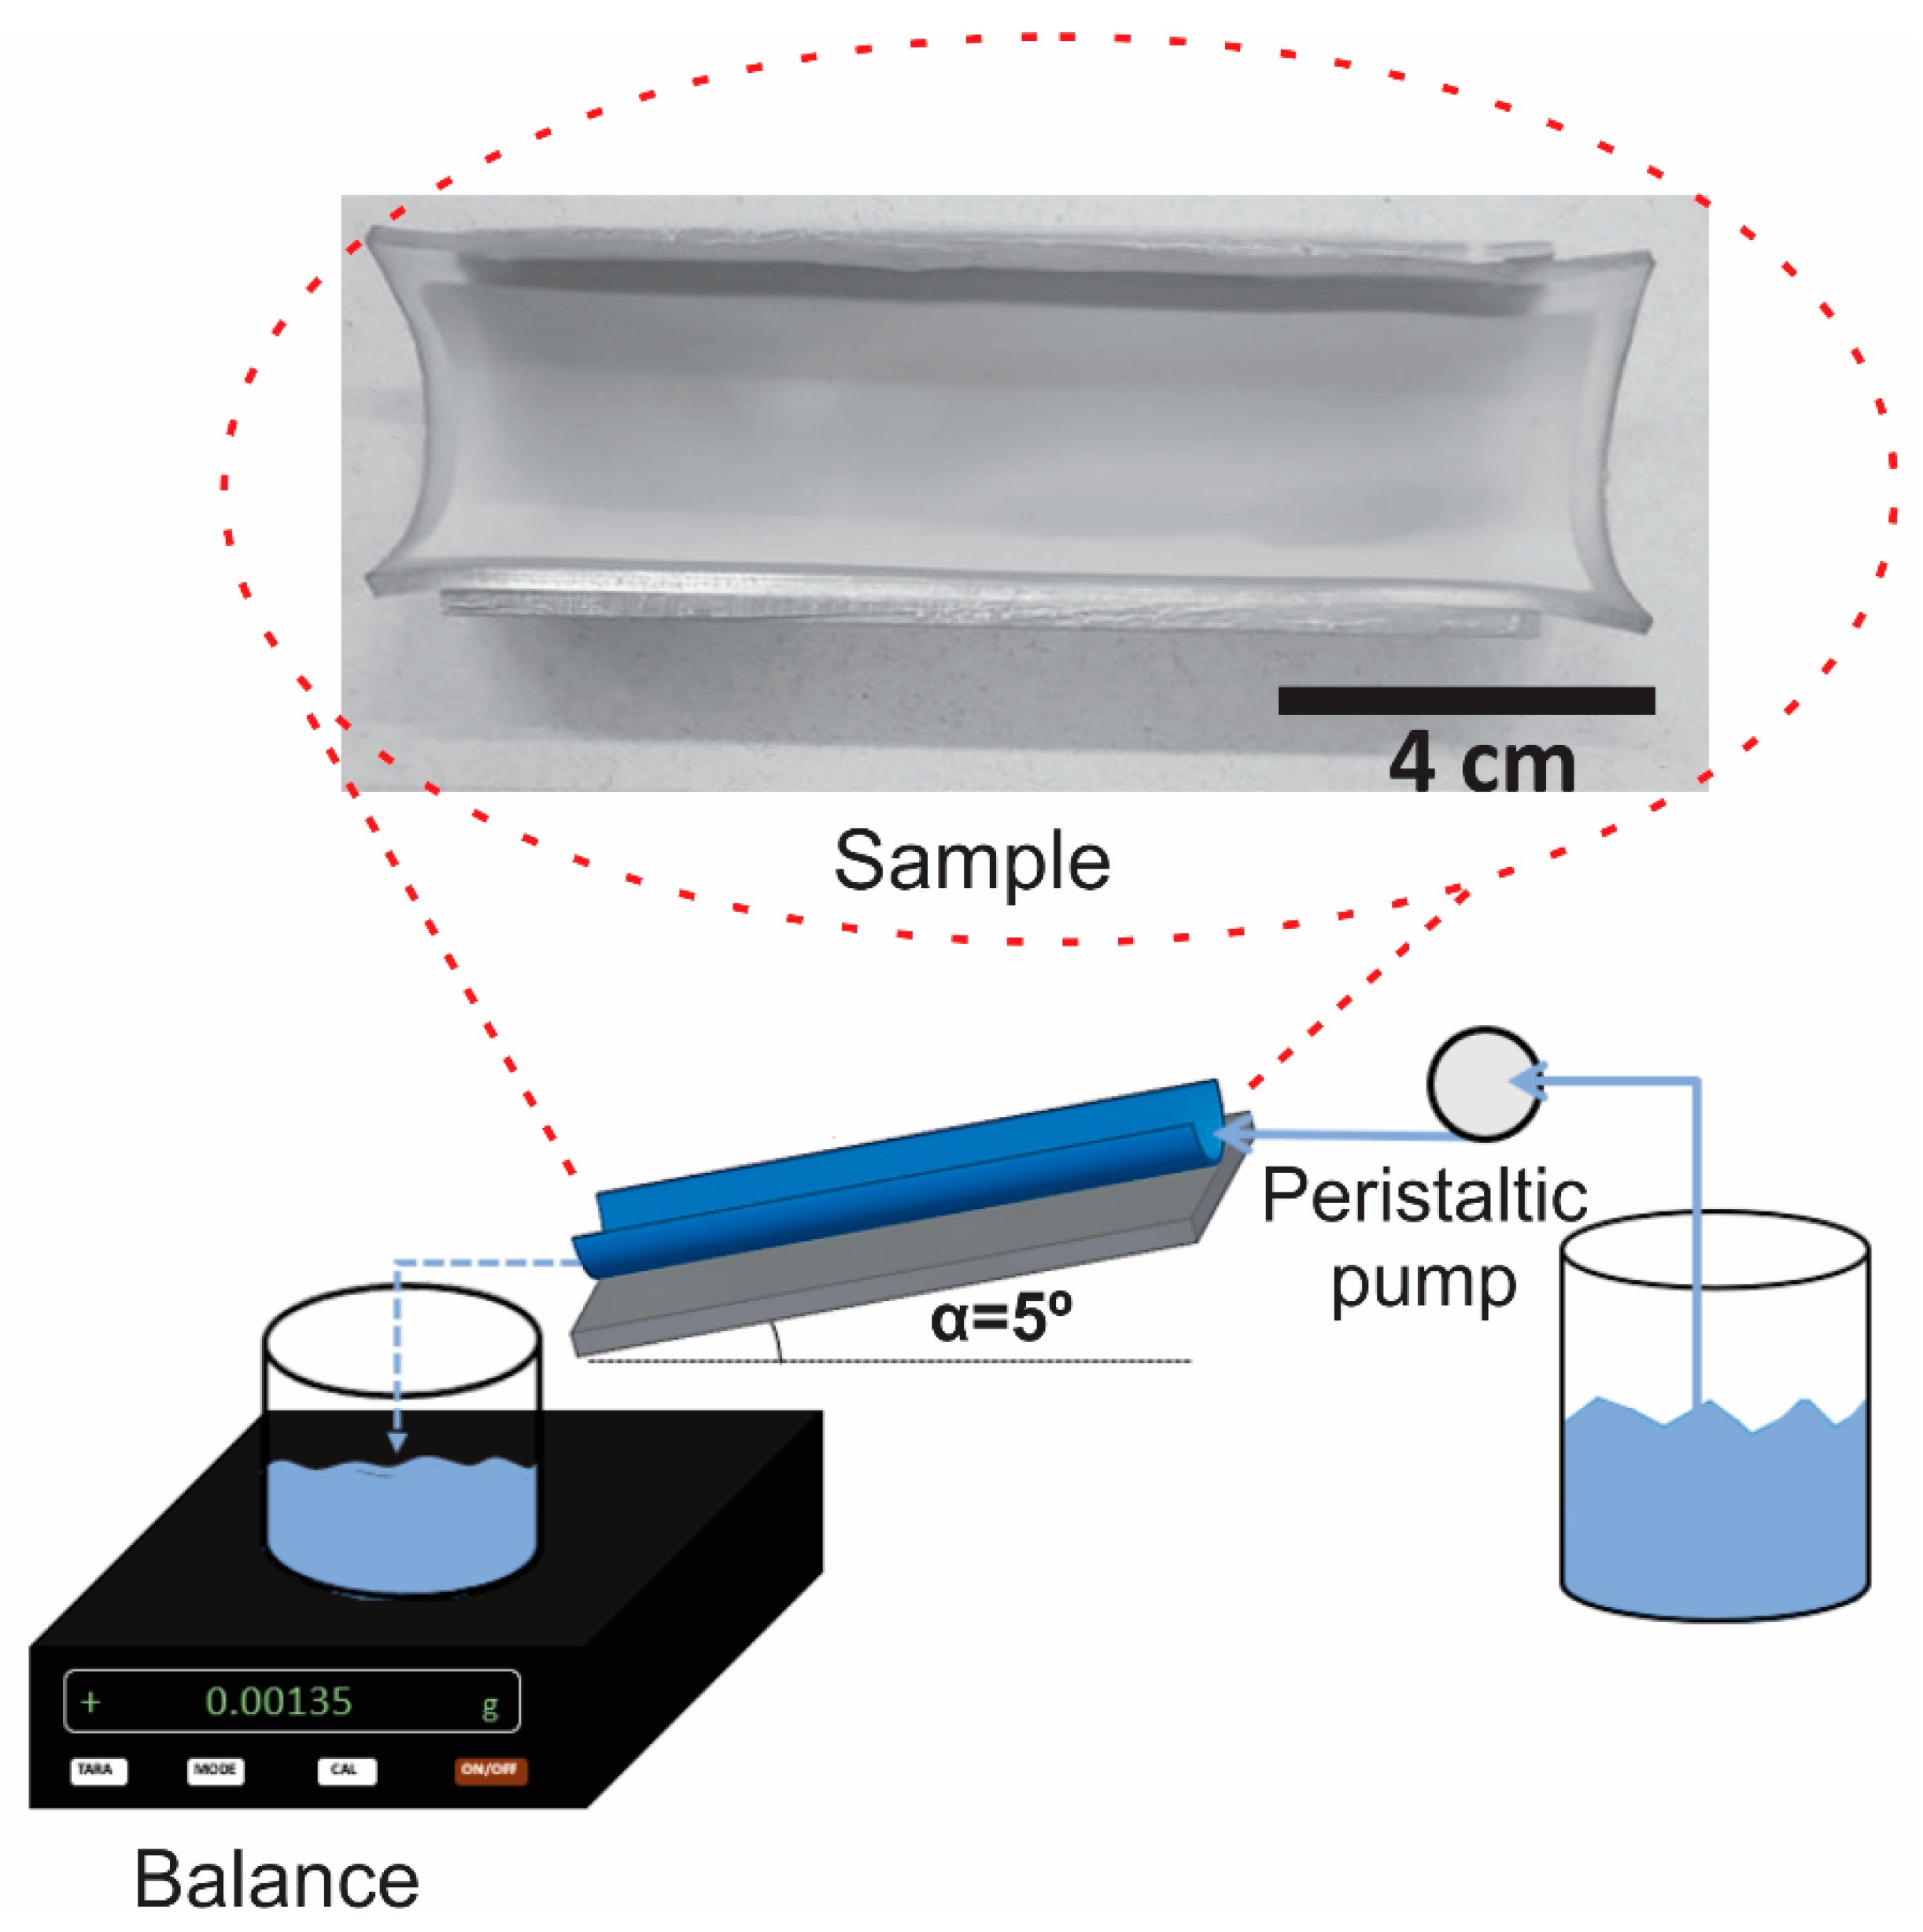
2.2.5. Investigation of the Drag-Reduction Phenomenon

The analysis of the drag-reduction phenomenon was carried out similarly to the work of Hoshian et al. (2017) [49], that is, through flow measurement. Thus, the apparatus used was composed of a peristaltic pump, responsible for making the reservoir fluid flow over the sample’s surface, and a precision scale was used to measure the mass of water drained per unit of time, as shown in Figure 3. The tests performed on the apparatus in Figure 3 were recorded so that it was possible to compare, for the same amount of water was drained on treated and untreated surfaces. The samples were placed on a 5° inclined plane to assist in the formation of the fluid slide. Three pump speeds were tested (40 RPM, 70 RPM and 100 RPM). Samples used for this characterization had a half-cylinder shape and were 12 cm long, as shown in Figure 3.
To achieve drag reduction, it is necessary to decrease the head loss in the flow. Applying the energy [49] equation between Section 1 and Section 2 (Figure 3) on untreated (Equation (2)) and superhydrophobic surface (subscript SHS—Equation (3)):
y 1 y 2 + z 1 z 2 + V 1 2 2 g V 2 2 2 g = H
y 1 S H S y 2 S H S + z 1 S H S z 2 S H S + V 1 2 2 g | S H S V 2 2 2 g | S H S = H S H S
where the terms y is the height of the water slide (m), z is the height (m), g is the gravity (m/s2), V is the flow velocity (m/s) and H is the flow head loss (m). Considering y 1 = y 2 ( y 1 S H S = y 2 S H S ) and multiplying Equations (2) and (3) by 2 g :
2 g Δ z + V 1 2 V 2 2 = 2 g H
2 g Δ z S H S + V 1 S H S 2 V 2 S H S 2 = 2 g H S H S  
Replacing the terms 2 g Δ z + V 1 2 by σ , and dividing Equation (5) by Equation (4):
H H S H = σ V 2 H S 2 σ H S V 2 H S 2
The drag reduction definition is given by [48]:
D R ( % ) = [ 1 H H S H ] 100
For flows of the same fluid, therefore the same density, and over the same area, measured flow variations depend exclusively on velocity.
One of the simple ways to measure the resistance to droplet flow in open channels was performed by Kim and Kim (2002) [6], the procedure also adopted in this work. This procedure consists of measuring the sliding angle (roll-off) for drops with different volumes of the surfaces under analysis.

3. Results

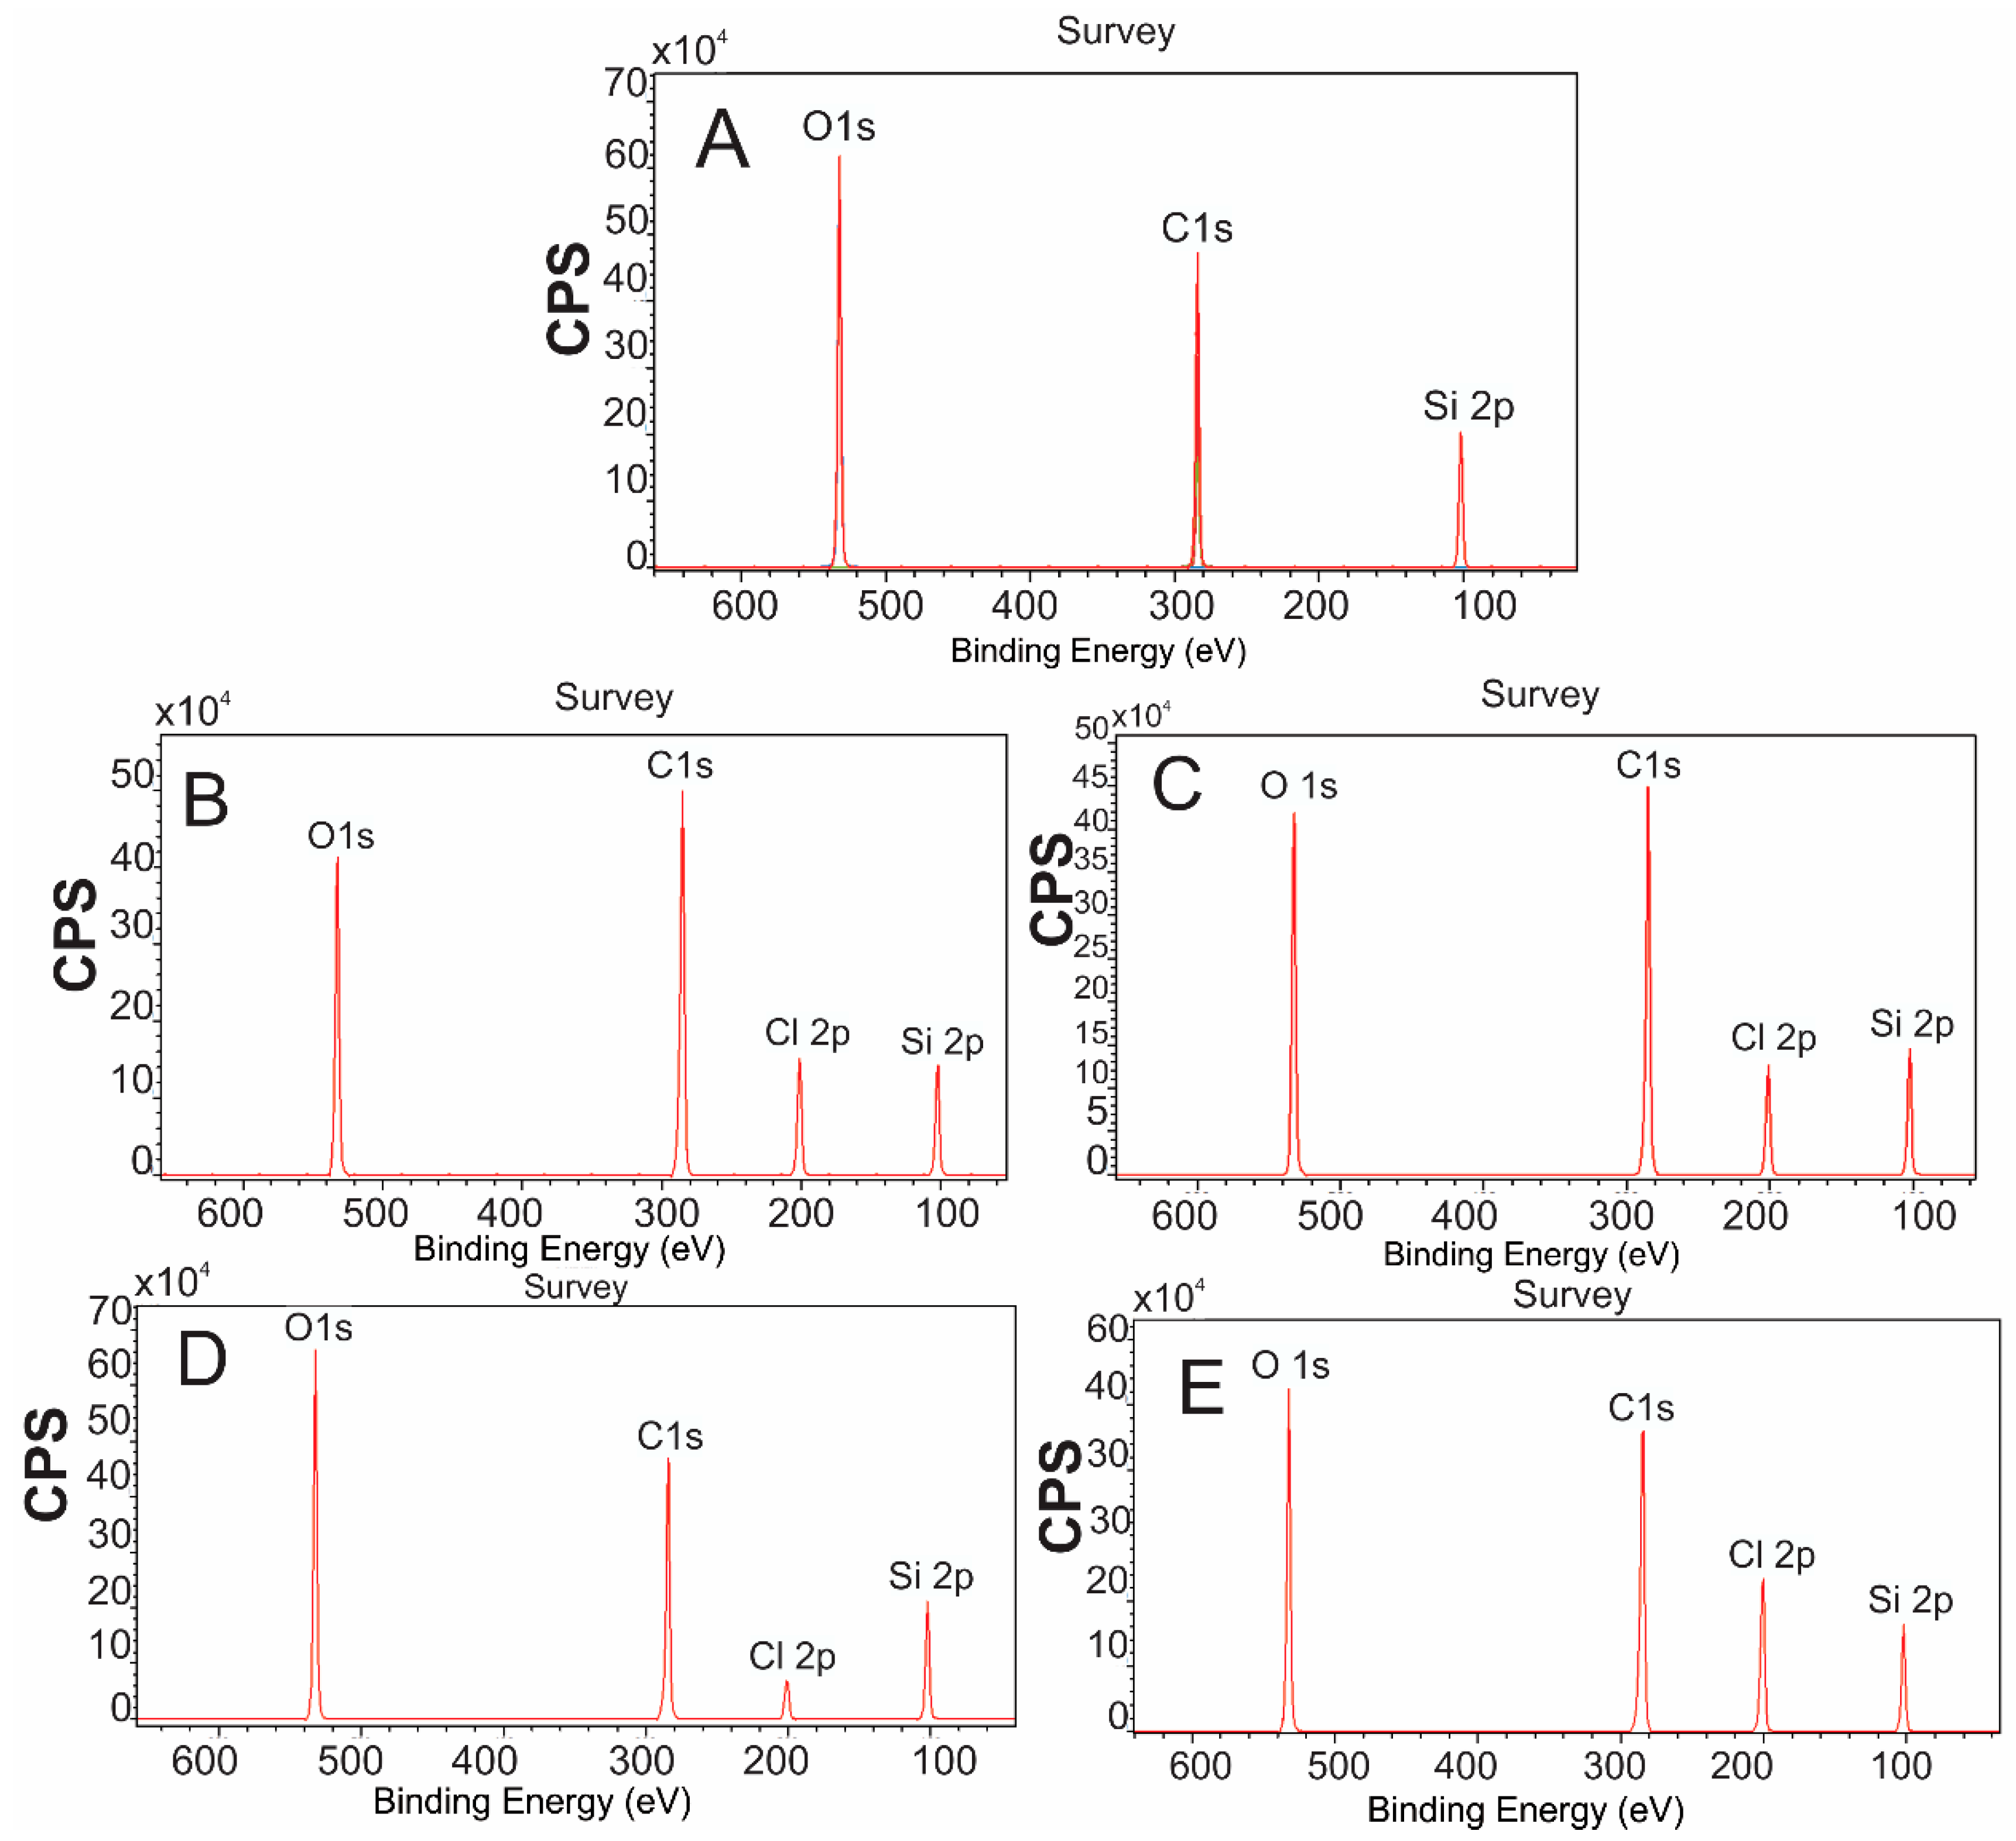
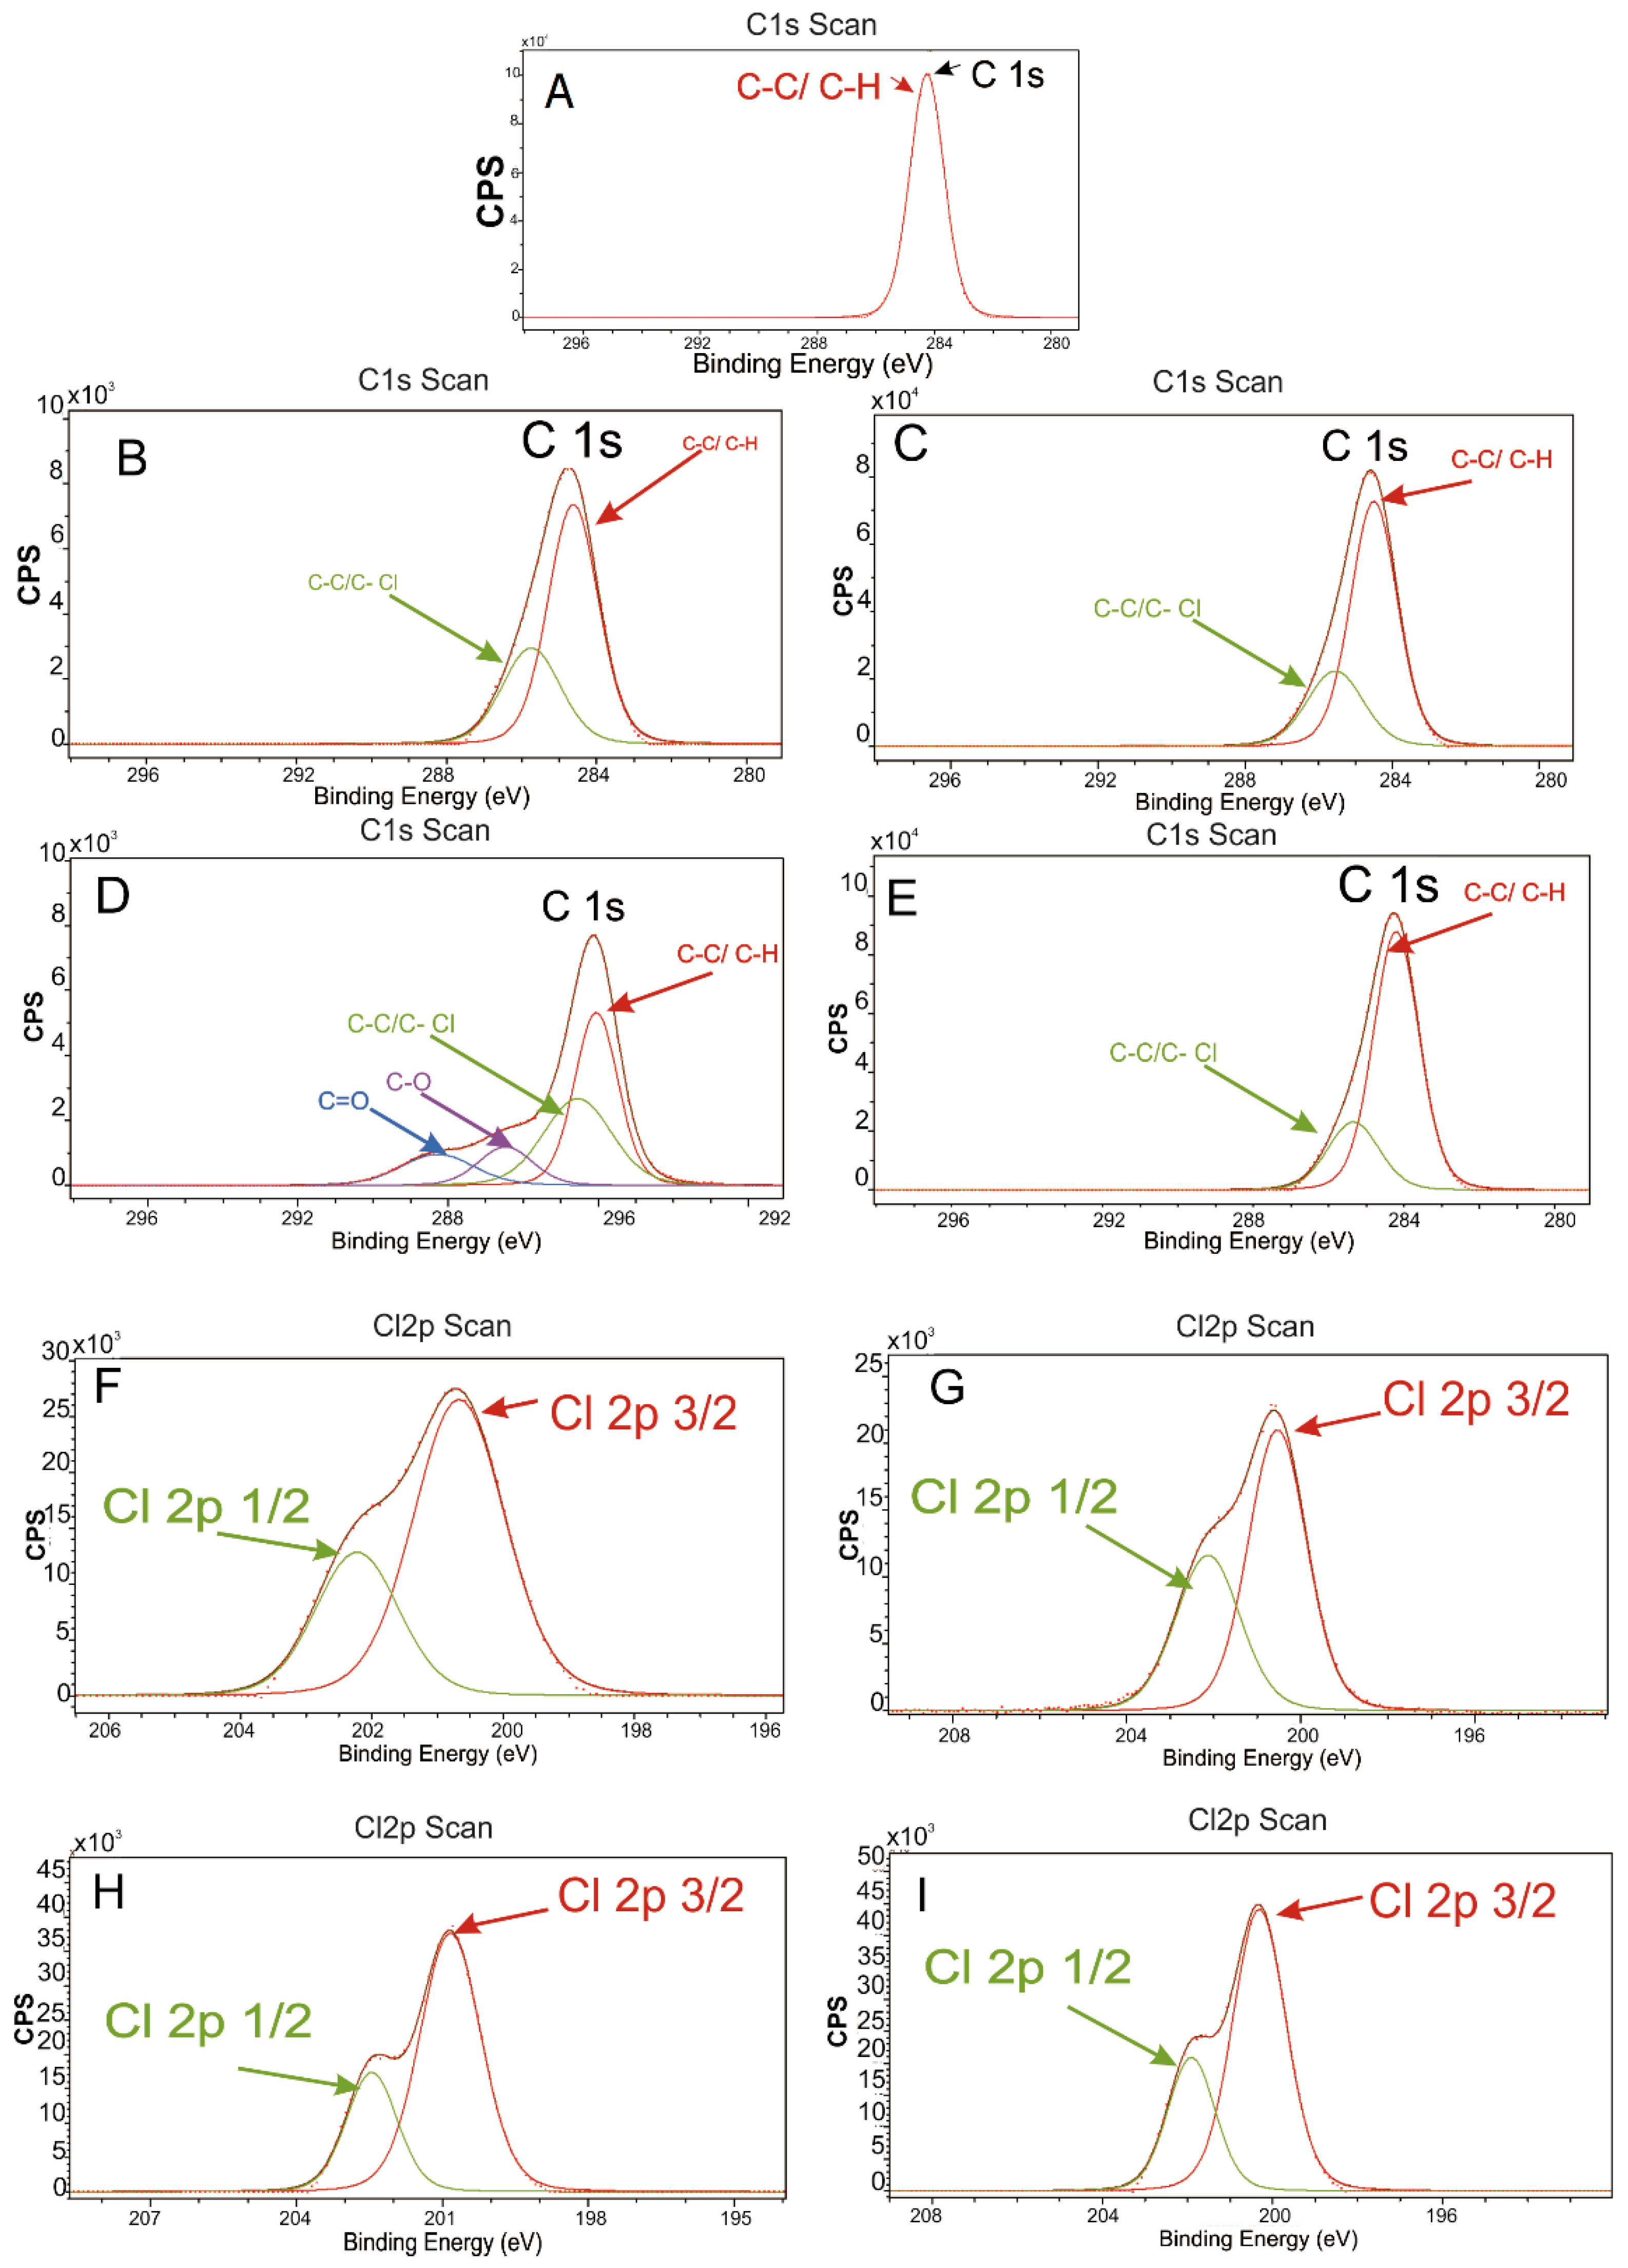
3.1. Analysis of the Surface by XPS
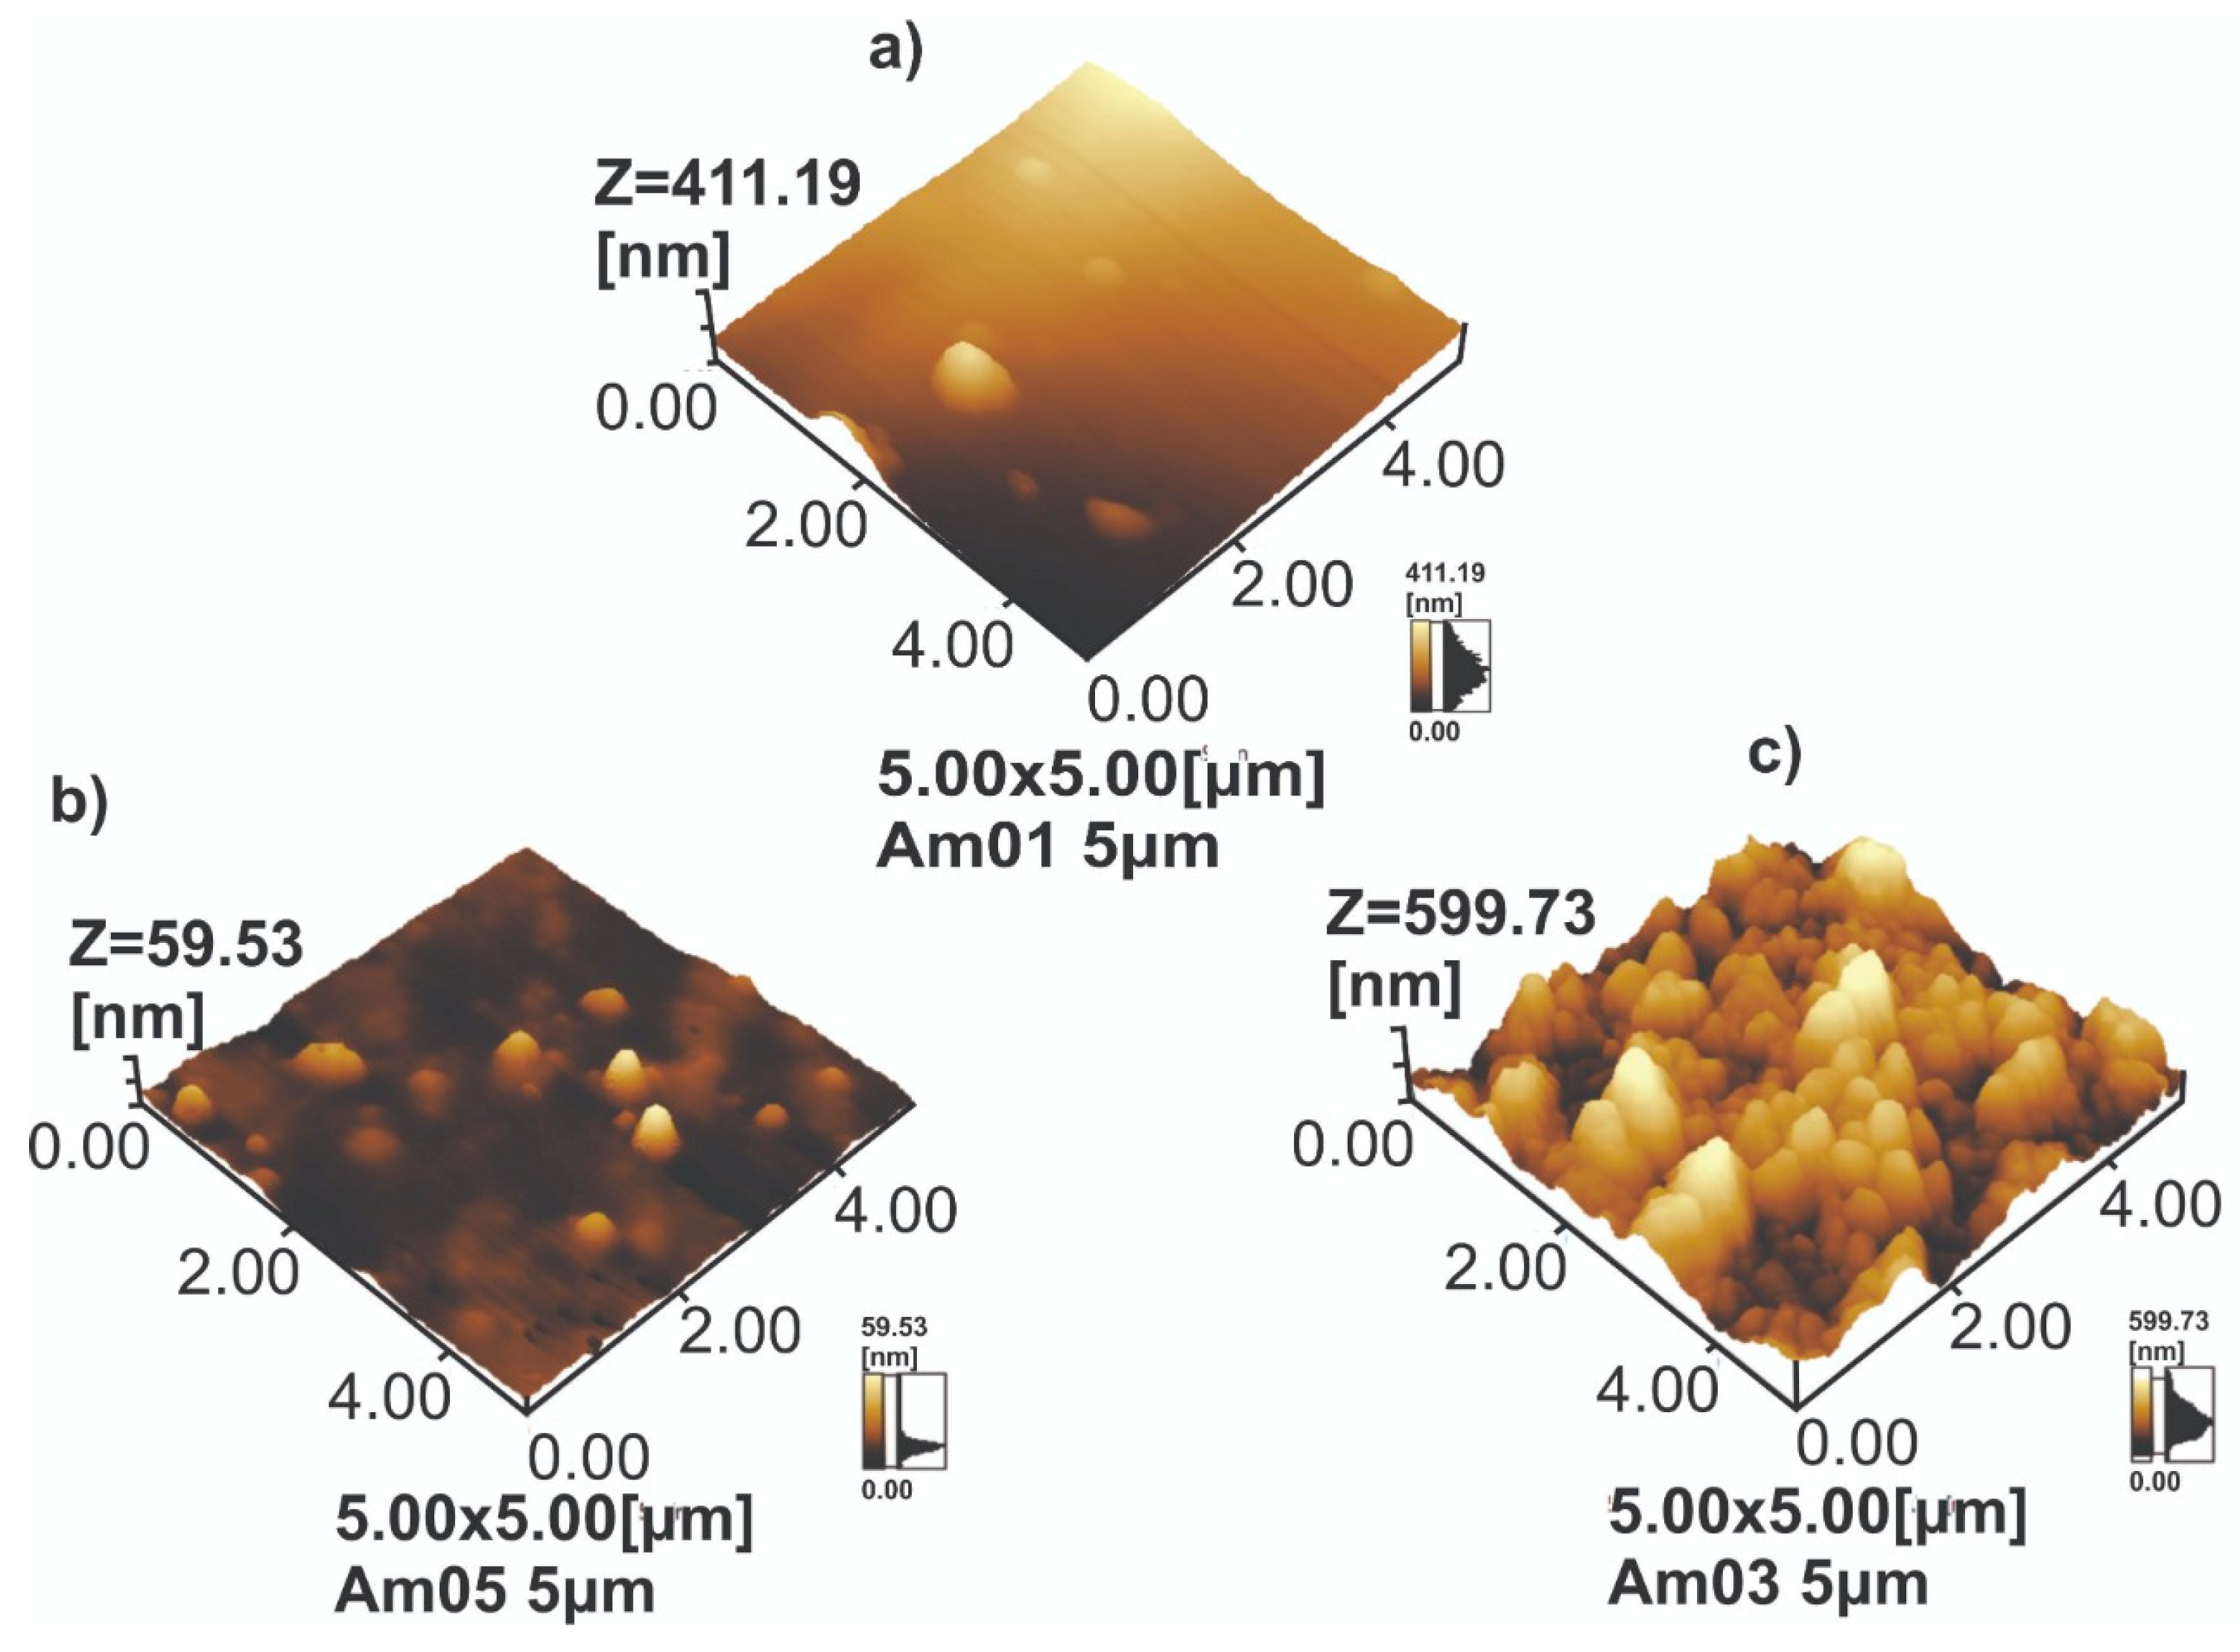
After the treatments, the samples of both strands of treatment were submitted for XPS analysis, in order to verify the change in chemical composition compared to the untreated sample.
Figure 4 shows all the peaks found in the present analysis, from the untreated sample (Figure 4A) where the peaks found were already expected due to the composition of the sample’s materials CH3, Si, and O, the samples treated in the first variant 4B and 4C, and the second variant 4D and 4E AM2, AM3 AM4 and AM5 respectively. In the latter, in the 200 eV region, the peak for chlorine appears in all samples.
Another finding in Figure 4 is that in all treated samples, there was a change in the amount of oxygen and carbon; this probably occurs due to the action of the plasma atmosphere, responsible by breaking chemical bonds between oxygen and silicon and in some situations for the the incorporation of chlorine and carbon, as will be seen in Figure 5.
Figure 5 shows the deconvolution of the XPS graphics of the treated and untreated samples. At the peak of C 1s in the region, 284.5 eV C-C/C-H bonds are detected, but the increase in the amount of Carbon atoms can also be attributed to the C-C/C-Cl bonds in the 287.7 eV region. In Figure 5D, it is possible to observe the difference in the chemical composition of the deposited film in relation to the other samples. In addition to the aforementioned bonds, there are C = O, and C-O bonds that can appear on the film after recombination of an oxygen molecule or atom pulled from the sample with a chloroform molecule that has lost one or two chlorine atoms, and that within 10 min the plasma was unable to remove and/or recombinec as occurred in sample 5E.
Analyzing the region close to 200 eV of the XPS graph (Figure 5), it is easy to see that on the surface of the samples treated, chlorine appears in lesser or greater quantities. In the first variant, when chloroform enters with argon, an inert gas, possibly chlorine, it will preferentially bind to the sample’s silicon that has lost oxygen or to bind to carbon from the breakage of methane bonds (see peaks in Figure 5F–I). The peak deconvolution shows are formed from chlorine 2p 1/2 and chlorine 2p 3/2.
This can be seen better in the Table 2, where it is possible to compare the untreated sample with the treated samples, except for sample 4. In this sample, the amount of oxygen was practically equal to that of the untreated sample attributed to the C = O and C-O bonds, as explained earlier.
Analyzing Table 2, it is possible to observe that the amount of chlorine on sample 5 doubled when compared with sample 4. This effect occurred due to the increase in the deposition time, and the reaction of chlorine species with the structure of Sylgard, since there was a reduction in the amount of oxygen and silicon in the sample. However, it is noteworthy that the deposition of chlorine is not capable of producing the effect of superhydrophobicity. The greatest Cl/C ratio in the AM5 sample probably occurred because in the second variant, acetylene was used as a transport gas for chloroform vapor, where saturation of the amount of chlorine may have hindered the polymerization of carbon and adding a greater amount of chlorine on the surface, explaining why this reason was the greatest among all (Cl/C = 0.224).

3.2. AFM Analysis

Understanding the level of hydrophobia obtained depends on the surface morphology of the samples and the wettability of the samples. The sample’s morphology was analyzed by the AFM technique to find out how the plasma treatment changed the samples’ surface and to get a sense of how the fluid might be behave on their surface. The image in Figure 6 shows the result of the AFM analysis.
The AFM result in Figure 5 contains the results of greater roughness of the two treatment variants AM3 and AM5. As well as the greatest roughness these two samples also had the highest values in percentage of carbon; in XPS analysis, however, as can be seen in Table 2, the chlorine/carbon (Cl/C) ratio was lower in sample AM3, indicating a possible superhydrophobic surface, as will be discussed in the next topic. The surface roughness values are shown in Table 3, where it can be seen that the sample treated in variant 2 had a roughness similar to the sample without treatment, confirming that for the conditions in which samples 4 and 5 were treated, where the polymerizing gas (Acetylene) had the function of transporting the chloroform vapor, it is harmful to the formation of film on the samples, with only one surface attack on the samples with the addition of chlorine, which does not guarantee the superhydrophobic character according to what is suggested in the literature [25,26,30,32,50].
In Figure 7, it is possible to see, in the AM2 sample, a region of continuous film with some cracks called stress (Figure 7a), and in Figure 7b, a region of discontinuous film; this is possibly due to a lower deposition time compared to AM3.

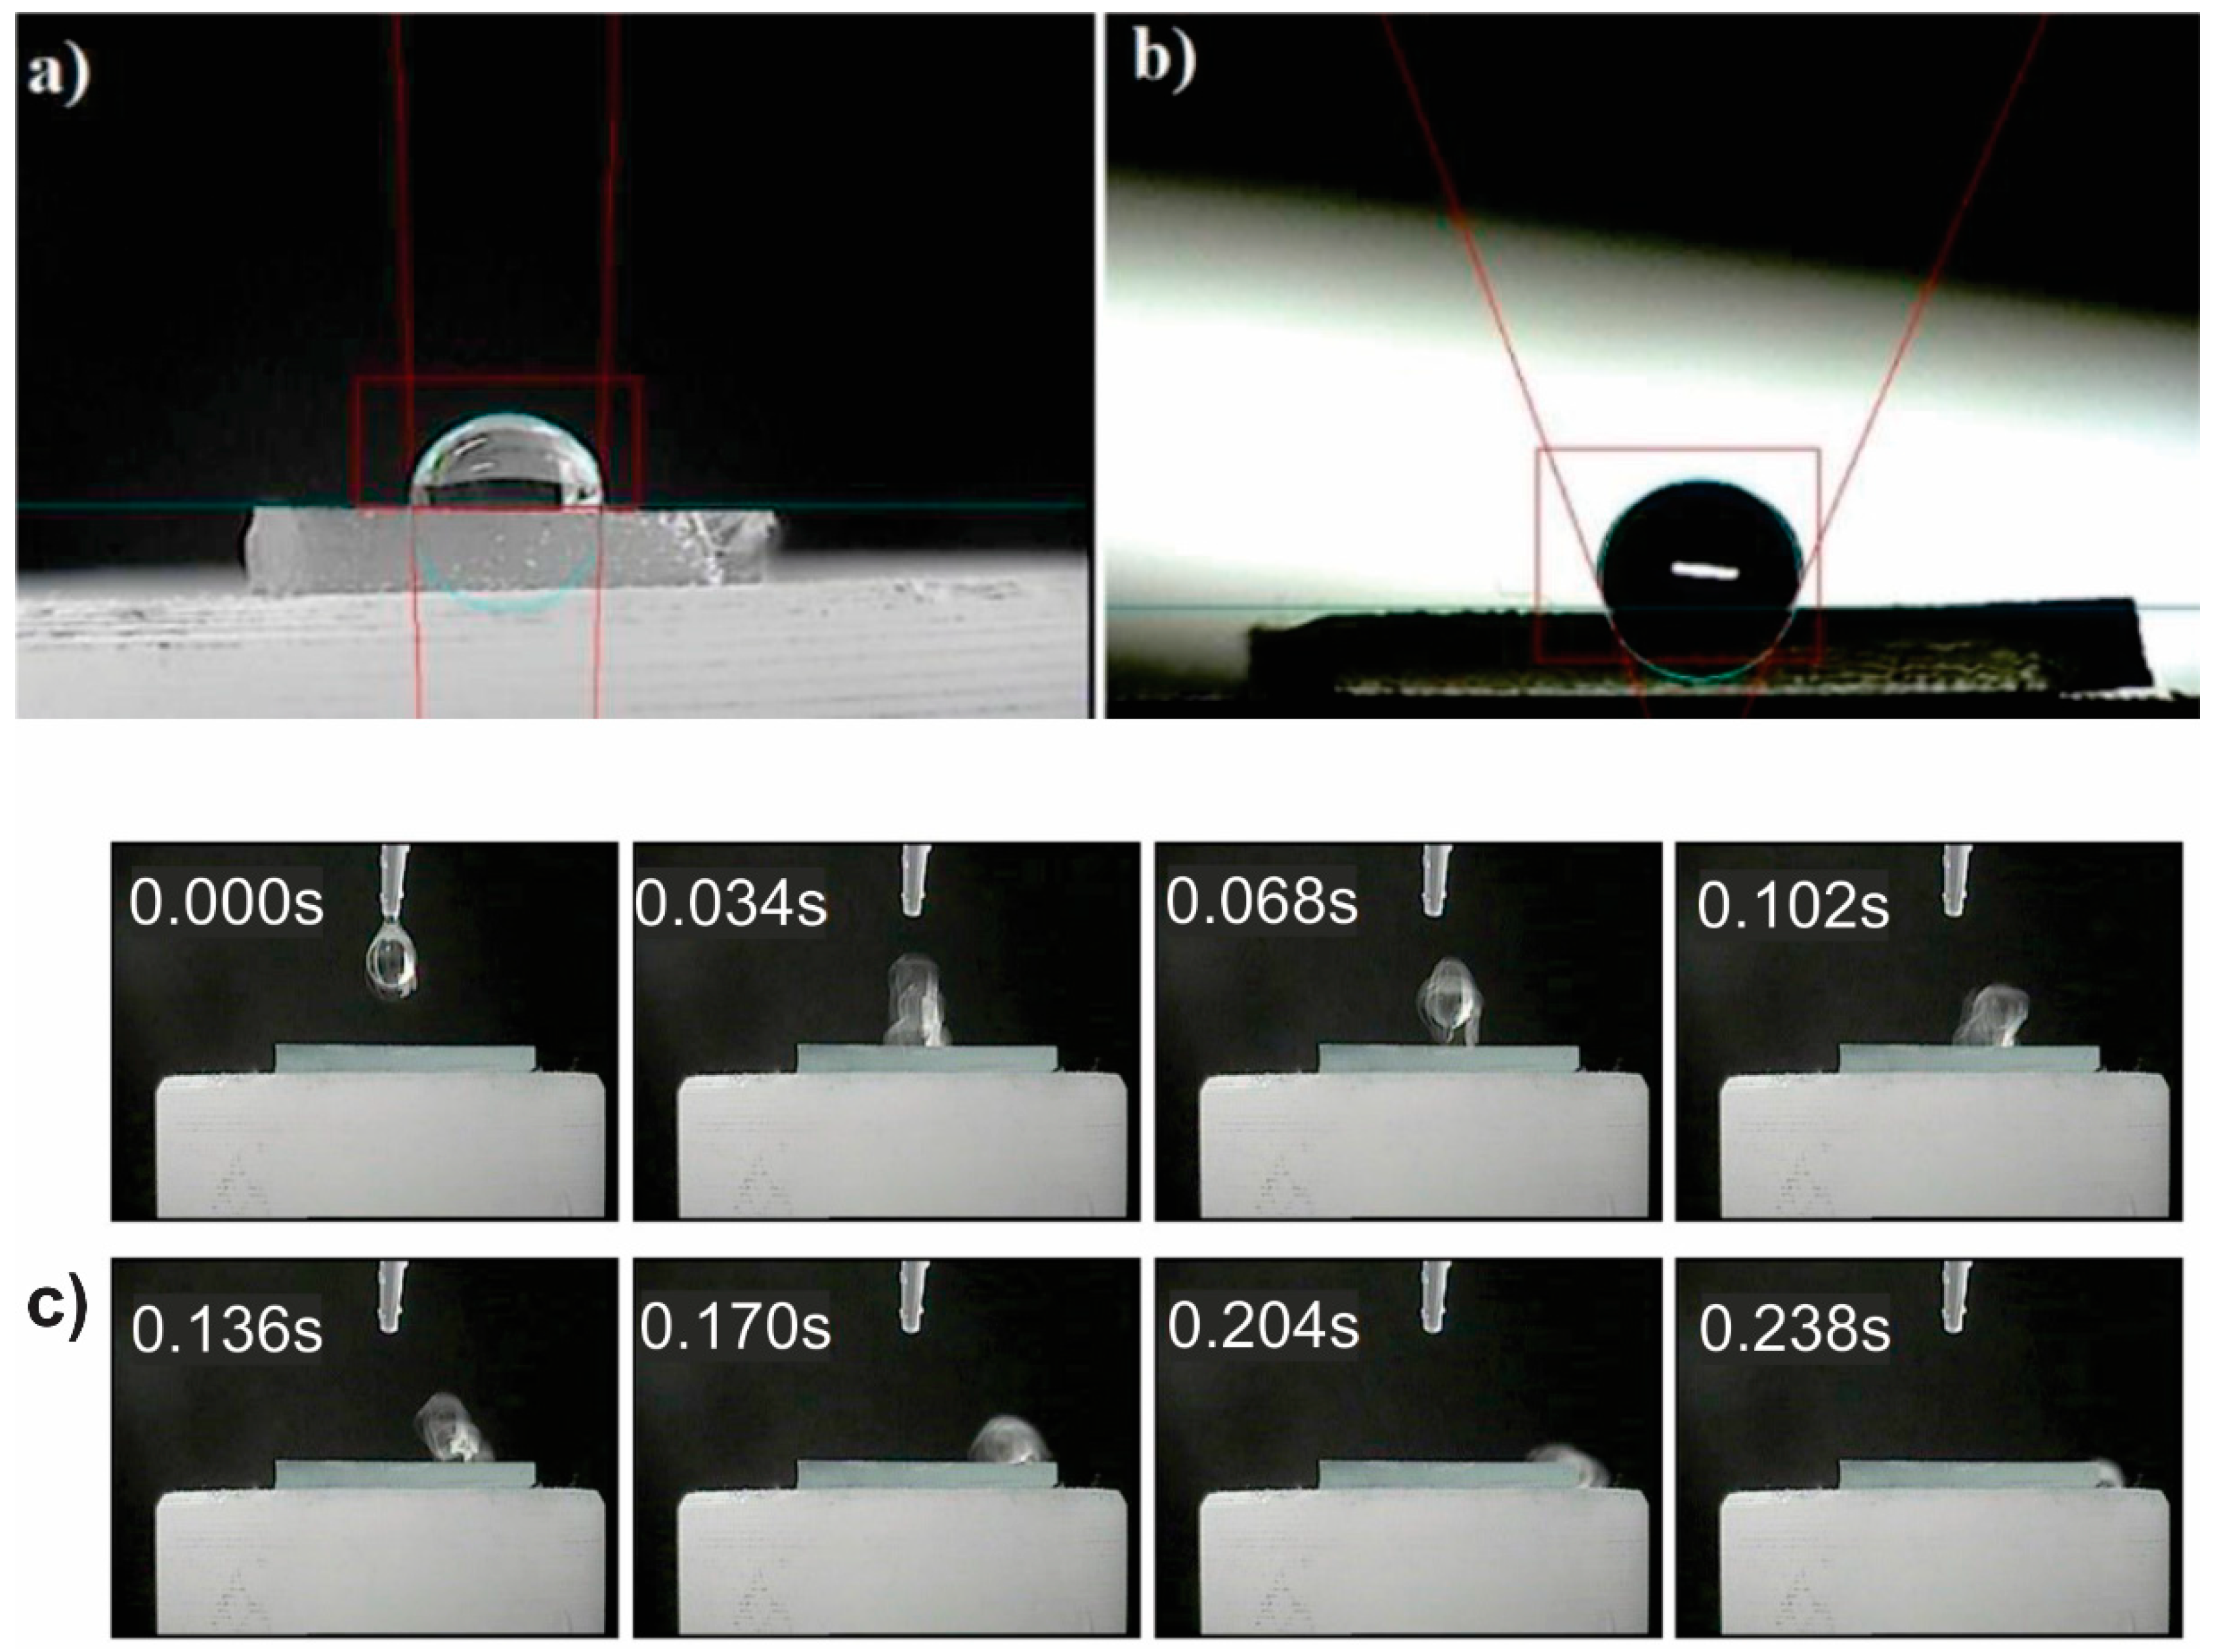
3.3. Analysis of the Wettability
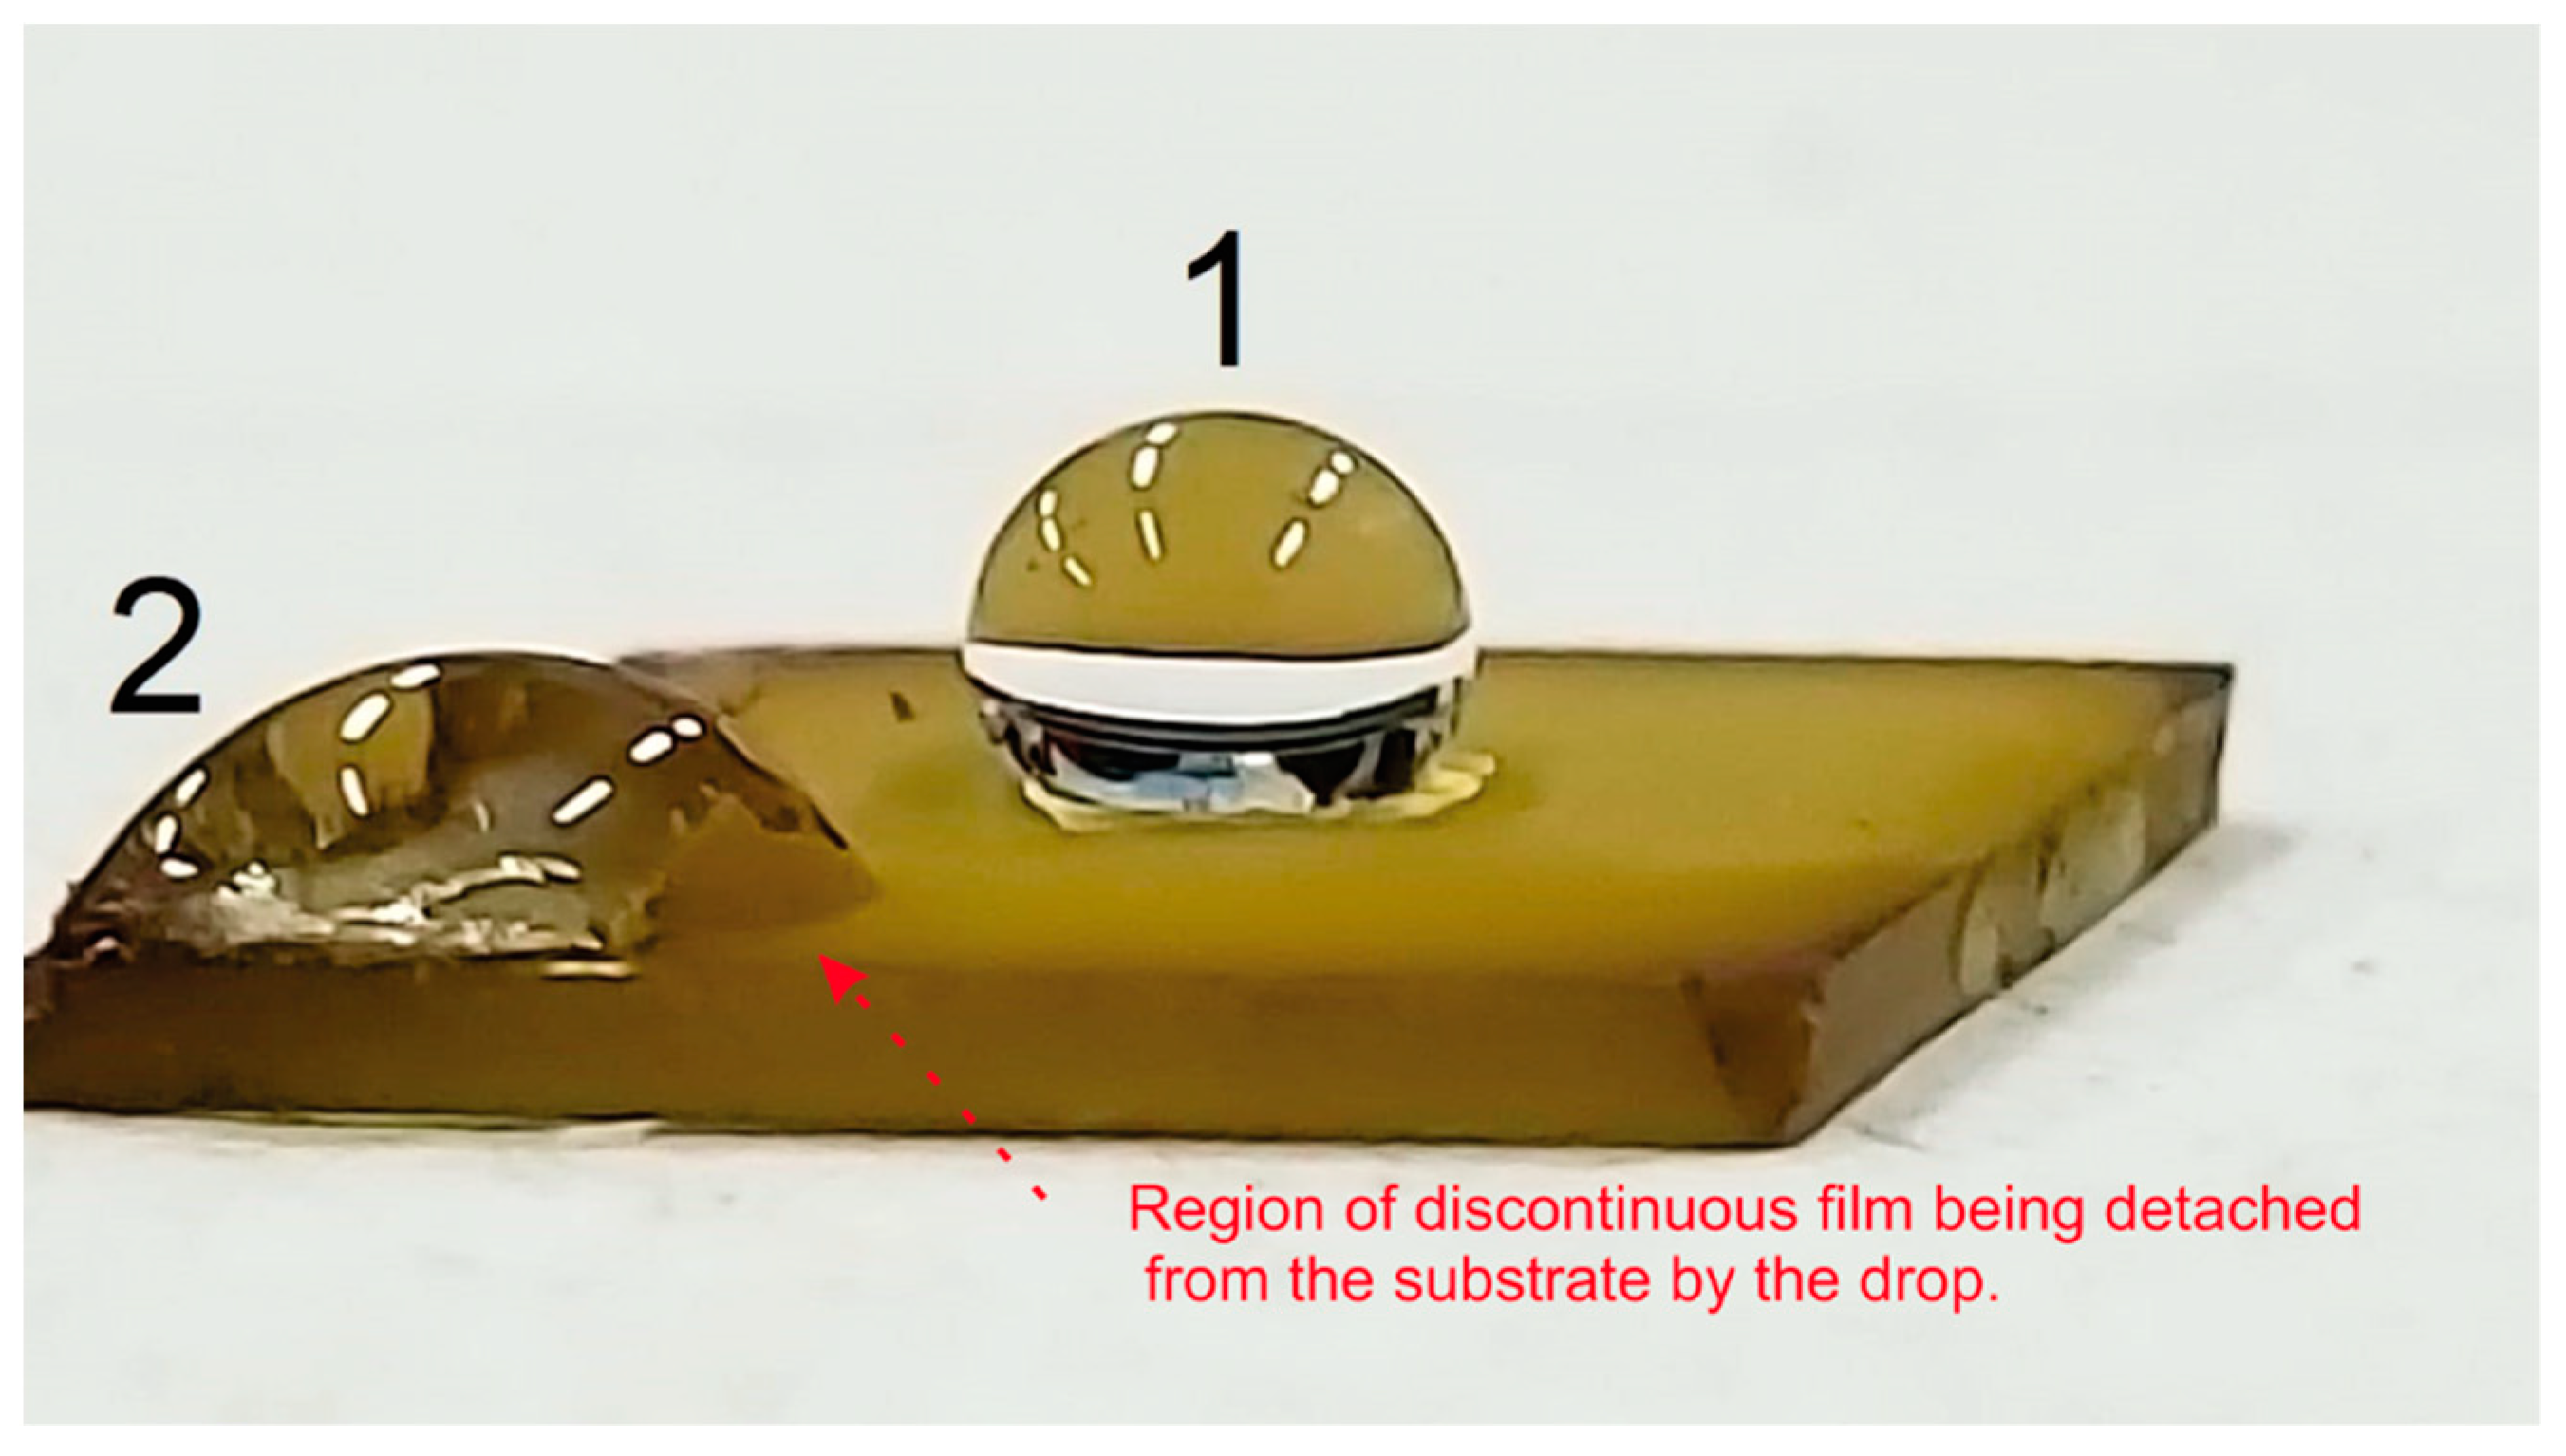
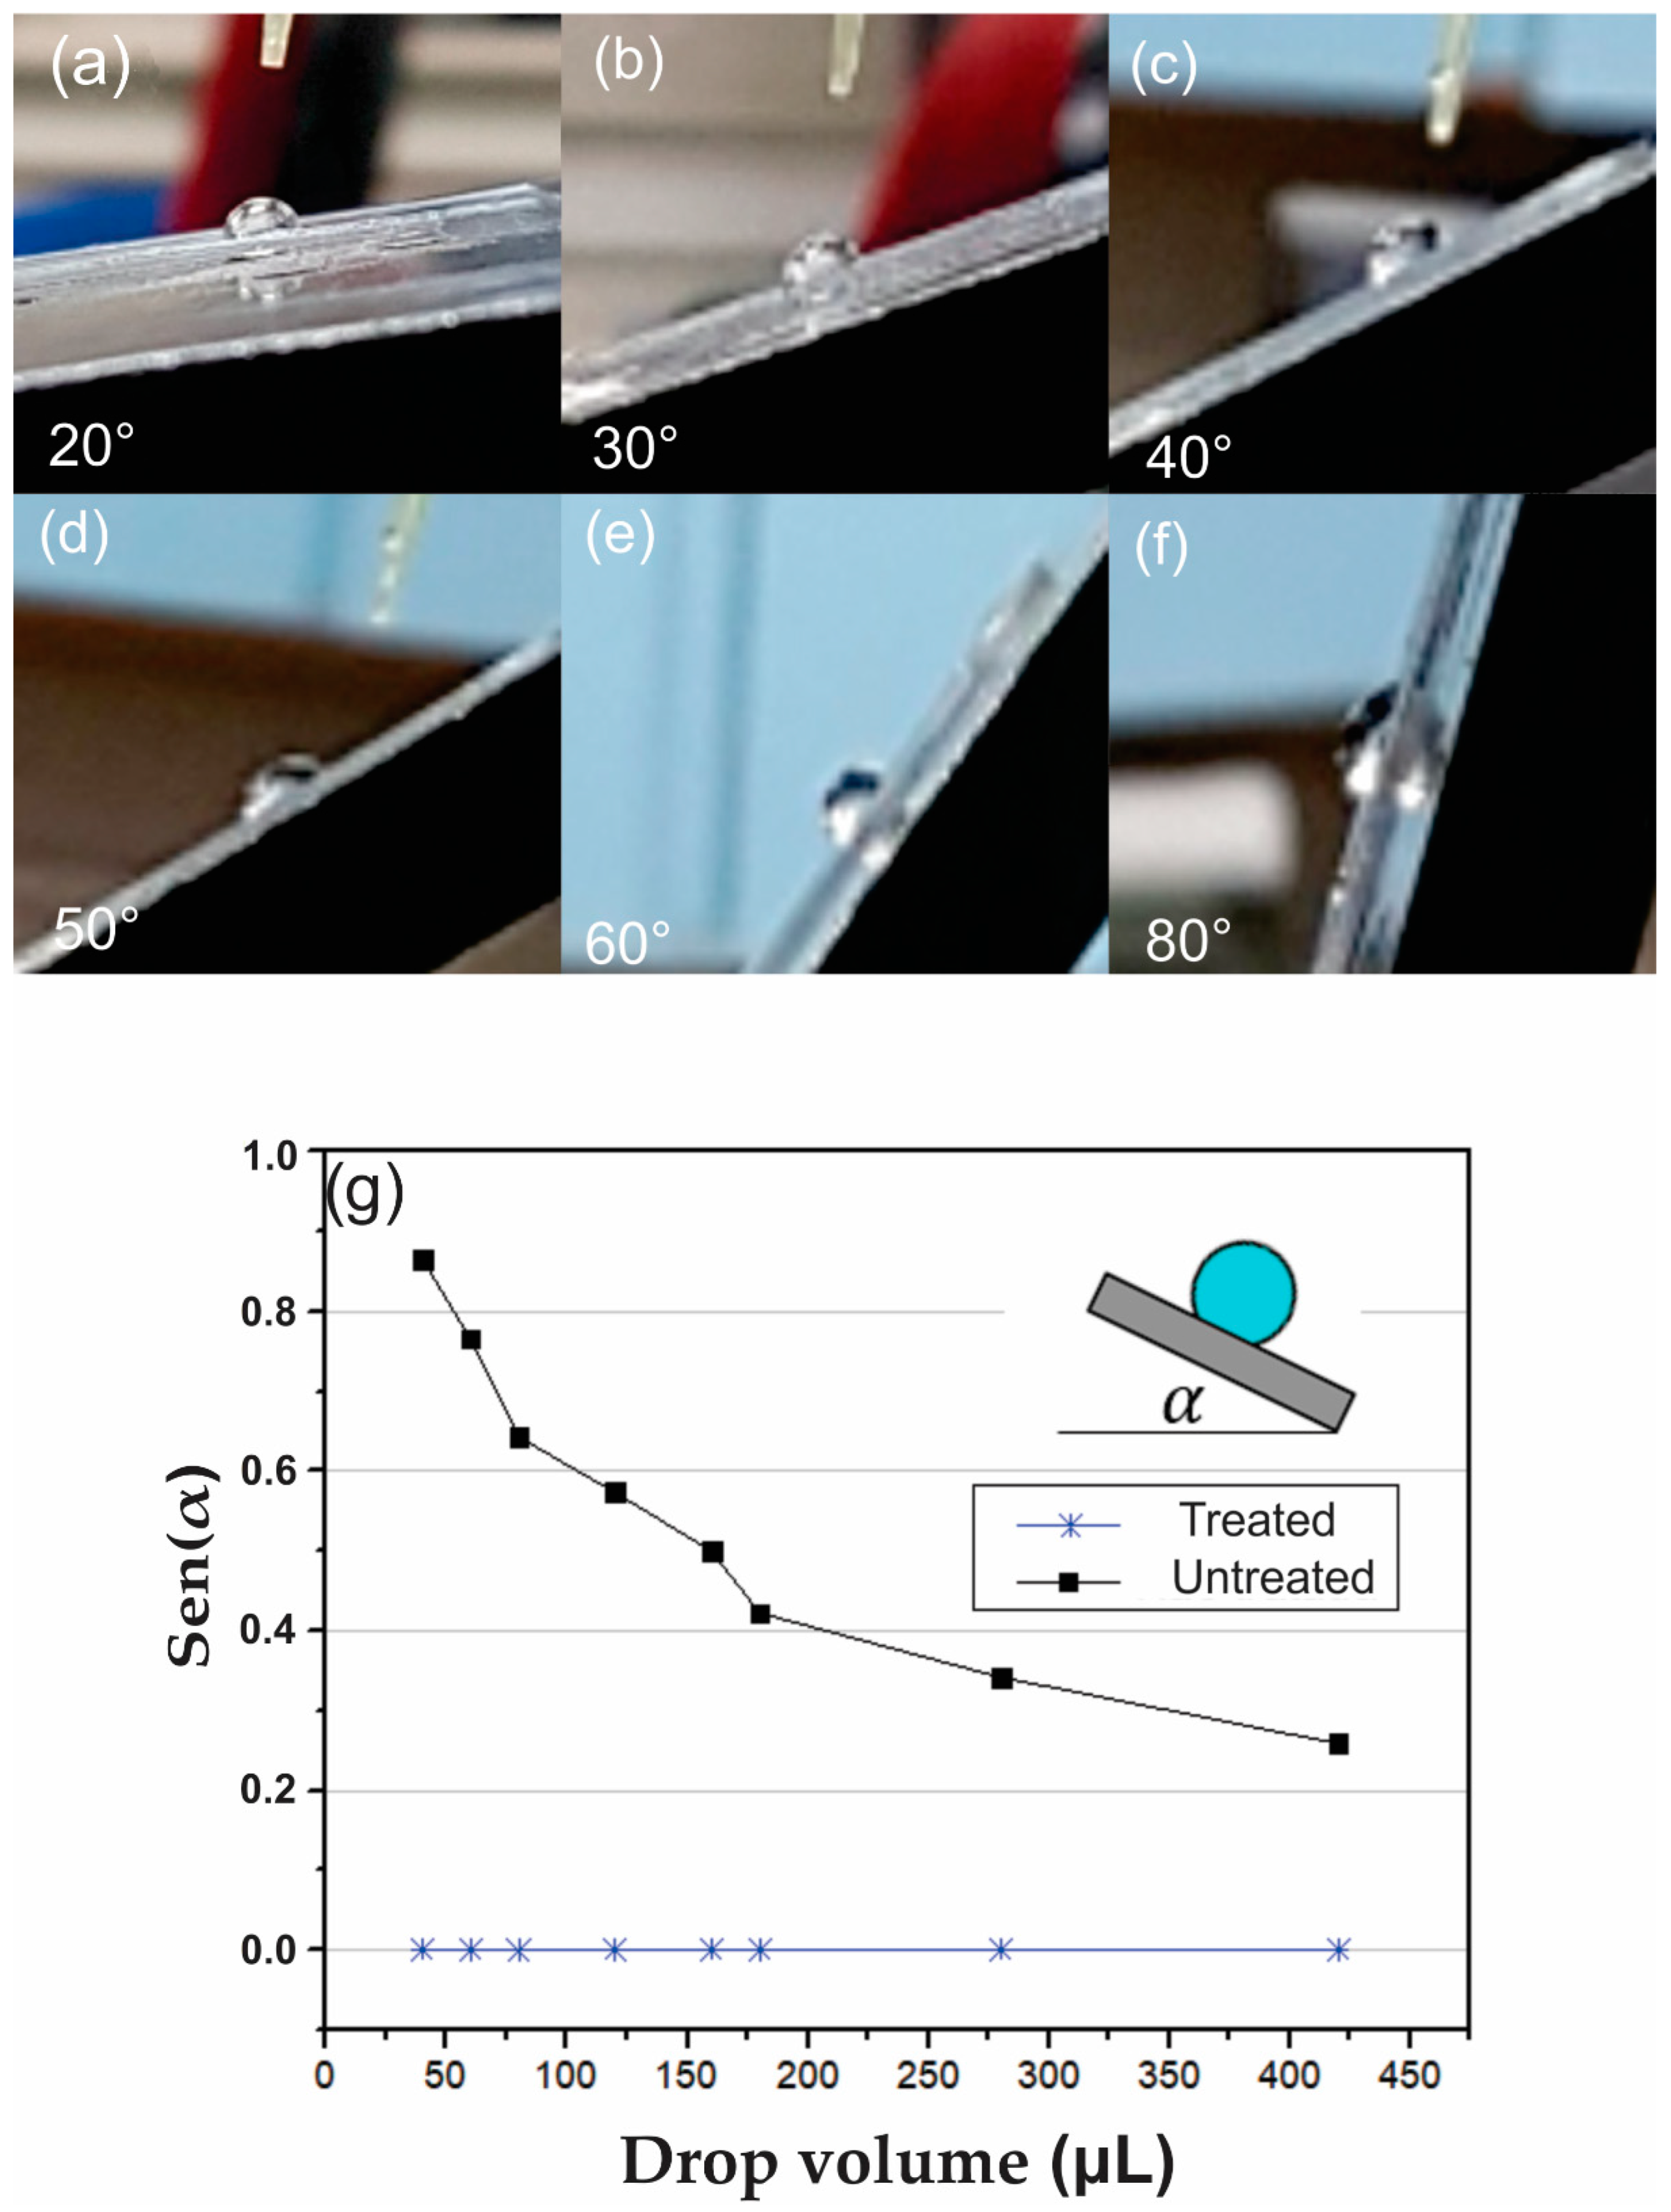
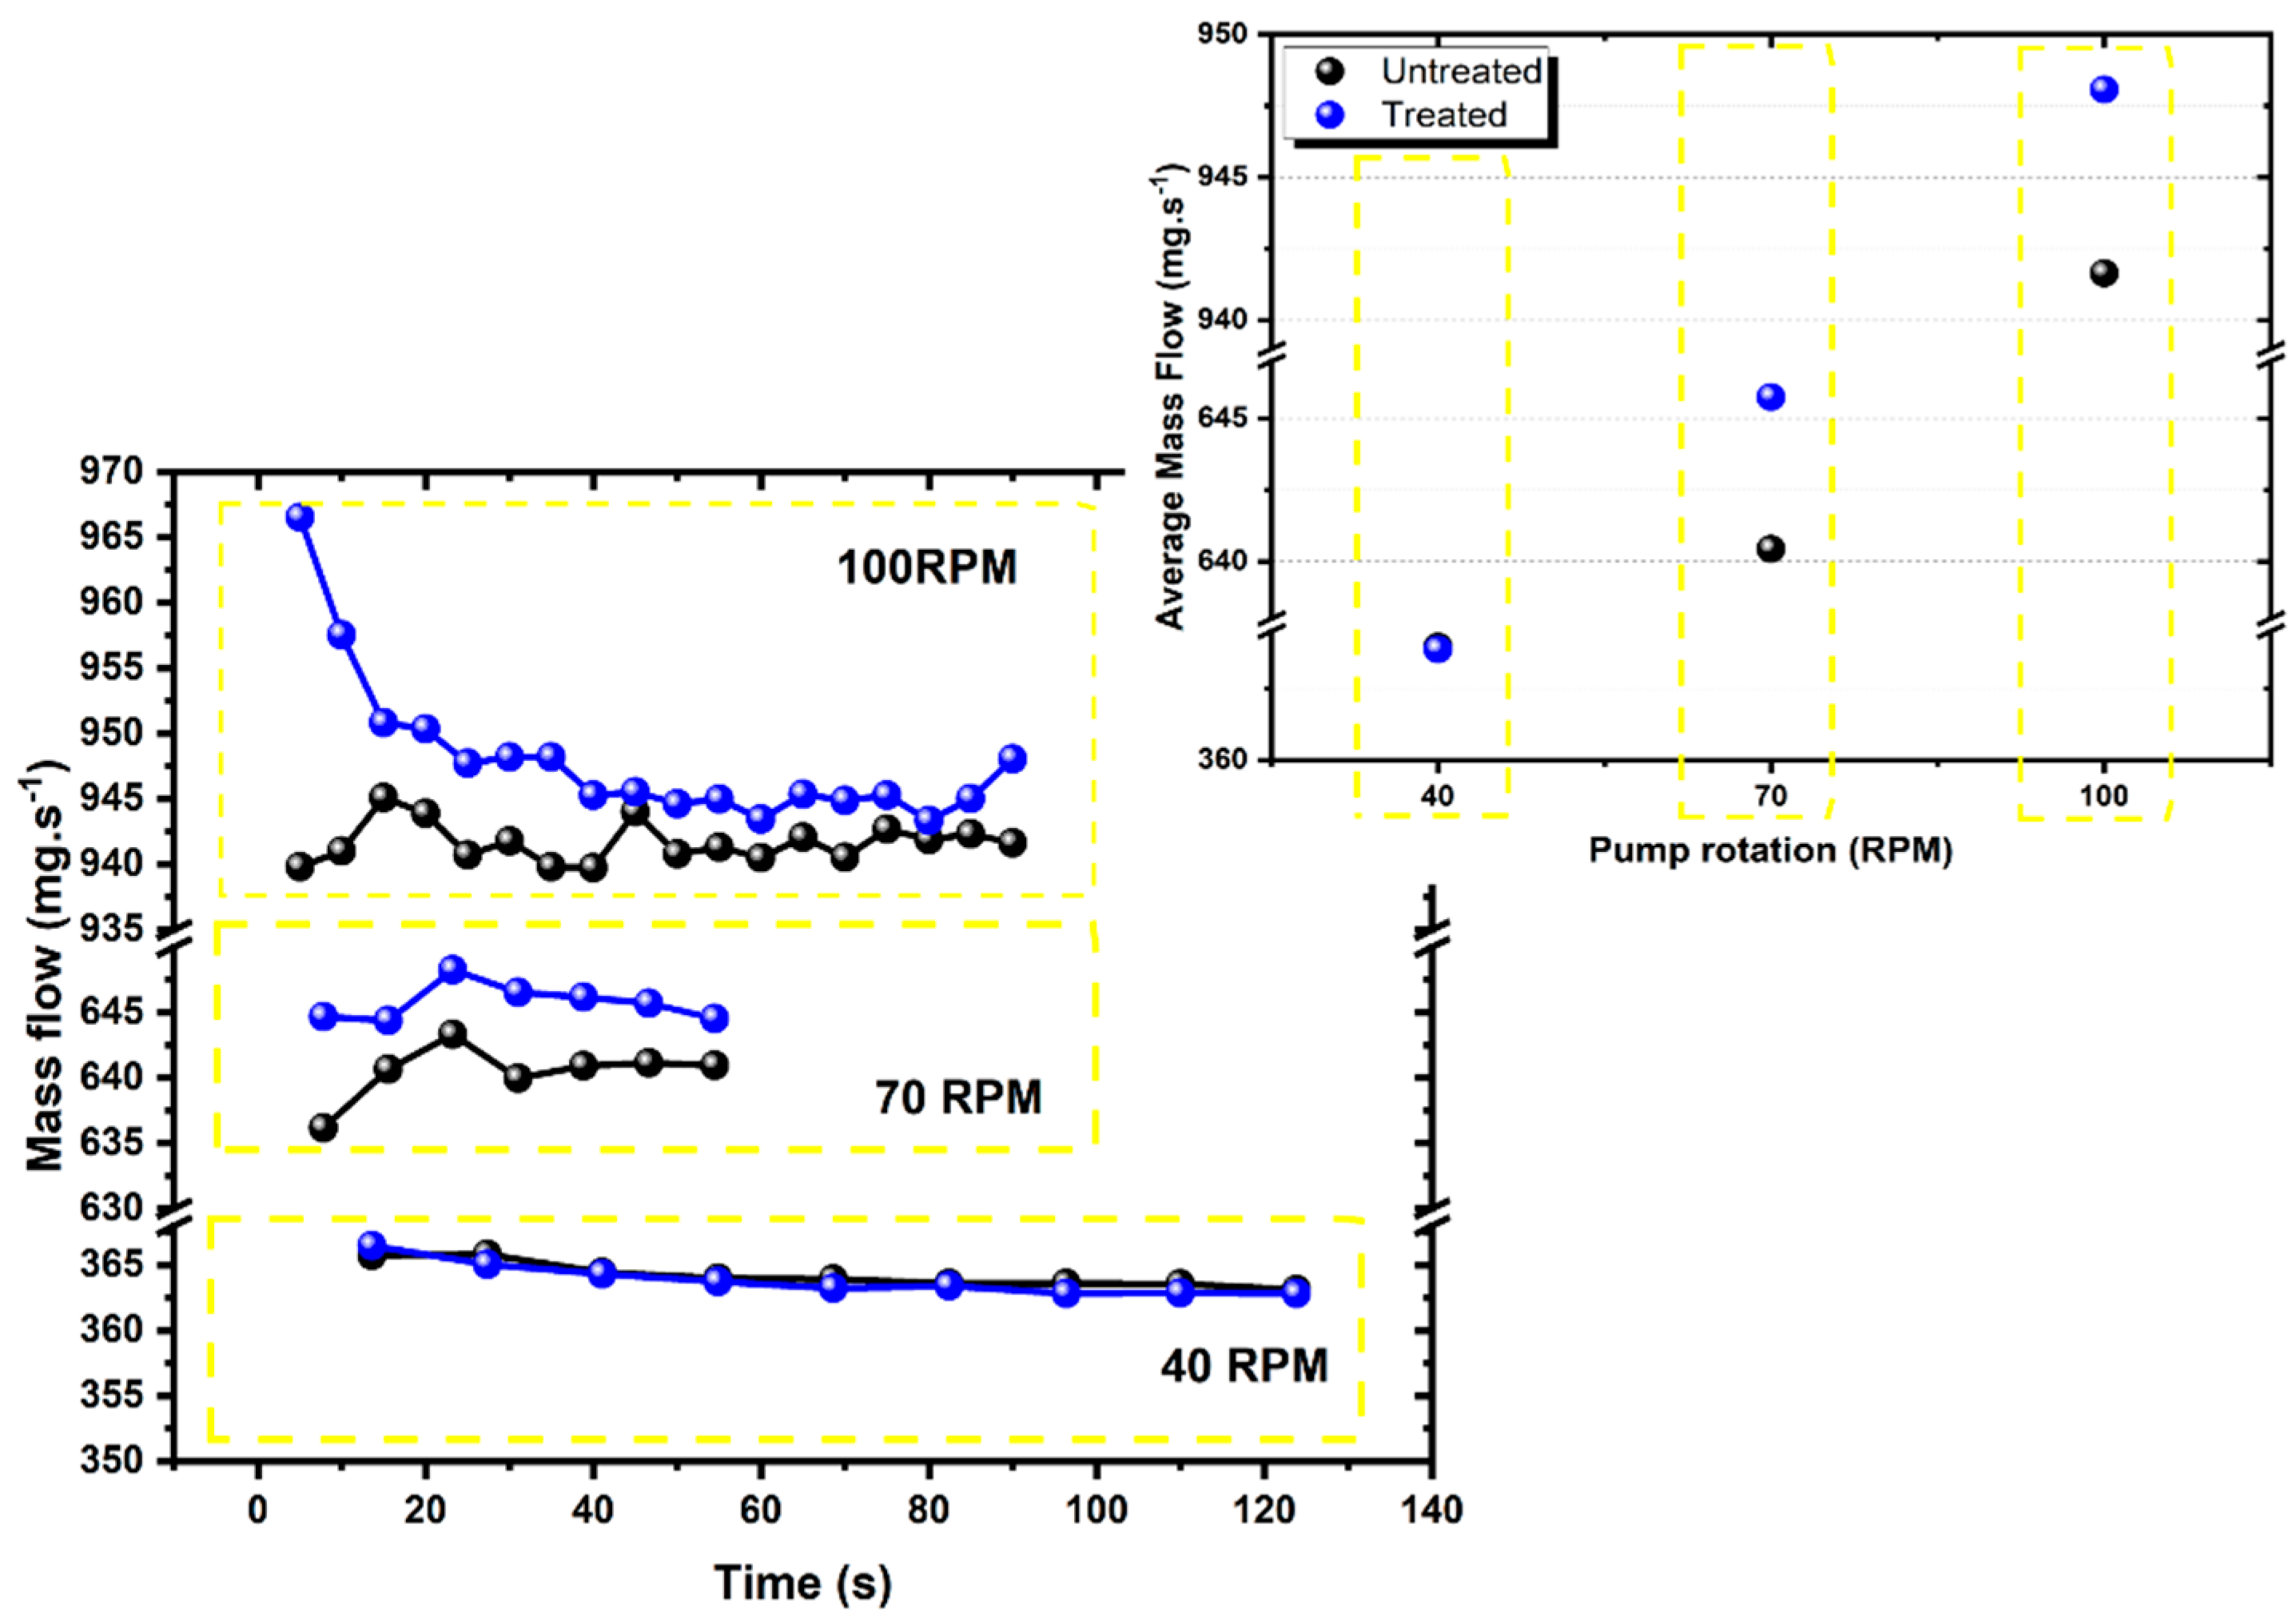
The initial wettability result came from test treatments using the configuration of the 2nd variant, with an atmosphere composed of 20% and 80% Ar and C2H2, where it was possible to obtain a surface with a high level of hydrophobicity, measuring an average contact angle of 130° (Figure 8b), well above the 80° calculated in the sample without treatment (Figure 8a). The O/C and Cl/C ratios are repeated in the samples and are key to the explanation for the increase in hydrophobia, as explained in the work of Jokinen et al. (2018). However, superhydrophobia is not achieved in AM5. Analyzing the XPS results again (Table 2), the O/C and Cl/C ratios are higher in the sample mentioned here compared to the AM3 sample.
Superhydrophobia was obtained in samples of type AM3 and AM2, with a much higher level in the first; for this reason, it was not possible to calculate the contact angle, since the drop was immediately expelled from the surface of the samples. The solution for this was to film the wettability test to present this result frame by frame, which is shown in Figure 8.
Although the AM2 sample also showed a result of superhydrophobia, the discontinuity of the film, as well as its thickness, caused problems both in the wettability obtained and also in the adhesion of the film in Sylgard®184, which is seen in Figure 9.
In Figure 8, it is possible to see two drops in different places on the sample: in position 1, one drop forming a contact angle greater than 150°, and in position 2, in addition to a much smaller contact angle, it is possible to see the drop penetrating under the film.

Drag Reduction

Flat samples of untreated Sylgard® 184 have a high adherence to water, even in cases of extreme inclination. Drops of 20 μL did not slide on these surfaces, nor at 90° of inclination, as shown in the Figure 10a. Subsequently fixed volumes were added to the pre-existing drop and the new sliding angle was evaluated, as can be seen in Figure 10b. For the treated sample (AM3), the drop was expelled from the surface at all angles effect already seen in Figure 10b, a result of the super hydrophobicity imposed by the treatment, showing the ability of the deposited film to expel the fluid mass from the drop. These measurements prove the state of Cassi–Baxter, already evidenced in the AFM analyses, for samples with higher levels of hydrophobia.
This is more evident by analyzing the results of the mass-flow variations versus the test time, considering each configured peristaltic pump rotation were plotted, Figure 11 shows the data referring to the rotation of 40 rpm, 70 rpm and 100 rpm of the flow over the treated and untreated gutters. The flow rates measured at low speed (40 rpm) are the same for both surfaces. This effect, along with the pulsatile regime generated in the configured rotation, caused the non-formation of the flowing fluid sheet. Thus, the accumulation of fluid mass in less hydrophobic regions of the treated trough delayed, in fractions of a second, the amount of mass measured on the scale.
At speeds of 70 and 100 rpm, it is possible to see the results of drag reduction. The water repellency and, consequently, the minimum contact with the water existing in SHSs is explained by the fact that SHSs can trap air layers in the solid–liquid interface, called plastrons [51]. The difference shown in the first 15 s is minimized due to the greater amount of fluid mass (greater pressure) over the surface, greater contact area, and consequent increase in solid–fluid interactions, imprinting the behavior of the untreated curve. Besides, once the fluid sheet is established, there is more sliding of water layers between them, instead of the fluid with SHS. However, there is the maintenance of the plastrons in the SHS of the gutter. The increase in mass flow shown in Figure 11 confirms, as commented in Section 2.2, an increase in the flow velocity over the SHS and, thus, the occurrence of the drag-reduction phenomenon.

4. Conclusions

The ability of the plasma technique in the surface modification of the PDMS elastomer, to obtain the required SHS, has been proven, proving to be efficient in printing a rough hierarchical nano-structure on the elastomer surface. It was possible to measure, as components through the analysis of the surface composition, as well as the physical ones, performing AFM analyses. The treatment strategy carried out, using an atmosphere of argon and acetylene in the proportions of 40% and 60%, respectively, and chloroform vapor, obtained a superhydrophobic level due to the deposition of hydrocarbon films, especially the AM03 sample. The technique was able to produce superhydrophobic surfaces, where it is not possible to measure static contact angles. In addition, the deposited films remained intact even after exposure to the fluid. With this result of hydrophobia in conjunction with the increase in surface roughness, the present work also obtained a satisfactory drag reduction with respect to runoff in gutters.
As previously mentioned, drag reduction occurs by decreasing the pressure differential value and maintaining the volumetric flow in an internal forced flow or promoting an increase in the volumetric flow by maintaining the hydrostatic pressure differential in an open-channel flow. Thus, it is believed that the phenomenon of drag reduction presented in this article in an open channel should be repeated with less intensity in an internal flow, due to the symmetric flow.

Author Contributions

Conceptualization, G.F.D. and T.H.d.C.C.; methodology, G.F.D.; software, G.F.D.; validation, I.A.d.S., T.H.d.C.C. and K.L.d.B.; formal analysis, A.W.M.; investigation, G.F.D.; resources, T.H.d.C.C.; data curation, J.A.d.S.; writing—original draft preparation, M.C.F.; writing—review and editing, J.F.d.M.N.; visualization, J.O.; supervision, M.C.F.; project administration, M.C.F.; funding acquisition, T.H.d.C.C. All authors have read and agreed to the published version of the manuscript.

Funding

This study was financed in part by the Coordenação de Aperfeiçoamento de Pessoal de Nível Superior—Brasil (CAPES)—Finance Code 001.

Institutional Review Board Statement

Not applicable.

Informed Consent Statement

Not applicable.

Conflicts of Interest

The authors declare no conflict of interest.

References

  1. Wu, K.; Kim, T.H.; Kim, H.D. Theoretical and Numerical Analyses of Aerodynamic Characteristics on Shock Vector Control. J. Aerosp. Eng. 2020, 33, 04020050. [Google Scholar] [CrossRef]
  2. Jiang, F.; Sun, H.; Chen, L.; Lei, F.; Sun, D. Dispersion-tribological property relationship in mineral oils containing 2D layered α-zirconium phosphate nanoplatelets. Friction 2020, 8, 695–707. [Google Scholar] [CrossRef] [Green Version]
  3. Fotopoulos, A.G.; Margaris, D.P. Computational Analysis of Air Lubrication System for Commercial Shipping and Impacts on Fuel Consumption. Computation 2020, 8, 38. [Google Scholar] [CrossRef]
  4. Selim, M.S.; El-Safty, S.A.; Shenashen, M.A.; Higazy, S.A.; Elmarakbi, A. Progress in biomimetic leverages for marine antifouling using nanocomposite coatings. J. Mater. Chem. B 2020, 8, 3701–3732. [Google Scholar] [CrossRef]
  5. Sanders, W.C.; Winkel, E.S.; Dowling, D.R.; Perlin, M.; Ceccio, S.L. Bubble friction drag reduction in a high-Reynolds-number flat-plate turbulent boundary layer. J. Fluid Mech. 2006, 552, 353–380. [Google Scholar] [CrossRef]
  6. Kim, J.; Kim, C.-J. Nanostructured surfaces for dramatic reduction of flow resistance in droplet-based microfluidics. In Proceedings of the IEEE International Conference on Micro Electro Mechanical Systems, Las Vegas, NV, USA, 24 January 2002; pp. 479–482. [Google Scholar]
  7. Virk, P.S. Drag reduction fundamentals. AIChE J. 1975, 21, 625–656. [Google Scholar] [CrossRef]
  8. Pribush, A.; Hatzkelzon, L.; Meyerstein, D.; Meyerstein, N. The mechanism of the polymer-induced drag reduction in blood. Colloids Surfaces B Biointerfaces 2013, 103, 354–359. [Google Scholar] [CrossRef]
  9. Lucas, E.F.; Mansur, C.R.E.; Spinelli, L.; Queirós, Y.G.C. Polymer science applied to petroleum production. Pure Appl. Chem. 2009, 81, 473–494. [Google Scholar] [CrossRef]
  10. Strel′Nikova, S.A.; Tkachenko, G.V.; Uryukov, B.A. Hydrodynamic Aspects of the Toms Effect. J. Eng. Phys. Thermophys. 2015, 88, 1491–1499. [Google Scholar] [CrossRef]
  11. Marhefka, J.N.; Kameneva, M.V. Natural Drag-Reducing Polymers: Discovery, Characterization and Potential Clinical Applications. Fluids 2016, 1, 6. [Google Scholar] [CrossRef] [Green Version]
  12. Bessa, K.; Belletati, J.; Dos Santos, L.; Rossoni, L.; Ortiz, J. Drag reduction by polyethylene glycol in the tail arterial bed of normotensive and hypertensive rats. Braz. J. Med Biol. Res. 2011, 44, 767–777. [Google Scholar] [CrossRef] [PubMed] [Green Version]
  13. Farsiani, Y.; Saeed, Z.; Jayaraman, B.; Elbing, B.R. Modification of turbulent boundary layer coherent structures with drag reducing polymer solution. Phys. Fluids 2020, 32, 015107. [Google Scholar] [CrossRef]
  14. Elbing, B.R.; Winkel, E.S.; Lay, K.A.; Ceccio, S.L.; Dowling, D.R.; Perlin, M. Bubble-induced skin-friction drag reduction and the abrupt transition to air-layer drag reduction. J. Fluid Mech. 2008, 612, 201–236. [Google Scholar] [CrossRef]
  15. Benschop, H.O.G.; Guerin, A.J.; Brinkmann, A.; Dale, M.L.; Finnie, A.A.; Breugem, W.-P.; Clare, A.S.; Stübing, D.; Price, C.; Reynolds, K.J. Drag-reducing riblets with fouling-release properties: Development and testing. Biofouling 2018, 34, 532–544. [Google Scholar] [CrossRef] [PubMed] [Green Version]
  16. Xiang, T.; Han, Y.; Guo, Z.; Wang, R.; Zheng, S.; Li, S.; Li, C.; Dai, X. Fabrication of Inherent Anticorrosion Superhydrophobic Surfaces on Metals. ACS Sustain. Chem. Eng. 2018, 6, 5598–5606. [Google Scholar] [CrossRef]
  17. Jokinen, V.; Kankuri, E.; Hoshian, S.; Franssila, S.; Ras, R.H.A. Superhydrophobic Blood-Repellent Surfaces. Adv. Mater. 2018, 30, e1705104. [Google Scholar] [CrossRef] [Green Version]
  18. Ge, M.; Cao, C.; Liang, F.; Liu, R.; Zhang, Y.; Zhang, W.; Zhu, T.; Yi, B.; Tang, Y.; Lai, Y. A “PDMS-in-water” emulsion enables mechanochemically robust superhydrophobic surfaces with self-healing nature. Nanoscale Horiz. 2019, 5, 65–73. [Google Scholar] [CrossRef]
  19. Tang, L.; Zeng, Z.; Wang, G.; Liu, E.; Li, L.; Xue, Q. Investigation on superhydrophilic surface with porous structure: Drag reduction or drag increasing. Surf. Coatings Technol. 2017, 317, 54–63. [Google Scholar] [CrossRef]
  20. Aljallis, E.; Sarshar, M.A.; Datla, R.; Sikka, V.; Jones, A.; Choi, C.-H. Experimental study of skin friction drag reduction on superhydrophobic flat plates in high Reynolds number boundary layer flow. Phys. Fluids 2013, 25, 025103. [Google Scholar] [CrossRef]
  21. Guo, Z.; Liu, W.; Su, B.-L. Superhydrophobic surfaces: From natural to biomimetic to functional. J. Colloid Interface Sci. 2011, 353, 335–355. [Google Scholar] [CrossRef]
  22. Daniello, R.J.; Waterhouse, N.E.; Rothstein, J.P. Drag reduction in turbulent flows over superhydrophobic surfaces. Phys. Fluids 2009, 21, 085103. [Google Scholar] [CrossRef] [Green Version]
  23. Hubert, J.; Mertens, J.; Dufour, T.; Vandencasteele, N.; Reniers, F.; Viville, P.; Lazzaroni, R.; Raes, M.; Terryn, H. Synthesis and texturization processes of (super)-hydrophobic fluorinated surfaces by atmospheric plasma. J. Mater. Res. 2015, 30, 3177–3191. [Google Scholar] [CrossRef] [Green Version]
  24. Xu, P.; Coyle, T.W.; Pershin, L.; Mostaghimi, J. Understanding the correlations between the mechanical robustness, coating structures and surface composition for highly-/super-hydrophobic ceramic coatings. Surf. Coatings Technol. 2019, 378, 124929. [Google Scholar] [CrossRef]
  25. Huang, Q.; Xiong, L.; Deng, X.; Shu, Z.; Chen, Q.; Bao, B.; Chen, M.; Xiong, Q. Super-hydrophobic film deposition by an atmospheric-pressure plasma process and its anti-icing characteristics. Plasma Sci. Technol. 2019, 21, 055502. [Google Scholar] [CrossRef]
  26. Han, D.; Moon, S.Y. Rapid Formation of Transparent Superhydrophobic Film on Glasses by He/CH4/C4F8Plasma Deposition at Atmospheric Pressure. Plasma Process. Polym. 2015, 12, 172–179. [Google Scholar] [CrossRef]
  27. Sohbatzadeh, F.; Eshghabadi, M.; Mohsenpour, T. Controllable synthesizing DLC nano structures as a super hydrophobic layer on cotton fabric using a low-cost ethanol electrospray-assisted atmospheric plasma jet. Nanotechnology 2018, 29, 265603. [Google Scholar] [CrossRef] [PubMed]
  28. Hünnekens, B.; Krause, A.; Militz, H.; Viöl, W. Hydrophobic recovery of atmospheric pressure plasma treated surfaces of Wood-Polymer Composites (WPC). Eur. J. Wood Wood Prod. 2017, 75, 761–766. [Google Scholar] [CrossRef]
  29. Macedo, M.J.; Silva, G.S.; Feitor, M.C.; Costa, T.H.; Ito, E.N.; Melo, J.D. Surface modification of kapok fibers by cold plasma surface treatment. J. Mater. Res. Technol. 2020, 9, 2467–2476. [Google Scholar] [CrossRef]
  30. Lin, C.-W.; Chung, C.-J.; Chou, C.-M.; He, J.-L. Morphological effect governed by sandblasting and anodic surface reforming on the super-hydrophobicity of AISI 304 stainless steel. Thin Solid Films 2016, 620, 88–93. [Google Scholar] [CrossRef]
  31. Xu, L.; Lai, Y.; Liu, L.; Yang, L.; Guo, Y.; Chang, X.; Shi, J.; Zhang, R.; Yu, J. The Effect of Plasma Electron Temperature on the Surface Properties of Super-Hydrophobic Cotton Fabrics. Coatings 2020, 10, 160. [Google Scholar] [CrossRef] [Green Version]
  32. Xu, L.; Deng, J.; Guo, Y.; Wang, W.; Zhang, R.; Yu, J. Fabrication of super-hydrophobic cotton fabric by low-pressure plasma-enhanced chemical vapor deposition. Text. Res. J. 2019, 89, 1853–1862. [Google Scholar] [CrossRef]
  33. Li, Z.; Liu, H.; Xu, X.; Ma, L.; Shang, S.; Song, Z. Surface modification of silicone elastomer with rosin acid-based quaternary ammonium salt for antimicrobial and biocompatible properties. Mater. Des. 2020, 189, 108493. [Google Scholar] [CrossRef]
  34. Fujii, T. PDMS-based microfluidic devices for biomedical applications. Microelectron. Eng. 2002, 61–62, 907–914. [Google Scholar] [CrossRef]
  35. Zhu, Z.; Wang, Z.; Li, S.; Yuan, X. Antimicrobial strategies for urinary catheters. J. Biomed. Mater. Res. Part A 2019, 107, 445–467. [Google Scholar] [CrossRef]
  36. Soares, E.J. Review of mechanical degradation and de-aggregation of drag reducing polymers in turbulent flows. J. Non-Newtonian Fluid Mech. 2020, 276, 104225. [Google Scholar] [CrossRef]
  37. Shokry, F.; Elfattah, M.A.; El-Gayar, D.; Farag, H.; Sedahmed, G. Effect of drag reducing polymers and impeller geometry on the rate of mass and heat transfer at the wall of a cylindrical stirred tank reactor in relation to catalytic reactor design. Alex. Eng. J. 2020, 59, 509–518. [Google Scholar] [CrossRef]
  38. Hussein, M.; Adesina, A.Y.; Kumar, A.M.; Sorour, A.; Ankah, N.; Al-Aqeeli, N. Mechanical, in-vitro corrosion, and tribological characteristics of TiN coating produced by cathodic arc physical vapor deposition on Ti20Nb13Zr alloy for biomedical applications. Thin Solid Films 2020, 709, 138183. [Google Scholar] [CrossRef]
  39. Zhao, W.; Xu, R.; Zhang, L.; Zhang, Y.; Wang, Y. Preparation and drag reduction performance of biomimetic coatings derived from gelatin-3,4-dihydroxyhydrocinnamic acid gels. Prog. Org. Coatings 2020, 139, 105442. [Google Scholar] [CrossRef]
  40. Macedo, M.J.P.; Mattos, A.; Costa, T.; Feitor, M.C.; Ito, E.N.; Melo, J.D.D. Effect of cold plasma treatment on recycled polyethylene/kapok composites interface adhesion. Compos. Interfaces 2018, 26, 871–886. [Google Scholar] [CrossRef]
  41. Neto, J.F.D.M.; De Souza, I.A.; Feitor, M.C.; Targino, T.G.; Diniz, G.F.; Libório, M.S.; Sousa, R.R.M.; Costa, T.H.D.C. Study of High-Density Polyethylene (HDPE) Kinetics Modification Treated by Dielectric Barrier Discharge (DBD) Plasma. Polymers 2020, 12, 2422. [Google Scholar] [CrossRef]
  42. Fernades, F.; Filho, E.R.; de Souza, I.A.; Nascimento, I.; Sousa, R.; Almeida, E.; Feitor, M.; Costa, T.; Naeem, M.; Iqbal, J. Novel synthesis of copper oxide on fabric samples by cathodic cage plasma deposition. Polym. Adv. Technol. 2019, 31, 520–526. [Google Scholar] [CrossRef]
  43. Chai, J.; Lu, F.; Li, B.; Kwok, D.Y. Wettability Interpretation of Oxygen Plasma Modified Poly(methyl methacrylate). Langmuir 2004, 20, 10919–10927. [Google Scholar] [CrossRef] [PubMed]
  44. Kozbial, A.; Trouba, C.; Liu, H.; Li, L. Characterization of the Intrinsic Water Wettability of Graphite Using Contact Angle Measurements: Effect of Defects on Static and Dynamic Contact Angles. Langmuir 2017, 33, 959–967. [Google Scholar] [CrossRef] [PubMed]
  45. Beake, B.D.; Ling, J.S.G.; Leggett, G.J. Correlation of friction, adhesion, wettability and surface chemistry after argon plasma treatment of poly(ethylene terephthalate). J. Mater. Chem. 1998, 8, 2845–2854. [Google Scholar] [CrossRef]
  46. Drnovská, H.; Lapcik, L.; Bursikova, V.; Zemek, J.; Timmons, A.B. Surface properties of polyethylene after low-temperature plasma treatment. Colloid Polym. Sci. 2003, 281, 1025–1033. [Google Scholar] [CrossRef]
  47. Lee, L.-H. Correlation between Lewis Acid−Base Surface Interaction Components and Linear Solvation Energy Relationship Solvatochromic α and β Parameters. Langmuir 1996, 12, 1681–1687. [Google Scholar] [CrossRef]
  48. Marmur, A. Superhydrophobic and superhygrophobic surfaces: From understanding non-wettability to design considerations. Soft Matter 2013, 9, 7900–7904. [Google Scholar] [CrossRef]
  49. Fox, R.W.; McDonald, A.T.; Mitchell, J.W. Fox and McDonald’s Introduction to Fluid Mechanics; John Wiley & Sons: Hoboken, NJ, USA, 2020. [Google Scholar]
  50. Qaiser, A.A.; Hyland, M.M.; Patterson, D. Effects of various polymerization techniques on PANI deposition at the surface of cellulose ester microporous membranes: XPS and electrical conductivity studies. Synth. Met. 2012, 162, 958–967. [Google Scholar] [CrossRef]
  51. Falde, E.J.; Yohe, S.T.; Colson, Y.L.; Grinstaff, M.W. Superhydrophobic materials for biomedical applications. Biomaterials 2016, 104, 87–103. [Google Scholar] [CrossRef] [Green Version]
Figure 1. Illustrative scheme of the plasma reactor used for the treatment of samples.
Symmetry 14 00524 g001
Figure 2. Interfacial tensions between the three distinct phases.
Symmetry 14 00524 g002
Figure 3. Illustrative scheme of the separation for measuring the drag reduction in the treated samples, in detail a photograph of the tested sample.
Symmetry 14 00524 g003
Figure 4. XPS graphs, peaks referring to the (A) AM1, untreated sample, (B) AM2, the sample treated with the first variant for 10 min, (C) AM3, the sample treated with the first variant for 15 min (D) AM4, the sample treated with the second variant for 10 min, and (E) AM5, the sample treated with the second variant for 15 min.
Symmetry 14 00524 g004
Figure 5. Peak region C 1s, (A) AM1, untreated sample, (B) AM2, the sample treated of the first variant for 10 min, (C) AM3, the sample treated of the first variant for 15 min (D) AM4, the sample treated of the second variant for 10 min, and (E) AM5, the sample treated of the second variant for 15 min, and deconvolution of XPS in the chlorine region (FI) to the AM2, AM3, AM4, and AM5, respectively.
Symmetry 14 00524 g005
Figure 6. Atomic force microscopy (AFM), (a) topographic aspect untreated sample AM1 (b) topographic aspect of sample AM3, (c) topographic aspect of the AM5 sample that has less roughness.
Symmetry 14 00524 g006
Figure 7. Scanning Electron Microscopy (SEM) of (a) AM3 continuous film region, (b) AM2 non-continuous film.
Symmetry 14 00524 g007
Figure 8. Measurement images of contact angles for sample AM5, (a) untreated and (b) treated, showing preliminary value greater than 130°, and (c) Sample AM3 wettability test film frame by frame.
Symmetry 14 00524 g008
Figure 9. Wettability test on a sample of type AM2 showing the different regions of the film.
Symmetry 14 00524 g009
Figure 10. (a) Variation of sliding angle for a drop of 20 uL on an untreated surface variation between (a) 20°, (b) 30°, (c) 40°, (d) 50°, (e) 60°, and (f) 80°. (g) Comparison of the slip angle between treated and untreated samples.
Symmetry 14 00524 g010
Figure 11. Mass flow variation for pump rotation at 40, 70, and 100 RPM.
Symmetry 14 00524 g011
Table 1. Variants used for plasma treatment.
VariantGases Used
20 cm3/min
CurrentVoltage
ArC2H2AV
1st Ar/CHCl340%60%0.15600
2nd C2H2/CHCl320%80%0.15600
Table 2. XPS results in percentage according to the treatment variant and ratios of oxygen in relation to carbon and chlorine in relation to carbon.
SamplesO (%)C (%)Cl (%)Si (%)O/CCl/CVariantTime (min)Pressure (mBar)
AM124.8348.47-26.690.5123---
AM217.8856.647.7217.760.31570.13631st10 1 ± 0.02
AM319.6853.115.9621.240.37060.11221st15 1 ± 0.02
AM424.3246.884.1424.650.51880.08832nd10 1 ± 0.02
AM519.3750.6611.3518.630.382402242nd15 1 ± 0.02
Table 3. Average roughness values (Ra) for untreated samples and treated in the 1st and 2nd variants.
SampleRoughness (nm)Sample Condition
AM018.92untreated
AM0389.29treated 1st variant
AM054.61treated 2nd variant
Publisher’s Note: MDPI stays neutral with regard to jurisdictional claims in published maps and institutional affiliations.

