Article

Adsorption Performance of Physically Activated Biochars for Postcombustion CO2 Capture from Dry and Humid Flue Gas

by
Joan J. Manyà
*,
David García-Morcate
and
Belén González
Aragón Institute of Engineering Research (I3A), Technological College of Huesca, University of Zaragoza, crta. Cuarte s/n, E-22071 Huesca, Spain
*
Author to whom correspondence should be addressed.
Submission received: 14 November 2019 / Revised: 20 December 2019 / Accepted: 30 December 2019 / Published: 3 January 2020
(This article belongs to the Special Issue New Carbon Materials from Biomass and Their Applications)

Abstract

:
In the present study, the performance of four biomass-derived physically activated biochars for dynamic CO2 capture was assessed. Biochars were first produced from vine shoots and wheat straw pellets through slow pyrolysis (at pressures of 0.1 and 0.5 MPa) and then activated with CO2 (at 0.1 MPa and 800 °C) up to different degrees of burn-off. Cyclic adsorption-desorption measurements were conducted under both dry and humid conditions using a packed-bed of adsorbent at relatively short residence times of the gas phase (12–13 s). The adsorbent prepared from the vine shoots-derived biochar obtained by atmospheric pyrolysis, which showed the most hierarchical pore size distribution, exhibited a good and stable performance under dry conditions and at an adsorption temperature of 50 °C, due to the enhanced CO2 adsorption and desorption rates. However, the presence of relatively high concentrations of water vapor in the feeding gas clearly interfered with the CO2 adsorption mechanism, leading to significantly shorter breakthrough times. In this case, the highest percentages of a used bed were achieved by one of the other activated biochars tested, which was prepared from the wheat straw-derived biochar obtained by pressurized pyrolysis.

Graphical Abstract

1. Introduction

Global warming is gaining wider recognition in the world. Fossil fuel power plants are responsible for approximately one-third of global CO2 emissions to the atmosphere. Therefore, removing CO2 from low-pressure flue gas (i.e., CO2 capture in postcombustion) has been the focus of extensive research over the last few decades. As an alternative to the energy-intensive amine-based chemical absorption processes, CO2 capture via adsorption on renewable biomass-derived carbons has gained increased interest, since these adsorbents are relatively cheap, require low energy for regeneration, and show a relatively good tolerance to moisture existing in flue gas [1].
An increasing number of studies have focused on producing activated carbons (ACs) from different biomass precursors (through physical or chemical activation) and assessing their performance in terms of CO2 uptake at 10–15 kPa and selectivity towards CO2 over N2 [2,3,4,5,6,7,8,9,10]. At equilibrium conditions (i.e., adsorption isotherms of pure components), the biomass-derived ACs exhibit a relatively high CO2 adsorption capacity, usually in the range of 1.0–2.0 mmol g−1 at 15 kPa and 25 °C [9]. Regarding the apparent CO2/N2 selectivity, which is defined as the ratio of molar uptakes divided by the ratio of partial pressures, values in the range of 8–14 (deduced from single component adsorption data at 25–50 °C) have been reported in previous studies [6,11,12]. It is generally accepted that the narrower micropores of ACs are the main responsible for the physical adsorption of CO2 at low pressure. Therefore, and for a given AC, the CO2 uptake at 10–15 kPa is primarily a function of its ultra-micropore volume (pore width below 0.7 nm).
From a more realistic point of view, studies focusing on the behavior of biomass-derived ACs under dynamic conditions are explicitly required, since cyclic breakthrough measurements are more representative of practical separations. Adsorbents have to exhibit relatively fast adsorption and desorption kinetics for their successful implementation in swing adsorption processes. In this sense, the number of studies available is relatively modest compared to the large amount of research already conducted on developing ACs from biomass precursors. In a very interesting study [13], the performance under dynamic conditions of olive stone and almond shells-derived ACs (produced by single-step activation with CO2 at 800 °C) was tested. For a feed stream composed of a binary mixture of CO2/N2 (14/86 vol. %) at 50 °C and 120 kPa, the authors reported good CO2 adsorption capacities (around 0.6 mmol g−1) and apparent selectivities CO2/N2 (20–30) for fresh adsorbent. The fact that the selectivity increased for dynamic measurements was mainly explained by a certain decrease in the adsorbed amount of the weaker adsorbate (N2) in the presence of the stronger one (CO2). In other words, the apparent CO2/N2 selectivity estimated from the single-component adsorption isotherms could be lower than that measured under dynamic conditions for binary mixtures.
Shahkarami et al., [14] assessed the performance of several agricultural waste-based carbons, which were produced through slow or fast pyrolysis and then activated with KOH. The best results were obtained for a pinewood sawdust-derived AC, which exhibited high CO2 uptake (1.8 mmol g−1 after nine cycles) and apparent selectivity CO2/N2 (29) at 25 °C and 101.3 kPa (for a binary mixture CO2/N2 15/85 vol. %). However, the temperature tested by Shahkarami et al., [14] was not within the typical range for postcombustion flue gas (40–60 °C). Moreover, the gas residence time selected by the authors (31 s) was relatively long. In this sense, capital costs for large-scale units operating at these conditions could be unacceptable. More representative operating conditions (adsorption temperatures of 45 and 60 °C, and gas residence times of 16–17 s) were considered in the study by Shafeeyan et al., [15], in which CO2 adsorption capacities of 0.57 and 0.47 mmol g−1 (at 45 and 60 °C, respectively) were reported for a granular palm shell-derived N-doped AC.
The three above-mentioned studies, however, were conducted under dry conditions. Given that the real flue gas contains a certain amount of moisture (which is unavoidable in practice), the effect of water vapor on the CO2 adsorption capacity and CO2/N2 selectivity under dynamic conditions should also be assessed. In this regard, there are relatively few experimental studies available in the literature that have explored the performance of biomass-derived ACs under humid conditions. Among them, it is worth mentioning the study by Xu et al., [16], where the performance of a commercial coconut shell-derived AC was tested during a vacuum swing adsorption (VSA) cycle under humid conditions. In the experiment conducted by Xu et al., the adsorption step was conducted at an absolute pressure of 120 kPa, at a bed temperature of 60 °C, and using a feed gas steam composed of CO2 (12 vol. %), water (4.8 vol. %), and air (balance). Surprisingly, the authors reported an almost identical recovery and purity of CO2 in the presence of water as compared to the dry condition. However, this study did not assess the performance of the tested adsorbent over sequential adsorption/desorption cycles.
Durán et al., [17] investigated the ability of a pine sawdust-based AC to selectively adsorb CO2 from wet biogas under dynamic conditions (at an absolute pressure of 135 kPa, 30 °C, and using a quaternary gas mixture of CH4/CO2/N2/H2O(v) with a relative humidity of 55%). The authors observed that, under humid conditions, the CO2 uptake and breakthrough time decreased in comparison with those measured during the breakthrough experiments under dry conditions. In fact, the breakthrough time was reduced by a factor of 1.85 for a molar ratio CO2/CH4 of 30/70 in the feed gas mixture. However, as a remarkable finding, Durán et al., [17] stated that the presence of water vapor on the bed can promote the CO2 adsorption over CH4, leading to a more efficient separation with respect to the dry case.
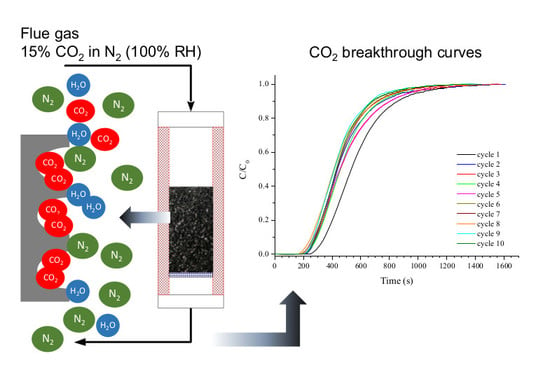
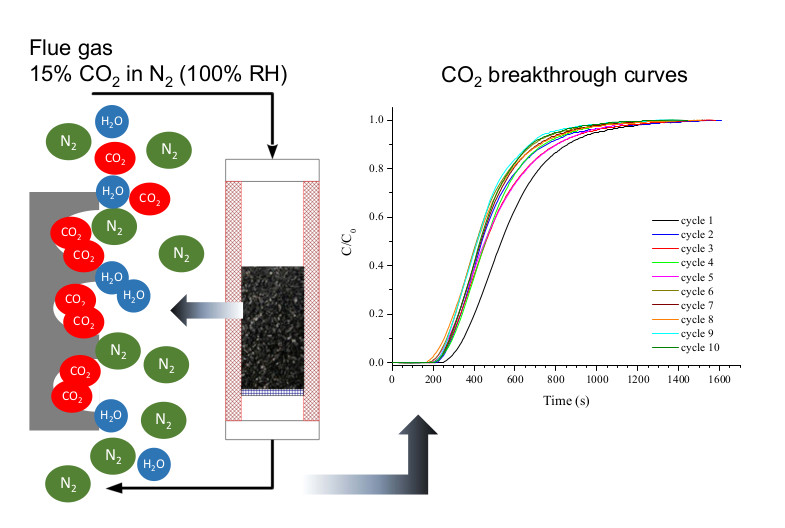
The specific aim of the present study is to explore the feasibility of using biomass-derived physically activated biochars as cost-effective adsorbents for CO2 capture from humid postcombustion flue gas. The performance of physically activated carbons based on vine shoots as well as wheat straw pellets was assessed via cyclic breakthrough experiments under dry and severe humid conditions (relative humidity of 100%). Both biomass sources were selected on the basis of their potential sustainability, since they are agricultural wastes (residual biomass) that do not compete with food, feed or timber production either directly or indirectly within a specific area.

2. Materials and Methods

2.1. Biochar-Based Adsorbents

Two types of agricultural wastes were used as carbon precursors: (1) vine shoots (VS) from a local vineyard (which were previously cut into pieces of 1.0–3.5 cm in length), and (2) free-binder wheat straw pellets (WS) from a Belgian company (7 mm OD and approximately 12 mm long). Proximate and ultimate analyses were conducted for both biomass sources (further details on these measurements are given in the Supplementary Materials).
The biomass feedstocks were pyrolyzed under nitrogen in a packed-bed reactor at a highest temperature (HTT) of 500 and 600 °C for WS and VS, respectively. Two different values of absolute pressures (0.1 and 0.5 MPa) were tested. Details on the pyrolysis device and experimental procedure are available elsewhere [18,19]. Briefly, approximately 400 g of raw biomass were heated at an average heating rate of 5 °C min−1 to the highest temperature with a soaking time of 60 min at this temperature. The volumetric flow rate of the carrier gas (N2) within the reactor at the highest temperature was kept constant, regardless of the pressure applied, by properly adjusting the mass flow rate. Assuming an entire reactor’s void-volume fraction of 0.9, the above-mentioned flow rate led to a as residence time of the carrier gas within the reactor of 100 s.
The obtained biochars (which were milled and sieved to a particle size distribution of 0.212–1.41 mm) were physically activated with CO2 at 800 °C in a quartz tubular fixed-bed reactor (ID = 16 mm), which was placed in a vertical tube furnace (model EVA 12/300 from Carbolite Gero, UK). The reactor was filled with biochar at a bed height of 300 mm and then heated at 10 °C min−1 under a steady flow of N2 (500 mL min−1 STP) at atmospheric pressure. Once the bed reached the desired temperature (800 °C), the gas flow was switched from pure N2 to a mixture of CO2 and N2 (in the volume ratio of 20:80) at a total mass flow rate of 500 mL min−1 STP. Given that the porosity of raw biochars ranged from 0.65 to 0.75, a gas-hourly space velocity (GHSV) of 5600–7800 h−1 was estimated. A holding time of 1 h was applied in order to obtain a burn-off degree of 20–30%, depending on the reactivity of the given precursor. To properly determine the degree of burn-off, biochars were previously pyrolyzed (under N2 atmosphere) at a highest temperature of 800 °C. Table 1 summarizes the preparation procedure for the ACs tested in the present study. The proximate and ultimate analyses of the activated biochars were also performed.

2.2. Static Gas Adsorption Measurements

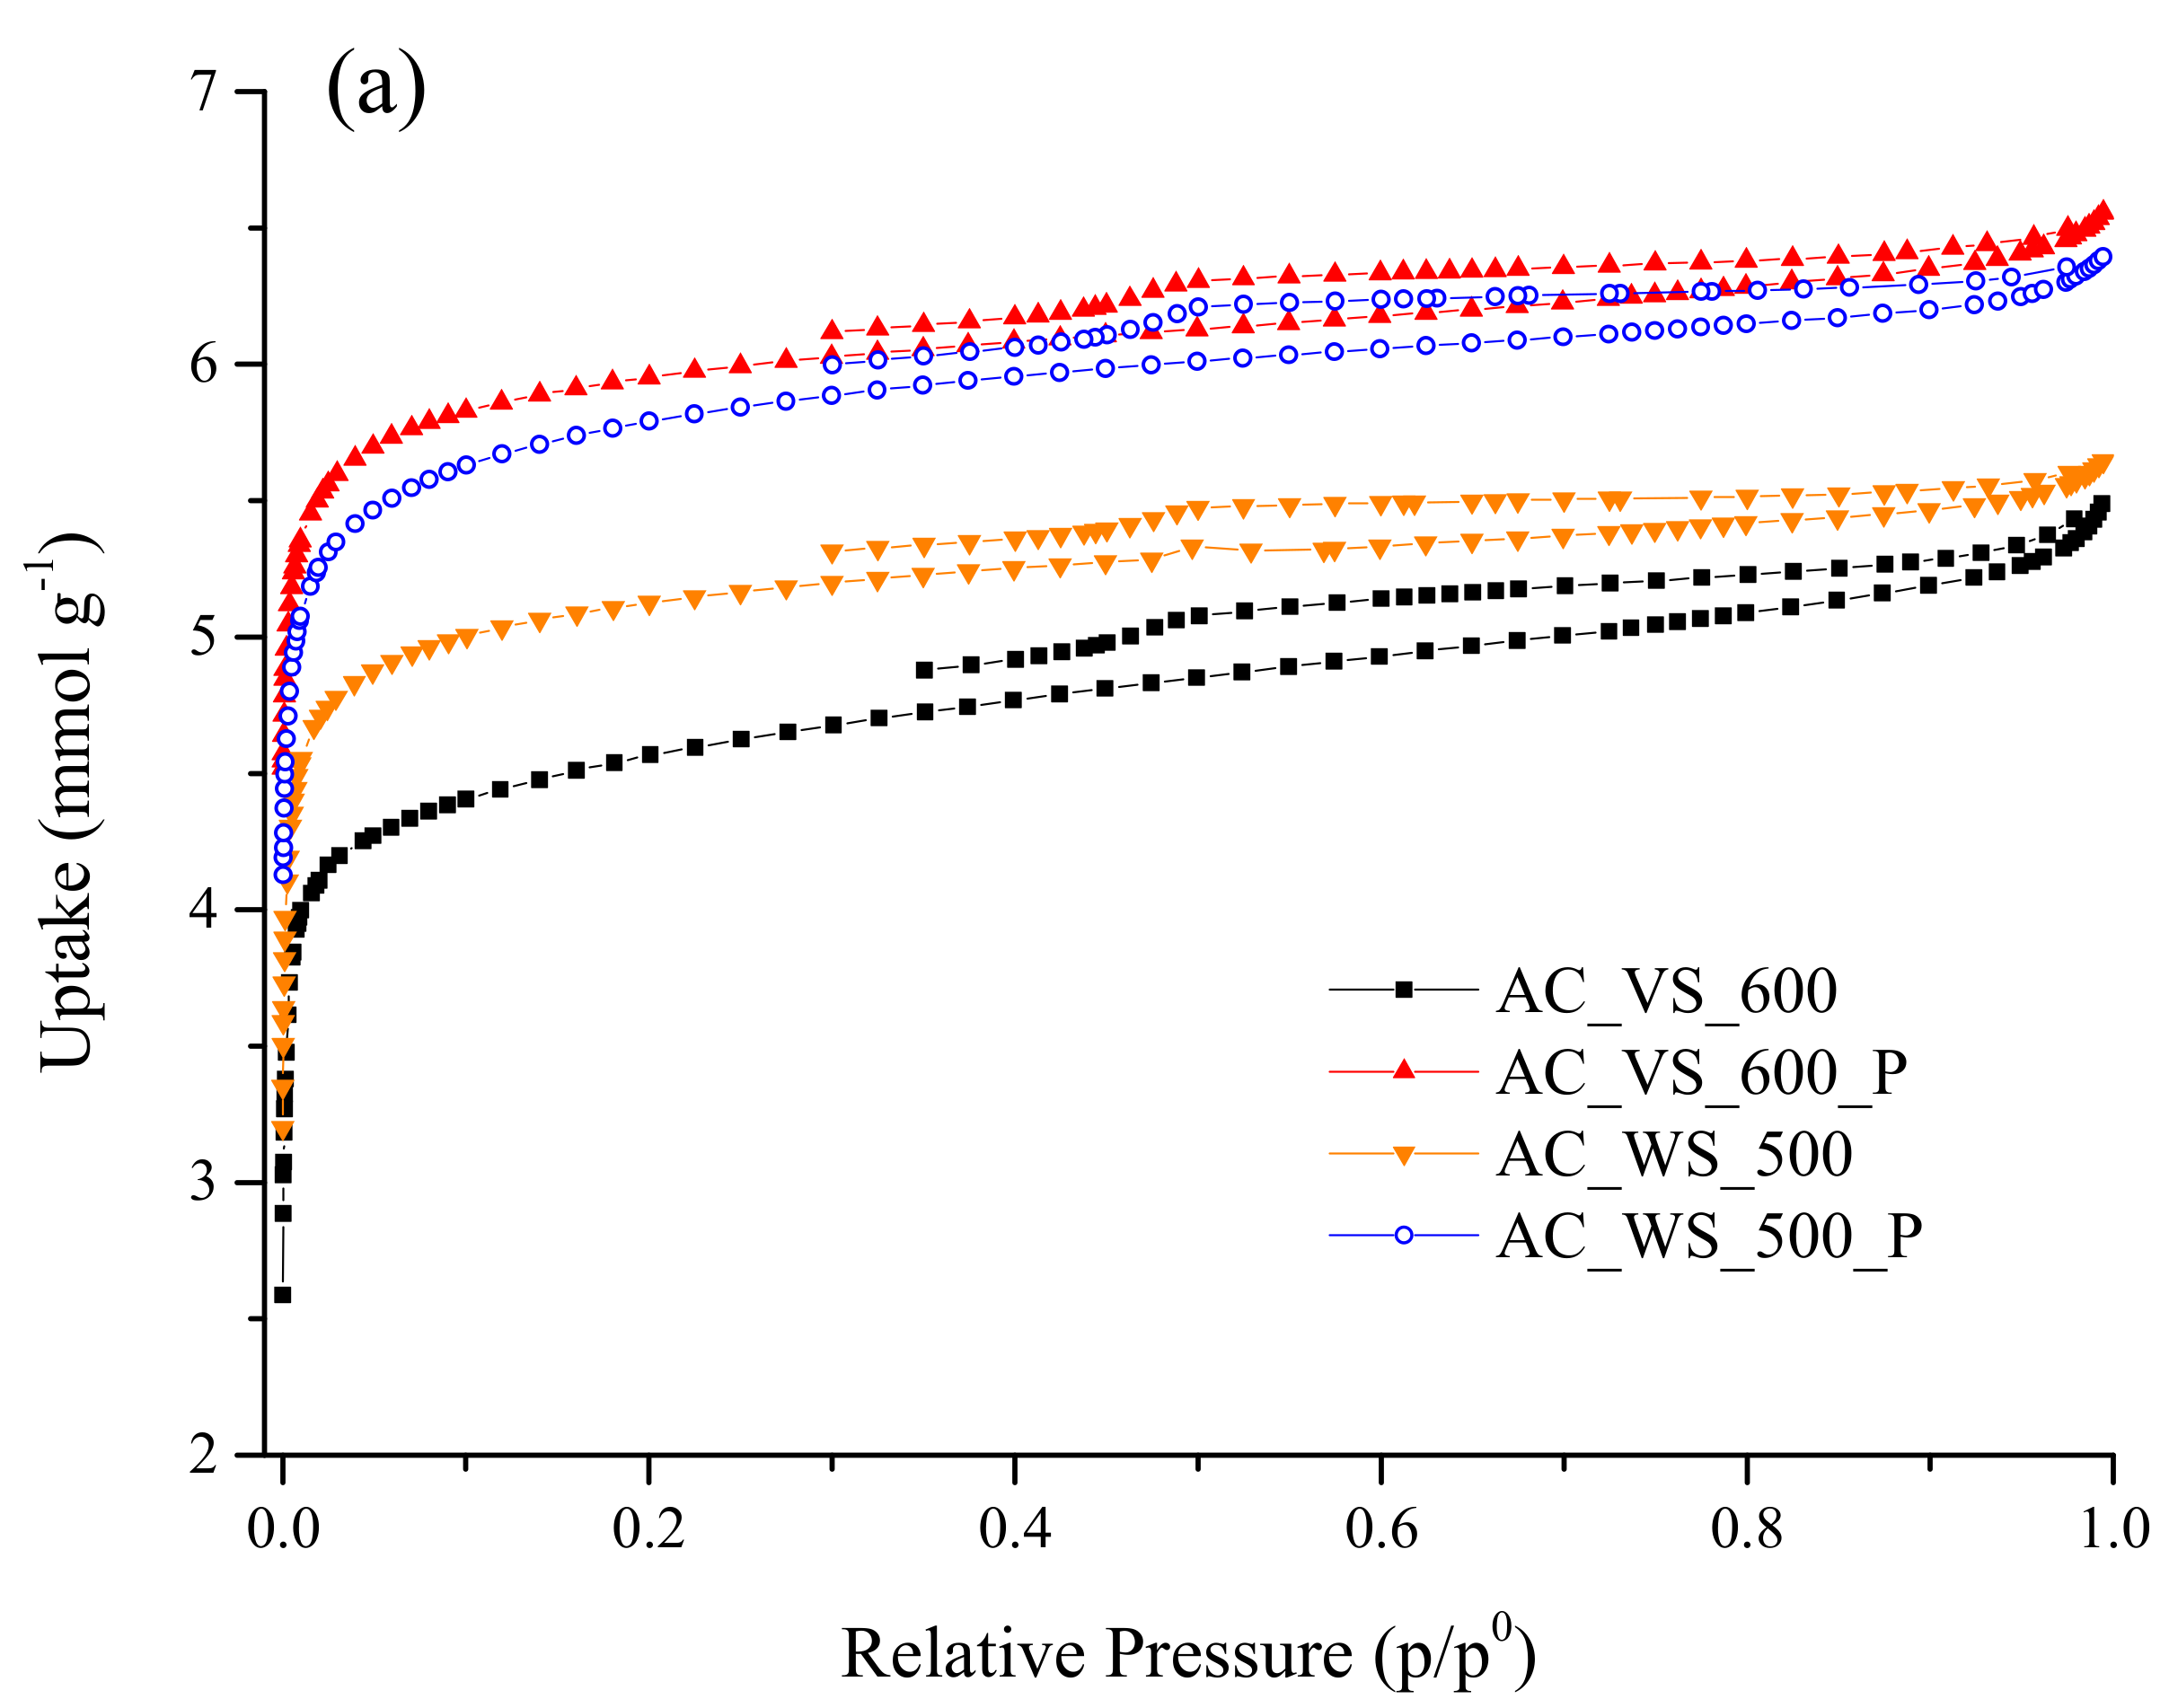
For textural characterization purposes, N2 adsorption/desorption isotherms at −196 °C and CO2 adsorption isotherms at 0 °C were acquired using an ASAP 2020 gas sorption analyzer from Micromeritics (USA). Samples (around 120–180 mg) were previously degassed under dynamic vacuum conditions to constant weight at a temperature of 150 °C. From the N2 adsorption/desorption isotherms at −196 °C, we estimated the apparent specific surface area (SBET), micropore volume (Vmic), mesopore volume (
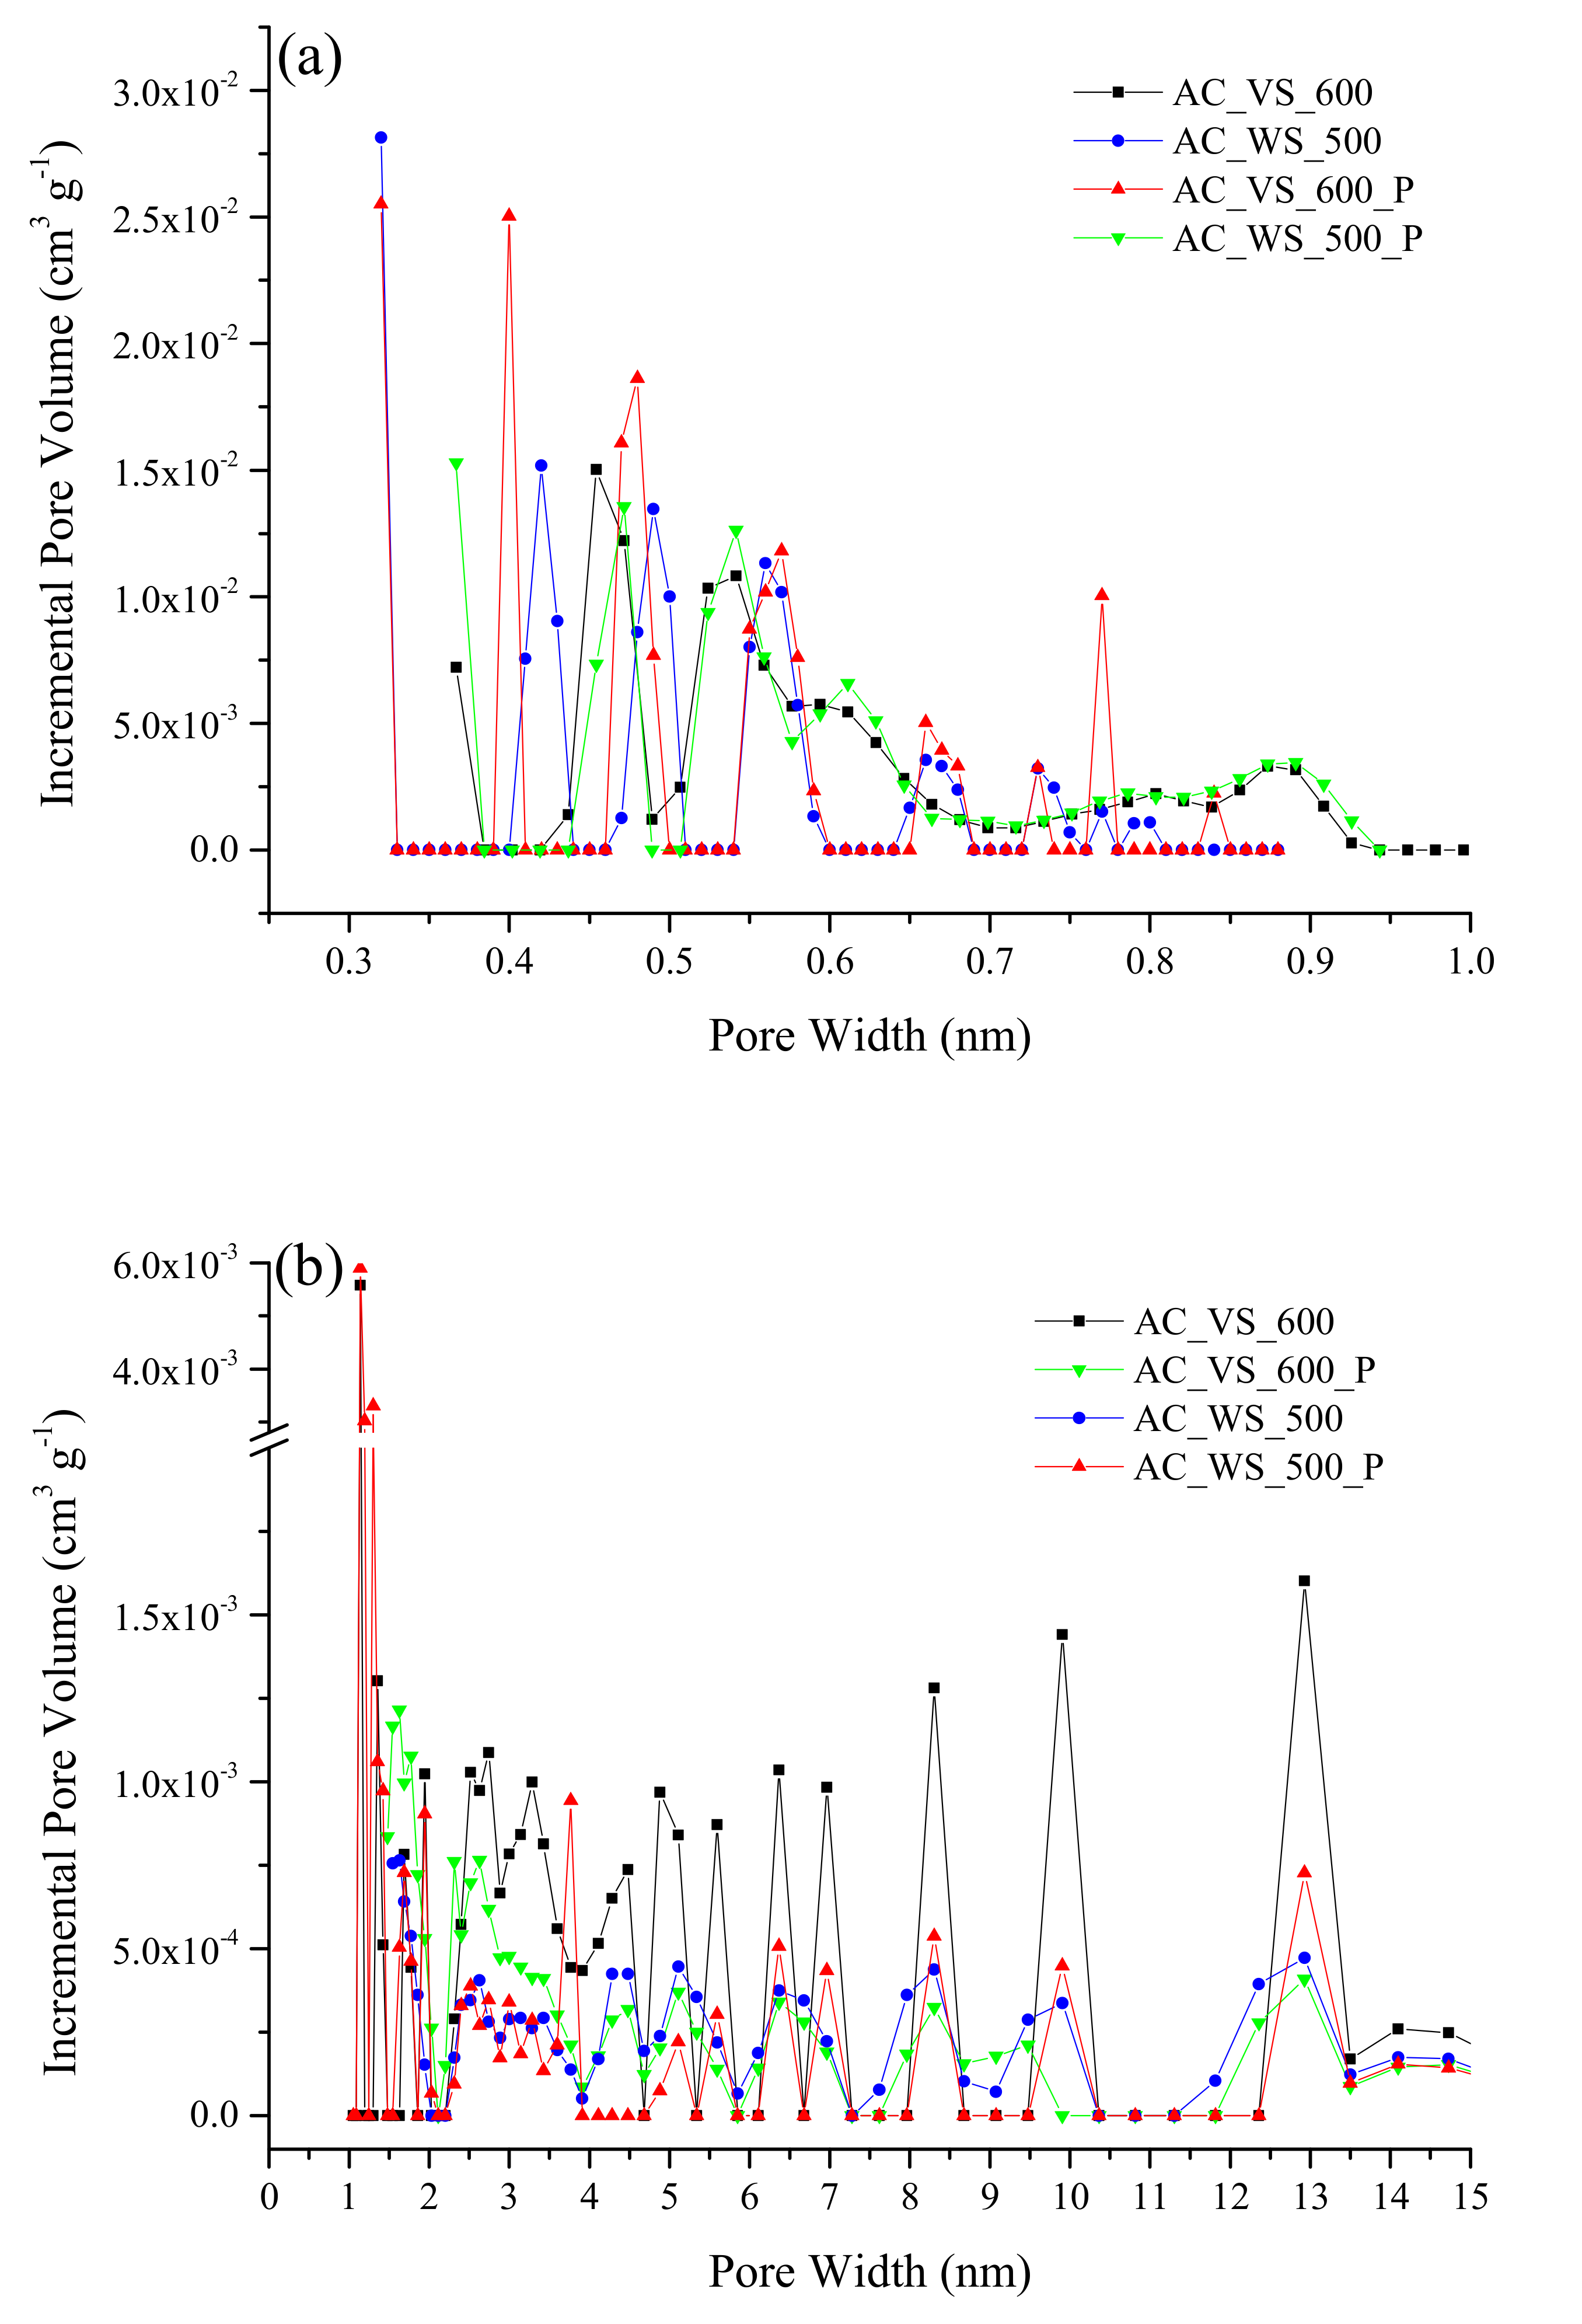
Vmes), and pore size distribution (PSD) for pore sizes above 0.9–1.0 nm. The data from the CO2 adsorption isotherms at 0 °C were used to estimate the ultra-micropore volume (Vultra, for pore sizes lower than 0.7 nm) and the PSD for narrow micropores. Further details regarding the procedures used to estimate the above-mentioned parameters are given in the Supplementary Material.
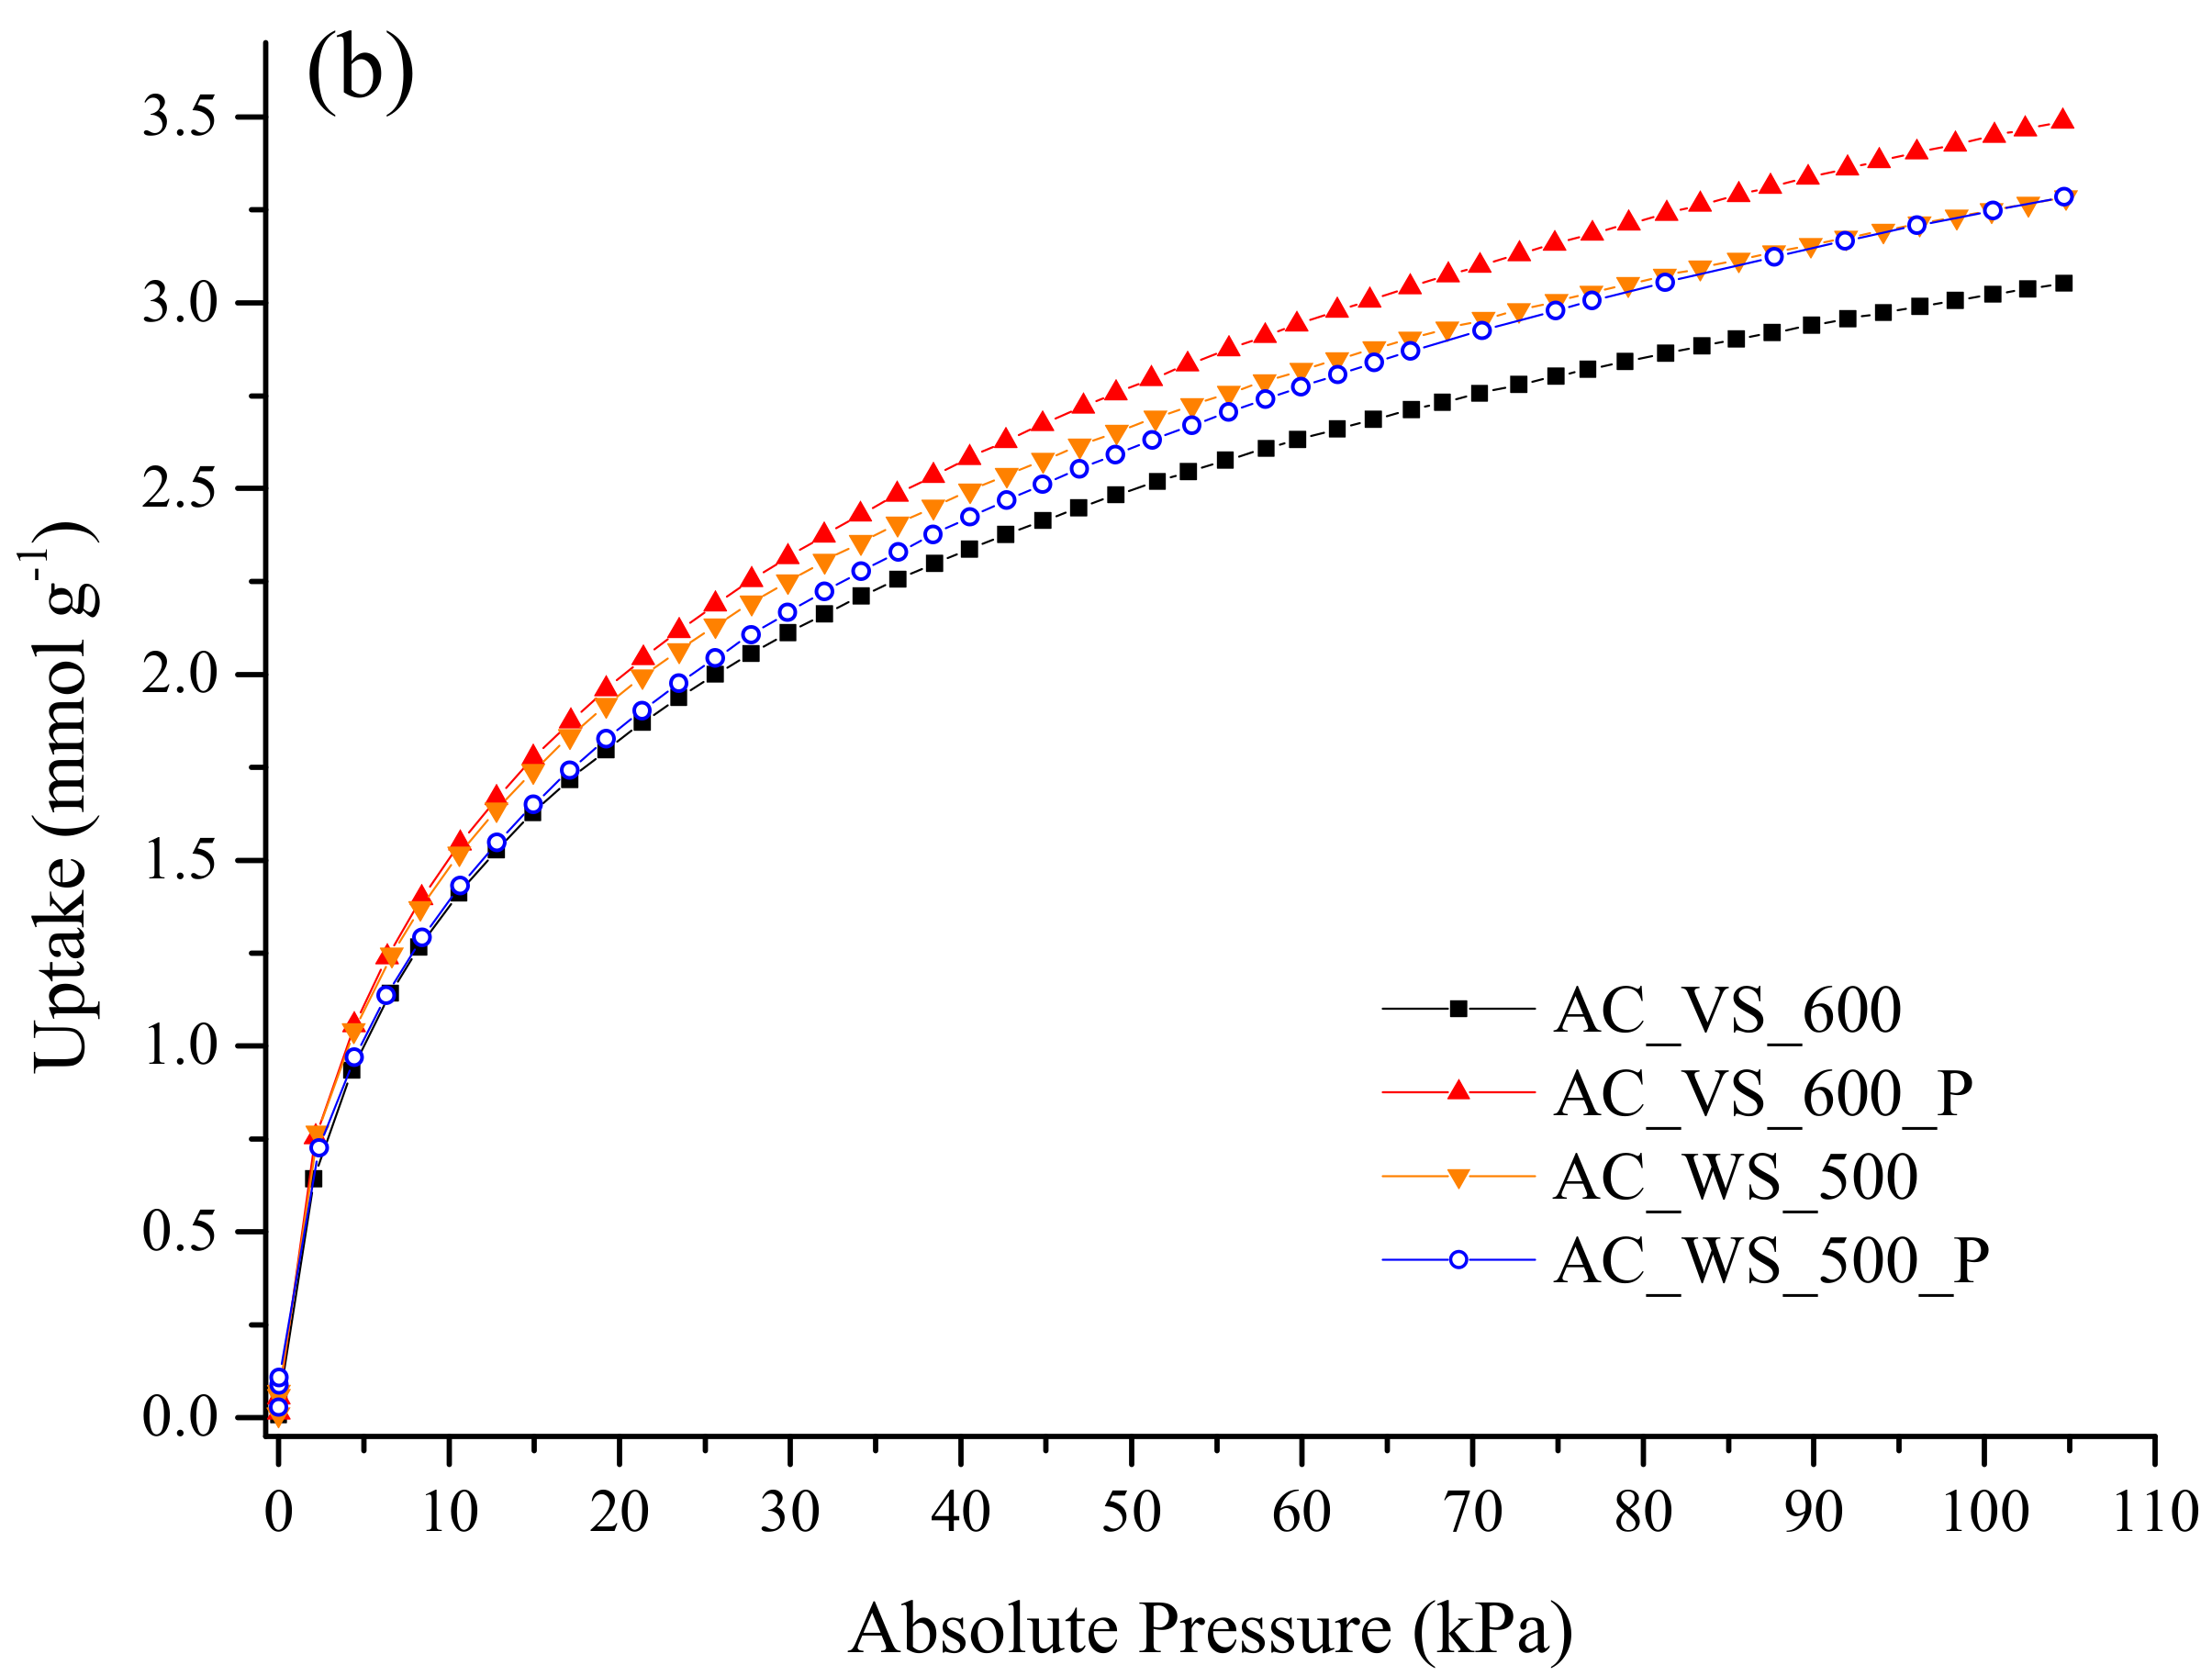
The single-component adsorption isotherms (for both CO2 and N2), at temperatures of 25 and 50 °C, on the activated biochars (at pressures ranging from 0 to 101 kPa) were measured using the same above-mentioned device as well as the same degasification procedure.

2.3. Dynamic Breakthrough Experiments

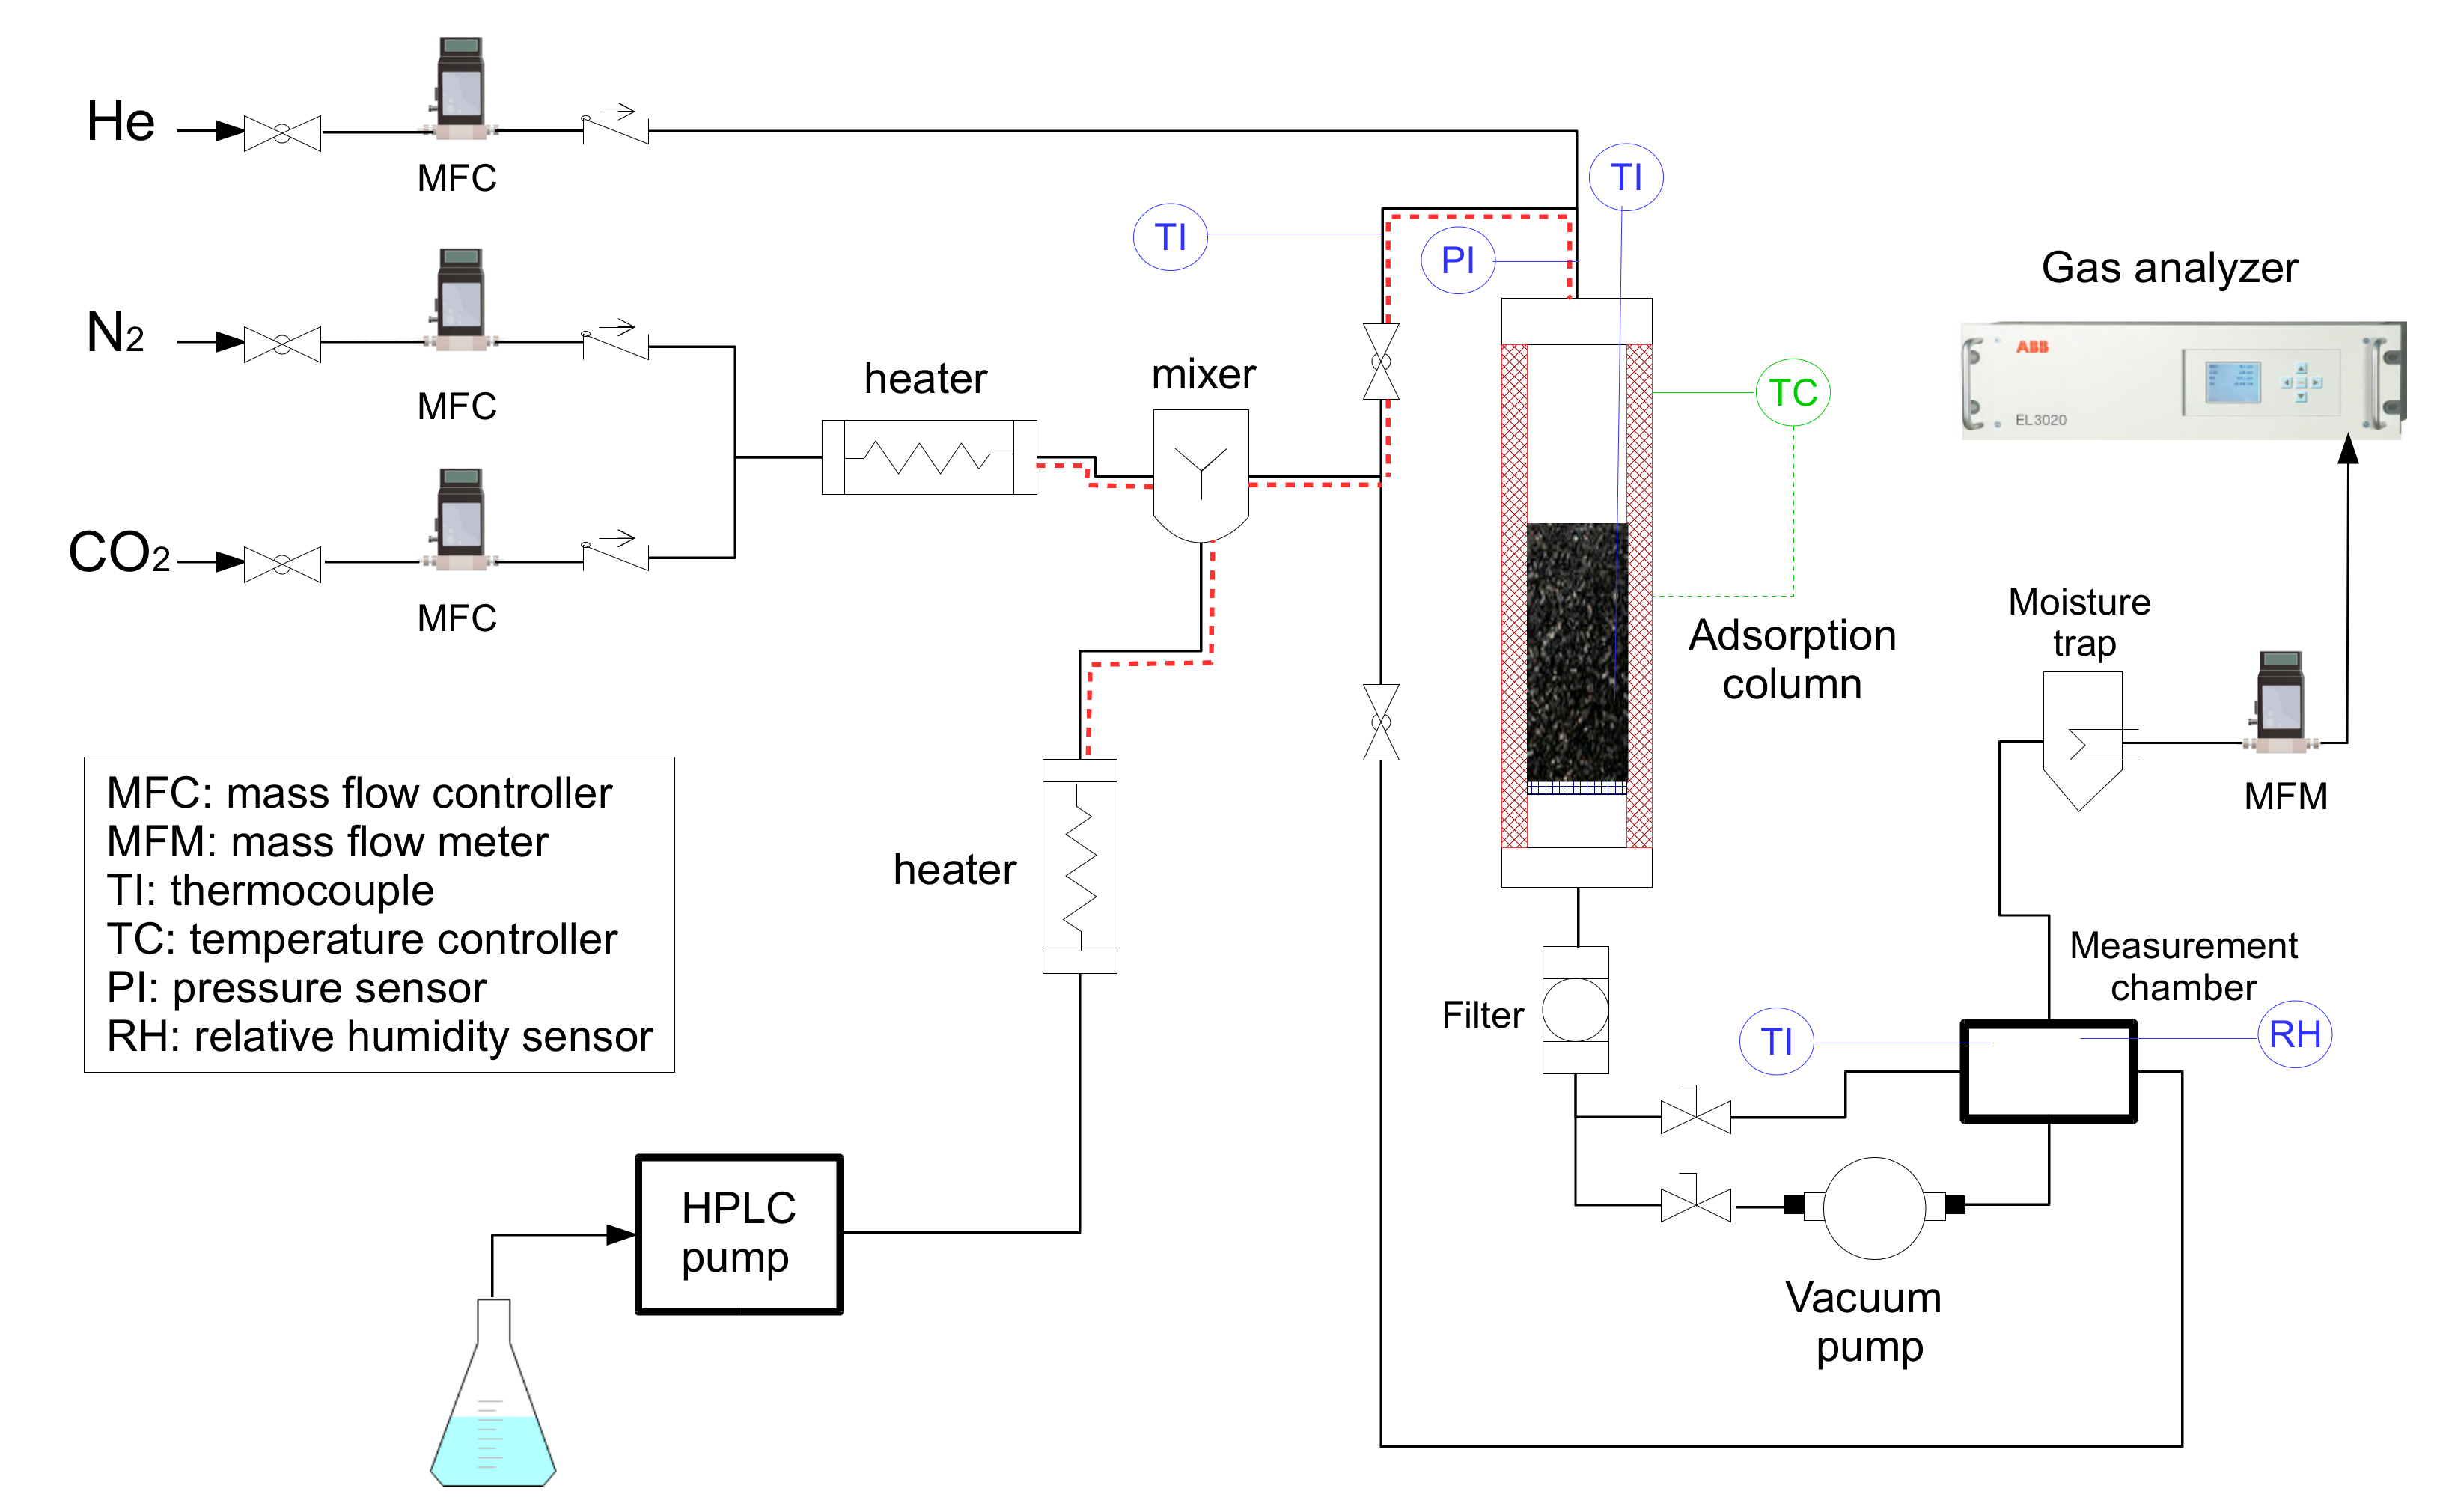
Cyclic adsorption-desorption measurements were conducted in a custom-built device, whose schematic diagram is given in Figure 1. The adsorption column consisted of an AISI 316-L tubular reactor (250 mm length; 20.9 mm ID), which was heated by a PID controlled electric furnace. A K-type thermocouple was placed in the center of the packed bed. Experiments were performed using an initial mass of adsorbent that corresponded to a bed height of 220 mm. Small particle sizes (i.e., below 0.212 mm) were discarded to avoid excessive pressure drop. A small portion of fused quartz wool was placed at both ends of the column to prevent the loss of adsorbent.
The feed flow rates of pure N2, CO2, and helium were adjusted using mass flow controllers (Brooks, USA). A mass flow meter (Omega Engineering, UK) was used to measure the outlet gas flow rate. CO2 concentrations were measured using a continuous gas analyzer (ABB model EL3020, Germany). During the adsorption step, the absolute pressure was kept constant at a value of 110–115 kPa. The desorption step was conducted under vacuum (VSA) using an oil rotary vane vacuum pump (Busch, Germany), which assured an absolute pressure of 10 kPa at suction flow rate up to 0.33 m3 s−1 STP.
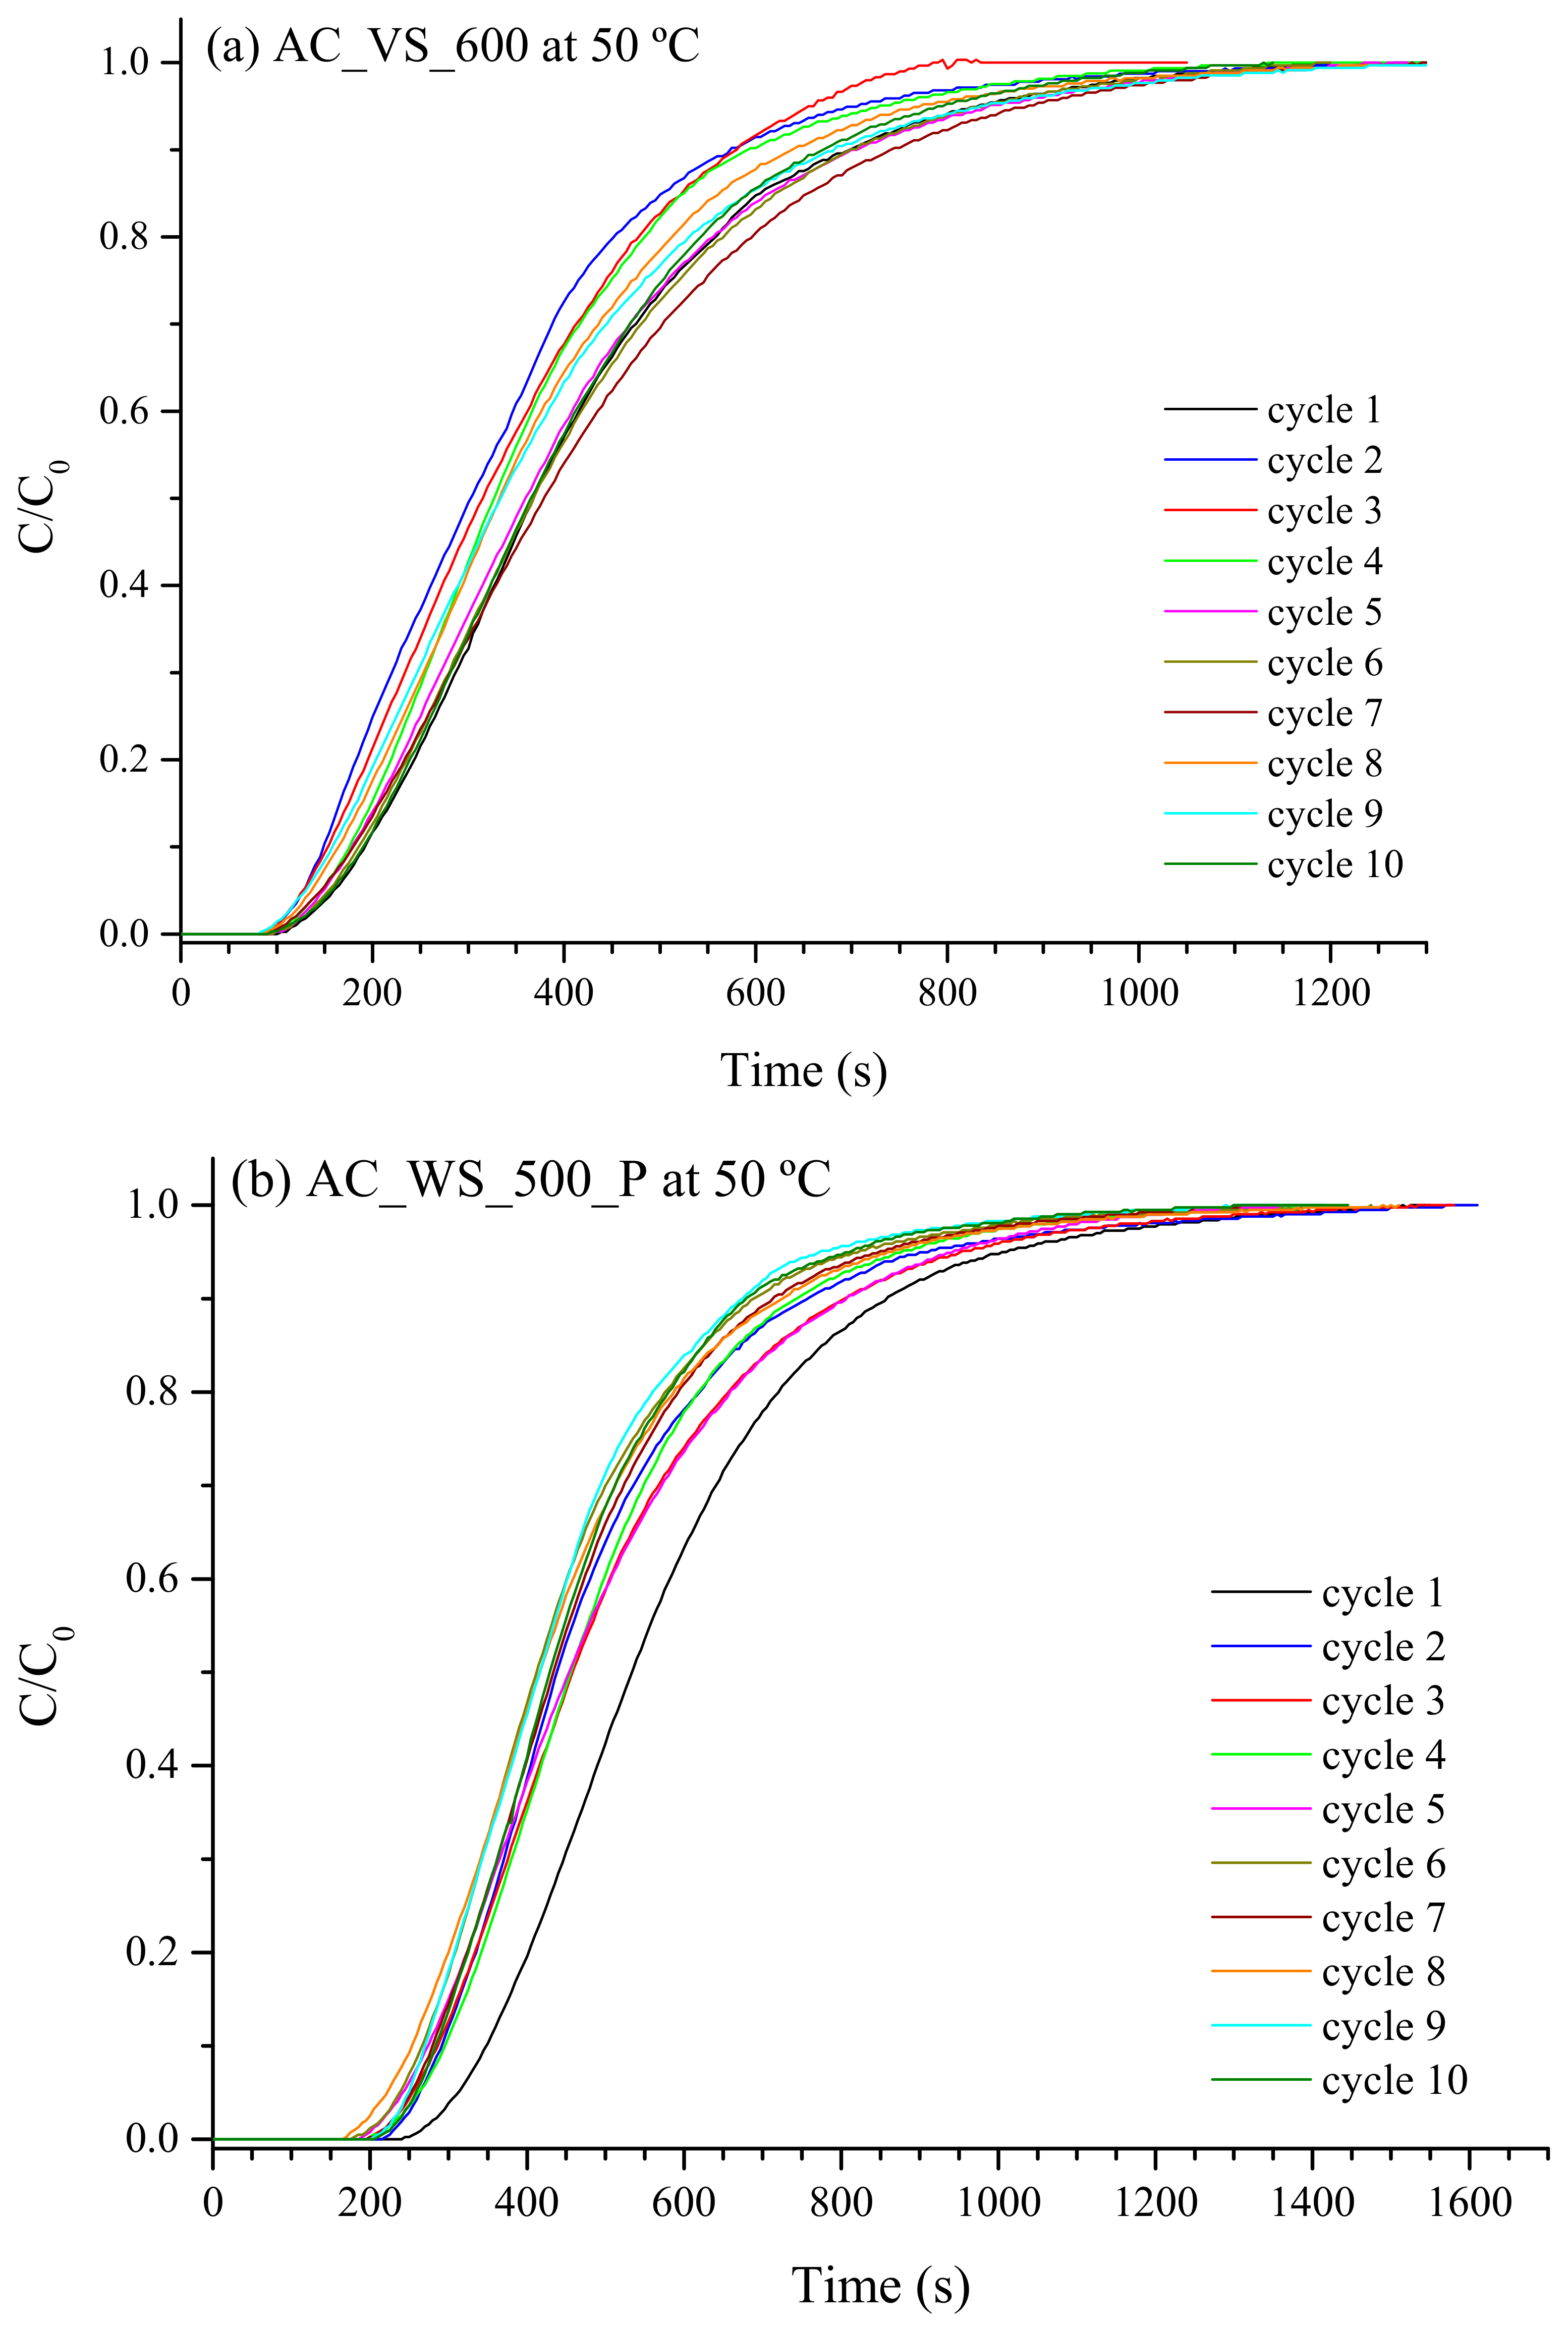
In a typical cyclic experiment under dry conditions, the adsorbent was initially outgassed by purging with helium at 150 °C for 4 h. Afterwards, the bed was cooled down to the desired temperature (25 or 50 °C). Adsorption was then started by switching the feeding gas from helium to a dry mixture of N2 and CO2 (with a CO2 composition of 13.75–14.25 vol. %) at a total flow rate of 3.67 cm3 s−1 STP. Under these operating conditions and assuming a void fraction of 0.65–0.75 (estimated from the measured pressure drop across the bed, which ranged from 165 to 430 Pa, and the Ergun equation), the gas residence time within the packed bed was 13.2 ± 1.3 and 12.2 ± 1.2 s at 25 and 50 °C, respectively. Once saturation was reached, the feeding gas was turned off and the column outlet was connected to the vacuum pump. During the desorption step, the temperature of the packed bed was kept at the same value than for the preceding adsorption step.
For the dynamic adsorption measurements under humid conditions (at a temperature of 50 °C), 0.0226 cm3 min−1 of water was added to the dry feeding gas (at the same flow rate as mentioned above) using a HPLC pump (model 521 from Analytical Scientific Instruments, USA). The amount of added water corresponded to a relative humidity (RH) of the wet gas of approximately 100% at the operating conditions of the column. The water content of the wet feeding gas was 11.2 vol. %.
Since the dead volume of the system was relatively large, especially for the experiments conducted under humid conditions (in which the moisture trap and measurement chamber were also used), blank adsorption tests were carried out to estimate the time required to displace the dead volume. The blank tests were conducted in both dry and humid conditions for an empty and filled (with glass beads of 1.0 mm OD) adsorption column.

3. Results and Discussion

3.1. Properties of the Used Adsorbents

The results from proximate and ultimate analyses for the raw biomasses and activated biochars are listed in Table 2. Both raw biomass samples exhibited relatively high carbon contents (47.1 and 44.2 wt. % in dry and ash-free basis for VS and WS, respectively) and low ash contents (below 5 wt. %), indicating their potential to be used as precursors for activated carbons. After pyrolysis and further activation with CO2, an expected higher carbon content (above 85 wt. % in daf basis), at the expense of both hydrogen and oxygen, was observed. However, the ash content of activated biochars was relatively high (from 9.00 to 16.5 wt. %). This can be explained by the loss of organic matter during the thermal treatments, leading to final mass yields of activated carbons (from the raw feedstock) within the range of 18–20 wt. % (dry basis), and the absence of any acid-leaching post-treatment. Despite the fact that the presence of ash can decrease the surface area available for adsorption, biomass-derived ash constituents (especially K) could have positive effect on CO2 adsorption, as reported by Yin et al., [20]. At this point, it should be noted that the contents of potassium (as K2O) in the ashes from the biomass sources used here were found to be considerably high: 18.4 wt. % for VS [18] and 53.2 wt. % for WS [19].
On the other hand, Table 3 reports the key textural properties (i.e., apparent surface area and pore volumes at different pore size ranges) of activated biochars, which were deduced from the adsorption isotherms of both N2 and CO2 at −196 °C and 0 °C, respectively (see Figure 2). As expected, the N2-based specific surface areas (SBET) reported in Table 3 were relatively low due to the high content of ash and the predominantly microporous narrow structure in biomass-derived chars activated with CO2. From Figure 2a, it can be observed a certain contribution of narrow macropores (isotherms do not reach a plateau at high relative pressures). In addition, a slight increase in the degree of burn-off resulted in a slightly better microporosity development (i.e., higher Vmic values). This trend, which is consistent with previous studies [21,22], could be explained by a progressive widening of the narrow micropores with the degree of burn-off. However, the mesopore volume did not seem to be correlated with the degree of burn-off, suggesting that the nature of the biomass feedstock and the pressure applied during the pyrolysis play a certain role in the resulting pore size distribution.

3.2. Adsorption Isotherms

In light of the adsorption isotherms (for both CO2 and N2 at 25 and 50 °C) shown in Figure 3, the AC_WS_500 adsorbent appeared to be the best material in terms of CO2 adsorption capacity at relatively low pressures. For instance, at an absolute pressure of 14 kPa, the highest CO2 uptake at both temperatures was measured for this adsorbent (1.3 and 0.74 mmol g−1 at 25 and 50 °C, respectively; as reported in Table 4). This finding is consistent with the highest ultra-micropore volume (Vultra) reported in Table 3 for this activated biochar (which also exhibited the lowest burn-off degree), since many studies have reported that the CO2 uptake at absolute pressures of 5–15 kPa is mainly dependent on the availability of ultra-micropores [6,7,9,12].
The CO2 adsorption capacities at low pressure (14 kPa) reported in Table 4 for the activated biochars can be considered as more than acceptable considering the relatively simple activation process (without the use of corrosive and/or costly reagents). At the more realistic temperature of 50 °C, the CO2 uptakes at equilibrium (0.60–0.74 mmol g−1) were within the range of those reported in previous studies for physically activated carbons derived from olive stones and almond shells [13], as well as for KOH-activated lignin-derived hydrochars [11].
Besides the CO2 uptakes measured for the activated biochars, Table 4 also lists their apparent selectivities at 25 and 50 °C, which were estimated according to Hao et al., [11]:
S a p p = q C O 2 * p N 2 q N 2 * p C O 2
In Equation (1), q* is the uptake of CO2 or N2 from the respective pure component adsorption isotherms at an absolute pressure equal to the partial pressure of each gas in a binary mixture (pCO2 = 14 kPa and pN2 = 86 kPa). This relatively simple approach, which can provide a reasonable estimate of the binary selectivity from single-component adsorption data [11], represents a good alternative to the most commonly used method, which is based on the ideal adsorption solution theory (IAST). The IAST-based method requires as inputs the fitted adsorption isotherms for a given model (e.g., Toth [11], Sips [13], and dual site Langmuir–Freundlich [23]). Limitations of such models to reproduce perfectly the pure component equilibrium data, in addition to possible deviations from ideality in the adsorbed phase, can result in unrealistic estimates of selectivity [13]. In fact, Hao et al., [11] found that the IAST-predicted selectivities were notably lower than the estimates calculated according to the simplified approach given in Equation (1).
The apparent CO2-over-N2 selectivities reported in Table 4 are considerably higher than those reported by Hao et al., [11] (about 14 at 50 °C). It is interesting to note that apparent selectivity decreased with higher adsorption temperature, especially for wheat straw-derived carbons. This negative temperature dependence, which was also observed in previous studies [8,11,24,25], could be related to the higher isosteric heat of adsorption and/or lower diffusion coefficient of CO2 with respect to N2.

3.3. Breakthrough Experiments under Dry Conditions

The following variables were taken as key performance indicators for the dynamic adsorption experiments: (i) the total (i.e., at saturation) specific CO2 uptake (qCO2; in mmol g−1), (ii) the percentage of total CO2 uptake at breakthrough time (which represents the percentage of used bed and provides a measure of the efficiency of the adsorbent in terms of mass transfer), (iii) the regeneration efficiency (which is defined as the ratio between the total CO2 uptake after the nth cycle and that obtained for the fresh adsorbent), and (iv) the selectivity towards CO2 over N2. Detailed information on how indicators were calculated is given in the Supplementary Materials.
Table 5 summarizes the results obtained from the dynamic adsorption experiments under dry conditions at 25 °C. The corresponding CO2 breakthrough curves are displayed in Figure S1 (Supplementary Materials). From the results listed in Table 5, it should be highlighted that the best performance was obtained for the AC_VS_600 adsorbent, which exhibited a CO2 uptake in the first cycle of 0.99 mmol g−1 (almost the same than that reported in Table 4 for static measurements at 25 °C and 14 kPa). This interesting finding could be explained by the relatively high volume of mesopores (0.027 cm3 g−1, as reported in Table 3), which can facilitate the diffusion of CO2 molecules into ultra-micropores. Moreover, the AC_WS_500 adsorbent, for which we found the highest CO2 uptake at equilibrium (1.3 mmol g−1 at 14 kPa), appears to be the worst material under dynamic conditions (just 0.90 mmol g−1 in cycle 1). This fact can also be related to the low volume of mesopores (0.011 cm3 g−1) measured for this material. Therefore, the results reported here seem to confirm the key role of mesopores to enhance adsorption kinetics.
Results shown in Table 5 (as well as breakthrough curves displayed in Figure S1) also indicate that the stability over the five adsorption/desorption cycles was dependent on the material tested. In this sense, the AC_VS_600 sample was the most stable with nearly constant percentages of used bed (76.2%–77.3%) and decent regeneration efficiencies (84.1%–89.8%). However, this fact could partly be attributed to the relatively low absolute pressure applied during regeneration for this adsorbent (21.5 kPa). In other words, the relatively poor results obtained in terms of regeneration efficiency for the rest of materials could be explained by an insufficient vacuum level during the regeneration step (absolute pressures of 31.3–31.5 kPa).
Regarding the experimental CO2-over-N2 selectivity at 25 °C, all the samples showed a very good behavior with values in the range of 44.5 to 58.6. These values, which were calculated according to Equation (A5), were considerably higher than those reported by González et al., (20–30) [13] and Shahkarami et al., (17.4–29.3) [14] from multicomponent adsorption measurements. Interestingly, the apparent CO2-over-N2 selectivities at 25 °C (see Table 4) were quite similar to those measured under dynamic conditions, with the exception of the AC_VS_600 sample. The fact that the selectivity significantly increased for this material under dynamic conditions could be explained by differences in pore size distribution. As can be deduced from the pore size distributions shown in Figure 4, the AC_VS_600 sample clearly exhibited a broader distribution, with a significant contribution in the ranges of relatively large micropores (0.8–2.0 nm) and relatively narrow mesopores (up to 15 nm). The higher availability of these pores can facilitate the adsorption of a relatively high amount of N2 under static conditions. However, under dynamic conditions, the much shorter residence time of the gas phase (around 13 s) could lead to a decreased N2 uptake, due to diffusional limitations.
On the basis of the results obtained at 25 °C, we decided to assess the performance at 50 °C of the AC_VS_600 and AC_WS_500_P materials. Table 6 summarizes the results obtained for this adsorption temperature, whereas Figure 5 shows the respective CO2 breakthrough curves. The AC_VS_600 adsorbent exhibited a very good performance, especially in terms of CO2 uptake (with values very close to that deduced from the adsorption isotherm) and stability over the adsorption/desorption cycles (see Figure 5a). The relatively low CO2 adsorption capacity measured for the first cycle (0.54 mmol g−1) and related regeneration efficiencies (higher than 100%) could be explained by slight differences in experimental conditions, especially the CO2 partial pressure in the feeding gas stream, which was slightly lower than the average value used for the rest of cycles (15.2 kPa vs. 15.9 kPa). Regarding the performance of the AC_WS_500_P sample, a considerably decrease in the CO2 uptake (18.2%) was observed after five cycles. As expected, the regeneration efficiency for the fifth cycle increased at 50 °C compared with that at 25 °C (81.6% and 69.6%, respectively). However, the pressure applied during desorption (24.9 ± 0.7 kPa) was still too low to ensure the complete regeneration of the AC_WS_500_P adsorbent, which showed a considerably lower mesopore volume compared to that of the AC_VS_600 material.

3.4. Breakthrough Experiments under Humid Conditions

The summarized results given in Table 7 reveal some interesting findings with regard to the performance of the two tested materials. For the AC_VS_600 adsorbent, the total specific CO2 uptake was found to be quite close to that obtained under dry conditions (in spite of the lower CO2 partial pressure in the wet feeding gas), whereas a higher drop in this performance indicator was observed for the AC_WS_500_P adsorbent. However, a certain degree of variability in qCO2 among the 10 cycles was observed for both materials. This variability, which was also evident from the CO2 breakthrough curves shown in Figure 6, could be explained by the extremely slower kinetics of water vapor adsorption on biomass-derived porous carbons in comparison with that of CO2 [17].
As already pointed out by Dasgupta et al., [26], the amount of water adsorbed during the first cycles could progressively increase, leading to a gradual decrease in the adsorption sites available for CO2. This was especially evident during the two first cycles for both tested adsorbents, as reported in Table 7. Nevertheless, after a few number of cycles, the CO2 uptake seemed to stabilize (for the AC_WS_500_P adsorbent) or even increase up to a closer value to that obtained for the first cycle (for the AC_VS_600 adsorbent). These differences observed in the performance of the two adsorbents could also be related to the effectiveness of the desorption step as well as the transient period to reach water equilibrium. In the case of the AC_VS_600 material, its more hierarchical pore size distribution could facilitate a relatively fast desorption of CO2 at 50 °C and mild vacuum conditions, despite the fact that a certain volume of micro- and mesopores could be filled by water. The fact that the CO2 uptake fluctuated over the ten cycles could also indicate that further cycles are required to saturate the bed with water. For the AC_WS_500_P adsorbent, however, the observed lower CO2 uptake could be due to a higher impact of the water adsorption on its surface, which could result in a critical reduction in the volume of mesopores and wide micropores available for CO2 diffusion during the desorption step. Nonetheless, the almost steady CO2 adsorption capacity observed for the last cycles also indicated that the relatively short residence time used here during the adsorption steps was appropriate to avoid a gradual accumulation of water within the bed.
With regard to the CO2-over-N2 selectivity under humid conditions, similar (for AC_WS_500_P) or slightly higher (for AC_VS_600) values than those measured under dry conditions are reported in Table 7. A little impact of water vapor on the CO2 purity was also observed by Xu et al., [16] for a coconut shell-derived activated carbon using a wet flue gas containing 4.6 vol. % H2O. In a more recent study, focused on simulating a VSA process using activated carbon, You and Liu [27] also reported that the CO2 purity was almost constant regardless of the relative humidity.
Although the promising results discussed above, the most negative impact of moisture was on the percentages of used bed, which were significantly lower than those measured under dry conditions, especially for the AC_VS_600 adsorbent (only 28.7% in average, as reported in Table 7). This loss of efficiency could be attributed to the fact that the presence of adsorbed water might substantially reduce the diffusion rate of CO2 into ultra-micropores during the adsorption step. Better efficiencies were obtained for the AC_WS_500_P adsorbent, showing an average percentage of used bed of 42.8%. This finding suggests that the rate of water adsorption on this material could be lower and a relatively high number of adsorption sites could be available for CO2 during the initial stage of the adsorption process.
As stated by Liu et al., in an excellent review [28], water adsorption on carbonaceous materials is a really complex process, which can be affected by the pore size distribution and the pore connectivity as well as the type of functional groups and their location and distribution on the surface. According to the mechanism firstly suggested by Pierce and Smith [29], water adsorption on activated carbon first takes place at the polar and oxygen-containing functional groups (OFGs) on the surface. Then, the water molecules can form clusters, which can grow and coalesce to fill the pores, in a greater or lower extent depending on the pore structure. Several previous studies revealed that the carboxyl group possessed the highest affinity to water molecules [30,31,32], due to both the accessibility of the carboxylic group to water molecules and the ability of this functional group to form hydrogen bonds. Bearing this in mind, one can hypothesize that differences in the concentration and accessibility of hydrophilic OFGs would explain the differences observed between the two adsorbents with respect to the water adsorption rate at the initial stage of the adsorption process. In this sense, advanced characterization studies (by using, e.g., in-situ NMR measurements) would be required in further studies to provide valuable insights into the interactions between water and OFGs at very low loadings.
In addition to the higher mass transfer efficiency observed for the AC_WS_500_P adsorbent, the fact that this material has a bulk density considerably higher than that of the AC_VS_600 adsorbent (368 vs. 200 kg m−3, respectively) makes it more suitable for industrial-scale applications (i.e., reduced size of adsorption vessels).

4. Conclusions

From the results discussed above, we can conclude that, in general, physically activated biochars produced from both wheat straw and vine shoots are promising adsorbents for CO2 capture under realistic postcombustion conditions. As expected, pore size distribution plays a key role in the CO2 adsorption behavior. In this sense, biomass-derived activated carbons having a hierarchical structure (with a high volume of ultra-micropores but also a certain volume of mesopores) appear as the ideal candidates for an efficient and selective CO2 adsorption from a dry flue gas under dynamic conditions. However, the presence of relatively high concentrations of water vapor in the feeding gas clearly interferes with the CO2 adsorption mechanism, leading to significantly shorter breakthrough times (i.e., lower percentages of used bed). The differences observed here in the performance under humid conditions of two activated carbons (produced from different biochar precursors) suggest that surface chemistry, and especially the concentration and accessibility of hydrophilic OFGs, could exert considerable influence on the water adsorption rate. Therefore, future research should focus on synthetizing biomass-derived activated carbons with an appropriate hierarchical pore size distribution, relatively high bulk density, and low affinity to water molecules. For this purpose, the combined effects of the nature of the precursor, pyrolysis conditions, activation conditions, and degree of burn-off should properly be addressed.

Supplementary Materials

The following are available online at https://0-www-mdpi-com.brum.beds.ac.uk/2076-3417/10/1/376/s1. Figure S1: CO2 breakthrough curves for five consecutive cycles (adsorption temperature = 25 °C) from a dry binary mixture of N2 and CO2 (with a CO2 composition of 13.75–14.25 vol. %).

Author Contributions

Conceptualization, J.J.M.; methodology, D.G.-M., B.G. and J.J.M.; software, D.G.-M. and J.J.M.; validation and formal analysis, D.G.-M., B.G. and J.J.M.; writing—original draft preparation, J.J.M.; project administration, B.G.; funding acquisition, J.J.M. All authors have read and agreed to the published version of the manuscript.

Funding

This research received funding from the Spanish Ministry of Science, Innovation, and Universities (ERANET-MED Project MEDWASTE, ref. PCIN-2017-048).

Acknowledgments

The authors also acknowledge the funding from the Aragón Government (Ref. T22_17R), co-funded by FEDER 2014-2020 “Construyendo Europa desde Aragón”.

Conflicts of Interest

The authors declare no conflict of interest.

References

  1. Creamer, A.E.; Gao, B. Carbon-Based Adsorbents for Postcombustion CO2 Capture: A Critical Review. Environ. Sci. Technol. 2016, 50, 7276–7289. [Google Scholar] [CrossRef]
  2. Chen, J.; Yang, J.; Hu, G.; Hu, X.; Li, Z.; Shen, S.; Radosz, M.; Fan, M. Enhanced CO2 Capture Capacity of Nitrogen-Doped Biomass-Derived Porous Carbons. ACS Sustain. Chem. Eng. 2016, 4, 1439–1445. [Google Scholar] [CrossRef]
  3. Yang, J.; Yue, L.; Hu, X.; Wang, L.; Zhao, Y.; Lin, Y.; Sun, Y.; DaCosta, H.; Guo, L. Efficient CO2 Capture by Porous Carbons Derived from Coconut Shell. Energy Fuels 2017, 31, 4287–4293. [Google Scholar] [CrossRef]
  4. Coromina, H.M.; Walsh, D.A.; Mokaya, R. Biomass-derived activated carbon with simultaneously enhanced CO2 uptake for both pre and post combustion capture applications. J. Mater. Chem. A 2016, 4, 280–289. [Google Scholar] [CrossRef]
  5. Li, D.; Ma, T.; Zhang, R.; Tian, Y.; Qiao, Y. Preparation of porous carbons with high low-pressure CO2 uptake by KOH activation of rice husk char. Fuel 2015, 139, 68–70. [Google Scholar] [CrossRef]
  6. Deng, S.; Wei, H.; Chen, T.; Wang, B.; Huang, J.; Yu, G. Superior CO2 adsorption on pine nut shell-derived activated carbons and the effective micropores at different temperatures. Chem. Eng. J. 2014, 253, 46–54. [Google Scholar] [CrossRef]
  7. Hao, W.; Björkman, E.; Lilliestråle, M.; Hedin, N. Activated carbons prepared from hydrothermally carbonized waste biomass used as adsorbents for CO2. Appl. Energy 2013, 112, 526–532. [Google Scholar] [CrossRef]
  8. Plaza, M.G.; González, A.S.; Pis, J.J.; Rubiera, F.; Pevida, C. Production of microporous biochars by single-step oxidation: Effect of activation conditions on CO2 capture. Appl. Energy 2014, 114, 551–562. [Google Scholar] [CrossRef] [Green Version]
  9. Manyà, J.J.; González, B.; Azuara, M.; Arner, G. Ultra-microporous adsorbents prepared from vine shoots-derived biochar with high CO2 uptake and CO2/N2 selectivity. Chem. Eng. J. 2018, 345, 631–639. [Google Scholar] [CrossRef] [Green Version]
  10. Yue, L.; Xia, Q.; Wang, L.L.; Wang, L.L.; DaCosta, H.; Yang, J.; Hu, X. CO2 adsorption at nitrogen-doped carbons prepared by K2CO3 activation of urea-modified coconut shell. J. Colloid Interface Sci. 2018, 511, 259–267. [Google Scholar] [CrossRef]
  11. Hao, W.; Björnerbäck, F.; Trushkina, Y.; Oregui Bengoechea, M.; Salazar-Alvarez, G.; Barth, T.; Hedin, N. High-Performance Magnetic Activated Carbon from Solid Waste from Lignin Conversion Processes. 1. Their Use as Adsorbents for CO2. ACS Sustain. Chem. Eng. 2017, 5, 3087–3095. [Google Scholar] [CrossRef]
  12. Sevilla, M.; Falco, C.; Titirici, M.M.; Fuertes, A.B. High-performance CO2 sorbents from algae. RSC Adv. 2012, 2, 12792–12797. [Google Scholar] [CrossRef] [Green Version]
  13. González, A.S.; Plaza, M.G.; Rubiera, F.; Pevida, C. Sustainable biomass-based carbon adsorbents for post-combustion CO2 capture. Chem. Eng. J. 2013, 230, 456–465. [Google Scholar] [CrossRef] [Green Version]
  14. Shahkarami, S.; Dalai, A.K.; Soltan, J.; Hu, Y.; Wang, D. Selective CO2 Capture by Activated Carbons: Evaluation of the Effects of Precursors and Pyrolysis Process. Energy Fuels 2015, 29, 7433–7440. [Google Scholar] [CrossRef]
  15. Shafeeyan, M.S.; Daud, W.M.A.W.; Shamiri, A.; Aghamohammadi, N. Modeling of Carbon Dioxide Adsorption onto Ammonia-Modified Activated Carbon: Kinetic Analysis and Breakthrough Behavior. Energy Fuels 2015, 29, 6565–6577. [Google Scholar] [CrossRef]
  16. Xu, D.; Xiao, P.; Zhang, J.; Li, G.; Xiao, G.; Webley, P.A.; Zhai, Y. Effects of water vapour on CO2 capture with vacuum swing adsorption using activated carbon. Chem. Eng. J. 2013, 230, 64–72. [Google Scholar] [CrossRef]
  17. Durán, I.; Álvarez-Gutiérrez, N.; Rubiera, F.; Pevida, C. Biogas purification by means of adsorption on pine sawdust-based activated carbon: Impact of water vapor. Chem. Eng. J. 2018, 353, 197–207. [Google Scholar] [CrossRef]
  18. Manyà, J.J.; Azuara, M.; Manso, J.A. Biochar production through slow pyrolysis of different biomass materials: Seeking the best operating conditions. Biomass Bioenergy 2018, 117, 115–123. [Google Scholar] [CrossRef] [Green Version]
  19. Greco, G.; Videgain, M.; Di Stasi, C.; González, B.; Manyà, J.J. Evolution of the mass-loss rate during atmospheric and pressurized slow pyrolysis of wheat straw in a bench-scale reactor. J. Anal. Appl. Pyrolysis 2018, 136, 18–26. [Google Scholar] [CrossRef] [Green Version]
  20. Yin, G.; Liu, Z.; Liu, Q.; Wu, W. The role of different properties of activated carbon in CO2 adsorption. Chem. Eng. J. 2013, 230, 133–140. [Google Scholar] [CrossRef]
  21. Plaza, M.G.; Pevida, C.; Arias, B.; Fermoso, J.; Casal, M.D.; Martín, C.F.; Rubiera, F.; Pis, J.J. Development of low-cost biomass-based adsorbents for postcombustion CO2 capture. Fuel 2009, 88, 2442–2447. [Google Scholar] [CrossRef] [Green Version]
  22. Ahmad, F.; Daud, W.M.A.W.; Ahmad, M.A.; Radzi, R.; Azmi, A.A. The effects of CO2 activation, on porosity and surface functional groups of cocoa (Theobroma cacao)—Shell based activated carbon. J. Environ. Chem. Eng. 2013, 1, 378–388. [Google Scholar] [CrossRef]
  23. Chen, Y.; Lv, D.; Wu, J.; Xiao, J.; Xi, H.; Xia, Q.; Li, Z. A new MOF-505@GO composite with high selectivity for CO2/CH4 and CO2/N2 separation. Chem. Eng. J. 2017, 308, 1065–1072. [Google Scholar] [CrossRef]
  24. Yang, J.; Zhang, P.; Zhang, Y.; Zeng, Z.; Liu, L.; Deng, S.; Wang, J. Controllable synthesis of bifunctional porous carbon for efficient gas-mixture separation and high-performance supercapacitor. Chem. Eng. J. 2018, 348, 57–66. [Google Scholar]
  25. Yu, H.; Zhu, W.; Wang, X.; Krishna, R.; Chen, D.-L.; Xu, C. Utilizing transient breakthroughs for evaluating the potential of Kureha carbon for CO2 capture. Chem. Eng. J. 2015, 269, 135–147. [Google Scholar] [CrossRef]
  26. Dasgupta, S.; Divekar, S.; Aarti; Spjelkavik, A.I.; Didriksen, T.; Nanoti, A.; Blom, R. Adsorption properties and performance of CPO-27-Ni/alginate spheres during multicycle pressure-vacuum-swing adsorption (PVSA) CO2 capture in the presence of moisture. Chem. Eng. Sci. 2015, 137, 525–531. [Google Scholar] [CrossRef]
  27. You, Y.Y.; Liu, X.J. Modeling of CO2 adsorption and recovery from wet flue gas by using activated carbon. Chem. Eng. J. 2019, 369, 672–685. [Google Scholar] [CrossRef]
  28. Liu, L.; Tan, S.J.; Horikawa, T.; Do, D.D.; Nicholson, D.; Liu, J. Water adsorption on carbon—A review. Adv. Colloid Interface Sci. 2017, 250, 64–78. [Google Scholar] [CrossRef]
  29. Pierce, C.; Smith, R.N. Adsorption—Desorption Hysteresis in Relation to Capillarity of Adsorbents. J. Phys. Colloid Chem. 1950, 54, 784–794. [Google Scholar] [CrossRef]
  30. Fletcher, A.J.; Uygur, Y.; Mark Thomas, K. Role of surface functional groups in the adsorption kinetics of water vapor on microporous activated carbons. J. Phys. Chem. C 2007, 111, 8349–8359. [Google Scholar] [CrossRef] [Green Version]
  31. Xiao, J.; Liu, Z.; Kim, K.; Chen, Y.; Yan, J.; Li, Z.; Wang, W. S/O-functionalities on modified carbon materials governing adsorption of water vapor. J. Phys. Chem. C 2013, 117, 23057–23065. [Google Scholar] [CrossRef]
  32. Nguyen, V.T.; Horikawa, T.; Do, D.D.; Nicholson, D. Water as a potential molecular probe for functional groups on carbon surfaces. Carbon 2014, 67, 72–78. [Google Scholar] [CrossRef] [Green Version]
Figure 1. Schematic diagram of the packed-bed setup used for dynamic breakthrough tests.
Applsci 10 00376 g001
Figure 2. Adsorption isotherms of N2 at –196 °C (a) and CO2 at 0 °C (b) on the activated biochars (see Table 1 for sample designation).
Applsci 10 00376 g002aApplsci 10 00376 g002b
Figure 3. Adsorption isotherms of CO2 and N2 on the activated biochars at 25 and 50 °C: AC_VS_600 (a), AC_VS_600_P (b), AC_WS_500 (c), and AC_WS_500_P (d).Black filled squares: CO2 at 25 °C; black open circles: CO2 at 50 °C; red filled squares: N2 at 25 °C; red open circles: N2 at 50 °C.
Applsci 10 00376 g003
Figure 4. Pore size distribution of the adsorbents: (a) narrow micropores (deduced from the CO2 adsorption isotherms at 0 °C), and (b) pores widths ranging from 1.0 to 15 nm (deduced from the N2 adsorption isotherms at −196 °C).
Applsci 10 00376 g004
Figure 5. CO2 breakthrough curves for five consecutive cycles (adsorption temperature = 50 °C) from a dry binary mixture of N2 and CO2 (with a CO2 composition of 13.75–14.25 vol. %) using the AC_VS_600 (a) and AC_WS_500_P (b) materials.
Applsci 10 00376 g005
Figure 6. CO2 breakthrough curves for ten consecutive cycles (adsorption temperature = 50 °C) from a wet mixture of N2 and CO2 (with a CO2 composition of 13.75–14.25 vol. %; relative humidity (RH) = 100%) using the AC_VS_600 (a) and AC_WS_500_P (b) materials.
Applsci 10 00376 g006
Table 1. Summary of the preparation procedure for the physically activated carbons (ACs) tested in the present study.
Activated CarbonBiomass SourcePyrolysis ConditionsActivation Conditions
AC_VS_600Vine shootsHTT = 600 °C; p = 101 kPaWith CO2 at 800 °C and atmospheric pressure; 1 h holding time
AC_VS_600_PVine shootsHTT = 600 °C; p = 500 kPa
AC_WS_500Wheat strawHTT = 500 °C; p = 101 kPa
AC_WS_500_PWheat strawHTT = 500 °C; p = 500 kPa
Table 2. Proximate and ultimate analyses of biomass sources (vine shoots (VS) and wheat straw pellets (WS)) and activated biochars.
Sample
VSWSAC_VS_600AC_VS_600_PAC_WS_500AC_WS_500_P
Proximate (wt. %)
Ash4.434.239.0013.915.616.5
Moisture7.487.600.740.203.213.11
Volatile matter75.774.813.210.212.912.2
Fixed carbon12.413.477.175.568.368.2
Ultimate (wt.%, daf basis)
C47.144.288.889.786.586.9
H5.296.311.651.612.262.18
N0.660.623.213.252.983.03
O 147.048.96.335.448.267.89
1 Calculated by difference.
Table 3. Main textural properties and degrees of burn-off of activated biochars.
Activated BiocharApparent Specific Surface Area (m2 g−1)Specific Pore Volume (cm3 g−1)Degree of Burn-Off (%) 2
SBET3SBET 4VmicVmesVultra
AC_VS_6004053710.1470.0270.09622.4 ± 1.9
AC_VS_600_P5364160.1610.0140.09426.2 ± 2.6
AC_WS_5004594030.1720.0110.14119.5 ± 1.1
AC_WS_500_P5144160.1910.0160.09428.9 ± 2.3
2 Determined as the percentage of mass loss during the activation process of a given biochar, which was previously heated up to 800 °C under pure N2 atmosphere. Standard deviation is also reported, since several activation runs were conducted to produce the required amount of activated biochar. 3 Determined from N2 adsorption data at −196 °C. 4 Determined from CO2 adsorption data at 0 °C.
Table 4. CO2 adsorption capacities and apparent selectivities (deduced from single-component adsorption isotherms) for the activated biochars at 25 and 50 °C.
Activated BiocharCO2 Uptake at 14 kPa (mmol g−1)CO2 Uptake at 101.3 kPa (mmol g−1)Apparent Selectivity CO2/N2 5
25 °C50 °C25 °C50 °C25 °C50 °C
AC_VS_6001.020.5982.351.6528.225.7
AC_VS_600_P1.160.6952.671.9050.046.5
AC_WS_5001.300.7382.631.9143.428.9
AC_WS_500_P1.000.6272.441.7845.628.6
5 Calculated from Equation (1).
Table 5. Summary of results from the breakthrough experiments (dry conditions) conducted at 25 °C.
Activated Biochar
AC_VS_600AC_VS_600_PAC_WS_500AC_WS_500_P
Mass of adsorbent (g)15.116.826.927.8
Absolute pressure in adsorption steps (kPa)111.8 ± 0.5111.9 ± 0.7111.4 ± 0.1111.5 ± 0.2
Absolute pressure in desorption steps (kPa)21.5 ± 0.131.3 ± 0.131.3 ± 0.131.1 ± 0.1
qCO2 (mmol g−1)cycle 10.9920.9360.8950.959
cycle 20.8910.7990.7630.869
cycle 30.8600.7310.7060.764
cycle 40.8520.6960.6760.727
cycle 50.8340.6820.6160.667
Percentage of total CO2 uptake at breakthrough timecycle 176.380.777.980.9
cycle 276.777.571.078.8
cycle 377.375.468.277.7
cycle 476.676.365.874.8
cycle 576.273.764.774.7
Regeneration efficiency (%)cycle 1
cycle 289.885.485.290.6
cycle 386.778.178.979.7
cycle 485.974.475.575.8
cycle 584.172.968.869.6
Selectivity CO2/N2cycle 156.758.649.448.6
cycle 249.251.951.946.6
cycle 344.949.445.245.9
cycle 446.548.548.244.5
cycle 546.650.844.245.7
Table 6. Summary of results from the breakthrough experiments (dry conditions) conducted at 50 °C.
Activated Biochar
AC_VS_600AC_WS_500_P
Mass of adsorbent (g)15.127.8
Absolute pressure in adsorption steps (kPa)113.6 ± 0.6113.3 ± 1.4
Absolute pressure in desorption steps (kPa)23.5 ± 0.524.9 ± 0.7
qCO2 (mmol g−1)cycle 10.5430.624
cycle 20.5700.583
cycle 30.5650.555
cycle 40.5730.550
cycle 50.5710.511
Percentage of total CO2 uptake at breakthrough timecycle 175.368.0
cycle 273.171.5
cycle 373.271.4
cycle 473.469.0
cycle 576.569.7
Regeneration efficiency (%)cycle 1
cycle 2105.093.3
cycle 3104.288.9
cycle 4105.688.2
cycle 5105.381.8
Selectivity CO2/N2cycle 140.838.2
cycle 239.143.1
cycle 337.443.2
cycle 434.635.0
cycle 538.738.3
Table 7. Summary of results from the breakthrough experiments (humid conditions) conducted at 50 °C.
Activated Carbon
AC_VS_600AC_WS_500_P
Mass of adsorbent (g)15.127.8
Absolute pressure in adsorption steps (kPa)118.8 ± 1.5120.0 ± 0.9
Absolute pressure in desorption steps (kPa)34.6 ± 3.036.9 ± 3.5
qCO2 (mmol g−1)cycle 10.5420.486
cycle 20.4470.393
cycle 30.4350.412
cycle 40.4870.391
cycle 50.5260.390
cycle 60.5260.385
cycle 70.5280.376
cycle 80.4980.363
cycle 90.4740.359
cycle 100.5330.371
Percentage of total CO2 uptake at breakthrough time (excluding first cycle)28.7 ± 1.642.8 ± 3.5
Regeneration efficiency (%)cycle 1
cycle 282.580.9
cycle 380.284.8
cycle 489.880.4
cycle 597.080.2
cycle 697.079.2
cycle 797.477.4
cycle 891.974.7
cycle 987.473.9
cycle 1098.376.3
Selectivity CO2/N2 (excluding first cycle)54.0 ± 4.140.9 ± 2.7

