1. Introduction
The recent Grenfell fire and Hackitt’s [
1] report on the use of safety cases in fire safety engineering have generated renewed interest in probabilistic methods for fire risk assessment [
2,
3,
4]. Recent work in probabilistic risk assessment (PRA) includes Van Coile et al. [
2] which provides an explicit definition of the acceptable level of safety and the relationship between various risk acceptance concepts in PRAs. The Australian Building Codes Board (ABCB) has proposed some benchmarks for individual and societal risk levels [
5]. The recent publication of BS7974-7:2019 [
6] focuses on the ‘as low as reasonably practicable’ (ALARP) principle, an explicit framework for PRA, and cost-benefit analysis (CBA) in fire safety engineering [
2,
3]. The ALARP principle recognizes that beyond a certain point, risk reduction may be too costly to implement. The monetary valuation of human life is assessed by adopting a parameter called ‘societal willingness to pay’ (SWTP) for one statistical life, based on the life quality index (LQI) approach [
7]. In this approach, the risk to death is reduced in exchange for the increased monetary amount that society is willing to pay. In other words, until the SWTP is achieved there is an additional capacity for society to invest to reduce unnecessary loss of life. Gross domestic product (GDP) and life expectancy are typical variables used to indicate the health of a society where resources allotted for safety purposes get translated into an increasingly healthier life. Straalen and Meacham [
8] propose a framework for the fire safety goal life safety, which links a quantified risk criterion for life safety with a series of well-defined fire safety criteria for the operative requirements for ignition of fire, fire development, evacuation, and strength of structures. These fire safety criteria can be related to generally applied fire safety solutions.
To implement PRA in buildings, Sabapathy et al. [
9] provide a systematic approach through a case study of a six-storey commercial building based on comparative expected risk-to-life (ERL) methodology. Weyenberge et al. [
10] developed an integrated quantitative risk assessment framework based on response surface modelling. There have been various other comprehensive risk models which were listed in [
11,
12]. All are focused on the quantification of technical risk factors without considering human factors. Oldham et al. [
13] proposed a framework for prioritization of safety risk where rankings of risks are based on societal risk and weightings. They suggest the introduction of human factors into the analysis, with systematic follow-up.
Human and organizational factors (HOFs) are important variables in assessing fire risk and the literature suggests that human and organizational errors (HOEs) should be considered in PRA and are likely relevant to high-rise residential buildings [
14]. Tan and Moinuddin [
14] define HOEs as “the collective departures from acceptable or desirable practice by an individual or groups of individuals that may result in unacceptable or undesirable outcomes.” In other high-risk sectors, personnel conditions in terms of training, and safety culture are usually implemented in PRA to ensure an adequate level of safety. HOEs related to fire safety in high-rise buildings include risk factors such as lack of regular drills or not following safety procedures, and poor safety culture. Gwynne et al. [
15] assert that given the impact of executing regular fire drills on timely fire response, it becomes important to accurately estimate the value of probability towards performing or not performing fire drills. As much as 80% of accidents are caused by human and organizational errors [
14,
16] and our recent study of high-rise buildings found that in general, fire safety designs that do not consider HOEs underestimate overall risk by approximately 20% [
17].
Fire safety protection in high-rise buildings consists of both active and passive systems that can be affected by HOEs. Automatic fire suppression and detection systems such as sprinklers, alarms, detectors, and smoke control systems are considered active systems while passive systems are designed to slow the spread or contain fires [
18]. Reliability of passive systems is generally considered to be higher than active systems while active systems, such as sprinklers are considered highly efficient [
19]. This perception of a difference in reliability may be related to a requirement that active systems require either automatic or manual intervention to initiate activation in a fire event [
20]. In [
19] the highest percentage of incidents of failure of sprinklers to activate was that the water supply was disabled or inadequate. Other causes were insufficient maintenance, damaged components, and antiquated systems or components. Indeed, there is evidence that both active and passive systems in a variety of fire systems may be affected by HOEs, including safety culture and maintenance activities, as well as the passage of time [
14].
Meacham and Straalen [
21] developed a Socio-Technical System (STS) framework of risk assessment based on both technical and human errors was developed. To show the importance of the link between safety practices and safety culture on risk assessments, Pence et al. [
22] developed the socio-technical risk analysis (SoTeRiA) framework and used it to identify critical human factors in a nuclear power plant. Mohaghegh et al. [
23] developed a framework using multiple levels of analysis to bridge the gap between safety culture and safety climate and comprehensively included human errors. The scope of this study was extended by Mohaghegh et al. [
24] to operationalize multi-dimensional measurements using a Bayesian approach. Mohaghegh et al. [
24] used the Bayesian Belief Network (BBN) technique to deal with human and organizational factors to develop a socio-technical predictive model. Further, SD was included in the model to predict risk as a function of time [
25]. The approach by Lin [
26] focuses on paired comparison quantification to differentiate and prioritize a set of management influences to reduce human or technical failure, and to quantify the size of different management influences on risk by combining it with BBN. The difference between BBN and paired comparison is that management interventions are independent of each other in the paired comparison. A third-generation hybrid algorithm that enhances both the qualitative and the quantitative basis of HRA, adding significant scientific depth and technical traceability to the highly complicated problem of modelling human–machine team failures in complex engineering systems is proposed by Groth et al. [
27]. The main elements of the hybrid algorithm include a comprehensive set of causal factors, human–machine team tasks and events, Bayesian Network causal models, and Bayesian parameter updating methods.
Another methodology for the incorporation of risks related to human factors include human risk assessment (HRA) methods. In the first generation HRA methods, a human operator was considered a component of the system, but decision-making processes and motivation were not considered. In the next generation, HRA methods considered cognitive effects into the reliability analysis. It identified technical, human, and organizational factors for risk analysis but lacked transparency and traceability. A systematic study of HRA was made by Lyons et al. [
28] wherein the methodology involved data collection, task description and simulation, human error identification, and finally quantification of human errors. The mismatch between humans and their tasks were identified through performance shaping factors (PSFs). Using this mismatch, human error probability is calculated which then becomes part of risk assessment. Such HRA techniques are generally time-independent models and do not consider human factors in an integrated way. Groth et al. [
29] proposed the use of Bayesian methods to formally incorporate simulator data into the estimation of human error probabilities (HEPs) in existing HRA methods. The approach enables even limited amounts of simulator data to be used to enhance the technical basis of existing and future HRA methods. An automated approach to risk estimation is made in [
30] where the semantic and spatiotemporal representation of knowledge of the urban area relies on a software system including a knowledge base; two components for quantitative and qualitative risk assessments, respectively; and a WebGIS interface. The knowledge base consists of the TERMINUS domain ontology, to represent urban knowledge, and of a geo-referenced database, including geographical, environmental, and urban data as well as temporal data related to the levels of operation of city services.
The literature review suggests that it is necessary to adopt both technical and human- organizational errors for realistic risk assessment of building design from a practical viewpoint. Furthermore, during the operational phase of the building, it is not reasonable to assume that the reliability of the fire equipment remains constant and its aging over time will need to be considered to derive a more realistic risk assessment value. To address the literature gaps and follow the suggestions made by researchers in their studies, we employ a technical-human-organizational risk (T-H-O-Risk) methodology in this article to assess and compare HOE risks due to fires in high-rise residential buildings. The T-H-O-Risk methodology is a novel, inclusive approach that overcomes the aforementioned difficulties and therefore provides a more realistic estimate of risk that covers multiple dimensions. Hollnagel’s [
31] Cognitive Reliability and Error Analysis Method (CREAM) deals with human errors, attempting to quantify human reliability and their impact on technical variables. The approach provides a good integration of human reliability into a probabilistic risk assessment through a cognitive reliability model. The CREAM approach is a bi-directional method, applicable both for predictions and for retrospective analysis (looking for the causes of an accident). This recursive method takes into consideration the context in which human actions take place and considers performance as the result of two different aspects: competence and control.
This paper focuses on active fire safety systems in high-rise residential buildings by comparing the impact of HOEs on individual fire safety systems and/or combinations of active systems. This study breaks down the impact of HOEs on sprinklers, building occupant warning systems (BOWS), smoke detectors, and smoke control systems. The building risk levels are compared to each other and against the absolute benchmark criteria to determine if they exceed the acceptable risk threshold. The ERL for each building design has different human and organizational scenarios based on either no HOEs or with HOEs-where organizational standards such as maintenance, safety culture, and emergency planning are determined to be low and human errors occur routinely.
2. Methodology
In our proposed T-H-O-Risk methodology [
17], the ERL of an alternative solution can be compared to a deemed to satisfy (DtS) solution within the framework of F-N curve to determine the acceptability of the design. When designing a building, both performance solutions and DtS solutions can be used to achieve compliance with performance requirements. This approach allows for testing of the interrelationship between different sub-systems and removal of unnecessary subsystems. The risk approach enables the quantification of different fire safety systems in an F-N curve assessment. The methodology of T-H-O-Risk described in [
12,
17] is further improved in this paper with the inclusion of ALARP principle [
2,
3,
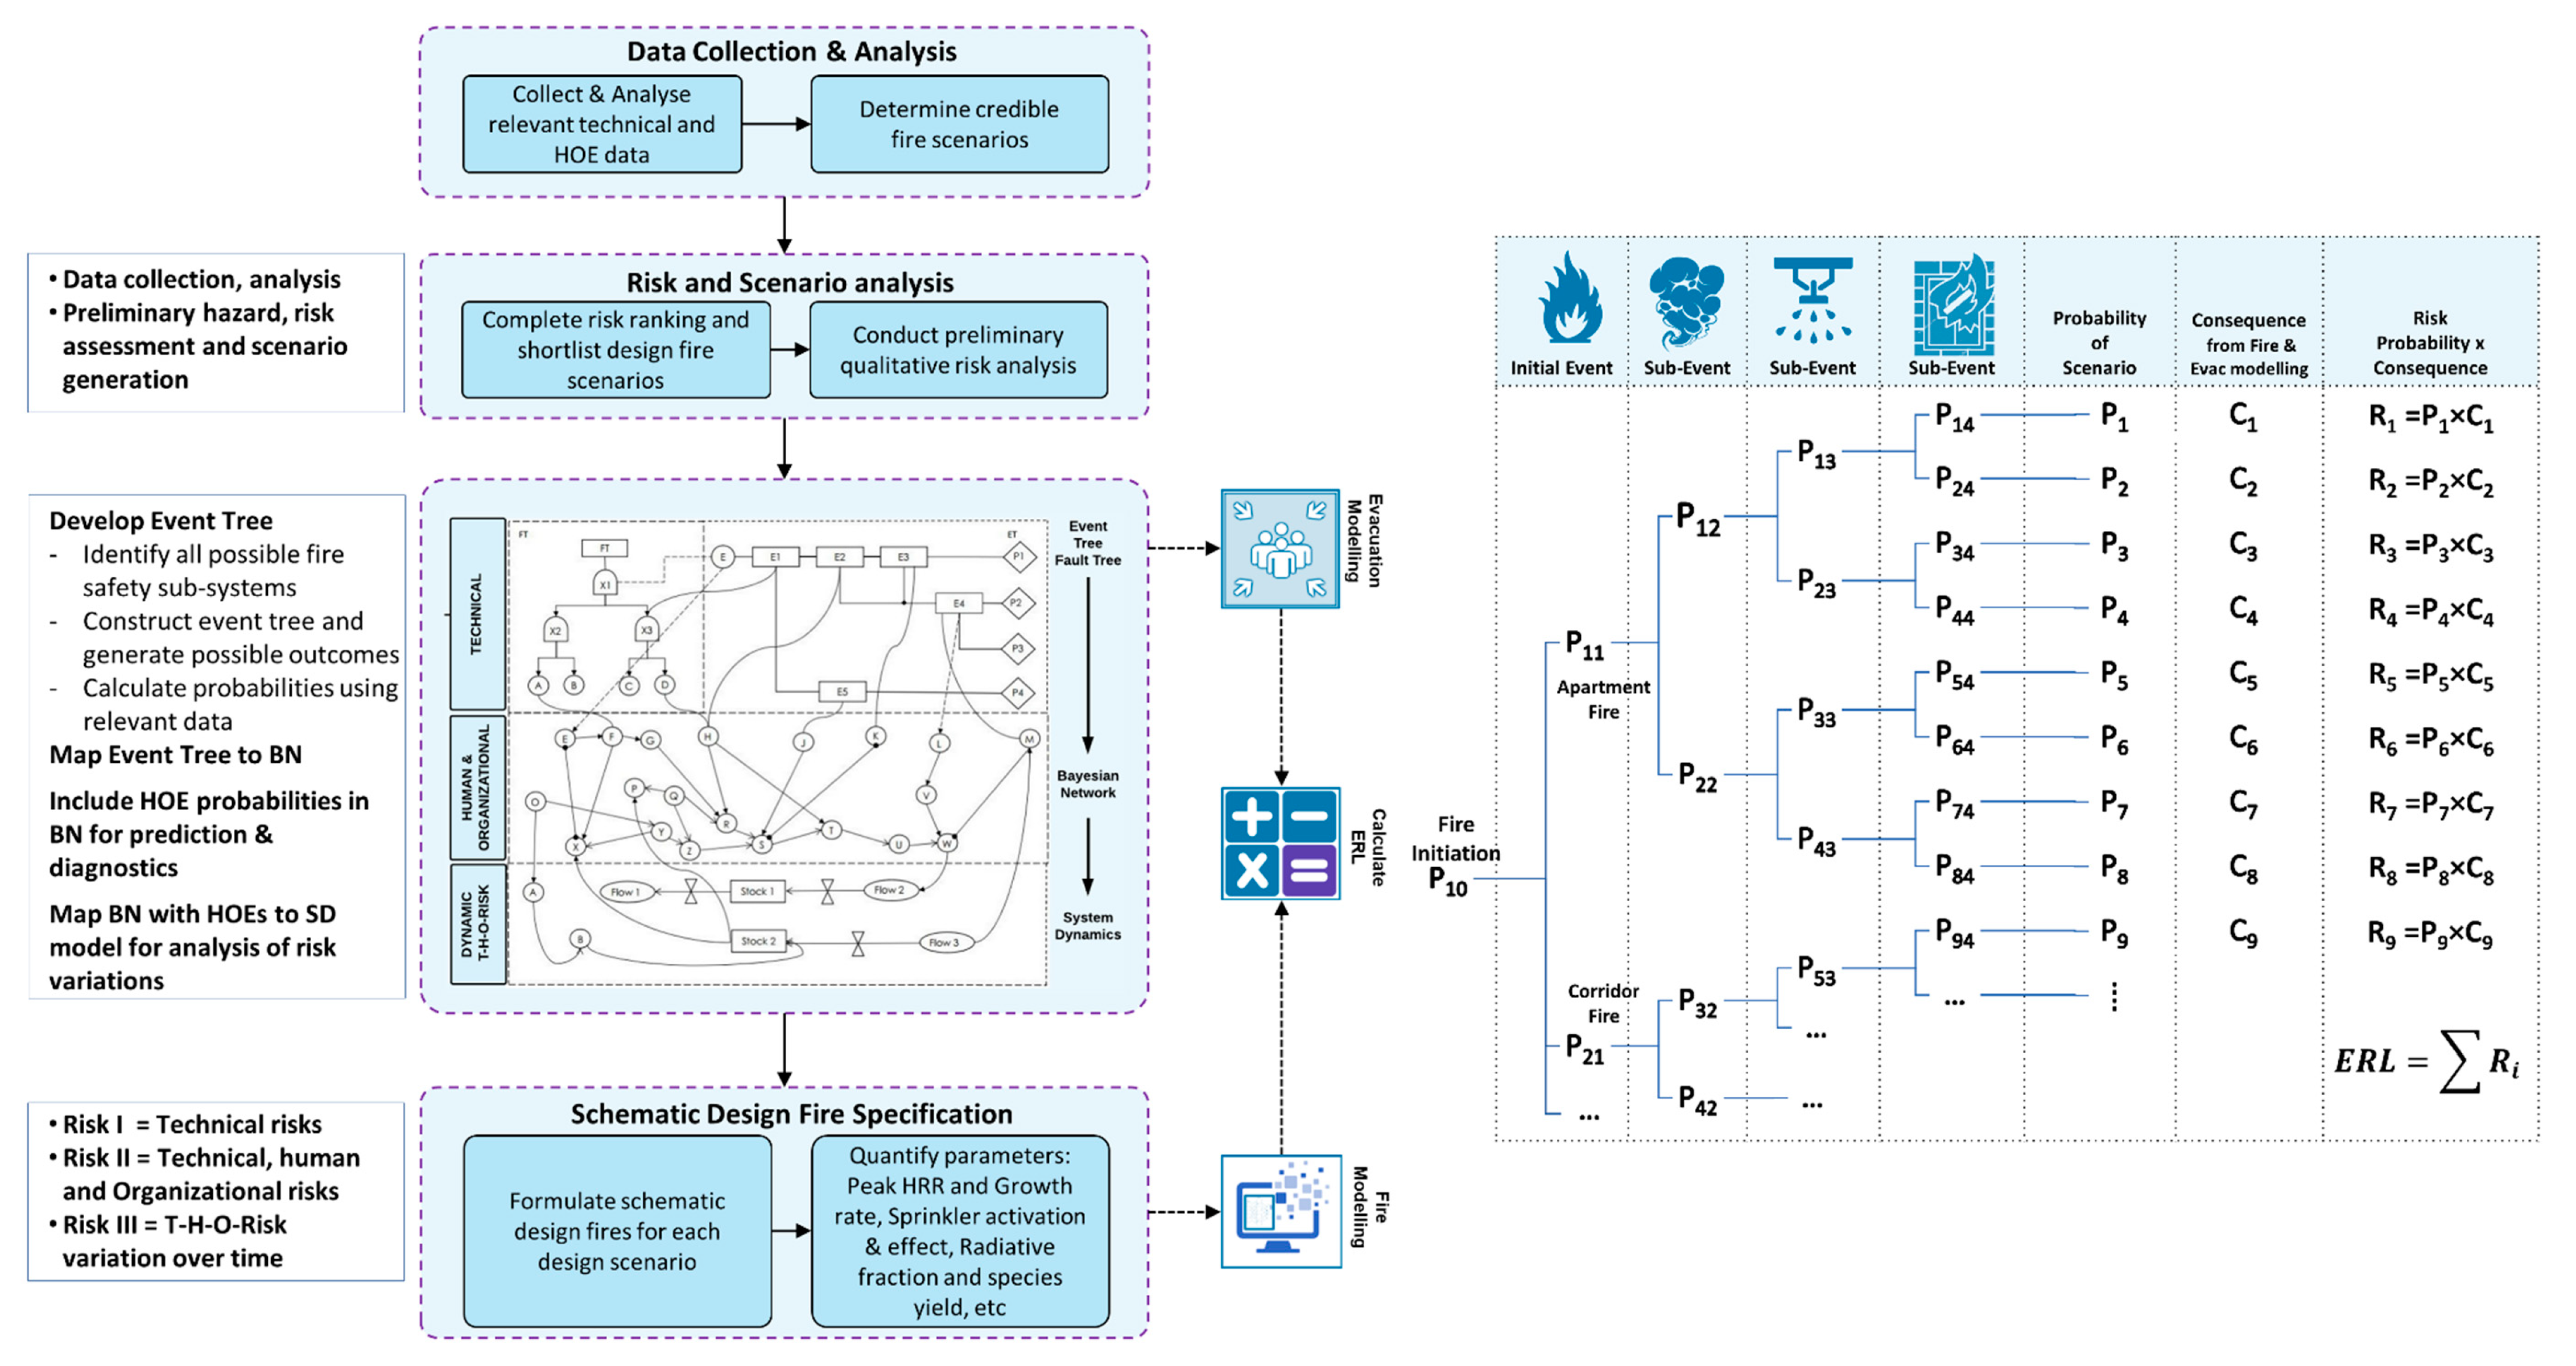
4] in comparing the calculated risk values. The major steps in T-H-O-Risk methodology are depicted in
Figure 1.
The first step in this methodology is to collect and analyze both technical and HOE data. Likely fire scenarios are created and then using this data, a preliminary risk analysis is carried out. An event tree (ET) is generated with all possible outcomes by considering each fire safety subsystem. The probabilities are computed for relevant events and then the ET is mapped to a Bayesian Network (BN). Probabilities for relevant HOEs are inserted into the BN model and the HOEs will influence the probability of each scenario depending on their location within the BN model. The variation in risk with time is computed by integrating the BN with an SD model that captures feedback loops and delays. A quantitative analysis of the state changes in the major HOE variables is conducted through simulation providing a characterization of the risk variations in the form of a probabilistic risk-time curve over a selected period in the life cycle of the building.
The model requires building inputs such as the number of apartments, floor level, travel distances to the nearest exit stair, occupancy load, and fire safety systems provided in the building. Both DtS and alternative solutions are evaluated in the ET where the number of scenarios is dependent upon fire safety measures provided. The event tree leads to the computation of overall fire risk to life if a fire occurs based on all the fire scenarios for each trial design using the simple Equation (1) involving probability and consequences.
Here
Pi is probability of a fire scenario
i, and
Ci is consequence or expected number of deaths resulting from scenario
i, while
n is the total number of scenarios. It must here be noted that this is only one of the various definitions of risk, which only implicitly invokes the concept of uncertainty. In fact, according to Aven et al. [
32] there are two main categories of risk definitions, one involving probability and expected outcomes, and a second one explicitly expressing risk as uncertainty. The definition adopted here is based on the first group and care should be considered to the fact that, even if not clearly stated, uncertainty is a fundamental aspect when dealing with risk; for this reason, risk-based methods require an uncertainty analysis.
The overall risk to occupants is calculated based on all probable fire scenarios leading to the computation of ERL in Equation (2).
where,
F is the annual fire ignition frequency for the building,
N is the number of fatalities in scenario
i and
POP is the number of occupants in the building.
Both DtS and alternative solutions are then compared with the absolute risk criteria given in BSI PD7974-7 to determine acceptance levels.
2.1. Collection and Probability Analysis of HOEs
In this study, the important HOEs result from the Fussel–Vesely method which measures the importance of the basic events [
33]. This method can be described as the ratio of the occurrence probability of the union of the minimum cut sets containing event X to the occurrence probability of the top event. To understand, consider a basic event
e defined by the following equation:
In the above equation, e is defined as the event where a model element of the hybrid approach is set to a specific probability of a risk state S (e.g., failure of a hardware component appears as a basic event in an event/fault tree analysis, or as a specific state of a BN variable such as procedural quality of maintenance set to low as opposed to a higher level). Hence the notion of the risk importance is now expanded for the inclusion of soft causal models and/or multi-state model elements. Once the notion of an event is generalized in the prescribed manner, the computation of important measures can be carried out in the usual manner.
A review and analysis of the literature is performed to obtain industry average probabilities/frequencies of HOEs, which are assigned to initiating events and basic events in the model to carry out a quantitative analysis of the frequency of occurrence. The results of this analysis may to some degree reflect specific building conditions since specific data should be applied whenever possible. Data may be found in incident databases, log data, and maintenance databases. In practice, extensive use of industry average data is necessary to carry out the quantitative analysis. The accuracy of results obtained from the model depends upon the assigned probability values of the HOE variables and equipment reliability data obtained from [
34,
35,
36,
37,
38,
39]. The applicability of the data from these sources to the building sector should be carefully considered. In fact, given that the analysis is largely based on probability, it is of the utmost importance that the provided data reflect the state of similar situations from the past. Therefore, before starting the application of the method, a survey of the existing databases is required. In some cases, where neither specific data nor generic data are found, it is necessary to use expert judgment to assign probabilities.
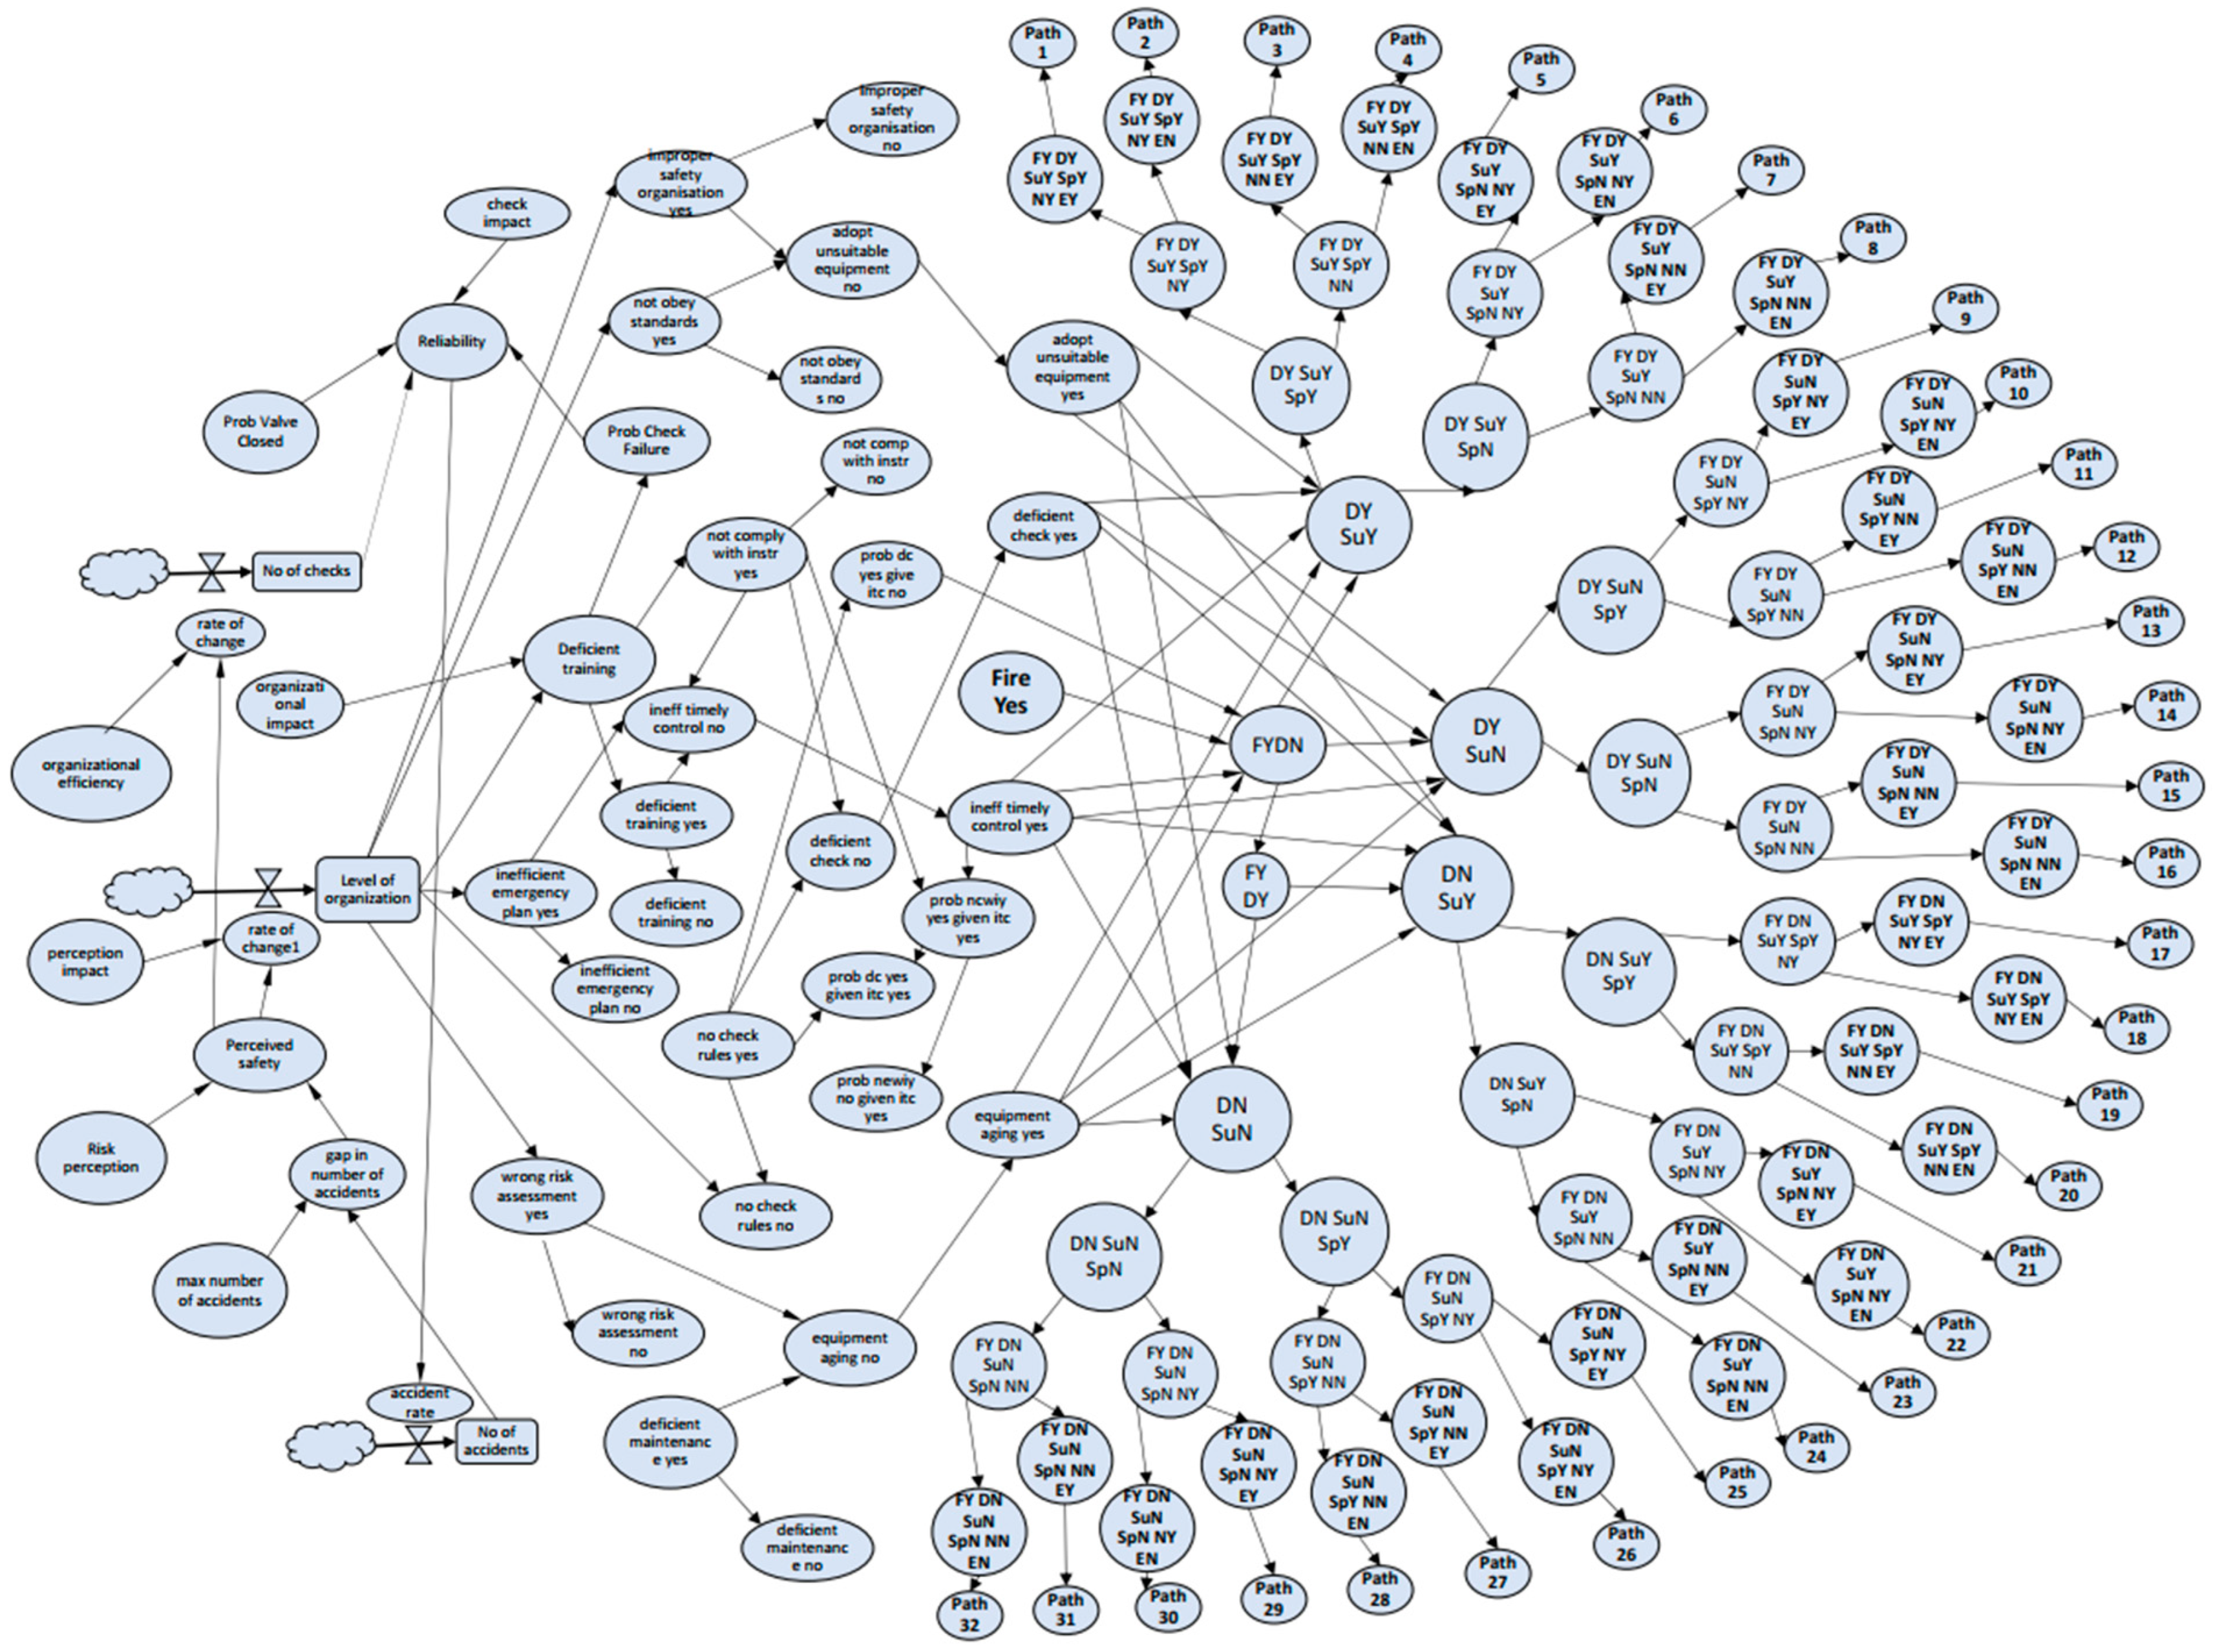
2.2. Event Tree
For each scenario, an ET will consider a fire event as the initiator and represents each subsystem and all possible outcomes. The event tree has the following events: (1) initiating event, (2) fire detected, (3) fire suppressed, (4) fire spread, (5) fire notified, and (6) egress protection system. For each of the scenarios in the ET, a probability of occurrence is calculated. For example, a scenario may be represented by the following chain of events (with the symbol of the associated probabilities):
The probability of each scenario is given by the product of the probabilities of the single events:
2.3. Bayesian Network
A BN is a probabilistic graphical model that represents a set of random variables and their conditional dependencies [
40]. A BN consists of directed acyclic graph (DAG) where each node denotes a random variable, each edge denotes direct influence of one variable over another, and each variable is independent of its non-descendants given its parents. Further, each node has a conditional probability distribution represented in Equation (5).
A BN provides a compact representation of a joint probability distribution, capturing independence and conditional independence if they exist (see also
Appendix A for details on BN equations). Further, it encodes the relevant portion of the full joint probability among variables where dependencies exist. The values in the CPT and their corresponding influence on the subsequent nodes are calculated based on expert judgment; higher values of the probability of a HOE are assumed to reduce the reliability of the technical systems. Furthermore, each combination of the states of a HOE variable is associated with a value for conditional probability. Through Bayes’ theorem, the model allows calculations of the reliability of a technical system as a function of HOEs. HOE variables such as emergency plans, training, compliance with instructions and standards, maintenance, risk assessment, safety organization, and checking of rules are all analyzed for their impact on the reliability of a given technical system (e.g., sprinkler or detection system). The major outcome is the risk level for building design while alternative solutions are further investigated based on HOE risk-based parameters. The T-H-O-Risk methodology compensates for the weaknesses in HOE-related risks overlooked in a typical PRA. An example of BN for a building design can be found in our earlier study [
17]. The BN structure has been developed by calculating the importance measures of basic events in the event/fault tree approach and multi-state BBN variables. The HOE basic events that contribute significantly to the occurrence of fire accidents have been identified from statistical data and presented in
Table 1 below.
2.4. System Dynamics
While the BN model incorporates HOEs, it does not consider their risk variation over time; the BN helps in the computation of risk value at a given time. Since the condition of building and equipment varies over its lifetime, it is natural to ask whether risk can be computed that varies with time. Fire events are complex dynamic processes, yet HOEs can be analyzed utilizing SD modelling [
41,
42]. This requires interaction of the BN with the SD model for the HOE variables. The SD model incorporated for this analysis extends the model in [
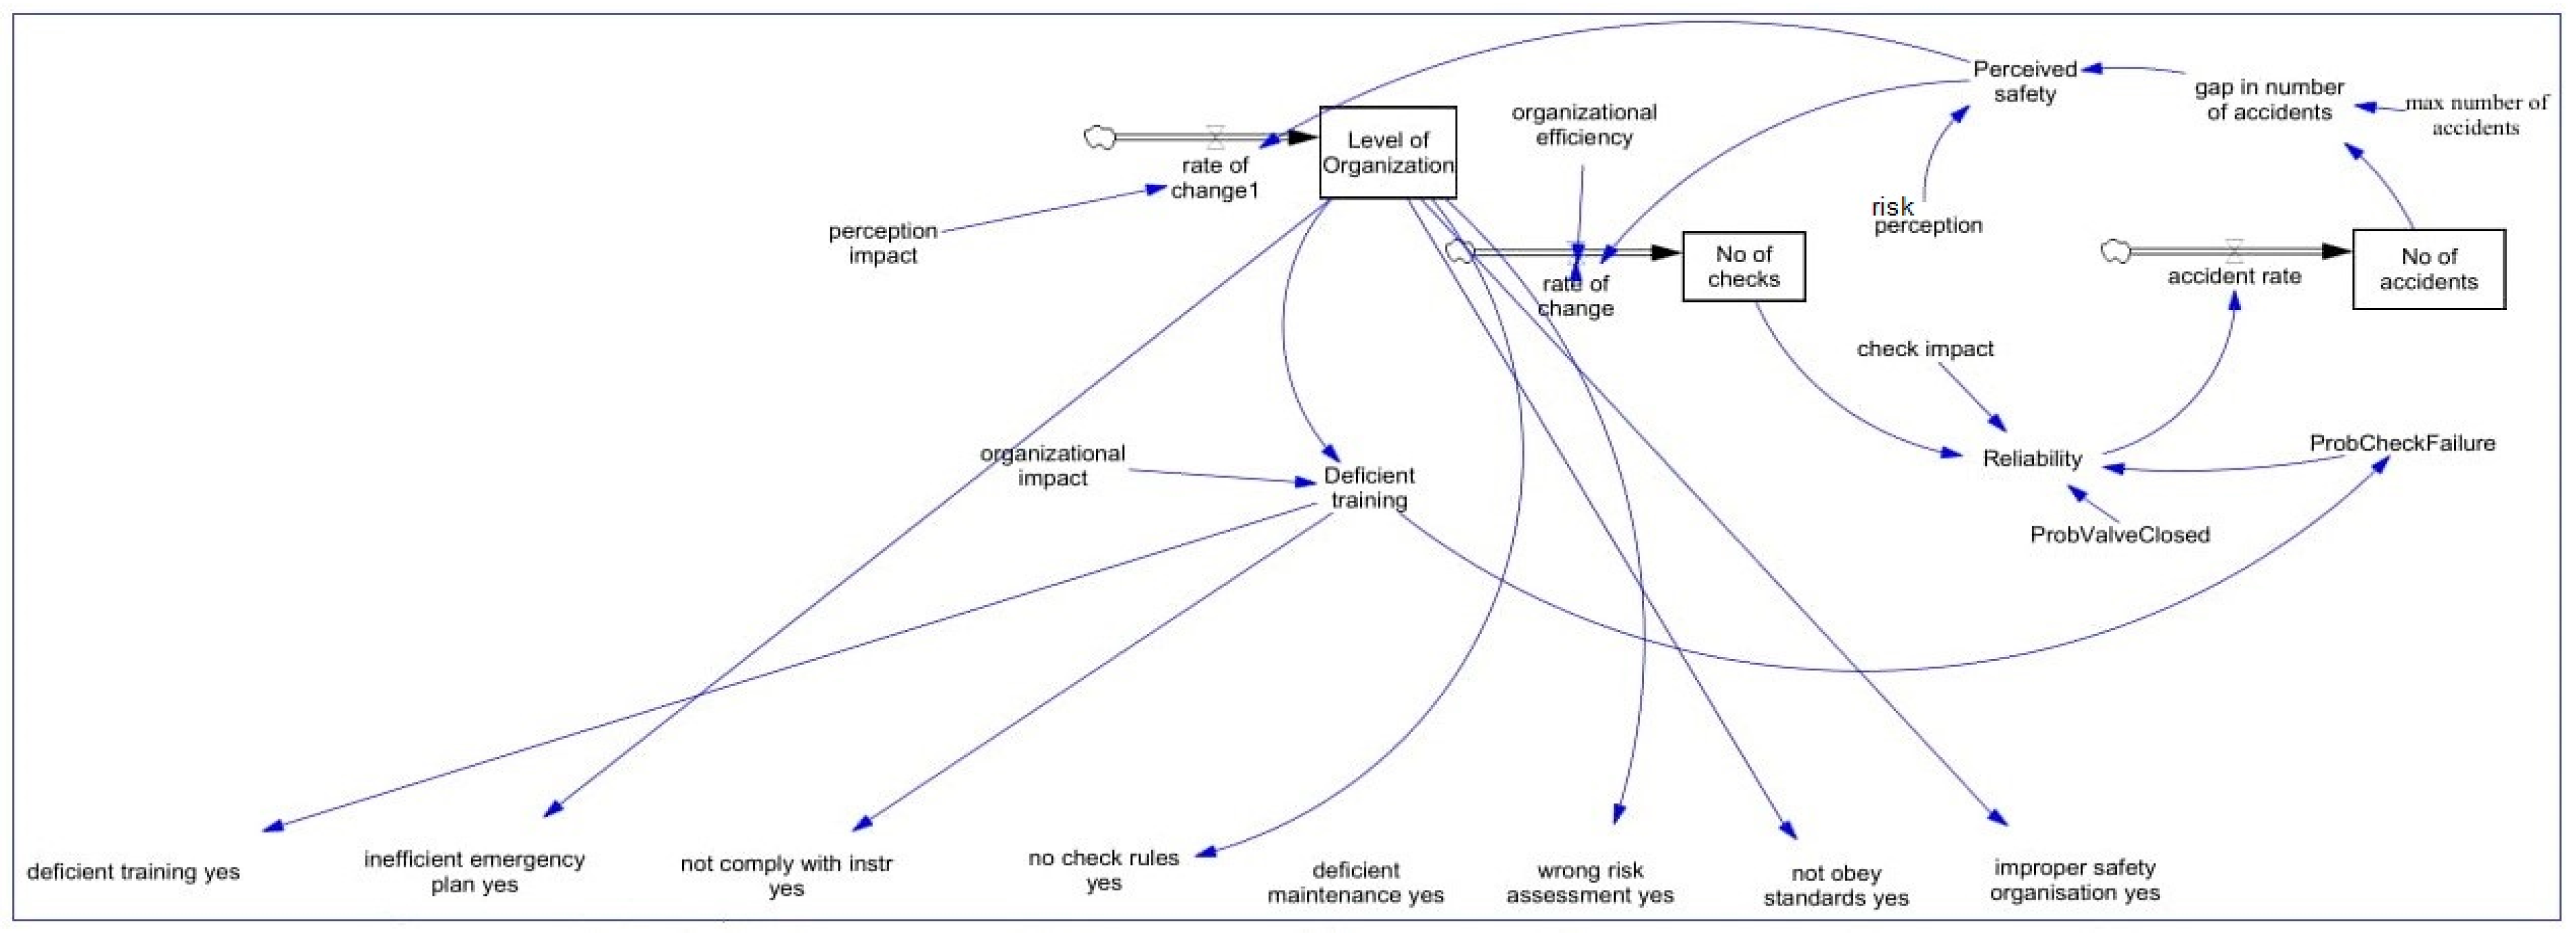
17] to encompass HOEs based on the reliability associated with maintenance practices and perceived safety. From a more general view, the maintenance regime is a subsystem linked with other subsystems, such as building management strategy and organizational safety culture.
The SD model is a two-step approach, the first being the causal loop diagram. A causal loop diagram is used to visualize the causal relationships in a system. It consists of all the elements representing the system and their interactions with each other including feedback loops and time delays, which are an integral part of the system. It helps conduct a qualitative analysis of the system’s structure and behavior. The second step is the stock and flow diagram which is a quantitative analysis technique with the use of stocks and flows. Stocks are accumulations in the system and stocks are used to represent variables that change with time. Flows are entities that control these stocks. Flow entering a stock (
Entry flow) increases the value of a stock and a flow exiting a stock (
Exit flow) decreases its value. Mathematically, the relationship between stocks and flows is shown in (7):
In this approach, each node of BN is made equivalent to a node in SD model. For example, if one of the nodes of the BN is represented by state yes or no, it is assigned with a probability and represented as a single state variable in the SD model. To bring time-varying values into this variable, it is perturbed by a known value. For example, a variable
fire:
yes is associated with a normal probability value of 0.03. From experience, it is known that there is a variation of 25% on the probability values. This can be implemented as:
For the child nodes, the conditional probabilities are calculated using the chain rule application of Bayes’ theorem. The CPT shown in
Table 2 is translated into an equation using the Boolean logic.
Consider a child node ‘inefficient timely control’, which has three parent nodes—‘deficient training’, ‘inefficient emergency plan’, and ‘not comply with instruction’. In the SD model, it is represented by the variables—‘inefficient timely control yes’ and ‘inefficient timely control no’ and can be translated into the following equations:
The same reasoning is applied to all other nodes in the BN. The final ERL variable contains the risk value for the specific design solution given by the sum of the ERLs of each single outcome.
The mapped SD model is shown in
Appendix B and explained there.
2.5. Available Safe Egress Time (ASET)-Required Safe Egress Time (RSET) Analysis
Available safe egress time (ASET) is defined as the time between fire detection and the onset of conditions which is hazardous to continued human occupancy. This time is a function of visibility, temperature, and fractional effective doses. The time can be estimated using a fire modelling simulation tool B-Risk. Required safe egress time (RSET) is the amount of time required after a fire ignition for occupants to evacuate a building or space and reach the building exterior or a protected exit enclosure. RSET is the sum of the detection time, the evacuation delay time (sometimes called the pre-movement time), and the movement time. Detection time is the time at which occupants first become aware of a fire through a building’s fire alarm system. The pre-movement time is the time that elapses between activation of the occupant notification system and the time at which occupants make the decision to begin evacuating. Pre-movement time includes the search for family and friends and to check whether the fire is real or not. The movement time is calculated by applying empirical relations for walking speed through egress elements such as doors, stairs, and corridors or using B-risk simulations. Evacuation time calculations were performed using the hydraulics methods outlined in Society of Fire Protection Engineering (SFPE) Handbook [
43] and Pathfinder evacuation modelling software from Thunderhead Engineering.
In building safety design, it is considered acceptable if the ASET is greater than the RSET, after applying an appropriate safety factor. The ASET can be increased by limiting combustibles, providing large separation distances between fuel drums (if any), providing fire suppression systems to suppress developing fires, or provide active or passive smoke detection systems. Live voice messages help in reducing the pre-movement time. Proper location of exit signs helps in reducing the movement time.
2.6. Risk Estimation
The model is tested on different building solutions in different regions. First, a frequency of ignition is calculated as a function of the building use and area; this frequency is then inputted into the first node of the ET and the probabilities for each of the outcomes are calculated. The corresponding consequences (in terms of casualties) are determined using software simulations and RSET/ASET analysis. Finally, the total ERL is calculated for each case, adding up the contributions of all outcomes.
The introduction of HOEs is then considered by applying to the BN the same ignition frequency calculated previously. The BN contains HOEs and their impact on the global ERL is analyzed. In order to include the dynamic effects of time-varying parameters, the SD graph is applied to the cases. Here, the initial ignition frequency is input, and the simulation is performed in Vensim from Ventana Systems. Vensim is a simulation software capable of representing and modelling the dynamic behaviour of a complex system. Besides direct causal relationships among variables, it performs calculations of the temporal evolution of feedbacks and loops.
The risk estimation is generated using the basic equation involving probability and consequences. The overall risk to occupants is calculated based on all probable fire scenarios leading to the computation of ERL. The resultant ERL for each building solution without HOEs (from ET) is compared with the solution with HOEs (from BN) to determine the impact of HOEs on overall risk. The ERL is compared with the acceptable industry standards and a go-ahead is given to design if it meets the same.
4. Results
The results of the impact of HOEs on the risk and reliability of fire safety systems in the case studies are presented as follows: individual risk (
Section 4.1), societal risk in the form of F-N curves (
Section 4.4), and System Dynamics (
Section 4.5).
Section 4.2 and
Section 4.3 focus on how human and organizational errors impact the individual risk of the buildings.
4.1. Expected Risk to Life (ERL) and HOE Quantification
The ASET-RSET analysis together with the risk assessment yields an overall ERL for technical risks for each building solution. A description of the ERL acceptance criteria, tenability, and ASET/RSET can be found in [
19]. The results from T-H-O-Risk modelling for the trial designs for each case study are summarized in
Table 10. These results are expressed in terms of ERL without HOE (noHOE) in the first column and ERL that includes HOE in the second column for each case.
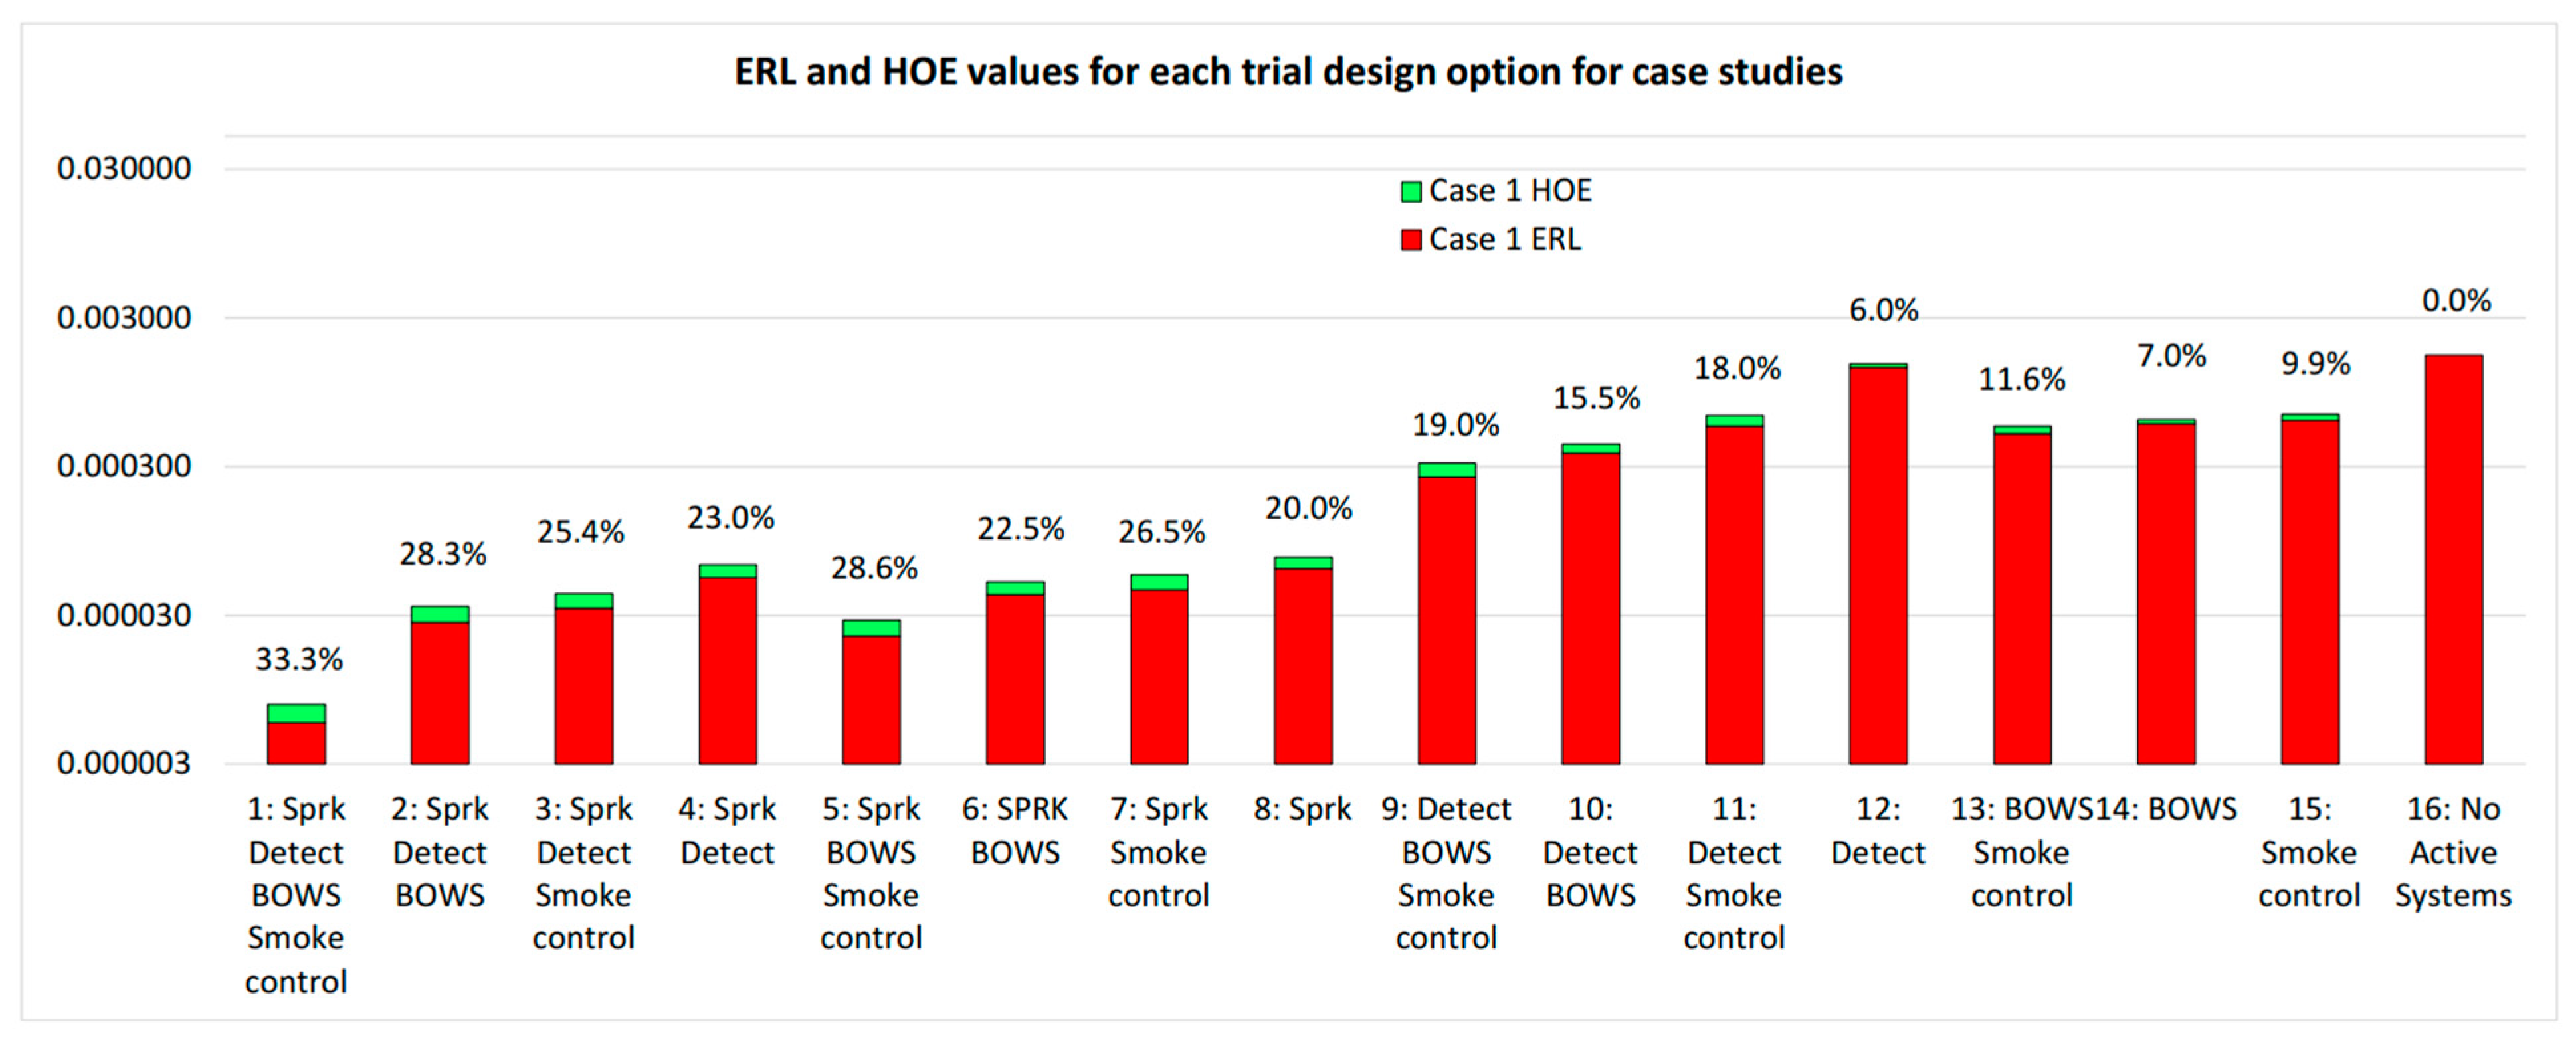
Figure 3 shows the ERL results for all 16 trial designs for Case #1. It is interesting to note that the influence of HOEs increases with the complexity of the system; a design with the full set of safety provisions (Trial Design 1) shows a +33% increase in ERL when considering HOEs, while the simpler design with only the sprinkler system (Trial Design 8) has a +20% increase in the ERL. However, even with HOE, Trial Design 1 has lower ERL without HOE in any other design.
The HOE/ERL ratio (in %) as a function of number of active systems is depicted in
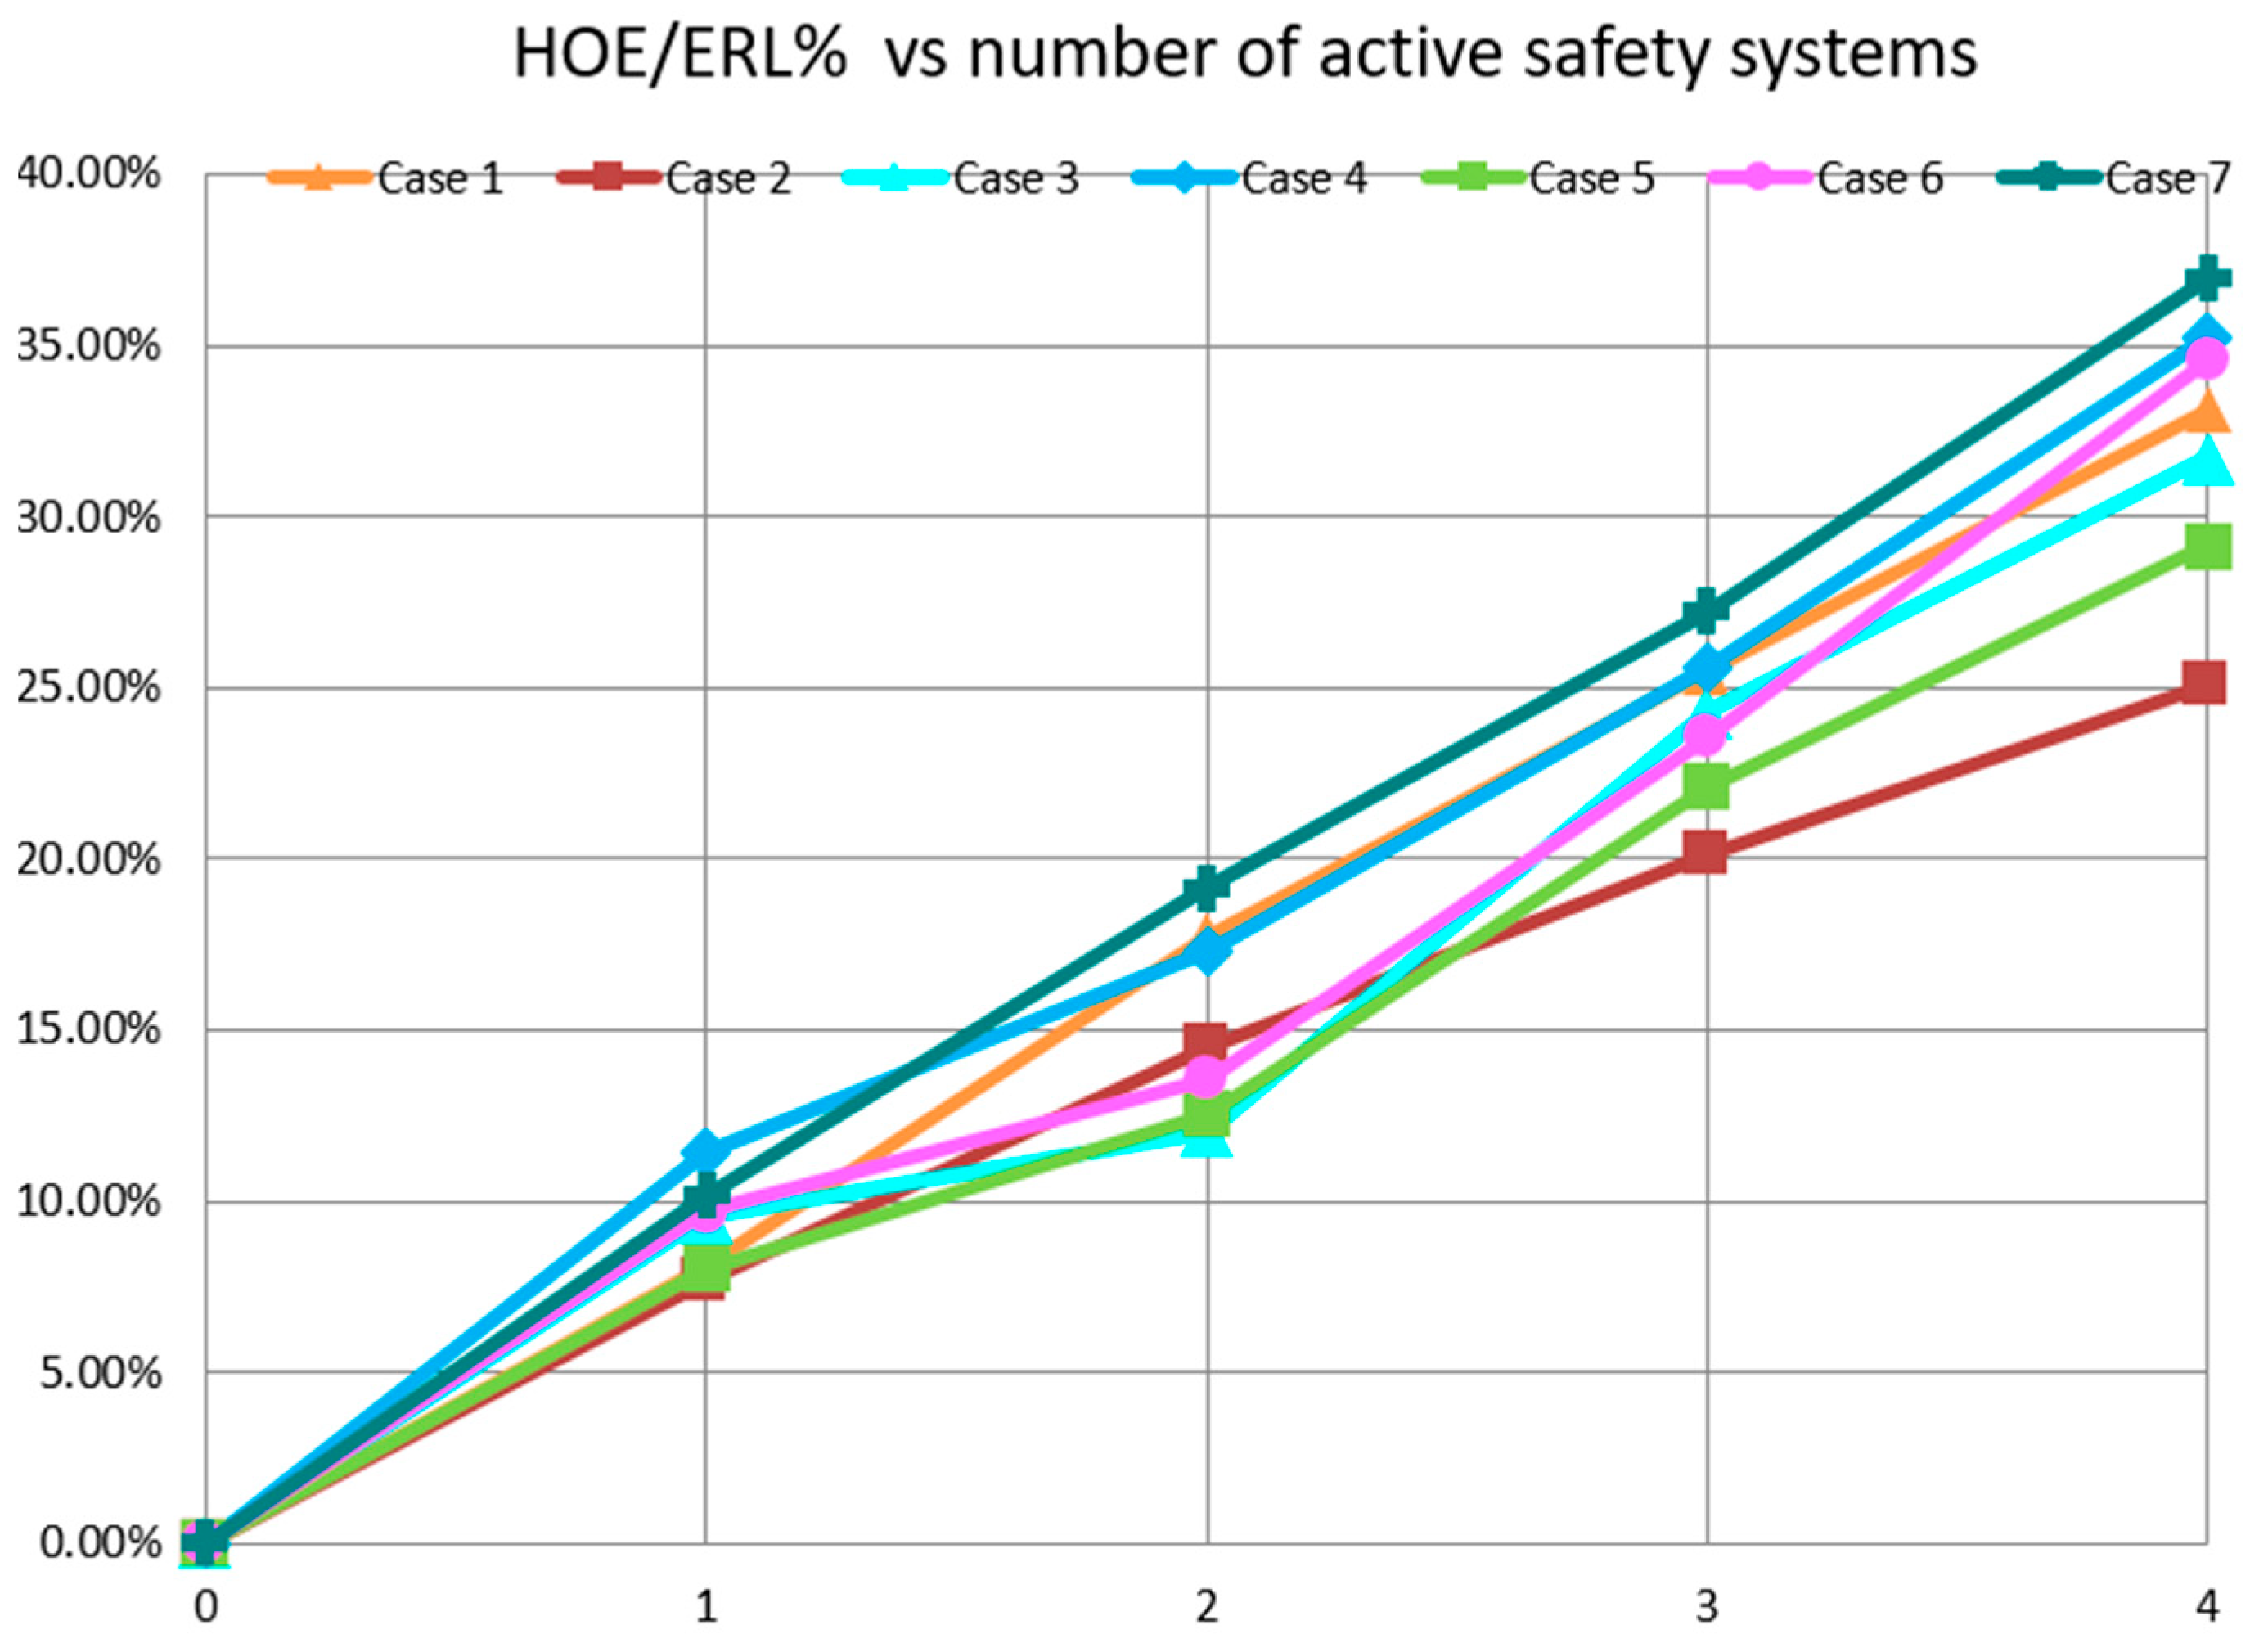
Figure 3. The HOE/ERL ratio increases with an increase in the number of active systems. With one active system, the HOE values range from 8–13% and increased to 25–38% when all four active systems are present in the trial design.
In
Figure 4, a linear relationship exists between the variable HOE/ERL% and the number of active systems. A correlation analysis indicates that HOE/ERL% and the number of active systems are strongly correlated in positive direction with respect to all cases #1 to #7-HOE/ERL% increases when active systems increase from 1 to 4. It can be concluded that a strong correlation exists between those variables for each case and for all data when considered together. The magnitude of correlation for each case is summarized in
Table 11. While Case #1 and Case #7 have the highest correlation, Case #5 has the lowest correlation.
4.2. Impact of HOEs on Active Systems
The fire fatalities in residential buildings vary across different countries and statistical data extrapolated from the literature indicate a range between 7.3 × 10
−6 to 1.3 × 10
−5 death/year in Australia, Canada, New Zealand, and the UK [
45]. In this study, the calculated ERL with active systems indicate a range between 2.23 × 10
−6 to 5.01 × 10
−5 which compares reasonably well with the literature. With no active safety systems, the ERL range from 1.68 × 10
−3 to 8.38 × 10
−3 (Trial Design 16). As expected ERL values are higher in the absence of active safety systems.
Trial Design 1 provides the most comprehensive fire safety systems as it includes sprinklers, BOWS, smoke detectors, and egress protection but is also most influenced by HOEs. Indeed, Trial Designs 1–9 consist of more complicated systems for fire safety, while Trial Designs 10–15 fire safety systems are less complicated. In general, these more complicated systems result in the lowest ERL.
HOEs have significant risk impact ranging from an average of 19.7–33% (average values of cases) with combinations of sprinklers, BOWS, smoke control systems, and smoke detectors for Trial Designs 1–9. For design options 10–15, HOEs had a lower impact on risk, ranging from 6.5% to 16.3% (average value of cases). HOEs have limited or no impact when active systems are absent.
4.3. Summary of HOE Results
Results of the T-H-O-Risk analysis compare reasonably with fire risk reported in the literature where available [
45,
46,
47,
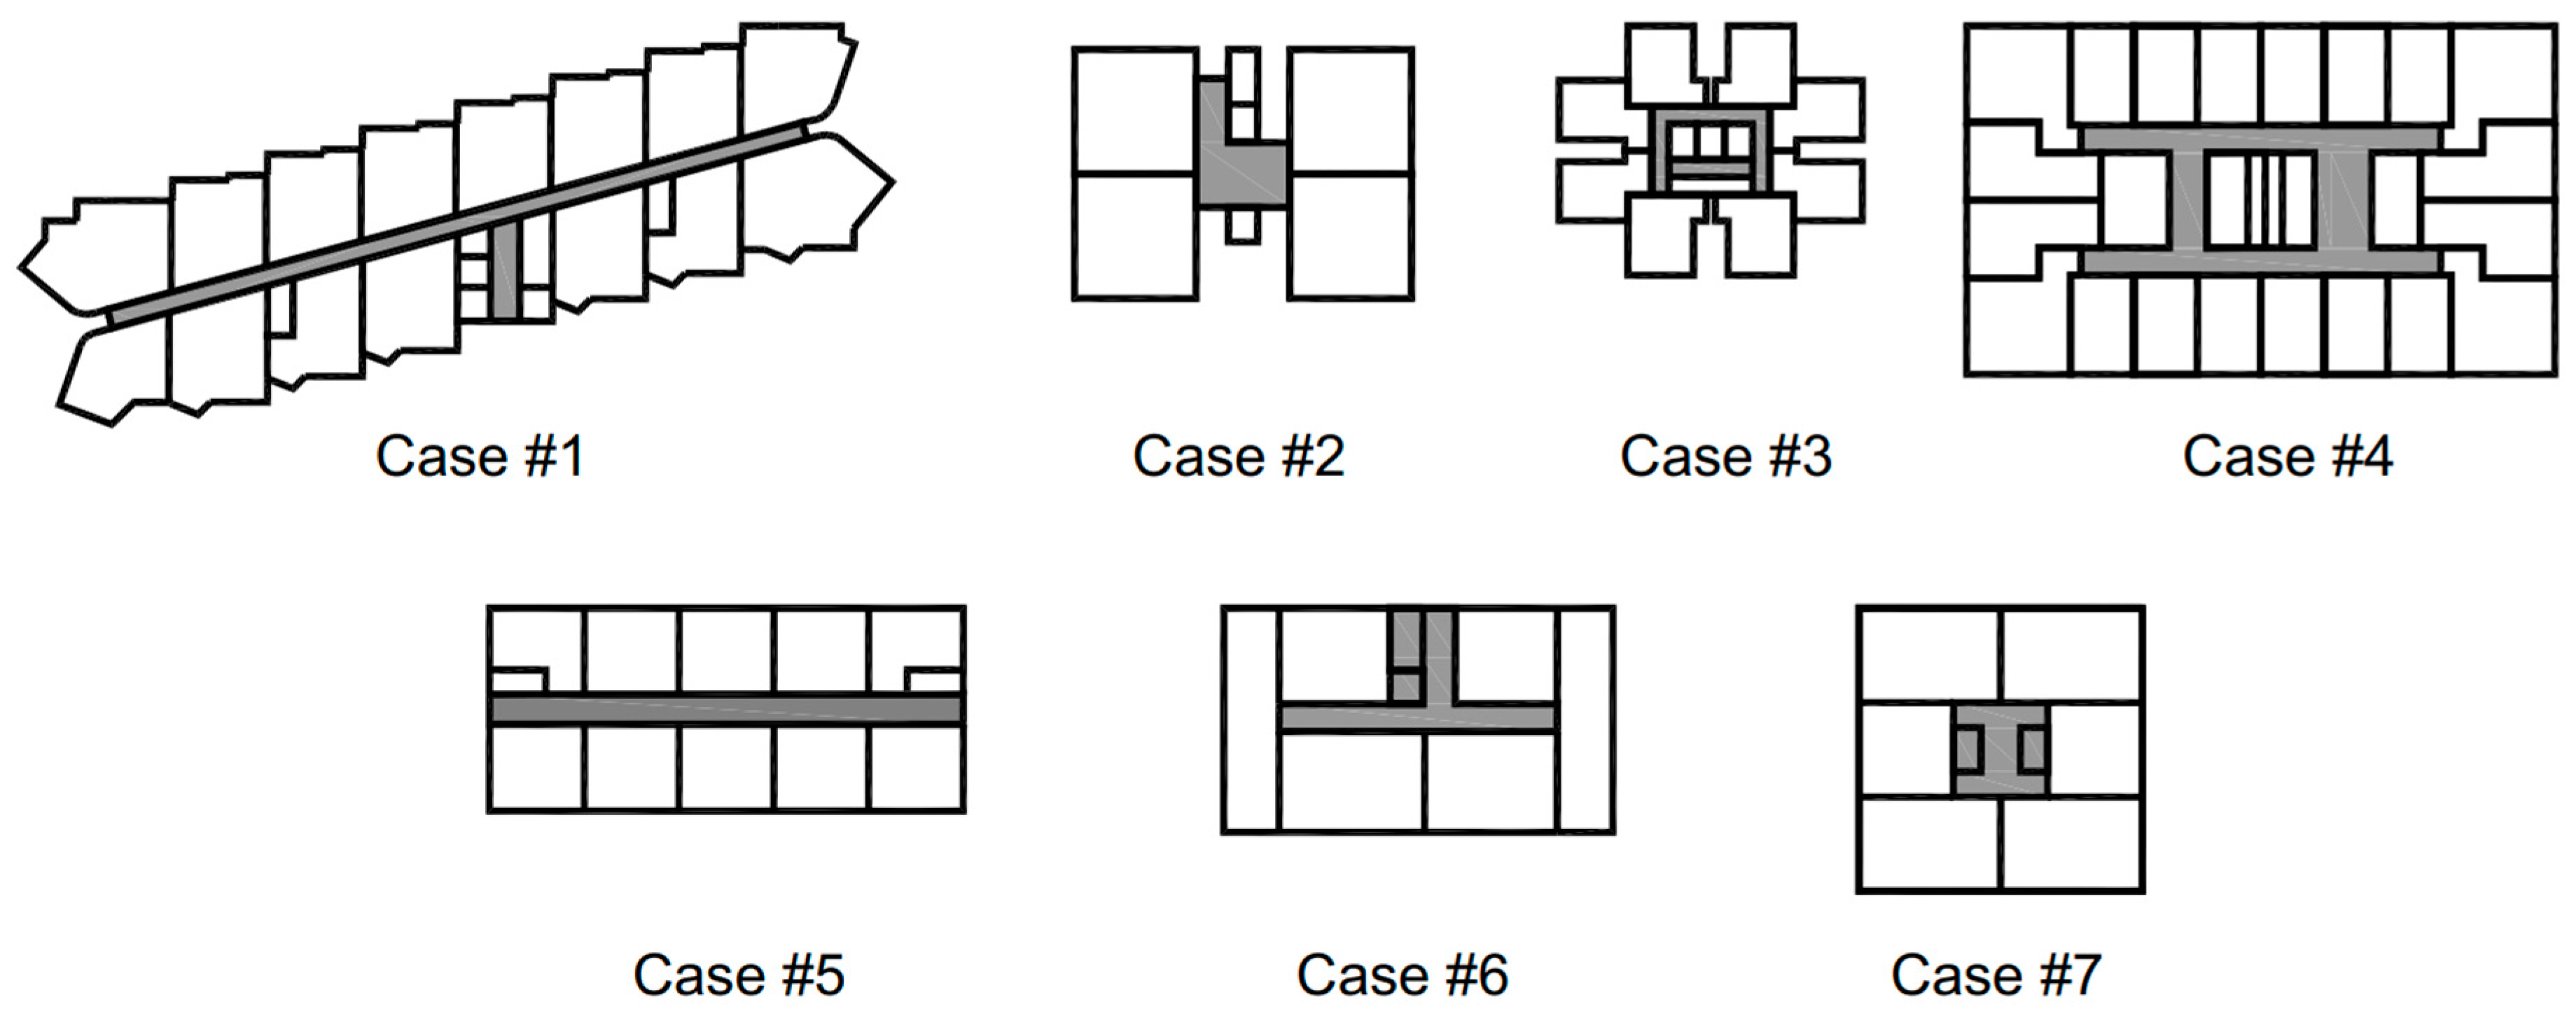
48]. The influence of HOEs is significant for Case #4 and Case #7 at 32% and 33% respectively with active systems of sprinklers, BOWS, and smoke detectors as these require regular maintenance. Case #4 is a building that has been converted from office to residential use while Case #7 is an old residential building that has been remodelled—both have inherent inflexibilities and legacy compliance issues which likely heightened their risk levels. As the number of active systems increases, the influence of HOEs becomes more significant since human interventions are required for maintenance and operations of these systems. Results indicate that overall, Cases #1, #2, #5, and #6 have comparably lower risk levels compared to Cases #3, #4, and #7. Case #1 is a double-loaded straight corridor block with full-height window openings at either end, which results in longer tenability conditions. Case #2 is a four-unit high-rise point-block with a single naturally ventilated stairwell and short cross-ventilated corridors. It is to be noted that this configuration can only be built in a tropical climate. Case #5 has naturally ventilated corridors and stairwells while Case #6 has low occupant load, short corridors, and travel distance to stair. Fire modelling results indicate that tenability conditions remain infinite at these corridors for Cases #2, #5, and #6 on account of the natural ventilation. The absence of a second exit stair in both Case #2 and Case #6 does not seem to compromise their risk levels likely due to the low occupant loads and corridor tenability. Case #7 has the highest overall risk on account of the sole stairwell and low tenability due the corridors filling up with smoke rapidly. Further, there is a strong positive correlation between the ratio HOE/ERL with the number of active systems–for each case, the correlation among its variables is high.
4.4. F-N Curve Assessment of Case Studies
Societal risks for the case studies are presented as F-N curves and constructed using the following equation:
where
F is the cumulative frequency of
N or more fatalities,
N is the number of fatalities,
a is the aversion factor and
k is a constant (please refer to
Appendix B for inputs).
The individual tolerability limit based on PD 7974-7:2019 is given as 1 × 10
−4/year while the de minimis limit is set at 1 × 10
−6 [
6]. From the draft ABCB Tolerable Risk Handbook, the Upper and Lower Individual Tolerance Limits are set as 5 × 10
−4/year and 5 × 10
−6/year respectively for residential classes.
Kaneko et al. [
49] suggest a method for building the tolerability limit curve mathematically from raw data of previous events. An
F function is minimized to obtain some parameters that define the tolerability limit curve. The method also aims at extrapolating the curve values for low probabilities/high consequences events when data for such events are not available. To create an approximating function that fits with the curve, a minimizing function
F is introduced. The equations for generating the tolerability limit curve are provided in
Appendix C.
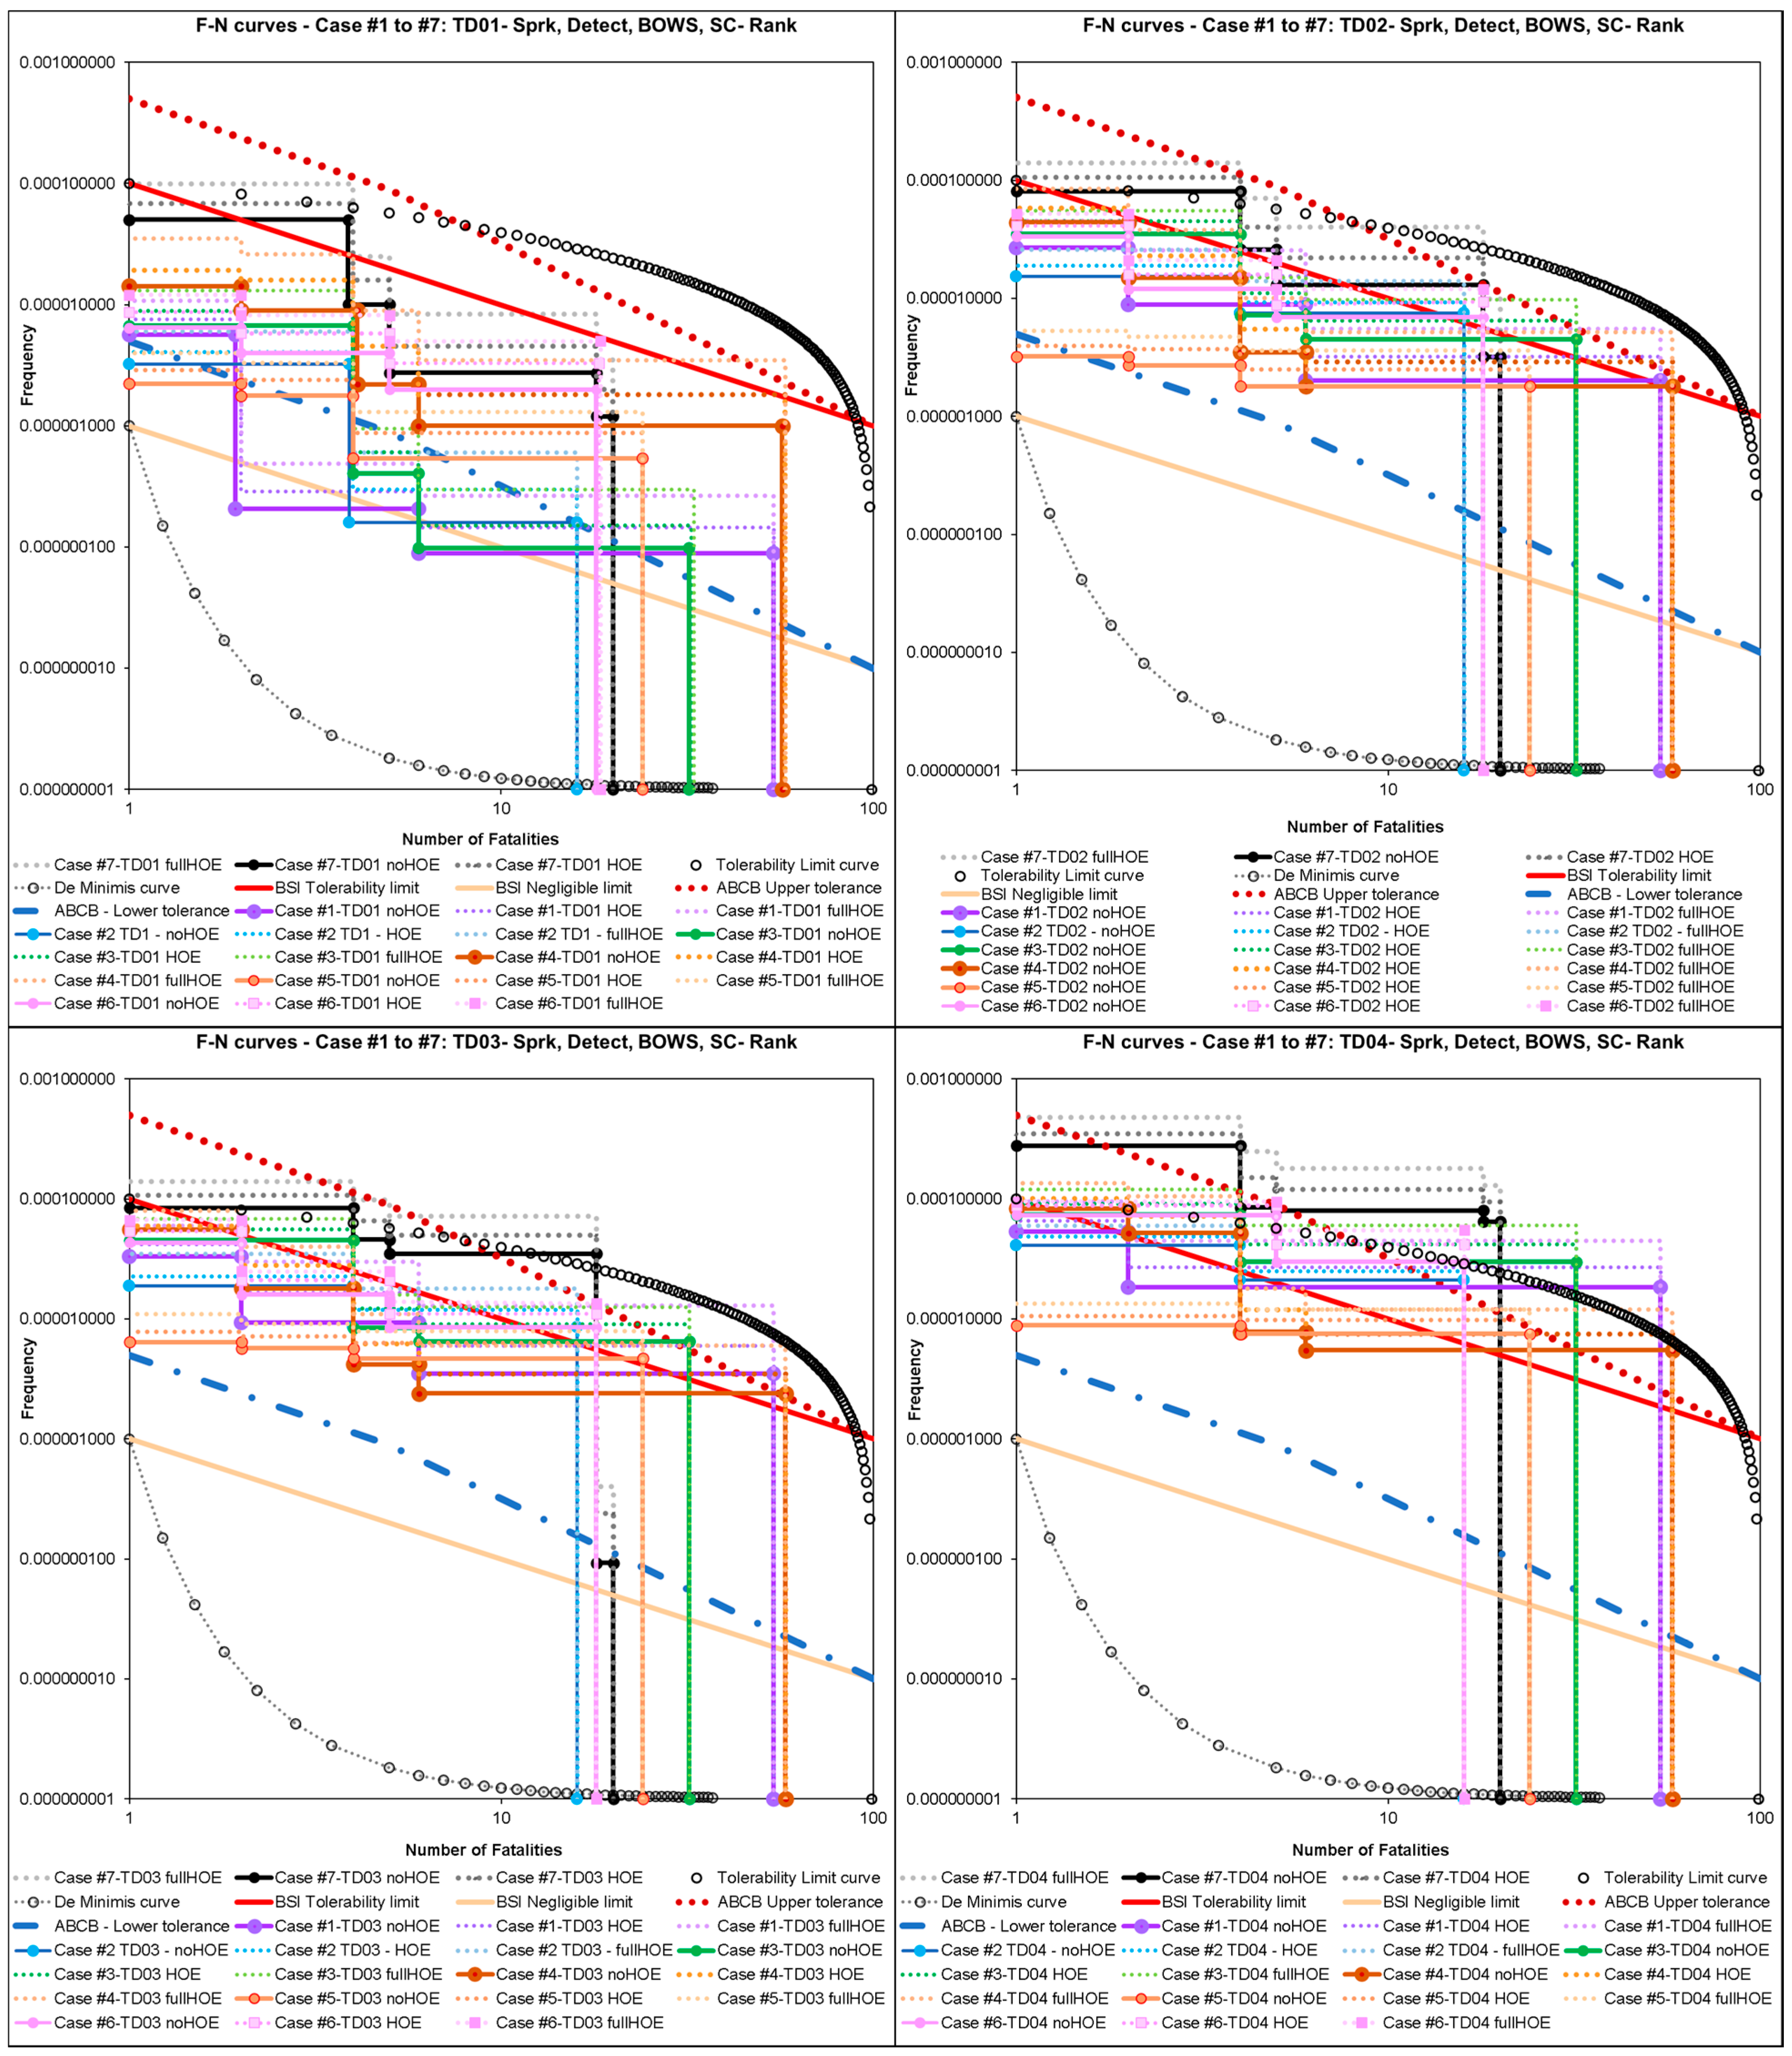
Figure 5 shows the F-N curves for Case #1 to Case #7: Trial Design TD01 to Trial Design TD04: [noHOE, HOE, fullHOE]. The F-N curves for the other Trial Designs TD05-TD16 are provided in
Supplementary Material—Figures S1–S3. F-N curves for each individual Trial Designs for each Case #1 to #7 (total 112 individual F-N graphs) are provided in
Supplementary Material—Figures S4–S10.
The tolerability and de minimis limit curves are indicated in
Figure 5 as follows:
The de minimis limit (denoted by dotted lines with black circle as markers) is the lower threshold below which designs are denoted as ‘broadly acceptable’ indicating no further requirement to investigate further risk reduction measures below this threshold [
2].
The gradient of tolerability limit curve (denoted by circle markers) is shallow for low consequences and steep for high consequences to explicitly acknowledge risk aversion.
The shape of the tolerability and de-minimis limits results in a wider ALARP region, increasing the range of design solutions requiring explicit cost–benefit assessment to maximize social welfare [
2,
3]. In the ALARP region, safety measures should be implemented to reduce the risk to ALARP so the design can be considered acceptable.
The F-N curve moves upward when HOEs are considered indicating increasing risks and greater severity in terms of frequency and number of fatalities.
ABCB tolerability curves are represented graphically in
Figure 5 and the bounds set by BSI 7974 for their tolerance are superimposed using black solid and dashed lines. Overall, the limits set by ABCB are similar to BSI PD-7974-7:2019. However, the rate of change in allowable frequency is also much faster (steeper slope) than BSI. The ABCB slope of −1.5 indicates a higher risk aversion that BSI’s neutral risk aversion slope of −1. Following are observations from
Figure 5:
In TD01 (with all active systems present), only Case #7 exceeded the upper tolerability limit of 1 × 10⁻⁴ based on BSI PD7974-7 tolerability. Against ABCB tolerability bounds, Case #7 did not exceed the upper tolerance while it is at the borderline of the upper Kaneko curve. For Case #7, the difference in risk with and without HOEs is ~33%.
On the other hand, the risk levels in Cases #1, #2, #3, #5, and #6 (with sprinkler systems, BOWS, smoke detection, and natural ventilation in corridors), stayed within the ALARP region even when HOEs were considered.
For TD04, the F-N curve exceeds the ABCB tolerability curve for cases #1, 3, 6, and 7 (noHOE). In addition, the curves for these cases (noHOE) gradually move upward from TD01 to TD04, indicating that as the number of active systems is reduced; the system becomes risker for no human intervention case. Also, for all cases in TD16 (no active system), the F-N curve remains above the tolerability limit (
Supplementary Material—Figures S1–S10). For partial or standalone active systems (TD5 to TD15) again, parts of F-N curve remain above tolerability limits prescribed by ABCB and PD7974-7:2019 resulting in unacceptable societal risks.
The lowest risk levels were realized in Case #1 and #5 (with two stairwells and installation of sprinklers, smoke detection, and BOWS) and Case #2 (with single stairwell, sprinklers, smoke detection, and BOWs). Risk levels did not exceed the tolerability limit in these cases when HOEs were included. In cases (#1, 2, and 5) risk only increased by 20% for with and without HOEs (nearly half that of Cases #4 and #7).
So, for Case #4 where HOEs edged the F-N curve towards the tolerability limit and also Case #7, additional fire safety measures. However, if the installation of further fire safety features is no longer available, alternatives might be to improve the reliability of active systems, accept a lower reliability interval or redesign the building plans to introduce passive means to improve tenability.
The CBA would use disproportionality factor,
D set as 1 per PD7974-7:2019 guidelines [
6], however, this is beyond the scope of this paper.
4.5. System Dynamics Modelling Results
System dynamics modelling considers risk variation over time and examines the dynamic effects of human and organisational factors on component reliability. It is observed that the reliability of safety systems such as detection or suppression systems varies with time, as illustrated by Case #1 in the graph on the left in
Figure 6. The curve shows the effect of perceived safety on the building management team. There is an initial period (0 to 5 years) in which the reliability declines slowly, thus causing the number of accidents to increase (
Figure 6a). The excessive number of accidents compel the building management to implement new safety measures that improve the reliability from year 5 to 7. The peak of the reliability reassures the building management team so that safety measures are then relaxed, and reliability declines again from year 7 to year 10. So there is a bottom value for reliability before 5 years, then a reaction from the organization is expected with improvements in safety being implemented along the next 2 years, peaking at 0.95 before lax safety behaviour causes the downward trend again till year 10. The ERL curve in
Figure 6b indicates an opposite behaviour to reliability over the 10-year period reaching a low risk level of 5.9 × 10
−6 in Year 7 before trending up. The detection probability curve in
Figure 6c exhibits similar behaviour to the reliability curve over this period. The accident rate increases until year 5 when safety measures cause a downward dip until year 7 when it begins to slope up again.
A sensitivity analysis for the SD model is then performed for the dynamic response of the system over 10 years. Sensitivity analysis is used to determine how the model behaves and responds to a change in a parameter. Each simulation with changed parameters and slope of the nonlinear relationship was compared with the base run simulation to determine whether the parameters and nonlinear relationships exhibited sensitive behavior. If the model behavior only changes numerically with the values of parameters, it indicates that the underlying behavior is not sensitive to changes in parameters. In fact, most of the input parameters will not have a great influence on the model behavior, except for critical variables in the model. The sensitivity of a parameter is given by the following equation:
where
S is the sensitivity function,
Y is the output behavior variable,
X is the model parameter and
t is time.
The sensitivity analysis tests are carried out in Vensim to provide a comparative graph of final results, which cause the simulation results to be displayed as confidence bounds ranging from 0 to 100 percentages. Confidence bounds are used to represent the sensitivity of the variable. The analysis is computed at each point in time by ordering and sampling all the simulation runs (1000 Monte Carlo simulation runs). The color area in the sensitivity graph indicates whether the specified variable may affect the simulation results to a great extent. For the confidence bounds color in
Figure 6, yellow represents 50%, green represents 75%, blue represents 95% and grey represents 100%. The ‘risk perception’ variable of the socio-technical loop has been taken as the input variable and its range of variation is between 0.99999 to 1.00001 (the range is very small, in the order of 1 × 10
−5). Monte Carlo simulation with 1000 iterations was run and the resulting behaviour of the reliability variable is represented by the sensitivity curve in
Figure 6a. It can be noted that the effect of the variations on the input variable deploy only after an initial period in which the input has no influence on the reliability outcome. This can be explained by the dynamic character of the high-level loop. For the same input variable ‘perception’ the ERL and accident rate exhibit large variations in behaviour after year 7.
For the detection node ‘fire yes, detection yes’ (FYDY), the sensitivity to the ‘perception’ factor is extremely low, with variations in the range from 40.05% to 40.50% as shown in the curve of
Figure 6c. The detection node (right side) shows that variations occur after about 7 years, meaning that the influence of the human and organization factors on technical systems develops after a certain period of time. The results indicate that a very small variation in the input variable ‘risk perception’ generates very large variations in the output ERL value. It can thus be concluded from the sensitivity analysis that a very small behavioural change in risk perception of a building management team can lead to a very large risk to life variations over time through the self-reinforcing feedback loop.
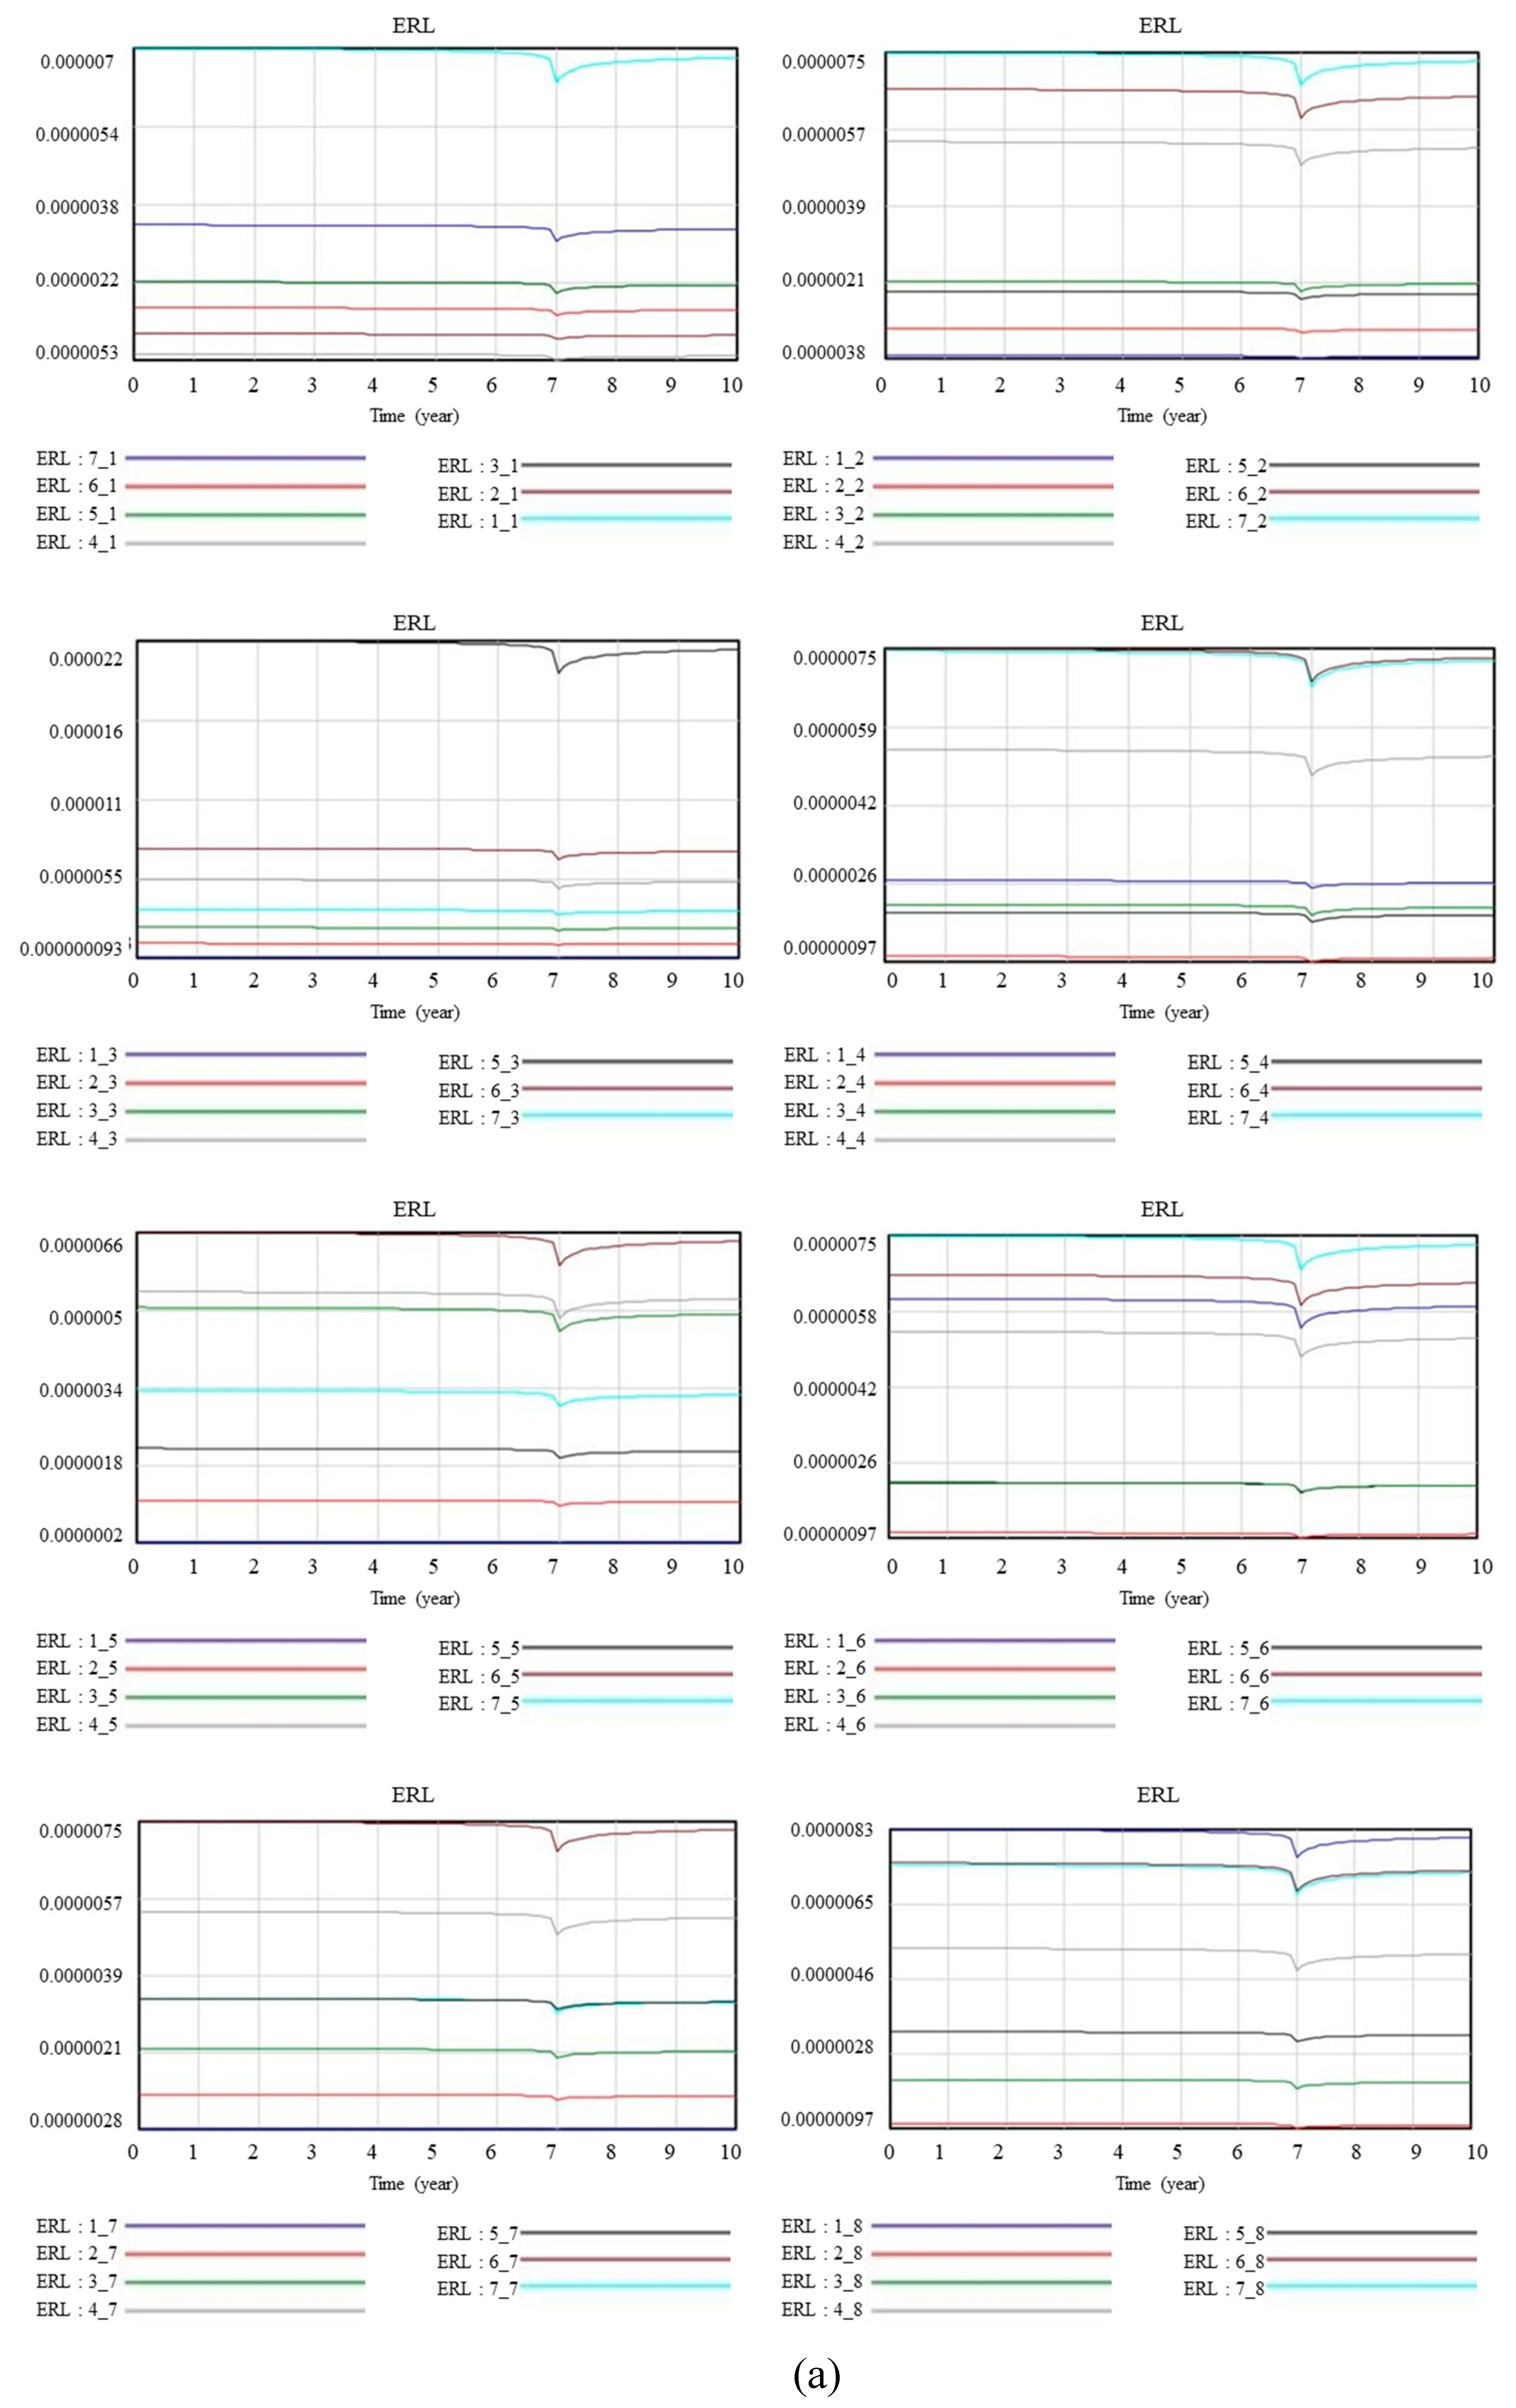
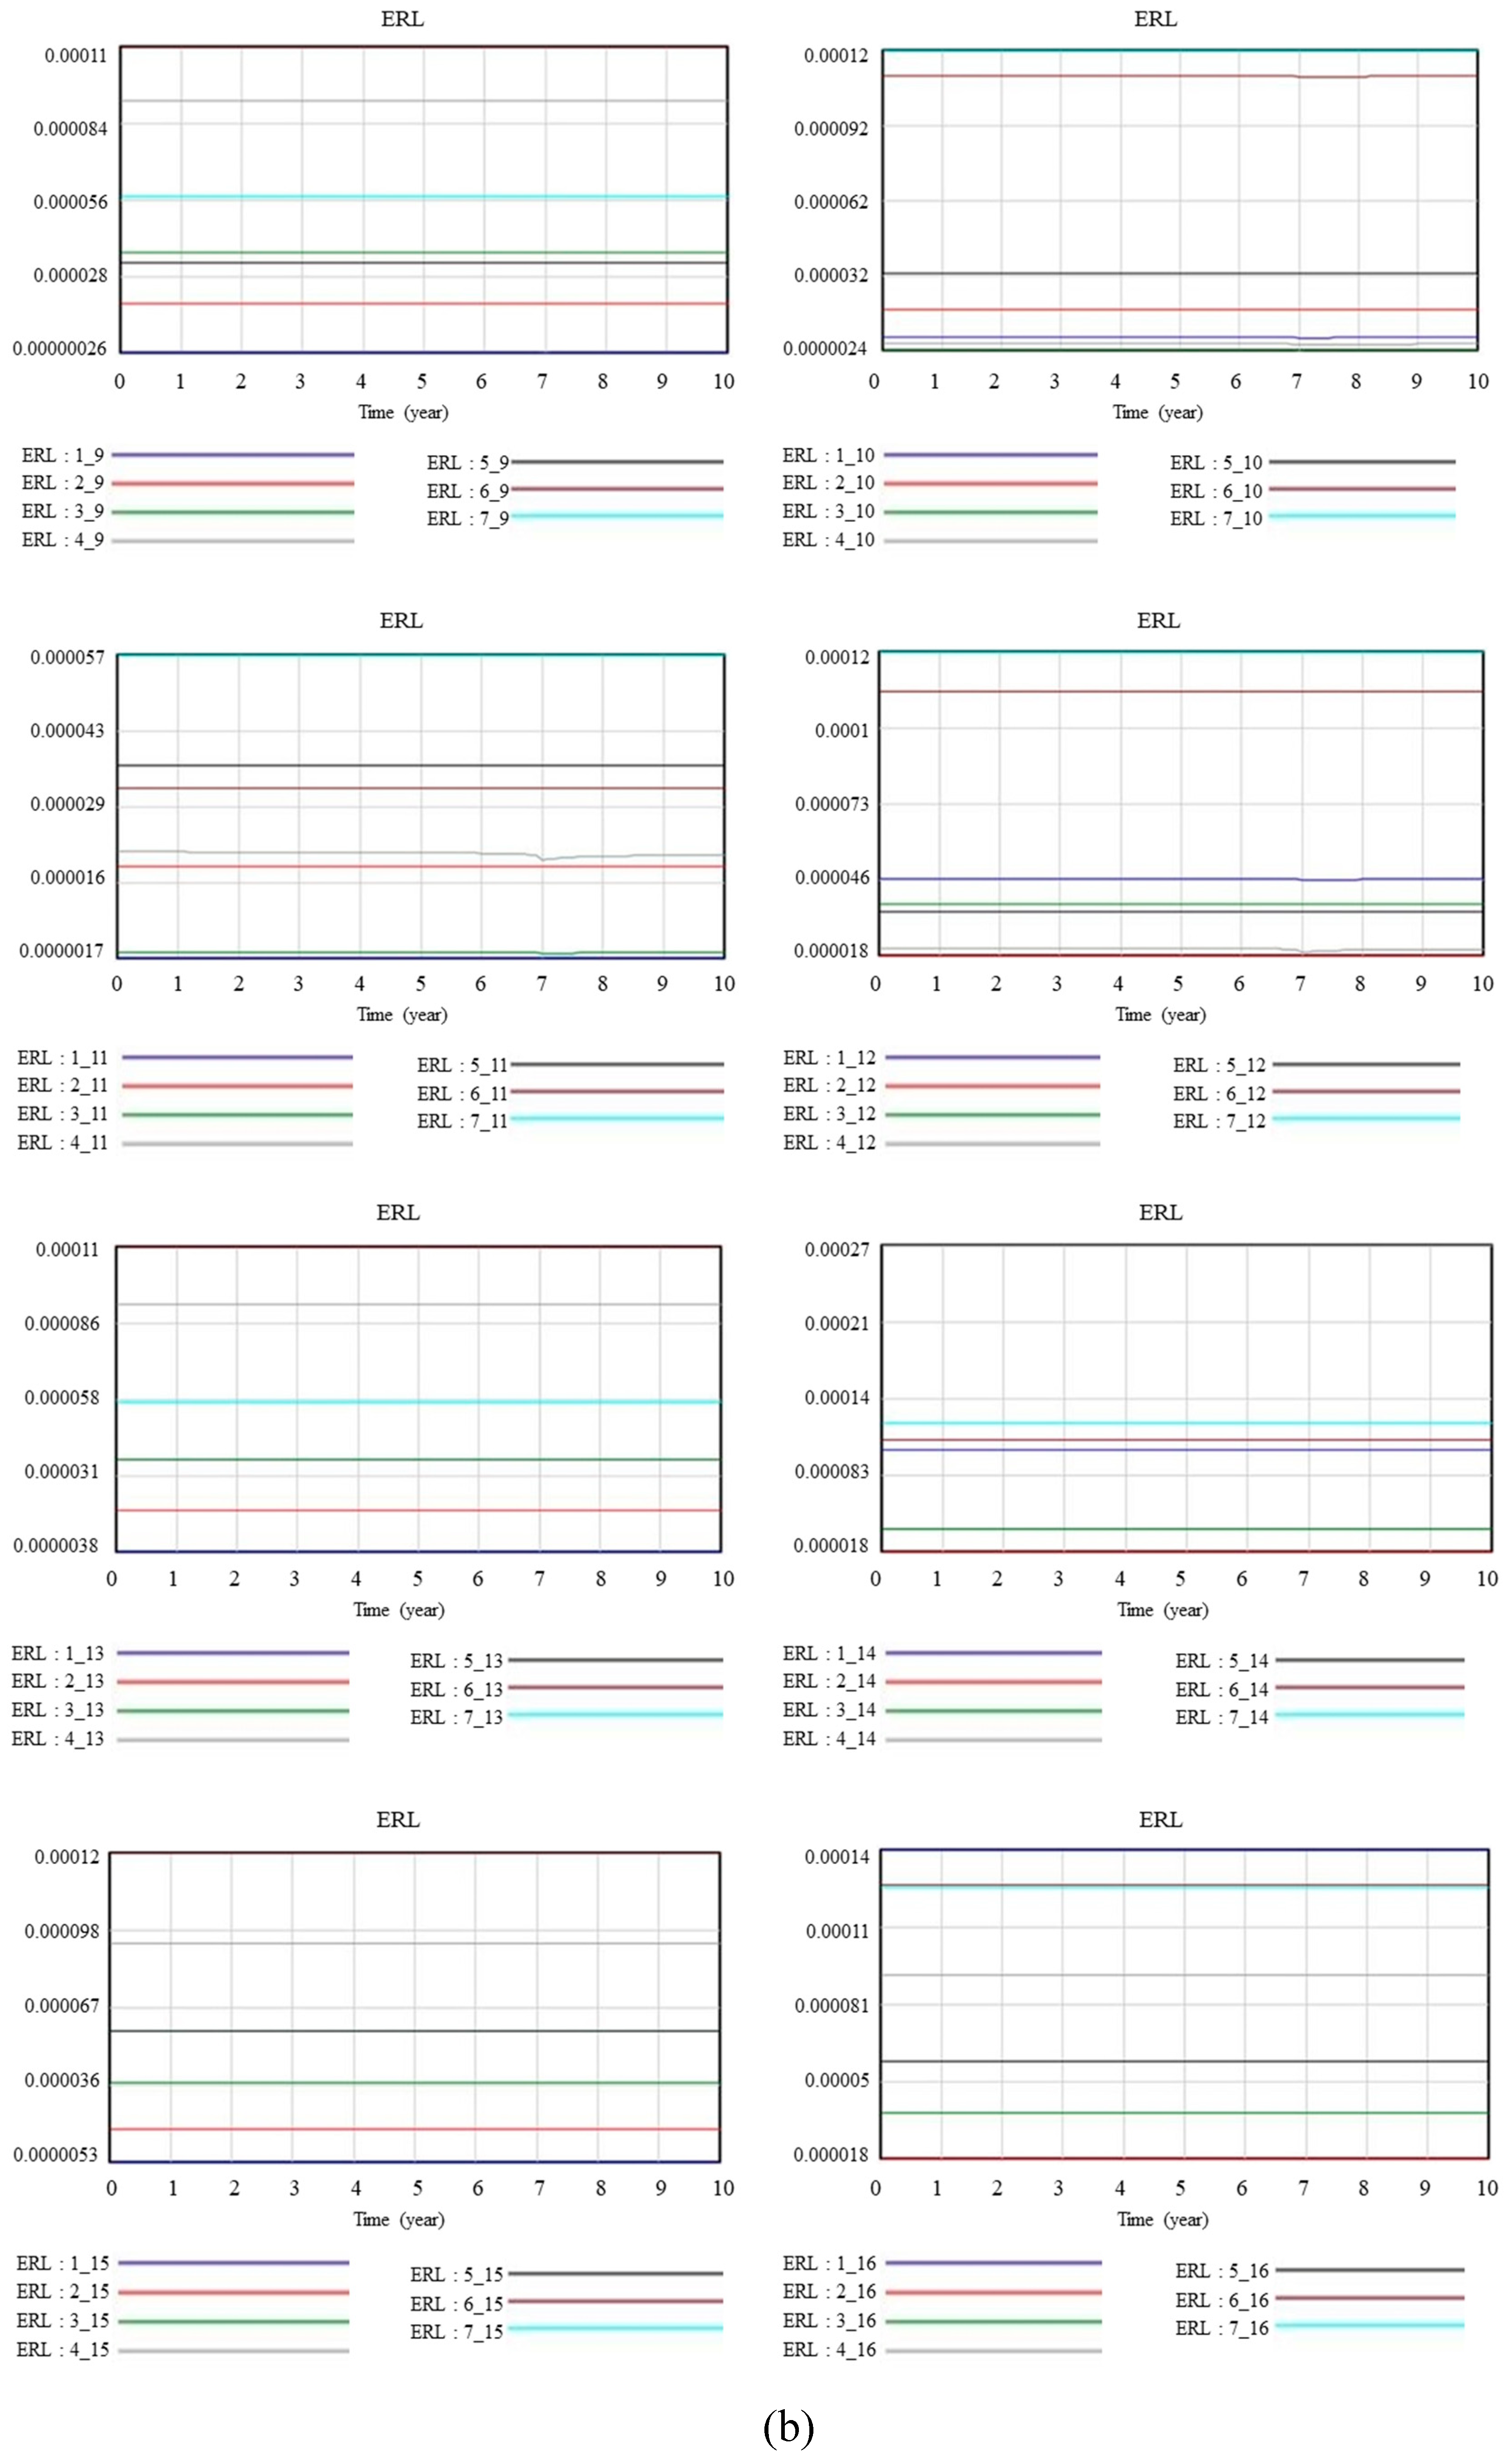
Figure 7a,b indicate the SD plots for ERL variations over time for each Trial Design (TD01-16) for case #1 to #7. The magnitude of the ERLs is different for different test cases and for different trial designs. It can be noted that the main trends in the ERL curves are maintained throughout all cases and determined by the HOE loop which the dynamic behaviour of the model is based on. Changes in ignition frequencies do not impact the evolution of the risk curve, although variations in absolute values are given. Dynamic risk variations are noticeable in the first 8 trial designs (TD01-08) with various active systems ON: in Year 6, risk levels improve due to improving safety measures from building management team peaking in year 7. Thereafter, lax safety behaviour is to be expected following the good outcome in the first six years, leading to risk levels increasing again. This behaviour is not as pronounced in Trial Designs TD09 to TD12 and is not present in TD13 to TD16 due to an absence of various active systems sensitive to HOEs. In summary, the high-level cycle, with its HOEs variables, is responsible for the dynamic risk curve behaviour while fire ignition frequency, building population, and consequences are parameters that impact only the absolute value of ERL at each time step.
5. Conclusions
The literature review suggests that it is necessary to adopt both technical and human organizational errors for realistic risk assessment of building design from a practical viewpoint. Furthermore, during the operational phase of the building, it is not reasonable to assume that the reliability of the fire equipment remains constant and its aging over time will need to be considered to derive more realistic risk assessment values. To address the literature gaps and follow the suggestions made by researchers in their studies, we developed a Technical-Human-Organizational Risk (T-H-O-Risk) methodology in [
12].
In this paper, our aim is to employ T-H-O-Risk methodology of [
12] to seven buildings in various geographical locations with different climatic conditions to assess and compare HOE risks due to fires in high-rise residential buildings. Particular focus is given to active fire safety systems in high-rise residential buildings by comparing the impact of HOEs on individual and/or combinations of active fire safety systems. This study breaks down the impact of HOEs on sprinklers, building occupant warning systems (BOWS), smoke detectors, and smoke control systems. For each of seven buildings (cases), 16 trial designs are considered. The building risk levels are compared to each other and against the absolute benchmark criteria to determine if they exceed the acceptable risk threshold. It is hypothesized that the ERL for each building design has different human and organizational scenarios based on either no HOEs or with HOEs-where organizational standards such as maintenance, safety culture, and emergency planning are determined to be low and human errors occur routinely. The quantification of difference in ERL for seven buildings for each of 16 trial designs is a novel aspect of this study.
The T-H-O-Risk model addresses the methodological gap in quantifying technical, human, and organizational risks and uncertainties in PRAs of high-rise residential buildings. To keep the study focused, we selected buildings in geographical locations with representative non-extreme climatic conditions of temperate, sub-tropical, and tropical zones and while we applied the BCA as the reference code for all seven cases, the T-H-O-Risk methodology can be applied to any other jurisdictions. The methodology incorporates HOEs by utilizing BN, while employing SD modelling to account for risk variations over time. Results are presented using multiple F-N curves encompassing ALARP criteria. Key outcomes are:
The influence of HOEs increases with the complexity of the system. The increase in ERL can reach 33% in a design with the full set of safety provisions while the simpler designs with only the sprinkler system have a +20% increase in the ERL.
HOEs have a significant risk impact on active safety systems with combinations of sprinklers. BOWS, smoke detectors, and smoke control systems. HOEs have limited or no impact on passive protection systems. Active systems require regular maintenance which increase the likelihood of human and organizational errors and increase in corresponding risk.
Strong positive correlation exists between the ratio HOE/ERL with the number of active systems. With one active system, the HOE values range from 8–13% and increased to 25–38% when all four active systems are present in the trial design.
For active systems, ERL values obtained from this study matches reasonably well with those obtained from the literature.
For all cases, trial design 1 which consists of all active systems results in the lowest ERL, but this design is also most influenced by HOEs.
Tenability conditions remain infinite for corridors having natural ventilation.
Case #7 has the highest overall risk on account of the sole stairwell and low tenability due to the corridors filling up with smoke rapidly.
The F-N curve with HOE is at a higher level than without HOE case indicating that risks increased with HOEs.
SD uncertainty modelling indicates large variations in reliability and risk levels of active systems due to the influence on HOEs over time. The results show the effect of perceived safety on the building management team. There is an initial period (0 to 5 years) in which the reliability declines slowly, thus causing the number of accidents to increase.
The reliability of active components gradually decreases with time and at about 5–7 years, there is a need to carry out maintenance activities.
It can be noted that the effect of the variations on the input variable deploy only after an initial period in which the input has no influence on the reliability outcome. This can be explained by the dynamic character of the high-level loop.
Prior studies provide estimated effects of HOEs on risk in other industries such as nuclear plans and offshore oil platforms, and estimated effects of technical factors only on risks during a fire event in high-rise buildings, but existing literature does not address or quantify the impact of HOEs on risks during fire events in high-rise buildings. The T-H-O-Risk approach demonstrates how technical, human, and organizational risks can be quantified in a comprehensive probabilistic framework for high-rise residential buildings and is an important contribution to the development of the next generation building codes and risk assessment methods.
Future work will focus on simplifying the model for wider applications to other building occupancies as well as on expanding the sensitivity and uncertainty analysis. In addition, cost-benefit analysis (CBA) should be carried out. The application of the model to the reliability of other safety systems is a further area of development. Another area is the research for other HOE variables applicable to the building sector.


