Article

Texture Evolution and Control of 2524 Aluminum Alloy and Its Effect on Fatigue Crack Propagation Behavior

1
Hunan Engineering Research Center of Forming Technology and Damage Resistance Evaluation for High Efficiency Light Alloy Components, Hunan University of Science and Technology, Xiangtan 411201, China
2
Hunan Provincial Key Laboratory of New Energy Storage and Conversion of Advanced Materials, Hunan University of Science and Technology, Xiangtan 411201, China
3
School of Materials Science and Engineering, Central South University, Changsha 410083, China
*
Authors to whom correspondence should be addressed.
Submission received: 9 May 2021 / Revised: 3 June 2021 / Accepted: 7 June 2021 / Published: 15 June 2021
(This article belongs to the Special Issue Advanced Structure Materials and Processing)

Abstract

:
The influences of cold rolling and subsequent heat treatment on the microstructure evolution of 2524 alloy were investigated using an orientation distribution function (ODF) and electron back-scattered diffraction (EBSD). A preparation method of 2524-T3 aluminum alloy with a strong Brass texture was developed, and its effect on the fatigue properties of the alloy was investigated using scanning electron microscopy (SEM) and transmission electron microscopy (TEM). The results show that with the increase in cold rolling deformation from 0% to 80%, the volume fractions of Brass, copper, and S textures in the 2524-T3 alloy also increase, especially in the case of Brass and S textures. However, the volume fractions of cube and Goss textures are reduced significantly, especially for cube textures, which are decreased by 57.4%. Reducing coarse second-phase particles (CSPs) is conducive to the formation of a strong deformation texture during cold rolling. A 10% deformation at each rolling pass, followed by a step annealing, helps the preservation of a Brass texture even after solution treatment at 500 °C for 0.5 h, while a large cold deformation followed by high-temperature annealing helps the formation of a strong cube texture. The Brass texture can enhance the strength while decreasing the fatigue crack growth resistance of this alloy.

1. Introduction

2524 aluminum alloy has been widely used in aircraft as a fuselage and wing skin material, due to its good mechanical properties and excellent fracture toughness [1,2,3]. Fatigue damage poses the main threat to the service safety of 2524 aluminum alloy components [4,5]. It is well known that the fatigue behavior of alloy depends on its microstructure, making it necessary to reveal the relationships between the microstructure and fatigue properties of 2524 aluminum alloy, as well as methods of controlling the microstructure thereof.
To assess the effects of different microstructure characteristics on the fatigue properties of aluminum alloy, much research has been conducted, as summarized herein.
Regarding inclusions, in aluminum alloys, inclusions are omnipresent and may cause severe local stress concentration and crack initiation during fatigue-inducing processes [6]. Reducing inclusions is believed to be an effective way of enhancing the fatigue properties of aluminum alloy [7]. Generally, high-purity raw materials are used for high damage-tolerant aluminum alloys to minimize the adverse effects of inclusions; purifying raw materials will also increase their cost, and the efficacy thereof diminishes once the purity reaches a certain level [8].
Regarding precipitates, those formed during artificial aging can improve the mechanical properties of age-hardened aluminum alloys and can thereby inhibit fatigue crack initiation. Meanwhile, precipitation may also promote the formation of CSPs or a precipitate-free zone (PFZ) along grain boundaries, which provide potential nucleation sites for fatigue cracking [9,10]; therefore, many high damage-tolerant aluminum alloys are treated as if in a natural aging state (T3 temper) to avoid the adverse effects of precipitation on resistance to fatigue crack growth.
Regarding grain size, grain refinement can strengthen aluminum alloys and therefore improve the fatigue lives thereof under stress-controlled conditions [11]. However, under strain-controlled fatigue, grain refinement decreases the fatigue life due to the fatigue-induced shear bands caused by cyclic softening [12]. In addition, many studies have proved that an increase in grain size would decrease the fatigue crack growth rate (FCGR) of an alloy, especially at a low stress intensity factor range (ΔK) [13].
Based on this analysis, there are certain limits to this method of controlling microstructures such as inclusions, precipitates, and grain size to enhance the fatigue growth resistance of aluminum alloys.
Recent studies indicate that the texture of an aluminum alloy could also affect its fatigue properties. More than five-fold differences have been found in FCGRs between aluminum alloy samples loaded in different directions [14,15]. This might be related to the textural change caused by the variation of loading direction, since there are significant differences in the fatigue propagation behavior as the crack passes through grains with different orientations [16,17]. It was demonstrated that some typical textures in aluminum alloy plate, such as Goss ({110} <001>) [18], cube ({001} <100>) [19], S ({123} <634>) [20] and Brass ({011} <001>) [21] textures have a significant effect on the FCGRs. Wu et al. [22] investigated the fatigue crack propagation behavior of an Al-Cu-Mg alloy, finding that there is a slight decrease in FCGR as the crack propagates the Goss-orientated ({110} <001>) [18] grains, and the fatigue crack is prone to deflect when it goes through the cube-orientated ({001} <100>) [19] grains. Liu et al. [23] found that the Goss texture can reduce the FCGR of aluminum alloys, whereas Wen [20] showed that the S ({123} <634>) texture has a strong inhibitory effect on the fatigue crack growth of the alloy.
Although many studies have been conducted, the relationships between textures and the fatigue properties of aluminum alloy remain unclear. In addition, there is still a lack of effective methods available to control the texture during the fabrication of wrought aluminum alloy. It is known that a high damage-tolerant aluminum alloy is always chosen with a T3 temper to minimize the adverse effect of inclusions, while, during the solution treatment of T3, the texture characteristics, especially deformation textures, would be totally switched due to the inevitable recovery and recrystallization at such high temperatures [24,25].
The aim of this study is to reveal the effect of texture on the fatigue properties of 2524-T3 aluminum alloy. Here, the texture evolutions of 2524-T3 aluminum alloy during cold rolling and heat treatments were revealed, and a method for the preparation of 2524-T3 aluminum alloy with a strong deformation texture (i.e., a Brass texture) was developed. In addition, the effects of this Brass texture on the fatigue crack propagation behavior of alloy were assessed by the use of an orientation distribution function (ODF), electron back-scattered diffraction (EBSD), and transmission electron microscope (TEM).

2. Experimental Work

2.1. Materials

The raw materials used in this study are 6.0-mm-thick hot-rolled 2524-T3 aluminum alloy plates with a 100-μm-thick cladding layer, provided by Southwest Aluminum Co., Ltd. (Chongqing, China). Its chemical composition is as follows: 4.2% Cu, 1.41% Mg, 0.56% Mn, 0.08% Fe, 0.06% Si, with Al accounting for the remainder (all wt %).

2.2. Cold Rolling and Heat Treatment

The cold rolling was performed using 270-mm diameter rollers operating at 30 rpm. The deformation was controlled by measuring the thickness of each pass before and after rolling. The annealing and solution treatments were carried out using an air circulation oven (WGZ-9040B, ± 2 °C). Differential scanning calorimetry (DSC) analysis was undertaken to identify the recrystallization temperatures of the alloy, using a universal V4.1-TA instrument. DSC runs from 250 °C to 500 °C were conducted at a constant rate of heating of 10 °C/min.

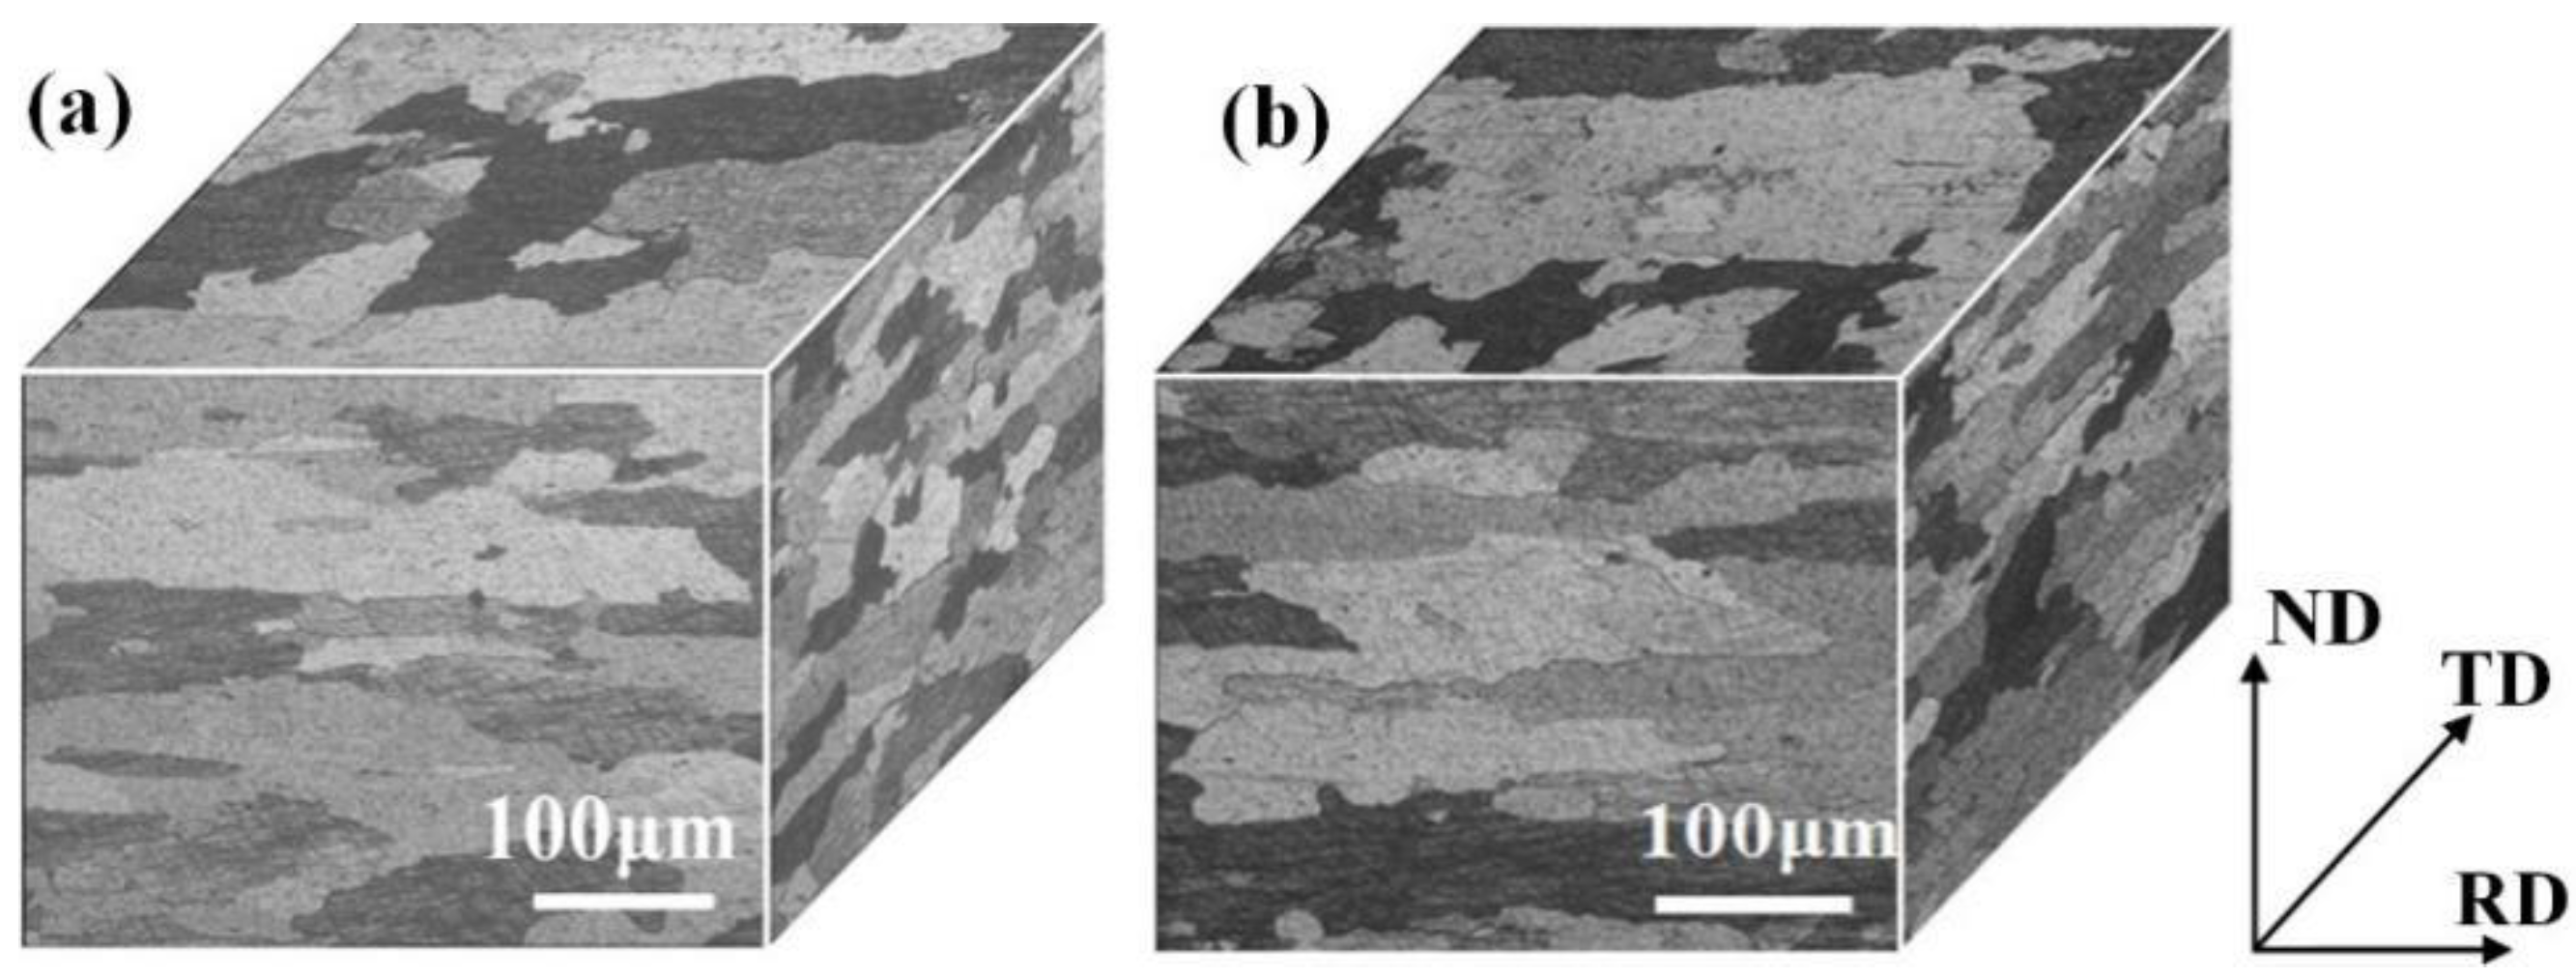
2.3. Microstructural Analysis

Optical microscopy (OM) samples were prepared in a standard procedure and etched in a solution consisting of HF (2 mL), HCl (3 mL), HNO3 (5 mL), and H2O (200 mL) for 15 s (after [26]), and were observed using an MR5000 inverted optical microscope.
The textures were determined using a Bruker D8 Discover X-ray system (at 40 kV, and 40 mA, using Cu Kα radiation). The ODF was calculated using {111}, {110}, and {200} pole figures, performed at α (5° to 85°) and β (0° to 360°).
SEM observation was conducted using a Quanta-200 environmental SEM equipped with EDAX Genesis (EDS) to evaluate the distribution of CSPs in the alloy. EBSD data acquisition was conducted on a JSM-5600L field emission scanning electron microscope equipped with EBSD detection system. After data acquisition, the collected data were analyzed using HKL Channel 5 software. The samples used for EBSD analysis were prepared by electrochemical polishing, using an electrolyte consisting of a nitric acid and methanol solution (1:3) at −20 °C using a working voltage of 20 V and a current of 0.5 A, for a polishing time of 40 s.
To reveal the evolution of dislocations, TEM observations were conducted using a Tecnai G2 F20 TEM with an accelerating voltage of 200 kV. The TEM samples were mechanically ground to a surface roughness of about 0.1 mm. Electrolytical polishing was then undertaken using a solution of 25% nitric acid and 75% methanol at −25 °C and 20 V for 60 s (after [27]).

3. Results and Discussion

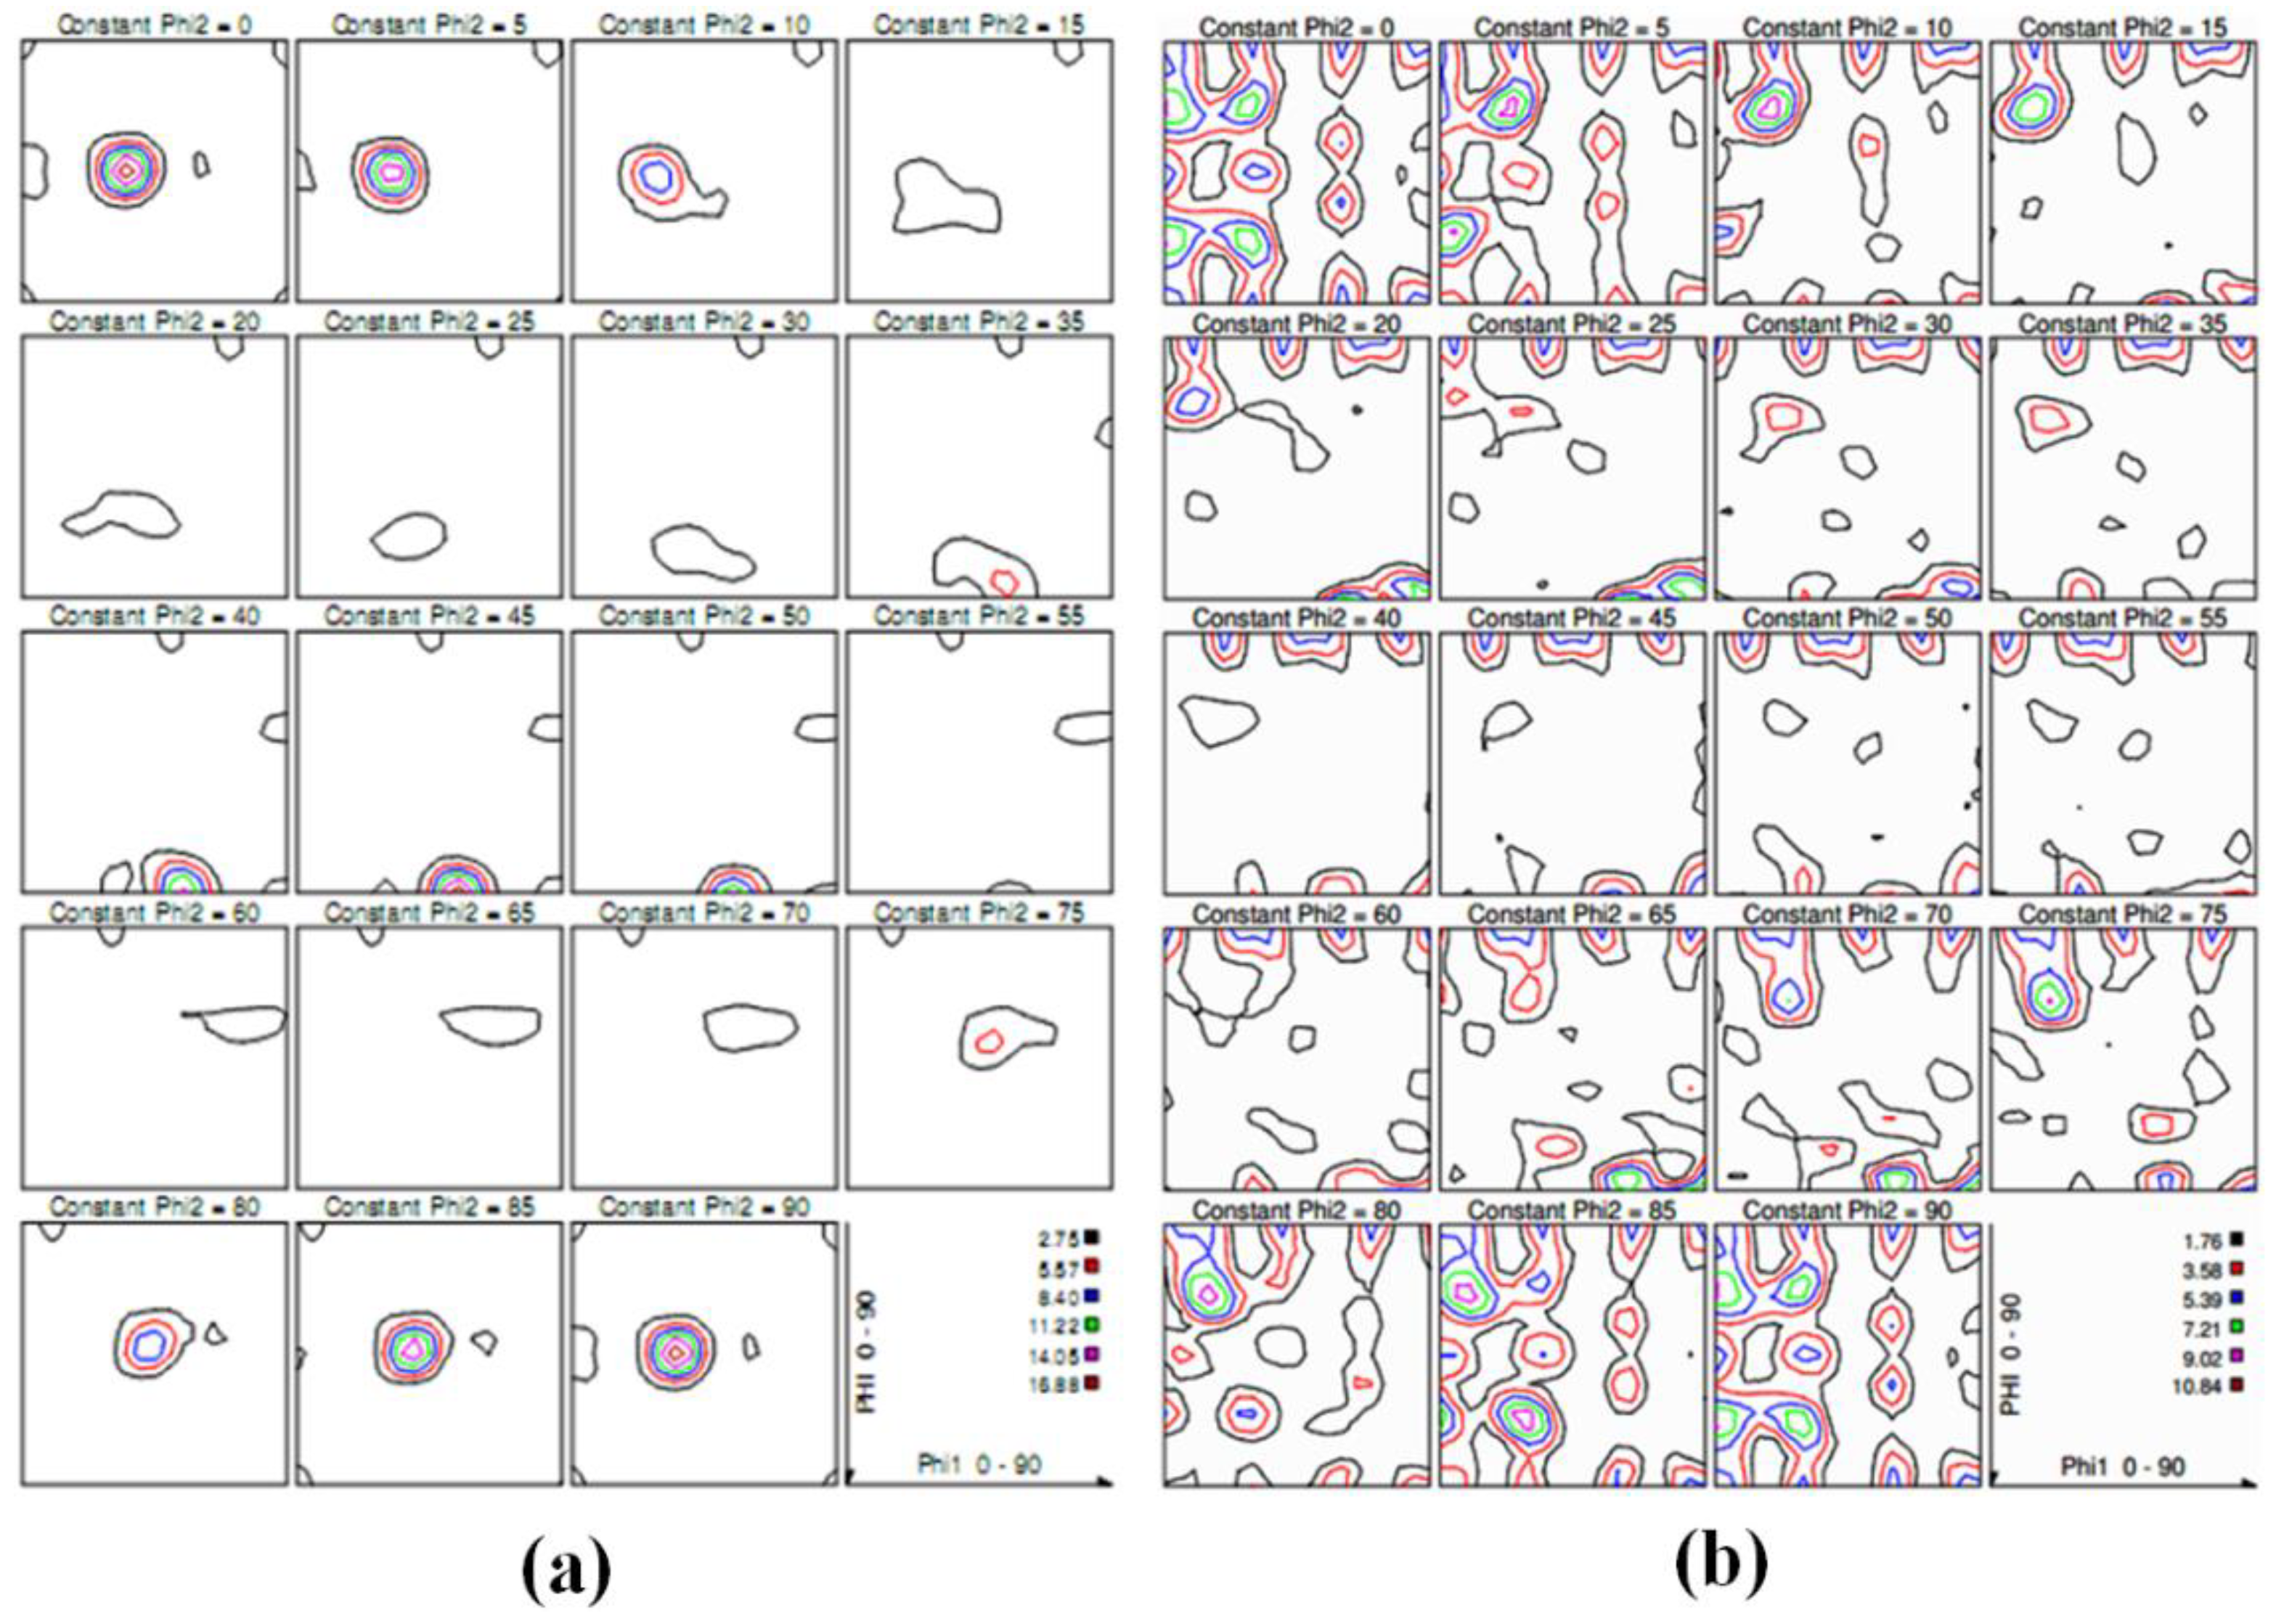
3.1. Texture Evolution of Alloy during Cold Rolling

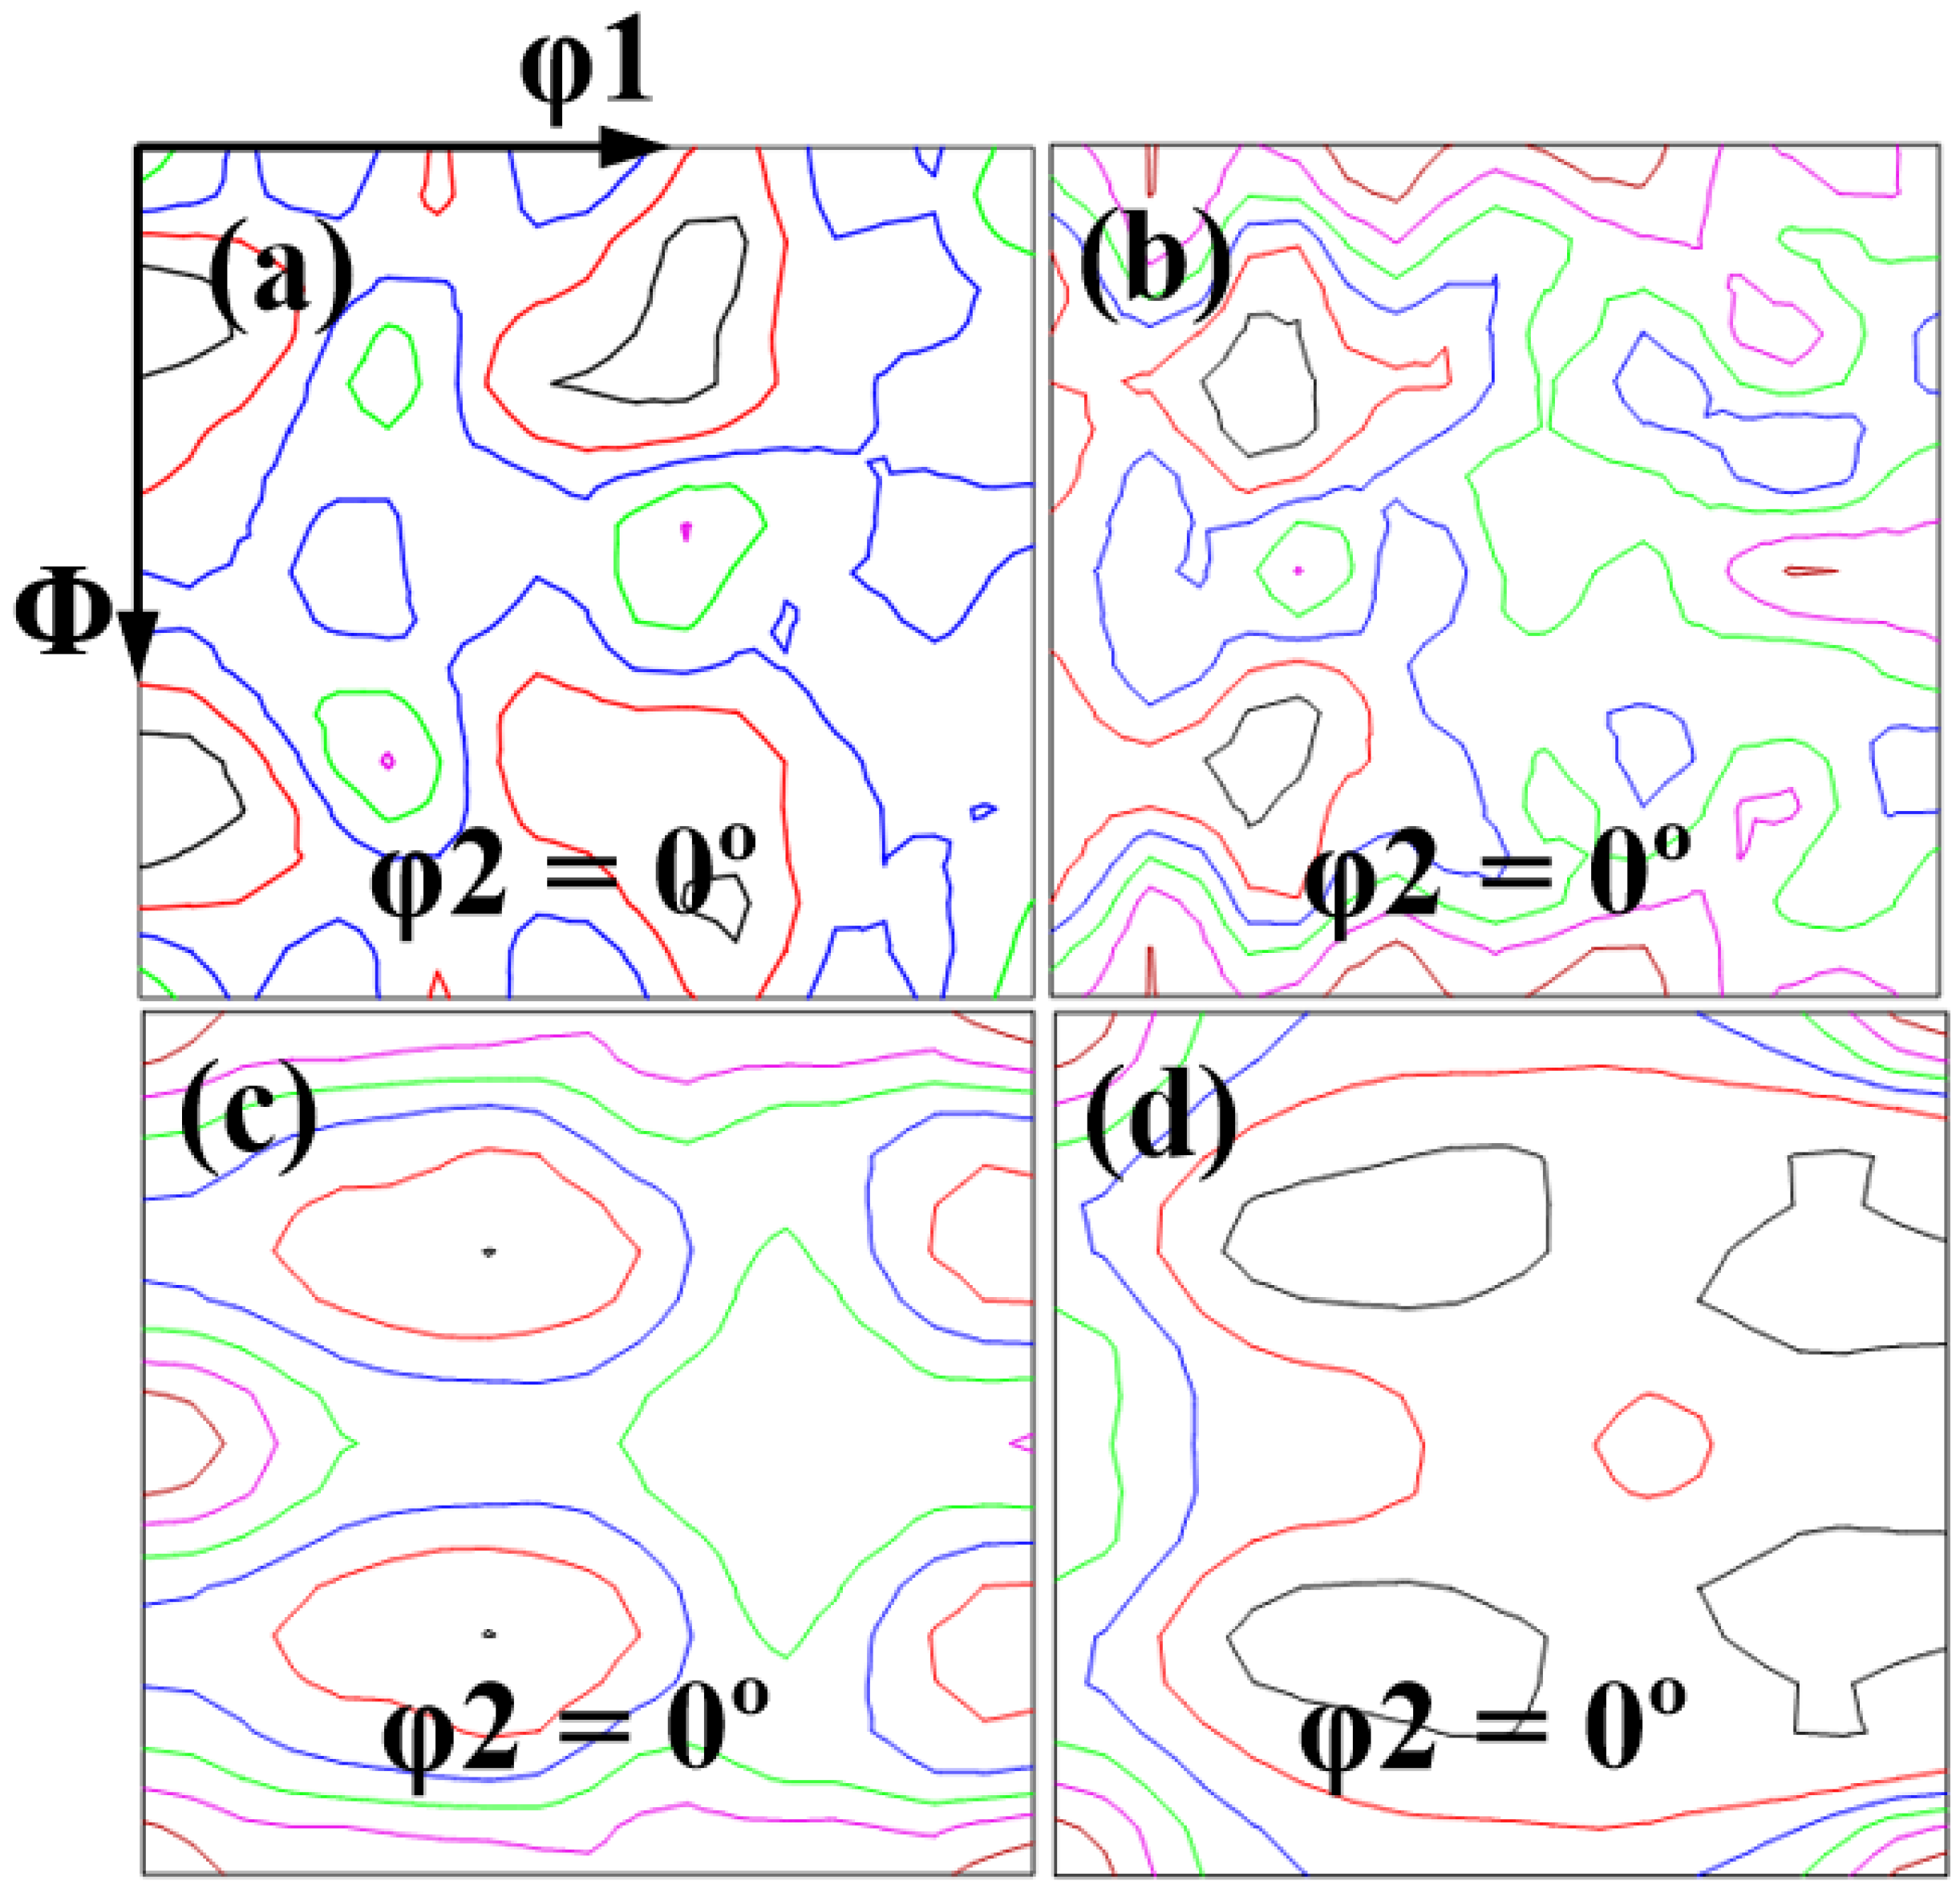
3.1.1. The Deformation Effect

The EBSD-derived inverse pole-figure (IPF) maps of the as-hot-rolled sample in Figure 1a identify the orientation of grains using different colors. The grains of the as-hot-rolled plate are significantly elongated along the rolling direction (RD), for which the grain aspect ratio (i.e., grain length divided by grain width) is found to be 5.56. In addition, there are many sub-grains with small orientation differences within the grains. Figure 1b shows the pole figures of <001>Al, <011>Al and <111>Al. It has a good match with the findings of Zhao et al. [28] that there are a certain number of deformation textures present in such hot-rolled alloy specimens.
To determine the volume fraction of each texture component, the samples after different deformations (i.e., 10%, 40%, and 80%) were detected by XRD, and the ϕ2 = 0° ODF sections are illustrated in Figure 2.
The spatial distribution of grains with different orientations can be expressed by ODFs, and the volume fraction of grains with different orientations can be quantified (for deviation angles ≤20°), as listed in Table 1. Brass ({011} <211>), S, and cube textures are the main types of texture present in the as-hot-rolled sample, of which the volume fractions are 12.56%, 9.68%, and 8.57% respectively. There are also certain amounts of copper (5.87%) and Goss textures (4.44%) present. With the increase in deformation from 0% to 80%, the volume fractions of Brass, copper ({112} <111>), and S textures increase, especially for Brass and S textures, which increase from 12.56% to 25.65%, and from 9.68% to 19.36%, respectively (the amounts of cube and Goss textures decrease).
Figure 3 shows the EBSD-derived IPF maps of the as-hot-rolled sample after 10%, 40%, and 80% cold deformation (Figure 3a–c), respectively. Brass, S, and cube textures were set into individual subsets, so that the evolution of each texture during cold deformation can be observed independently. With increasing deformation, all grains gradually fracture into small sub-grains. In addition, the area occupied by cube-orientated grains decreases significantly, and breaks into many small grains as the deformation reaches 80%, while those of S-orientated and Brass-orientated grains can increase.
Figure 4 shows TEM images and corresponding selected-area diffraction patterns (SADPs) of the hot-rolled alloy after cold rolling deformation of 10%, 40%, 80%, and 90%, respectively. As shown in Figure 4a, after 10% deformation, many dislocations are present within the alloy matrix. These dislocations entangle with each other, forming a dislocation net. After 40% deformation (Figure 4b), many cellular structures with a high dislocation density appear. The dislocation density in the cellular structure increases upon deformation, and the size of each defect is also significantly refined, as shown in Figure 4c,d. In addition, it can be seen from the SADPs that the circular diffraction spots in the alloy gradually evolve into an arc shape, and then into a ring shape with increasing deformation. This indicates that the number of sub-grains and their orientation differences increase upon deformation.

3.1.2. CSP Effects

Figure 5 demonstrates the back-scattered electron (BSE) images of the as-hot-rolled 2524 alloy. There are many CSPs with a size ranging from 5 to 30 μm arranged along the RD of the sample (Figure 5a). According to EDS analysis, these CSPs mainly include S(Al2CuMg) (Figure 5b) and AlCuFeMn phases (Figure 5c), which are the main inclusions present in this alloy [8,29].
To assess the effect of second-phase particles on the deformation characteristics of alloy, the RD-ND plane of the sample was polished on which some straight scratches were preserved deliberately so that the local deformation behavior of the region near CSPs can be determined by comparing the changes in the shape of these scratches before and after cold rolling.
Figure 6 shows the SEM images of the RD-ND plane of the sample after 10% cold rolling. As shown in Figure 6a,b, deflections (~18°) and displacements of the scratches can frequently be observed as they cross the interface between the CSPs and alloy matrix. This indicates that significant deformation discontinuities are present in the local region near the CSPs, given the aforementioned discontinuity of deformation: this leads to significant stress concentration in the near-CSP region, causing crack initiation at the interface of the CSPs (Figure 6c) and the fracture thereof (Figure 6d).
Figure 7 shows TEM images of the region near an AlCuFeMn-phase particle in the sample after 80% cold rolling. It indicates that a high density of dislocations evolves to form many cellular structures caused by the great deformation. Compared with Figure 7a,b, the sizes of the cellular structures are shown to be smaller in the matrix adjacent to the interface of the particle than those only ~3 μm from the interface. As the wall of this cellular structure comprises a high density of dislocations, it is believed that the smaller the cellular structure, the higher the dislocation density.
According to the theory of plastic deformation [30], the relationship between dislocation density (ρ) and strain (ε) of an alloy is given by:
d ε = b g β   .   d ρ ρ 1 2
where b is the Burgers vector, and g and β represent constants. There is a more serious strain at the region closer to the CSPs, as it has a higher dislocation density. This is mainly because many dislocations are blocked and accumulated at the interface of CSPs during cold rolling. This phenomenon will undoubtedly aggravate the non-uniformity of deformation in certain areas.
To reveal the effect of CSPs on the texture evolution of alloy during cold rolling, the hot-rolled alloy samples were pre-annealed at 495 °C for 2 h so that most CSPs were dissolved into the alloy matrix, and their volume fractions of textures after different deformations were compared with those without pre-annealing (Figure 2).
Figure 8 shows the sections (φ = 0°) of ODFs of pre-annealed samples after different amounts of deformation (i.e., 10%, 40%, and 80%). Their volume fractions of different textures were also calculated quantitatively (deviation angle ≤20°), as listed in Table 2. This indicates that, as is consistent with the results in Figure 2 and Table 1, the volume fractions of cube and Goss textures in the pre-annealed alloy decrease, and those of Brass and S textures increase significantly upon deformation, whereas, at the same deformation of 80%, the volume fractions of Brass and S textures in pre-annealed samples are 37.54% and 25.78%, respectively (Table 2). These are much greater than those without pre-annealing (25.65% and 19.36%, respectively (Table 1)); reducing the CSPs increases the amounts of deformation textures (such as Brass and S forms). This might be due to minimizing the discontinuity of deformation during cold rolling, caused by the CSPs.

3.2. Texture Evolution of Alloy during Annealing

3.2.1. CSP Effects

The pre-annealed samples were cold rolled to 10%, 40%, 60%, and 80%, respectively, then tested by DSC. As shown in Figure 9, the onset of the major exothermic peak in DSC occurs at ~350 °C in the 10% deformed sample, and the peak in the exothermic event occurs at 379.7 °C. The stored energy released during the major exothermic event is believed to be due to the recrystallization of the cold-rolled sample [31]. This exothermic peak gradually shifts to a lower temperature, and its height increases significantly with increasing deformation, then shifts to 364.1 °C for the sample after 80% cold rolling. This is probably due to the increase in stored energy caused by cold rolling.
Figure 10 shows the ϕ2 = 0° ODF sections of samples after different cold rolling and annealing treatments at 470 °C for 0.5 h. Their volume fractions of different textures were also calculated quantitatively (deviation angle ≤20°), as listed in Table 3. This shows that the volume fraction of cube texture in the 10% deformed sample is only 8.2% after annealing, while the volume fraction thereof in the 80% deformed alloy reaches 20.8% after annealing. This indicates that the cold deformation exerts a significant influence on the evolution of the cube texture during subsequent annealing.

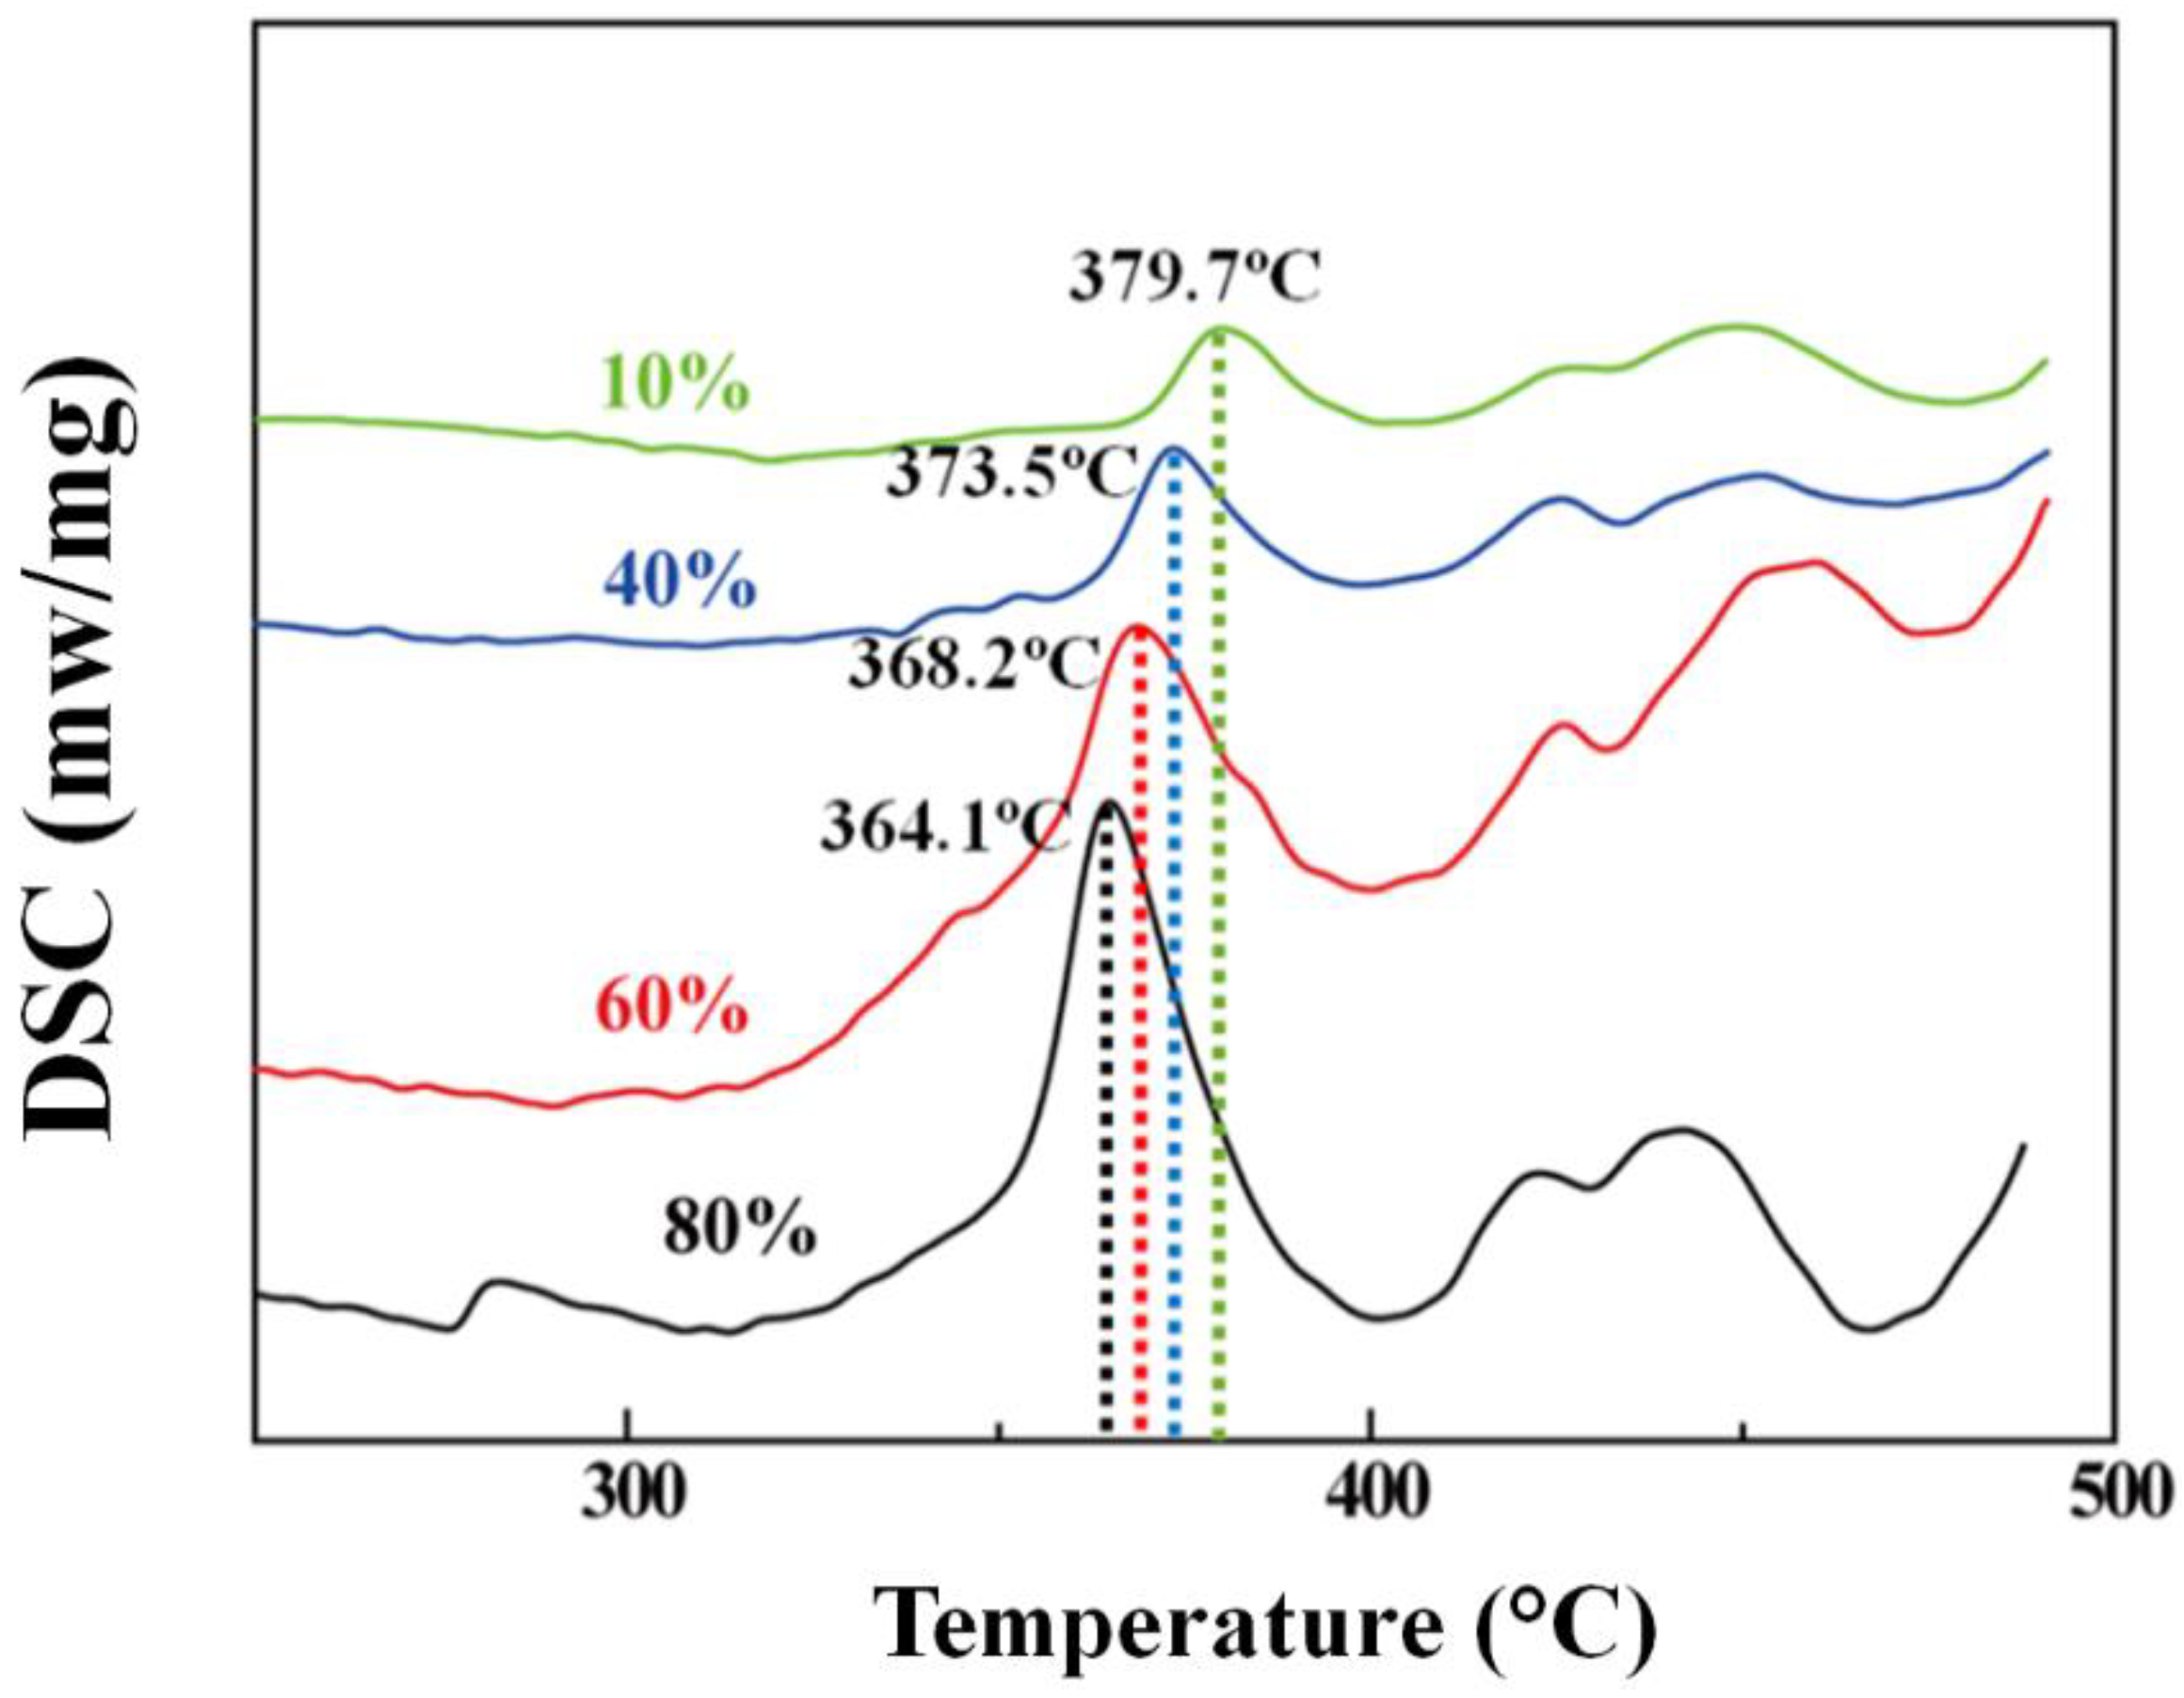
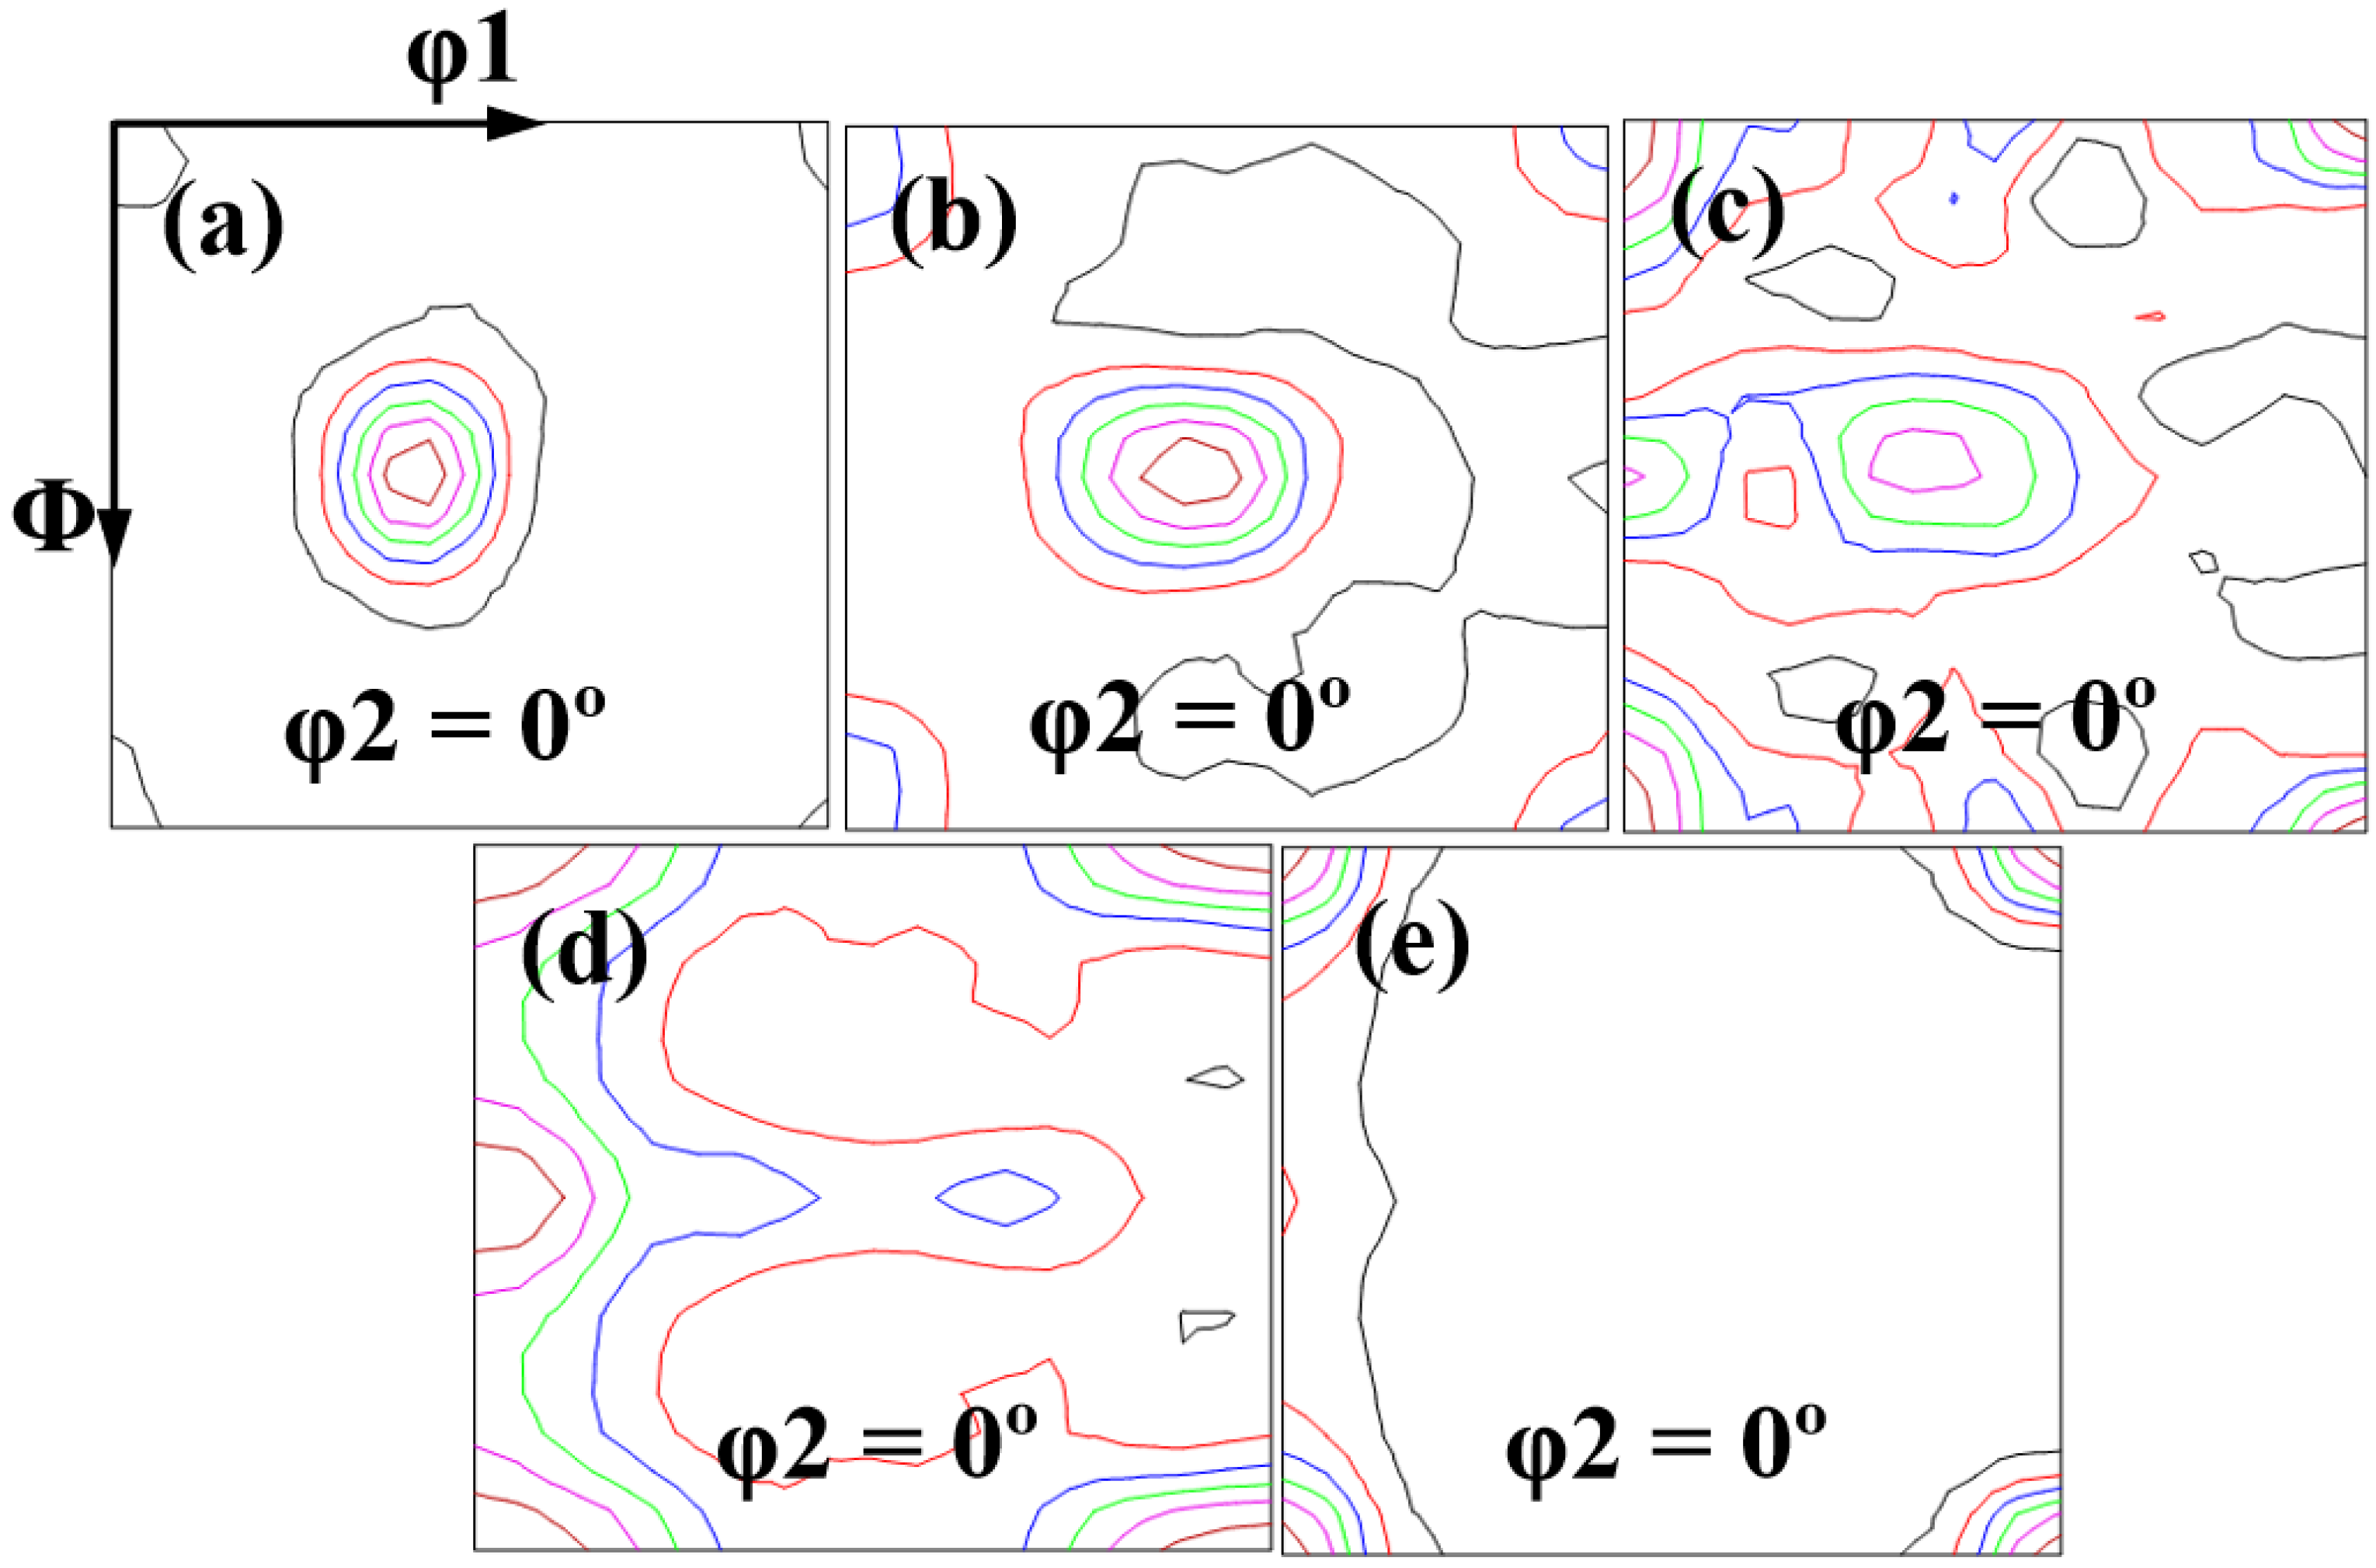
3.2.2. Annealing Temperature Effect

Figure 11 shows the ϕ2 = 0° ODF sections of 80% cold-rolled samples after different annealing treatments. The texture change is minor after annealing at 330 °C for 0.5 h (Figure 11a,b). When the annealing temperature reached 380 °C (Figure 11c), and then exceeded 420 °C (Figure 11d,e) significant changes occurred. With increasing annealing temperature, the amounts of Brass, copper, and S textures decreased (especially Brass and S textures, Table 4), while the amounts of cube and Goss textures increased with increasing temperature (especially that of the cube texture, of which the volume fraction increased from 2.82% to 36.53% after annealing at 470 °C for 0.5 h).
Figure 12a–c shows the EBSD-derived inverse pole figure (IPF) images of 80% cold-rolled samples, annealed at different temperatures for 0.5 h. There are several equiaxed recrystallized grains with sizes of 5–10 μm when the samples are annealed at 330 °C for 0.5 h (Figure 12a). With the increase in temperature, the recrystallized grains grow (Figure 12b,c). Figure 12d–f demonstrates the cube-orientated grains extracted from Figure 12a–c, respectively. Agreeing with the results in Figure 11, most of these recrystallized grains show a cube-like orientation, and, with the increase in temperature, cube-orientated grains grow faster and are thus much larger than grains with other orientations.

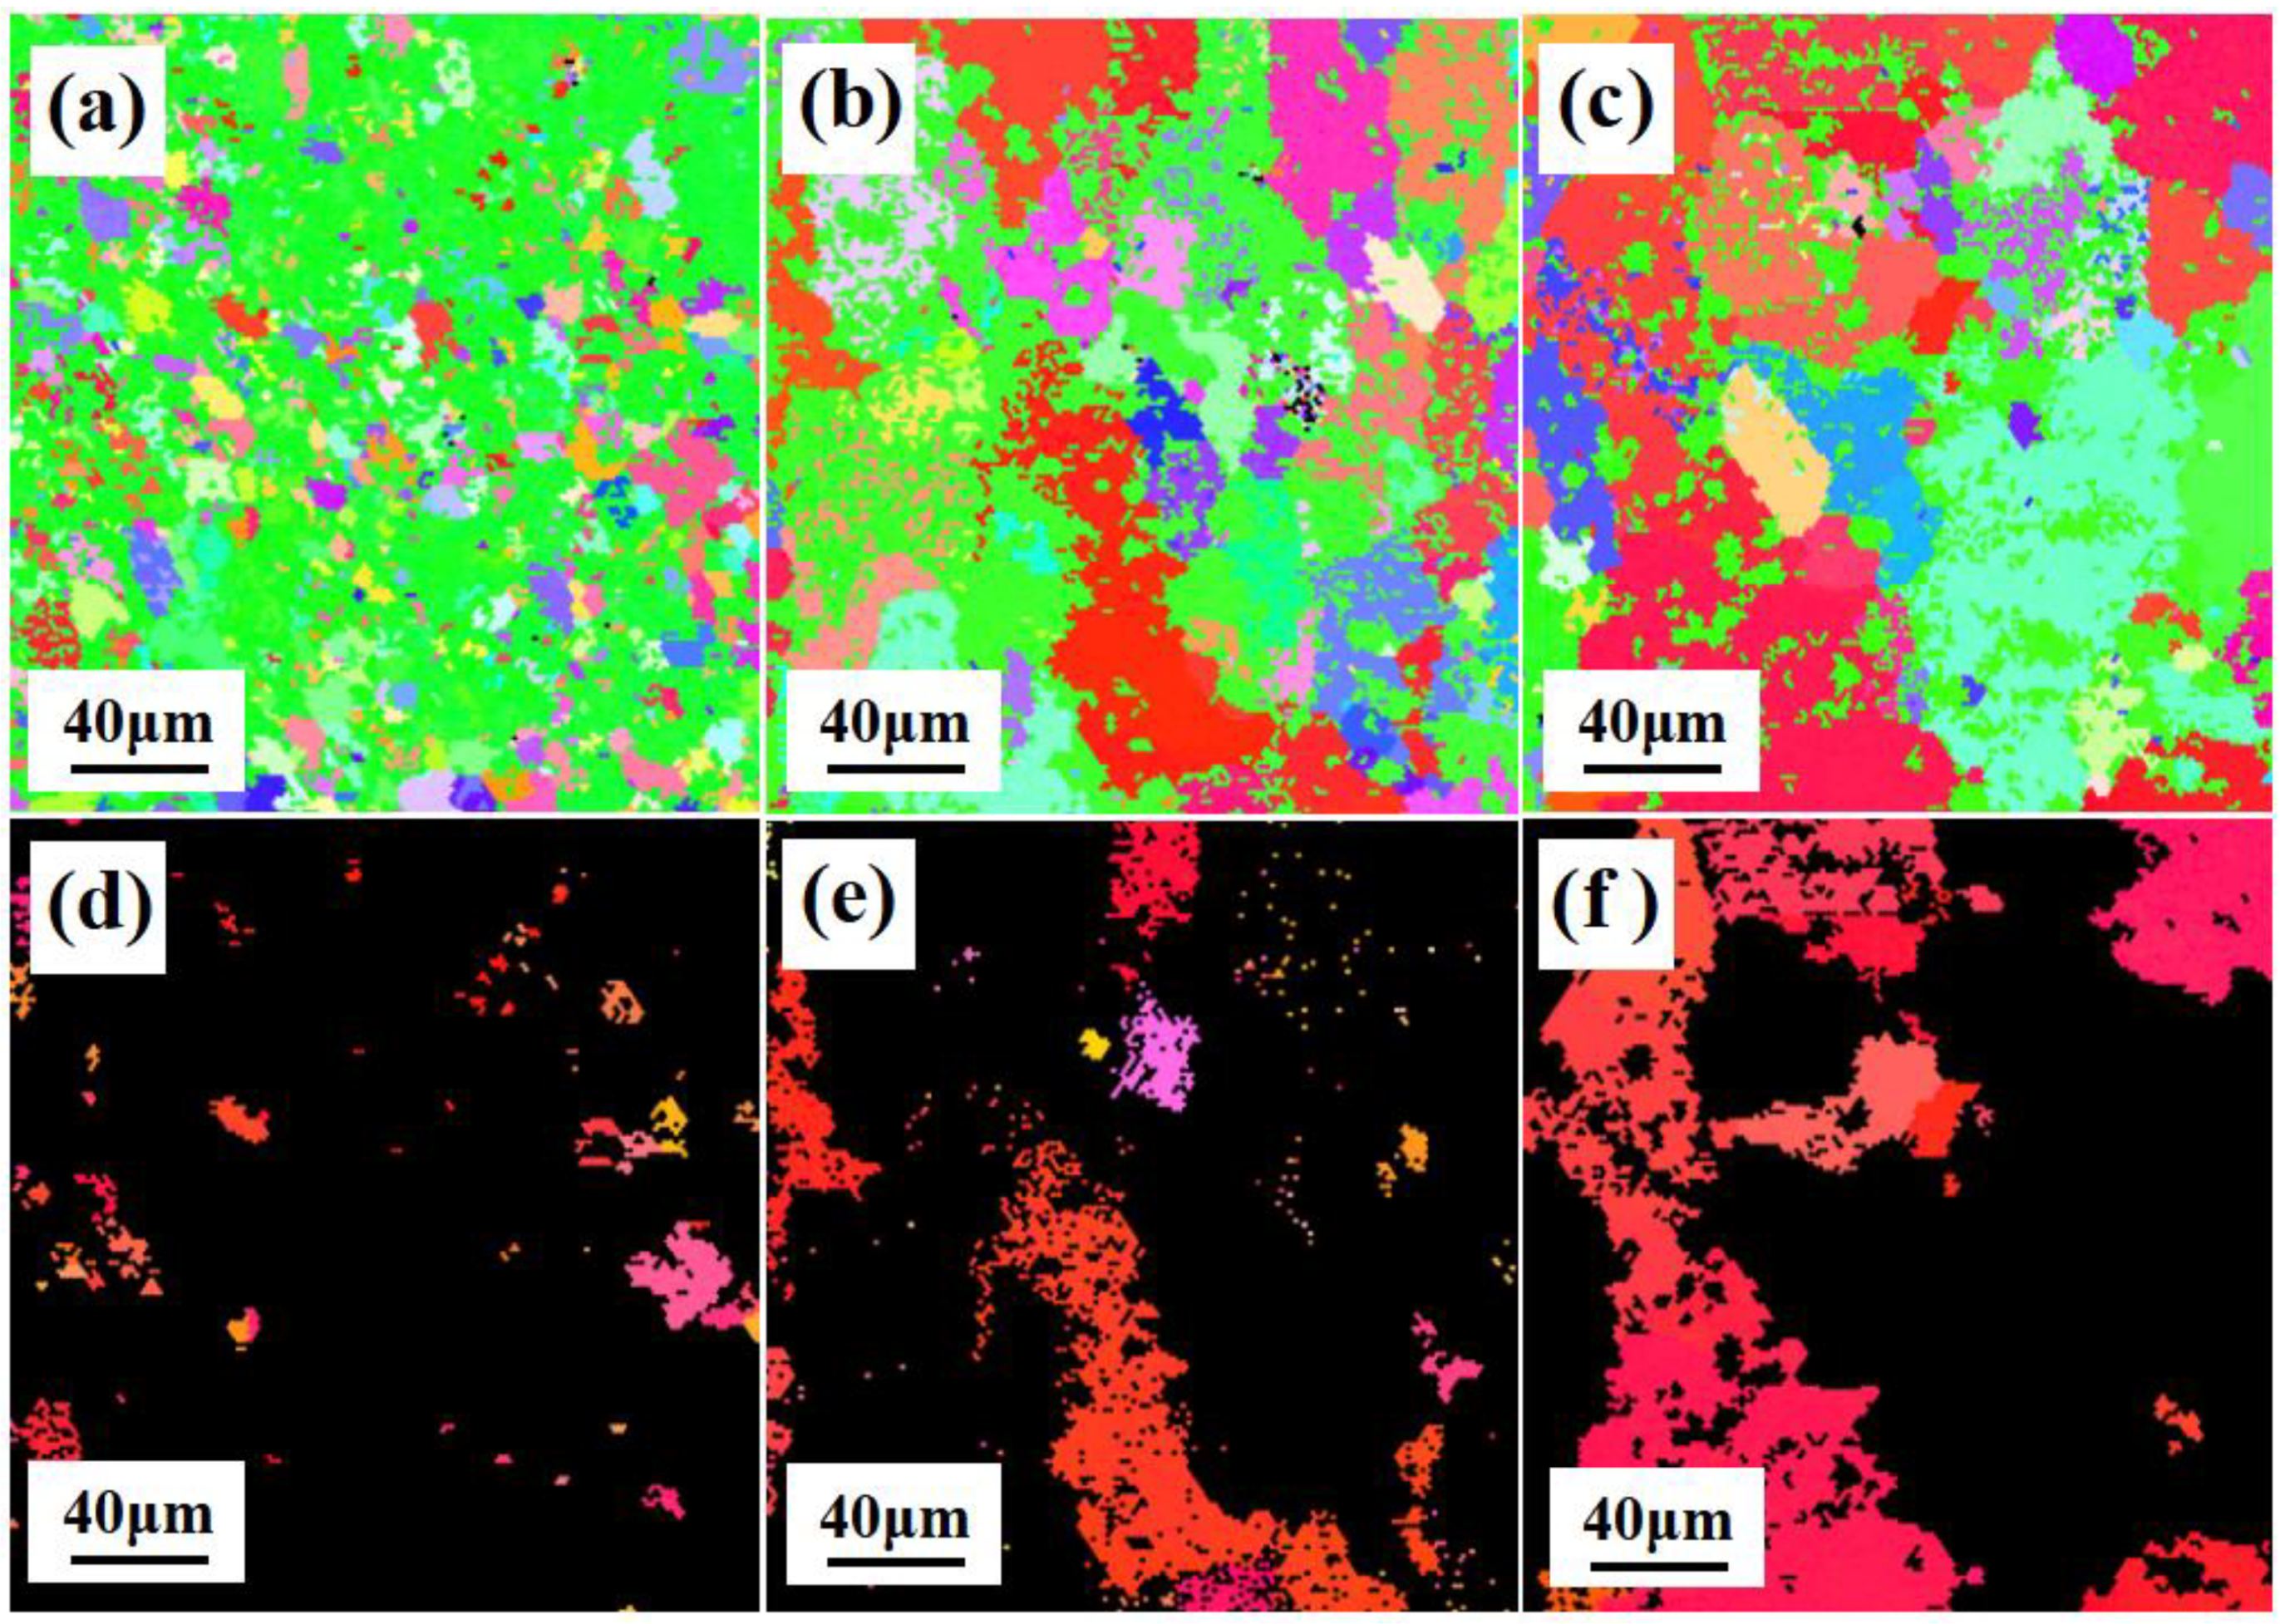
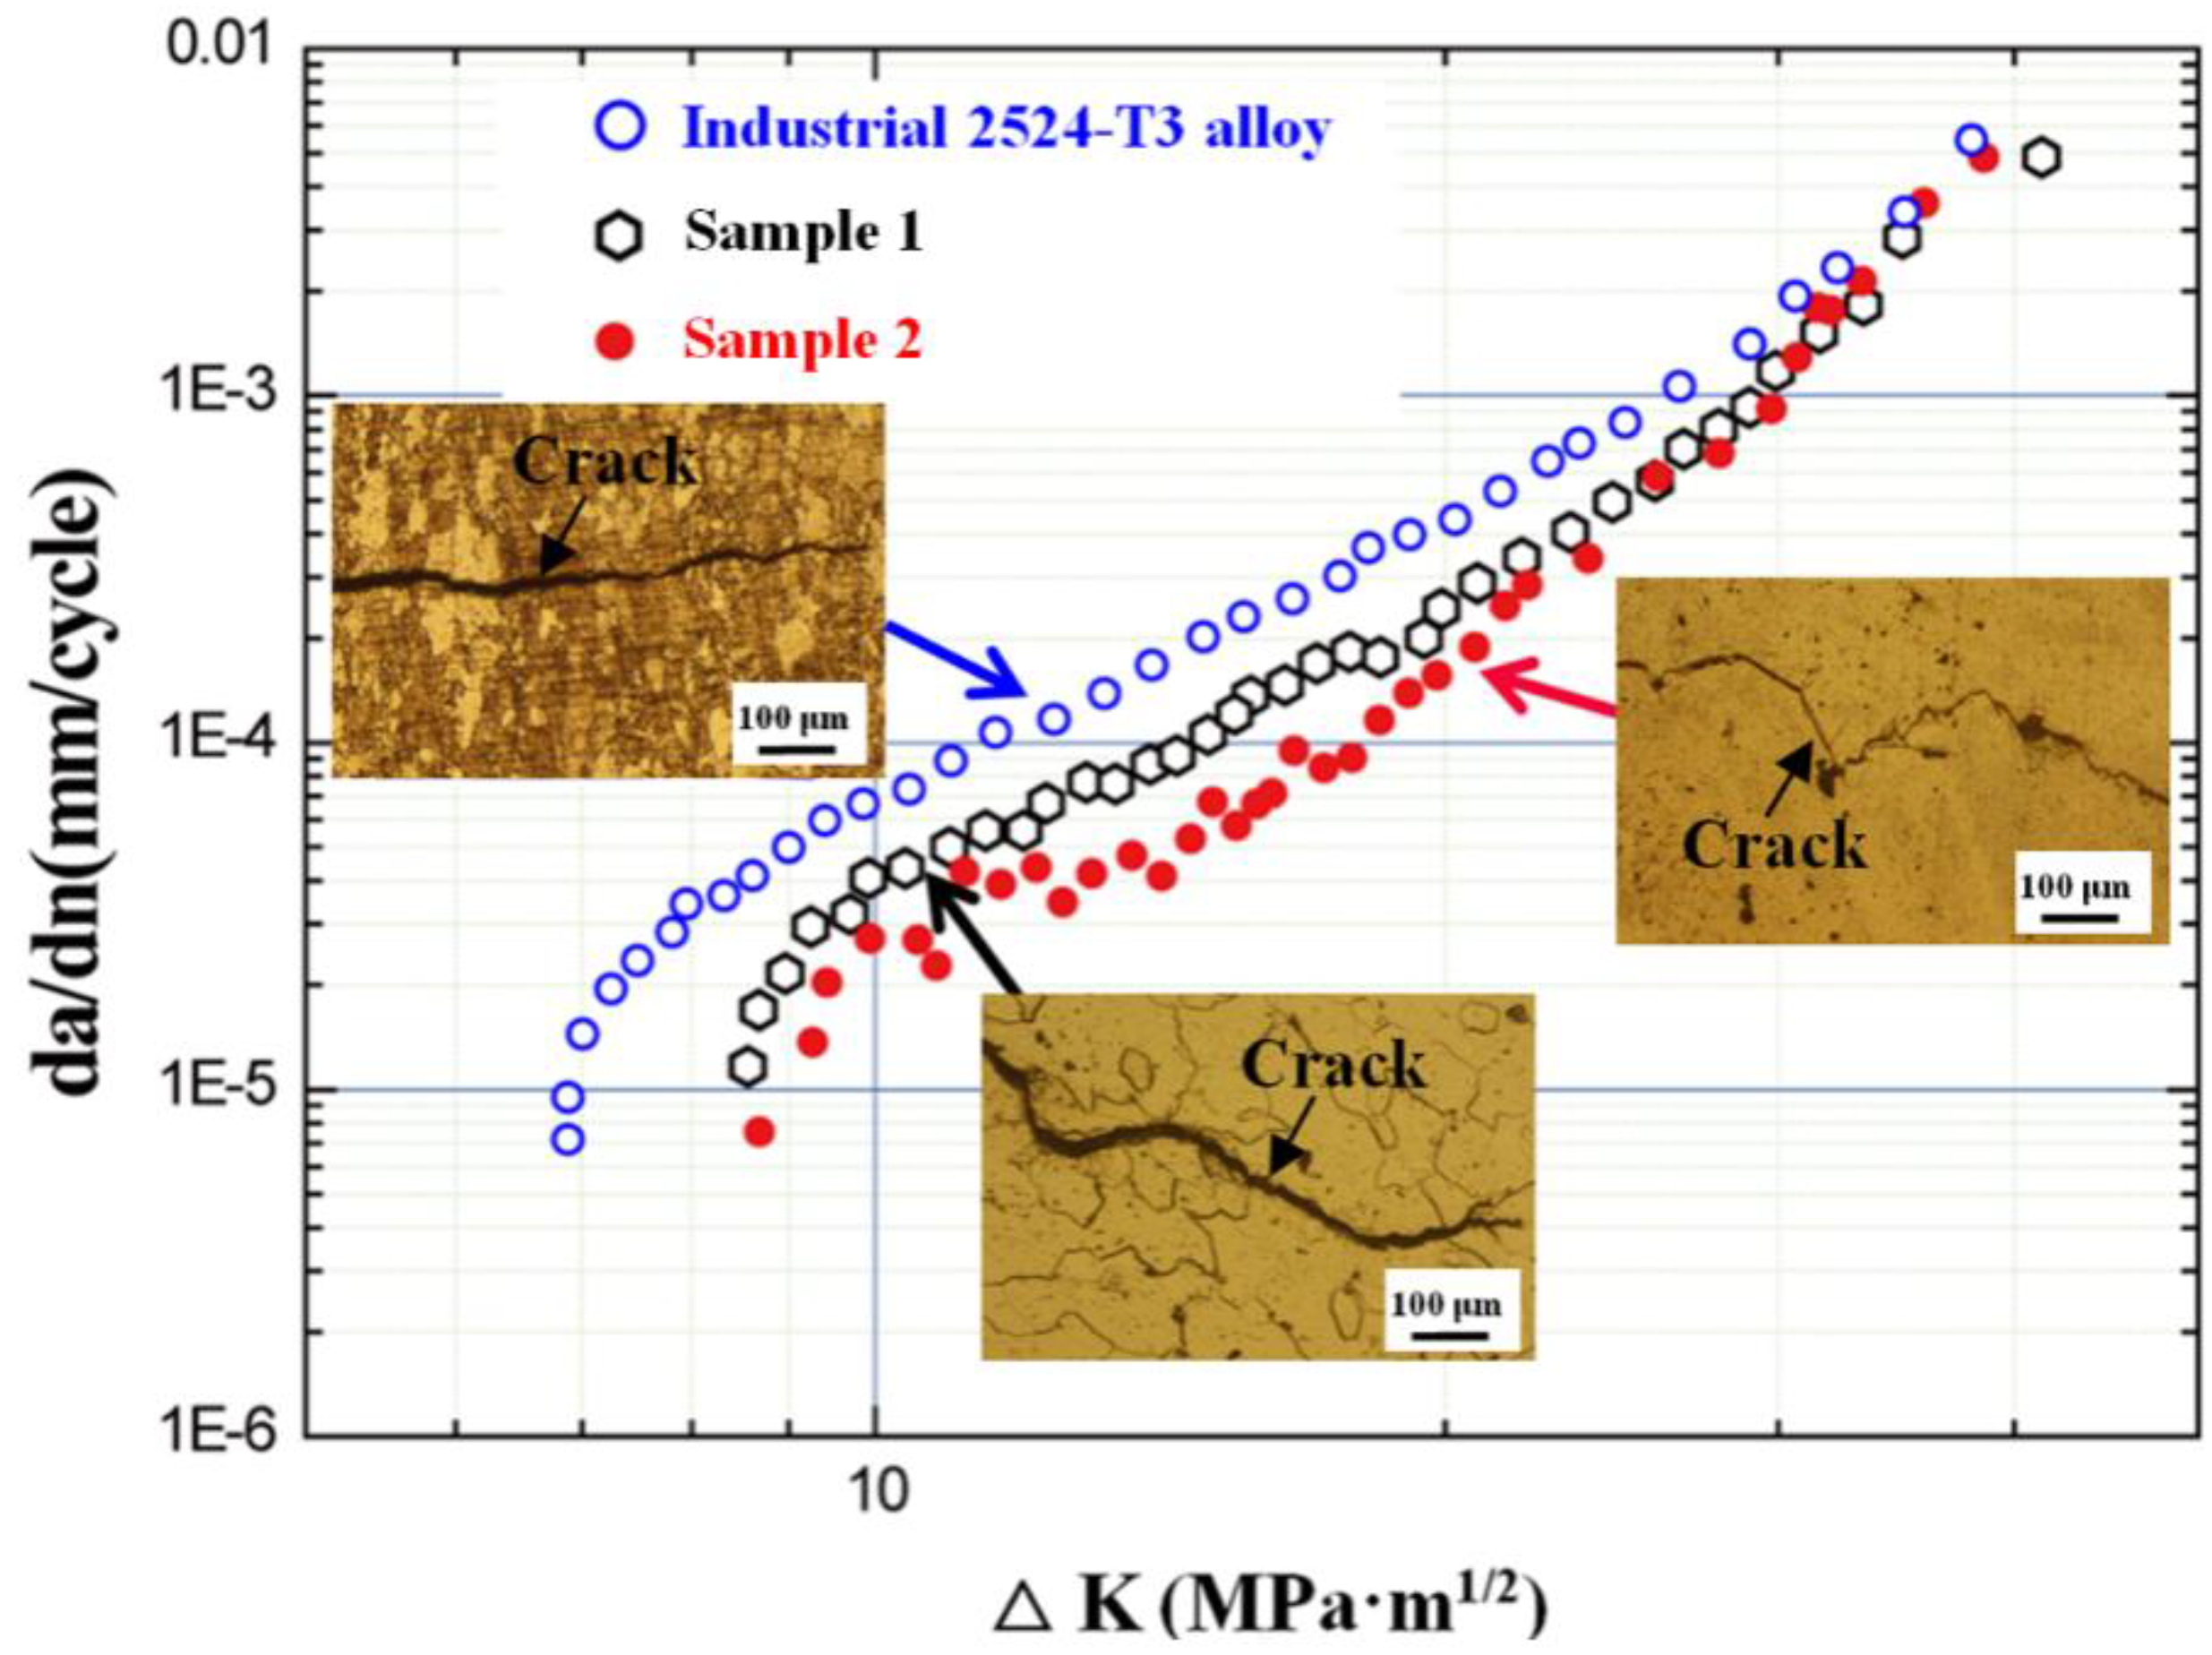
3.3. Preparation and Fatigue Crack Propagation Behavior of 2524-T3 Aluminum Alloy with a Strong Brass Texture

Based on the above analysis, reducing second-phase particles is conducive to the formation of a strong deformation texture (such as the Brass texture), while increasing the annealing temperature would weaken the deformation texture. Besides, increasing deformation will, on the one hand, increase deformation texturing during cold rolling, while on the other hand facilitating recrystallization during subsequent annealing.
To produce a strong deformation texture in a T3-tempered sample, Sample 1 was pre-annealed at 495 °C for 2 h to minimize the number of second-phase particles. Then, it was cold-rolled to 10% deformation in each pass, and a staged annealing treatment was applied (330 °C/0.5 h + 380 °C/0.5 h + 420 °C/0.5 h) after each pass to limit the potential for recrystallization. After eight passes of cold rolling and annealing, the material was solution-treated at 500 °C for 0.5 h and then naturally aged for about 96 h to achieve a T3 temper. To assess the deformation texture effect on the fatigue properties of the alloy, a T3-tempered sample (Sample 2) with and without evident texture, which can be obtained following the same process as for Sample 1 except for rotating the rolling direction by 90° after each pass, was examined.
Figure 13 shows the ODFs of the two samples, and their volume fractions of textures are summarized in Table 5; although, after being solution-treated at 500 °C for 0.5 h, Sample 1 preserves its very strong Brass texture (35.0%), while Sample 2 exhibits no evidently strong texture, which it is probably due to the randomized grain orientations arising from rolling in alternate directions.
The OM images of the two samples are shown in Figure 14. In both samples, most grains are elongated along the RD, and there are few equiaxed recrystallized grains. The average sizes of grains in these two samples are 312.3 ± 5.9 and 303.1 ± 6.4 µm respectively (these are relatively large, a fact attributed to the continuous grain growth during processing, and the inhibition of recrystallization, which restricts grain refinement).
Table 6 lists the mechanical tensile properties of two samples. Compared with Sample 2, both the yield strength (σ0.2) and tensile strength (σb) of Sample 1 increase, especially in the RD direction along which σ0.2 of Sample 1 is 39 MPa (~14.6%) greater than that of Sample 2; the elongations (δ) of Sample 1 are lower than those of Sample 2 in both RD and TD directions, but the decreases are less than 3.2%. In addition, the strength of Sample 1 in the RD direction is much greater than that in the TD direction. This is probably attributed to the mechanical anisotropy caused by the strong Brass texture of Sample 1. Unlike Sample 1, there are only small differences in the mechanical properties of Sample 2 in the RD and TD directions, as it possesses no evident texture.
Figure 15 shows the FCGR vs. the applied △K of Samples 1 and 2, and an industrial 2524-T3 alloy: both Samples 1 and 2 have a lower FCGR at the same applied △K, especially at low △K values. Among these three samples, Sample 2 has the lowest FCGR at ~75% and ~31% less than those of the industrial alloy and Sample 1, respectively, at △K = 10 MPa m1/2.
From the inserted OM image, Samples 1 and 2 contain coarser grains than the industrial 2524-T3 alloy, and their crack paths are also more tortuous. Previous studies [29,32] showed that the coarse-grained samples possessed higher resistance to fatigue-crack growth, since it on the one hand deflected cracks and therefore increased the length of the crack path, and on the other hand produced a more evident roughness-induced crack closure [32]. Thus, the lower FCGRs of Samples 1 and 2 could be due to the higher crack closure level and lower driving force of crack growth, caused by coarser grain sizes.
It is recognized that during fatigue loading, there is a reverse plastic region [33] with radius rp at the crack tip when the applied stress changes. The size of the reverse plastic zone under plane-stress condition can be estimated thus:
r c 1 π ( Δ K I 2 σ 0.2 )
For a tension–tension fatigue loading, compressive stress exists in this reverse plastic zone that has an inhibitory effect on the crack growth. Generally, the larger the size of the reverse plastic zone, the lower the FCGR.
Previously, Zhao et al. [21] investigated the texture evolution of a hot-rolled Al-Cu-Mg plate, annealing at temperatures from 300 °C to 400 °C, finding that the fracture toughness (∆KI) of the alloy is reduced with the increase in the volume fraction of Brass texture. Additionally, as shown in Table 6, this Brass texture can increase σ0.2 to a significant extent; both these effects can lead to a decrease in rc and thus a higher FCGR. This may be due to the lower fatigue crack growth resistance of Sample 1.

4. Conclusions

(1)
With the increase in cold rolling from 0% to 80%, the volume fractions of Brass, copper, and S textures increase significantly, especially for the Brass texture, while those of cube and Goss textures decrease.
(2)
Reducing CSPs is conducive to the formation of strong deformation texture during cold rolling because of the minimization of local deformation discontinuity.
(3)
A large cold deformation combined with subsequent high-temperature annealing can lead to the formation of a strong cube-like texture. With the increase in annealing temperature from 330 °C to 470 °C, the volume fraction of the cube texture in 80% cold-rolled samples increases from 2.82% to 36.53%.
(4)
A strong Brass texture can be produced by eight passes, each of 10%, of cold rolling, followed by staged annealing at 330 °C/0.5 h + 380 °C/0.5 h + 420 °C/0.5 h after each rolling of the pre-annealed sample, even after solution treatment.
(5)
The Brass texture increases the strength but decreases the fatigue crack growth resistance of this aluminum alloy.

Author Contributions

Conceptualization, Y.C.; methodology, C.X.; validation, W.L.; investigation, S.P.; resources, C.X.; data curation, Y.S.; Y.L.; writing—original draft preparation, C.X.; writing—review and editing, B.Z.; supervision, project administration, funding acquisition, Y.C. All authors have read and agreed to the published version of the manuscript.

Funding

This work was supported by the National Natural Science Foundation of China (Grants 52075166 and 51875197) and the Science and Technology Planning Project of Hunan Province (Grant 2019RS2064).

Institutional Review Board Statement

Not applicable.

Informed Consent Statement

Informed consent was obtained from all subjects involved in the study.

Data Availability Statement

The data presented in this study are available on request from the corresponding author.

Conflicts of Interest

The authors declare no conflict of interest.

References

  1. Liu, B.; Peng, C.Q.; Wang, R.C.; Wang, X.F.; Li, T.T. Research Status and Prospect of aluminum alloy for large aircraft. Chin. J. Nonferrous Met. 2010, 20, 1705–1714. [Google Scholar]
  2. Attia, M.; Ragab, K.A.; Bouazara, M.; Chen, X.G. Fatigue Cycles and Performance Evaluation of Accelerating Aging Heat Treated Aluminum Semi Solid Materials Designed for Automotive Dynamic Components. Appl. Sci. 2020, 10, 3008. [Google Scholar] [CrossRef]
  3. Feng, K.; Yang, M.; Long, S.L.; Li, B. The Effect of a Composite Nanostructure on the Mechanical Properties of a Novel Al-Cu-Mn Alloy through Multipass Cold Rolling and Aging. Appl. Sci. 2020, 10, 8109. [Google Scholar] [CrossRef]
  4. Zhang, S.; Zhang, T.; He, Y.; Feng, Y.; Du, X.; Ma, B.; Zhang, T. Effect of coastal atmospheric corrosion on fatigue properties of 2024-T4 aluminum alloy structures. J. Alloys Compd. 2019, 802, 511–521. [Google Scholar] [CrossRef]
  5. Chen, Y.; Liu, C.; Zhou, J.; Wang, F. Effect of alternate corrosion factors on multiaxial low-cycle fatigue life of 2024-T4 aluminum alloy. J. Alloys Compd. 2019, 772, 1–14. [Google Scholar] [CrossRef]
  6. Rajput, A.; Paul, S.K. Effect of soft and hard inclusions in tensile deformation and damage mechanism of Aluminum: A molecular dynamics study. J. Alloys Compd. 2021, 869, 159213. [Google Scholar] [CrossRef]
  7. Guérin, M.; Alexis, J.; Andrieu, E.; Blanc, C.; Odemer, G. Corrosion-fatigue lifetime of aluminium-copper-lithium alloy 2050 in chloride solution. Mater. Des. 2015, 87, 681–692. [Google Scholar] [CrossRef]
  8. Chen, Y.Q.; Pan, S.P.; Zhou, M.Z.; Yi, D.Q.; Xu, D.Z.; Xu, Y.F. Effects of inclusions, grain boundaries and grain orientations on the fatigue crack initiation and propagation behavior of 2524-T3 Al alloy. Mater. Sci. Eng. A 2013, 580, 150–158. [Google Scholar] [CrossRef]
  9. Lin, L.; Liu, Z.; Liu, W.; Zhou, Y.; Huang, T. Effects of Ag addition on precipitation and fatigue crack propagation behavior of a medium-strength Al–Zn–Mg alloy. J. Mater. Sci. Technol. 2018, 34, 534–540. [Google Scholar] [CrossRef]
  10. Xue, X.L.; Zheng, Z.Q.; Hu, F.; Zhang, L. Effect of aging system on fatigue crack growth rate of 2A97 Al-Li alloy. Rare. Metall. Mat. Eng. 2016, 45, 3319–3324. [Google Scholar]
  11. Höppel, H.W.; May, L.; Prell, M.; Göken, M. Influence of grain size and precipitation state on the fatigue lives and deformation mechanisms of CP aluminium and AA6082 in the VHCF-regime. Int. J. Fatigue 2011, 33, 10–18. [Google Scholar] [CrossRef]
  12. Estrin, Y.; Vinogradov, A. Fatigue behaviour of light alloys with ultrafine grain structure produced by severe plastic deformation: An overview. Int. J. Fatigue 2010, 32, 898–907. [Google Scholar] [CrossRef]
  13. Chowdhury, P.B.; Sehitoglu, H.; Rateick, R.G.; Maier, H.J. Modeling fatigue crack growth resistance of nanocrystalline alloys. Acta Mater. 2013, 61, 2531–2547. [Google Scholar] [CrossRef]
  14. Gürbüz, R.; Doruk, M.; Schütz, W. Effect of salt-water fog on fatigue crack growth behaviour of 7050 aluminium alloy in different orientations. J. Mater. Sci. 1991, 26, 1032–1038. [Google Scholar] [CrossRef]
  15. Maduro, L.P.; Baptista, C.A.R.P.; Torres, M.A.S.; Souza, R.C. Modeling the growth of LT and TL-oriented fatigue cracks in longitudinally and transversely pre-strained Al 2524-T3 alloy. Procedia Eng. 2011, 10, 1214–1219. [Google Scholar] [CrossRef] [Green Version]
  16. Zhai, T.; Jiang, X.P.; Li, J.X.; Garratt, M.D.; Bray, G.H. The grain boundary geometry for optimum resistance to growth of short fatigue cracks in high strength Al-alloys. Int. J. Fatigue 2005, 27, 1202–1209. [Google Scholar] [CrossRef]
  17. Jian, H.; Jiang, F.; Wei, L.; Zheng, X.; Wen, K. Crystallographic mechanism for crack propagation in the T7451 Al-Zn-Mg-Cu alloy. Mater. Sci. Eng. A 2010, 527, 5879–5882. [Google Scholar] [CrossRef]
  18. Shen, F.H.; Yi, D.Q.; Jiang, Y.; Wang, B.; Liu, H.Q.; Tang, C.; Shou, W.B. Semi-quantitative evaluation of texture components and fatigue properties in 2524 T3 aluminum alloy sheets. Mater. Sci. Eng. A 2016, 157, 15–25. [Google Scholar] [CrossRef]
  19. Han, J.H.; Seok, H.K.; Chung, Y.H.; Shin, M.C.; Lee, J.C. Texture evolution of the strip cast 1050 Al alloy processed by continuous confined strip shearing and its formability evaluation. Mater. Sci. Eng. A 2002, 323, 342–347. [Google Scholar] [CrossRef]
  20. Wen, W.; Zhai, T. Quantification of resistance of grain boundaries to short-fatigue crack growth in three dimensions in high-strength Al alloys. Metall. Mater. Trans. A 2012, 43, 2743–2752. [Google Scholar] [CrossRef]
  21. Zhao, Q.; Liu, Z.; Huang, T.; Xia, P.; Li, F. Enhanced fracture toughness in an annealed Al-Cu-Mg alloy by increasing Goss/Brass texture ratio. Mater. Charact. 2016, 119, 47–54. [Google Scholar] [CrossRef]
  22. Wu, W.; Liu, Z.; Hu, Y.; Li, F.; Bai, S.; Xia, P.; Wang, A.; Ye, C. Goss texture intensity effect on fatigue crack propagation resistance in an Al-Cu-Mg alloy. J. Alloys Compd. 2018, 730, 318–326. [Google Scholar] [CrossRef]
  23. Liu, Z.; Li, F.; Xia, P.; Bai, S.; Gu, Y.; Yu, D.; Zeng, S. Mechanisms for Goss-grains induced crack deflection and enhanced fatigue crack propagation resistance in fatigue stage II of an AA2524 alloy. Mater. Sci. Eng. A 2015, 625, 271–277. [Google Scholar] [CrossRef]
  24. Crumbach, M.; Goerdeler, M.; Gottstein, G. Modelling of recrystallisation textures in aluminium alloys: II. Model performance and experimental validation. Acta Mater. 2006, 54, 3291–3306. [Google Scholar] [CrossRef]
  25. Shen, F.; Sun, Z.; Li, W.; Zhou, Z.; Zhong, S.; Huang, H.; Guo, J.; Xie, C.; Wang, Y.; Yi, D. Texture evolution in hot-rolled Al–Cu–Mg sheets using orientation streamline approach and texture index. J. Alloys Compd. 2020, 816, 152415. [Google Scholar] [CrossRef]
  26. Wu, R.R.; Li, Q.S.; Guo, L.; Ma, Y.X. Fabrication and Characterization of Bimodal Size Al2O3p Reinforced 7075 Aluminium Matrix Composites. Mater. Sci. 2017, 23, 317–321. [Google Scholar] [CrossRef]
  27. Masuda, H.; Tobe, H.; Hara, T.; Sato, E. Three-dimensional characterization of superplastic grain boundary sliding inside Al–Zn–Mg–Cu alloy sheet. Scr. Mater. 2019, 164, 82–85. [Google Scholar] [CrossRef]
  28. Zhao, Q.; Liu, Z.Y.; Wahab, M.A. Enhanced Brass texture of hot-rolled Al-4Cu-1.6Mg alloy by 0.1% Zr addition. Mater. Charact. 2020, 169, 110643. [Google Scholar] [CrossRef]
  29. Chen, Y.Q.; Zhang, H.; Pan, S.P.; Zhang, W.T.; Song, Y.F.; Fu, M.Z.; Liu, X.; Liu, W.H. Effect of service environment and pre-deformation on the fatigue behaviour of 2524 aluminium alloy. Arch. Civ. Mech. Eng. 2020, 20, 5. [Google Scholar] [CrossRef]
  30. Wilsdorf, D.K. Theory of plastic deformation: Properties of low energy dislocation structures. Mater. Sci. Eng. A 1989, 113, 1–41. [Google Scholar] [CrossRef]
  31. Niranjani, V.L.; Hari Kumar, K.C.; Subramanya Sarma, V. Development of high strength Al–Mg–Si AA6061 alloy through cold rolling and ageing. Mater. Sci. Eng. A 2009, 515, 169–174. [Google Scholar] [CrossRef]
  32. Yin, D.Y.; Liu, H.Q.; Chen, Y.Q.; Yi, D.Q.; Wang, B. Effect of grain size on fatigue-crack growth in 2524 aluminium alloy. Int. J. Fatigue 2016, 84, 9–16. [Google Scholar] [CrossRef]
  33. Chen, J.J.; Huang, Y.; Dong, L.L.; Li, Y.G. A study on evaluation method of crack tip reverse plastic zone size for the center cracked steel plate model under tension–compression cyclic loading. Eng. Fract. Mech. 2015, 133, 138–151. [Google Scholar] [CrossRef]
Figure 1. Microstructures of the as-hot-rolled sample: (a) EBSD-derived IPF maps; (b) pole figures. RD and TD are the rolling direction and the transverse direction, respectively.
Applsci 11 05550 g001
Figure 2. Sections (φ = 0°) of ODFs on the rolling plane of hot-rolled state 2524-T3 alloy after cold rolling: (a) 0%; (b) 10%; (c) 40%; (d) 80%.
Applsci 11 05550 g002
Figure 3. Microstructures of the hot-rolled state 2524-T3 alloy after cold rolling: (a) 10%; (b) 40%; (c) 80%.
Applsci 11 05550 g003
Figure 4. TEM images of the hot-rolled state 2524 alloy after cold rolling: (a) 10%; (b) 40%; (c) 80%; (d) 90%.
Applsci 11 05550 g004
Figure 5. BSE images and EDS results of the as-hot-rolled sample: (a) macroscopic BSE image showing the CSPs arranged along RD; (b) BSE image and EDS result indicating ellipsoidal-shaped S(Al2CuMg) phase; (c) BSE image and EDS result indicating the presence of an irregularly shaped AlCuFeMn phase.
Applsci 11 05550 g005
Figure 6. The SEM images in the secondary electron mode of near-CSPs regions after the sample was cold-rolled at 10%: (a) a scratch deflected by ~18° when it crosses the CSP; (b) a scratch displaced by about 0.4 μm at the CSP interface; (c) cracks nucleated at the CSP interface; (d) fracture of CSP.
Applsci 11 05550 g006
Figure 7. TEM images showing the dislocation distributions around CSPs in the sample after 80% cold rolling: (a) the region far from the interface of the particle; (b) the region adjacent to the interface of the particle.
Applsci 11 05550 g007
Figure 8. Sections (φ = 0°) of ODFs on the pre-annealed samples after different cold rolling treatments: (a) 10%; (b) 40%; (c) 60%; (d) 80%.
Applsci 11 05550 g008
Figure 9. Sections (φ = 0°) of ODFs on the pre-annealed samples after different cold rolling treatments.
Applsci 11 05550 g009
Figure 10. Sections (φ = 0°) of ODFs on the rolling plane of sample after different rolling deformations and annealing treatments at 470 °C for 0.5 h: (a) 10%; (b) 40%; (c) 60%; (d) 80%.
Applsci 11 05550 g010
Figure 11. Sections (φ = 0°) of ODFs on the rolling plane of the cold-rolled sample after different annealing treatments: (a) before annealing; (b) 330 °C/0.5 h; (c) 380 °C/0.5 h; (d) 420 °C/0.5 h; (e) 470 °C/0.5 h.
Applsci 11 05550 g011
Figure 12. EBSD-derived IPF images of 80% cold-rolled samples after different annealing treatments: (a) 330 °C/0.5 h; (b) 420 °C/0.5 h; (c) 470 °C/0.5 h; (d) cube-orientated grains extracted from (a); (e) cube-orientated grains extracted from (b); (f) cube-orientated grains extracted from (c).
Applsci 11 05550 g012
Figure 13. ODFs on the rolling plane of two T3-tempered samples: (a) sample 1; (b) sample 2.
Applsci 11 05550 g013
Figure 14. OM images of two T3-tempered samples: (a) Sample 1; (b) Sample 2.
Applsci 11 05550 g014
Figure 15. Fatigue crack growth rates (FCGRs) vs. applied ∆K of Sample 1 and 2, and an industrial 2524-T3 alloy.
Applsci 11 05550 g015
Table 1. Volume fractions of the textures in samples after different cold rolling treatments, calculated based on the ODF (with a measurement accuracy of 0.05%).
Deformation (%)Cube (%)Goss (%)Brass (%)Copper (%)S (%)
08.574.4412.565.879.68
106.514.1315.396.3511.26
404.603.8120.638.4115.55
803.652.5425.659.3619.36
Table 2. Volume fractions of the textures in pre-annealed samples after different cold rolling treatments, calculated using the ODF (with a measurement accuracy of 0.05%).
Deformation (%)Cube (%)Goss (%)Brass (%)Copper (%)S (%)
1010.709.4710.874.565.79
407.376.1418.596.848.77
604.394.2128.597.5415.61
802.813.1637.548.6025.78
Table 3. Volume fractions of textures in alloy after different rolling deformations and annealing treatments at 470 °C for 0.5 h, calculated using the ODF (with a measurement accuracy of 0.05%).
Deformation (%)Cube (%)Goss (%)Brass (%)Copper (%)S (%)
108.247.748.715.494.84
408.719.037.105.814.52
6015.808.716.615.483.87
8020.839.685.814.993.39
Table 4. Volume fractions of different textures, calculated based on the ODF of 80% cold-rolled samples after different annealing treatments (with a measurement accuracy of 0.05%).
Heat TreatmentCube (%)Goss (%)Brass (%)Copper (%)S (%)
Before annealing2.823.0635.468.6325.80
330 °C/0.5 h10.564.2726.857.6612.66
380 °C/0.5 h17.657.6715.645.568.47
420 °C/0.5 h20.6415.7211.614.684.35
470 °C/0.5 h36.5317.338.433.152.82
Table 5. Volume fractions of textures, calculated based on the ODFs of two T3-tempered samples (with a measurement accuracy of 0.05%).
SampleCube (%)Goss (%)Brass (%)Copper (%)S (%)
Sample 15.244.5235.08.109.17
Sample 28.646.514.564.092.35
Table 6. Mechanical tensile properties of two T3-tempered samples.
SampleDirectionσ0.2 (MPa)σth (MPa)δ (%)
Sample 1RD305.5 ± 6.9375.7 ± 5.620.6 ± 0.6
TD284.8 ± 4.3358.6 ± 4.521.1 ± 0.5
Sample 2RD266.5 ± 4.1353.7 ± 6.323.5 ± 0.7
TD253.8 ± 3.5344.6 ± 3.124.3 ± 0.3
Publisher’s Note: MDPI stays neutral with regard to jurisdictional claims in published maps and institutional affiliations.

