
The Effect of Strengthening Methods on the Performance of Reinforced Concrete Columns against Vehicle Impact


1
Department of Civil and Environmental Engineering, College of Engineering, King Faisal University, P.O. Box 400, Al-Ahsa 31982, Saudi Arabia
2
Department of Civil & Architectural Engineering, College of Engineering, Sultan Qaboos University, P.O. Box 33, Al-Khodh, Muscat 123, Oman
*
Authors to whom correspondence should be addressed.
Appl. Sci. 2022, 12(3), 1382; https://doi.org/10.3390/app12031382
Submission received: 27 December 2021
/
Revised: 21 January 2022
/
Accepted: 21 January 2022
/
Published: 27 January 2022
(This article belongs to the Special Issue Advanced Structure Materials and Processing)
Abstract
:Columns at the ground floor and parking garages that could be hit by a car pose a significant risk to the structural stability of the building superstructures. Generally, these columns are not built to sustain the lateral impact force generated by car–column collision. In this study, the performance of axially loaded retrofitted reinforced concrete (RC) columns against car impact is evaluated using finite element (FE) simulation. The FE model of the RC column with axial load was validated with experimental results. For the car-crushing simulations, two SUV car models with a mass of about 2250 kg, which had been experimentally validated, were used to simulate the car–column collision. The results of the FE analysis revealed that once the impact speed exceeds 30 km/h, the horizontal impact force has a significant effect on the column joint at the foundation. The impact force increases linearly as the impact velocity of the car increases up to 20 km/h. When car impact velocities are more than 20 km/h, the generated impact force increases in power to the car-crashing velocity. Both types of cars have almost the same effect on the generation of impact force and the lateral displacement of the column. It is found that the generated impact forces are higher than the recommended design values of Eurocode 1. To protect the column from car impact damage, two types of column-strengthening systems were investigated. One form of strengthening system involves retrofitting the lower half of the column with an aramid fiber-reinforced polymer (AFRP) warp, while the other involves putting a reinforced concrete jacket of up to 1.3 m in the height of the column. Based on the comparative study, design recommendations are suggested to protect the RC column from accidental car-crashing damage.
1. Introduction
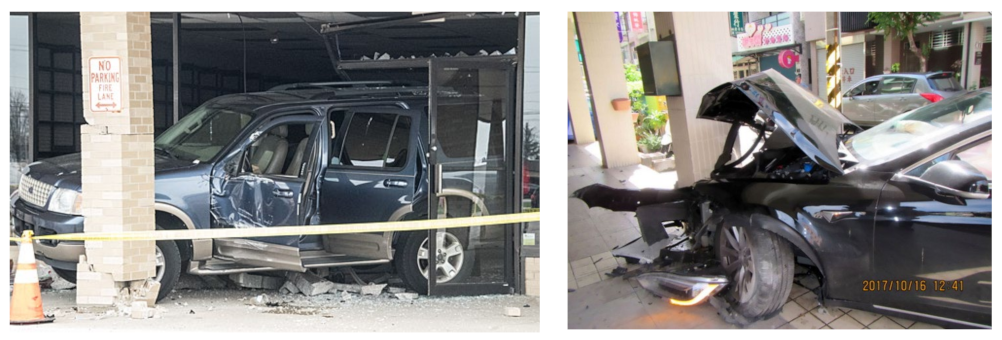
Structural elements nowadays face the possibility of being subjected to sudden dynamic load in addition to the design static load, which can lead to catastrophic failure of the structure. This type of unusual dynamic load can be caused by falling objects, vehicular impact, or explosions. These incidents may occur accidentally or intentionally as a result of terrorist activities. Columns on the ground floor and parking garages are potentially exposed to such dynamic load caused by vehicular impact [1,2]. In recent years, column damage or even column failure due to vehicle impact has increased due to the increase in vehicles and traffic load as a result of population growth and urbanization [2,3,4,5]. Vehicle accidents with the front columns of roadside buildings and columns in parking garages are likely to occur unexpectedly, resulting in significant dynamic loads [6]. Some examples of column failure and damage due to car impact are shown in Figure 1 [7]. Most of the previous studies have focused on the impact behavior of RC beams and slabs under impact loads [8,9,10,11,12,13]. Some studies were dedicated to investigating the impact and blast behavior of RC structures retrofitted with different types of fiber-reinforced polymer (FRP) [14,15,16,17,18,19]. It was found that the FRP jacket enhanced the performance of RC structures under blast load. Limited studies are available on the impact behavior of axially loaded retrofitted RC columns under impact load [1,2,20]. In particular, there is a scarcity of information in the literature about the detailed behavior of a retrofitted RC column under vehicle impact. Therefore, it is necessary to study systematically the behavior of RC columns subjected to different types of car impact and to develop a protective system that can prevent any type of damage to the column during accidental low-velocity car impact. One of the objectives of this study is to categorize the behavior of RC columns under vehicle impact numerically.
The abnormal collision of a road vehicle with a column can cause the affected columns to lose a significant amount of strength. As a result, the column may be unable to carry the loads that have been applied to it [21]. A number of codes and industry standards are concerned more about the capabilities of the designed structures to resist impact and blast loading. Most of the current codes of practice [22] recommended the use of equivalent static forces to account for anticipated lateral impact forces in column design, particularly for building columns located near roads or in parking garages. However, there is a wide range of variation in the values of equivalent static forces derived from different codes of practices, as shown by Ferrer et al. [5,23]. Furthermore, it is shown in many studies [24,25,26] that the equivalent static forces recommended by Eurocode 1 for designing columns against transverse impact loads do not provide sufficient protection for the columns in the event of a collision between a veered vehicle and a specific column, particularly for a large column. Many research centers and institutes have tried to develop the optimal columns’ protective systems [27]. However, after an intensive search, it was found that most of the protective systems developed and made available in the market are dedicated to protecting the columns located in warehouses where only forklifts are permitted to access and the speed limit is below 10 km/h. Only a few studies have been conducted to investigate the use of honeycomb sandwich panels to protect bridge piers and steel columns from vehicular impact [28,29]. The energy absorption capability of the honeycomb sandwich panels determines the efficiency of column protection. Furthermore, if the sandwich panel is damaged in a car collision, it should be replaced with a new sandwich panel.
Since it is not possible to prevent drivers from losing control of their vehicles, it is practical to prevent these going-astray vehicles from striking a structural member such as a column in the first place. An effective protective system is one of the solutions to prevent the veered vehicles from sticking to the column directly. The protective system is primarily dedicated to reducing the impact force experienced by the column following the collision between the impacting vehicle and the column. Another system is to design the column for the additional lateral impact force that may arise from the car collision to the column. For the design of a column subjected to lateral load, it is necessary to predict the maximum possible lateral load due to car impact on the column. Therefore, the first objective of this paper is to determine the maximum lateral load that can be developed during a car collision with a column located in parking garages. The second objective is to develop an effective protection system that can protect building columns from damage caused by a car impact at the speed of 40 km/h. The commercially available finite element software LS-DYNA [30] was used to evaluate the performance of the developed protective system. A numerical model of the column was created using LS-Prepost. Verified car models developed by NHTSA [31] for crash simulation were used with the column models.
2. Development of Finite Element Model of Axially Loaded RC Columns for Impact Load
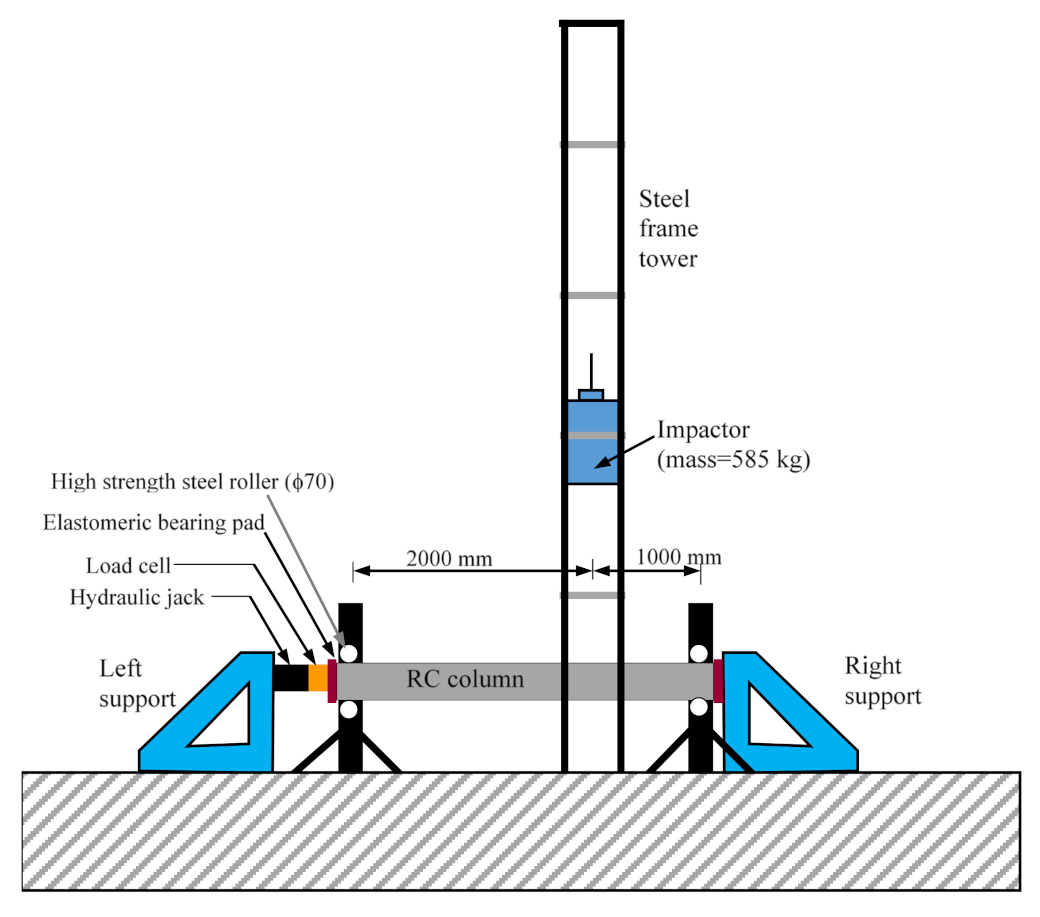
Two experimentally tested reinforced concrete (RC) columns were selected for the development of the finite element (FE) model for vehicle impact. One column is a standard RC column (Imp3), while the other column (ImpA2) has been retrofitted with two layers of aramid fiber-reinforced polymer (AFRP) sheets [15]. The cross-section and length of the columns were 300 × 300 mm2 and 3200 mm, respectively. The span of the columns for the impact test was 3000 mm. Four longitudinal reinforcements of 18 mm diameter were used. The clear concrete cover on all sides was 25 mm. Stirrups of 8 mm diameter with 150 mm spacing were provided along the length of the columns. The yield strengths of longitudinal bars and stirrups were 465.7 and 512.3 MPa, respectively. The ultimate strengths of the bars were 583.7 and 613.0 MPa, respectively. The compressive strength and split tensile strength of the concrete was 30.7 and 2.8 MPa, respectively. The maximum aggregate size was 12 mm, and the density of the concrete was 2380 kg/m3. The thickness of each layer AFRP sheet was 0.2 mm. Detailed properties of the concrete and AFRP can be obtained from [15]. In the experiment, the axially loaded RC columns were impacted laterally by a falling weight [15]. Figure 2 shows the schematic diagram of the test setup. The applied axial load was 375 kN, which is approximately 15% of the axial capacity of the column. The axial load was applied at the left end of the column while the other end was restrained for axial movement. Elastomeric bearing pads were used at both ends. The mass of the falling weight was 585 kg, and the drop heights were 3 and 4.5 m to generate the targeted impact velocities for the standard RC column (Imp3) and the FRP-retrofitted column (ImpA2), respectively. The dimension of the impactor was 400 × 400 × 700 mm3.
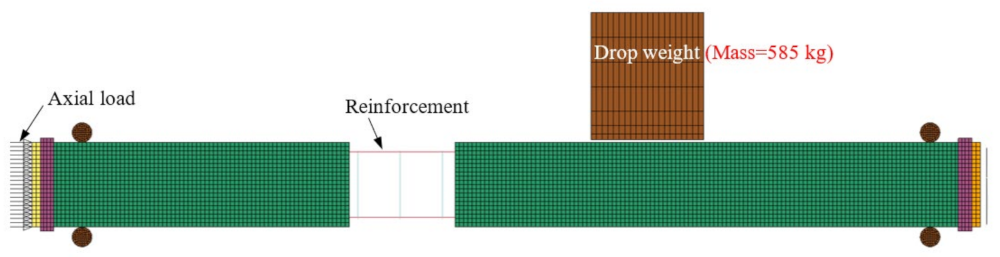
In this study, the non-linear finite element program LS-DYNA was used to model the axially loaded RC column for impact load. Using the available information from the experiment, a finite model was developed, as shown in Figure 3. The center of the impact is 1000 mm away from the right support of the assembly, which simulates the car impact point on the column. The concrete, projectile, roller supports, end plates, and elastomeric pad were modeled as 8-node solid elements. From the mesh sensitivity analysis, it was found that the displacement-time history converged at an element size of 20 and less. Therefore, the element of 15 mm in size was used for concrete in the FE model. The reinforcements were modeled as beam elements, following previous studies [26,32]. For the modeling of the AFRP-retrofitted column, the AFRP sheet was modeled using 4-node thin shell elements with bending and membrane capabilities. The maximum size of the shell element was 15 mm.
2.1. Constitutive Models of the Materials
The material properties of transverse and longitudinal steel bars were modeled using MAT-24 (piecewise linear plasticity model) from the material library of LS-DYNA [33]. This material model is very popular and widely used for modeling steel materials under dynamic or rate-dependent loads. It takes into account the material’s isotropic plasticity and kinematic hardening properties. The user-defined stress–strain parameters can also be used to define the stress–strain curve of the steel material. This material model allows us to incorporate the strain rate effect on the steel material. The following equations (Equations (1) and (2)) define the relationship between the tensile and compressive dynamic increase factor (DIF) of steel and the strain rate [34]:
where fy and are the steel yield strength (MPa) and strain rate, respectively. The steel material of impactor, roller support, and end plates were modeled using MAT-3 (Plastic kinematic) from the material library.
Modeling concrete materials in FE analysis is always a challenge. It is important to select an appropriate concrete material model in order to achieve a realistic result. The LS-Dyna material modeling library includes a large number of constitutive models for concrete [33]. MAT-159 (continuous surface cap model) and MAT-72RIII (concrete damage model) have the ability to generate the required parameters using only the unconfined cylinder compressive strength and the maximum aggregate size of the concrete. Other concrete material models, such as MAT-84/85 and MAT-272, can also be used by providing some parameters that can be determined manually using compressive strength. All of the material models discussed here have their own set of benefits and drawbacks. There is no single concrete material model that can be applied to all impact problems and produce the best results in terms of damage, deflections, and impact forces. In some cases, the material model MAT-72RIII produces good results; however, when the impact velocity is increased, it appears that shear deformation is prominent around the projectile rather than global beam deformation [35,36]. Nevertheless, this material model gives very excellent results with low-velocity impact (i.e., low impact energy) by adjusting some parameters. To adjust the different parameters in this model needs very expert knowledge on the constitutive material properties of concrete [37].
The material model MAT-159 is appropriate for simulating the impact problems of RC beams and columns. However, with the default fit values, it shows some concrete hardening [38]. For this reason, some of the cases underestimate the deflection of the beam. However, with the suggested adjustment on compressive fracture energy, tensile fracture energy, and shear fracture energy [38], this problem can be overcome. Additionally, this material model can define the damage profile in the RC members more reasonably than other concrete of the material models. Thus, this material model has been used by many researchers to model reinforced concrete structures for dynamic analysis [26,35,36]. In light of the above discussion, MAT-159 was used to simulate the concrete material of the column under impact load in this research.
MAT-54 (ENHANCED_COMPOSITE_DAMAGE) specified with Chang–Chang failure criteria was used to model the AFRP material. This material model was specially developed for arbitrary orthotropic materials. To define FRP materials, this material model is widely used in many studies [17,39]. The properties of the AFRP are given in Table 1. The remaining input parameters are taken from [39].
2.2. Contact Definition
Contacts between different parts are defined by the automatic surface-to-surface contact option in LS-DYNA [30]. This option prevents the penetration of elements of different parts to each other. A standard penalty-based algorithm was used to define the contact. The embedded reinforcements are tied with concrete elements using LS-DYNA keyword-constrained Lagrange in solid. The contact between concrete and AFRP was defined by using the automatic surface-to-surface tiebreak contact option. In this contact model, the tie-breaking strength was defined by the adhesive epoxy’s tensile and shear failure strengths. The tie-breaking strength of 55.2 MPa was used based on the bond strength of the epoxy [15]. This type of contact model was used in previous studies to model the contact between concrete and FRP [17,39]. This contact has been proven to model the bonding behavior between concrete and FRP efficiently.
3. Validation of the FE Model of Column Subjected to Impact Load
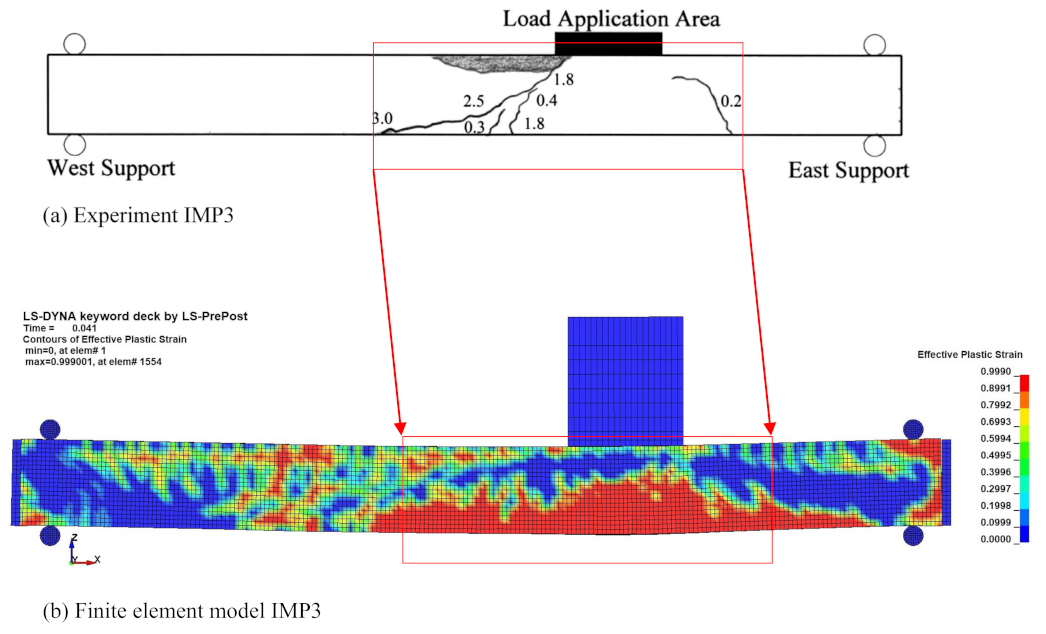
The damage pattern in the FE model of axially loaded RC columns under impact load is shown in Figure 4. For comparison reasons, the test damage pattern of the standard column (Imp3) is given in Figure 4a. It can be seen that the developed FE model can capture concrete damage with reasonable accuracy.
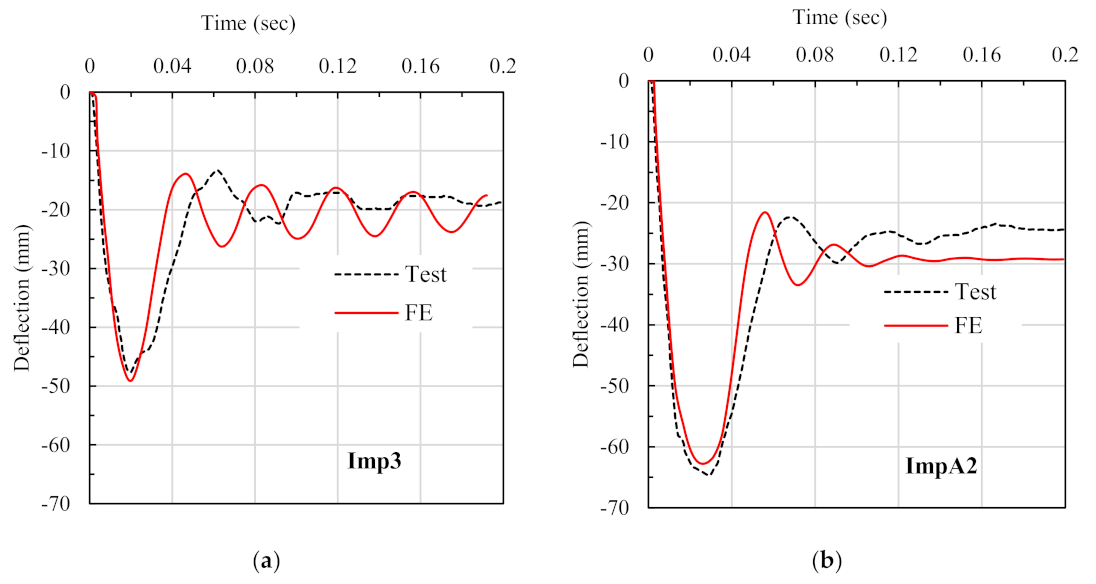
Figure 5 shows the deflection history at the impact point of the columns along with test deflection-time history. Standard column Imp3 was impacted with a velocity of 7.67 m/s, and RFP-retrofitted column ImpA2 was impacted with an impact velocity of 9.40 m/s. It can be seen from the figure that the maximum deflections from FE analysis are almost the same as the test results. The difference between the test and FE maximum deflections is less than 2%. Moreover, the shape of the deflection-time history of the FE model is the same as the test deflection shape. Therefore, it can be inferred that the developed FE model is capable of capturing the impact behavior of RC columns under axial load.
4. Numerical Simulation of a Vehicle Collision with Column
4.1. Finite Element Models of Vehicles and Reinforced Concrete Columns
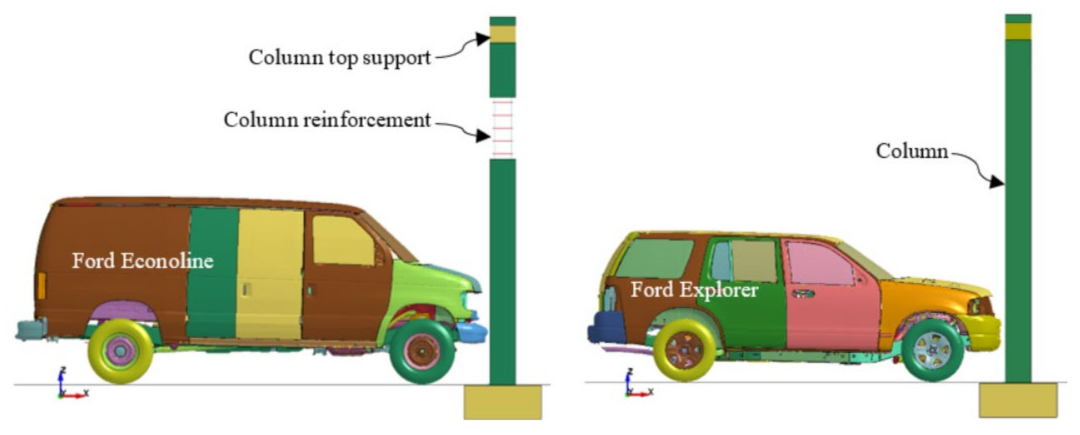
Two SUV types of car models were used in this study. Two Ford van vehicles, namely Econoline and Explorer, were incorporated into the model to simulate an accident of a vehicle crashing into a reinforced concrete column. The models were developed by the National Crash Analysis Center (NCAC) at George Washington University and have been used in support of several NHTSA programs [31]. The geometry of the vehicle’s models is brought into finite element form by digitizing all the vehicles’ parts. The vehicles’ parts are represented using shell, solid, and beam elements. The connectivity between the parts is properly selected to allow the vehicle to move and act in a realistic manner [40]. The overall weight of the Econoline and Explorer vehicles in the finite element models is 2131 and 2254 kg, respectively. Table 2 shows the main features of the finite element model of the vehicles. The selection of the vehicle model was not random since it is based on the size and weight of the vehicle, taking into account that the proposed protection system for columns is dedicated for car parking where only passenger vehicles are permitted. Therefore, a Ford van (Econoline-2007) and the Ford Explorer were selected because their weight is higher than most normal passenger vehicles. The altitude of the frontal part of the selected cars is also considerably high, which means that most of the other brands and categories of passenger vehicles can crash the protection barrier at points lower than the point reached by the Ford SUV vehicles. Figure 6 shows the finite element models of the vehicles and columns that are adopted in this study. Furthermore, the model was tested for stability in crash testing up to a speed of 65 km/h by the developer, indicating that the developed car model can be used for crashworthiness simulations at speeds equal to or lower than the tested speed of 65 km/h.
The validated reinforced concrete column with axial load was used as a reference column to simulate the vehicle–column collision. The column was attached to a typical footing with a fixed boundary at the bottom, and the upper end of the column was only allowed to move vertically. The axial load carrying capacity of the RC column was calculated using Equation (3), following the guideline of ACI318-14 [41].
where Pn is the design load, Ac is the concrete area, As is the main reinforcement area, fc is the compressive strength of concrete, and fy is the steel yield strength.
Pn = 0.85 Acƒc + Asƒy
In this study, approximately 75% of the design axial load was applied to the column. The axial load was applied individually to the concrete nodes and reinforcing bars. A portion of the total axial load was applied on the concrete nodes uniformly at the top surface of the column. The rest of the axial force was applied through the longitudinal reinforcement. The load distribution between the concrete and steel rods was performed with the assumption of uniform strain distribution, i.e., εc = εs, where εc is the concrete strain and εs is the steel strain. Using the axial load compatibly criteria, the following equation can be developed to determine the stress on the concrete (σc):
where P, Ac, ρs, and n are the applied axial force on the column, the cross-section area of the concrete, the steel ratio of the section, and the modular ratio (Es/Ec).
The majority of the analysis in this study was done using two sizes of columns: 300 × 300 mm2 (C300) and 400 × 400 mm2 (C400). Two other column sizes, 500 × 500 mm2 (C500) and 600 × 600 mm2 (C600), were also studied in FE analysis for comparison purposes. The columns were reinforced with 2.6% of the concrete area. The spacing of shear reinforcement was 150 mm, and the diameter of shear reinforcement was 10 mm. The material properties of reinforcing bars were the same as the validated column model. However, the concrete compressive strength used in the model was 40 MPa.
4.2. Contact Definition between Vehicle and Column
In this study, the automatic surface-to-surface contact algorithm is used to eliminate the penetration or overlap between interacting surfaces, i.e., the interaction between the vehicle and the reinforced concrete column. A required number of sets of automatic surface-to-surface contact algorithms are used in the model to avoid complexity in terms of computational time. Both of the static and dynamic friction coefficients are set to 0.3 and 0.25, respectively, as recommended by El-Tawil et al. [40], on one hand. On the other hand, all the remaining parameters are kept as the default values. For the AFRP-retrofitted columns, the contact between the AFRP and the concrete surface was kept the same as the validated column model described earlier.
4.3. Initial Velocity
According to the practice in the Gulf region, particularly in Oman, it was observed that most of the parking lots have a speed limit of 20 km/h (see Figure 7). However, during an accident, the car speed can exceed this limit unintentionally. After an extensive study on the car speed limit to be used for the FE model, it is decided to set an initial velocity of 40 km/h for providing the design guideline of the column at parking places. In addition to this car impact velocity, the FE models were run for initial car speeds of 10, 15, 20, 25, 30, 35, 50 km/h, and 60 km/h for parametric study.
The *INITIAL_VELOCITY keyword was used to initiate the velocity to the vehicle, which is moved toward the column at a constant speed. The car is placed in such a way that the center of the frontal parts of the vehicle is supposed to crash into the column. During the collision, the soft frontal part of the vehicle deforms and absorbs a portion of the impact energy. The rest of the energy is dissipated by the deformation of both the car and the column when the hard part of the car engine collides with the column.
5. Results and Discussions
5.1. Impact Damage of Column and Car
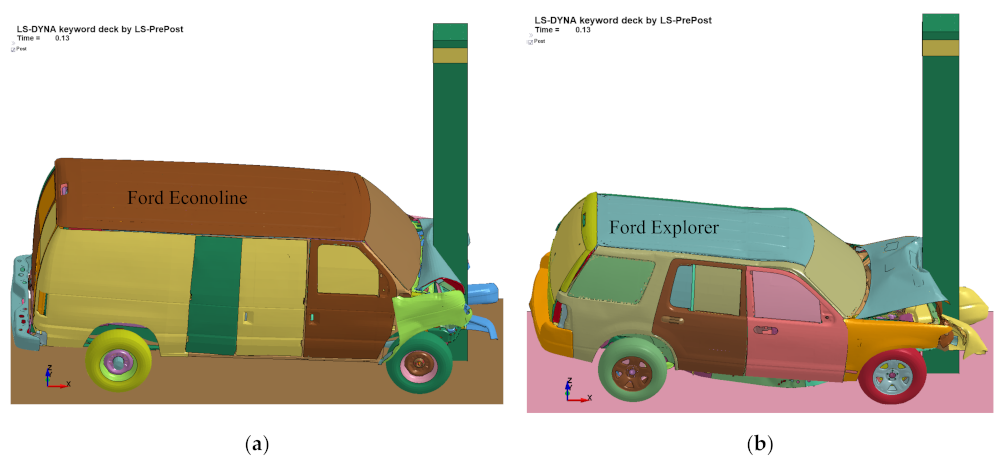
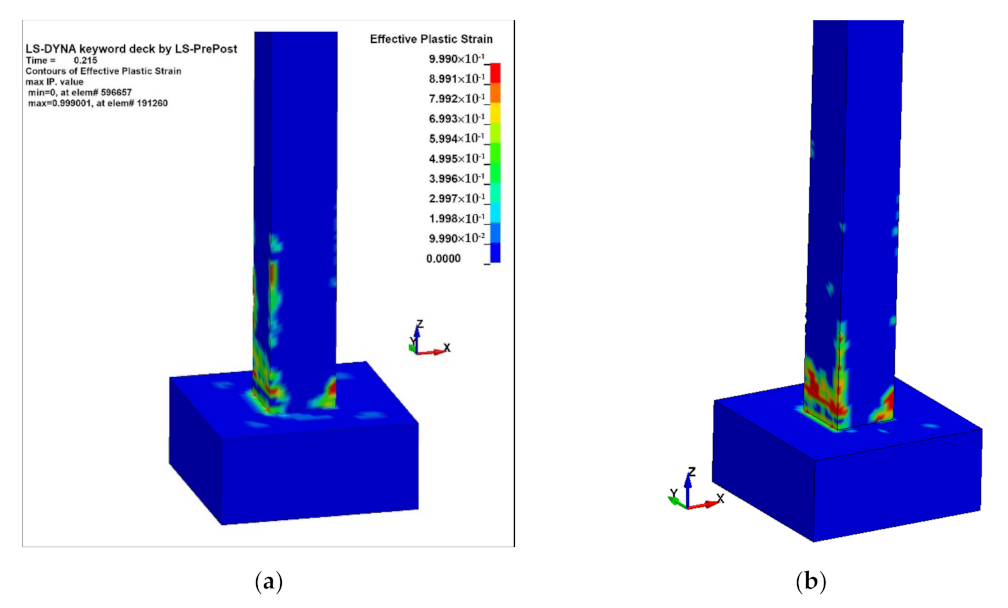
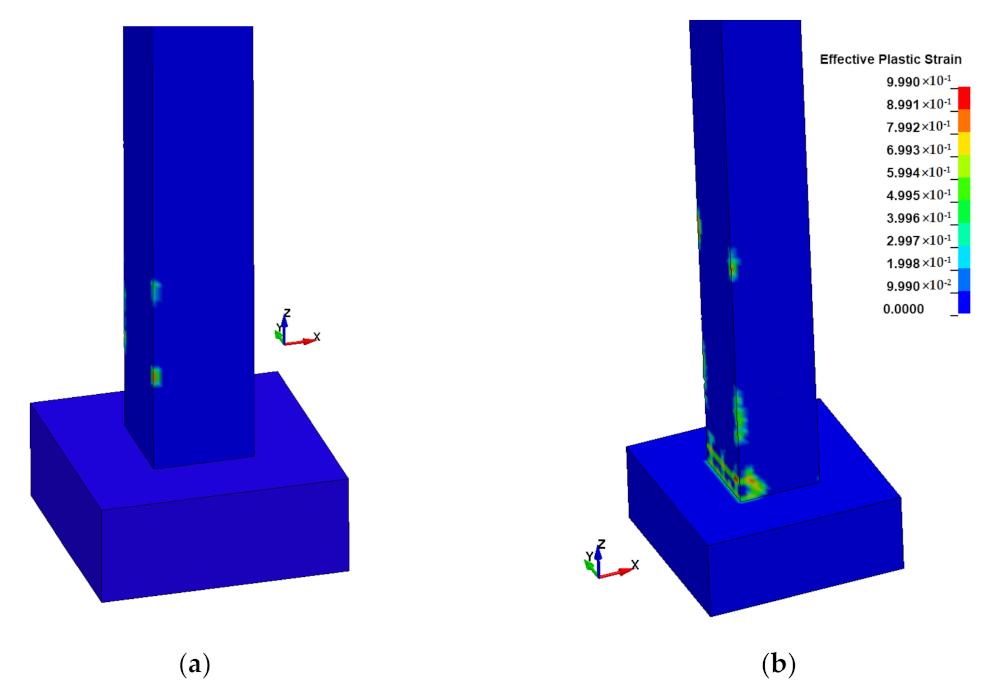
In the event of a car–column collision, the frontal part of the car experiences plastic deformation. This plastic deformation becomes significant when the impact velocity exceeds 15 km/h. In case of a high-speed car crash, the column pierces the front area of the car, as presented in Figure 8. Like the car, the columns also experience some damage as a result of the high-speed impact. Even column C300 fails when the impact speed exceeds 40 km/h. Figure 9 shows the damage contours of columns C300 and C400 for an impact speed of 40 km/h. It can be seen in the figure that column C300 experiences moderate damage at the column–foundation joint as well as at the car crash point. However, as the column size increases, the damage becomes minor, as illustrated in Figure 10. This is true for both types of car collisions. This is due to the fact that as the column size increases, so do shear capacity, flexural capacity, and mass, which increase impact resistance.
5.2. Impact Force Time-History
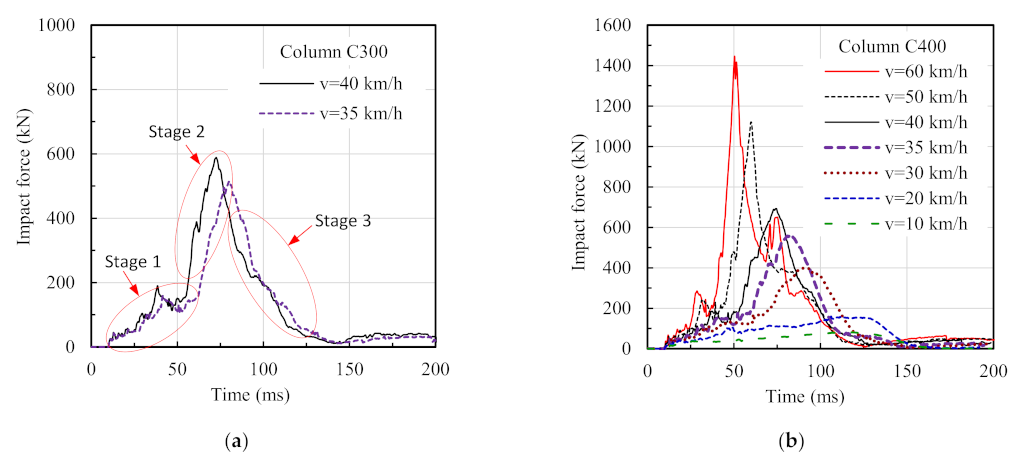
When a car collides with a column, contact force, also known as impact force, is generated at the collision point. Figure 11 shows the impact force-time histories generated during car–column crushes at various car-crashing velocities. The typical impact force-time histories for car crushing velocities of 35 and 40 km/h are shown in Figure 11a. There are stages of impact events. The first stage is soft impact, where the soft frontal part of the car absorbs impact energy by deformation. The second stage can be termed as hard impact, where the car engine gets in contact with the column and pushes it laterally. The last stage (stage 3) is termed as the unloading or rebounding stage of the impact event. As anticipated, the maximum impact force (PIF) increases with the increase in car-crashing velocity, as shown in Figure 11b. This is because of the relationship between kinetic energy and impact velocity for a constant mass. In Figure 11b, it can also be seen that as the impact velocity increases, the duration of peak impact force decreases. The structure may not be able to respond to this short-duration impact force. For this reason, the concept of equivalent static force is developed.
In FE analysis, it was found that up to a car-crashing velocity of 20 km/h, the soft frontal part of the car is damaged and the hard part of the engine box does not come into contact with the column. For this reason, the generated impact force remains below 160 kN. When the crashing speed is increased to 30 km/h and above, the hard part of the engine box comes into contact with the column. As a result, the generated impact force becomes higher than 400 kN, as can be seen in Figure 11b.
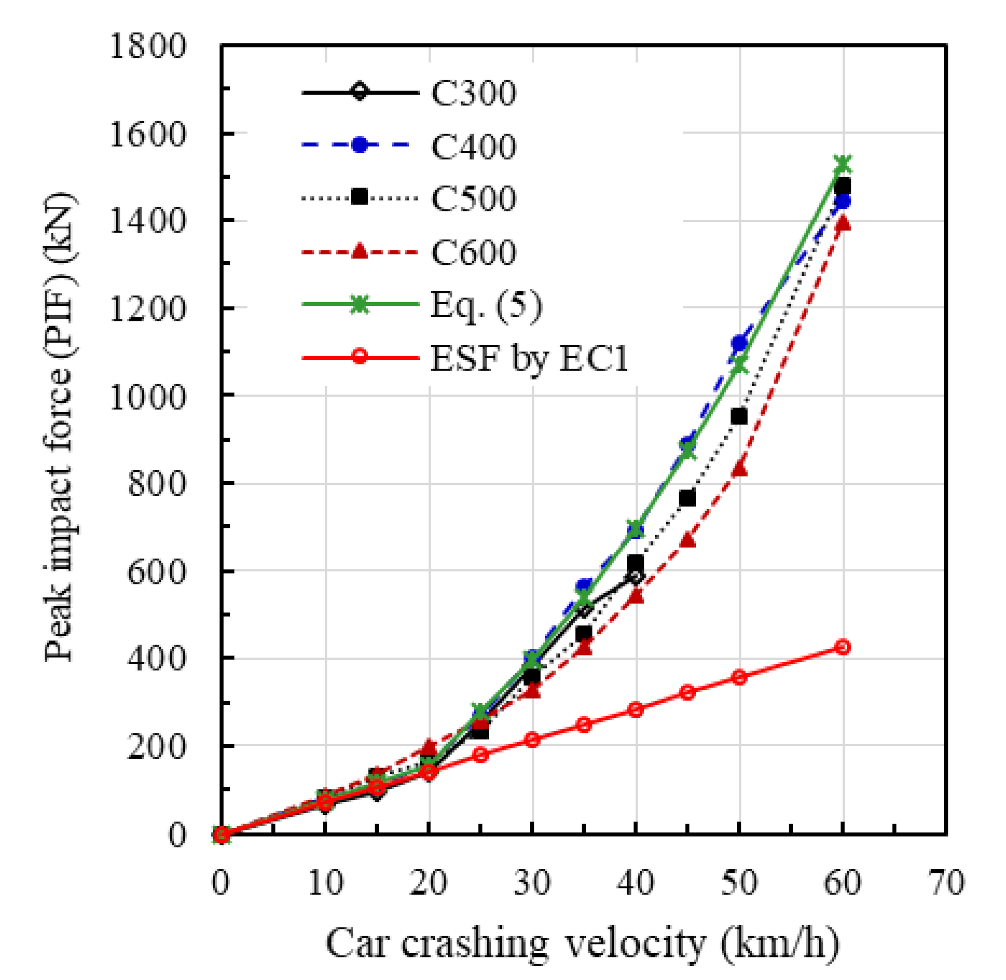
Figure 12 shows the relationship between peak impact forces (PIFs) and the car-crashing velocity. Rates of PIFs increase linearly until the impact speed reaches 20 km/h. At this crashing speed limit, the car experiences deformation in the soft frontal part (distance between the car engine and bumper). In addition, the spring stiffness in this area of the car is nearly constant. As a result, up to a collision speed of 20 km/h, the correlations between PIFs and vehicle speed are almost linear. In contrast, PIF values are increasing in power at twice the speed when the car-crashing speed is from 30 to 60 km/h. Over this impact speed range, the car engine, which is a rather rigid portion of the passenger car, collides with the column. As a result, when the collision speed exceeds 30 km/h, there is a significant increase in impact force. For comparison reasons, in addition to C300 and C400, two more column sizes (C500 and C600) were studied. The size of the cross-section of the column affects the PIF value, as illustrated in Figure 12. Up to a car crushing velocity of 30 km/h, the difference in PIF curves for different column sizes is negligible. Meanwhile, as the column size was reduced, the PIF values increased slightly at car-crashing speeds ranging from 30 to 60 km/h. For example, at a car-crashing velocity of 40 km/h, column C400 produced higher PIFs than C500 and C600. This is due to the fact that reducing the column size reduces the contact area of the crashing point, which results in the deeper penetration of the column inside the vehicle’s frontal part. It should be noted that the impact force increases as the penetration depth increases. This pattern indicates that the stiffness of a vehicle is not constant all over the length of the frontal part. Based on the FE results, the equation of PIFs (in kN) for different car impact velocities is derived as follows,
PIF = 7.67 V for 0 < V ≤ 20 km/h
PIF = 0.54 V1.9376 for 20 < V ≤ 60 km/h
The predicted peak impact forces using Equations (5) and (6) for different car crashing velocities are plotted along with FE results in Figure 12. It can be seen that the proposed equation can predict the PIFs with reasonable accuracy for similar SUV types of car impact with a velocity of up to 60 km/h.
5.3. Effect of Crushing Height on the Impact Force
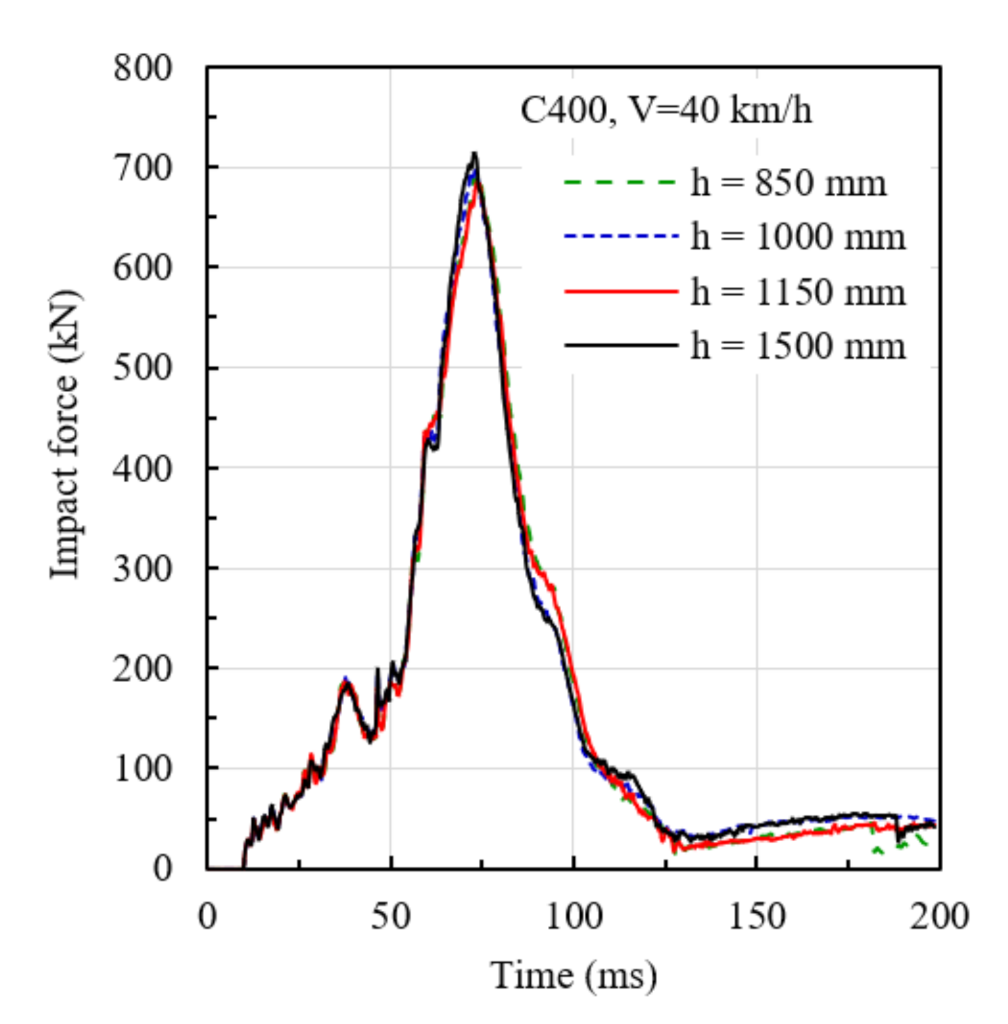
In general, the veered car crashes at the lower part of the column; for this reason, impact height was chosen as the car ground height. According to EC 1 [22], the position of impact loading on the column for a passenger car collision is approximately 500 mm in height from the column’s base. This may be applicable to small and medium-weight passenger cars. On the other hand, for SUV-type seven-seater passenger cars, the height of impact position was found to be approximately 840 mm.
The effect of the impact height on the behavior of RC column was also studied, and it was found that the variation in impact force histories was very little. The peak impact forces were in between 695 to 713 kN for impact heights between 850 and 1300 mm. The impact force-time histories are given in Figure 13. As many studies have shown that the design ESF can be calculated from the impact force-time history [26], the calculated ESF will be almost the same for a crashing height up to 1300 mm. As the column is more rigid than the car, the effect of impact height (between 850 and 1300 mm) on the impact force is very low. However, if the impact location is at the middle of the column, the column will absorb some impact energy by flexural deformation. Therefore, the ESF value will be slightly lower than the ESF value obtained from the impact at the lower part of the column.
5.4. Displacement Time History
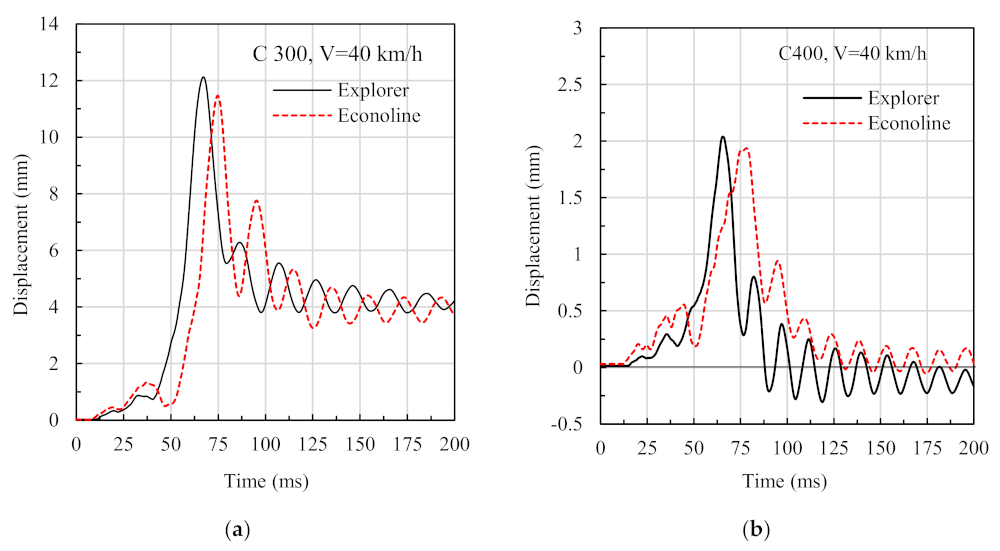
In the event of car crushing, the RC column experiences lateral deflection. Figure 14 displays the lateral deflection-time history of the columns (C300 and C400) at 1740 mm height for a car impact velocity of 40 km/h. The deflection histories of the columns were obtained for two different cars (Econoline and Explorer). It can be seen that the maximum displacements in the columns for both cars are almost the same. The difference in the maximum displacements is less than 6 percent. These negligible differences in the displacements indicate that the frontal stiffness of similar types of cars is almost the same. It is found from the FE analysis that when the impact velocity is 35 km/h or higher, there is residual deflection in column C300. On the other hand, column C400 did not experience any residual deflection when impact velocity is less than or equal to 40 km/h. The FE results showed that elements at the base of column C300 surpass the plastic yield strength at impact speeds greater than 35 km/h. As a result, at these velocities, the column base undergoes plastic rotation, causing permanent deformation in the column. A similar type of plastic deformation occurs for column C400 when the car impact velocity exceeds 40 km/h.
Figure 15 shows the column displacement profile at maximum impact force for columns C300 and C400. Despite the fact that the car collides with the column at the height of 850 mm, the maximum displacement occurs at the height of 1600 to 1800 mm. The displacement profiles of the columns for both car-crashing cases are identical. Figure 15c,d shows the effect of car-crashing velocity on the displacement at 1740 mm height of the column. As anticipated, the column deflection increases with the increase of impact velocity. The column also experiences residual displacement at higher impact velocity, which indicates that the column experiences more damage at higher impact velocity.
Figure 16 shows the effect of reinforcement ratio on lateral displacement at 1740 mm height of columns C300 and C400, as caused by an SUV (Econoline) car impact with a velocity of 40 and 60 km/h, respectively. The axial load was set to the full capacity of the column during the simulation. Column C300 has four longitudinal reinforcements. On the other hand, column C400 has eight longitudinal reinforcements. However, the area of the reinforcement was altered by changing the diameter of the bars. It is found that the maximum displacement of column C300 is reduced with the increase of the reinforcement ratio. A similar phenomenon can also be seen for residual displacement. In the case of column C400, the maximum displacement is slightly decreased as the reinforcement ratio increases. However, there was no significant improvement in the residual displacement at a higher level of enforcement. The average residual displacement of C400 is approximately 1.5 mm, which indicates the plastic damage in the columns. The additional reinforcement increases the axial and flexural capacity of the column. However, the additional longitudinal reinforcement has a minimal contribution to the shear capacity of the RC column. For this reason, after a certain percentage of longitudinal reinforcement, there is no improvement in controlling the lateral displacement of the column against car impact.
It is worth mentioning that the impact angle of the car may have an effect on the performance of the RC column. It is found in the literature [42] that the column is more vulnerable when the car impacts perpendicular to the column face. However, a car impacting at the column’s corners shows more damage than a car impacting on the column’s sides.
6. Performance of Retrofitted Column against Vehicle Impact
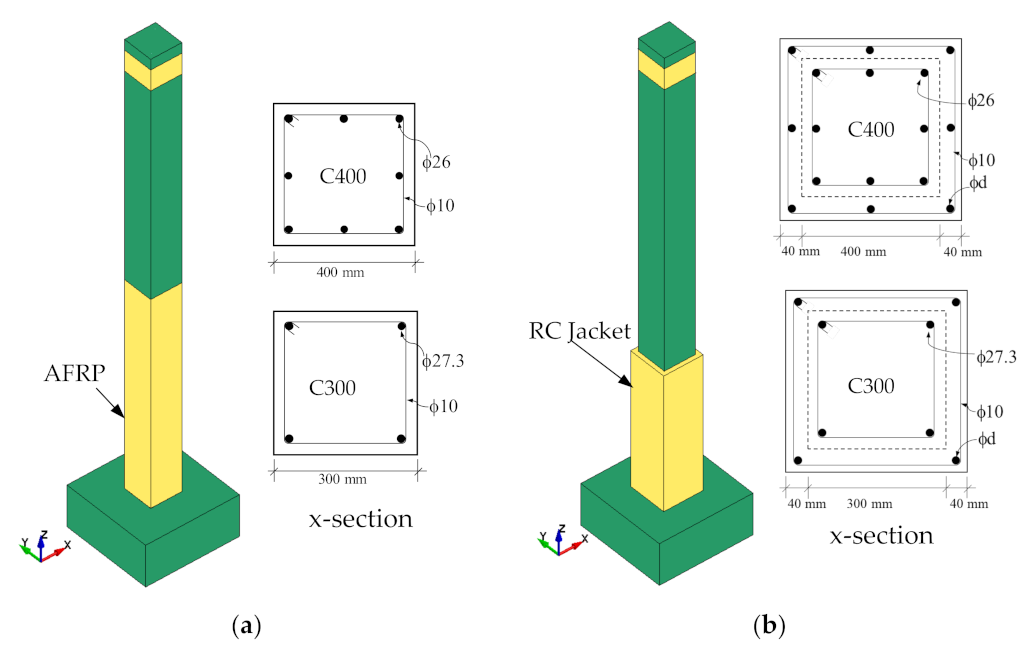
It can be seen that the slender column (C300) experiences permanent residual lateral deformation due to car impacts with an impact velocity of more than 25 km/h. Colum C400 experiences permanent deformation if the car impact velocity is more than 40 km/h. Therefore, it is necessary to provide measures to protect the column from being permanent deformation due to car impacts up to 40 to 50 km/h. There are several methods to reduce the damage in the column against car impacts with an impact velocity of 50 km/h. In this study, the column strength was increased by (1) retrofitting the column with AFRP and (2) providing reinforced concrete jackets (RC jackets) near the column base, as shown in Figure 17.
6.1. Performance of AFRP-Retrofitted Column
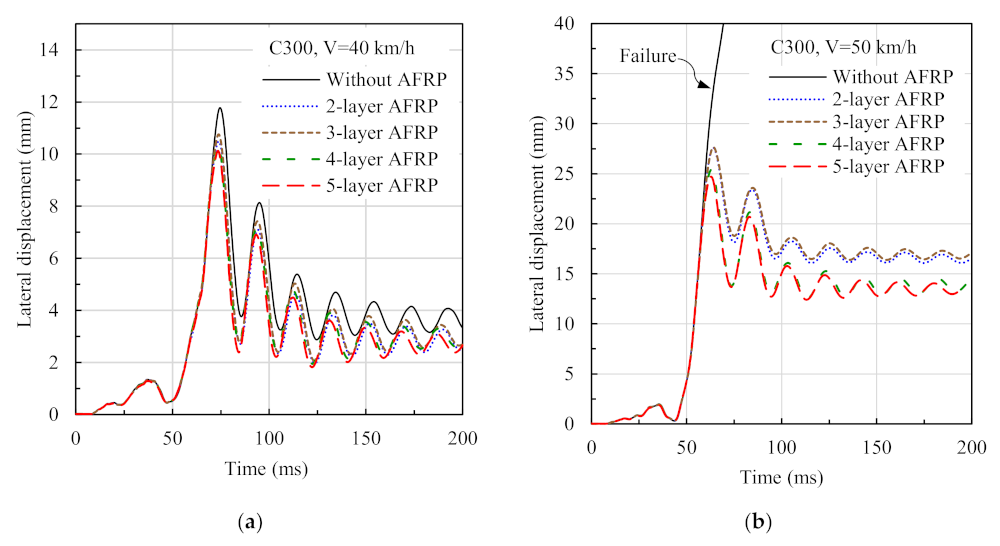
Column C300, with 2.6% reinforcement, is retrofitted with ARFP sheets. The properties of the AFRP are the same as the test column described earlier in the numerical model verification section. The column is jacketed by the AFRP sheet at the bottom half (up to 2 m height) of the column because the damage from the car impact occurs near the base (Figure 17a). Two to five layers of AFRP sheets are used to observe the effect of the AFRP layers on the impact performance of the column. The FE simulations were conducted for car impact velocities of 40 and 50 km/h.
The displacement-time history of the AFRP retrofitted column is shown in Figure 18. With the addition of the AFRP layer to the column, the impact performance of the column is improved. At a car impact velocity of 40 km/h and 2 layers of AFRP sheets, the maximum and residual displacements at the height of 1740 mm are reduced by 12% and 15%, respectively (Figure 18a). Again, at a car impact velocity of 50 km/h, column C300 fails, as indicated in Figure 18b. The failure can be prevented by jacketing the column with two or more layers of AFRP sheets. However, the existence of a large residual displacement (13.5 to 16.5 mm) demonstrates the internal damage of the column. This indicates that the AFRP sheet can reduce the damage of the column but cannot completely eliminate the residual damage for a slender column at moderate car impact velocity. Furthermore, the addition of more than two layers of AFRP does not show any significant improvement in the impact performance of the column, as can be seen in Figure 18. A similar conclusion was drawn by another study, where it was shown that the increasing FRP layers did not improve blast performance significantly [39].
6.2. Performance of Column with RC Jacket
A concrete jacket, 40 mm thick, is provided up to the 1.3 m height of columns C300 and C400, as seen in Figure 17b. The jacket contains an additional amount of longitudinal and shear reinforcement, as indicated in Figure 17b. A varying amount of longitudinal reinforcement is provided in the jacket to find out the optimum amount of reinforcement required for specific car impact velocities (Table 3). This treatment of the column increases the shear and flexural capacity of the column along with the overall stiffness of the column. The shear capacity (Vn) of the axially loaded RC section can be calculated relatively accurately by the formula given by ACI 318-11 [41], as follows:
where fC is the cylinder compressive strength (MPa) of concrete, Ag is the gross concrete area, P is the applied axial force (N), d is the depth of the Column section, b is the width of the column, As is the area of shear reinforcement, fy is the yield strength of shear reinforcement, and S is the spacing of shear reinforcement. The shear capacity of the column with the RC jacket can be calculated using following Equation (8):
where Asj, fyj, and Sj are the area, yield strength, and spacing of the shear reinforcement in the jacket, respectively, and dj is the depth of the RC jacket. The material strength can be increased to consider the strain rate effect, following the formula described in [43]. If the calculated shear capacity, considering the strain rate effect, is equal to or higher than the impact force generated during car impact, the column will not suffer any damage. The damage level can be defined by the damage index (DI), which is the ratio between impact force and shear capacity, as given by Equation (9).
The calculated static shear capacity, PIFs, and damage index (DI) for different columns are given in Table 4. It can be seen from Table 4 that columns C300 and C400 (without RC jackets) suffer permanent deformation at a car impact velocity of 40 and 60 km/h, respectively, where DI values are more than 1.5. However, when a 40-mm-thick RC jacket is provided with minimum shear reinforcement (ϕ10@150 mm spacing), the column is safe for the above-mentioned car-impact velocity. In these cases, the DI values are less than 1.5.
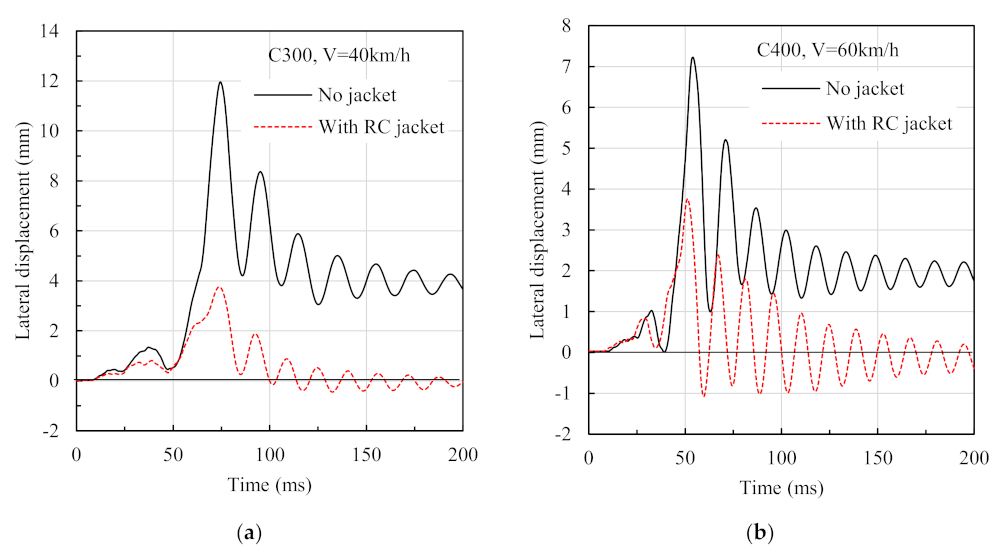
Figure 19 shows the displacement history at the height of 1740 mm of the modified columns due to car impact. As shown in Figure 19a, the maximum displacement of modified column C300 for an impact velocity of 40 km/h is significantly less than that of the column without the RC jacket. Furthermore, at the end of the impact event, no residual (permanent) deformation exists in column C300 with the RC jacket, up to an impact velocity of 40 km/h. Similar to the modified C300 column, the modified C400 column performed significantly better than the original C400 column. The modified C400 column can withstand an impact velocity of 60 km/h without any permanent deformation, as can be seen in Figure 19b. This means that the RC jacket is effective at protecting the original core column from car impact damage up to an impact velocity of 40 km/h for column C300 and 60 km/h for column C400. The RC jacket acts as a protecting barrier of the original column by increasing the stiffness, shear capacity, and mass [44]. Therefore, in designing a column at the parking places, the above findings on providing an RC jacket can be used as a general guideline to set the vehicle-moving velocities inside the car parking places. When the performance of an AFRP-retrofitted column is compared to that of a column with an RC jacket, it is reasonable to conclude that the AFRP jacket is not as effective as the RC jacket in protecting the column against car impacts.
7. Conclusions
In this study, the finite element (FE) model of an axially loaded reinforced concrete column under impact load has been developed. This RC column model and verified car models were used to observe the behavior of RC columns under vehicle impact. The following specific conclusion can be drawn from this study:
- (1)
- The axially loaded column, with a cross-section of 300 × 300 mm2 (C300), is highly vulnerable under the initial car impact with V = 40 km/h. However, the column with a cross-section of 400 × 400 mm2 (C400) is more stable under initial car impact with V = 40 km/h. This implies that increasing column shear capacity by increasing the size of the columns can improve the impact resistance of the column.
- (2)
- Impact forces do not increase linearly with the increase of car initial-impact velocity. Therefore, the estimation of design impact force using the constant stiffness factor proposed by Eurocode 1 is not valid for crashing velocities of more than 20 km/h.
- (3)
- There is no significant effect on the impact force if the car-crashing height changes from 850 to 1500 mm. However, the deformation characteristics of the column are varied with the change of impact height.
- (4)
- There is an improvement in the column performance against car impact when the longitudinal reinforcement ratio increases from 1% to 2.6%. However, adding more than 2.6% of longitudinal reinforcement, there is a minor improvement in controlling the lateral displacement of the column against car impact.
- (5)
- The slender column should be strengthened near the car impact region to avoid any permanent deformation (i.e., internal damage) of the RC column at the parking places of the building. Two systems are proposed in this study, namely, (1) retrofitting the column by AFRP and (2) reinforced concrete jackets (RC jackets) at the column base.
- (6)
- The AFRP warp can reduce maximum lateral displacement and residual displacement, but it cannot eliminate the internal damage of the column. On the other hand, the RC jacket is very effective in reducing the lateral displacement and internal damage of the column. Up to an impact velocity of 40 km/h, a 40-mm-thick RC jacket can completely eliminate any permanent damage to column C300. Similarly, with a 40-mm-thick jacket, column C400 can withstand a car impact velocity of 60 km/h without being damaged.
- (7)
- By comparing the performance of an AFRP-retrofitted column to a column with an RC jacket, it is found that the AFRP jacket is not as effective as the RC jacket for the column against car impact.
- (8)
- Using the damage index specified in Equation (8), the RC jacket can be designed to protect the column against car (SUV type) impact with specific velocities.
Author Contributions
Project administration and funding acquisition, A.A.F.; conceptualization, methodology, software, validation, K.M.A.S.; writing—original draft preparation, writing—review and editing, visualization, supervision, M.A. All authors have read and agreed to the published version of the manuscript.
Funding
This research was funded by the Deanship of Scientific Research at King Faisal University, and the APC was funded by DSR, KFU: Ra’ed Track (grant no. 207012).
Institutional Review Board Statement
Not applicable.
Informed Consent Statement
Not applicable.
Data Availability Statement
Not applicable.
Acknowledgments
The authors acknowledge the Deanship of Scientific Research at King Faisal University, Saudi Arabia, for financial support under Ra’ed Track (grant no. 207012).
Conflicts of Interest
The authors declare no conflict of interest.
References
- Gurbuz, T.; Ilki, A.; Thambiratnam, D.P.; Perera, N. Low-elevation impact tests of axially loaded reinforced concrete columns. ACI Struct. J. 2019, 116, 117–128. [Google Scholar] [CrossRef]
- Thilakarathna, H.M.I.; Thambiratnam, D.P.; Dhanasekar, M.; Perera, N. Numerical simulation of axially loaded concrete columns under transverse impact and vulnerability assessment. Int. J. Impact Eng. 2010, 37, 1100–1112. [Google Scholar] [CrossRef] [Green Version]
- Reiter, R. Crash course: The overlooked threat of vehicle-into-building accidents. Risk Manag. 2014, 61, 40–43. [Google Scholar]
- Yao, J.; Wang, B.; Hou, Y.; Huang, L. Analysis of Vehicle Collision on an Assembled Anti-Collision Guardrail. Sensors 2021, 21, 5152. [Google Scholar] [CrossRef] [PubMed]
- Ferrer, B.; Ivorra, S.; Irles, R. Low velocity vehicle impact against building structures: An outline of relevant codes. Rev. Construcción 2010, 9, 18–25. [Google Scholar] [CrossRef]
- Ferrer, B.; Ivorra, S.; Irles, R.; Mas, D. Real size experiments of a car crash against a building column. In WIT Transactions on the Built Environment; Wessex Institute of Thecnology: Southampton, UK, 2010; Volume 113, pp. 231–241. ISBN 9781845644666. [Google Scholar]
- METRO Metro News. Available online: https://metro.co.uk/2017/10/18/man-faces-50000-repair-bill-after-crashing-rented-car-into-concrete-column-7009575/ (accessed on 26 June 2021).
- Fujikake, K.; Li, B.; Soeun, S. Impact Response of Reinforced Concrete Beam and Its Analytical Evaluation. J. Struct. Eng. 2009, 135, 938–950. [Google Scholar] [CrossRef]
- Kishi, N.; Mikami, H. Empirical formulas for designing reinforced concrete beams under impact loading. ACI Struct. J. 2012, 109, 509–519. [Google Scholar] [CrossRef]
- Pham, T.M.; Hao, H. Plastic hinges and inertia forces in RC beams under impact loads. Int. J. Impact Eng. 2017, 103, 1–11. [Google Scholar] [CrossRef] [Green Version]
- Hu, B.; Cai, J.; Ye, J. Numerical Simulation of Dynamic Response and Evaluation of Flexural Damage of RC Columns under Horizontal Impact Load. Appl. Sci. 2021, 11, 11223. [Google Scholar] [CrossRef]
- Lim, K.M.; Han, T.H.; Lee, J.H. Numerical simulation on dynamic behavior of slab–column connections subjected to blast loads. Appl. Sci. 2021, 11, 7573. [Google Scholar] [CrossRef]
- Zhang, C.; Gholipour, G.; Mousavi, A.A. State-of-the-Art Review on Responses of RC Structures Subjected to Lateral Impact Loads. Arch. Comput. Methods Eng. 2021, 28, 2477–2507. [Google Scholar] [CrossRef]
- Pham, T.M.; Hao, H. Behavior of fiber-reinforced polymer-strengthened reinforced concrete beams under static and impact loads. Int. J. Prot. Struct. 2017, 8, 3–24. [Google Scholar] [CrossRef]
- Gurbuz, T. Impact Performance and Mitigation of Reinforced Concrete Columns. Ph.D. Thesis, Queensland University of Technology, Brisbane, Australia, 2018. [Google Scholar]
- Berardi, V.P. Fracture failure modes in fiber-reinforced polymer systems used for strengthening existing structures. Appl. Sci. 2021, 11, 6344. [Google Scholar] [CrossRef]
- Dong, J.; Zhao, J.; Zhang, D. Numerical Evaluation of Reinforced Concrete Columns Retrofitted with FRP for Blast Mitigation. Adv. Civ. Eng. 2020, 2020, 8884133. [Google Scholar] [CrossRef]
- Lu, J.; Qi, Y.; Li, Y.; Wang, X. Axial compressive performance of a composite concrete-filled GFRP tube square column. Appl. Sci. 2021, 11, 6757. [Google Scholar] [CrossRef]
- Wang, W.; Mo, Z.; Chouw, N.; Jayaraman, K. Renovation effect of flax frp-reinforced cracked concrete slabs under impact loadings. Materials 2021, 14, 6212. [Google Scholar] [CrossRef] [PubMed]
- Liu, B.; Fan, W.; Huang, X.; Shao, X.; Kang, L. A Simplified Method to Predict Damage of Axially-Loaded Circular RC Columns Under Lateral Impact Loading. Int. J. Concr. Struct. Mater. 2020, 14, 32. [Google Scholar] [CrossRef]
- Tsang, H.H.; Lam, N.T.K. Collapse of Reinforced Concrete Column by Vehicle Impact. Comput. Civ. Infrastruct. Eng. 2008, 23, 427–436. [Google Scholar] [CrossRef]
- EN 1991-1-7:2006; Eurocode 1: Actions on Structures-Part 1–7: General Actions—Accidental Actions, 2010 [Incorporating Corrigendum, 20–24 and 53–55]. CEN: Bruxelles, Belgium, 2010.
- Ferrer, B.; Ivorra, S.; Segovia, E.; Irles, R. Tridimensional modelization of the impact of a vehicle against a metallic parking column at a low speed. Eng. Struct. 2010, 32, 1986–1992. [Google Scholar] [CrossRef]
- Al-Thairy, H.; Wang, Y.C. An assessment of the current Eurocode 1 design methods for building structure steel columns under vehicle impact. J. Constr. Steel Res. 2013, 88, 164–171. [Google Scholar] [CrossRef]
- Abdelkarim, O.I.; ElGawady, M.A. Performance of bridge piers under vehicle collision. Eng. Struct. 2017, 140, 337–352. [Google Scholar] [CrossRef]
- Sohel, K.M.A.; Al-Jabri, K.; Al Abri, A.H.S. Behavior and design of reinforced concrete building columns subjected to low-velocity car impact. Structures 2020, 26, 601–616. [Google Scholar] [CrossRef]
- A-SAFE. Building, Wall and Column Impact Protection. Available online: https://www.asafe.com/ar-ae/applications/building-wall-and-column-protection/ (accessed on 30 November 2021).
- Kang, H.; Kim, J. Damage Mitigation of a Steel Column Subjected to Automobile Collision Using a Honeycomb Panel. J. Perform. Constr. Facil. 2020, 34, 04019107. [Google Scholar] [CrossRef]
- Yang, M.; Qiao, P. Analysis of cushion systems for impact protection design of bridges against overheight vehicle collision. Int. J. Impact Eng. 2010, 37, 1220–1228. [Google Scholar] [CrossRef]
- LSTC. LS-DYNA Keyword User’s Manual R11.0 (r:10580)—Vol I; Livermore Software Technology Corporation: Livermore, CA, USA, 2018. [Google Scholar]
- NHTSA. Crash Simulation Vehicle Models|NHTSA. Available online: https://www.nhtsa.gov/crash-simulation-vehicle-models#madymo-occupant-vehicle (accessed on 30 October 2021).
- Sohel, K.M.A.; Richard Liew, J.Y.; Koh, C.G. Numerical modelling of lightweight Steel-Concrete-Steel sandwich composite beams subjected to impact. Thin-Walled Struct. 2015, 94, 135–146. [Google Scholar] [CrossRef]
- LSTC. LS-DYNA Keyword User’s Manual (Material Models) R11.0 (r:10572) —Vol II; Livermore Software Technology Corporation: Livermore, CA, USA, 2018. [Google Scholar]
- Malvar, L.J. Review of static and dynamic properties of steel reinforcing bars. ACI Mater. J. 1998, 95, 609–616. [Google Scholar] [CrossRef]
- Liu, B.; Fan, W.; Guo, W.; Chen, B.; Liu, R. Experimental investigation and improved FE modeling of axially-loaded circular RC columns under lateral impact loading. Eng. Struct. 2017, 152, 619–642. [Google Scholar] [CrossRef]
- Fan, W.; Yuan, W.C. Numerical simulation and analytical modeling of pile-supported structures subjected to ship collisions including soil-structure interaction. Ocean Eng. 2014, 91, 11–27. [Google Scholar] [CrossRef]
- Wu, Y.; Crawford, J.E. Numerical Modeling of Concrete Using a Partially Associative Plasticity Model. J. Eng. Mech. 2015, 141, 04015051. [Google Scholar] [CrossRef]
- Murray, Y.; Abu-Odeh, A.; Bligh, R. Evaluation of LS-DYNA Concrete Material Model 159; Federal Highway Administration: Washington, DC, USA, 2007. [Google Scholar]
- Kong, X.; Qi, X.; Gu, Y.; Lawan, I.A.; Qu, Y. Numerical evaluation of blast resistance of RC slab strengthened with AFRP. Constr. Build. Mater. 2018, 178, 244–253. [Google Scholar] [CrossRef]
- El-Tawil, S.; Severino, E.; Fonseca, P. Vehicle Collision with Bridge Piers. J. Bridge Eng. 2005, 10, 345–353. [Google Scholar] [CrossRef] [Green Version]
- ACI Committee 318. Building Code Requirements for Structural Concrete and Commentary (ACI 318M-11); ACI: Farmington Hills, MI, USA, 2011. [Google Scholar]
- Yi, N.H.; Choi, J.H.; Kim, S.J.; Kim, J.H.J. Collision capacity evaluation of RC columns by impact simulation and probabilistic evaluation. J. Adv. Concr. Technol. 2015, 13, 67–81. [Google Scholar] [CrossRef] [Green Version]
- Liew, J.Y.R.; Sohel, K.M.A.; Koh, C.G. Impact tests on steel-concrete-steel sandwich beams with lightweight concrete core. Eng. Struct. 2009, 31, 2045–2059. [Google Scholar] [CrossRef]
- Sayed, A.M.; Rashwan, M.M.; Helmy, M.E. Experimental behavior of cracked reinforced concrete columns strengthened with reinforced concrete jacketing. Materials 2020, 13, 2832. [Google Scholar] [CrossRef] [PubMed]
Figure 1.
Cars crashed into RC columns on the ground floor [7].
Figure 1.
Cars crashed into RC columns on the ground floor [7].

Figure 2.
Schematic diagram of test setup for the drop weight impact on the RC column [15].
Figure 2.
Schematic diagram of test setup for the drop weight impact on the RC column [15].

Figure 3.
Numerical model of the column under impact load.

Figure 4.
Damage pattern of the axially loaded RC column after impact.

Figure 5.
Deflection−time history of the RC column at a point 2000 mm away from left support: (a) column Imp3; (b) AFRP-retrofitted column ImpA2.
Figure 5.
Deflection−time history of the RC column at a point 2000 mm away from left support: (a) column Imp3; (b) AFRP-retrofitted column ImpA2.

Figure 6.
Finite element model of the Ford Econoline and Explorer vehicles with a column at a parking garage.
Figure 6.
Finite element model of the Ford Econoline and Explorer vehicles with a column at a parking garage.

Figure 7.
Speed limit in the parking garage practiced in Middle East region (e.g., Oman).

Figure 8.
Damage to the car during the collision against the column (column width 400 mm and V = 40 km/h): (a) Ford Econoline car–column collision; (b) Ford Explorer car–column collision.
Figure 8.
Damage to the car during the collision against the column (column width 400 mm and V = 40 km/h): (a) Ford Econoline car–column collision; (b) Ford Explorer car–column collision.

Figure 9.
Column (C300) damage contour for car impact velocity of V = 40 km/h: (a) impacted by Econoline and (b) Explorer.
Figure 9.
Column (C300) damage contour for car impact velocity of V = 40 km/h: (a) impacted by Econoline and (b) Explorer.

Figure 10.
Column (C400) damage contour for car impact velocity of V = 40 km/h: (a) impacted by Econoline and (b) Explorer.
Figure 10.
Column (C400) damage contour for car impact velocity of V = 40 km/h: (a) impacted by Econoline and (b) Explorer.

Figure 11.
Impact force-time histories at the event of car–column collision: (a) typical impact force-time history showing different stages of the impact event; (b) impact force-time histories for different car crashing velocities.
Figure 11.
Impact force-time histories at the event of car–column collision: (a) typical impact force-time history showing different stages of the impact event; (b) impact force-time histories for different car crashing velocities.

Figure 12.
Relationship between PIFs and car crashing velocity.

Figure 13.
Effect of crushing height on the impact force.

Figure 14.
Lateral displacement time histories at 1740 mm height of the columns during the car crash with a velocity of 40 km/h: (a) column size 300 × 300 mm; (b) Column size 400 × 400 mm.
Figure 14.
Lateral displacement time histories at 1740 mm height of the columns during the car crash with a velocity of 40 km/h: (a) column size 300 × 300 mm; (b) Column size 400 × 400 mm.

Figure 15.
Deformation profile of column at maximum impact force (V = 40 km/h): (a) column size 300 × 300 mm; (b) column size 400 × 400 mm; (c) variation in column displacement history with car impact velocity; (d) effect of car (Econoline) impact velocity on the maximum displacement of column.
Figure 15.
Deformation profile of column at maximum impact force (V = 40 km/h): (a) column size 300 × 300 mm; (b) column size 400 × 400 mm; (c) variation in column displacement history with car impact velocity; (d) effect of car (Econoline) impact velocity on the maximum displacement of column.

Figure 16.
Effect of reinforcement ratio on the lateral displacement at 1740 m height: (a) column size 300 × 300 mm and impact velocity of 40 km/h; (b) column size 400 × 400 mm and impact velocity of 60 km/h.
Figure 16.
Effect of reinforcement ratio on the lateral displacement at 1740 m height: (a) column size 300 × 300 mm and impact velocity of 40 km/h; (b) column size 400 × 400 mm and impact velocity of 60 km/h.

Figure 17.
Column protection by: (a) AFRP sheet; (b) RC jacket.

Figure 18.
Displacement history of AFRP-retrofitted column C300: (a) car impact velocity of 40 km/h; (b) car impact velocity of 50 km/h.
Figure 18.
Displacement history of AFRP-retrofitted column C300: (a) car impact velocity of 40 km/h; (b) car impact velocity of 50 km/h.

Figure 19.
Displacement history of columns with an RC jacket with ϕ10@150 mm shear reinforcement up to 1.3 m height of the column: (a) column size 300 × 300 mm and impact velocity of 40 km/h; (b) column size 400 × 400 mm and impact velocity of 60 km/h.
Figure 19.
Displacement history of columns with an RC jacket with ϕ10@150 mm shear reinforcement up to 1.3 m height of the column: (a) column size 300 × 300 mm and impact velocity of 40 km/h; (b) column size 400 × 400 mm and impact velocity of 60 km/h.


Table 1.
Mechanical properties of AFRP.
| Fabric Density (kg/m3) | Fabric Thickness (mm) | Tensile Strength (MPa) | Elastic Modulus (GPa) | Ultimate Strain |
|---|---|---|---|---|
| 1450 | 0.2 | 3200 | 120 | 0.024 |
Table 2.
Main features of the vehicle model.
| Econoline | Explorer | |
|---|---|---|
| Number of parts | 438 | 923 |
| Number of nodes | 295,555 | 724,628 |
| Number of solids | 15,952 | 33,690 |
| Number of beams | 2 | 185 |
| Number of springs | 6 | 42 |
| Number of mass elements | 90 | 456 |
| Number of shells | 278,535 | 680,288 |
| Number of elements | 300,066 | 714,661 |
Table 3.
Performance of columns with RC jackets against car impact.
| Column (ρs) | Jacket Thickness (mm) | Longitudinal Reinforcement in Jacket | Shear Reinforcement in the Jacket | Car Impact Velocity (km/h) | Maximum Deflection (mm) | Residual Deflection (mm) |
|---|---|---|---|---|---|---|
| C300 (2.6%) | 0* | 0 | 0 | 40 | 11.78 | 3.65 |
| 40 | 4 ϕ10.0 | ϕ10@150 mm | 40 | 4.16 | 0 | |
| 40 | 4 ϕ10.0 | ϕ10@150 mm | 50 | 9.18 | 1.26 | |
| 40 | 4 ϕ12.0 | ϕ10@150 mm | 40 | 4.15 | 0 | |
| 40 | 4 ϕ27.3 | ϕ10@150 mm | 40 | 3.58 | 0 | |
| C300 (1.13%) | 40 | 4 ϕ18.0 | ϕ10@150 mm | 40 | 0 | |
| 40 | 4 ϕ10.0 | ϕ10@150 mm | 40 | 4.72 | 0 | |
| C400 (2.6%) | 0 * | 0 | 0 | 60 | 6.65 | 1.15 |
| 40 | 8 ϕ10.0 | ϕ10@150 mm | 60 | 3.74 | 0 | |
| 40 | 8 ϕ12.0 | ϕ10@150 mm | 60 | 3.53 | 0 | |
| 40 | 8 ϕ18.0 | ϕ10@150 mm | 60 | 3.50 | 0 | |
| 40 | 8 ϕ26.0 | ϕ10@150 mm | 60 | 3.42 | 0 | |
| C400 (1.13%) | 40 | 8 ϕ10.0 | ϕ10@150mm | 60 | 3.78 | 0.4 |
* Column without RC jacket; ρs = reinforcement ratio.
Table 4.
Damage index and observation.
| Column (ρs) | Jacket Thickness (mm) | Longitudinal Reinforcement in Jacket | Shear Capacity at RC Jacket (kN) | Car Impact Velocity (km/h) | PIF (kN) | DI | Observation from FE Analysis |
|---|---|---|---|---|---|---|---|
| C300 (2.6%) | 0 * | 0 | 408.5 | 40 | 686.35 | 1.68 | Major cracks and residual displacement |
| 40 | 4 ϕ10.0 | 660.1 | 40 | 686.35 | 1.04 | No residual deformation, some cracks in the jacket | |
| 40 | 4 ϕ10.0 | 660.1 | 50 | 1057.59 | 1.60 | Cracking at base and residual displacement | |
| 40 | 4 ϕ12.0 | 660.1 | 40 | 686.35 | 1.04 | No residual deformation, some cracks in the jacket | |
| 40 | 4 ϕ27.3 | 660.1 | 40 | 686.35 | 1.04 | No residual deformation, some cracks in the jacket | |
| C300 (1.13%) | 40 | 4 ϕ10.0 | 619.3 | 40 | 686.35 | 1.11 | No residual deformation, some cracks in the jacket |
| C400 (2.6%) | 0* | 0 | 702.8 | 60 | 1505.0 | 2.14 | Column base yielded and residual deformation |
| 40 | 8 ϕ10.0 | 1028.7 | 60 | 1505.0 | 1.46 | No residual deformation, some cracks in the jacket | |
| 40 | 8 ϕ12.0 | 1028.7 | 60 | 1505.0 | 1.46 | No residual deformation, some cracks in the jacket | |
| 40 | 8 ϕ18.0 | 1028.7 | 60 | 1505.0 | 1.46 | No residual deformation, some cracks in the jacket | |
| 40 | 8 ϕ26.0 | 1028.7 | 60 | 1505.0 | 1.46 | No residual deformation, some cracks in the jacket | |
| C400 (1.13%) | 40 | 8 ϕ10.0 | 960.1 | 60 | 1505.0 | 1.57 | Minor damage in the column and jacket |
* Shear reinforcement in the jacket is ϕ10@150 mm.
Publisher’s Note: MDPI stays neutral with regard to jurisdictional claims in published maps and institutional affiliations. |
© 2022 by the authors. Licensee MDPI, Basel, Switzerland. This article is an open access article distributed under the terms and conditions of the Creative Commons Attribution (CC BY) license (https://creativecommons.org/licenses/by/4.0/).
Share and Cite
MDPI and ACS Style
Fuhaid, A.A.; Sohel, K.M.A.; Arifuzzaman, M. The Effect of Strengthening Methods on the Performance of Reinforced Concrete Columns against Vehicle Impact. Appl. Sci. 2022, 12, 1382. https://0-doi-org.brum.beds.ac.uk/10.3390/app12031382
AMA Style
Fuhaid AA, Sohel KMA, Arifuzzaman M. The Effect of Strengthening Methods on the Performance of Reinforced Concrete Columns against Vehicle Impact. Applied Sciences. 2022; 12(3):1382. https://0-doi-org.brum.beds.ac.uk/10.3390/app12031382
Chicago/Turabian StyleFuhaid, Abdulrahman Al, Kazi Md Abu Sohel, and Md Arifuzzaman. 2022. "The Effect of Strengthening Methods on the Performance of Reinforced Concrete Columns against Vehicle Impact" Applied Sciences 12, no. 3: 1382. https://0-doi-org.brum.beds.ac.uk/10.3390/app12031382
Note that from the first issue of 2016, this journal uses article numbers instead of page numbers. See further details here.