Article

Multimodal Feature-Assisted Continuous Driver Behavior Analysis and Solving for Edge-Enabled Internet of Connected Vehicles Using Deep Learning

1
Department of Information Systems and Technology, College of Computer Science and Engineering, University of Jeddah, Jeddah 23218, Saudi Arabia
2
Department of Computer Science and Artificial Intelligence, College of Computer Science and Engineering, University of Jeddah, Jeddah 21959, Saudi Arabia
3
Department of Mathematics & Mechanics, Saint Petersburg State University, 199178 St. Petersburg, Russia
4
Department of Communication Networks and Data Transmission, St. Petersburg State University of Telecommunications, 193232 St. Petersburg, Russia
5
Department of Applied Probability and Informatics, Peoples’ Friendship University of Russia (RUDN University), 6 Miklukho-Maklaya St., 117198 Moscow, Russia
6
Computer Science Department, Community College, Shaqra University, Shaqra 11961, Saudi Arabia
*
Author to whom correspondence should be addressed.
Submission received: 26 June 2021 / Revised: 30 October 2021 / Accepted: 3 November 2021 / Published: 7 November 2021
(This article belongs to the Special Issue 5G and Beyond Fiber-Wireless Network Communications)

Abstract

:
The emerging technology of internet of connected vehicles (IoCV) introduced many new solutions for accident prevention and traffic safety by monitoring the behavior of drivers. In addition, monitoring drivers’ behavior to reduce accidents has attracted considerable attention from industry and academic researchers in recent years. However, there are still many issues that have not been addressed due to the lack of feature extraction. To this end, in this paper, we propose the multimodal driver analysis internet of connected vehicles (MODAL-IoCV) approach for analyzing drivers’ behavior using a deep learning method. This approach includes three consecutive phases. In the first phase, the hidden Markov model (HMM) is proposed to predict vehicle motion and lane changes. In the second phase, SqueezeNet is proposed to perform feature extraction from these classes. Lastly, in the final phase, tri-agent-based soft actor critic (TA-SAC) is proposed for recommendation and route planning, in which each driver is precisely handled by an edge node for personalized assistance. Finally, detailed experimental results prove that our proposed MODAL-IoCV method can achieve high performance in terms of latency, accuracy, false alarm rate, and motion prediction error compared to existing works.

1. Introduction

In intelligent transportation systems (ITSs), driver behavior analysis is the most exploited topic in terms of emergency events reduction [1]. If any abnormal behavior occurs on the roadside, the service not only highlights the wrong information to the driver, but also affects the transportation system around the vehicle [2]. For instance, accidents and road risks are caused by high volumes of traffic and the speed of vehicles [3].
Recently, driver behavior analysis based on the continuous monitoring of visual features (driver’s actions) has been used for managing risks in the roadside environment [4,5]. However, determining the driver’s status based on visual facial features is inadequate for driver behavior analysis [6]. In-built vehicle sensors are used to monitor steering wheel movement, and the standard deviation of lane changes and position [7]. Furthermore, physiological signal parameters, such as a trocardiograph (ECG), electroencephalogram (EEG), and electromyogram (EMG), are used to measure health issues [8]. Therefore, driver, vehicle, and roadside parameters are utilized to continuously monitor driver behavior [9,10].
Most of the previous works in this field lack in identifying the various driver and vehicle parameters [11]. Such driver behavior monitoring suffers by not alerting roadside pedestrians and other vehicles that are traveling on the non-safe driver’s path [12]. Some of the input parameters for monitoring driver behavior are gravity, throttle, speed, revolutions per minute, and acceleration. The types of driver behavior are normal, aggressive, distracted, drowsy, and drunk driving [13,14]. This information is measured by sensors that are placed on the vehicle. Each vehicle is connected to the roadside units (RSU) and each vehicle has microphones, frontal cameras, and road cameras (as shown in Figure 1).
In driver behavior monitoring, vehicle motion prediction and lane change detection are often utilized since drivers frequently change lanes with high motion [15]. This causes any risks to avoid nearby vehicles and roadside pedestrians [16]. As a result, vehicle velocity, distance, and the position of the vehicle are observed to predict the sudden change of motion from past sequences [17]. There are two successive procedures that are implemented if any abnormal behaviors are detected: route planning and personalized assistance [18]. Route planning based on drivers’ current preferences was not discussed earlier. This is significant in monitoring and providing assistance to drivers to ensure traffic and driver safety [19]. Hence, both assistance and route planning is provided in this study. Moreover, minimal research has been presented regarding disseminating warning messages to nearby vehicles [20].

1.1. Research Aim and Objectives

The main research aim is to design a safe roadside environment (i.e., ensure driver safety, pedestrian safety and neighboring vehicle safety). This can be achieved with the continuous monitoring of vehicle motion and lane change deviation, and processing other multimodal features is important for accurate driver behavior analysis. Another aim of the study was to reduce the overhead of the whole network by introducing a multiaccess edge environment—an end-to-end architecture for driver behavior analysis and solving roadside risks via personalized assistance and route planning. The common issues that are faced in driver behavior analysis are as follows:
  • High overhead: The huge volume of data processing in RSU increases the message overhead; the cloud-based computing environment that is used for warning message generation for driver behavior increases the latency in alert generation; the prevention of road traffic is not possible;
  • Lack of optimum recommendation: Most of the existing works have focused on driver behavior analysis/prediction; however, if the behavior was abnormal, solving it was not discussed in the current research papers. Recommendations for solving abnormal behavior and reducing damage (economic loss, accidents to pedestrians and passengers (inside the vehicle), and health issues of driver) are lacking.

1.2. Research Contribution

The contributions of our multimodal feature-based driver behavior analysis method are defined as follows:
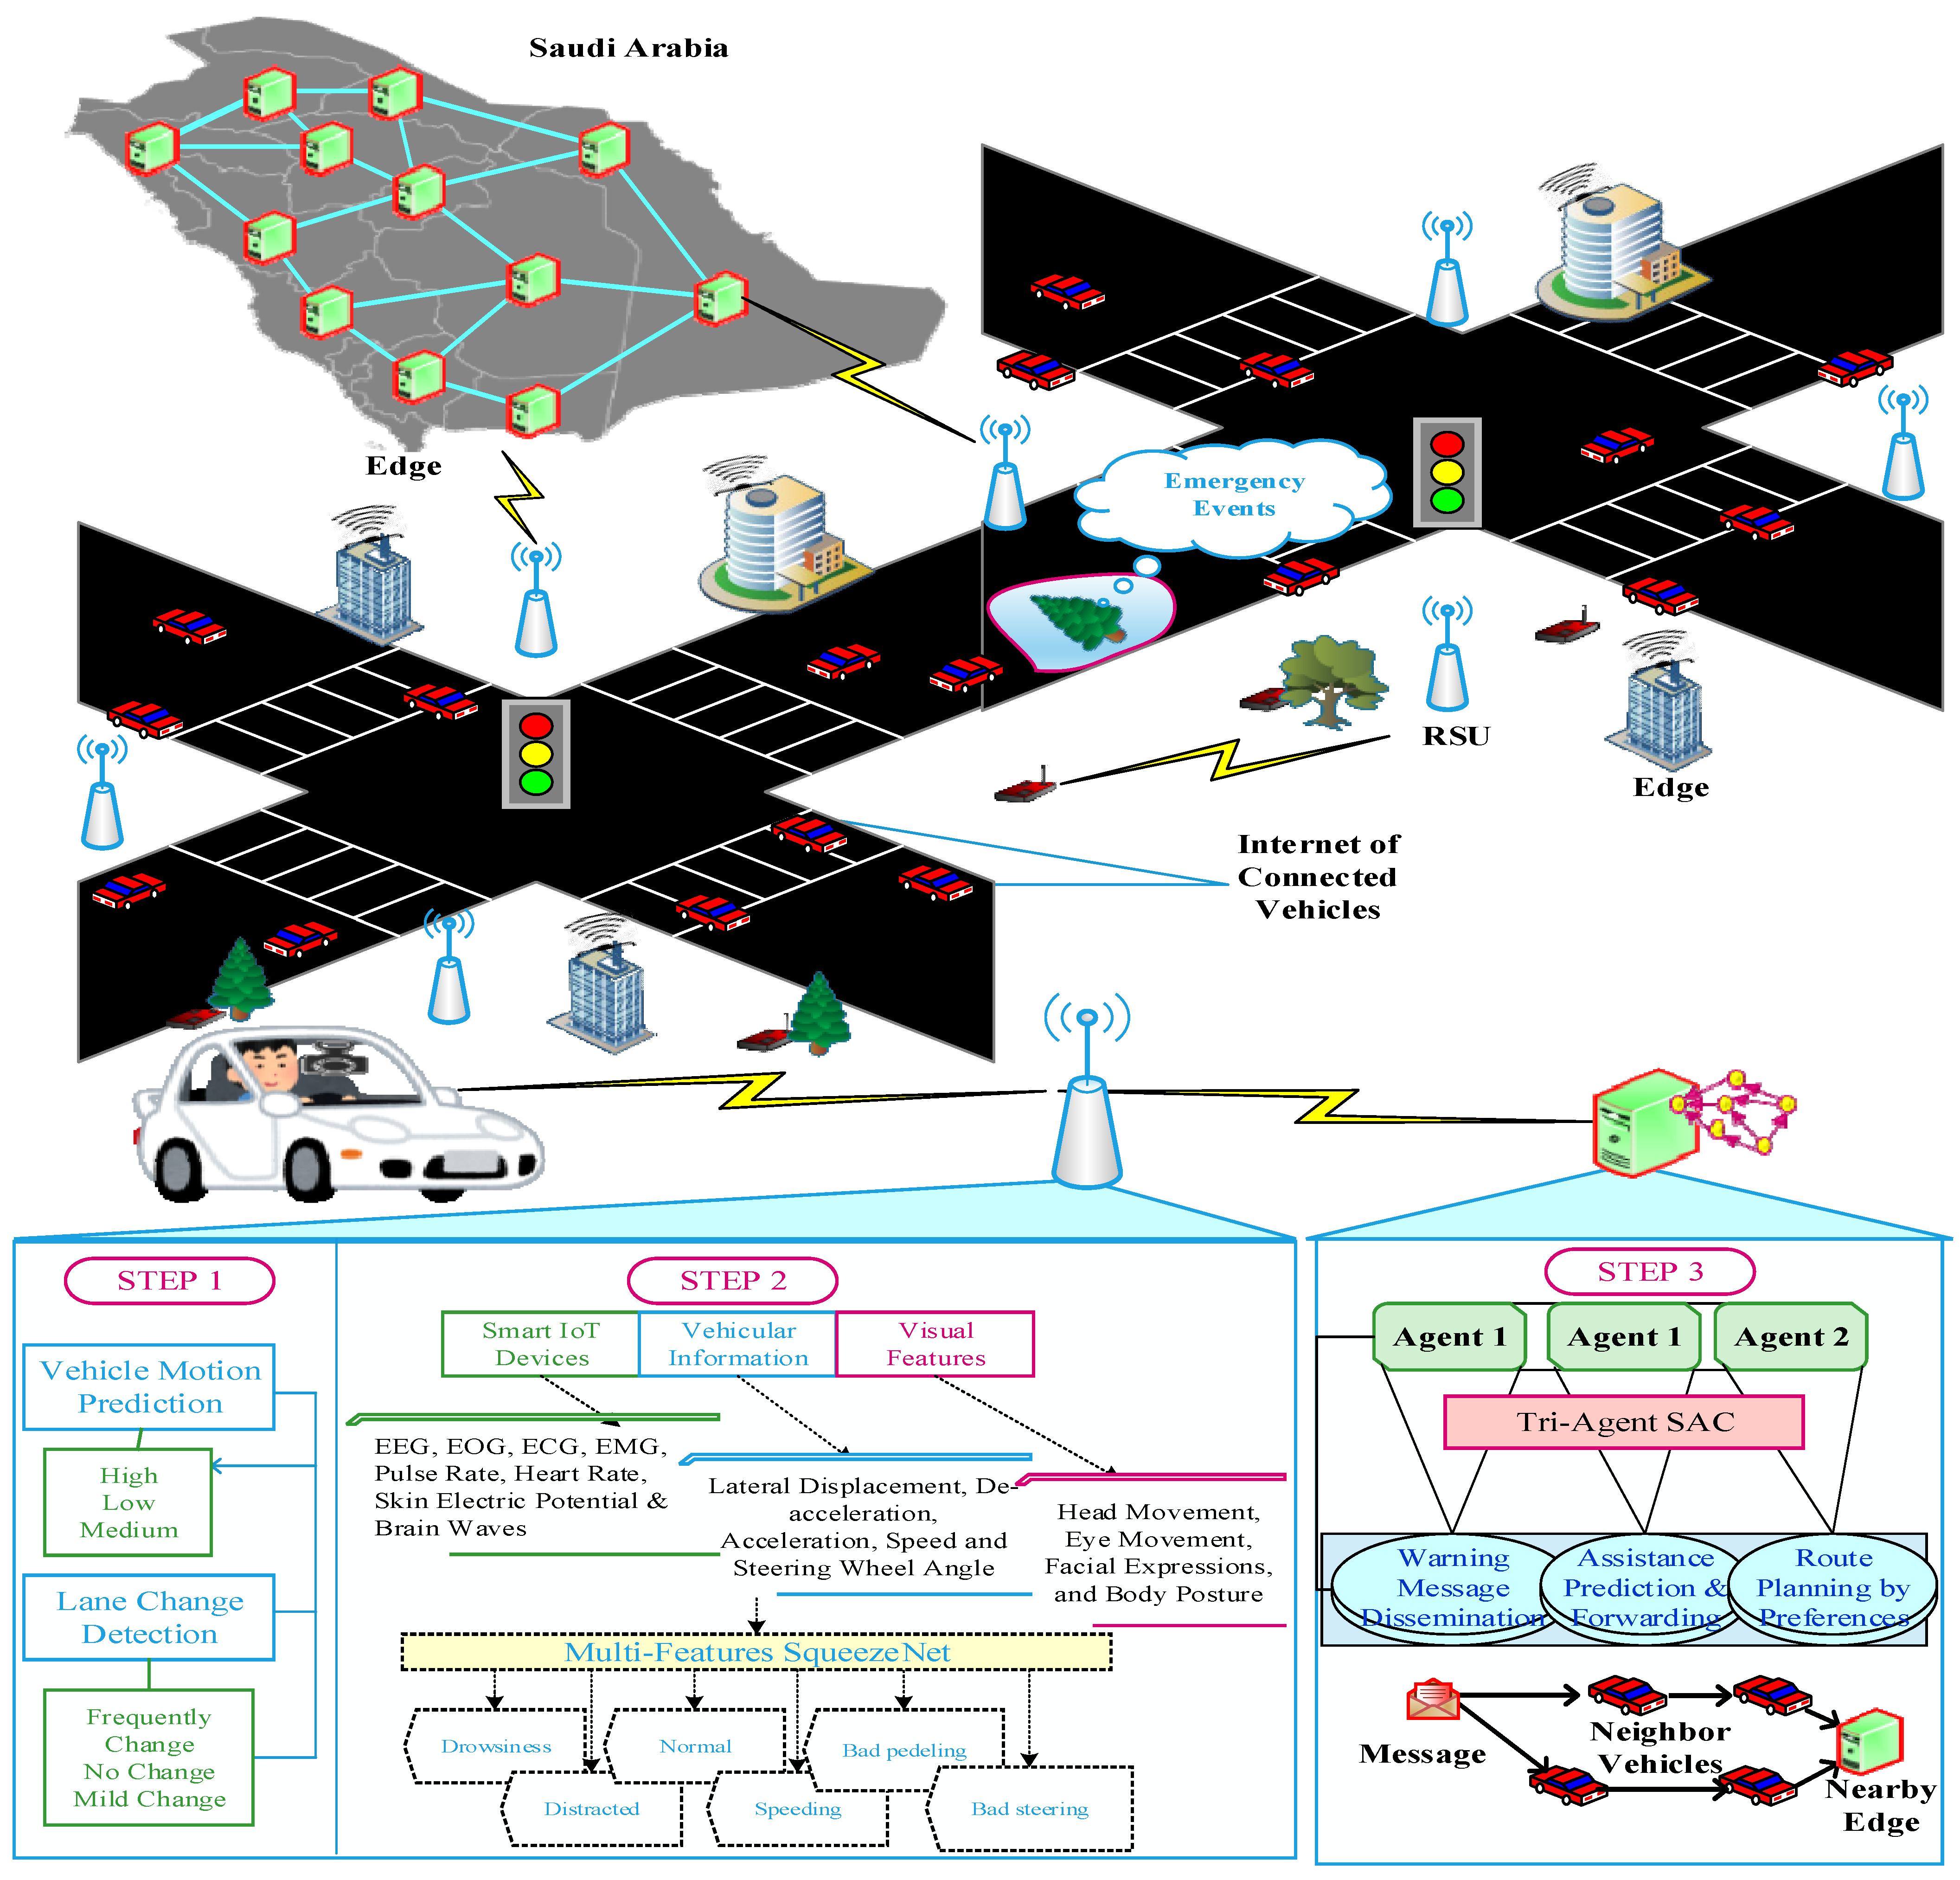
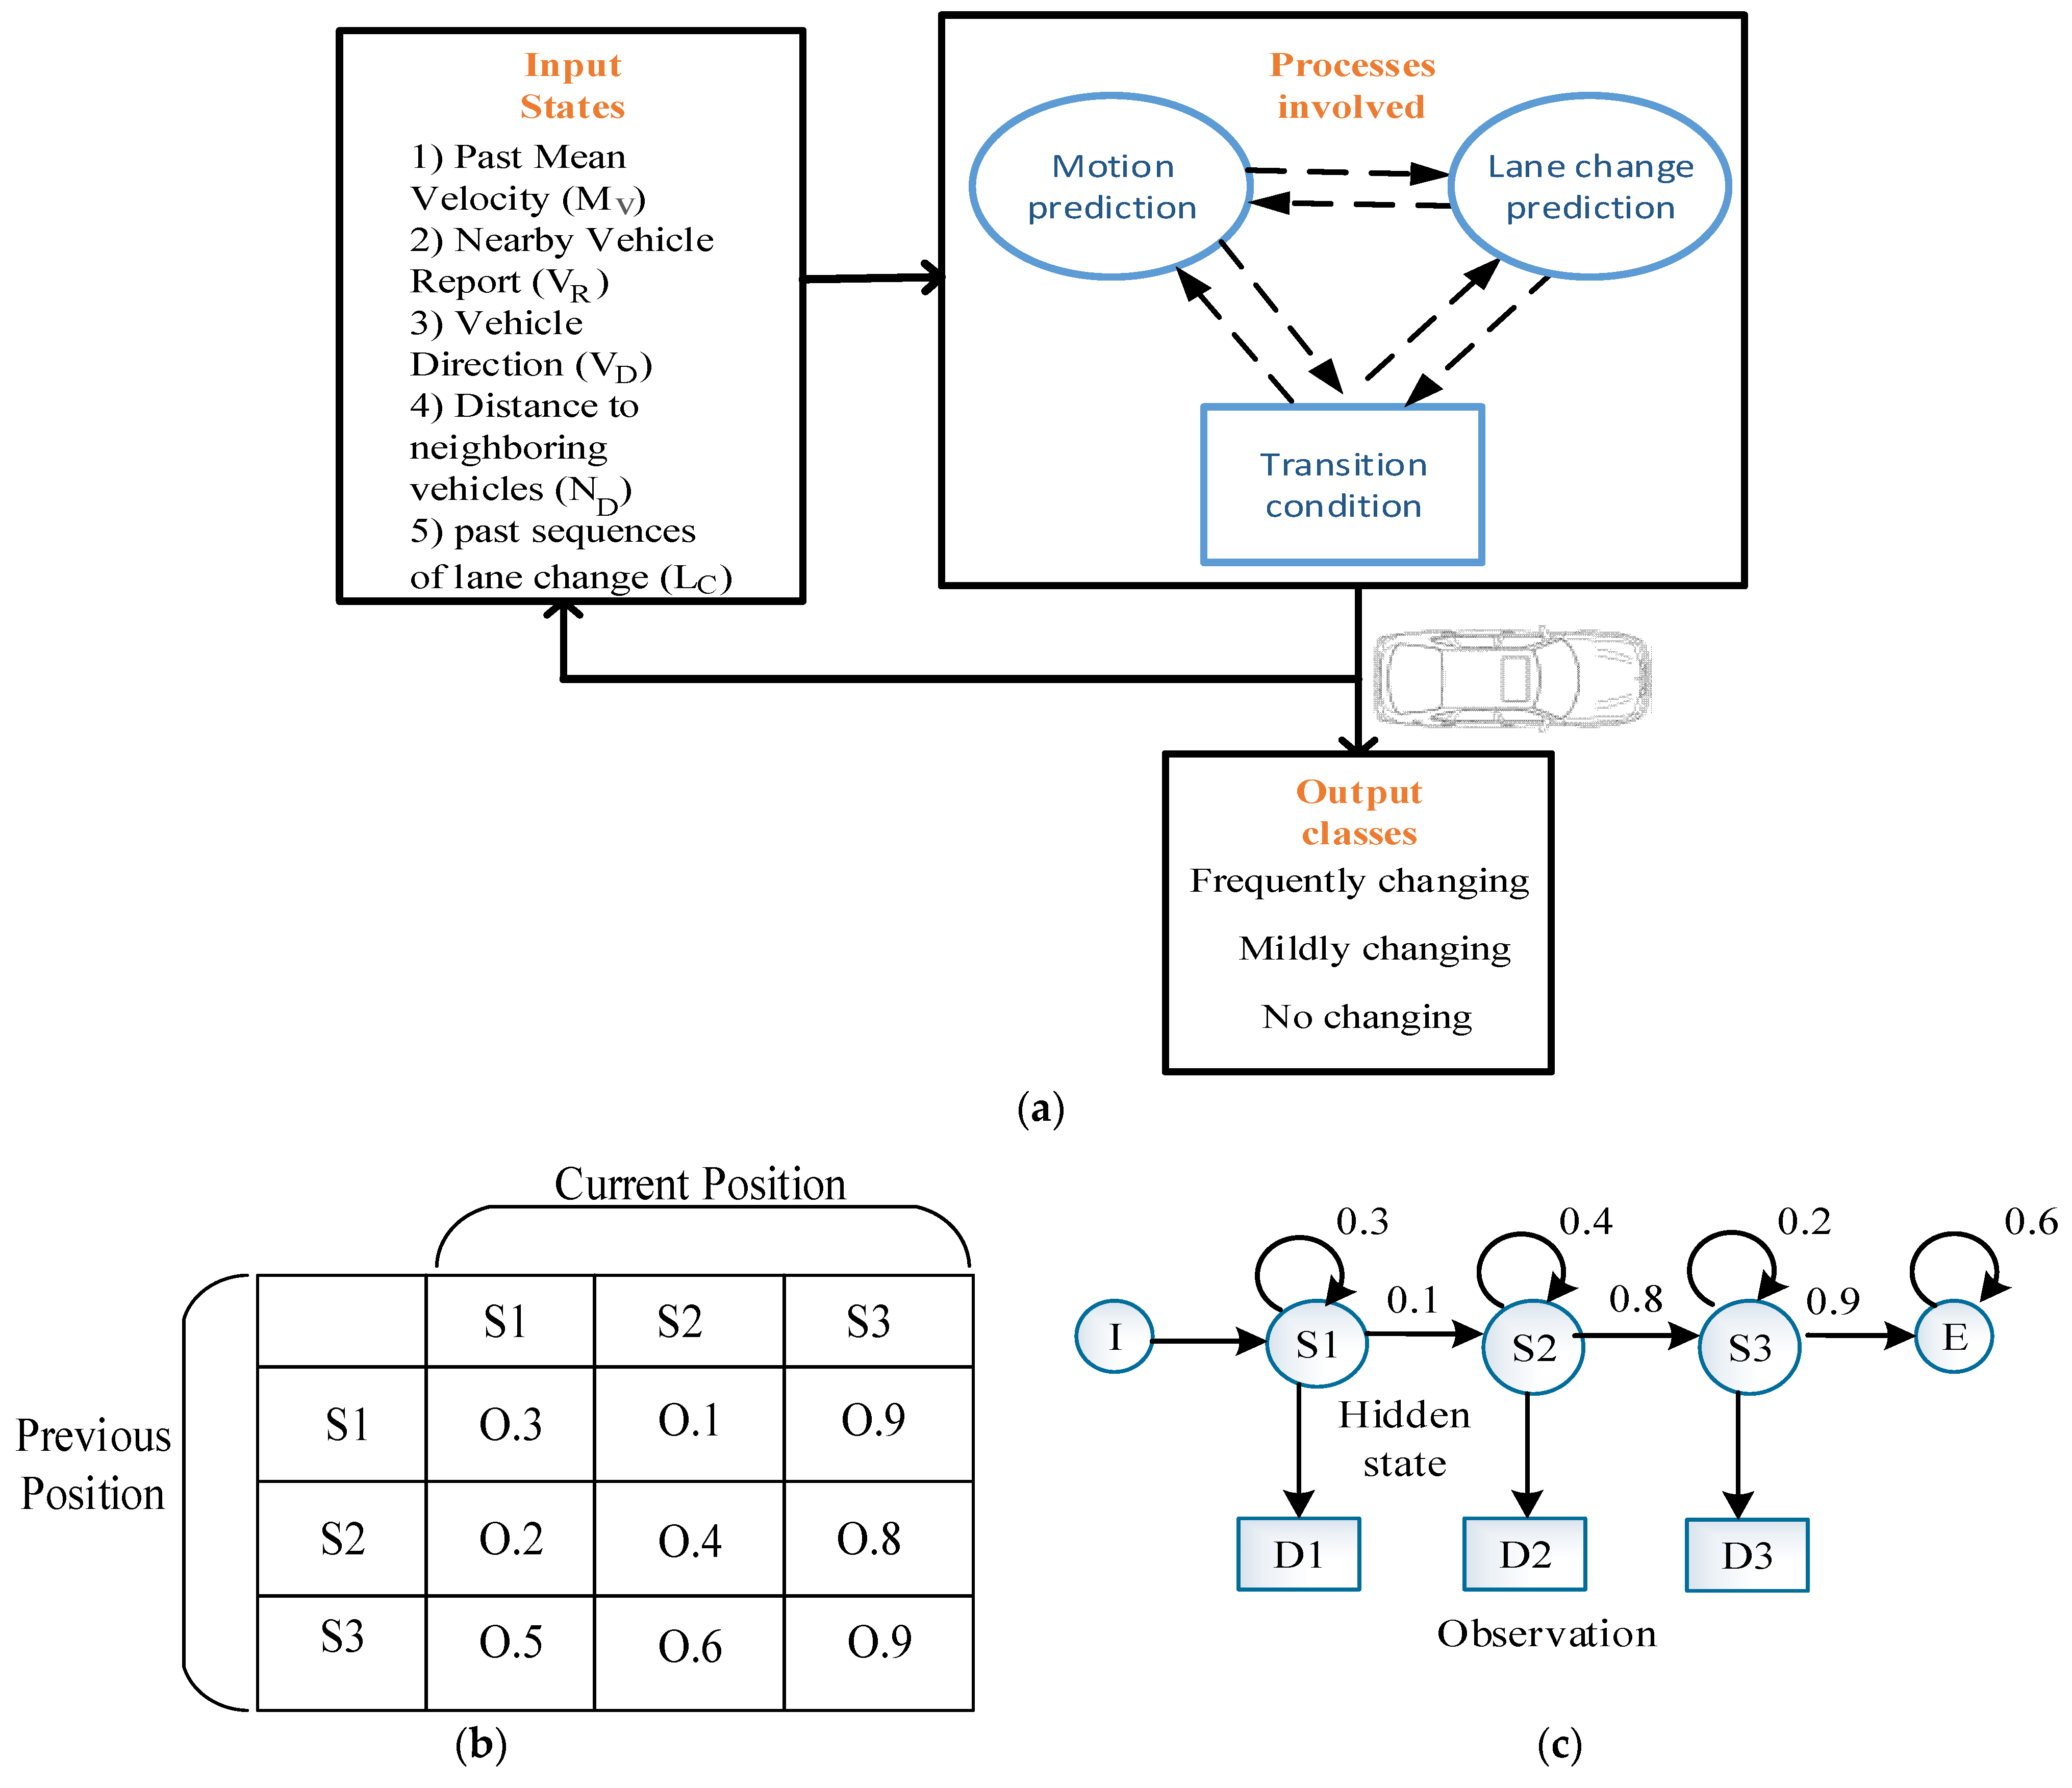
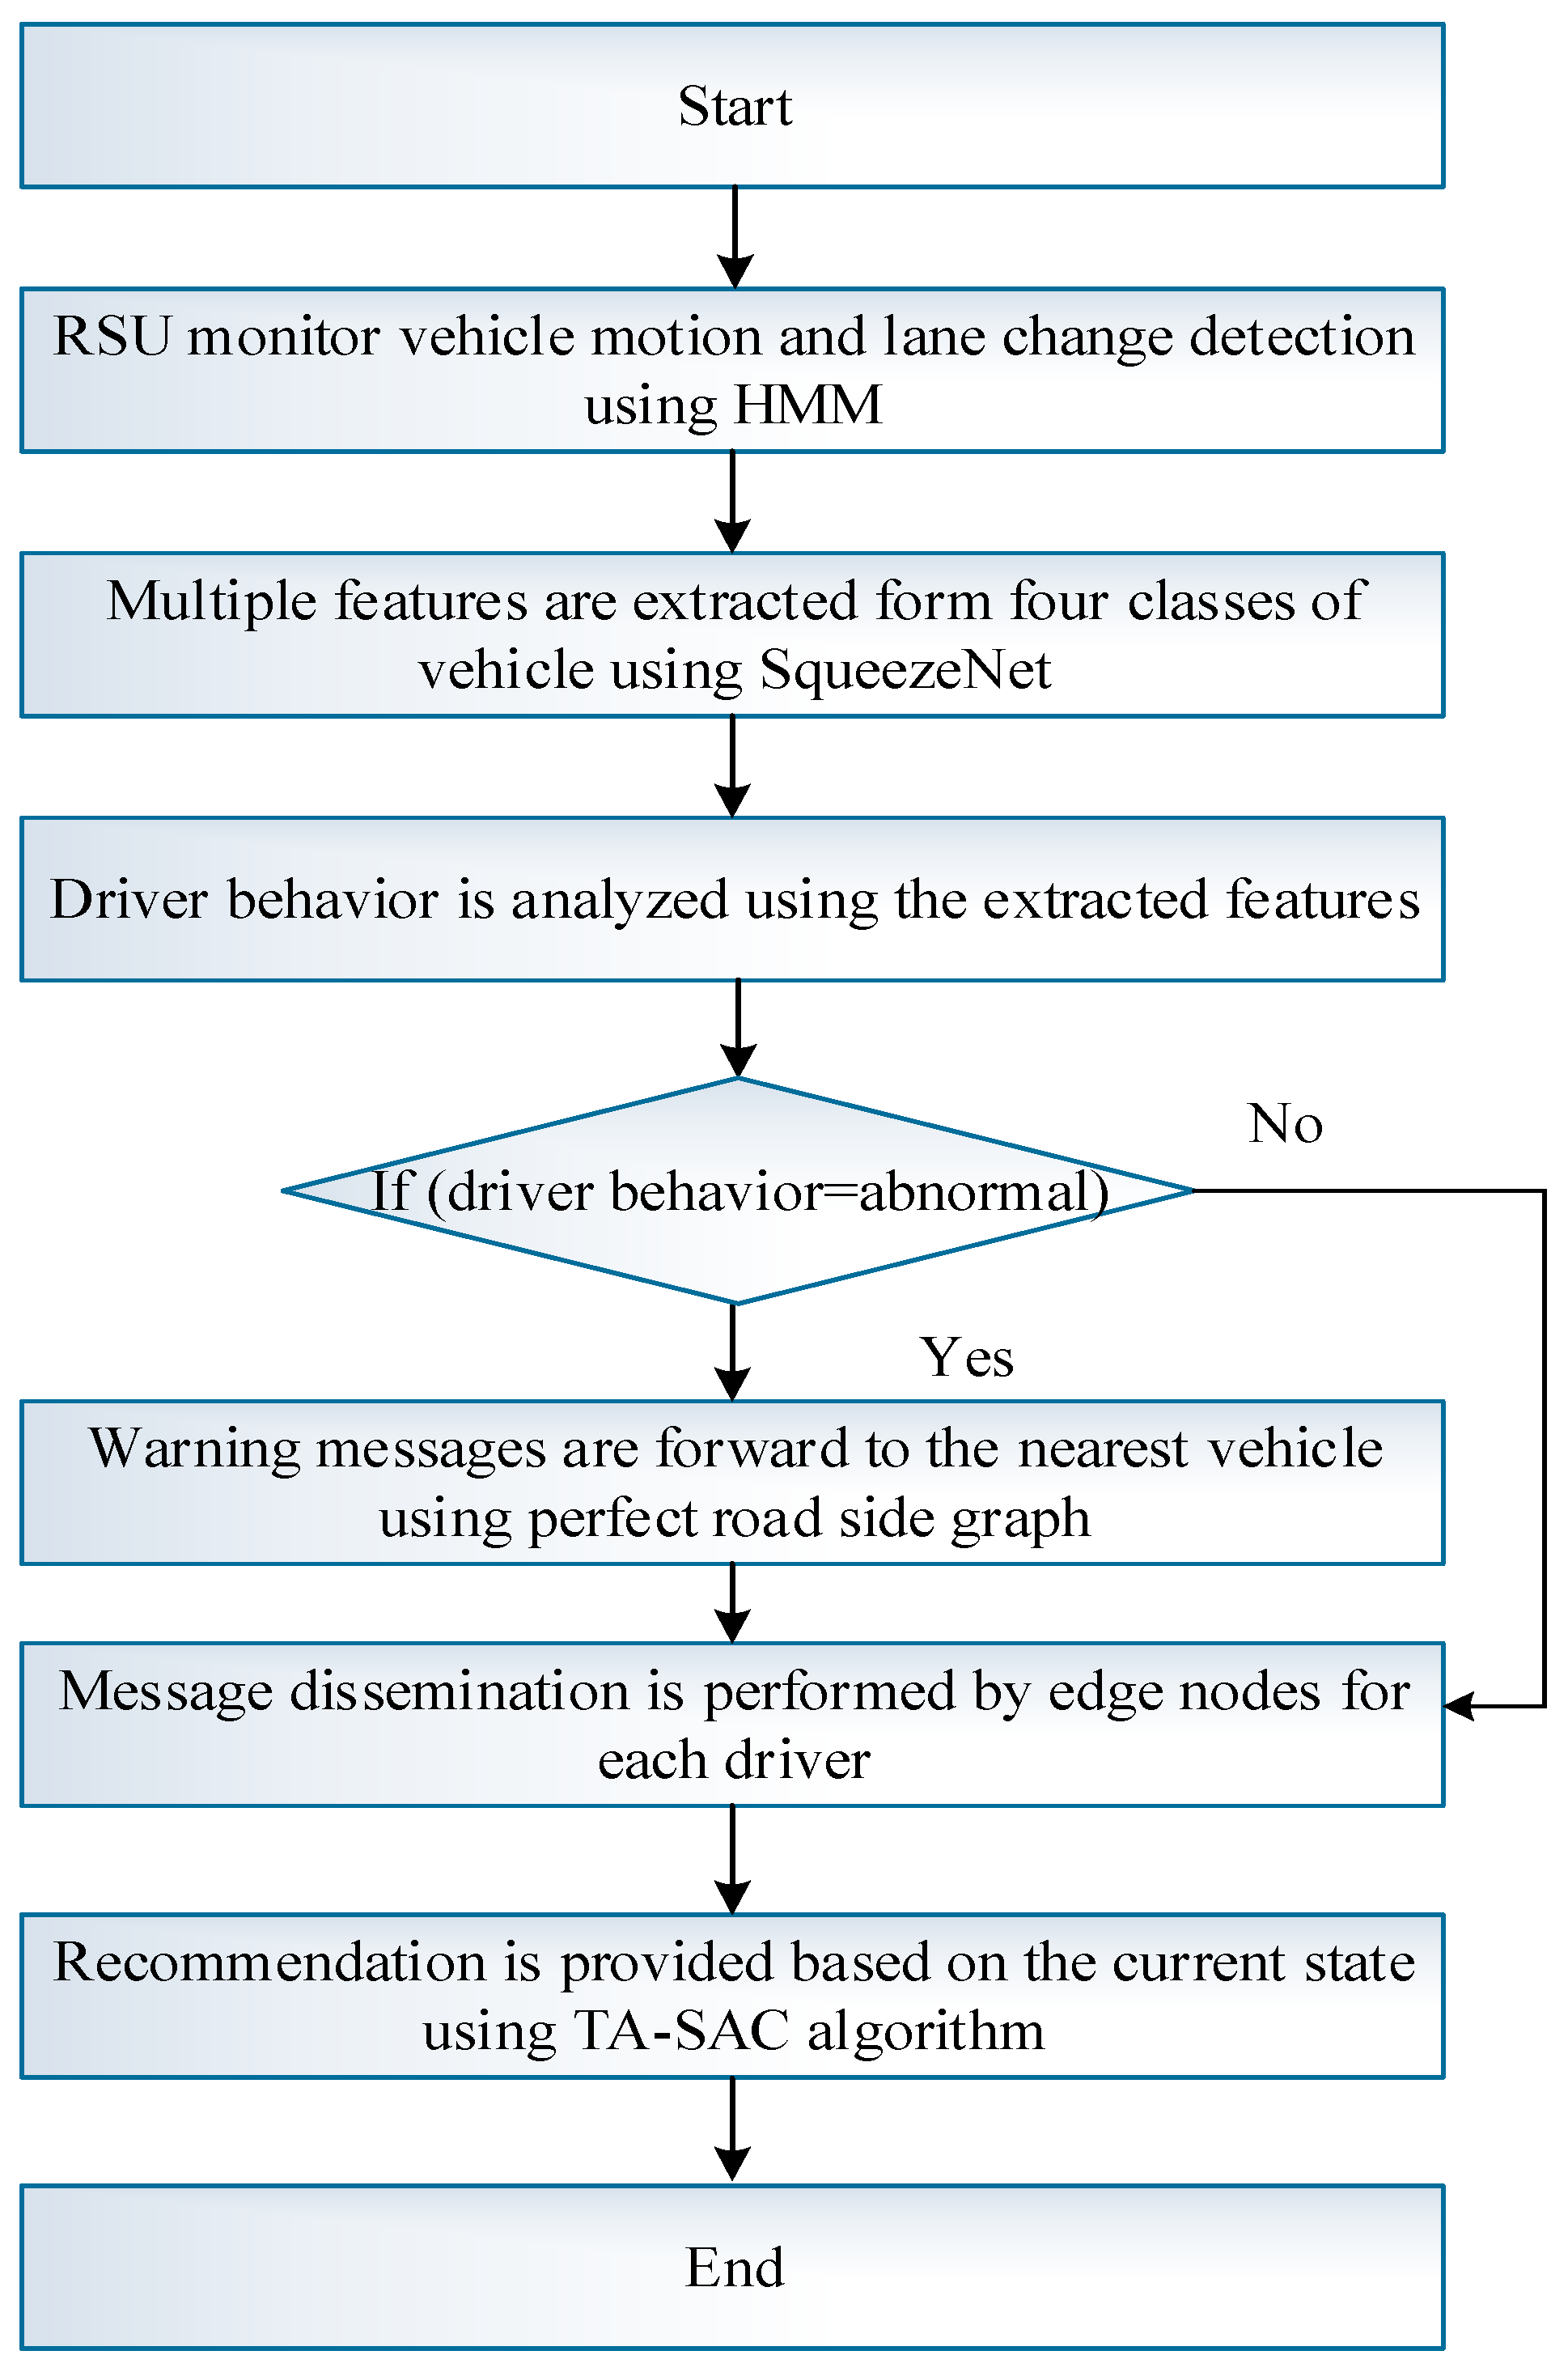
  • Vehicle motion and lane change behaviors are predicted for improving the performance of feature extraction. For this, HMM is proposed in this paper. After completing vehicle motion and lane change detection, the HMM classifies them into three classes—namely, frequent change, no change, and mild change for improving the performance of the proposed MODAL-IoCV method;
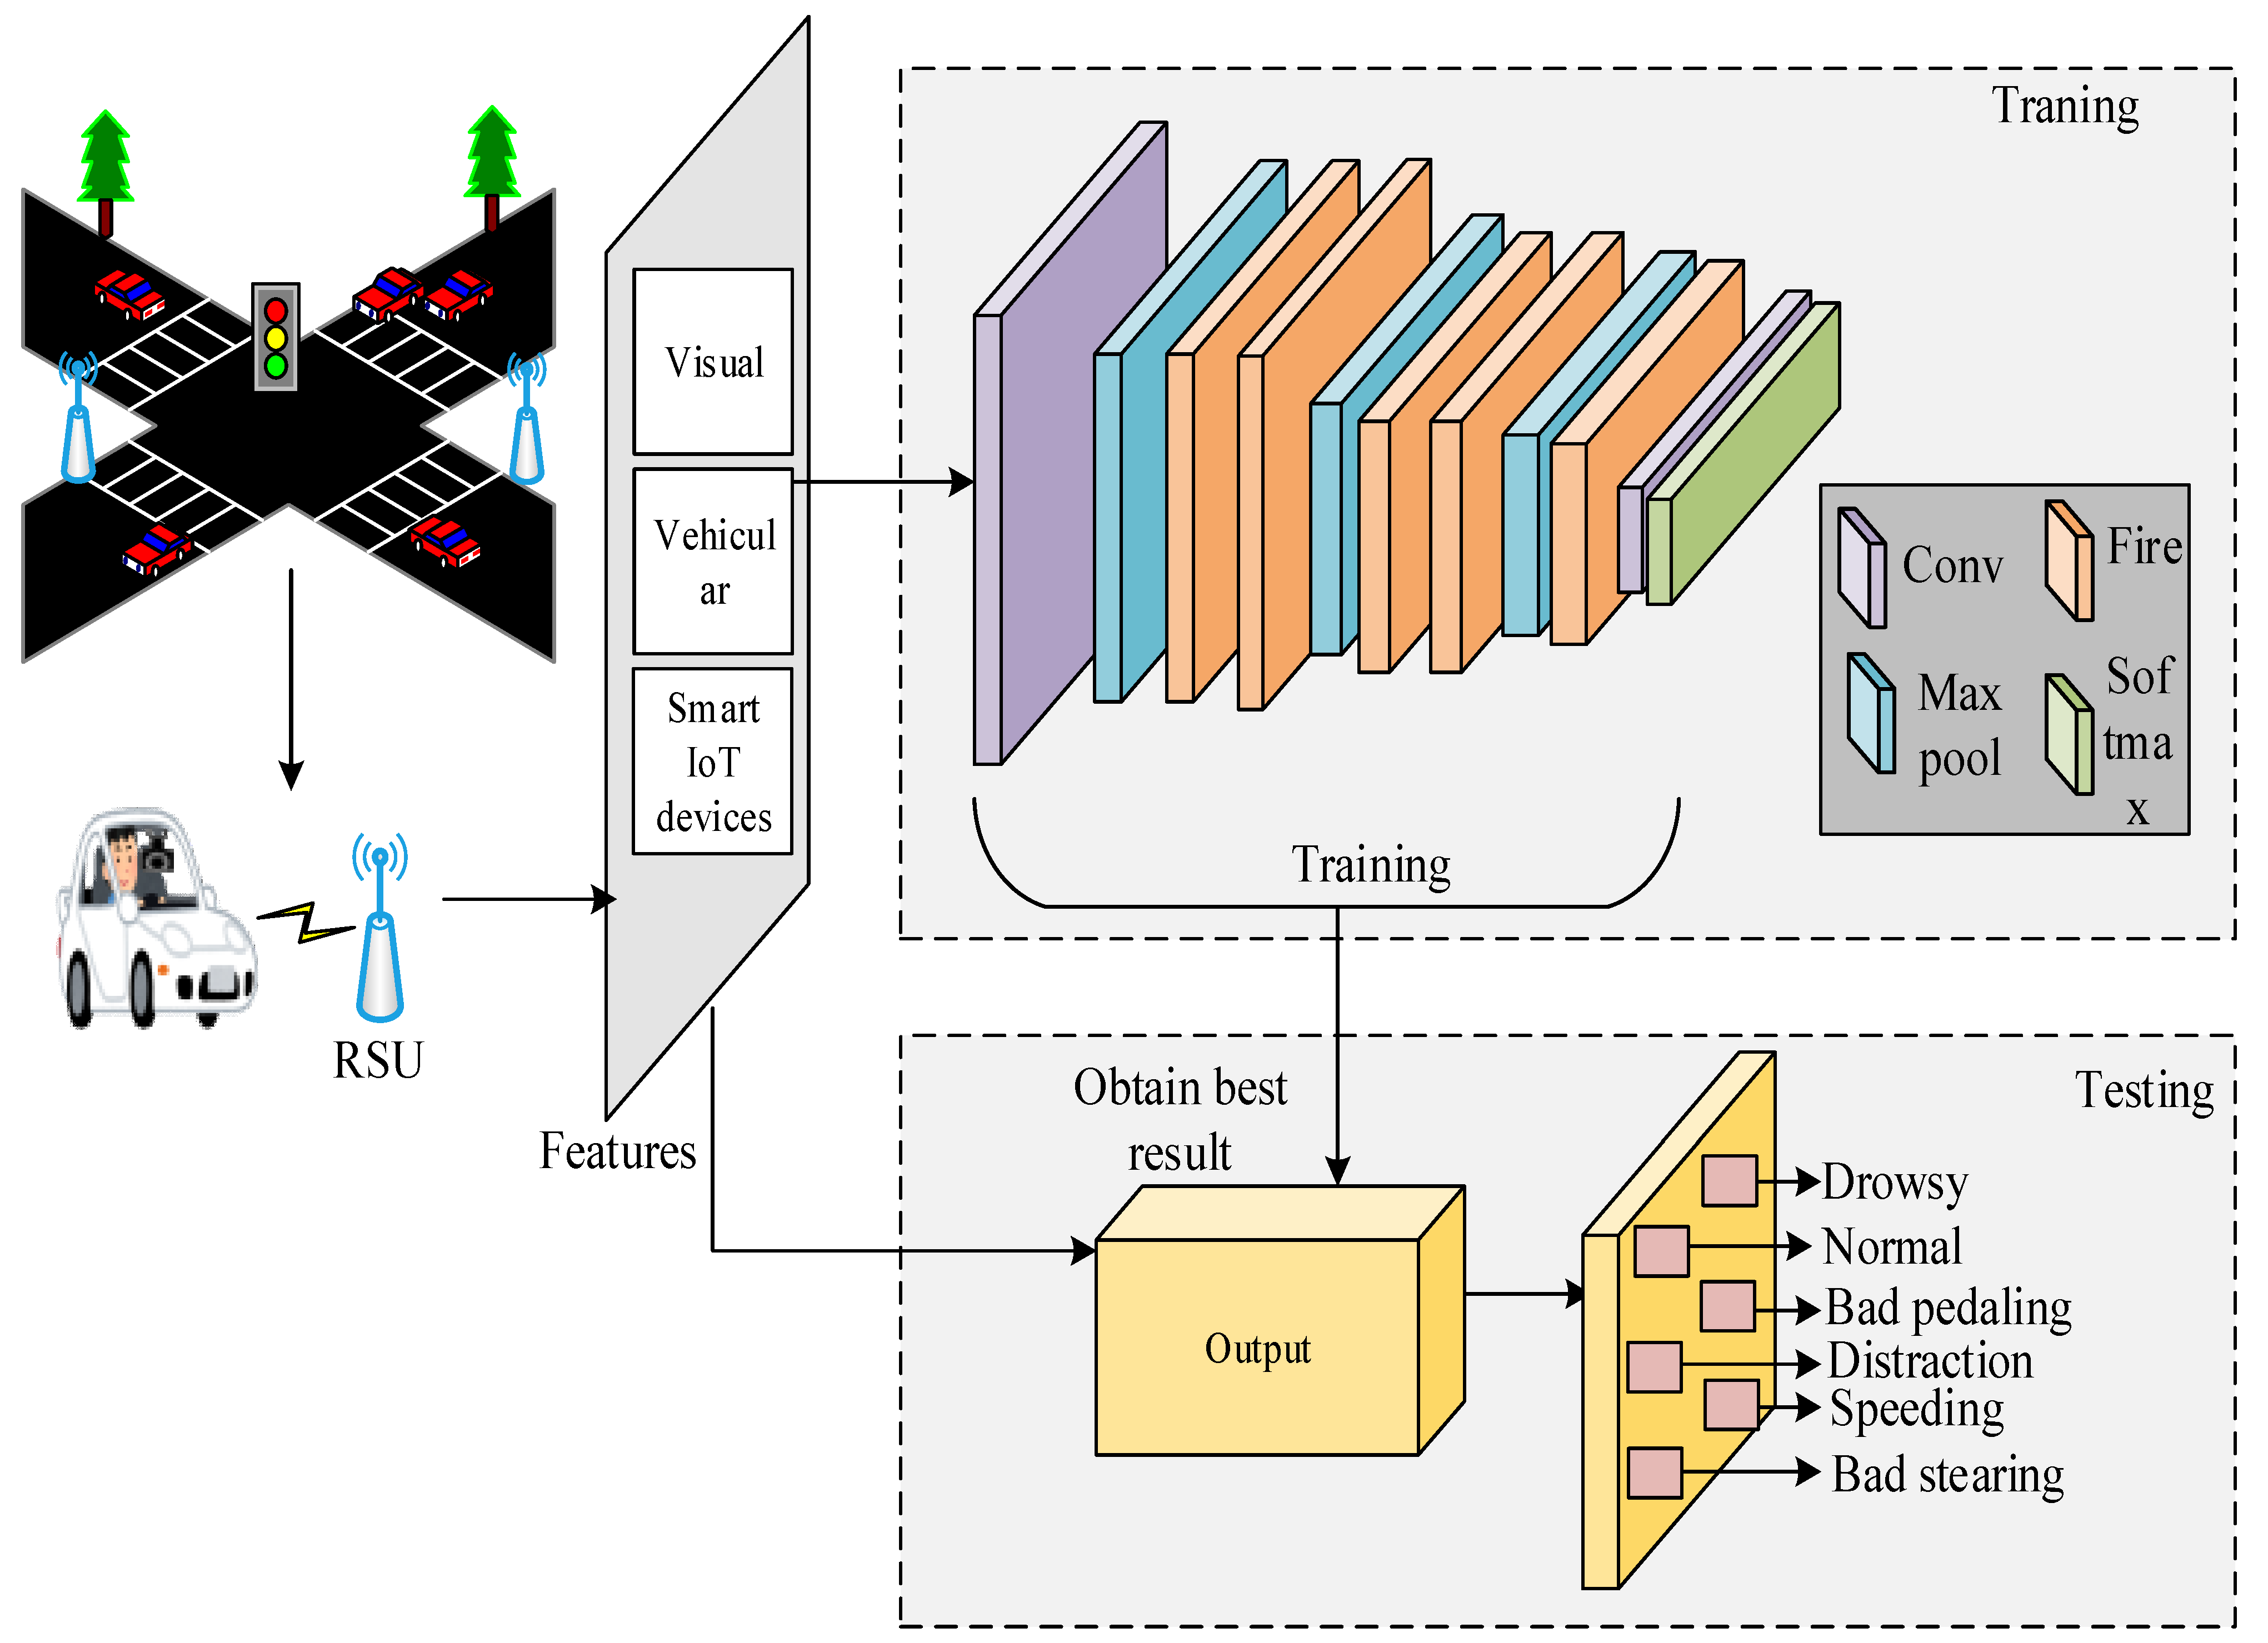
  • Then, RSU extracts multiple features from four classes, which are provided by SqueezeNet, which is a lightweight model. It extracts three types of features, including visual features, vehicular features, and smart IoT device features, which increases the speed and accuracy of feature extraction compared to AlexNet;
  • We construct a perfect roadside virtual graph by considering vehicle mobility speed, moving direction, and the distance between vehicles for broadcasting the warning messages to the nearby vehicles and roadside pedestrians, which helps to reduce the risk of accidents;
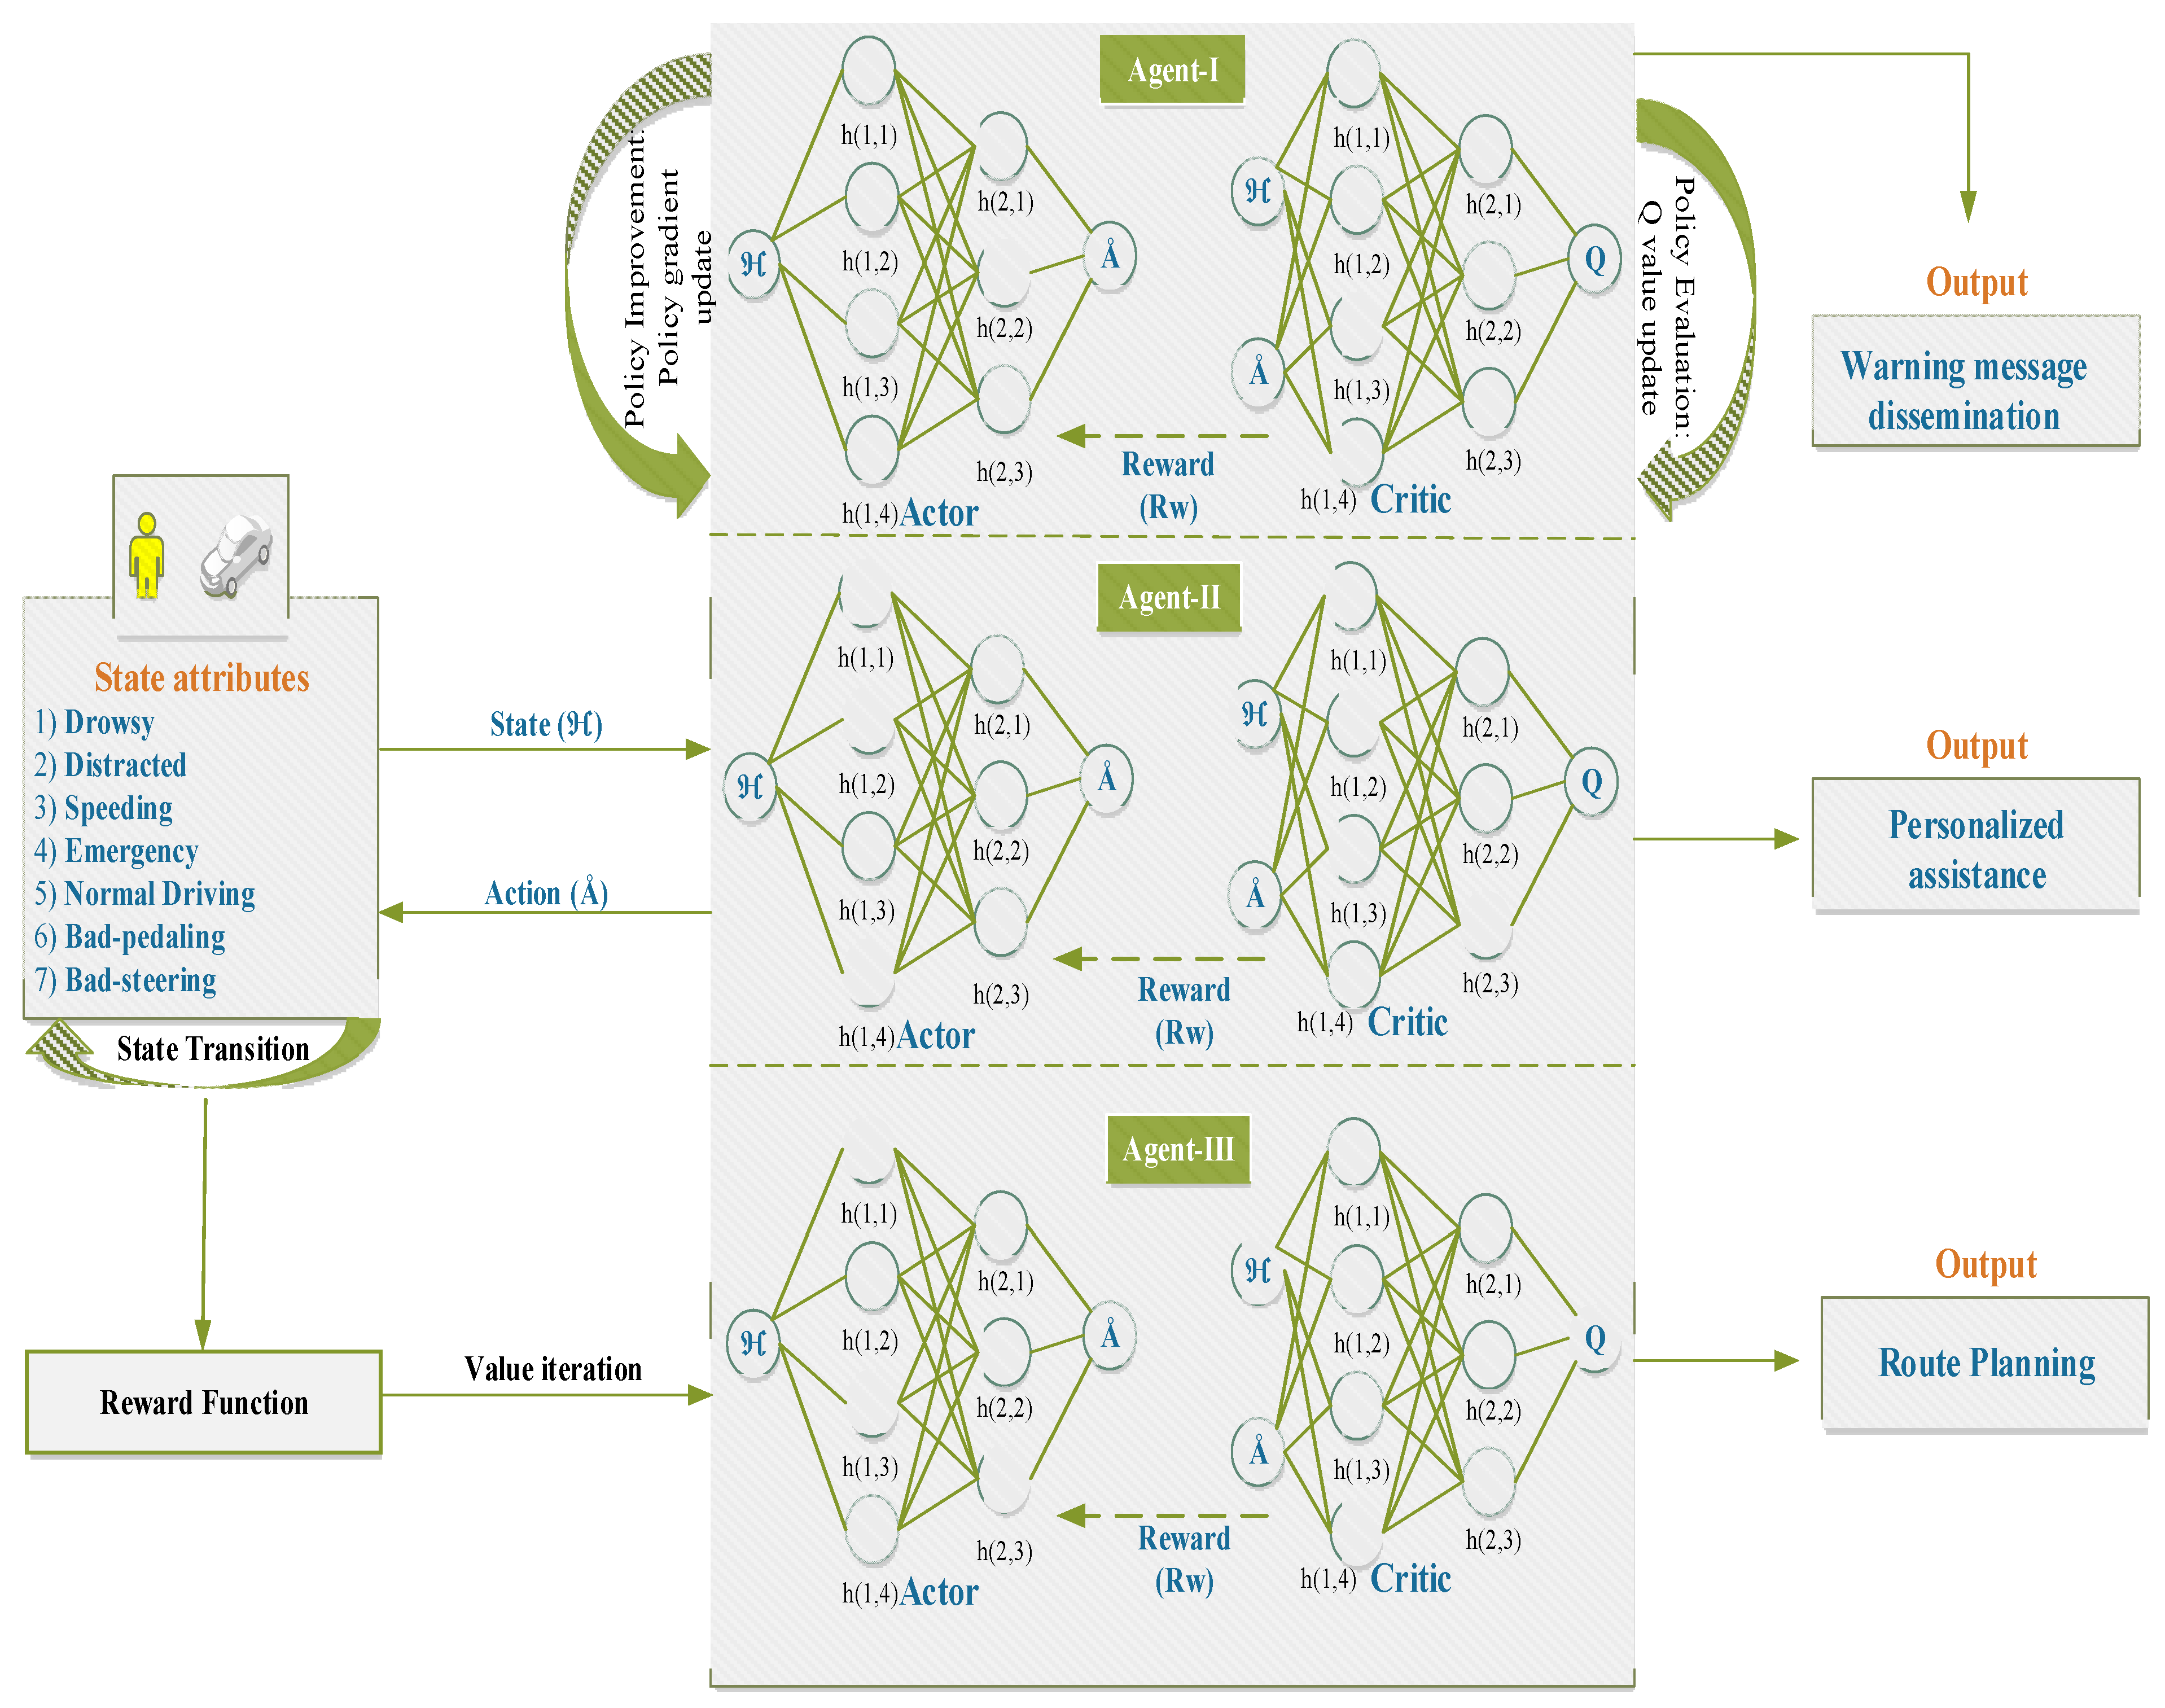
  • Then, we provide a recommendation to the drivers by disseminating the message to each driver using edge nodes. This assistance is recommended based on the past and future behavior of the vehicles using the tri-agent-based soft actor critic (TA-SAC) algorithm. Here, three agents are utilized for driver behavior and this provides recommendations such as take a rest and drive defensively based on the current state. This increases the detection accuracy and prevention accuracy of the proposed MODAL-IoCV method.

1.3. Paper Organization

The rest of this paper is organized as follows: Section 2 explains the related work and its limitations, which are related to our work. Section 3 describes the problem statement that existed in the previous work. Section 4 provides a detailed explanation of the proposed methodology of the MODAL-IoCV method, which includes pseudocode, algorithms and mathematical representations. Section 5 explains the results section, which shows how the proposed system achieves better performance compared to the existing work. Section 6 discusses the results of our proposed model. Finally, Section 7 concludes the research work, which also includes the future work of this research.

2. Related Work

In this section, the literature survey regarding the detection and classification of driver behavior in IoCV is presented. The research gap in designing an effective driver behavior analysis is analyzed.
Using driving behavior detection to reduce the occurrence of traffic accidents was proposed in [21]. Driving behavior analysis is conducted based on the serial feature network (SF-NET) and smart phone inertial sensor, which consider the continuity of driving events and utilize multitime data to analyze the driving status. Data are collected from GPS data, acceleration, and gyroscope sensors in smartphones. The input vector not only consists of the current sensor information, but also the relevant information for the adjacent time. In the serial feature network (SF-NET), 10 different behaviors of drivers are identified, which uses multitime and multilevel features information. The SF-NET model must be simplified to reduce the overhead in driver behavior analysis because it is difficult to analyze the multiple features in a single model.
Using vehicle motion prediction for driver behavior monitoring and design was proposed in [22]. Attention span is incorporated in this paper for deriving the relative importance of nearby vehicles with respect to the future moving direction. The weighted sum model is added for fusing the related motion patterns to the surrounding vehicles. By incorporating the historical information of vehicle motion, the future trajectories of vehicles are computed. The vehicle motion is different depending on the number of intersections, vehicle densities, and traffic signals. The consideration of historical information does not reflect higher accuracy in driver behavior detection.
The prediction of driving distraction based on a hybrid deep learning model was proposed in [23]. Visual analysis of the driver is monitored continuously by a camera, for which CNN is presented. A hybrid CNN is presented for behavior detection. For driver behavior extraction, three different deep learning models are used, including ResNet50, Inception V3, and XCeption, and then the extracted features are applied in the hybrid CNN. In this final softmax layer, anomalies in driver behavior are assessed to manage safe driving habits. The set of driver behaviors classified by the hybrid CNN are safe driving, right-handed texting, right-handed phone use, left-handed texting, left-handed phone use, operating the radio, drinking, glancing behind, hair and makeup, and talking to the passengers. However, this paper only considers visual images when the camera is placed in a different location, and it is not effective in handling driver behavior continuously.
Image analysis-based driver status monitoring using lightweight deep learning algorithms was proposed in [24]. In the first step, the driver’s facial behavior is analyzed to analyze the time series information for driver status behavior analysis. In the second step, the driver’s face is continuously tracked and PydMobileNet is used for facial analysis-based driver behavior detection. However, visual analysis can predict driver behavior using facial emotions and actions, although vehicle wheel movement and lane change deviation must be computed to manage the risk values of a particular vehicle. Otherwise, the ITS system is affected by roadside loss, and accidents to pedestrians and nearby vehicles, that are caused by the abnormal driver.
An approach for the risk assessment of drivers in near risk conditions was proposed in [25]. The data about vehicle crashes and driver behavior was observed to guarantee safety, which avoids emergency events in ITS. A real-world dataset was used, which collected driver, vehicle, and road information for driver behavior modeling. A modified version of rough set theory was used—namely, variable precision rough set—which makes decisions based on real-world information. The mutual information entropy function was used to find the significant road attributes and to determine the risk values. A safety distance was computed for giving a warning message to the following vehicles. Furthermore, there were four factors that were used to analyze the crash risk: driver behavior, vehicle motion, road traffic, and weather conditions. However, lane change deviation was not predicted in this approach, and the health parameters of the driver were not extracted, which increases the misclassification rate.
Using an advanced driver assistance system for increasing safety was proposed in [26]. Driving security and quality for both passengers and drivers are ensured in this paper. A driver complex state (DCS) is predicted using non-obstructive sensors, and artificial intelligence (AI) is used to uncover the driver state. This paper considers vehicle information, driver data through a smartphone, smart wearables, and external data (i.e., road condition, weather condition, lane occupation, and actions of other vehicles). However, personalized recommendation is not effectively designed in this paper, in which the emotional state of the driver is not predicted. Vehicle moving patterns become a more powerful input parameter that aids driver behavior analysis.
An approach for the effective monitoring of drivers current state of action was proposed in [27]. In this paper, driver distraction was predicted by designing driver monitoring systems. The driver’s historical travel data was collected based on two aspects: short-distance and long-distance drivers. Then, driving time, average speed, and frequency and length of breaking time were predicted to analyze the driver’s behavior. However, this paper does not provide the specific distraction type of the driver, which must be detailed to correlate with the environment and to generate the corresponding warning messages to the driver and to other vehicles in the ITS. Drivers’ physiological parameters must be observed through smart wearables to monitor the health issues of the driver. With the lack of information about drivers, the presented study is not able to determine the behaviors of the different profiles/characteristics of the driver.
A cloud-based approach for the detection of driver fatigue was proposed in [28]. In this paper, driver fatigue detection was implemented by using multiple sensors and the reports were processed in the cloud environment. Multimodal feature processing was investigated in this paper, such as facial PERCLOS features, mobile sensors, and inbuilt vehicle sensors, were used to analyze the performance of the driver. There were several driver styles that were predicted and studied in this paper using machine learning with rule-based and deep learning-based approaches. For a real-world environment, it is necessary to compute all of the different parameters of the driver in a DL model.
A deep learning model based on analyzing of interaction between the user and the road was proposed in [29]. The proposed stacked autoencoder (SDAE) was used to extract the features of driver behavior from a dataset that included real driving test and GPS sensor records. The dataset included high-dimensional raw driver behaviors. Cubic representation was used to extract the 3D features, in which the color trajectories represented the driving path. The RGB color features were extracted for trajectory analysis. Then, a windowing process was applied to normalize the data, which converts the dataset into a number of frames based on the time.
In [30], the authors proposed a mobile app for monitoring driver behavior and provided recommendations for preventing accidents. The proposed method used ontology for collecting driver and vehicle information, which helped to provide a recommendation for dangerous states. For this, the mobile phone was used as a front camera, gyroscope, accelerometer, GPS, navigation map, and microphone to collect the information. The main objective of this research was to provide a recommendation to reduce the number of accidents. The proposed system included two processes: dangerous state classification and detection. The classification model collected information regarding the driver’s stress, pulse rate, drunk driving, and distraction. Additionally, the fame images were collected from the driver, including head angle and pitch, eye openness, mouth openness; based on this information, the dangerous states were detected. In the reference model, the recommendations were provided to the driver.
In [31], the authors proposed braking behavior and driver behavior for reducing the probability of accidents using time pressure conditions. The proposed system considered two events—namely, brake pedal force and brake to maximum brake transition time. Additionally, the time conditions included: no pressure, low time pressure, and high time pressure. Based on this information, the braking behavior was analyzed. The simulation result showed that the proposed system achieved better performance compared to the existing systems.
Asymmetric driving theory was proposed for capturing driving characteristics using traffic oscillation [32]. An unmanned aerial network was used to record videos to collect vehicle trajectory data. Initially, the author illustrated the theory of asymmetric behavior, and then the proposed system collected the individual vehicle trajectories using driver behaviors which represented the characteristics of drivers. The data was collected in Nanjing, China. The simulation result shows that the proposed model achieved better performance, in terms of driver reaction in oscillation, compared to the existing model. Table 1 summarizes the contributions of the approach and the results that were achieved in other research.

3. Problem Statement

For ITS safety provision, driver behavior analysis is essential to provide continuous assistance and route planning for drivers. The specific problem statements that were encountered in the detection and classification of driver behavior are as follows.
The machine learning models that were used for the accurate detection and classification of driver behavior for minimizing road casualties were proposed in [33,34]. The driver behavior was described by the acceleration and speed of the vehicle [33]. The environment was modelled using dilated residual networks (DRN) that split the video image into a number of patches for the driver’s attention. For stress analysis, extreme gradient boosting (XGBoost) predicted the stress values of the driver into three aspects: high, low, and medium. In [34], various drivers’ behavior signals such as gravity, acceleration, throttle, speed, and revolutions per minute (rpm) were used to categorize drivers as normal, aggressive, distracted, drowsy, and drunk driving. A 2D convolutional neural network (CNN) was used to classify driver behavior based on vehicle moving trajectories. For this, the temporal dependencies of driving signals were converted into spatial dependencies. The major problems that are faced in these approaches are:
  • The visual result of the environment (scenes by images) was considered and processed in DRN, but the weather information was not considered, which causes low accuracy in monitoring the driver’s behavior;
  • System errors in modelling driver’s stress become very high due to the usage of the XGBoost algorithm, and training time is long compared to the Catboost and light GBM algorithms;
  • Environmental and health status was not considered in this paper, which causes a higher risk of accidents and high economic damage. Lane change deviation is also taken into account for modelling the behavior of drivers;
  • This paper does not discuss the alert messages for the personalized monitoring of drivers during driving. Hence, driver behavior modelling must be investigated using other significant parameters;
  • CNN does not effectively handle all of the image features that are converted from signals, and behavior modelling takes a long amount of time to generate a prediction. This increases the chance of accidents and also does not ensure traffic safety through early alert message transmission.
In [35,36], driver monitoring was utilized to provide personalized assistance. This system was developed for the internet of vehicles (IoV), in which on-board image parameters and wearable sensor parameters were collected to compute the deviation degree of vehicles, as well as the head motion of drivers. Based on the observed parameters, an abnormality level of driver behavior was computed. If the abnormality was high, alert messages were forwarded to the neighboring vehicles and the pedestrians that travelled at the roadside. Frequent alert message transmission avoids accidents and economic damage, and also ensures traffic safety. The cloud environment keeps track of drivers’ reports and allows the monitoring of drivers’ behavior [36]. The problems in these approaches are presented as follows:
  • Vehicle motion, which measures lane change deviation using image processing techniques, is not a focus. Hence, it does not suit all types of drivers. High acceleration, continuous speeding, frequent lane changes, and large brakes must be considered to monitor the driver’s behavior;
  • Dangerous drivers’ behavior is not classified, including drunk, distracted, and fatigued. Hence, the warning messages are not optimal in this case (i.e., decisions must be properly made and sent to the pedestrians and other roadside vehicles);
  • Cloud-based driver behavior monitoring increases latency. It is not effective to monitor a large number of drivers’ behaviors to provide real-time warning message updates;
  • The health (physiological) parameters of the driver are not considered, which are important in emergency situations. The lack of smart sensor deployment increases pandemic cases;
  • Recommendations are not personalized for drivers, since environment parameters (events) and weather information are not considered, which causes low accuracy in the recommendations.
The proposed MODAL-IoCV approach overcomes the above stated problems to effectively analyze driver behavior and provide route assistance. The proposed approach considers the visual features of driver’s vehicles in SqueezeNet for modelling facial features and head position. Furthermore, weather information is considered and integrated into SqueezeNet for modelling the driver’s current behavior based on past sequences. SqueezeNet is a lightweight deep learning architecture that is able to process both large and small volumes of data to produce the corresponding outcomes. Vehicle motion and lane change detection is implemented using the hidden Markov model, which uses the vehicle sensor information of past and current sequences. With this model, we categorize vehicle motion into three classes: high, medium, and low. On the other hand, lane change is detected and classified into three classes: frequent change, no change, and mild change. Edge nodes are deployed for monitoring all of the RSUs that are deployed on the roadside, which decreases latency. It can handle the number of vehicles that are inside the region, and multiaccess edges coordinate with the corresponding RSUs. Smart wearables, smart sensors, and smartphone devices are used to continuously monitor the physiological parameters and to sense the health issues of the driver for accurate behavior modelling. Personalized assistance is recommended for drivers, in which the driver’s next action is presented. Based on the action, route planning is initiated for drivers.

4. Proposed Work

In this study, we concentrated on driver behavior modelling and road accidents reduction by providing early warning alerts using an Internet of Connected Vehicles (IoCV) environment. For that, we designed multimodal feature processing in edge assisted IoCV environment, as shown in Figure 2. The proposed work is organized by the following entities: Vehicles Along with Drivers, Edge Devices, and RSUs. Furthermore, it is organized into two tiers as follows,
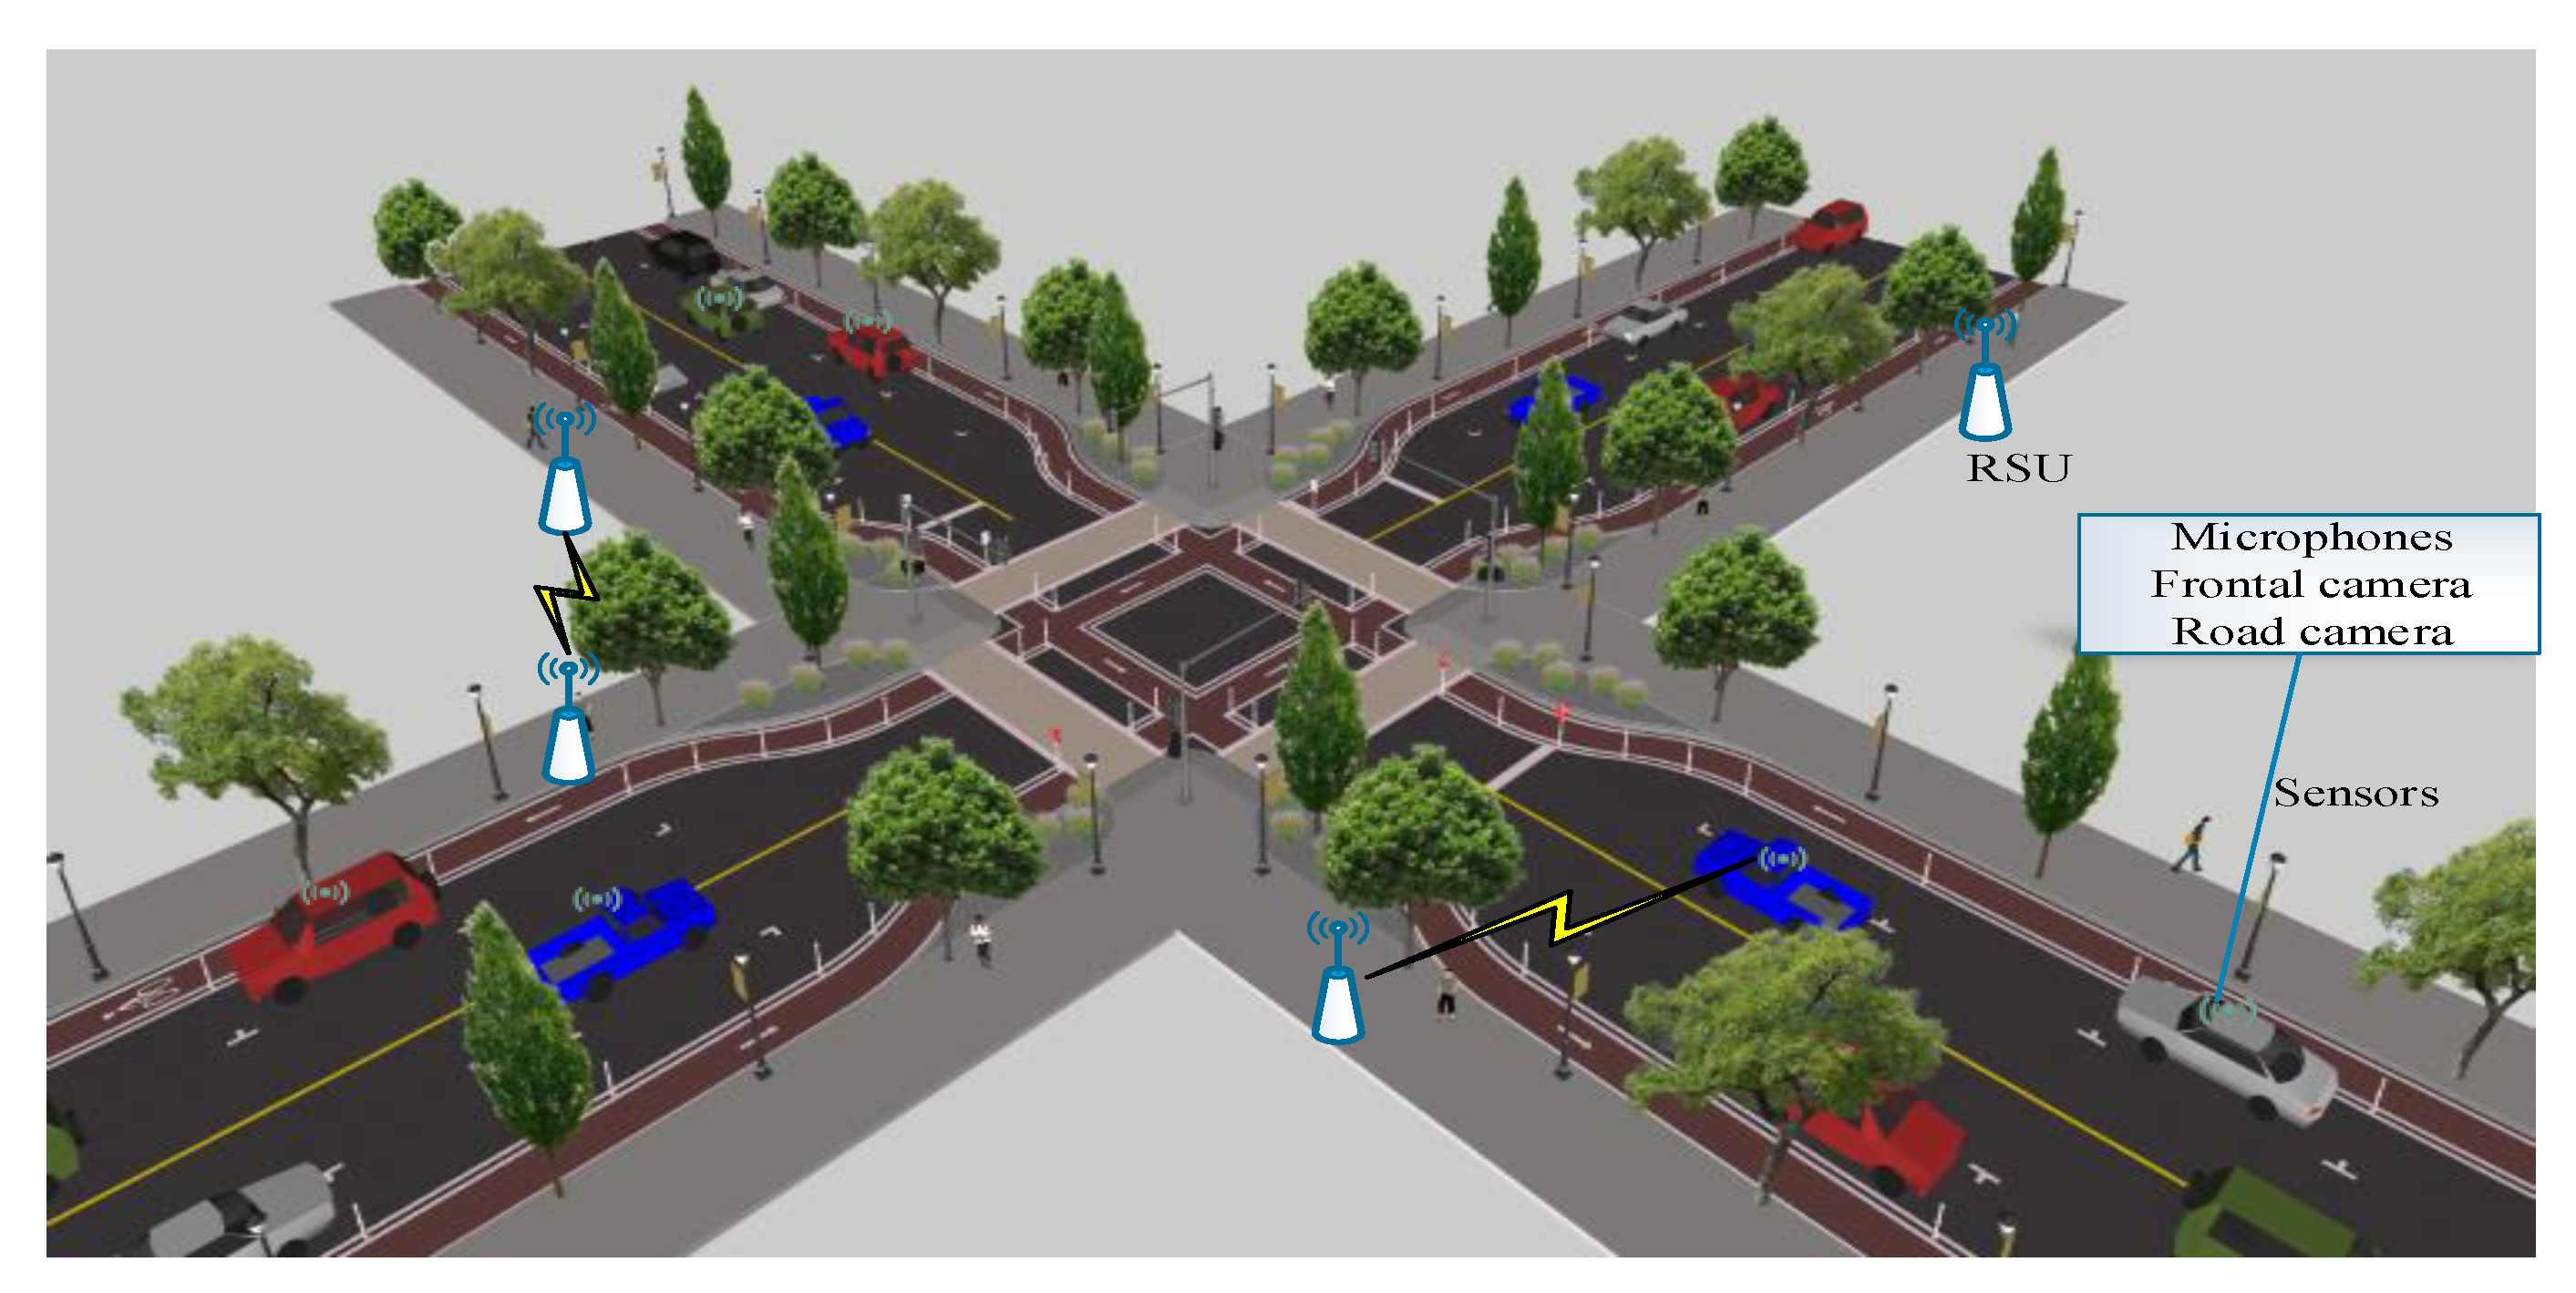
  • Layer 1 (IoCV)—This layer consists of intelligent vehicles that are connected with the internet. Each vehicle consists of sensors for monitoring speed, acceleration, etc. OBU also contains sensors which are equipped to capture vehicles’ information. This layer also consists of RSUs for data collection from vehicles.
  • Layer 2 (Edge Computing)—This layer consists of a number of edges that are responsible for monitoring separate regions of layer 1. Each edge node has a processing capacity that is higher than cloud computing platforms. These two layers are functioned for accidents prevention and generate early warning alerts.

4.1. Data Gathering

Typically, to experiment with the proposed system, we executed a set of driving maneuvers under real conditions. A real scenario rather than a simulation has been chosen to avoid possible deviations from the real behavior of drivers. Three drivers were involved in the experiments. They were driving the same vehicle in real traffic conditions. Participants were encouraged to use all types of driving including (1) normal, (2) aggressive, (3) distracted, (4) drowsy, and (5) drunk. They knew the characteristics of all driving behaviors and imitated the different driving styles by performing certain predetermined jobs. We collected data including acceleration, gravity, RPM, speed, and throttle of the vehicle during the experiment.
All data on different driving styles in different road and transport conditions were carefully collected.

4.2. Driving Vehicle Motion and Lane Change Detection

In its range, RSU is responsible for vehicle monitoring and vehicle motion. Lane change behaviors are predicted. Vehicle motion is described by two sets of attributes as Nearby Vehicle Report ( V R ) and Past Mean Velocity ( M V ) . This information is collected and forwarded to the Hidden Markov Model (HMM) that predicts the vehicles motion accurately and also Lane Change Deviation is measured by Vehicle Direction ( V D ) , Distance to neighboring vehicles ( N D ) and past sequences of lane change ( L C ) , The proposed HMM is defined as follows,
H = ( n , m , π , a , b )
where n represents the number of states, and the value of n is 3. In our work, we have three states (frequently state, no change and mild change). m represents the observation symbol and π represents the initial state distribution. a represents the transition probability of the state and b represents the probability of observation.
In our work, HMM consider three states with the feature parameters such as V R and M V for motion prediction and V D ,   N D , L C for lane detection. Then, the HMM is defined as follows,
H = ( π , a , b )
If the condition is expressed as Q ( i =1, 2…n), n represents the condition limit of the Markov chain. The observed values are represented as R   ( j = 1 , 2 , m ) where m represents the number of observed values as y t and the Markov sequence is represented as x t . The probability matrix of the HMM for vehicle motion detection and lane detection is defined as follows,
B = [ A i j ] n × n
where,
A i j = P ( x t + 1 = Q | x t = Q ) , 1 i ,   j n
The observation probability matrix is defined as follows,
D = [ C i j ] n × m
where,
C i j = P ( y t = R | x t = Q ) , 1 i n ,   j m
The initial condition probability vector is defined as follows
π = P ( x t = Q ) ,   1 i n
Therefore, the probability of motion and lane change detection is defined using HMM, based on the probability, and the HMM provides three classes (frequently change, no change and mild change). Figure 3a illustrates the conceptual diagram of motion and lane change detection, Figure 3b represents the probability matrix which shows the current position and previous position, and Figure 3c represents the process of HMM, where I represents the initial state and E represents the end state.

4.3. Multimodal Features-Based Driver Behavior Modelling

Once the RSU has classified the vehicle, then driver behavior analysis is performed for four classes of vehicles (i.e., high motion, low motion, frequently change, and mild change). Multiple features are extracted using SqueezeNet, which is a lightweight deep learning model that has a more compact architecture than other models. It is a good replacement for AlexNet. The performance of SqueezeNet is increasing due to a smaller number of parameters (50X) and speed (3X). In total, 10 layers are used in SqueezeNet including Conv_Layers, Fire Layers, Max Pool Layers, and a Softmax Layer. The initial layer of the squeeze is a convolutional layer that extracts the features from 3 × 3 regions. The feature sets are collected from the fire modules, which include driver visual features ( V f ) , head position and facial emotion, vehicular features ( F v ) , and smart IoT device features ( S f ) . These are all considered to predict driver behavior. The visual features conditions re shown in Pseudocode 1.
Pseudocode 1: Visual features conditions
  • Initialize parameters N y ,   C P , N H n ,   S v ,   H r
  • While S v > 0 :
  • {
  • If N y > 3 in T y = 1   || C P 25 %   || N H n > 4 in T H n = 2
  • {
  • Current state = drowsy
  • }
  • Else if H r 18 ° in T H r = 3
  • {
  • Current state =distracted
  • }
  • Else
  • {
  • Current state =normal
  • }
  • end
  • }
Table 2 and Table 3 present the condition for determination for driver behavior based on the visual features, wherein N y ,   CP , N Hn ,   H r denote the number of yawns, closure percentage of eye, and the count of head nods by the driver, respectively, and S v denotes the speed of the vehicle, which is considered in order to determine whether the vehicle is in motion or parked state. The pulse range rhythm, respiratory rate, ST elevation, Q wave, EEG range, and ST depression are used to detect driver drowsiness. Driving behavior information includes deviations from lane position, vehicle speed, steering movement, pressure on the acceleration pedal, etc. We facilitate the classification of driver behavior based on the significant features such as visual features of driver, vehicular features, and physiological features acquired from the smart wearables and the driver behavior is extensively influencing by the physiological features which are using to accurately detect the driver behavior.
For each kind of feature, an individual SqueezeNet program is used. It has nine fire blocks whose size is 13 × 13 × 512 . Each feature vector is extracted from a vector size of 512. And then the attention branch includes the global average pooling layer which also has the vector size 512. The fully connected layer has a sigmoid function with the size of 169 ( 13 × 13 ) that extracts the weight of the feature vector. The features of the input ( I i ) block are represented as follows,
O i = F ( I i )
where O i represents the feature block and F represents the function of convolutional layer in the nine fire blocks. Here, we consider many features such as visual features, vehicular features, and Smart IoT device features. The weight of the features is defined as follows,
W i = ρ [ M w G P   O i ]
where M w represents the weight matrix of the FC layer, G P defined global average pooling operation, and ρ is a sigmoid function with the range of [0, 1]. The attention is given to the highest weight values. Based on these features, the Softmax layer performs classification with the activation function.
X i = F [ G P ( W i × O i ) ]
From this information, the Softmax layer predicts the driver’s current behavior (i.e., drowsy, distracted, emergency, speeding, normal driving, bad pedaling, and bad steering). The overall process is shown in Figure 4 and the layers of input-output and filters information are shown in Table 4.
After the abnormal behaviors are classified, the current state of behavior is forwarded to the Edge Nodes. The warning messages are broadcasted to nearby vehicles and roadside pedestrians by constructing the virtual graph from source nodes using the ‘perfect roadside graph’, which is constructed by vehicle mobility speed ( M s ) , moving direction ( M d ) , and distance ( d ) between vehicles. Here, the graph is constructed as follows,
G = ( V , E )
where, V represents the vertices and E represents the edges. Here the vehicles are considered as vertices and the edges are used to connect two edges by considering the parameters of M s , M d , d .
E ˙ { { u , v } | u , v   and   u v }
where u and v represent the endpoints in the edges. For all the forwarding vehicles, the warning message is forwarded. Further, edge node forwards this message to the nearby edge nodes for warnings about abnormal behavior. The Pseudocode 2 shows the multimodal features-based driver behavior modelling.
Pseudocode 2: Multimodal features-based driver behavior modelling
  • Input: Four classes {C1, C2, C3, C4}
  • Output: Driver behavior
  • {
  • Begin
  • Initialize C1, C2, C3, C4
  • Initiate SqueezeNet
  • Ensure relevant information is taken as input
  • for i o   t o   n do
  • {
  • Extract V f from the input
  • Extract F v from the input
  • Extract     S f from the input
  • F { V f , F v , S f }
  • F S Extract squeezeNet features
  • Construct feature map O i using Equation (8)
  • Calculate the weight values W i for features using Equation (9)
  • Classifying driver behavior using Equation (10)
  • B driver behavior
  • }
  • end for
  • if (B==abnormal)
  • {
  • Forward driver behavior to edge node
  • Calculate M s
  • Calculate M d
  • Calculate d
  • Construct virtual graph using Equation (11)
  • }
  • else
  • consider as normal behavior
  • Return B;
  • end
  • }

4.4. Personalized Recommendation and Route Planning

In parallel to the message dissemination, each vehicle of the driver is precisely handled by Edge Node for provisioning of personalized assistance. This precise assistance is recommended by the past, present, and future behavior of the vehicles. We can also send one or more assistance provided according to the current state by using a tri-agent-based soft actor critic (TA-SAC) algorithm. Each agent purpose can be as follows,
  • Agent 1: It is used to disseminate the warning messages to nearby vehicles and edges
  • Agent 2: It is used to determine personalized assistance for behaviors according to the current state
  • Agent 3: It is used for route planning according to the drivers’ preferences
This process is constructed as a Markov decision process (MDP) with corresponding state ( ) , action ( ) , and reward ( R w ) . Let the policy of process be denoted as π ϕ ( t | t ) . Then, the soft Q function and state value function can be denoted as Q θ ( t , t ) and V ψ ( t ) , respectively. The state represents the current state of the driver and the action represents the dissemination of warning message, providing personalized assistance and route planning which is performed by three different agents.
The squared residual error is minimized by introducing a separate function approximation. The training of soft value function can be expressed as,
K v ( ψ ) = E t ~ D [ 1 2 ( V ψ ( t ) E Ω t ~ π ϕ [ Q θ ( t , t ) log π ϕ ( t | t ) ] ) 2 ]
The estimation of gradient function can be formulated as,
^ ψ K v ( ψ ) = ψ   V ψ ( t ) ( V ψ ( t ) Q θ ( t , t ) + log π ϕ ( t | t ) )
The current policy is considered to perform sampling of actions. The training of soft Q function is optimized by using a stochastic gradient, which can be formulated as,
^ θ K Q ( θ ) = θ Q θ ( t , t ) ( Q θ ( t , t ) R w ( t , t ) δ   V ψ ( t + 1 )
The learning of parameter policy is carried out to achieve the optimal policy, which can be formulated as,
K π ( ϕ ) = E t ~ D , ϵ t ~ N [ log π ϕ ( f ϕ ( ϵ t ; t ) | t ) Q θ ( t , f ϕ ( ϵ t ; t ) ) ]
where f ϕ ( ϵ t ; t ) denotes the action t and by doing so, the optimal policy is achieved for the three agents. For instance, if the current state of the driver is detected as distracted and drowsy, then the assistance recommended to the driver is to take a rest and drive defensively. The current location of the vehicles is used to provide assistance to driver such as “There is a coffee shop in 100 m ahead, take a break and drive safely”. The audio system of the vehicle is utilized to provide these recommendations. Figure 5 presents the architecture of the TA-SAC algorithm in providing precise recommendation, warning message dissemination, and route planning. The Pseudocode 3 of our proposed TA-SAC algorithm is provided below. Figure 6 presents the overall flow chart of MODAL-IoCV approach.
Pseudocode 3: TA-SAC algorithm
  • Parameter initialization ( θ , ϕ , ψ , ψ ˙ )
  • For each agent do
  • For each iteration do
  • t ~ π ϕ ( t | t )
  • t + 1 ~ l ( t + 1 | t , t )
  • D D { t , t , R w ( t , t ) , t + 1 }
  • End for
  • For each step of gradient do
  • ψ ψ α v ^ ψ K v ( ψ )
  • θ n θ n α Q ^ θ n K Q ( θ n )
  • ϕ ϕ α π ^ ϕ K π ( ϕ )
  • ψ ˙ τ ψ + ( 1 τ ) ψ ˙
  • End for
  • End for

5. Experimental Study

In this section, the experimentation of our proposed MODAL-IoCV approach is carried out in order to evaluate the performance. This section is divided into two sub-sections, namely a simulation study and its corresponding comparative analysis.

5.1. Simulation Study

The proposed MODAL-IoCV approach is simulated using tools such as objective modular network (OMNET++) and simulation of urban mobility (SUMO). Here, SUMO is implemented for traffic simulation and OMNET++ is utilized for network simulation, respectively. The system configurations required for the simulation of the approach are presented in Table 5. The simulation parameters considered for the simulation of our approach are provided in Table 6.

5.2. Comparative Analysis

In this section, the validation of our proposed MODAL-IoCV approach is carried out by comparing with existing works such as DRN (XGBoost algorithm-based monitoring model for urban driving stress: combining driving behavior, driving environment, and route familiarity) [33] and CNN (driver behavior detection and classification using deep convolutional neural networks) [36] by means of performance metrics such as motion prediction error, accuracy, latency, and false alarm rate with respect to both number of vehicles and number of edges.

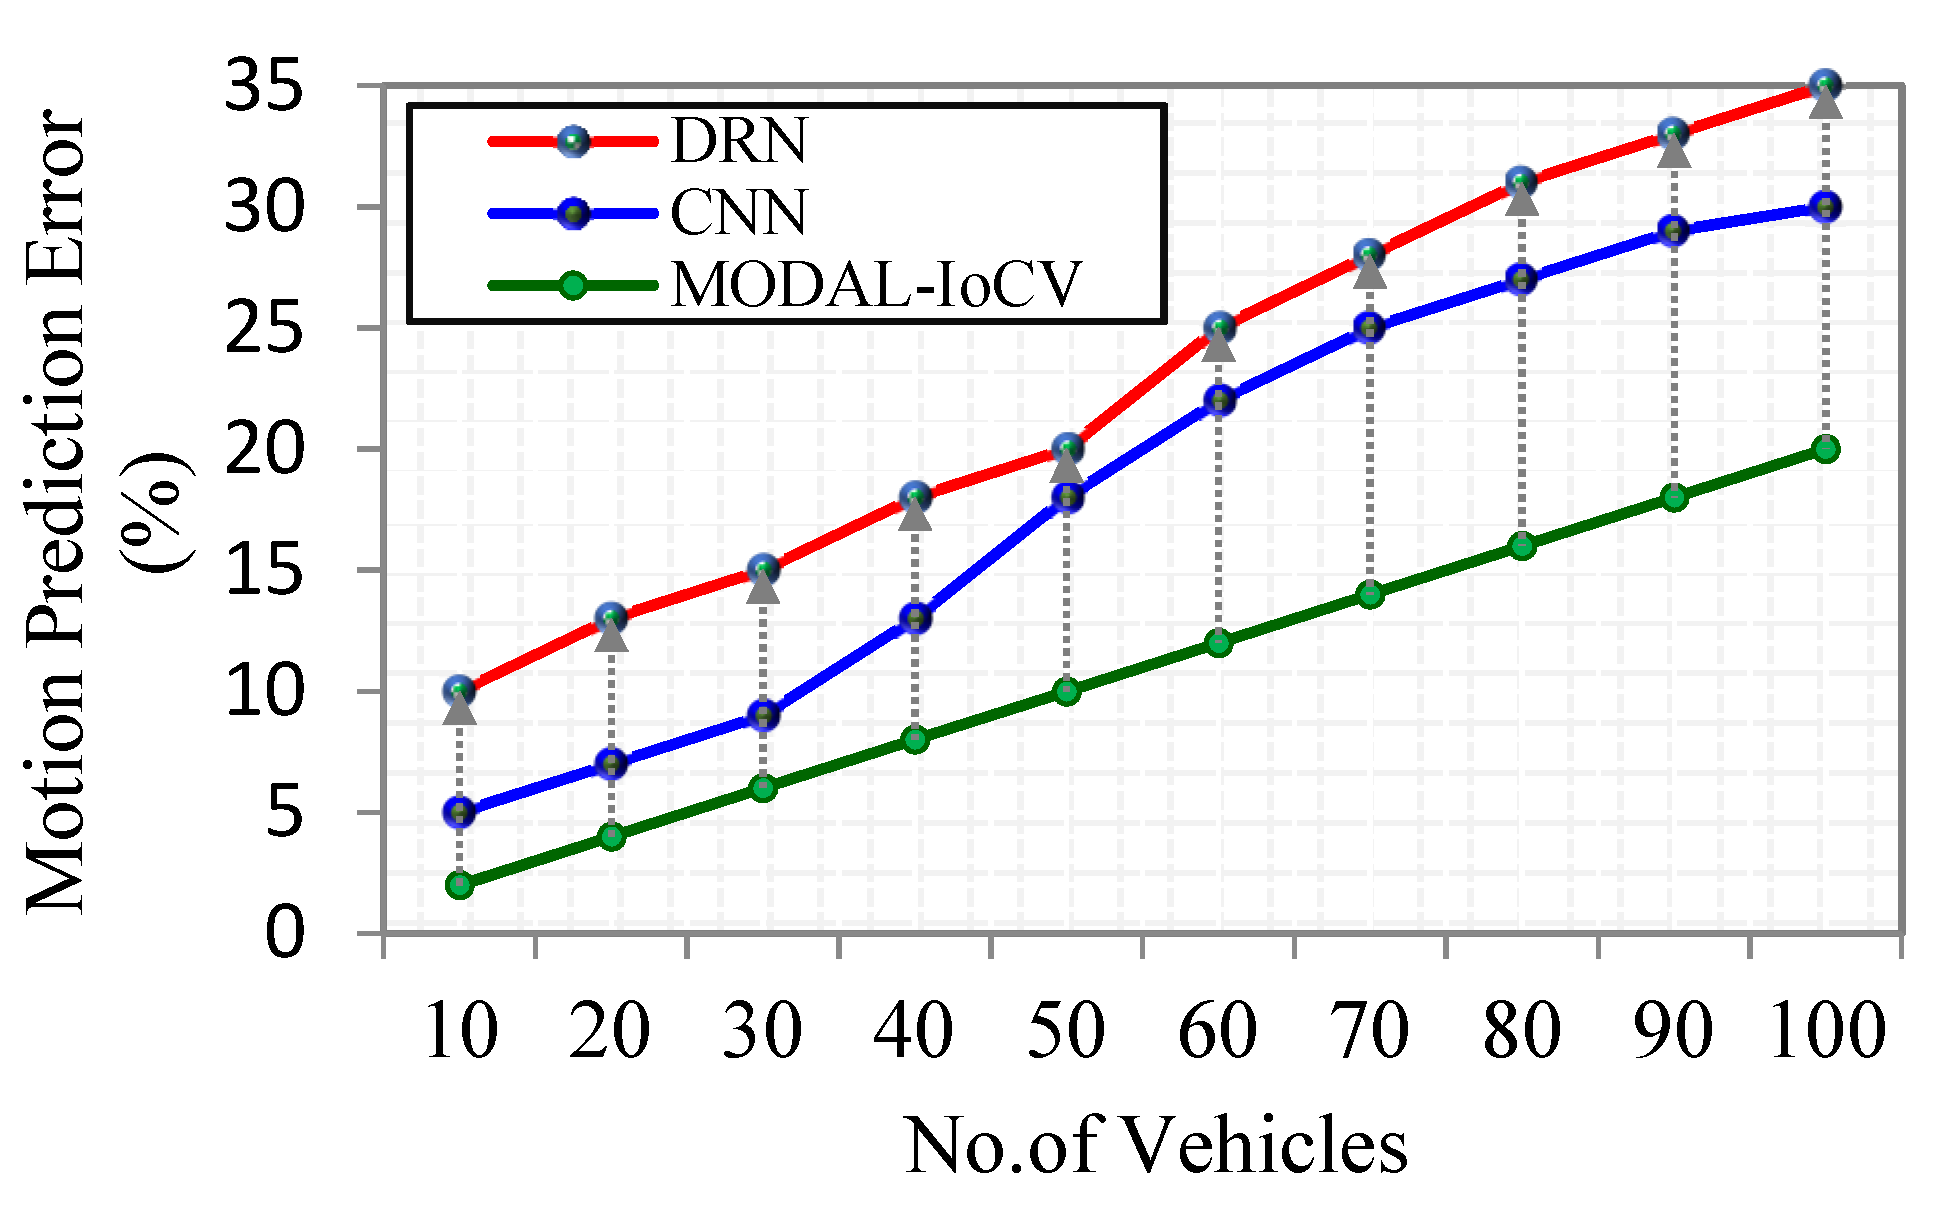
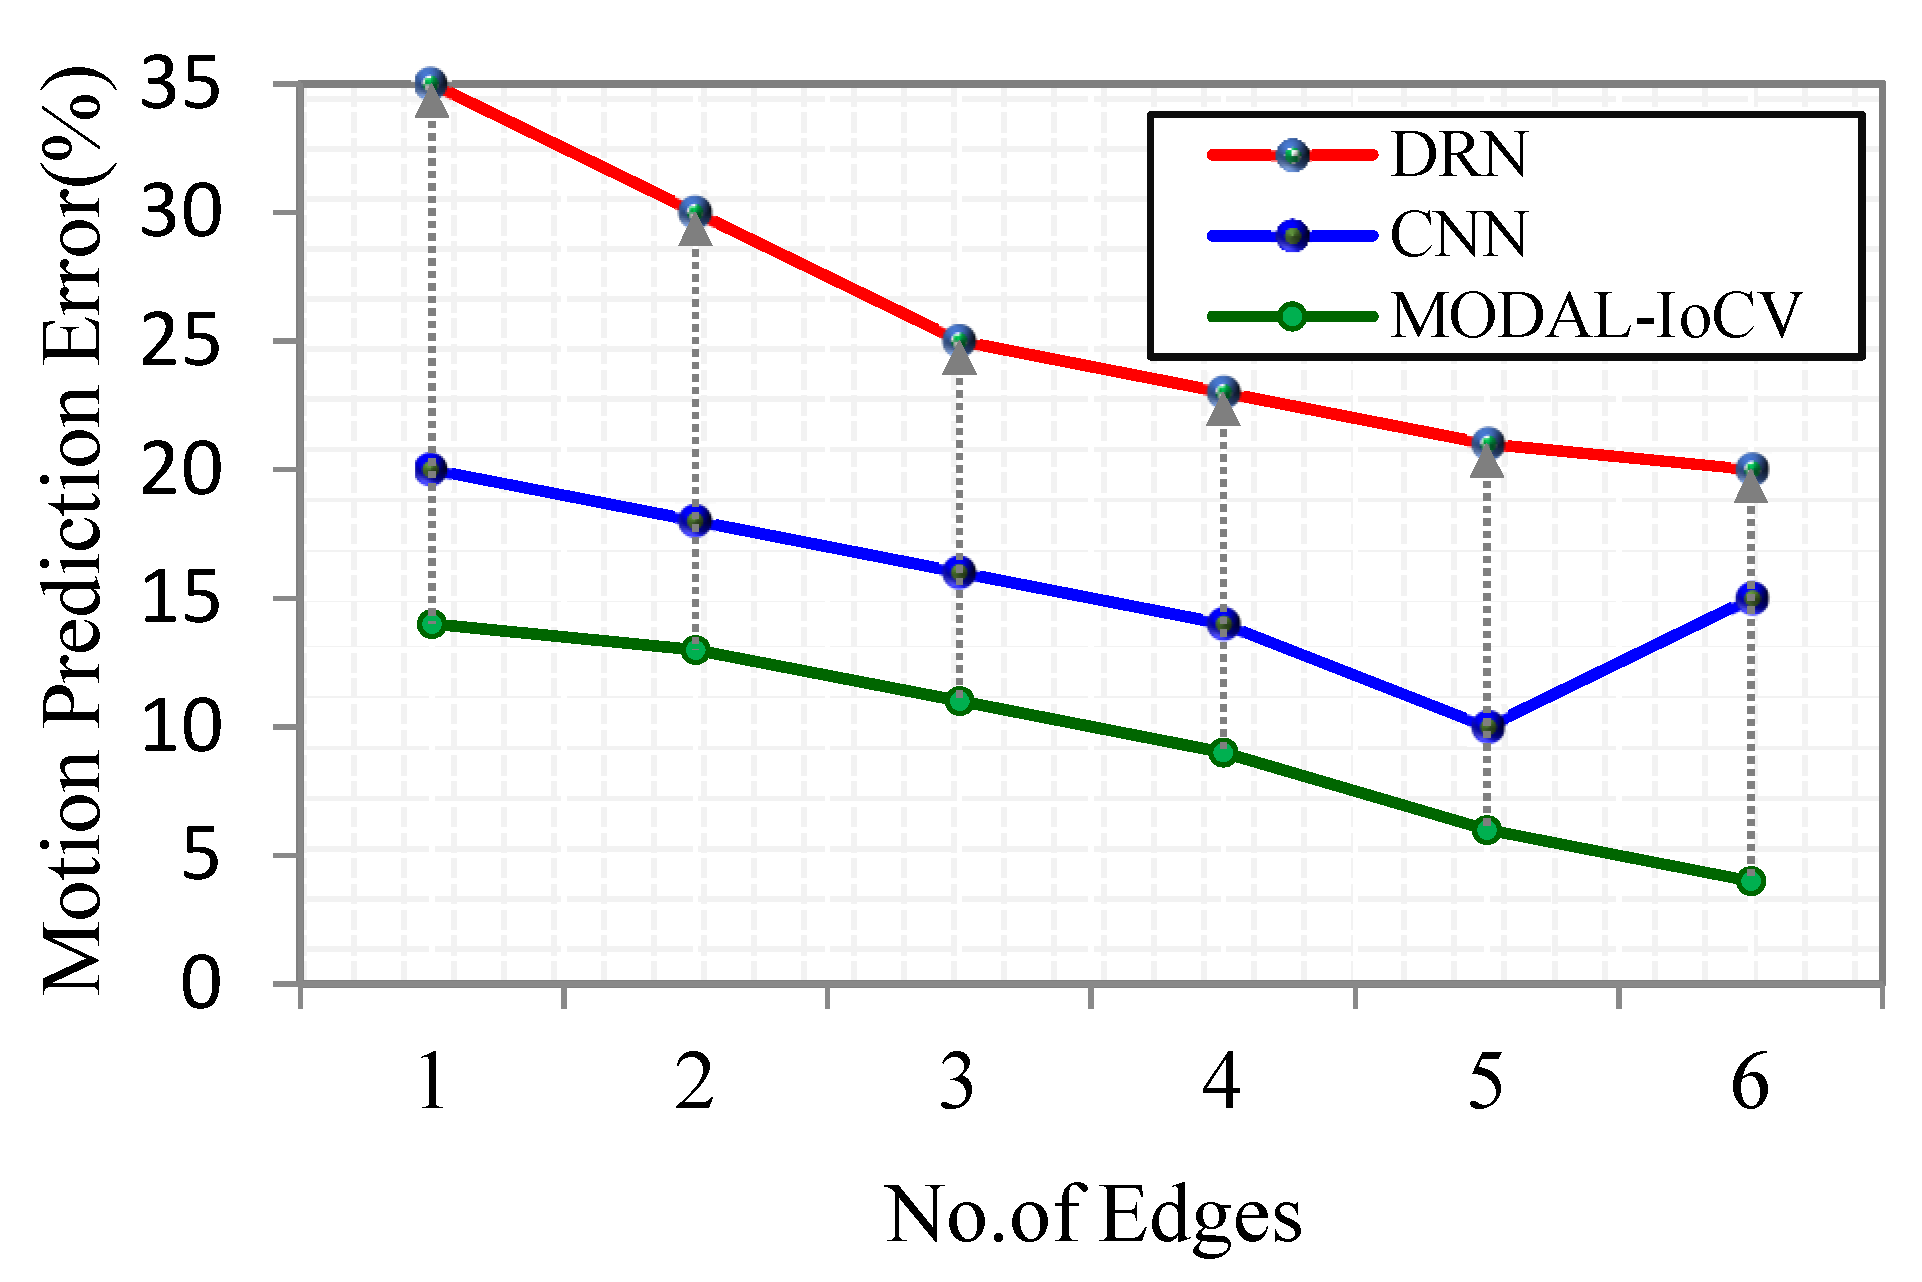
5.2.1. Impact of Motion Prediction Error

The motion prediction error is the measure of rate of error acquired during the prediction of motion of the vehicle. Figure 7 depicts a comparison of the motion prediction error of our proposed MODAL-IoCV approach and existing approaches, with respect to the number of vehicles. The motion prediction error increases with the increase in number of vehicles. The proposed approach possesses low motion prediction error due to the effective prediction of vehicle’s motion using HMM by considering both the past mean velocity and report by the nearby vehicles. By doing so, even if the speed of the vehicle increases the prediction of motion is not interrupted. The increase in speed affects the motion prediction accuracy of the existing approaches due to a lack of consideration of important parameters, thereby resulting in an increased prediction error.
The motion prediction error of our proposed approach is compared with the existing approaches with respect to the number of edge nodes, as illustrated in Figure 8. The motion prediction error decreases with an increase in the number of edges due to the fast computations provided by the edge nodes. The motion prediction error of our proposed approach is low than the existing approaches due to the increased efficiency of monitoring the specific regions by the respective edge nodes. In existing approaches, the error decreases with an increase in edge nodes, but the inefficient prediction of motion still results in an increased error.

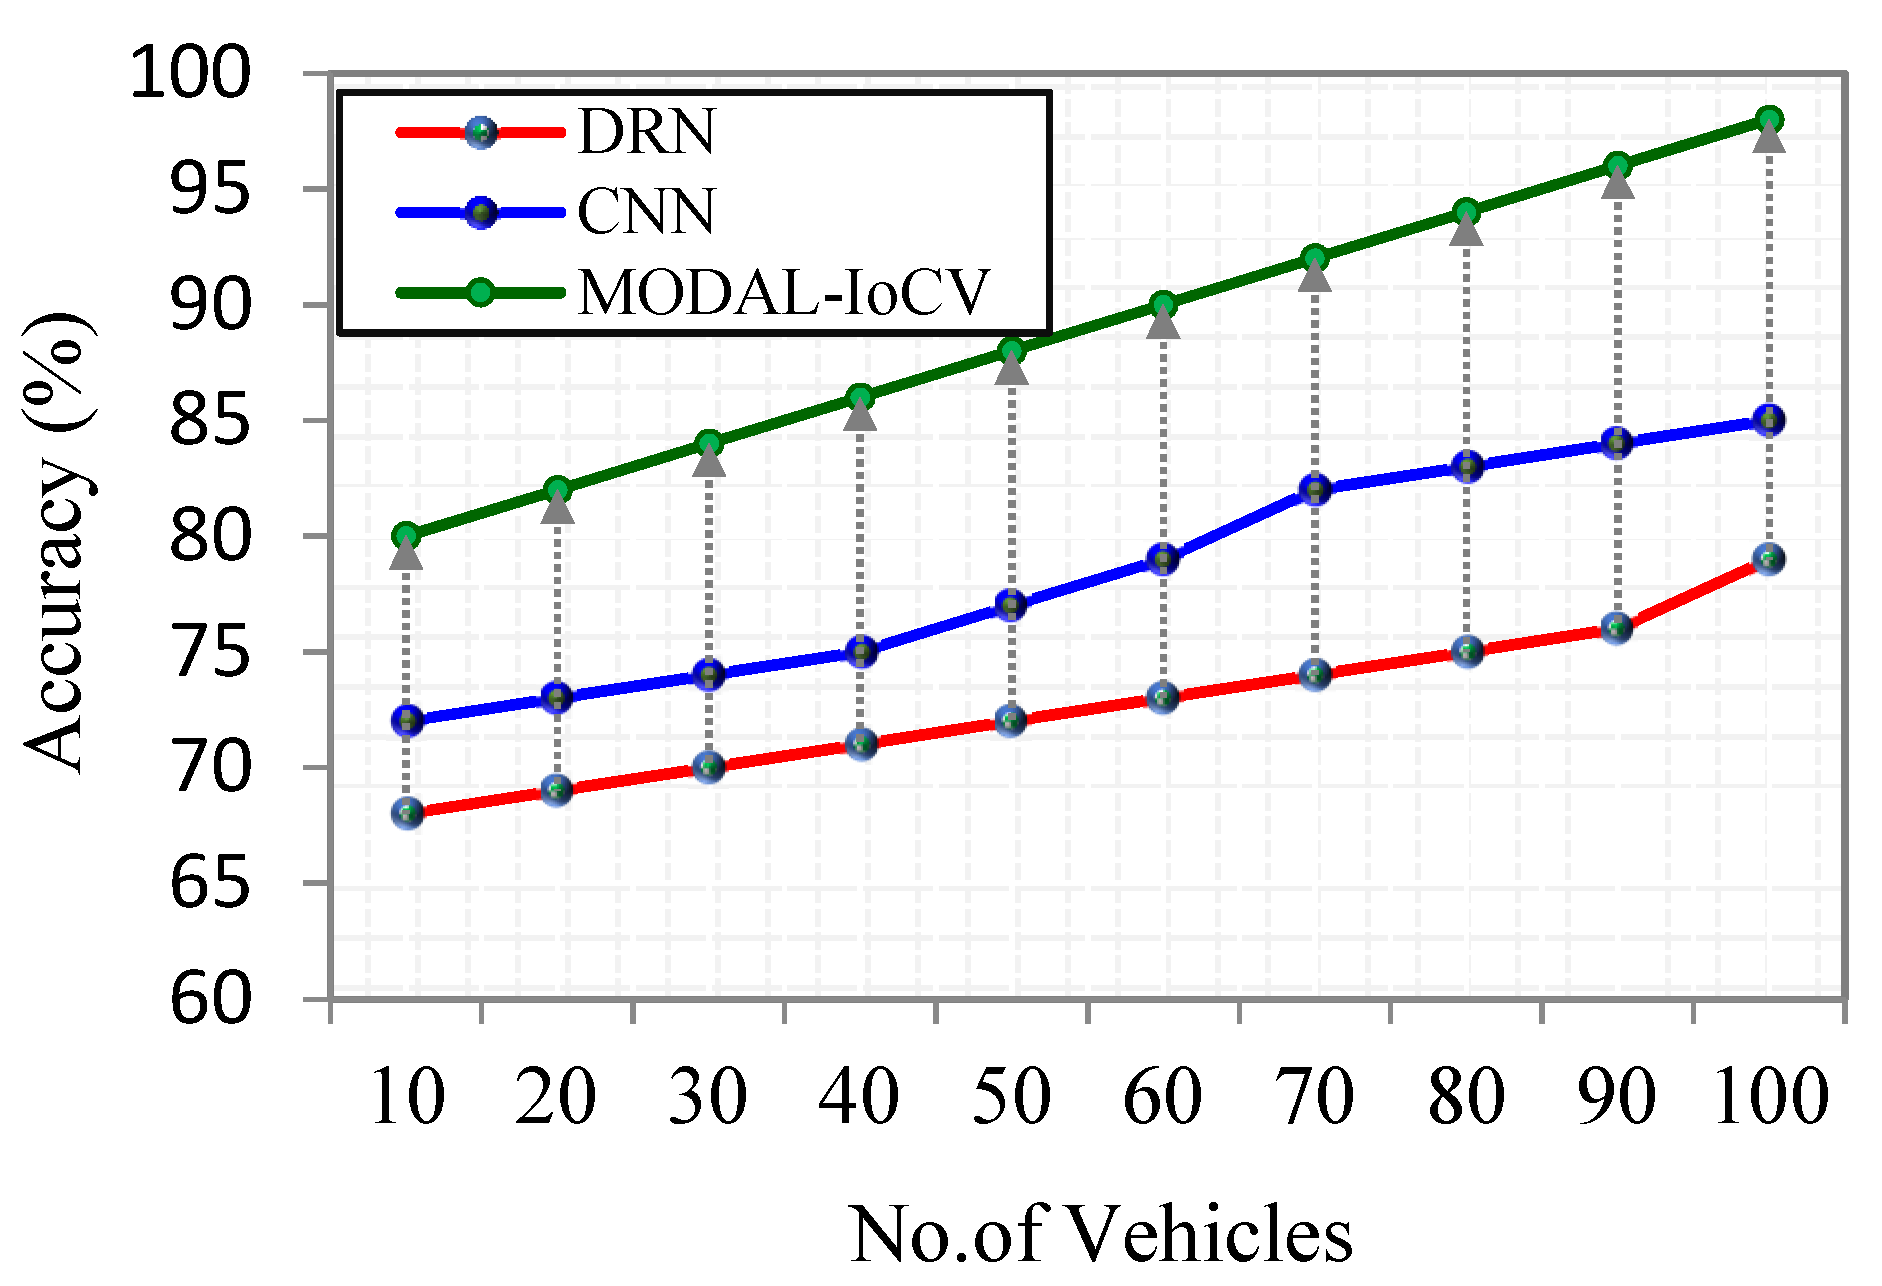
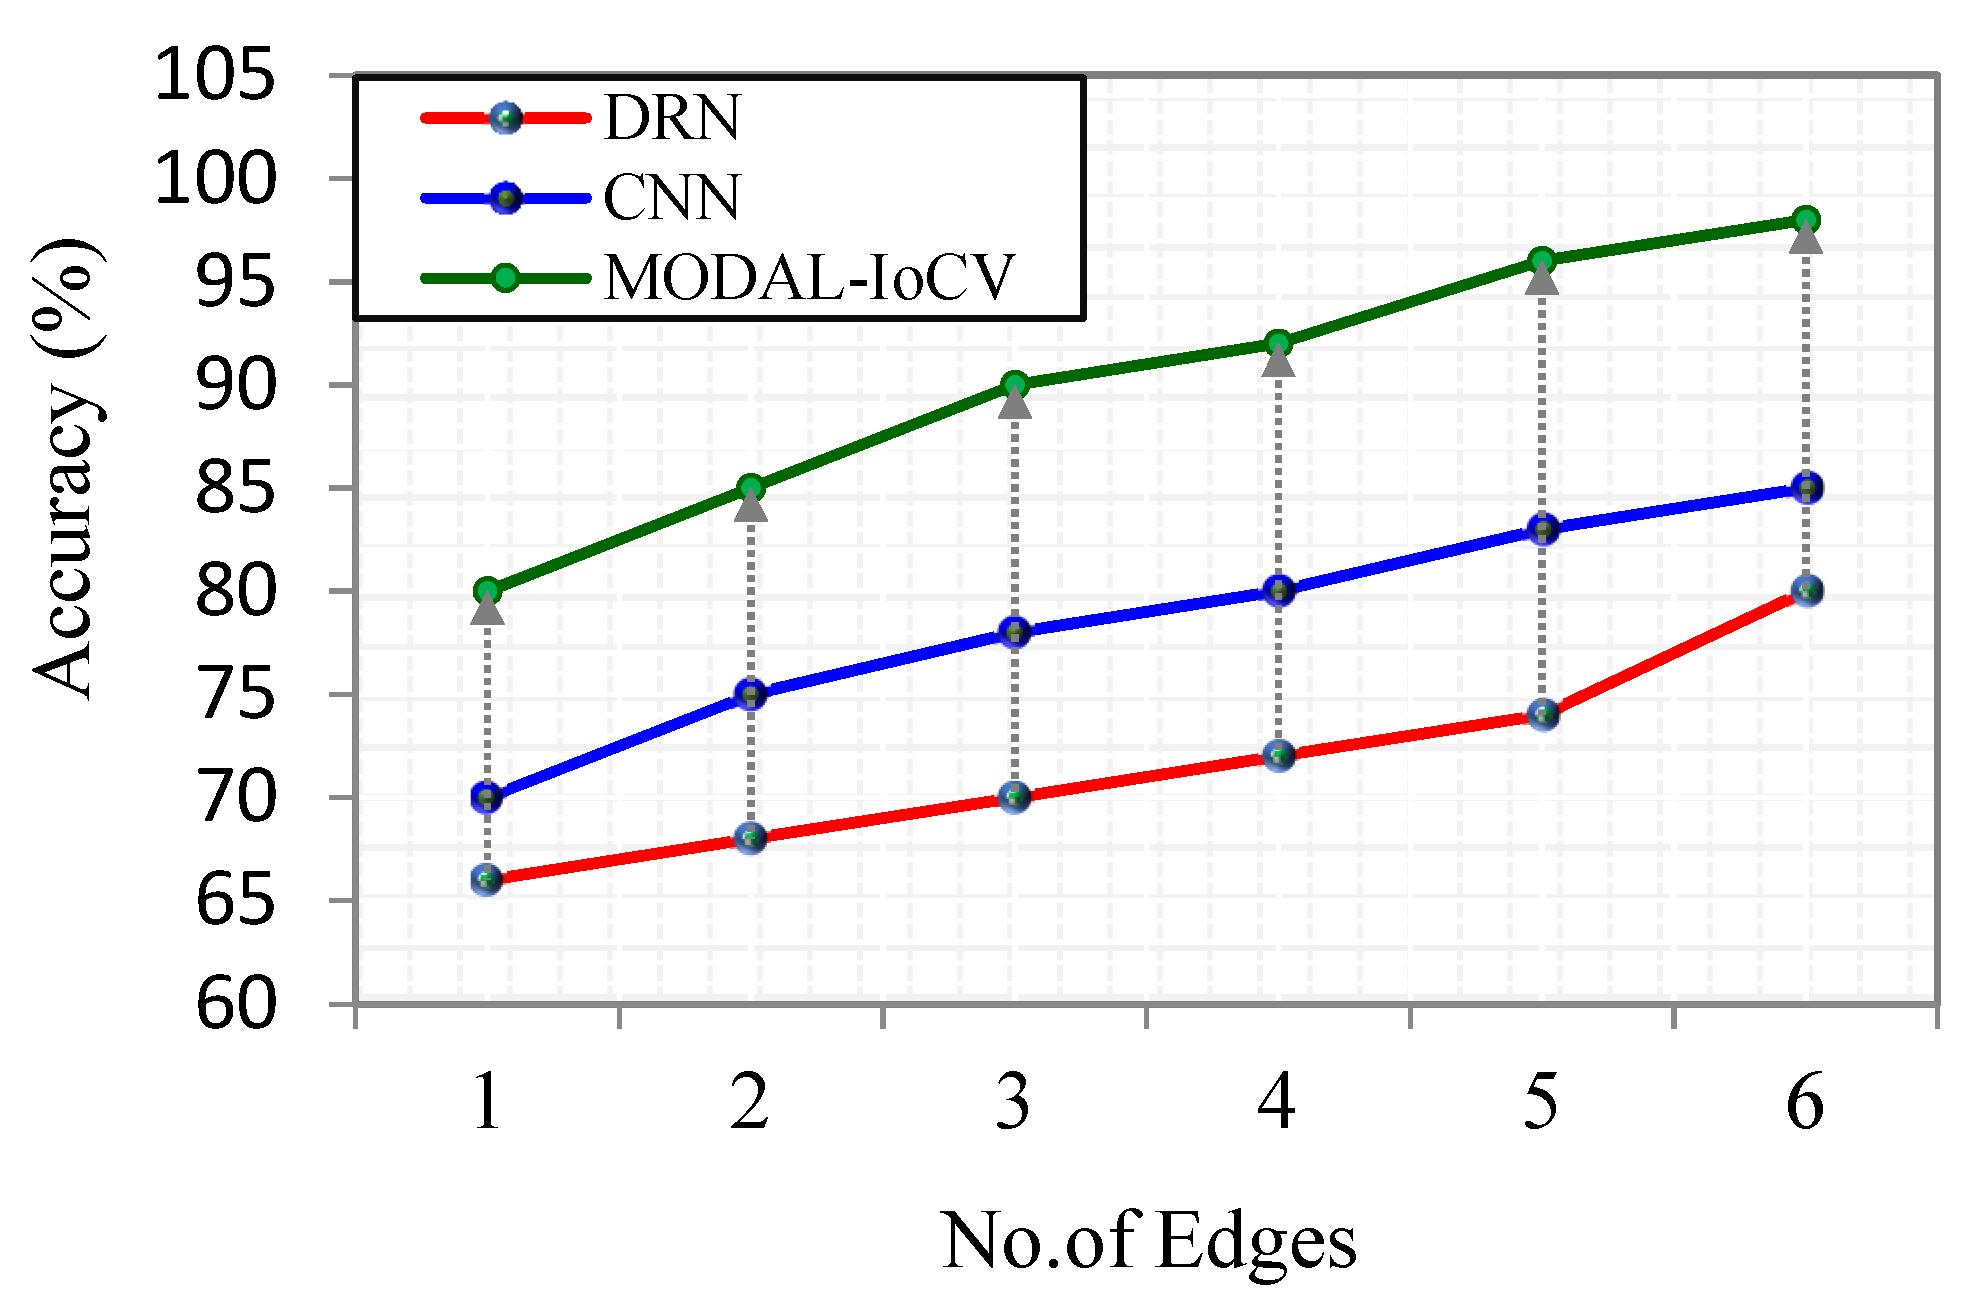
5.2.2. Impact of Accuracy

The accuracy is referred to as the measure of correctness in analyzing the behavior of the driver. The comparison of accuracy of the proposed approach and the existing approaches with respect to number of vehicles is presented in Figure 9. The accuracy of our proposed approach in classifying the behavior of the driver is high due to the implementation of SqueezeNet, which possesses increased efficiency in performance.
The classification of driver behavior is performed based on the integration of visual features, vehicle features and features provided by the smart wearables, which provides the drivers’ health information. The consideration of a variety of essential features and efficacy of the proposed SqueezeNet resulted in increased classification accuracy. The existing approaches utilized traditional deep learning models which are inefficient in differentiating between complex features resulting in reduced classification accuracy.
Figure 10 depicts the comparison of accuracy of our proposed approach and existing approaches with respect to the number of edge nodes. The increase in number of edge nodes contributes to the increased accuracy. The reduced error achieved by the proposed approach in predicting the motion of the vehicle also contributes to increased accuracy in the classification of driver behavior. The lack of consideration of necessary features in the classification of driver behavior resulted in reduced accuracy of the existing approaches even with the increase in the number of edge nodes.

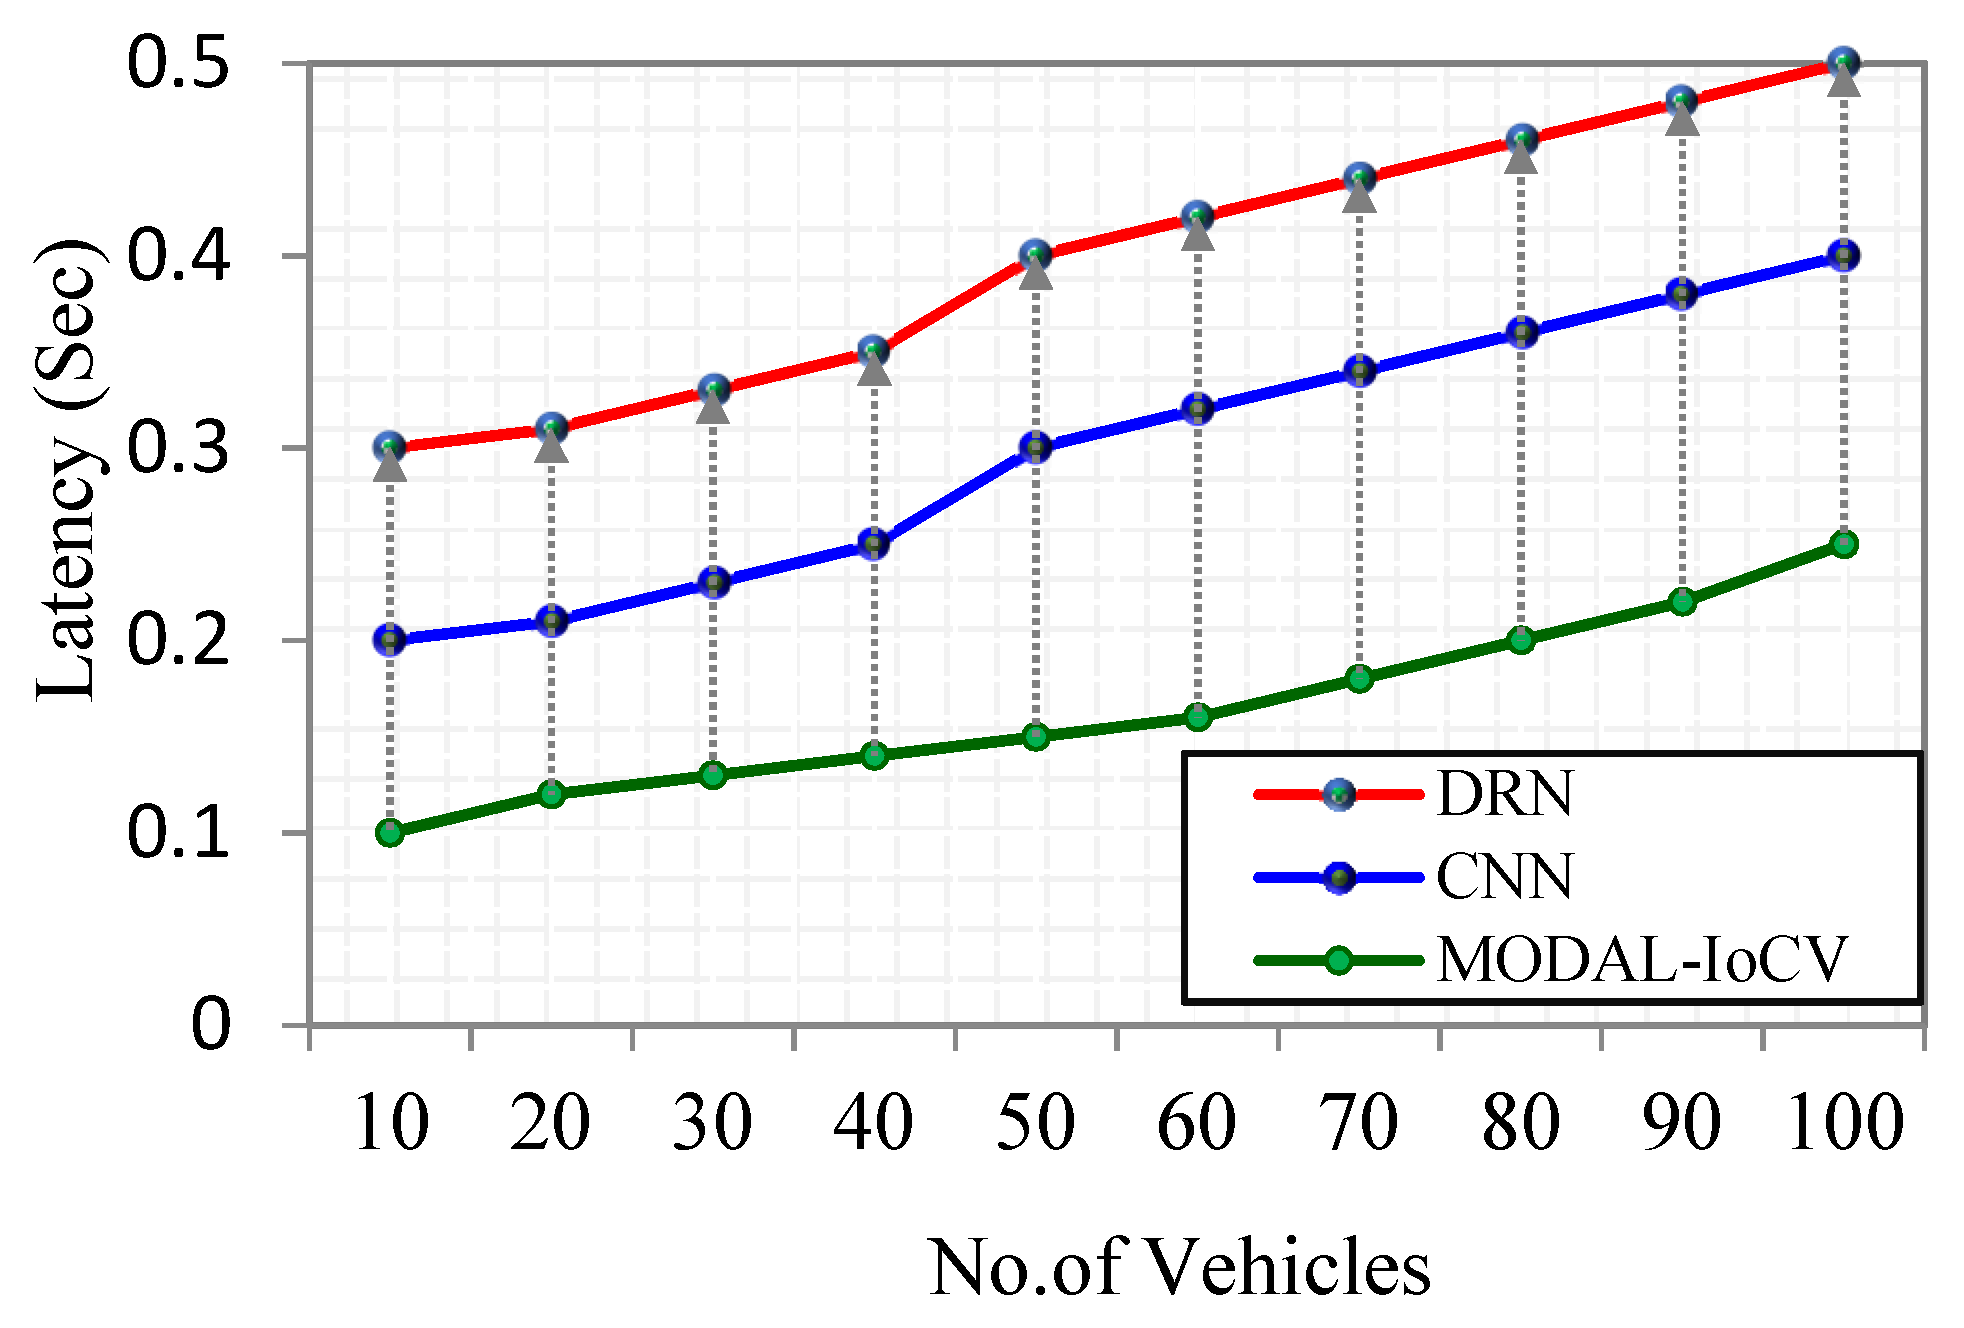
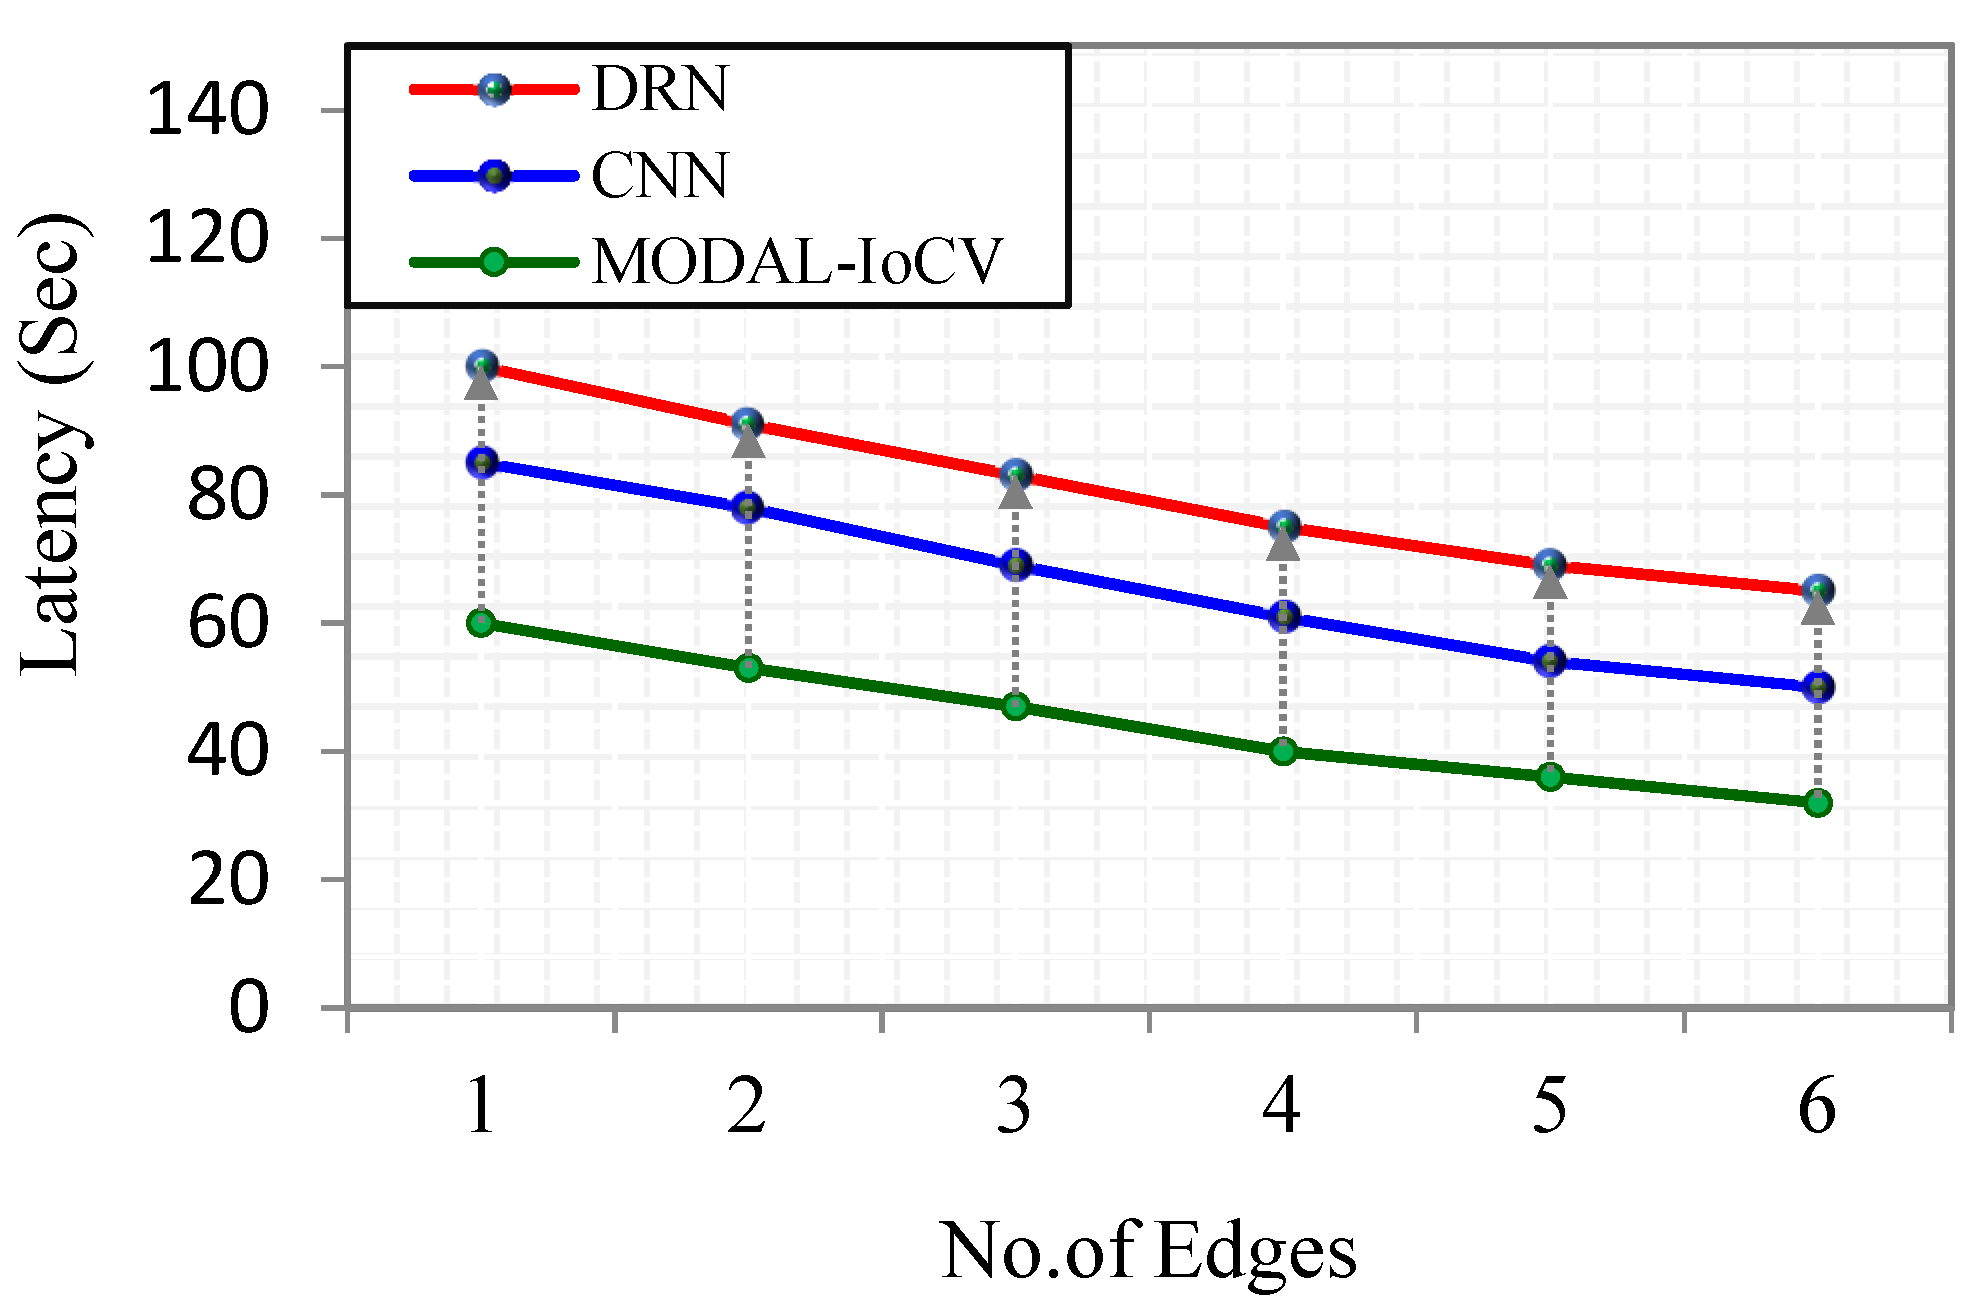
5.2.3. Impact of Latency

The latency is defined as the delay associated with the execution of operations involved in analyzing the behavior of driver. The latency is an important metric to be considered in analyzing the driver behavior and generation of personalized assistance in emergency situations. The latency of the proposed MODAL-IoCV approach is compared with the existing approaches with respect to the number of vehicles, as illustrated in Figure 11. The latency increases with an increase in the number of vehicles. The proposed approach possesses reduced latency due to the execution speed of the proposed SqueezeNet, which requires only a fewer number of parameters. The existing approaches implemented more complex methods resulting in increased latency, thereby affecting the performance of those approaches in emergency situations.
Figure 12 illustrates the comparison of latency of the proposed approach and the existing approaches with respect to the number of edge nodes. The latency decreases with an increase in the number of edge nodes. The latency of the proposed approach increases with the increase in the number of edges is found to be low due to the efficacy of the SqueezeNet in the classification of driver behavior. The lightweight nature of the proposed model makes it possible to execute with less consumption of time. The conventional methods possessed by the existing approaches resulted in increased latency even with the increase in the number of edge nodes.

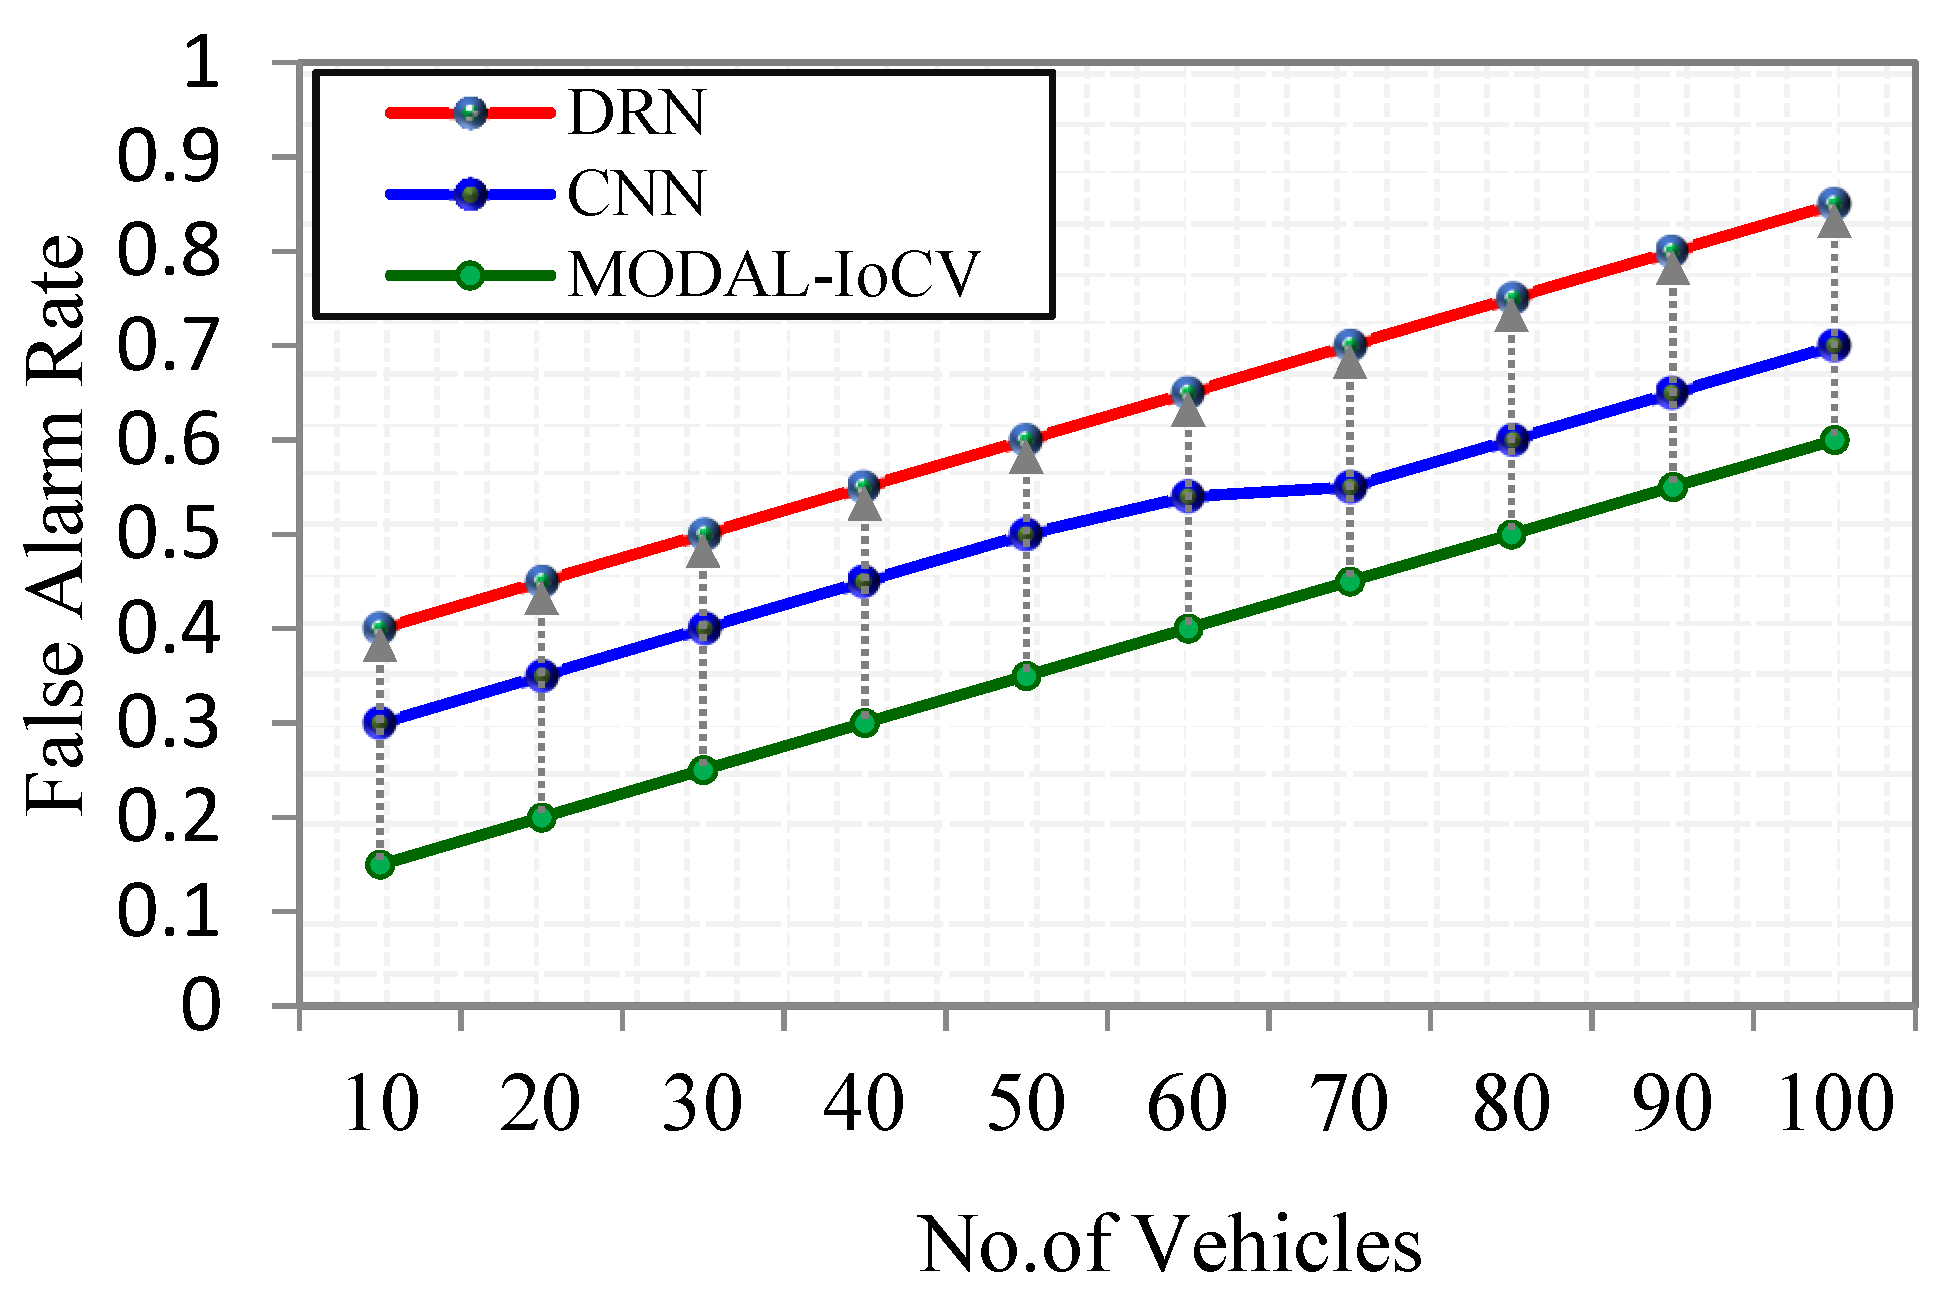
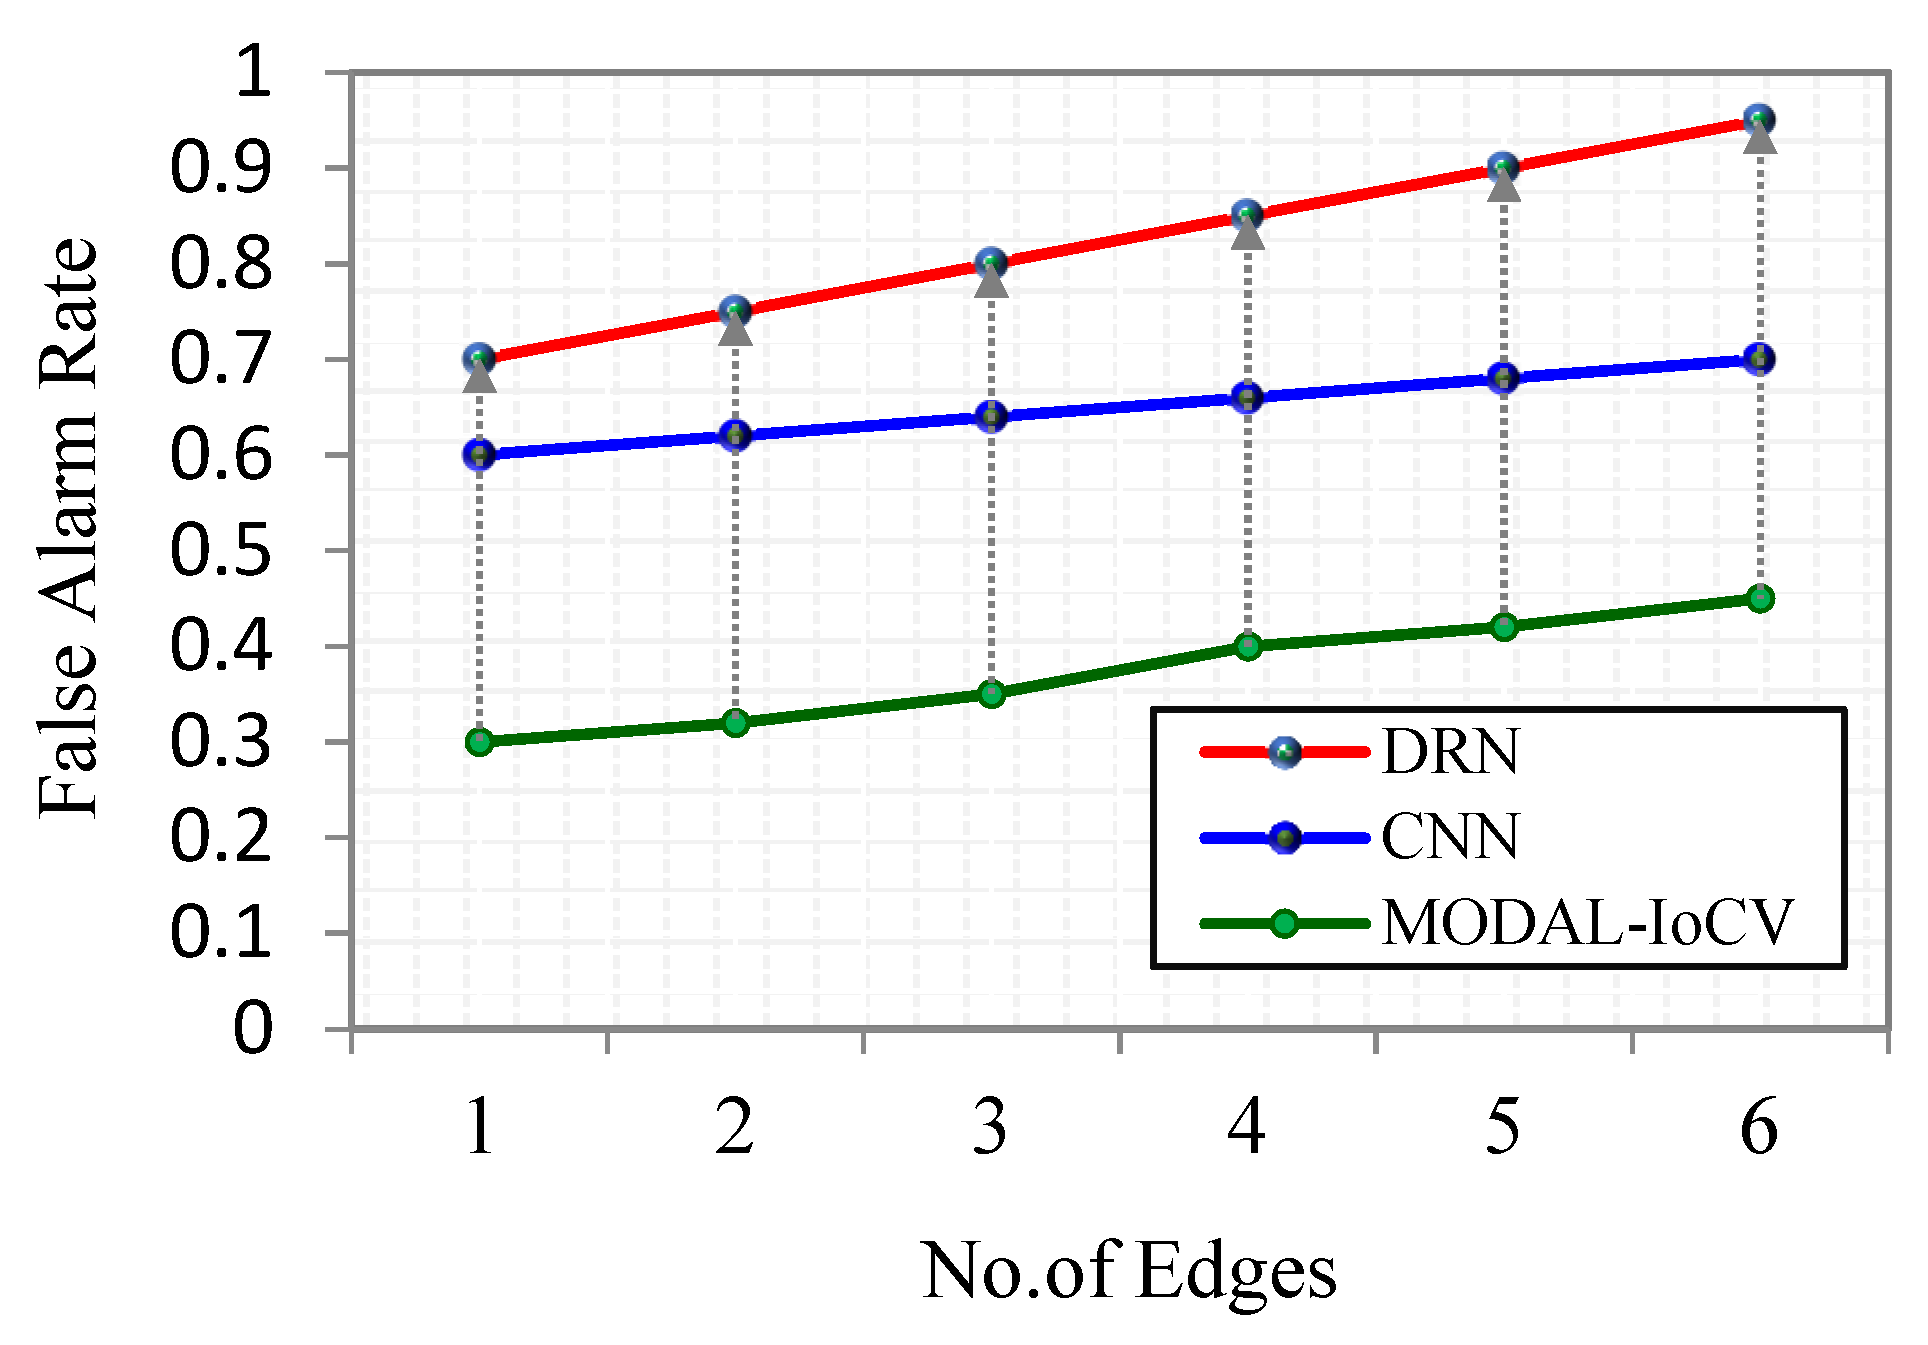
5.2.4. Impact of False Alarm Rate

The false alarm rate is the measure of rate of unwanted warnings provided by an approach due to the inefficiency in the classification of driver behavior. The false alarm rate of the proposed approach is compared with the existing approaches with respect to the number of vehicles as shown in Figure 13.
The false alarm rate increases with an increase in the number of vehicles. The proposed approach possesses a lower false alarm rate than the existing approaches due to precise classification of driver behavior and providing personalized assistance to the driver. This is achieved by implementing TA-SAC in which the three agents are utilized to provide precise assistance and dissemination of warning messages based on the environment. The existing approaches possess low accuracy in detection of driver behavior, thereby providing a high number of false alarms (which affects the regulation of traffic).
Figure 14 presents the comparison of the false alarm rate of our proposed approach and the existing approaches with respect to the number of edge nodes. The increase in edge nodes influences the speed of transmission of warning messages to nearby vehicles. The proposed approach possesses less false alarm rate due to the efficacy of both driver behavior detection and generation of personalized assistance. The increase in the number of edge nodes in the existing approaches, which possess an increased false alarm rate, result in frequent dissemination of false alarms, thereby resulting in wastage of bandwidth.

6. Discussion Section

6.1. Discussion

Context aware technologies employ sensors and other informational sources to inform users and systems about the operating environment and activities within a given domain. Advanced implementation of these systems will increasingly seek to integrate information concerning the physical, physiological, and psychological dimensions of the user. The integration of these three dimensions enables the output of context aware, and other ambient intelligence systems, to provide enhanced monitoring and reporting to a third party on the well-being or behavior of a target population in fixed locations. This context rich information can better inform the management of activities or resources and ultimately the support and motivation of certain behaviors that improve overall wellbeing.
Although previous research results such as [33] driver’s stress is assessed during driving which is based on three different factors as behavior, environment and route familiarity, the system error in modelling driver’s stress becomes very high due to the usage of the XGBoost algorithm and the training time is large as compared to the Catboost and light GBM algorithms. In [36], CNN is presented for driver behavior detection and classification, but CNN is not effectively handle in all image features converted from signals. Behavior modelling also takes a large amount of time for prediction. This increases the chance of accidents and does not ensure traffic safety through early alert message transmission. Thus, in this work the proposed MODAL-IoCV approach is validated with respect to two different metrics, namely the number of vehicles and the number of edges, respectively. The driver behavior analysis is carried out and the generation of personalized assistance based on the current state of the driver is performed in the proposed approach. The classification of driver behavior is facilitated based on the significant features such as visual features of driver, vehicular features, and physiological features acquired from the smart wearables. The driver behavior is extensively influenced by the physiological features which are used to accurately detect the driver behavior. The integration of visual features and physiological features contributed to the increased accuracy of the classification of driver behavior. The existing approaches implemented conventional models and considered either any of the feature set which affects the accuracy of detection. The proposed SqueezeNet performs the classification of driver behavior with reduced time, thereby reducing the overhead associated with the computation. The warning message dissemination and personalized assistance generation are executed by TA-SAC, which provides assistance based on multiple factors. Through this, the proposed approach is able to achieve increased accuracy and reduced latency, motion prediction error, and false alarm rate of about 90%, 0.16 s, 10%, and 0.37, respectively.
The proposed approach possesses reduced latency due to the execution speed of the existing approaches, which requires only a fewer number of parameters. The lightweight nature of the proposed model makes it possible to execute with less consumption of time.
Table 7 presents the numerical comparison of the performance metrics of our proposed MODAL-IoCV and the existing approaches with respect to both the number of vehicles and the number of edge nodes. From this, we can conclude that our proposed approach outperforms the existing approaches in all of the metrics to provide precise, personalized assistance and warning message dissemination based on the analysis of the behavior of the driver.

6.2. Safety and Security Challenges

As we have mentioned above, the main research aim is to design of safe roadside environment (i.e., to ensure driver safety, pedestrian safety, and neighboring vehicle safety). Safety and security properties to be taken into account in our work addressing sensitive data can be summarized as follows.
  • Confidentiality, which is the property through which data is disclosed only as intended by the data owner;
  • Integrity, which is the property guaranteeing that critical assets are not altered in disagreement with the owner’s wishes;
  • Availability, which is the property according to which critical assets will be accessible when needed for authorized use;
  • Accountability, which is the property according to which actions affecting critical assets can be traced to the actor or automated component responsible for the action.
All above security properties can be achieved when continuous monitoring of vehicle motion and lane change deviation and other multimodal features processing is important for accurate prediction driver behavior analysis. We set our aim in this study to reduce the overhead of the whole network by introducing a multiaccess edge environment. An end-to-end architecture for driver behavior analysis and solving roadside risks via personalized recommendation of assistance (and route planning) is therefore proposed.

7. Conclusions and Future Work

In this paper, a MODAL-IoCV method is proposed for driver behavior analysis using a deep learning approach. 5G is a high-speed and reliable technology, and thus the proposed model using edge computing possesses reduced latency due to the execution speed of the proposed SqueezeNet, which requires only a fewer number of parameters. The proposed method includes two layers, namely the IoCV layer and edge layer. The first layer includes the number of vehicles and RSU for monitoring the behaviors of the vehicles. The second layer consists of a number of edges which is responsible for monitoring the vehicles and driver behaviors. These layers are used for accident prevention and can provide early warning alerts to the drivers. The HMM predicts vehicle motion and lane changes for identifying the behavior of the vehicles. Then, the RSU classifies the driver behaviors into set of classes (i.e., high motion, low motion, frequently change and mild change). From these classes, the features are extracted using SqueezeNet which can classify the behaviors into drowsy, distracted, emergency, speeding, normal driving, bad pedaling, and bad steering, thereby improving the accuracy of the process. Afterward, abnormal behaviors are forward to the nearest vehicles by constructing a virtual graph, which increases traffic prevention. In parallel, the message dissemination of each vehicle of the deriver is precisely handled by the edge node. For that, we proposed TA-SAC, which provides the recommendation based on the current state of the driver behavior. Finally, the performances are evaluated and proved that the proposed model achieves better performance.
In ongoing and future work, we have planned to focus on security in driver behavior analysis with different varieties of attacks.

Author Contributions

Conceptualization, O.A. and M.K.; methodology, M.S.A.M.; software, B.A.-H.; validation, A.M., M.H.A., and O.A.; formal analysis, B.A.-H.; investigation, A.M.; resources, A.M.; data curation, M.S.A.M.; writing—original draft preparation, M.S.A.M.; writing—review and editing, M.K.; visualization, H.F.; supervision, A.M.; project administration, M.K.; funding acquisition, M.K. All authors have read and agreed to the published version of the manuscript.

Funding

This research was funded by Distinct Research Grant (DRG), grant number UJ-02-045-DR.

Institutional Review Board Statement

Not applicable.

Informed Consent Statement

Not applicable.

Data Availability Statement

The data are contained within the article and/or available from the corresponding author upon reasonable request.

Acknowledgments

Many thanks are due to University of Jeddah and Mohammed Muthanna for the assistance in the materials used for experiments and methodological work.

Conflicts of Interest

The authors declare no conflict of interest.

References

  1. Wang, X.; Wang, H. Driving Behavior Clustering for Hazardous Material Transportation Based on Genetic Fuzzy C-Means Algorithm. IEEE Access 2020, 8, 11289–11296. [Google Scholar] [CrossRef]
  2. Moghaddam, A.M.; Ghaffari, A.; Khodayari, A. Adaptive comfort-oriented vehicle lateral control with online controller adjustments according to driver behavior and look-ahead dynamics. Proc. Inst. Mech. Eng. Part K J. Multi-Body Dyn. 2020, 234, 272–287. [Google Scholar]
  3. Nassef, O.; Sequeira, L.; Salam, E.; Mahmoodi, T. Building a Lane Merge Coordination for Connected Vehicles Using Deep Reinforcement Learning. IEEE Internet Things J. 2021, 8, 2540–2557. [Google Scholar] [CrossRef]
  4. Le, D.T.; Dang, K.Q.; Nguyen, Q.L.T.; Alhelaly, S.; Muthanna, A. A Behavior-Based Malware Spreading Model for Vehicle-to-Vehicle Communications in VANET Networks. Electronics 2021, 10, 2403. [Google Scholar] [CrossRef]
  5. Mase, J.M.; Majid, S.; Mesgarpour, M.; Torres, M.T.; Figueredo, G.P.; Chapman, P. Evaluating the impact of Heavy Goods Vehicle driver monitoring and coaching to reduce risky behavior. Accid. Anal. Prev. 2020, 146, 105754. [Google Scholar] [CrossRef]
  6. Raissi, M.; Perdikaris, P.; Karniadakis, G.E. Physics-informed neural networks: A deep learning framework for solving forward and inverse problems involving nonlinear partial differential equations. J. Comput. Phys. 2019, 378, 686–707. [Google Scholar] [CrossRef]
  7. Escano, J.M.; Ridao-Olivar, M.A.; Ierardi, C.; Sanchez, A.J.; Rouzbehi, K. Driver Behavior Soft-Sensor Based on Neurofuzzy Systems and Weighted Projection on Principal Components. IEEE Sens. J. 2020, 20, 11454–11462. [Google Scholar] [CrossRef]
  8. Alamri, A.; Gumaei, A.; Al-Rakhami, M.; Hassan, M.M.; Alhussein, M.; Fortino, G. An Effective Bio-Signal-Based Driver Behavior Monitoring System Using a Generalized Deep Learning Approach. IEEE Access 2020, 8, 135037–135049. [Google Scholar] [CrossRef]
  9. Wu, R.; Zheng, X.; Xu, Y.; Wu, W.; Li, G.; Xu, Q.; Nie, Z. Modified Driving Safety Field Based on Trajectory Prediction Model for Pedestrian–Vehicle Collision. Sustainability 2019, 11, 6254. [Google Scholar] [CrossRef] [Green Version]
  10. Li, Y.; Wang, F.; Ke, H.; Wang, L.-L.; Xu, C.-C. A Driver’s Physiology Sensor-Based Driving Risk Prediction Method for Lane-Changing Process Using Hidden Markov Model. Sensors 2019, 19, 2670. [Google Scholar] [CrossRef] [Green Version]
  11. Parra, A.; Rodriguez, A.J.; Zubizarreta, A.; Perez, J. Validation of a Real-Time Capable Multibody Vehicle Dynamics Formulation for Automotive Testing Frameworks Based on Simulation. IEEE Access 2020, 8, 213253–213265. [Google Scholar] [CrossRef]
  12. Ortega, J.D.; Kose, N.; Cañas, P.; Chao, M.-A.; Unnervik, A.; Nieto, M.; Otaegui, O.; Salgado, L. DMD: A Large-Scale Multi-modal Driver Monitoring Dataset for Attention and Alertness Analysis. Adv. Auton. Robot. 2020, 18, 387–405. [Google Scholar] [CrossRef]
  13. Hong, Z.; Chen, Y.; Wu, Y. A driver behavior assessment and recommendation system for connected vehicles to produce safer driving environments through a “follow the leader” approach. Accid. Anal. Prev. 2020, 139, 105460. [Google Scholar] [CrossRef]
  14. Terán, J.; Navarro, L.; Quintero M., C.G.; Pardo, M. Intelligent Driving Assistant Based on Road Accident Risk Map Analysis and Vehicle Telemetry. Sensors 2020, 20, 1763. [Google Scholar] [CrossRef] [PubMed] [Green Version]
  15. Blackman, R.; Legge, M.; Debnath, A.K. Comparison of Three Traffic Management Plans Showing Shadow and Police Vehicle Effects on Driver Behavior at Highway Single Lane Closures. Transp. Res. Rec. J. Transp. Res. Board 2020, 2674, 15–25. [Google Scholar] [CrossRef]
  16. Zahid, M.; Chen, Y.; Jamal, A.; Al-Ofi, K.A.; Al-Ahmadi, H.M. Adopting Machine Learning and Spatial Analysis Techniques for Driver Risk Assessment: Insights from a Case Study. Int. J. Environ. Res. Public Health 2020, 17, 5193. [Google Scholar] [CrossRef]
  17. Leng, J.; Liu, Y.; Du, D.; Zhang, T.; Quan, P. Robust Obstacle Detection and Recognition for Driver Assistance Systems. IEEE Trans. Intell. Transp. Syst. 2019, 21, 1560–1571. [Google Scholar] [CrossRef]
  18. Zahabi, M.; Razak, A.M.A.; Shortz, A.E.; Mehta, R.K.; Manser, M. Evaluating advanced driver-assistance system trainings using driver performance, attention allocation, and neural efficiency measures. Appl. Ergon. 2020, 84, 103036. [Google Scholar] [CrossRef]
  19. Wickramanayake, S.; Bandara, H.M.; Samarasekara, N.A. Real-Time Monitoring and Driver Feedback to Promote Fuel Efficient Driving. arXiv Prepr. 2020, arXiv:2007.02728. [Google Scholar]
  20. Ullah, S.; Abbas, G.; Abbas, Z.H.; Waqas, M.; Ahmed, M. RBO-EM: Reduced Broadcast Overhead Scheme for Emergency Message Dissemination in VANETs. IEEE Access 2020, 8, 175205–175219. [Google Scholar] [CrossRef]
  21. Wang, R.; Xie, F.; Zhao, J.; Zhang, B.; Sun, R.; Yang, J. Smartphone Sensors-Based Abnormal Driving Behaviors Detection: Serial-Feature Network. IEEE Sens. J. 2021, 21, 15719–15728. [Google Scholar] [CrossRef]
  22. Messaoud, K.; Yahiaoui, I.; Verroust-Blondet, A.; Nashashibi, F. Attention Based Vehicle Trajectory Prediction. IEEE Trans. Intell. Veh. 2021, 6, 175–185. [Google Scholar] [CrossRef]
  23. Huang, C.; Wang, X.; Cao, J.; Wang, S.; Zhang, Y. HCF: A Hybrid CNN Framework for Behavior Detection of Distracted Drivers. IEEE Access 2020, 8, 109335–109349. [Google Scholar] [CrossRef]
  24. Kim, W.; Lee, Y.-K.; Jung, W.-S.; Yoo, D.; Kim, D.-H.; Jo, K.-H. An Adaptive Batch-Image Based Driver Status Monitoring System on a Lightweight GPU-Equipped SBC. IEEE Access 2020, 8, 206074–206087. [Google Scholar] [CrossRef]
  25. Peng, L.; Sotelo, M.A.; He, Y.; Ai, Y.; Li, Z. Rough Set Based Method for Vehicle Collision Risk Assessment Through Inferring Driver’s Braking Actions in Near-Crash Situations. IEEE Intell. Transp. Syst. Mag. 2019, 11, 54–69. [Google Scholar] [CrossRef]
  26. Davoli, L.; Martalò, M.; Cilfone, A.; Belli, L.; Ferrari, G.; Presta, R.; Montanari, R.; Mengoni, M.; Giraldi, L.; Amparore, E.G.; et al. On Driver Behavior Recognition for Increased Safety: A Roadmap. Safety 2020, 6, 55. [Google Scholar] [CrossRef]
  27. Lobo, A.; Ferreira, S.; Couto, A. Exploring Monitoring Systems Data for Driver Distraction and Drowsiness Research. Sensors 2020, 20, 3836. [Google Scholar] [CrossRef] [PubMed]
  28. Abbas, Q.; Alsheddy, A. Driver Fatigue Detection Systems Using Multi-Sensors, Smartphone, and Cloud-Based Computing Platforms: A Comparative Analysis. Sensors 2020, 21, 56. [Google Scholar] [CrossRef]
  29. Bichicchi, A.; Belaroussi, R.; Simone, A.; Vignali, V.; Lantieri, C.; Li, X. Analysis of Road-User Interaction by Extraction of Driver Behavior Features Using Deep Learning. IEEE Access 2020, 8, 19638–19645. [Google Scholar] [CrossRef]
  30. Kashevnik, A.; Lashkov, I.; Gurtov, A. Methodology and Mobile Application for Driver Behavior Analysis and Accident Prevention. IEEE Trans. Intell. Transp. Syst. 2020, 21, 2427–2436. [Google Scholar] [CrossRef]
  31. Pawar, N.; Khanuja, R.K.; Choudhary, P.; Velaga, N.R. Modelling braking behavior and accident probability of drivers under increasing time pressure conditions. Accid. Anal. Prev. 2019, 136, 105401. [Google Scholar] [CrossRef] [PubMed]
  32. Wan, Q.; Peng, G.; Li, Z.; Inomata, F.; Zheng, Y.; Liu, Q. Using Asymmetric Theory to Identify Heterogeneous Drivers’ Behavior Characteristics Through Traffic Oscillation. IEEE Access 2019, 7, 106284–106294. [Google Scholar] [CrossRef]
  33. Lu, Y.; Fu, X.; Guo, E.; Tang, F. XGBoost Algorithm-Based Monitoring Model for Urban Driving Stress: Combining Driving Behavior, Driving Environment, and Route Familiarity. IEEE Access 2021, 9, 21921–21938. [Google Scholar] [CrossRef]
  34. Shahverdy, M.; Fathy, M.; Berangi, R.; Sabokrou, M. Driver behavior detection and classification using deep convolutional neural networks. Expert Syst. Appl. 2020, 149, 113240. [Google Scholar] [CrossRef]
  35. Kashevnik, A.; Lashkov, I.; Ponomarev, A.; Teslya, N.; Gurtov, A. Cloud-Based Driver Monitoring System Using a Smartphone. IEEE Sens. J. 2020, 20, 6701–6715. [Google Scholar] [CrossRef]
  36. Chen, L.-W.; Chen, H.-M. Driver Behavior Monitoring and Warning With Dangerous Driving Detection Based on the Internet of Vehicles. IEEE Trans. Intell. Transp. Syst. 2020, 1–10. [Google Scholar] [CrossRef]
Figure 1. Environment of driver behavior analysis.
Applsci 11 10462 g001
Figure 2. Overall architecture of MODAL-IoCV.
Applsci 11 10462 g002
Figure 3. (a) conceptual diagram, (b) state positions, (c) hidden Markov model.
Applsci 11 10462 g003
Figure 4. SqueezeNet-based driver behavior modeling.
Applsci 11 10462 g004
Figure 5. working of TA-SAC algorithm.
Applsci 11 10462 g005
Figure 6. Overall Flowchart.
Applsci 11 10462 g006
Figure 7. Number of vehicles vs. motion prediction error.
Applsci 11 10462 g007
Figure 8. Number of edges vs. motion prediction error.
Applsci 11 10462 g008
Figure 9. Number of vehicles vs. accuracy.
Applsci 11 10462 g009
Figure 10. Number of edges vs. accuracy.
Applsci 11 10462 g010
Figure 11. Number of vehicles vs. latency.
Applsci 11 10462 g011
Figure 12. Number of edges vs. latency.
Applsci 11 10462 g012
Figure 13. Number of vehicles vs. false alarm rate.
Applsci 11 10462 g013
Figure 14. Number of edges vs. false alarm rate.
Applsci 11 10462 g014
Table 1. Summary of the contribution of the approach and results achieved by other research.
Existing WorkProblems AddressedProposed Solutions
[33]
  • Visual result of environment (scenes by images) is considered and processed in DRN, but weather information is not of focus, which causes low accuracy in monitoring driver behavior.
  • System error in modelling driver stress becomes very high due to the usage of the XGBoost algorithm, and training time is large compared to the Catboost and light GBM algorithms.
  • Visual features of driver’s vehicle are considered in SqueezeNet for modelling facial features and head position. Furthermore, weather information is considered and learned by SqueezeNet for modelling the driver’s current behavior based on past sequences.
  • SqueezeNet is a lightweight deep learning architecture that is able to process both large and small volumes of data to produce the corresponding outcomes.
[34]
  • Environmental and health status is not considered in this paper, which causes a higher accident risk and high economic damage.
  • This paper does not discuss the alert messages for the personalized monitoring of drivers during driving.
  • CNN does not effectively handle all image features converted from signals, and behavior modelling takes a large amount of time to generate predictions. This increases the chance of accidents and does not ensure traffic safety through early alert message transmission.
  • Alert messages are forwarded to the drivers and personalized driver monitoring is implemented in this work.
  • SqueezeNet is used to handle individual type of features. Based on the features processed in SqueezeNet, the driver behavior is modelled.
[35]
  • Cloud-based driver behavior monitoring increases latency. It is not effective to handle the monitoring of a large number of drivers’ behavior for real-time warning message updates.
  • The health (physiological) parameters of the driver are not considered, which are important in emergency situations. The lack of smart sensor deployment increases pandemic cases.
  • Recommendations are not personalized for drivers since environment parameters (events) and weather information is not considered, which causes low accuracy in recommendations.
  • Edge is deployed in monitoring all RSUs deployed on the road side, which decreases latency. It can handle the number of vehicles inside the region and multiaccess edges coordinate with the corresponding RSUs.
  • Smart wearables, smart sensors, and smart phone devices are used to continuously monitor the physiological parameters and sense the health issues of the driver for accurate behavior modelling.
  • Personalized assistance is recommended for drivers in which the driver’s next action is presented. Based on the action, route planning is initiated for drivers.
[36]
  • Vehicle motion is not focused, which measures the lane change deviation using image processing techniques. Hence, it is not suited for all types of drivers. High acceleration, continuous speeding, frequent lane changes, and large brakes must be considered to monitor driver behavior.
  • Dangerous driver’s behaviors are not classified, such as drunk, distraction, and fatigue. Hence, warning messages are not optimal in this case (i.e., the decision must be properly made and sent to the pedestrians and other road side vehicles).
  • Vehicle motion and lane change detection is implemented using the hidden Markov model, which uses vehicle sensor information of past and current sequences. With this, we find vehicle motion of three classes: high, medium, and low. On the other hand, lane change is detected and classified into three classes: frequent change, no change, and mild change.
  • There are several classes of dangerous driver that are identified using multimodal feature processing in the SqueezeNet algorithm.
Table 2. Features considered for driver behavior analysis.
Feature TypeFeature NameRange
Smart IoT devicePulse range50–110 (ppm)
Rhythmyes
Respiratory rate12–20 (bpm)
ST elevation0.13
Q wave0.15
EEG range8–13 Hz
ST depression0.16
VehicularMoving direction(North, South, East, West)
Position(Latitude, Longitude)
Longitudinal acceleration 0.1 0.22   m / s 2
Speed40-0 km
Rate of yaw angle 20 ° / s 27 ° / s
Table 3. Attributes of driver behavior analysis.
Attribute TypeAttributeDescription
Driver behaviorBoolean (0-no, 1-yes)Brake SwitchKeep constant
Acceleration
Deceleration
Steering
Boolean
(0-no, 1-yes)
Acc Pedal
Boolean
(0-no, 1-yes)
Turn indicator
Road obstaclesContinuousObstacles in longitudinal directionCalculated by TTC and classified into 3 levels
1>5, 2=1–5
3=0–2
Kinematic status of vehicleContinuousVelocityCalculate by km/h and classified into 4 levels
1=0–40, 2=41–50, 3=51–60,4=>60
Table 4. Layers of SqueezeNet.
Name of the LayerFiltersDepthOutput Size
Conv 1 7 × 7 / 2 ( × 96 ) 1 111 × 111 × 96
Maxpool 1 3 × 3 /20 55 × 55 × 96
Fire 2-2 55 × 55 × 128
Fire 3-2 55 × 55 × 128
Fire 4-2 55 × 55 × 256
Maxpool 4 3 × 3 /20 27 × 27 × 256
Fire 5-2 27 × 27 × 256
Fire 6-2 27 × 27 × 384
Fire 7-2 27 × 27 × 384
Fire 8-2 27 × 27 × 512
Maxpool 8 3 × 3/20 13 × 12 × 512
Fire 9-2 13 × 12 × 512
Conv 10 1 × 1 / 1 ( × 1000 ) 1 13 × 13 × 1000
Avgpool 10 13 × 13 /10 × 1 / 1 × 1000
Table 5. System requirements.
Software RequirementsNetwork simulatorOMNET++
Traffic simulatorSUMO
OSUbuntu
Hardware requirementsRAM8 GB
CPU2.90 GHZ
Hard disk1 TB
ProcessorIntel core
Table 6. Simulation parameters.
PARAMETERSDESCRIPTION
Network Parameters
Area of simulation500 × 500 m
Simulation time300 s
Number of RSUs4
Number of Edge nodes6
Number of cloud node1
Number of vehicles100
Type of trafficTraffic control interface model
Rate of transmission200 Mbps
Range of transmission200–250 m
Transport protocolTCP
Size of packet512 bytes
Total number of packets10,000 (approx.)
Mobility modelRandom way point
Table 7. Performance analysis.
Performance MetricsScenarioProposed and Existing Approaches
DRNCNNMODAL-IoCV
Accuracy (%)#of vehicles 71.7 ± 4 78.6 ± 3 90.5 ± 2
#of edges 72.6 ± 3 78.5 ± 2 90.1 ± 1
Latency (Sec)#of vehicles 0.39 ± 0.4 0.29 ± 0.3 0.16 ± 0.2
#of edges 80.5 ± 3 66.1 ± 2 44.6 ± 1
Motion prediciton error (%)#of vehicles 22.8 ± 4 18.5 ± 3 11 ± 1
#of edges 25.6 ± 3 15.5 ± 2 9.5 ± 1
False alarm rate#of vehicles 0.62 ± 0.4 0.50 ± 0.3 0.37 ± 0.1
#of edges 0.82 ± 0.4 0.65 ± 0.3 0.37 ± 0.2
Publisher’s Note: MDPI stays neutral with regard to jurisdictional claims in published maps and institutional affiliations.

