
Post-Buckling Spring Vibration Isolator Using Silicone Gel Column: A Theoretical and Experimental Study


1
Beijing Key Laboratory of Nonlinear Vibrations and Strength of Mechanical Engineering, Faculty of Materials and Manufacturing, Beijing University of Technology, Beijing 100124, China
2
School of Mechanical Engineering & Automation, Northeastern University, Shenyang 110819, China
3
State Key Laboratory of Robotics, Shenyang Institute of Automation, Chinese Academy of Sciences, Shenyang 110169, China
*
Author to whom correspondence should be addressed.
Appl. Sci. 2021, 11(22), 10559; https://0-doi-org.brum.beds.ac.uk/10.3390/app112210559
Submission received: 29 September 2021
/
Revised: 31 October 2021
/
Accepted: 4 November 2021
/
Published: 10 November 2021
(This article belongs to the Special Issue Vibration Control and Applications)
Abstract
:Based on the design of a post-buckling silicone gel column (SGC), a novel type of low-frequency vibration isolator is presented, and the vibration isolation performance of this isolator is studied by combining theoretical analysis and experimental verification. The stiffness characteristics of the post-buckling SGC are derived, and its recovery force curves with different parameters are analyzed using two kinds of elliptic integral functions. Displacement transmissibility is formulated using harmonic balance method (HBM), and the influences of the excitation amplitude, damping ratio, SGC section diameter, and Young’s modulus are discussed in terms of the transmissibility. The performance of the SGC system is verified through a series of experimental studies based on the developed experimental prototype. The result shows that the proposed post-buckling spring vibration isolator has a good vibration isolation effect, especially in the low-frequency domain, which may provide a feasible novel design idea for a low-frequency vibration isolator.
1. Introduction
The generation of harmful vibration is inevitable, which reduces the performance of machines used in engineering [1,2,3]. Harmful vibration during engineering not only affects the use and working efficiency of precision instruments but also leads to precision instruments being damaged [4]. Therefore, it is particularly important to reduce harmful vibration in fields such as machining, transportation, and aerospace [4,5].
One simple and effective way to reduce harmful vibrations is to use isolation devices [6]. These devices can realize vibration isolation in a wide range of frequencies, but most traditional isolators are linear, as they play a role in vibration isolation only when the excitation frequency is times higher than the natural frequency of the system [5,7]. Therefore, if we want to achieve the low-frequency isolation of linear isolators, it is necessary to reduce the stiffness of their elastic elements. Selecting a lower system stiffness means that it will cause larger static displacement; however, the static bearing capacity of the system is insufficient.
In terms of the deficiency of linear vibration isolation, vibration isolators using nonlinear damping or nonlinear stiffness designs have been of concern and, therefore, studied extensively in recent years. The introduction of nonlinear damping has been found to improve vibration isolation performance [8,9], and the characteristic of nonlinear stiffness can broaden the frequency band of vibration isolation [10,11,12]. Both simulation and experiments show that the aforementioned nonlinear design methods can achieve better vibration isolation effects and have a high bearing capacity in the corresponding frequency band. Even so, the nonlinearity of this kind of special design needs higher application requirements and is hard to control, evaluate, and realize [2,13,14,15]. Based on recent research investigating the contradiction between low stiffness and low static load in vibration isolation theory, we aim to analyze and design the isolator in a manner that reduces stiffness and increases its bearing capacity, thus improving the vibration isolation performance of the isolator.
Silicone gel material, which is widely used in sports, medicine, and other fields, has excellent impact resistance and is a very promising buffer material for reducing shock and vibration [16,17,18,19]. Based on its unique soft elastic properties, the resonance frequency of the SGC can reach the low-frequency region, meeting the requirements of the low-frequency vibration isolation of the isolator. The post-buckling behavior of the beam–column structure is part of the issue of supercritical deformation induced by axial force, and it has been studied by many scholars [20,21,22,23]. When the beam–column structure is subjected to axial pressure and exceeds the critical pressure value, the buckling deformation of the structure will occur, and the post-buckling behavior of the super large deformation will occur if the pressure continues to increase [24]. Therefore, the design of the elastic elements of vibration isolators based on supercritical post-buckling deformation can ensure low stiffness while having the capability of initial static load, which greatly reduces the static displacement of the system [22,25,26].
By introducing a new silicone gel material to make the vibration isolation frequency reach the low-frequency region and using the elastic element design of post-buckling to improve the defect of insufficient static load, a new solution for low-frequency vibration isolation can be achieved. In this paper, we study the following aspects of the vibration isolation performance of the new vibration isolator. Firstly, based on two kinds of elliptic integral functions, the stiffness characteristics of the post-buckling spring are analyzed. Secondly, the dynamic models of the SGC vibration isolation systems of the post-buckling spring are established, and the approximate analytical solution is obtained using HBM. The expression of the vibration transfer rate is derived, and the parameter influence of the system on vibration isolation performance is studied. Finally, the vibration isolation performance of the post-buckling spring isolator is investigated through a vibration isolation experiment.
2. The Stiffness Analysis of Post-Buckling SGC
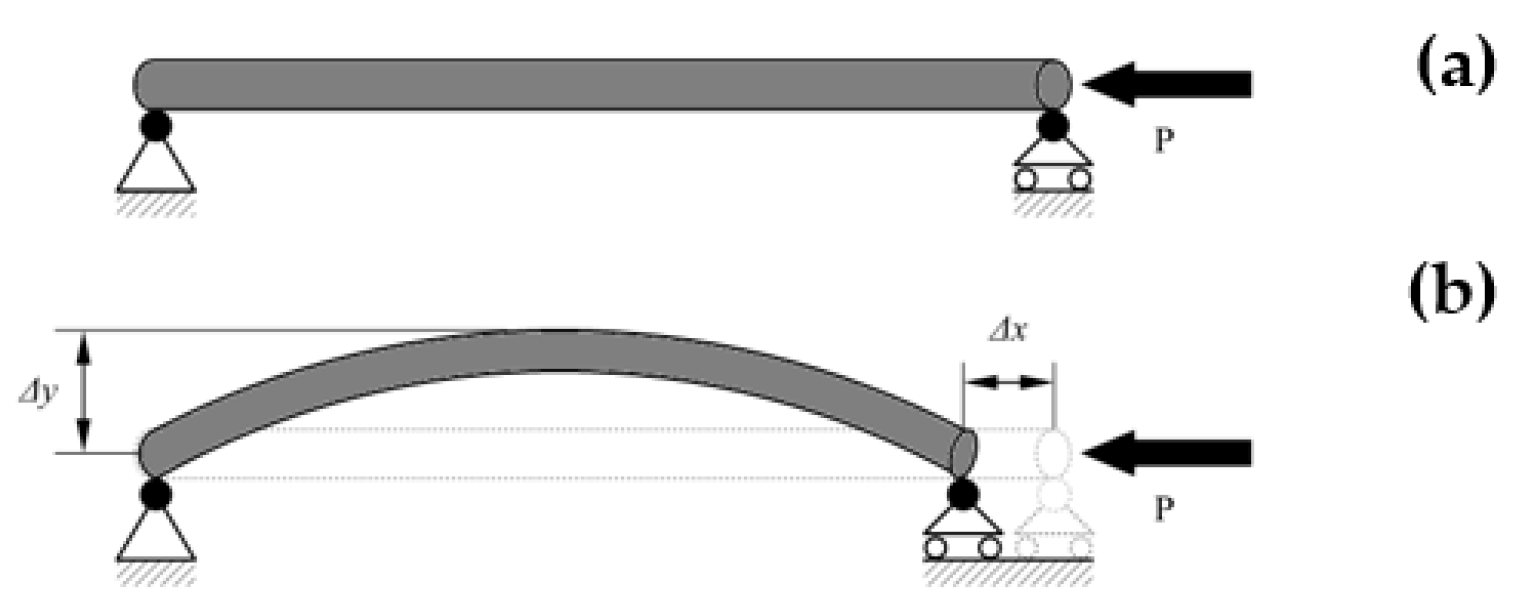
The axial stiffness of the SGC consists of the compression steady-state tensile stiffness and the buckling stiffness during compression instability. For example, a simple support beam is made of length l, section area A, and Young’s modulus E. The equivalent tensile stiffness formula of the beam during the steady-state tension is k = EA/l [27], and the schematic representation of the compression is as shown in Figure 1a. By continuing to increase the pressure p, beyond the axial critical pressure Pcr = π2EI/l2, (I = πd4/64) [28], the SGC causes buckling deformation. When the axial projection shortens by before deformation and the lateral deflection is ∆y, the equivalent stiffness can be written as k = p/∆x, as shown in Figure 1b.
2.1. The Characteristic of the Post-Buckling Spring
In Figure 1, the dynamic equation of the axial compressed support beam is written as [27]:
where θ is the corner of the beam bending, P is the axial pressure of the beam, s is the beam arc length coordinate, and d/ds is differential operator.
It is essential to consider the large deflection angle in the post-buckling analysis. This is part of the strong, nonlinear problem, which in turn requires two classes of elliptic integral functions [29].
With the transformation and integration, Equation (1) can be expressed as
The endpoint deflection angle is assumed to be θ0, and the curvature is zero due to the endpoint of the hinge, so dθ/ds = 0; thus, one can obtain
due to θ ⊂ (0, θ0), and introducing φ ⊂ (0, π/2), we assume
The following Equation (6) will be obtained by Equation (5).
By substituting the above Equations (3), (4) and (6) into Equation (2), one can obtain
Considering the first class of elliptic integral,
the value c is obtained and replaced into Equation (7), and using the first class of non-complete elliptical integral,
A set of data (l, φ) is derived and converted into (l, θ) via Equation (4), where l ⊂ (0, L/2) is the arc coordinate indicating the arc length from the middle to the endpoint, and θ indicates the deflection angle.
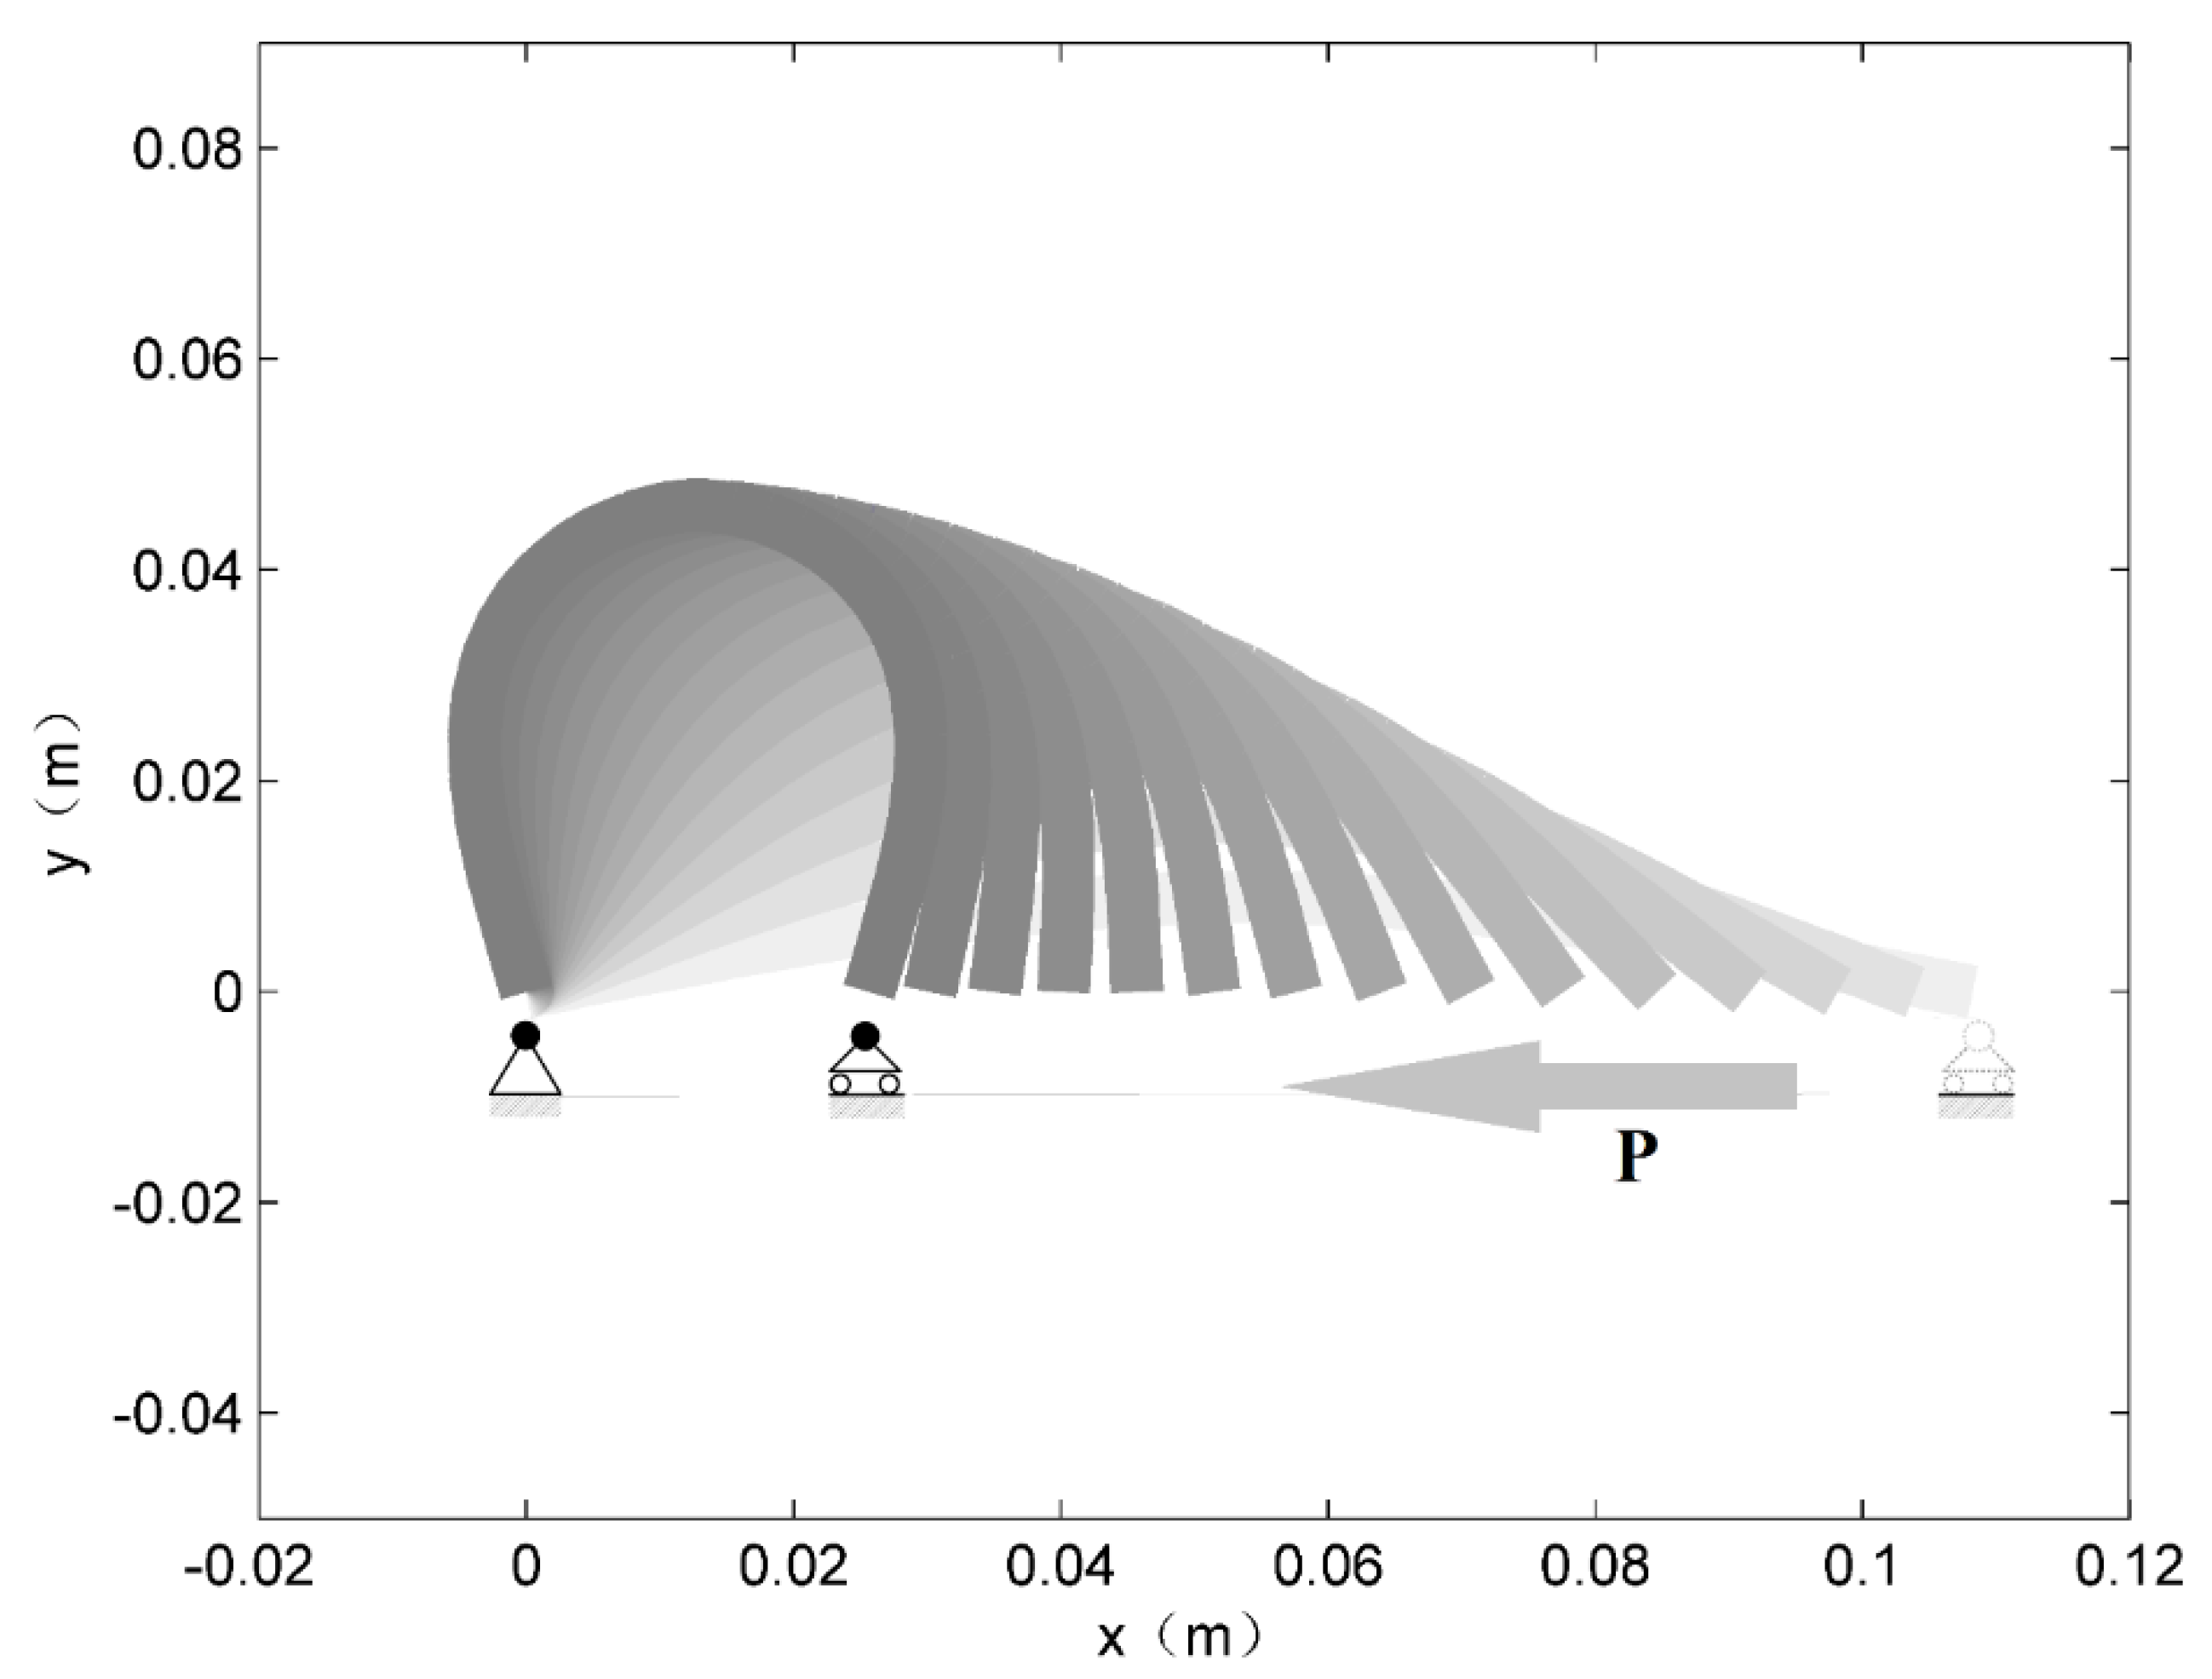
A symmetrical arc of length L can be drawn when the length L, Young’s modulus E, and Section diameter D of the SGC are selected as 0.11 m, 3.5 × 10⁴ Pa, and 0.02 m, respectively. By increasing the axial pressure, which is applied to the right side of the SGC, the deformation evolution process of the beam is as shown in Figure 2.
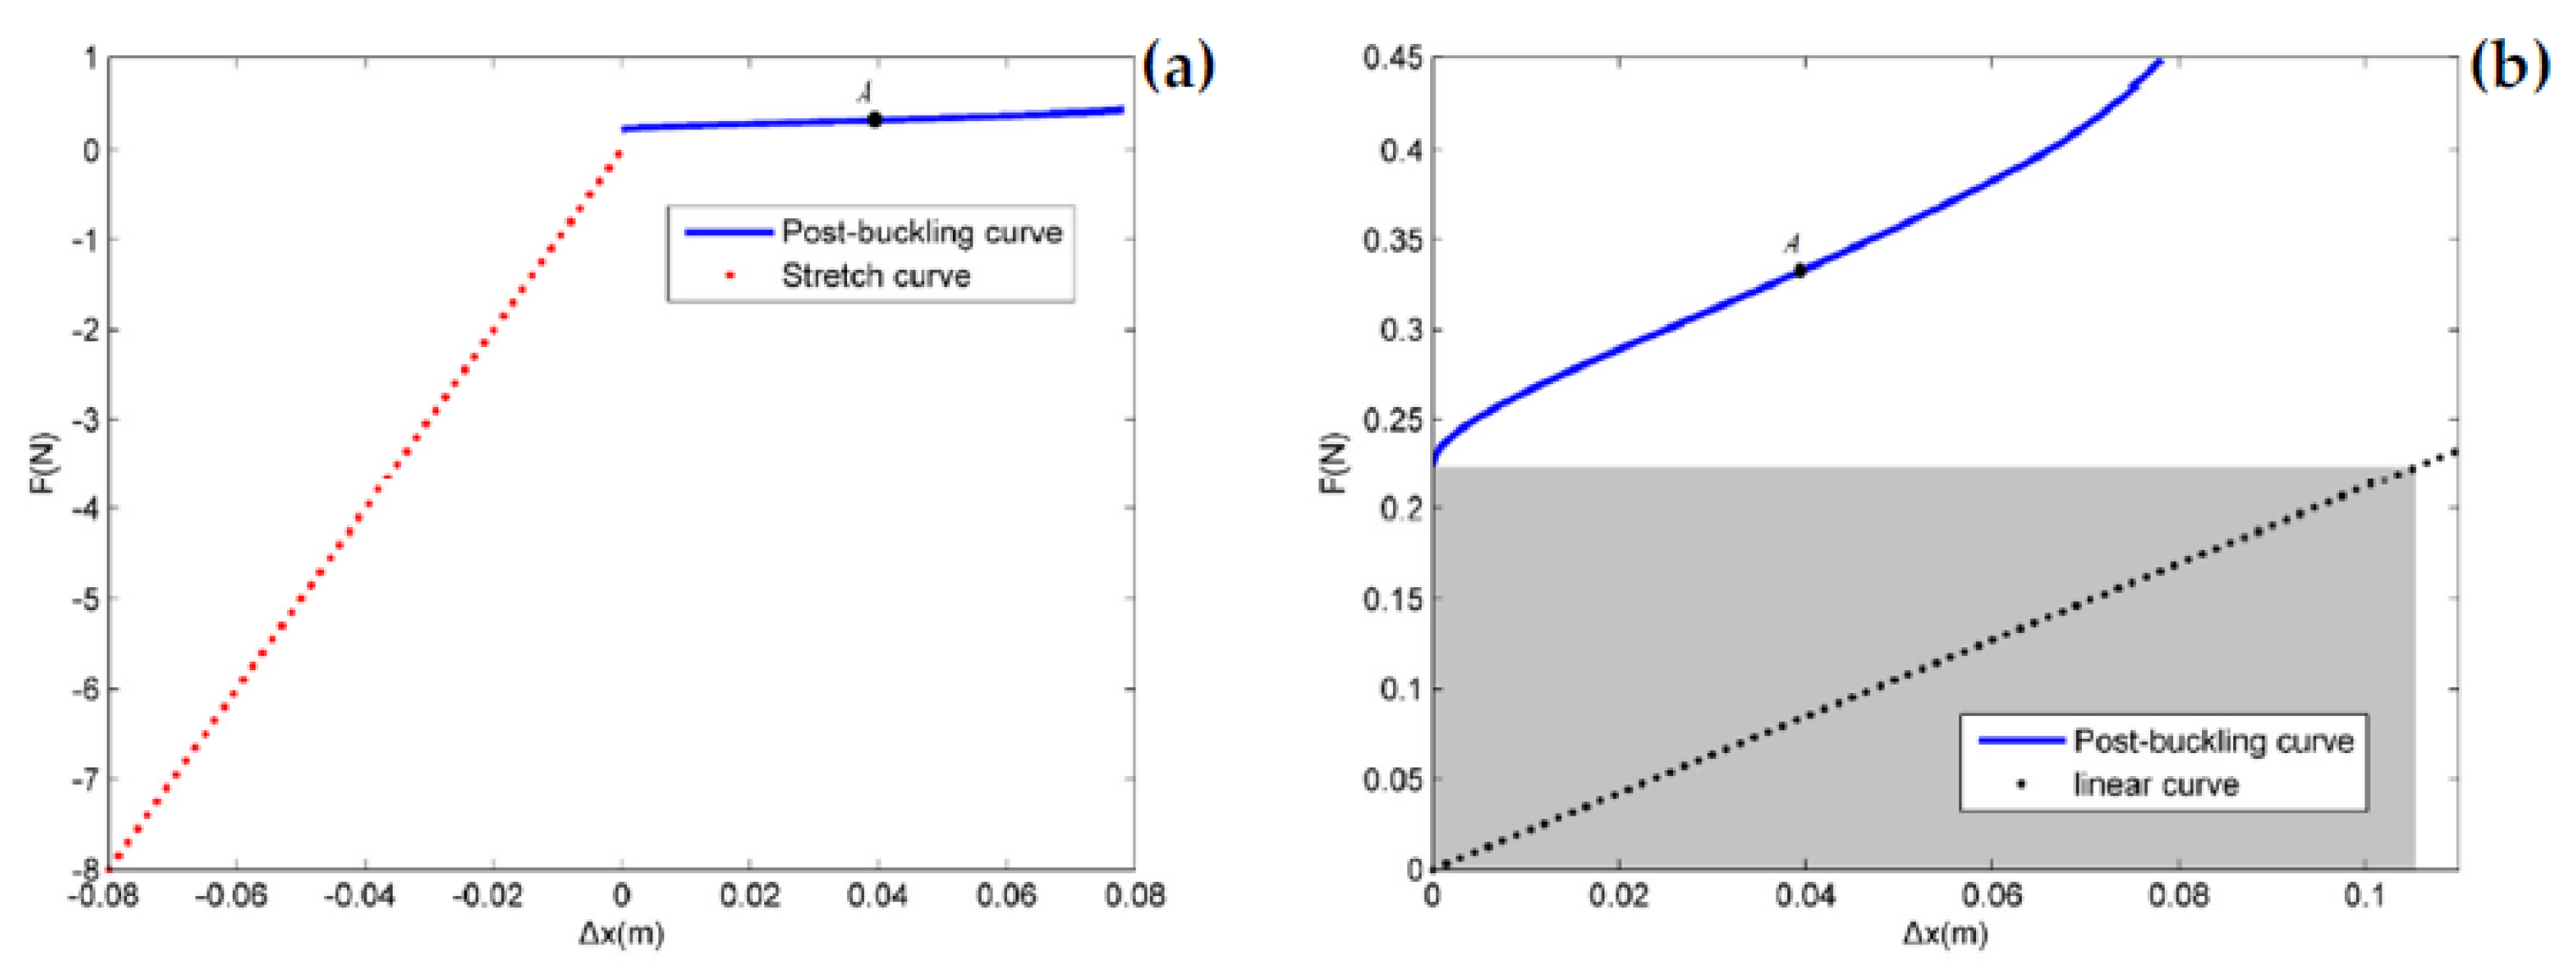
According to the stiffness of the stretching process formula k1 = EA/l0, the axial deformation length corresponding to different pressures is extracted, and the recovery curve of the SGC is obtained, in which the compression direction is positive. As shown in Figure 3a, the slope of the solid blue line is much smaller than that of the red dotted line, which demonstrates that there is much less post-buckling stiffness than stretch stiffness. The post-buckling spring recovery vs. ordinary spring curve is shown in Figure 3b. For the same static load, the post-buckling spring saves 0.1057 m more vibration stroke than the ordinary linear spring. While the post-buckling design realizes the low-stiffness design under the same material attributes, the post-buckling spring increases the load capacity compared with the ordinary spring and saves the vibration travel space.
2.2. The SGC Vibration Isolator Unit
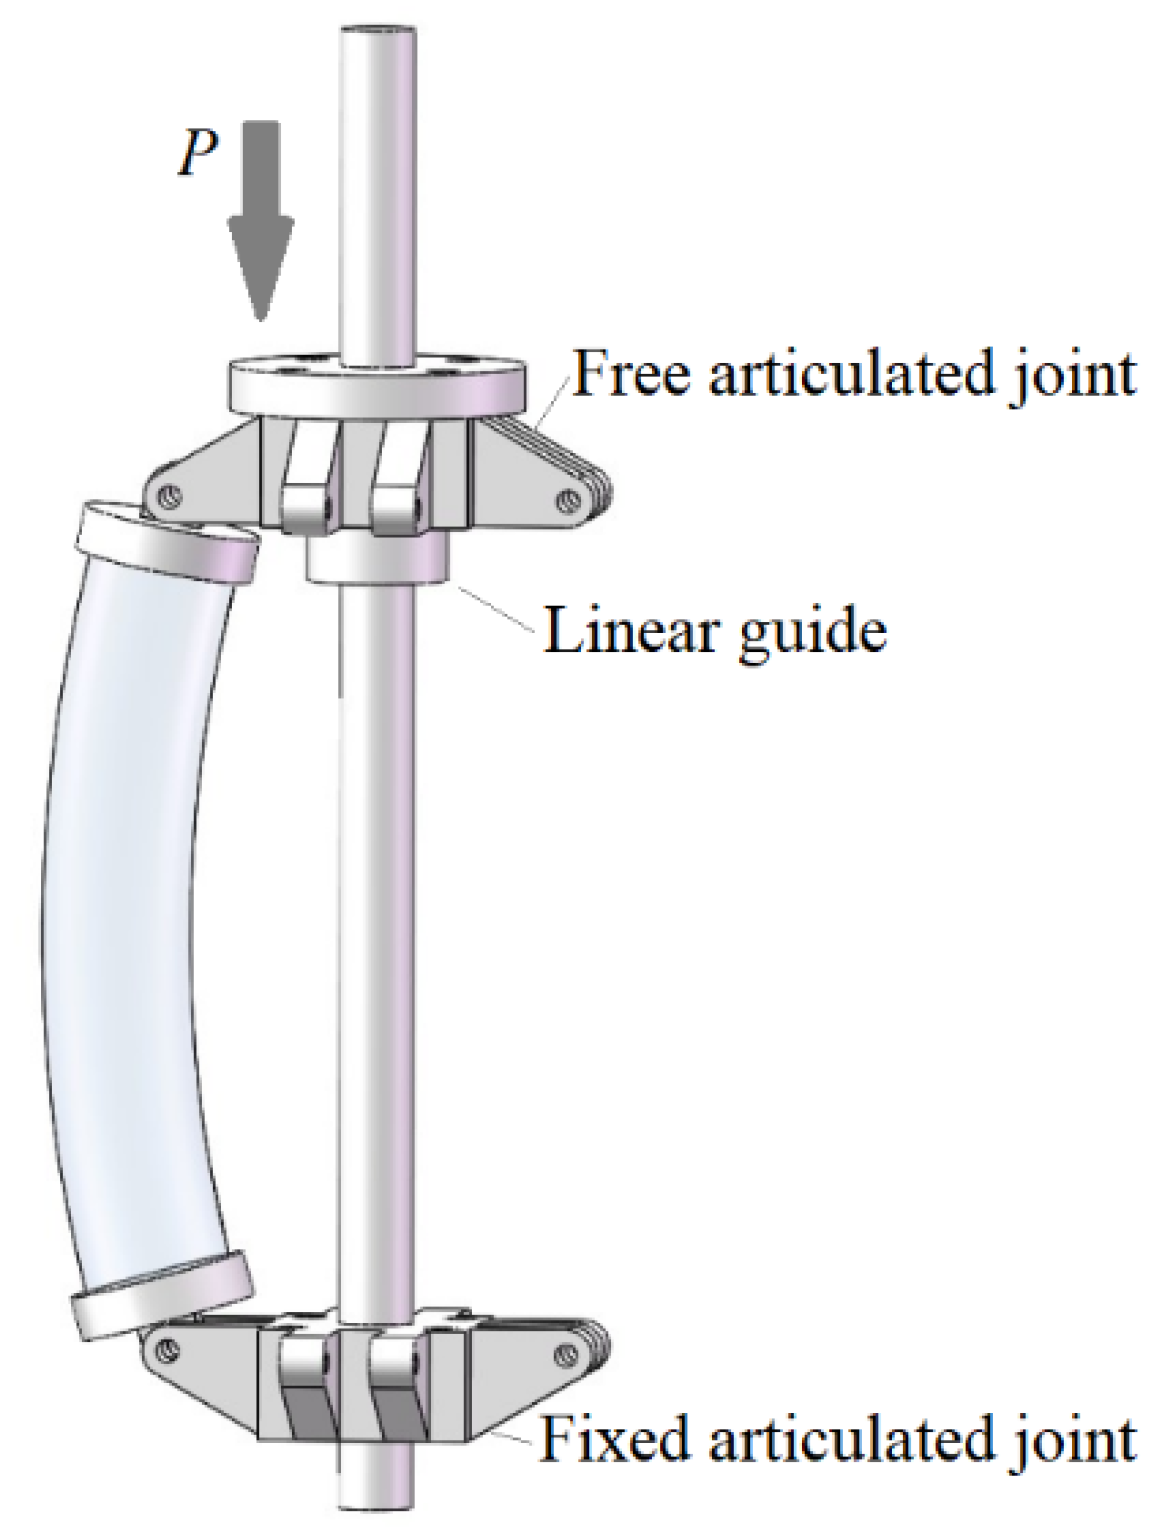
Figure 4 shows the model of the vibration isolation unit composed of the SGC. The SGC is connected by two articulated joints, which are aligned and centralized through a smooth guide through the center hole of the joints. One end of the SGC is secured to the guide rod through an articulated joint, while the articulated joint at the other end is free to slide up and down the guide rod through a linear guide.
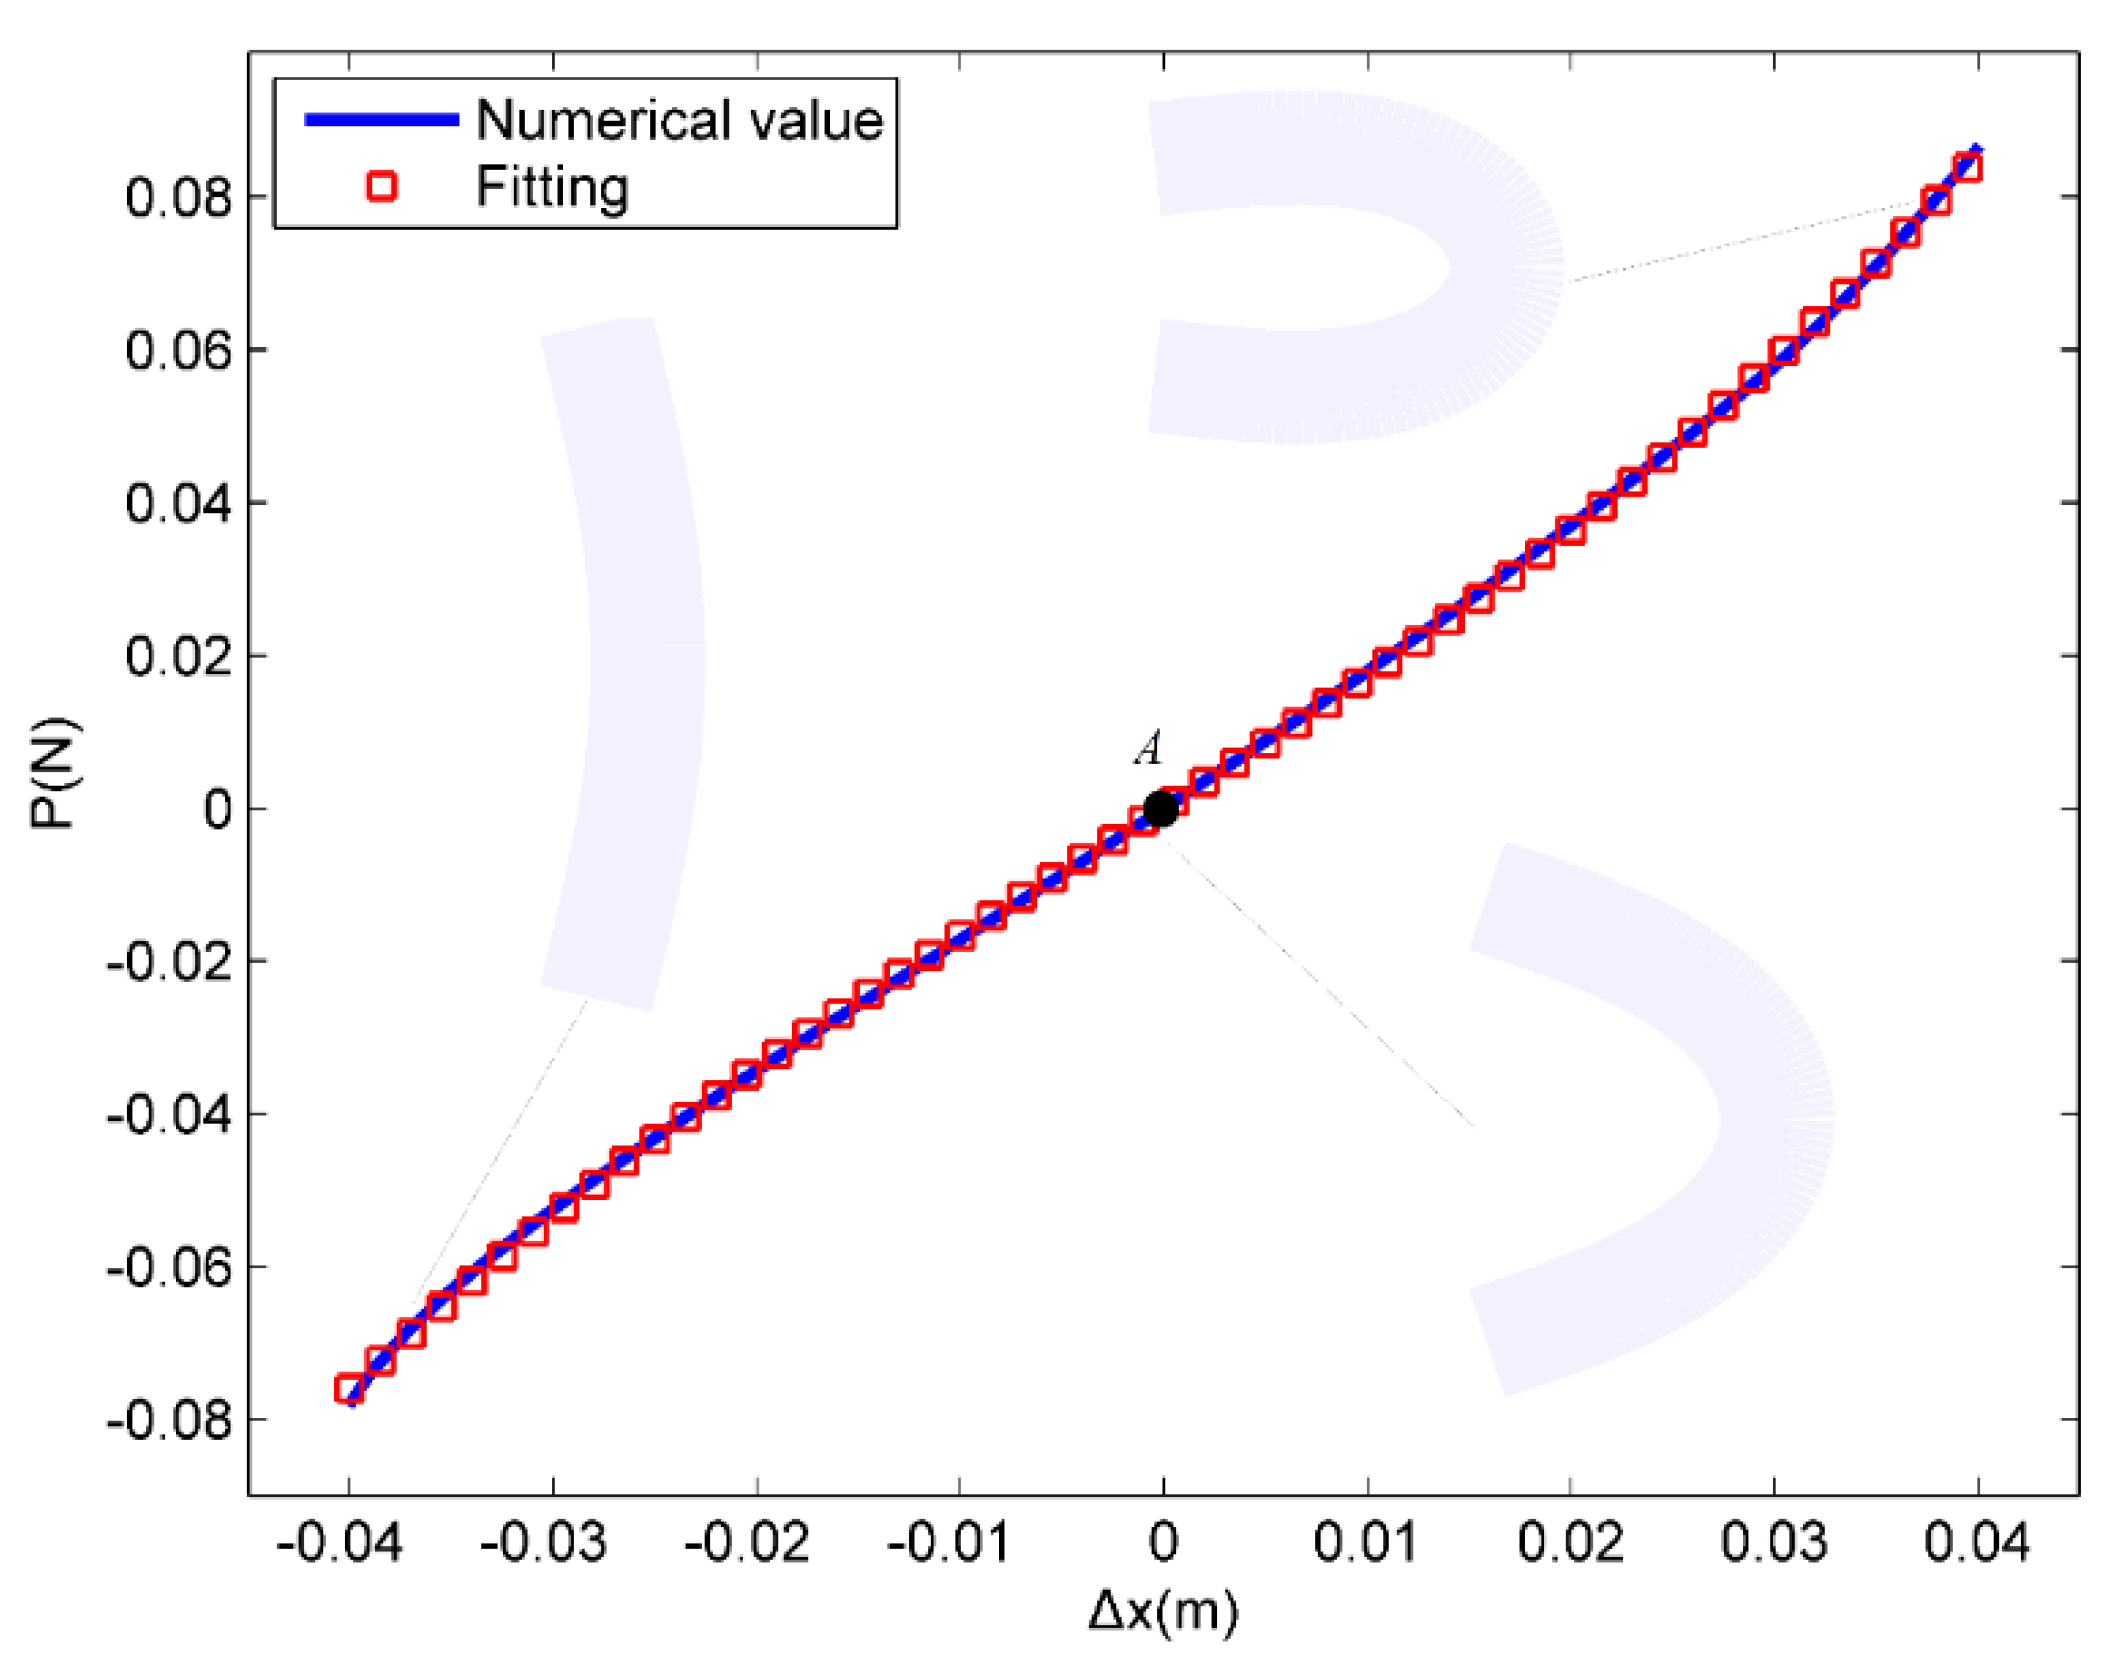
Considering the limited vibration stroke of the SGC for the post-buckling design, point A in Figure 3 is set as the initial position, while the upcoming applied load P0 = 0.33072 N is considered to be the initial equilibrium position. The recovery curve after numerical solution and fitting are shown in Figure 5. The post-buckling spring response force of a single SGC is expressed as
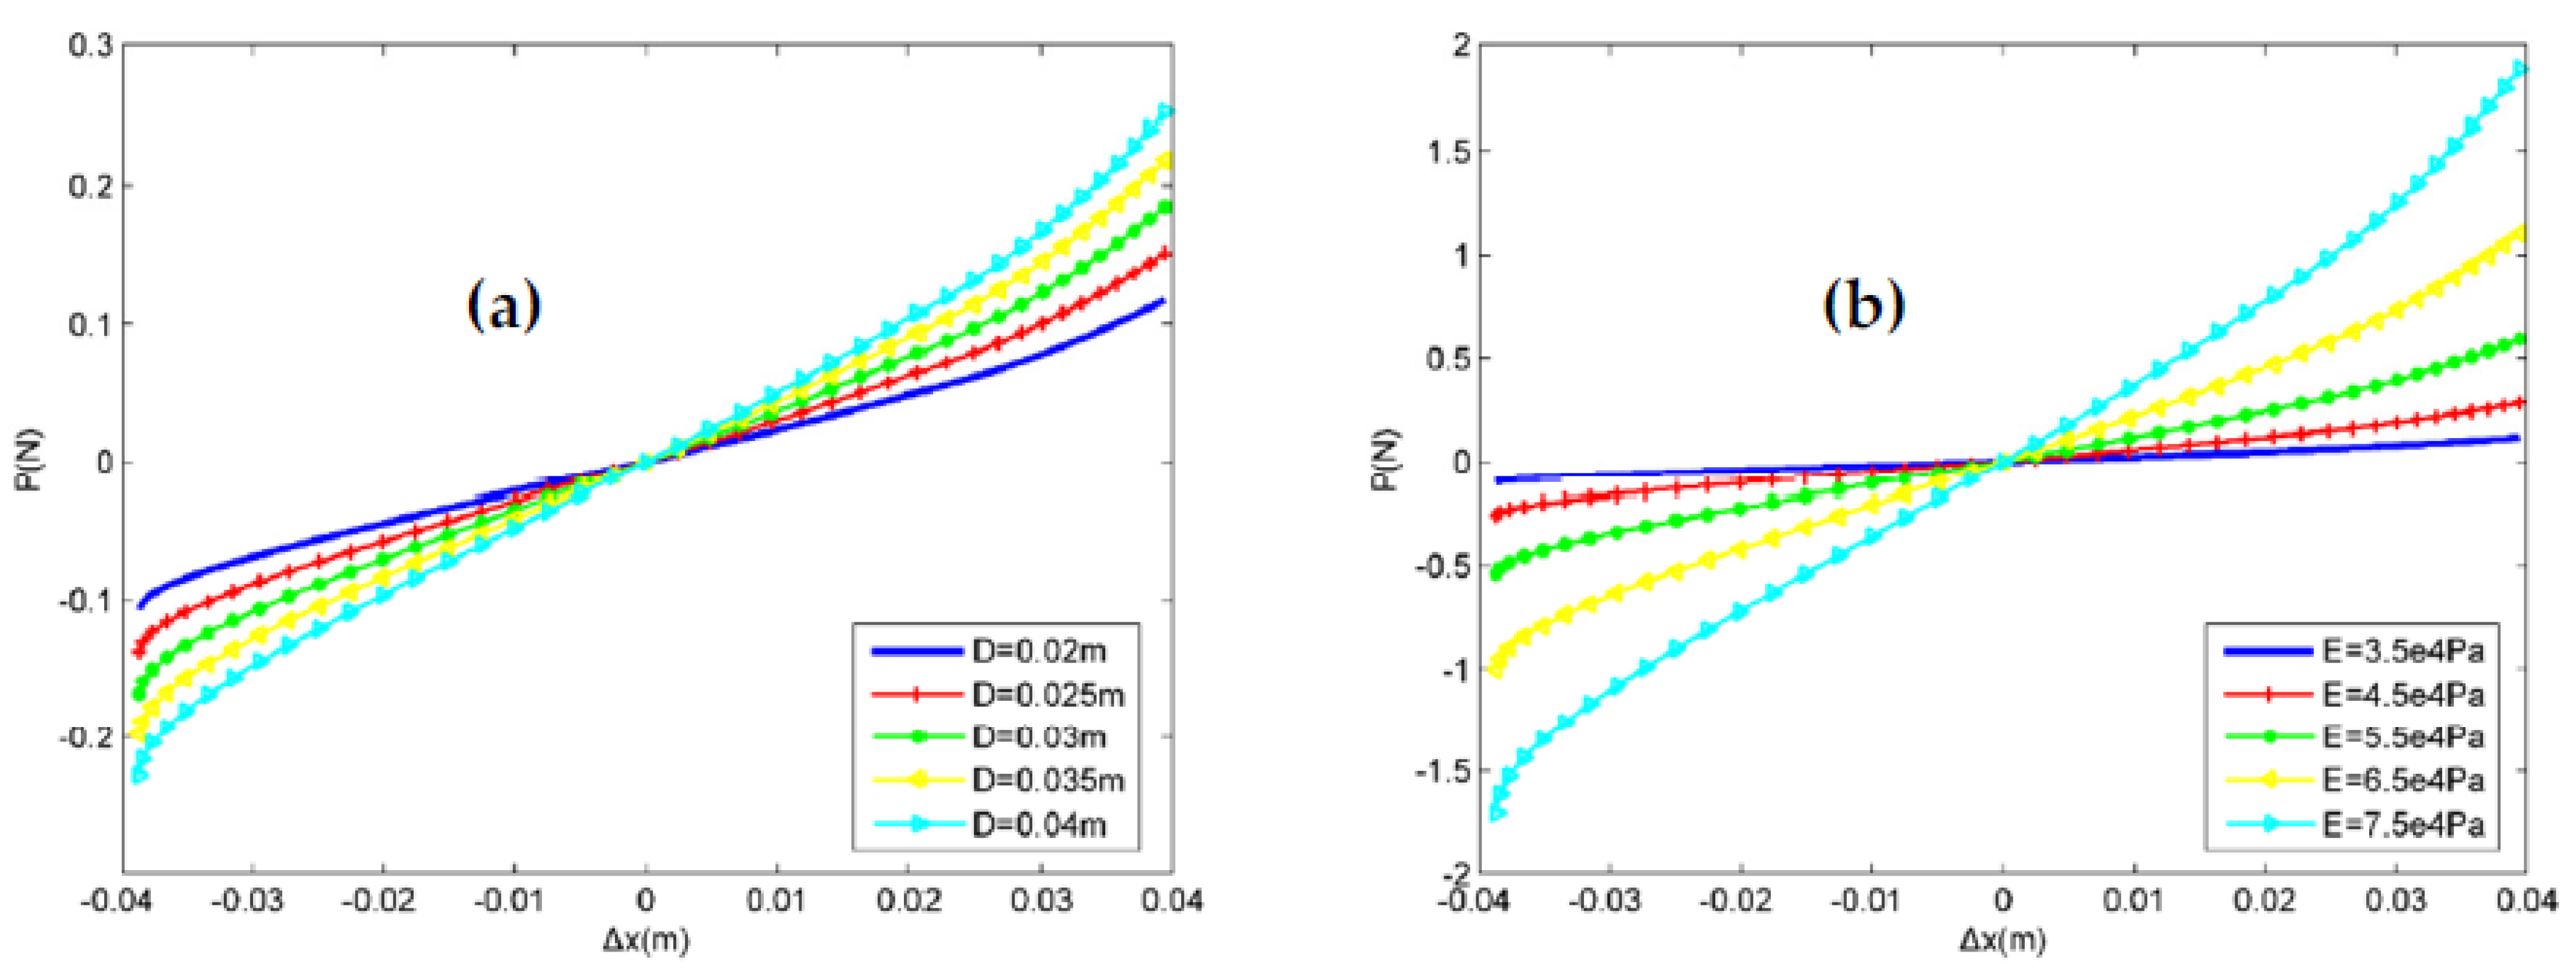
Since SGCs are formed by room temperature curing after mixing of two different raw liquid silicones, different ratios of raw liquid silicone will yield an SGC of different Young’s moduli. As shown in Figure 6, the post-buckling spring recovery curve under different Young’s moduli and section diameters is obtained by numerical analysis. The equivalent stiffness of the post-buckling spring increases as the Young’s modulus or cross-section diameter increases. This is due to the increased Young’s modulus or the cross-section diameter increasing the bending stiffness of the SGC. After polynomial fitting according to Equation (11), the corresponding stiffness coefficient and the initial bearing load capacity of the equilibrium position under different parameters are obtained, as shown in Table 1.
3. The SGC Post-Buckling Vibration Isolator
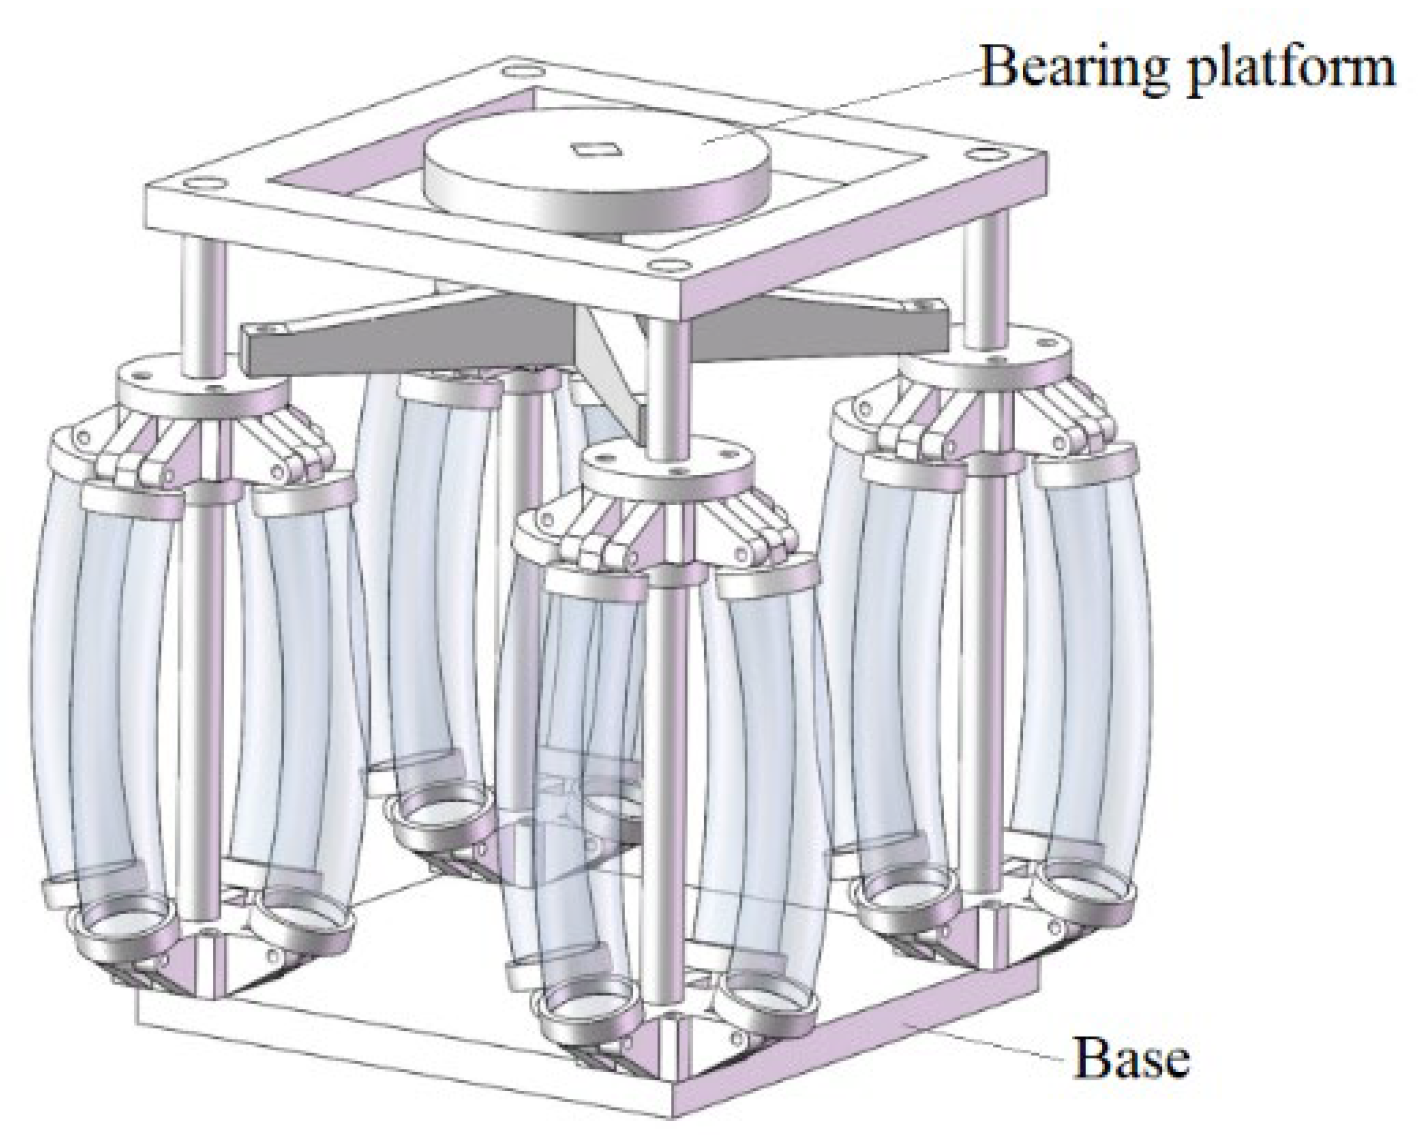
As shown in Figure 7, a post-buckling vibration isolator is constructed by 16 SGC units, a bearing platform, and a base. The fixed end of the SGC unit is connected to the base, and the free end at its top is connected to the bearing platform. Under the action of the four linear guides, the deformation of the proposed post-buckling vibration isolator is limited to a vertical direction.
3.1. Modeling
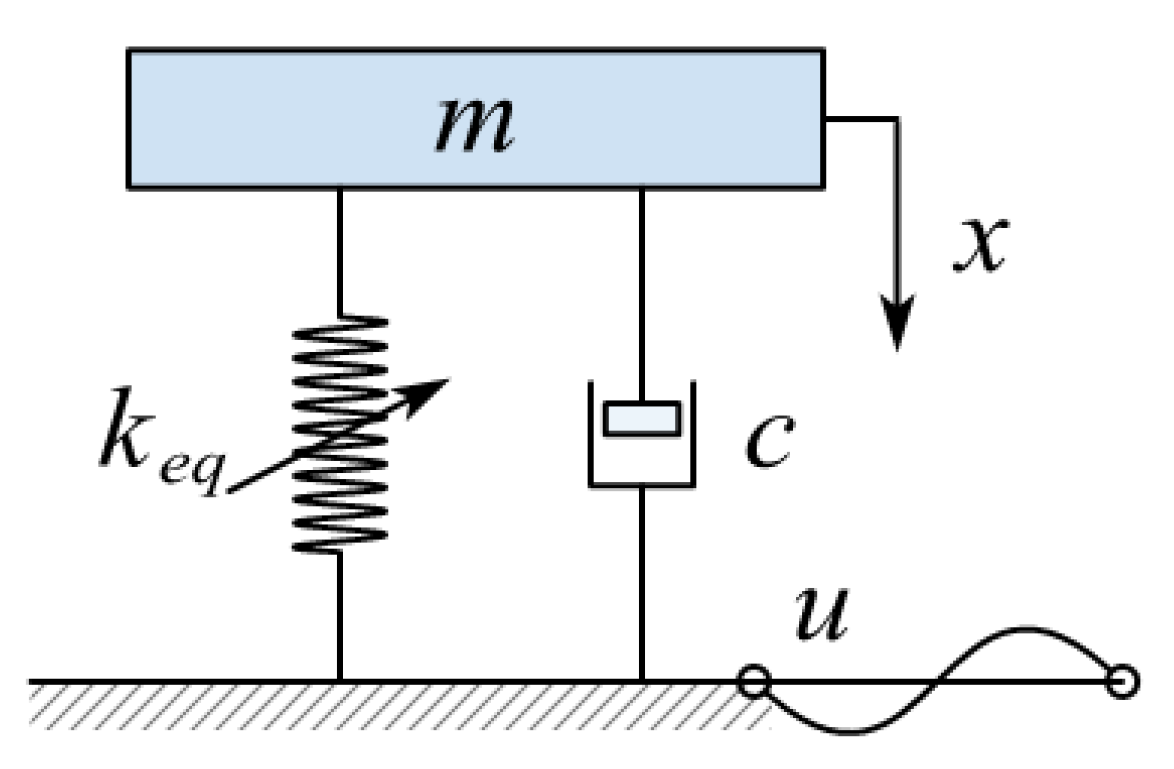
Since the vibration separator includes 16 post-buckling springs and its vibration displacement is limited to a small range, the damping coefficient of the system is constant, and the elastic recovery is 16P according to Equation (11). The vibration isolation system model shown in Figure 8 mainly blocks the vibration propagation from the foundation to the system.
The kinetic differential equation of the SGC vibration isolation system can be written as
by using z = x − u, the dynamic equation is expressed as
where m is mass, c is damping coefficient, k1, k2, k3 are stiffness coefficients, x is vibration displacement, f is force excitation, and u is foundation displacement excitation.
According to the harmonic balance method (HBM), when the base is motivated by a sinusoidal function, such as
the solution of the Equation (13) can be expressed in the following form:
where Λ is the base acceleration excitation amplitude, ω is the circle frequency, t is the time, γ is the phase, b0 is the nonlinear response constant, and b1 is the response harmonic.
Substituting Equations (14) and (15) into Equation (13), the amplitude frequency response characteristics of vibration isolation system is obtained as
where the phase satisfies the following formula
and the damping coefficient is approximately taken as ; ζ is the viscous damping ratio.
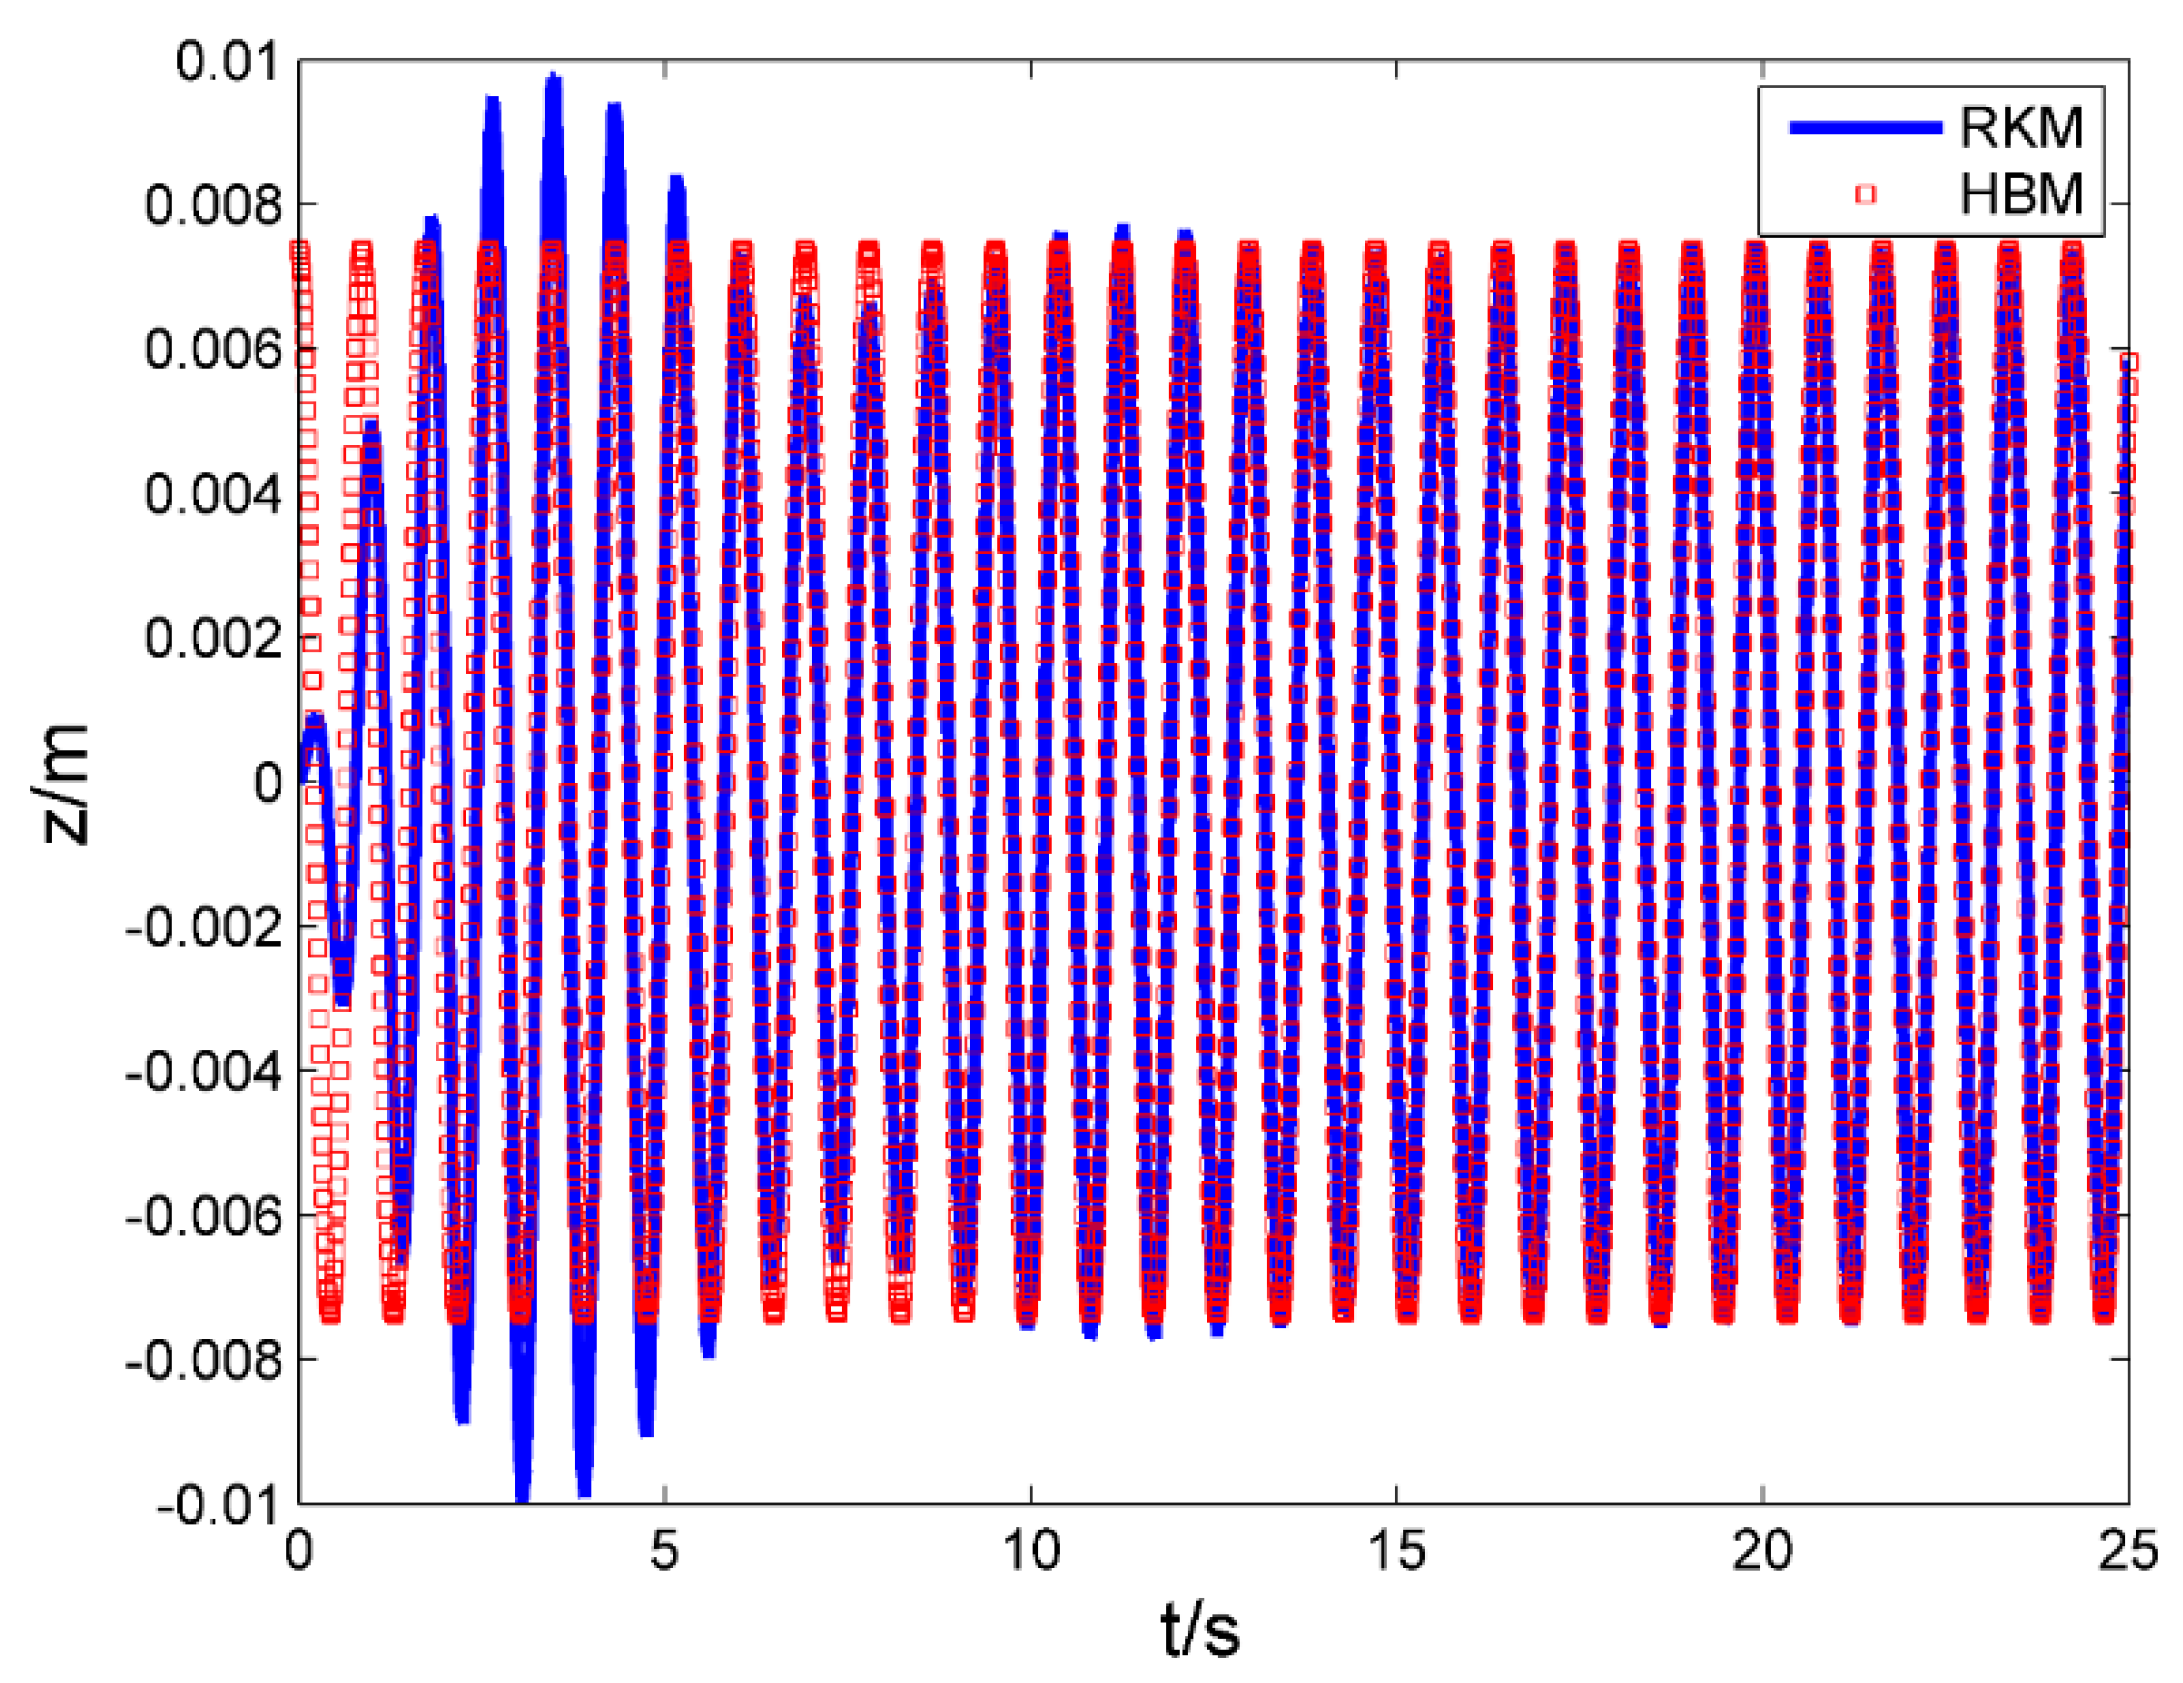
The numerical solution of the Runge–Kutta method (RKM) [30] is used to verify the accuracy of the HBM, and the parameter of vibration isolation system is selected as: m = 0.529 kg; ζ = 0.3; k1 = 33.9376; k2 = 76.0736; k3 = 6723.2; Λ = 0.05 m/s2; ω = 7.262 Hz. The analytical and numerical results of the vibration isolation system are shown in Figure 9, and the approximate analytical solution obtained by the HBM agrees well with the numerical solution obtained by the RKM.
3.2. Transmissibility of Vibration Isolation System
The displacement transfer rate is selected as the parameter for measuring the vibration isolation performance, which is defined as the ratio of the absolute displacement response amplitude of the bearing platform to the base displacement amplitude. The bearing platform absolute displacement expression is
and the transmissibility can be expressed as
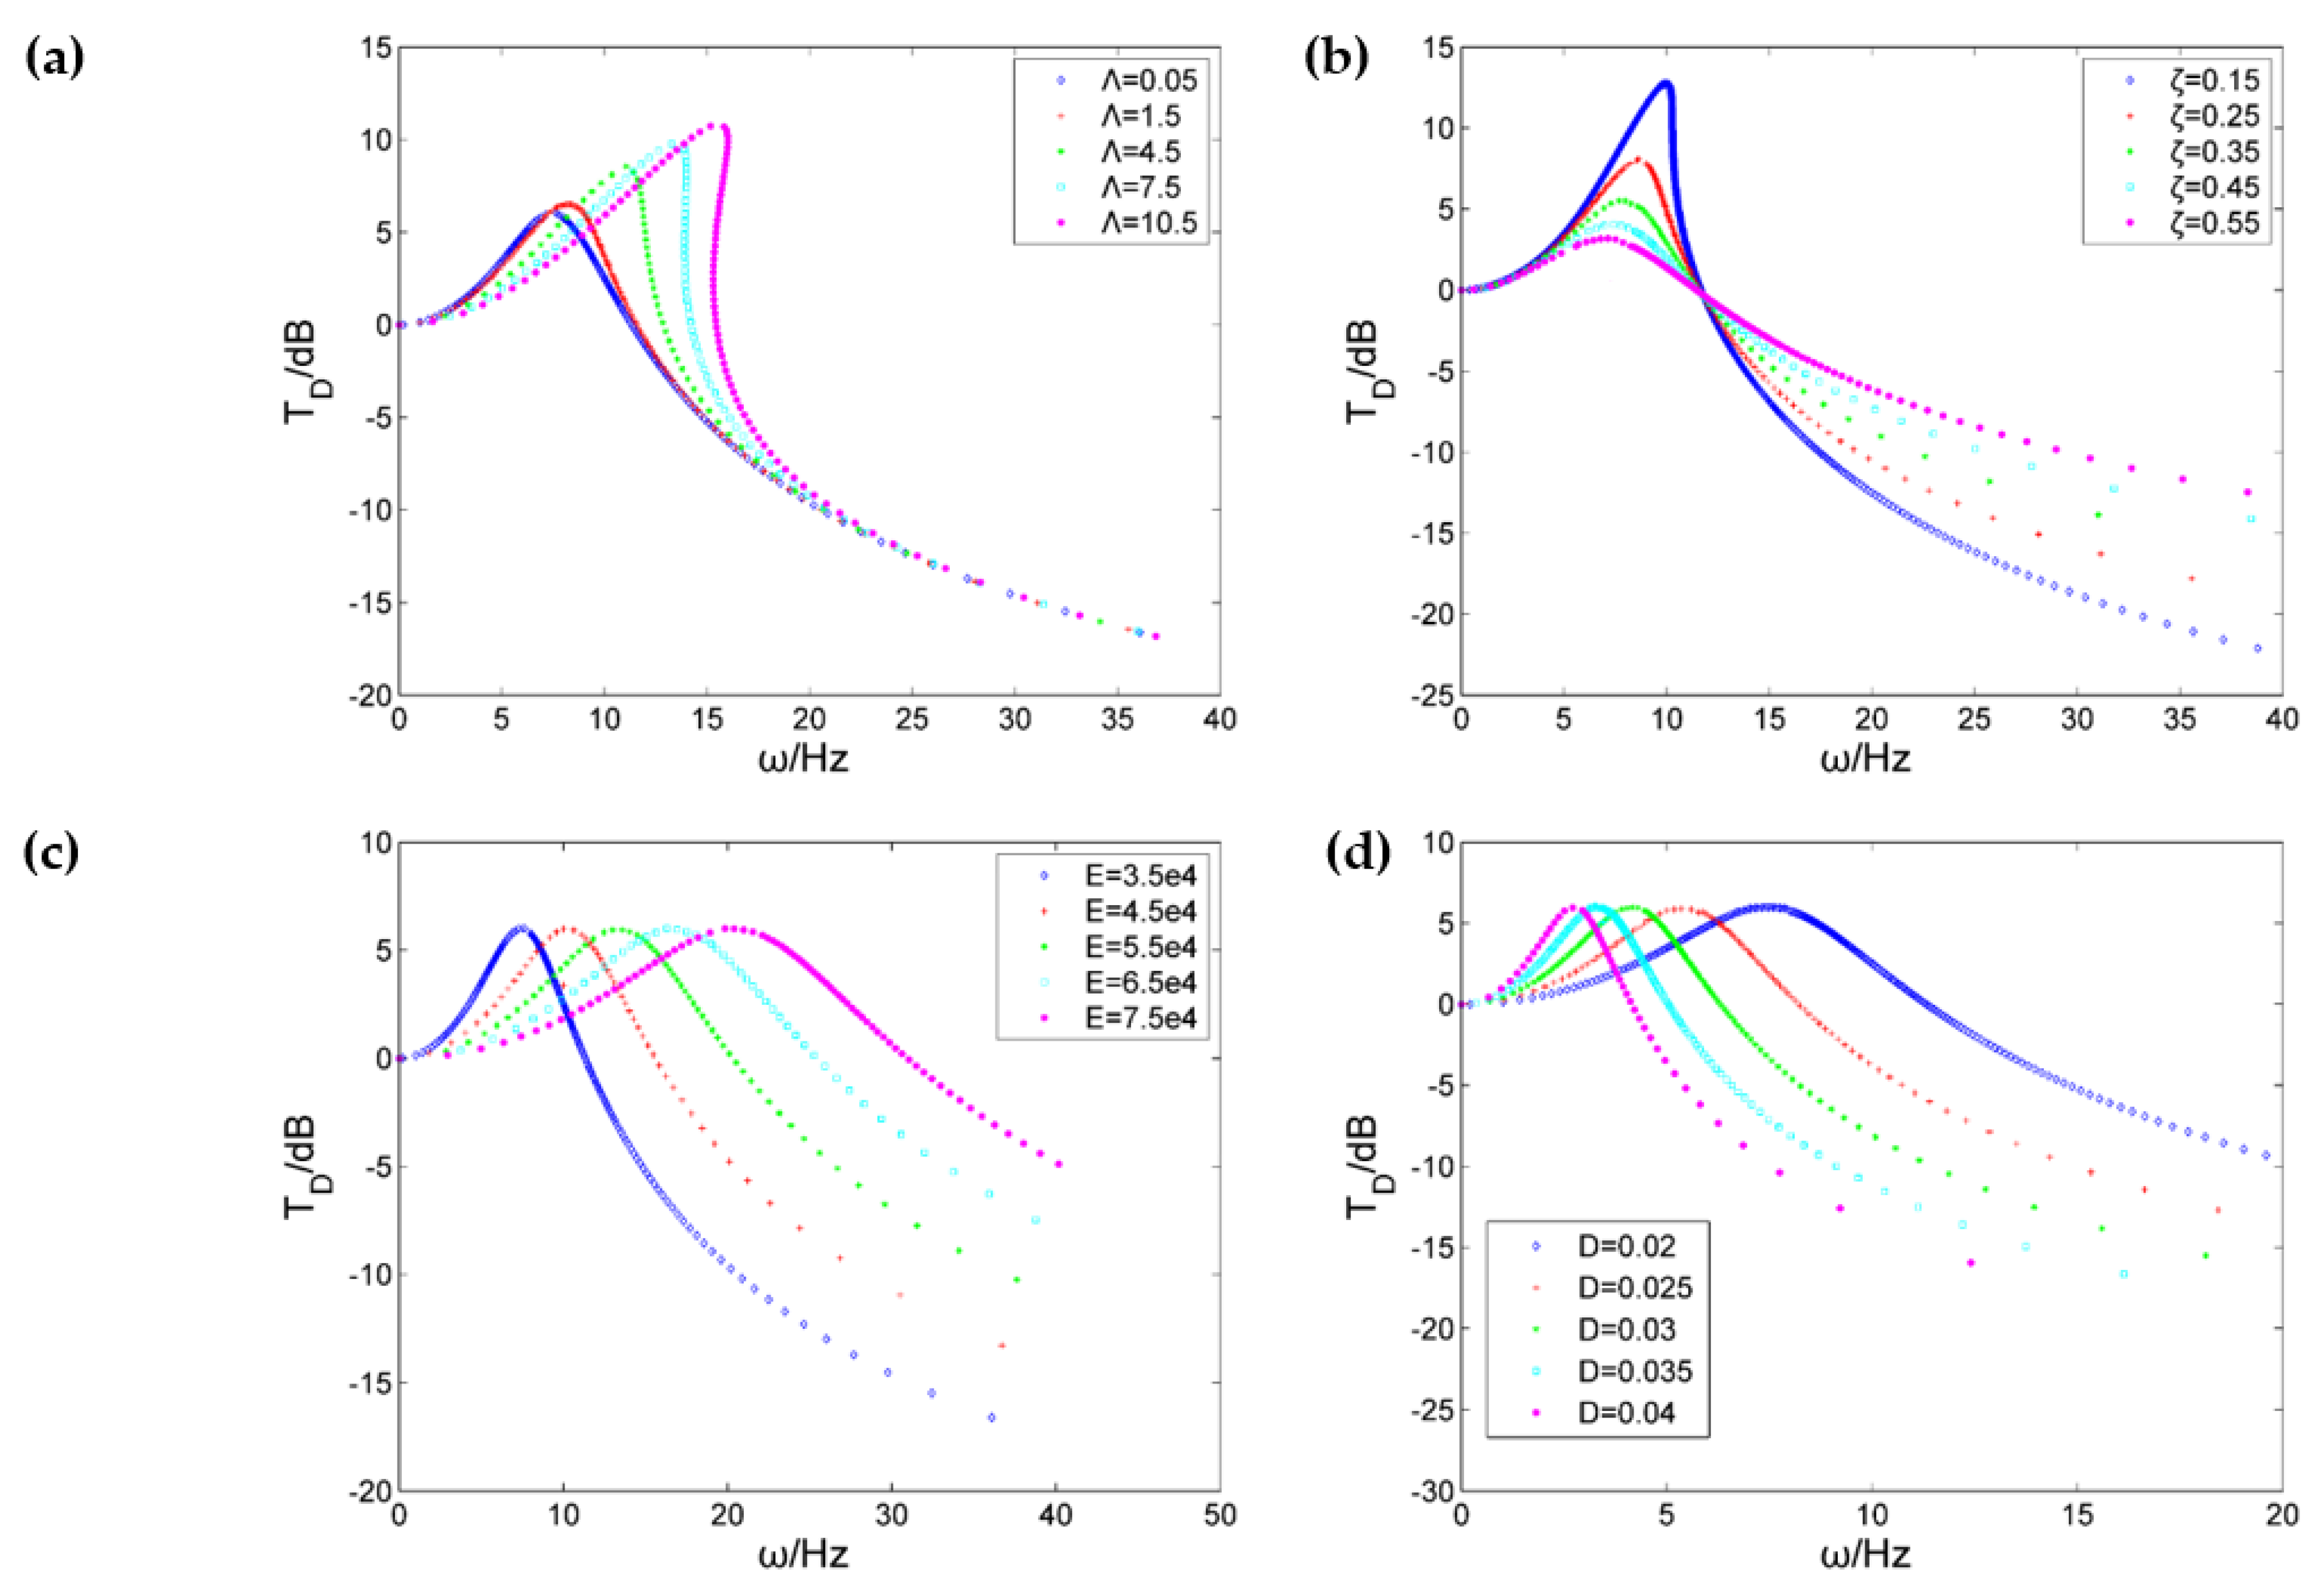
Figure 10 shows the influence of different parameters on displacement transmissibility, and relevant computational parameters are listed in brackets under the icon. The proposed structure shows the gradually hardened stiffness from the entire compression vibration process.
The increased external excitation strengthens the tendency to shift the curve to the right, giving the system more obvious nonlinear features, as shown in Figure 10a. The change law of transmissibility with viscous damping ratio is shown in Figure 10b. As the damping coefficient decreases, the vibration transfer rate curve is gradually tilted to the right and the instability of the system is gradually enhanced. There is a significant “ridge line” inclined to the larger frequency direction through the peak point of the curve family, which is determined by the excitation amplitude and the nonlinear stiffness coefficient. The damping coefficient has no effect on the curve skeleton.
As Young’s modulus and the section diameter increase, both SGC stiffness and the static load increase, as shown in Table 1. In the case of Young’s modulus variation, the growth rate of linear stiffness is significantly higher than that of the static load, while in the case of the section diameter change, the static load grows faster than the linear stiffness. In Figure 10c,d, it is found that neither the diameter nor the Young’s modulus affects the peak of the transmission rate. As the diameter increases or the Young’s modulus decreases, the peak of the vibration isolation transmission rate curve moves to the left, which means the initial frequency of playing the vibration isolation effect decreases.
4. Experimental Test
4.1. Experimental Setup
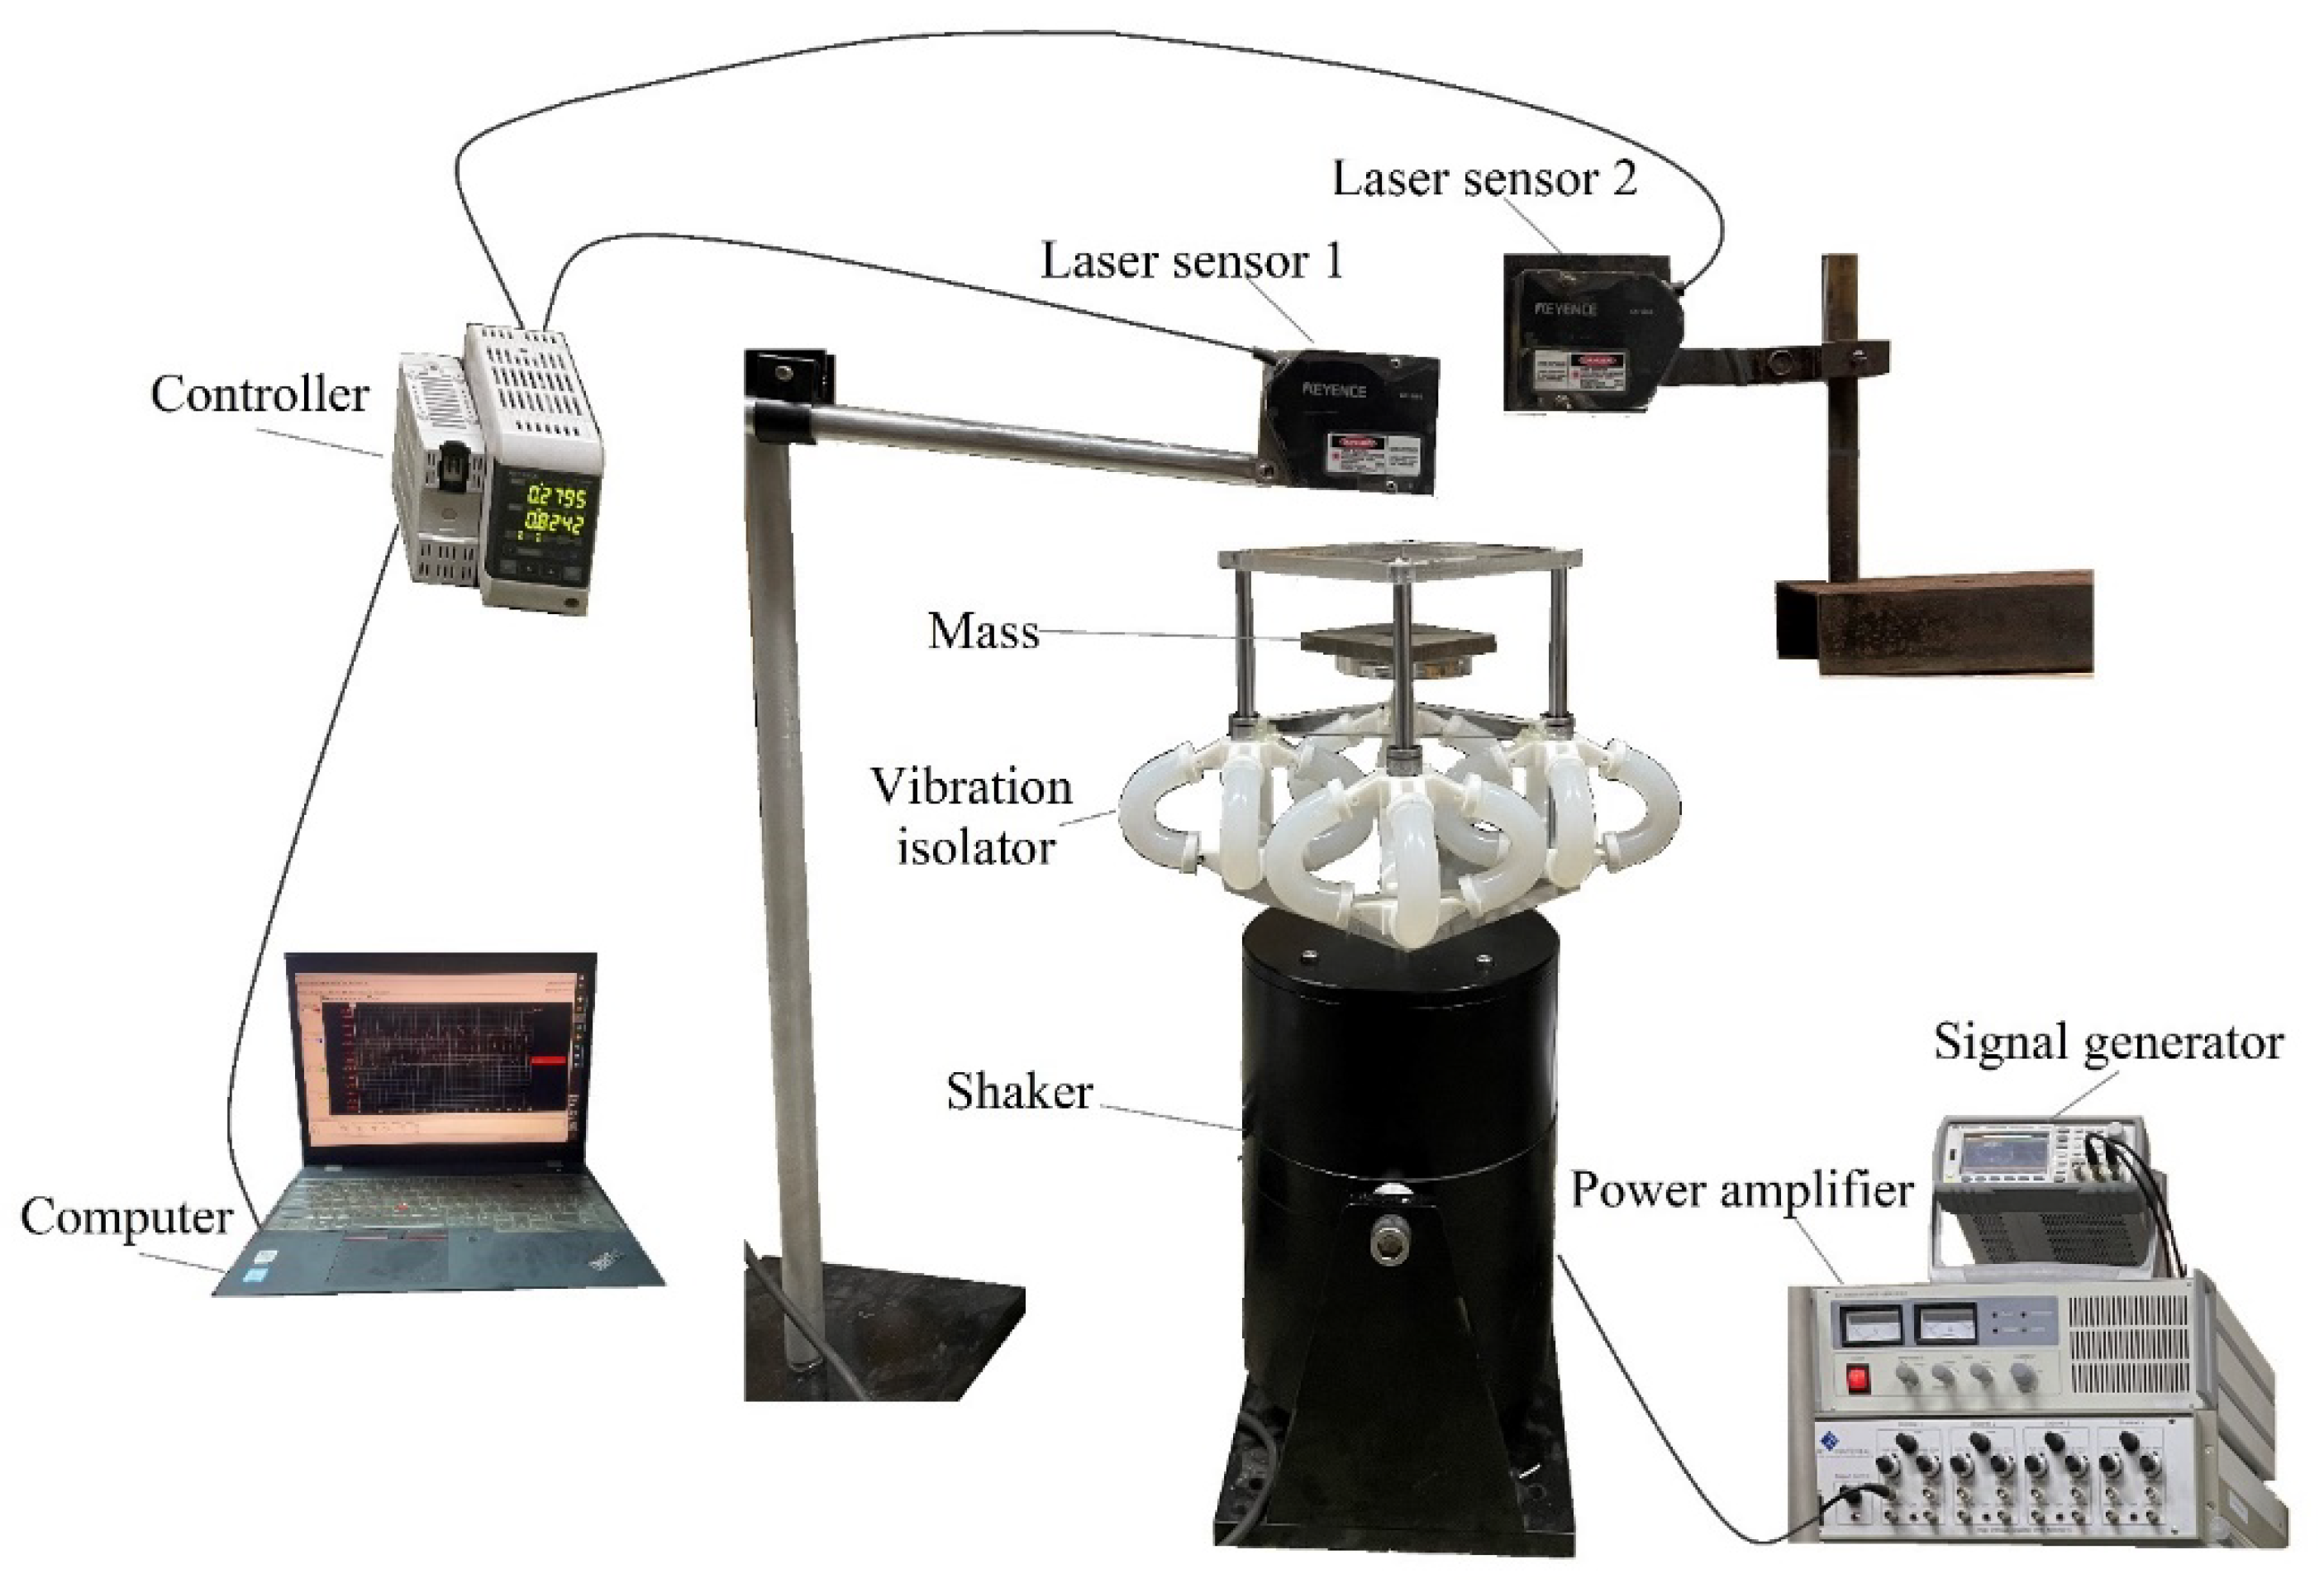
As shown in Figure 11, an experimental prototype was established to test the isolation performance of the SGC vibration isolator. This prototype includes seven main subsystems: a signal generator, a power amplifier, a shaker, the SGC isolator, laser sensors, a controller, and a computer. The shaker generates the forced vibration of the SGC system, which is applied to imitate a real vibration situation. The laser sensor measures the displacement of the base and bearing platform, which is used to evaluate the vibration isolation effect in terms of displacement transmissibility. The length, Young’s modulus, and section diameter of the SGC prototype in this experiment are 0.11 m, 3.5 × 10⁴ Pa, and 0.035 m, respectively.
As shown in Figure 11, the SGC isolator is mounted on a vibration shaker, and the mass is placed on the bearing platform. A sine signal outputted by the signal generator is amplified to the vibration shaker by a power amplifier. A sine exciting force is applied to the base by a vibration shaker, which causes the base to vibrate. The vibration displacements of the base and bearing platform are measured by two laser sensors. The data collection’s signal of the laser sensor is sampled 500 times each second, and the data collected by the laser sensor is transmitted to the computer for analysis.
4.2. Experimental Results and Discussions
The vibration isolation performance of the vibration isolator is closely related to its resonance frequency and response peak. The lower the resonant frequency, the lower the initiation frequency of vibration isolation and of the wider vibration isolation frequency band. In this experimental test, to comprehensively analyze the displacement transmissibility of the isolator with load mass m = 4.9 kg, a sweep sine excitation was applied to the base and the frequency of the exciting signal was set from 1 Hz to 20 Hz. The parameters adopted by the theoretical calculations are listed in parentheses under the icon of Figure 12, where the reason for the large damping ratio is that the damping here is the structural damping of the vibration isolator, including friction damping of hinge joints and straight bearing, as well as damping of the silicone gel material itself.
(Λ = 0.001 m/s2; ζ = 0.5; D = 0.035 m; E = 3.5 × 10⁴ Pa)
Figure 12 shows a comparison of experimental and theoretical results of displacement transmissibility, and the vibration of the base and bearing platform are at the excitation frequencies of 3 Hz, 9 Hz, and 15 Hz after the system reaches a steady state. It is found that the experimental test results and the theoretical calculations essentially agree, and it should be noted that the experimental results in the low-frequency resonance region are slightly smaller than the theoretical results and slightly larger than the theoretical results in the high-frequency zone. This is caused by the insufficient accuracy of the installation of the physical model to produce additional damping. The effective vibration isolation frequency of the SGC vibration isolation system is about 4 Hz. As the frequency increases, the inhibitory effect of the vibration isolation system on the vibrational transmission gradually increases. When the excitation frequency increases to 15 Hz, the amplitude of the steady-state displacement has the ability to decrease to 18 dB.
5. Conclusions
Numerical analysis reveals that the post-buckling design can realize a low-stiffness design, increase the load capacity compared with the ordinary spring, and save vibration travel space. Based on the analysis, a novel post-buckling vibration isolator using an SGC is proposed, and a corresponding vibration isolation experiment system is constructed. The displacement transfer rate of the system is derived by using the harmonic balance method, while the dynamic response of the SGC vibration isolator is experimentally studied. The validity of the model is verified by comparing the experimental data and numerical solutions under harmonic excitations. The results of experimental test show that the proposed design has low-resonance frequencies and can achieve effective suppression of vibration at low starting frequencies. This novel design of a post-buckling SGC provides a viable method in low-frequency vibration isolation.
Author Contributions
Conceptualization, J.-H.Y. and X.-D.Y.; methodology, J.-H.Y.; software, J.-H.Y.; validation, Q.-K.H. and J.-G.L.; formal analysis, J.-H.Y.; investigation, X.-D.Y.; resources, Q.-K.H.; data curation, J.-H.Y.; writing—original draft preparation, J.-H.Y. writing—review and editing, J.-H.Y.; visualization, X.-D.Y.; supervision, Q.-K.H.; project administration, J.-G.L.; funding acquisition, X.-D.Y. All authors have read and agreed to the published version of the manuscript.
Funding
This research was funded by National Natural Science Foundation of China (Grants Nos. 11672007 and 11972050).
Institutional Review Board Statement
Not applicable.
Informed Consent Statement
Not applicable.
Data Availability Statement
Not applicable.
Conflicts of Interest
The authors declare no conflict of interest.
References
- Li, L.; Tan, L.Y.; Kong, L.; Wang, D.; Yang, H.B. The influence of flywheel micro vibration on space camera and vibration suppression. Mech. Syst. Signal Process. 2018, 100, 360–370. [Google Scholar] [CrossRef]
- Mao, X.Y.; Ding, H.; Chen, L.Q. Vibration of Flexible Structures under Nonlinear Boundary Conditions. J. Appl. Mech. Trans. ASME 2017, 84, 111006. [Google Scholar] [CrossRef]
- Chen, H.Y.; Ding, H.; Li, S.H.; Chen, L.Q. The Scheme to Determine the Convergence Term of the Galerkin Method for Dynamic Analysis of Sandwich Plates on Nonlinear Foundations. Acta Mech. Solida Sin. 2021, 34, 1–11. [Google Scholar] [CrossRef]
- Carrella, A.; Brennan, M.J.; Waters, T.P. Static analysis of a passive vibration isolator with quasi-zero-stiffness characteristic. J. Sound Vib. 2007, 301, 678–689. [Google Scholar] [CrossRef]
- Ibrahim, R.A. Recent advances in nonlinear passive vibration isolators. J. Sound Vib. 2008, 314, 371–452. [Google Scholar] [CrossRef]
- Kovacic, I.; Brennan, M.J.; Waters, T.P. A study of a nonlinear vibration isolator with a quasi-zero stiffness characteristic. J. Sound Vib. 2008, 315, 700–711. [Google Scholar] [CrossRef]
- Harris, C.M.; Piersol, A.G. Harris’ Shock and Vibration Handbook; McGraw-Hill: New York, NY, USA, 2010. [Google Scholar]
- Ho, C.; Lang, Z.Q.; Billings, S.A. A frequency domain analysis of the effects of nonlinear damping on the Duffing equation. Mech. Syst. Signal Process. 2014, 45, 49–67. [Google Scholar] [CrossRef]
- Lin, J.L.; Liu, T.H.; Tsai, K.C. Real-valued modal response history analysis for asymmetric-plan buildings with nonlinear viscous dampers. Soil Dyn. Earthq. Eng. 2015, 77, 97–110. [Google Scholar] [CrossRef]
- Wang, J.; Wierschem, N.; Spencer, B.F.; Lu, X. Experimental study of track nonlinear energy sinks for dynamic response reduction. Eng. Struct. 2015, 94, 9–15. [Google Scholar] [CrossRef]
- Wang, J.; Wierschem, N.E.; Spencer, B.F.; Lu, X. Track Nonlinear Energy Sink for Rapid Response Reduction in Building Structures. J. Eng. Mech. 2015, 141, 04014104. [Google Scholar] [CrossRef]
- Yang, K.; Zhang, Y.W.; Ding, H.; Yang, T.Z.; Chen, L.Q. Nonlinear Energy Sink for Whole-Spacecraft Vibration Reduction. J. Vib. Acoust. 2017, 139, 021011. [Google Scholar] [CrossRef]
- Mojahed, A.; Moore, K.; Bergman, L.A.; Vakakis, A.F. Strong geometric softening-hardening nonlinearities in an oscillator composed of linear stiffness and damping elements. Int. J. Non-Linear Mech. 2018, 107, 94–111. [Google Scholar] [CrossRef]
- Wu, W.J.; Chen, X.D.; Shan, Y.H. Analysis and experiment of a vibration isolator using a novel magnetic spring with negative stiffness. J. Sound Vib. 2014, 333, 2958–2970. [Google Scholar] [CrossRef]
- Zhu, H.; Yang, J.; Zhang, Y.; Feng, X.; Ma, Z. Nonlinear dynamic model of air spring with a damper for vehicle ride comfort. Nonlinear Dyn. 2017, 89, 1545–1568. [Google Scholar] [CrossRef]
- Matsumoto, K.; Zako, M.; Shimizu, N.; Kanda, T.; Sakurai, H. Statically Indeterminate Stress Analysis of Sport Shoes. Trans. Jpn. Soc. Mech. Eng. A 1999, 65, 2045–2051. [Google Scholar] [CrossRef] [Green Version]
- Sekine, S.; Shimizu, N.; Yamazaki, H.; Zako, M.; Matsumoto, K. Development of Silicone Gel Insulator Composed of Coil Spring and Silicone Gel. Trans. Jpn. Soc. Mech. Eng. 1994, 60, 162–168. [Google Scholar] [CrossRef] [Green Version]
- Shimizu, N.; Yamazaki, H. Development of Vibration Insulator Using a New Material, Silicone Gel. Trans. Jpn. Soc. Mech. Eng. C 1993, 59, 3717–3724. [Google Scholar] [CrossRef] [Green Version]
- Sutisno, S.; Adi, A.P. Vibration Disturbance Damping System Design to Protect Payload of the Rocket. Mechatron. Electr. Power Veh. Technol. 2012, 3, 111–116. [Google Scholar] [CrossRef] [Green Version]
- Fulcher, B.A.; Shahan, D.W.; Haberman, M.R.; Seepersad, C.C.; Wilson, P.S. Analytical and Experimental Investigation of Buckled Beams as Negative Stiffness Elements for Passive Vibration and Shock Isolation Systems. J. Vib. Acoust. 2015, 136, 031009. [Google Scholar] [CrossRef]
- Plaut, R.H.; Alloway, L.A.; Virgin, L.N. Nonlinear oscillations of a buckled mechanism used as a vibration isolator. In Iutam Symposium on Chaotic Dynamics and Control Of Systems and Processes in Mechanics; Rega, G., Vestroni, F., Eds.; Springer: Dordrecht, The Netherlands, 2005; Volume 122, pp. 241–250. [Google Scholar]
- Winterflood, J.; Blair, D.G.; Slagmolen, B. High performance vibration isolation using springs in Euler column buckling mode. Phys. Lett. A 2016, 300, 122–130. [Google Scholar] [CrossRef]
- Yang, J.H.; Yang, X.D.; Qian, Y.J.; Zhang, W. A Novel Type of Bi-Gyroscopic System Undergoing both Rotating and Spinning Motions. J. Vib. Acoust. 2021, 143, 034502. [Google Scholar] [CrossRef]
- Li, W.; Yang, X.D.; Zhang, W.; Ren, Y. Parametric amplification performance analysis of a vibrating beam micro-gyroscope with size-dependent and fringing field effects. Appl. Math. Model. 2021, 91, 111–124. [Google Scholar] [CrossRef]
- Sun, Y.; Zhou, J.S.; Thompson, D.; Yuan, T.C.; Gong, D.; You, T.W. Design, analysis and experimental validation of high static and low dynamic stiffness mounts based on target force curves. Int. J. Non-Linear Mech. 2020, 126, 103559. [Google Scholar] [CrossRef]
- Wang, Q.; Zhou, J.; Xu, D.; Ouyang, H. Design and experimental investigation of ultra-low frequency vibration isolation during neonatal transport. Mech. Syst. Signal Process. 2020, 139, 106633. [Google Scholar] [CrossRef]
- Britvec, S.J. The Stability of Elastic Systems; Pergamon: Oxford, UK, 1973. [Google Scholar]
- Virgin, L.N. The Dynamics of Symmetric Post-buckling. Int. J. Mech. Sci. 1985, 27, 235–248. [Google Scholar] [CrossRef]
- Bazant, Z.P. Stability of Structures; Oxford University Press: Oxford, UK, 1991. [Google Scholar]
- Yan, G.; Zou, H.X.; Wang, S.; Zhao, L.C.; Zhang, W.M. Large stroke quasi-zero stiffness vibration isolator using three-link mechanism. J. Sound Vib. 2020, 478, 115344. [Google Scholar] [CrossRef]
Figure 1.
Schematic illustration of axial compression of simply supported SGC. (a) Before buckling deformation; (b) after buckling deformation.
Figure 1.
Schematic illustration of axial compression of simply supported SGC. (a) Before buckling deformation; (b) after buckling deformation.

Figure 2.
Axial compression deformation of SGC.

Figure 3.
Comparison diagram of recovery force curve. (a) Post-buckling spring vs. stretch spring; (b) post-buckling spring vs. linear spring.
Figure 3.
Comparison diagram of recovery force curve. (a) Post-buckling spring vs. stretch spring; (b) post-buckling spring vs. linear spring.

Figure 4.
The simple model of vibration isolation unit.

Figure 5.
The numerical value of SGC’s recovery force curve and its fitting curve.

Figure 6.
Comparison of spring recovery force curves under different parameters. (a) E = 3.5 × 10⁴ Pa; (b) D = 0.02 m.
Figure 6.
Comparison of spring recovery force curves under different parameters. (a) E = 3.5 × 10⁴ Pa; (b) D = 0.02 m.

Figure 7.
The physical model of vibration isolator.

Figure 8.
Passive vibration isolation model.

Figure 9.
Comparison of numerical and analytical methods of vibration isolation system.

Figure 10.
Vibration transfer rate curves under different parameters. (a) Excitation amplitude (ζ = 0.3; D = 0.02 m; E = 3.5 × 10⁴ Pa); (b) viscous damping ratio (Λ = 0.05 m/s2; D = 0.02 m; E = 3.5 × 10⁴ Pa); (c) Young’s modulus (Λ = 0.05 m/s2; ζ = 0.3; D = 0.02 m); (d) section diameter (Λ = 0.05 m/s2; ζ = 0.3; E = 3.5 × 10⁴ Pa).

Figure 11.
Experimental set-up for the vibration isolation test.

Figure 12.
Comparison of experimental and theoretical results of displacement transmissibility.


Table 1.
The stiffness coefficient and initial load.
| E (Pa) | D (m) | K1 | K2 | K3 | P0 (N) |
|---|---|---|---|---|---|
| 3.5 × 10⁴ | 0.02 | 2.1211 | 4.7546 | 420.2 | 0.330723 |
| 0.025 | 2.7272 | 6.1134 | 540.27 | 0.807425 | |
| 0.03 | 3.3333 | 7.4715 | 660.34 | 1.674255 | |
| 0.035 | 3.9391 | 8.83 | 780.35 | 3.10176 | |
| 0.04 | 4.5453 | 10.189 | 900.44 | 5.29161 | |
| 3.5 × 10⁴ | 0.02 | 2.1211 | 4.7546 | 420.2 | 0.330723 |
| 4.5 × 10⁴ | 5.1783 | 11.608 | 1025.9 | 0.4252194 | |
| 5.5 × 10⁴ | 10.737 | 24.069 | 2127.1 | 0.519715 | |
| 6.5 × 10⁴ | 19.892 | 44.591 | 3940.7 | 0.614197 | |
| 7.5 × 10⁴ | 33.938 | 76.077 | 6723.3 | 0.708697 |
Publisher’s Note: MDPI stays neutral with regard to jurisdictional claims in published maps and institutional affiliations. |
© 2021 by the authors. Licensee MDPI, Basel, Switzerland. This article is an open access article distributed under the terms and conditions of the Creative Commons Attribution (CC BY) license (https://creativecommons.org/licenses/by/4.0/).
Share and Cite
MDPI and ACS Style
Yang, J.-H.; Yang, X.-D.; Han, Q.-K.; Liu, J.-G. Post-Buckling Spring Vibration Isolator Using Silicone Gel Column: A Theoretical and Experimental Study. Appl. Sci. 2021, 11, 10559. https://0-doi-org.brum.beds.ac.uk/10.3390/app112210559
AMA Style
Yang J-H, Yang X-D, Han Q-K, Liu J-G. Post-Buckling Spring Vibration Isolator Using Silicone Gel Column: A Theoretical and Experimental Study. Applied Sciences. 2021; 11(22):10559. https://0-doi-org.brum.beds.ac.uk/10.3390/app112210559
Chicago/Turabian StyleYang, Ji-Hou, Xiao-Dong Yang, Qing-Kai Han, and Jin-Guo Liu. 2021. "Post-Buckling Spring Vibration Isolator Using Silicone Gel Column: A Theoretical and Experimental Study" Applied Sciences 11, no. 22: 10559. https://0-doi-org.brum.beds.ac.uk/10.3390/app112210559
Note that from the first issue of 2016, this journal uses article numbers instead of page numbers. See further details here.