
Usage of Barkhausen Noise for Assessment of Corrosion Damage on Different Low Alloyed Steels


1
Research Centre, University of Žilina, Univerzitná 1, 01026 Žilina, Slovakia
2
Faculty of Civil Engineering, University of Žilina, Univerzitná 1, 01026 Žilina, Slovakia
3
Faculty of Mechanical Engineering, University of Žilina, Univerzitná 1, 01026 Žilina, Slovakia
*
Author to whom correspondence should be addressed.
Appl. Sci. 2021, 11(22), 10646; https://0-doi-org.brum.beds.ac.uk/10.3390/app112210646
Submission received: 14 October 2021
/
Revised: 2 November 2021
/
Accepted: 10 November 2021
/
Published: 11 November 2021
(This article belongs to the Special Issue Diagnostics and Monitoring of Steel and Concrete Structures)
Abstract
:This study deals with corrosion damage of low alloyed feritic steels of variable strength. Three different steels of nominal yield strength 235, 700 and 1100 MPa were subjected to the variable degree of corrosion attack developed in the corrosion chamber under a neutral salt spray (NSS) atmosphere. The corrosion damage was investigated by the use of conventional metallographic observations when the thickness of corroded layer was quantified. Moreover, non-destructive magnetic technique, based on Barkhausen noise, was also employed. It was found that the rate of corrosion damage decreases along with the increasing number of days in the chamber. The similar evolution can be also found for Barkhausen noise emission and the extracted parameters from the emission. It can be reported that conventional rms value of Barkhausen noise signal as well as FWHM (full width at half maximum of Barkhausen noise envelope) can be linked with the corrosion extent, especially in the early phases of corrosion attack. The PP (peak position of Barkhausen noise envelope) values exhibit poor sensitivity.
1. Introduction
Components and civil structures made of steel are exposed to the corrosion damage as a result of the aggressive environment. Surface oxidation is frequently observed phenomenon, which can result into serious failures of components and a collapse of civil structures, especially bridges [1,2]. Monitoring of corrosion extent is, therefore, of vital importance with respect of functionality of the mechanical system and safety of road traffic. Apart from visual inspection, a diversity of techniques was reported and employed for monitoring of corrosion damage in the critical applications.
Li et al. [3] reported on cluster analysis applied for post processing of acoustic signals. Martin et al. [4] used ultrasonic tomography in order to monitor bridge structures. Peng and Wang [5] applied gamma rays for monitoring wire ropes being intergraded into bridges. Christen et al. [6] reported about magnetics flux leakage method in order to localize the defects in stay cables. Moreover, electromagnetic signals are frequently applied in the real applications [7].
Significance of corrosion damage monitoring is associated with the increase of true stress as a result of decreasing cross sectional area. When the true stress exceeds the yield strength, plastic straining takes place. When the true stress exceeds the ultimate strength, rupture in the over-stressed area redistributes the load into neighbouring regions [8]. For this reason, an unacceptable degree of corrosion damage in narrow region can remarkably affect the stability of the whole structure. Corrosion damage, therefore, drops down the bearing capacity in the complexity of this term.
Apart from the above-mentioned techniques, also magnetic methods based on Barkhausen noise effect exhibit certain sensitivity against degree of corrosion damage [9]. Barkhausen noise, which is a product of domain walls (DWs), jumps when the surface made of ferromagnetic matrix is exposed to magnetic field altering in time [10,11]. Magnetic Barkhausen noise (MBN) is the only component of produced emission which—since the acoustic emission produced by DWs—can be detected as well. DWs alignment is affected by the stress state [12,13,14]. However, magnetostriction in complex steel structures is quite weak [15,16]. Therefore, the major role, in many cases, takes microstructure expressed in term of precipitation, dislocation of non-ferromagnetic or hard magnetic phases [17,18,19], etc. Presence of non-ferromagnetic or hard magnetic phase (for instance Fe oxides [10]) tends to attenuate MBN emission [9]. The increasing height of surface irregularities makes propagation of electromagnetic pulses more difficult [20]. Furthermore, a non-ferromagnetic layer on a ferromagnetic body makes weaker magnetising field which in turn decreases amplitude of acquired MBN pulses [21]. According to this, MBN emission is a promising tool for monitoring of ferromagnetic bodies, which are exposed to corrosion, and this study deals with corrosion damage of low alloyed steels of variable strength.
2. Materials and Methods
Three different commercial low alloyed steels of nominal yield strength 235, 700 and 1100 MPa were employed in the study. A total of 32 samples of size 25 × 50 mm of each steel were cut from sheets of thickness 5 mm (6 mm in the case of MC1100). The sheets of yield strength 700 and 1100 MPa were produced by hot rolling (further details are unknown). Chemical composition of all steels is indicated in Table 1.
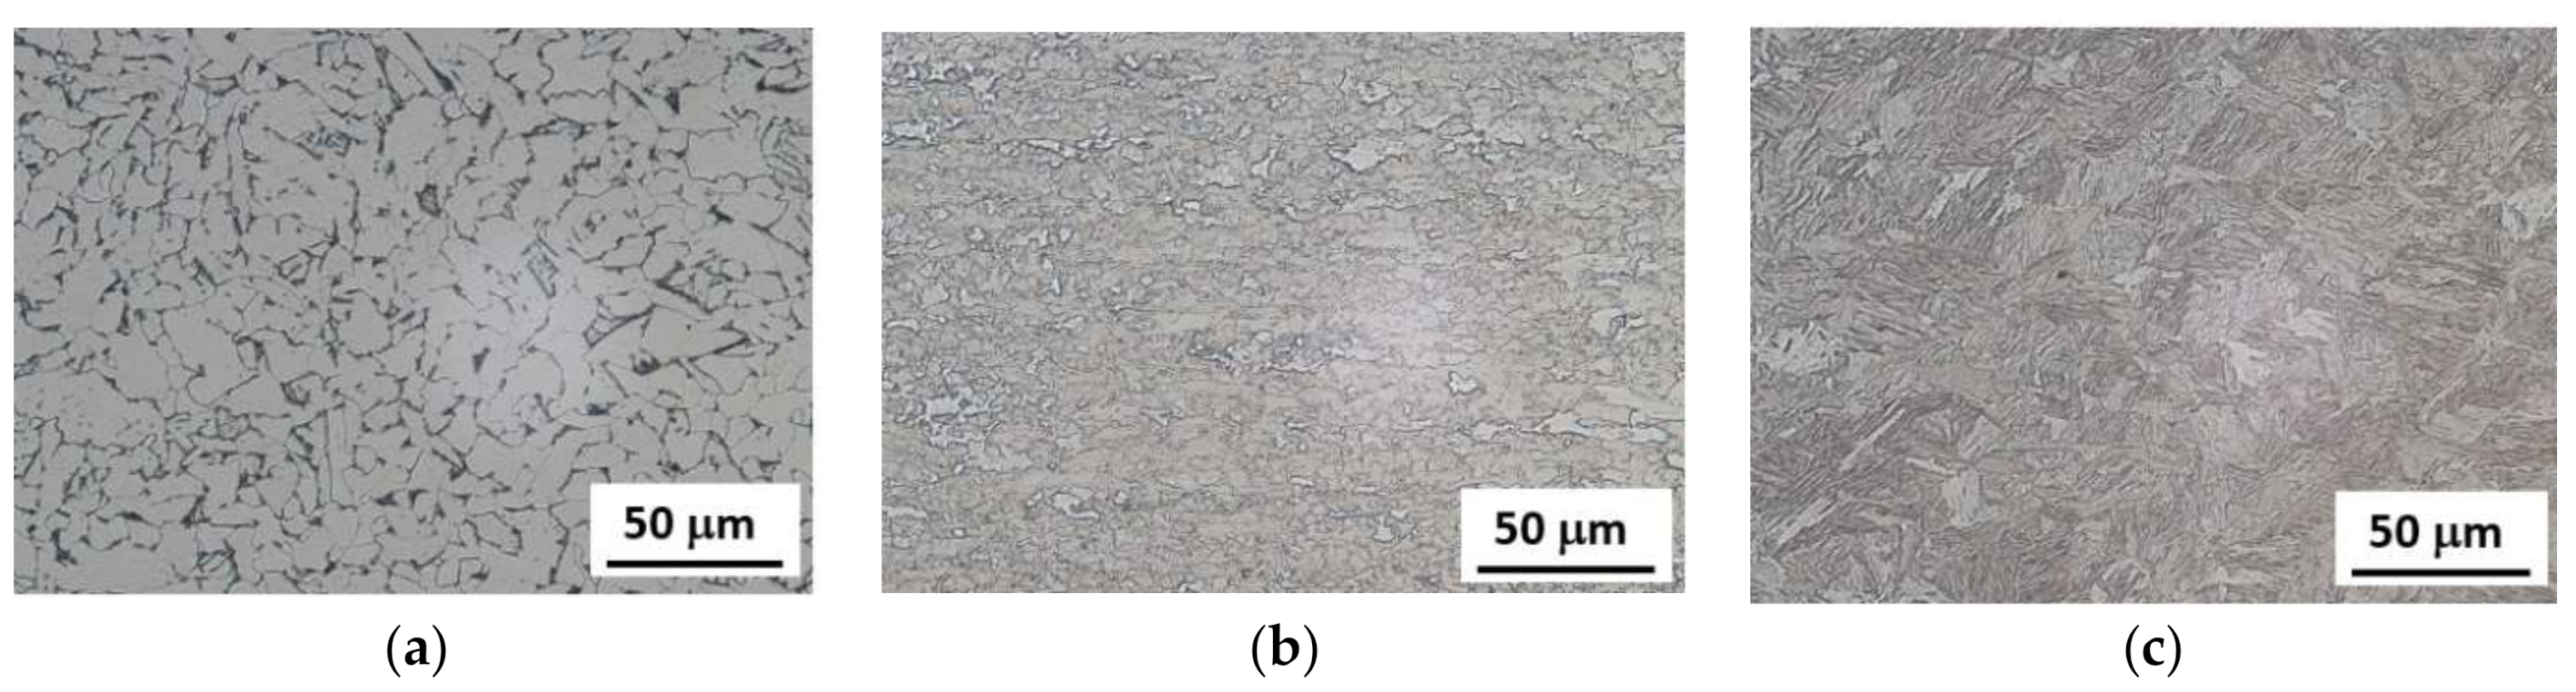
The matrix of the S235 steel is entirely composed of ferrite grains and limited volume of pearlite. Hot rolling initiated the fine-grained structure with certain volume of strain induced martensite phase in the case MC700 whereas MC1100 steel is entirely composed of martensite phase. Microstructural images of investigated steels can be found in Figure 1. The average grain size obtained from the EBSD (electron back scattering diffraction) observations is 22 μm for the S235, 15 μm for the MC700 and 11 μm for MC1100 [22].
The samples were subjected to variable degree of corrosion attack. The samples were corroded in the neutral salt spray atmosphere with respect of STN EN ISO 9227 standard [23] in the VSC KWT 1000 chamber (temperature of 35 °C, pH in the range from 6.5 to 7.2, pressure in the chamber 120 kPa). The samples were cleaned before the experiment and placed into the chamber by the use of plastic stripes. Certain fractions of the corroded layer were removed from the surface during the cleaning. However, the corrosion products firmly connected with the underlying matrix retain on the surface and can be found on metallographic images. The cleaning of the surface was carried out in the manner as that potentially employed before MBN measurements on the real components. The samples were exposed to the different corrosion attack linked with the days in the chamber as it has been indicated in Table 2.
For each degree of corrosion, Attack 2 samples were analysed. Loose corrosion residues were manually removed from the surface of each sample and subsequently the surface of samples was water cleaned and dried.
MBN was measured by RollScan 350 in MicroScan 600 software under magnetising voltage 16 V and frequency 125 Hz of sine profile (the corresponding magnetising field altered ± 9.87 kA.m−1). Sampling frequency of acquired MBN emission was 6.4 MHz. Due to magnetic anisotropy originated from sheets rolling MBN emission was measured in the rolling direction (RD) as well as transversal direction (TD). RD direction represents the easy axis of magnetisation whereas TD represents the perpendicular hard axis (due to the lower MBN in TD as compared with RD). MBN signal was acquired in the frequency range from 10 to 1000 kHz by the use of serial sensor S1-18-12-01. MBN refers to the rms value of the signal. The PP (peak position) feature is linked with magnetic field in which MBN envelope attains the maximum. FWHM of MBN envelope is the full width of MBN envelope at half of its maximum.
In order to analyse the thickness of corroded layer, about 20 mm long pieces were cut along RD (in Struers Secotom-50). The samples were tapped by red tape in order to avoid massive delamination of corroded layer from the surface during cutting. Small pieces were subsequently hot moulded, grounded, polished, and finally etched by 3% Nital. Optical images of corroded samples were observed in Neophot 2 microscope by the use Niss Element software. The thickness of the corroded layer was measured in five different positions using the light microscopes Zeiss AxioCam MRc5 and Olympus SZx16 in Quick Photo Industrial 3.0 software.
3. Results of Experiments and Their Discussion
3.1. Observations of Corrosion Damage
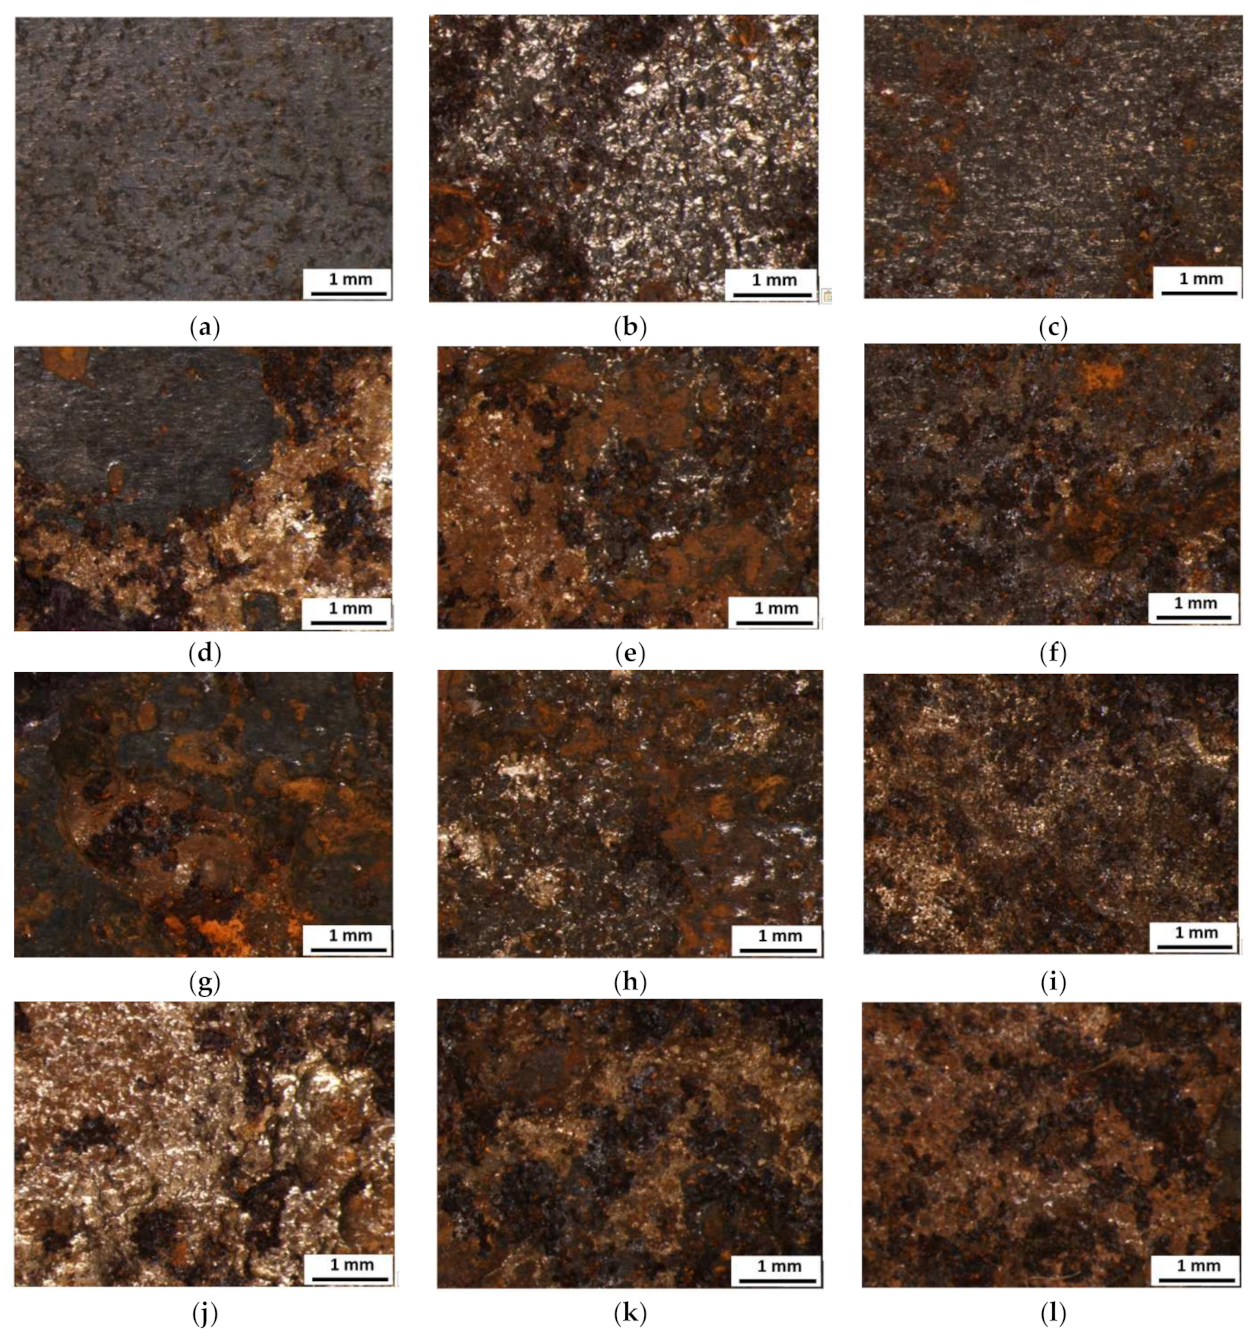
Visual observation of corroded samples showed that corrosion attack is not developed in the same rate with respect of the different steels. It is worth mentioning that evolution of corrosion is strongly heterogeneous with respect of the different microanodic and microcathodic regions within one sample [1,9]. For this reason, corroded region neighbouring with non-corroded one or/and extent of corrosion towards the deeper layers strongly varies. Figure 2 indicates the heterogeneity and coverage of corrosion products within the sample’s surface in a detail after various exposure times in neutral salt spray atmosphere. All the surfaces of tested steels were completely covered by various types of iron oxides, hydroxides and oxohydroxides (proved by different colours and structures of corrosion product) even after 11 h of exposure in salt spray atmosphere (Figure 2d–f) as a result of high humidity, temperature, presence of oxygen and chloride ions accelerating the corrosion process. Depending on local thermodynamic conditions changing over time within the corrosion process, different types of corrosion products are formed or transformed locally on the sample’s surface explaining the mentioned heterogeneity. However, as the heterogeneity of corrosion products is very similar within all the tested samples and all the surfaces were completely covered by corrosion products even after short exposure times, the testing method of surface evaluation by visual surface inspection cannot be used as a relevant non-destructive tool for assessing the extent of corrosion attack. Real differences in corrosion extent are visible from the cross section of individual samples (Figure 3) and interpretation of corrosion products thickness growth is presented in Figure 4. This different corrosion rate is related to various microstructures, chemical compositions and performed hot rolling as all the other conditions were the same for all the samples. However, it is not possible to use cross-section analysis in real conditions, hence, another non-destructive technique, such as Barkhausen noise emission should be employed to assess the real corrosion extent.
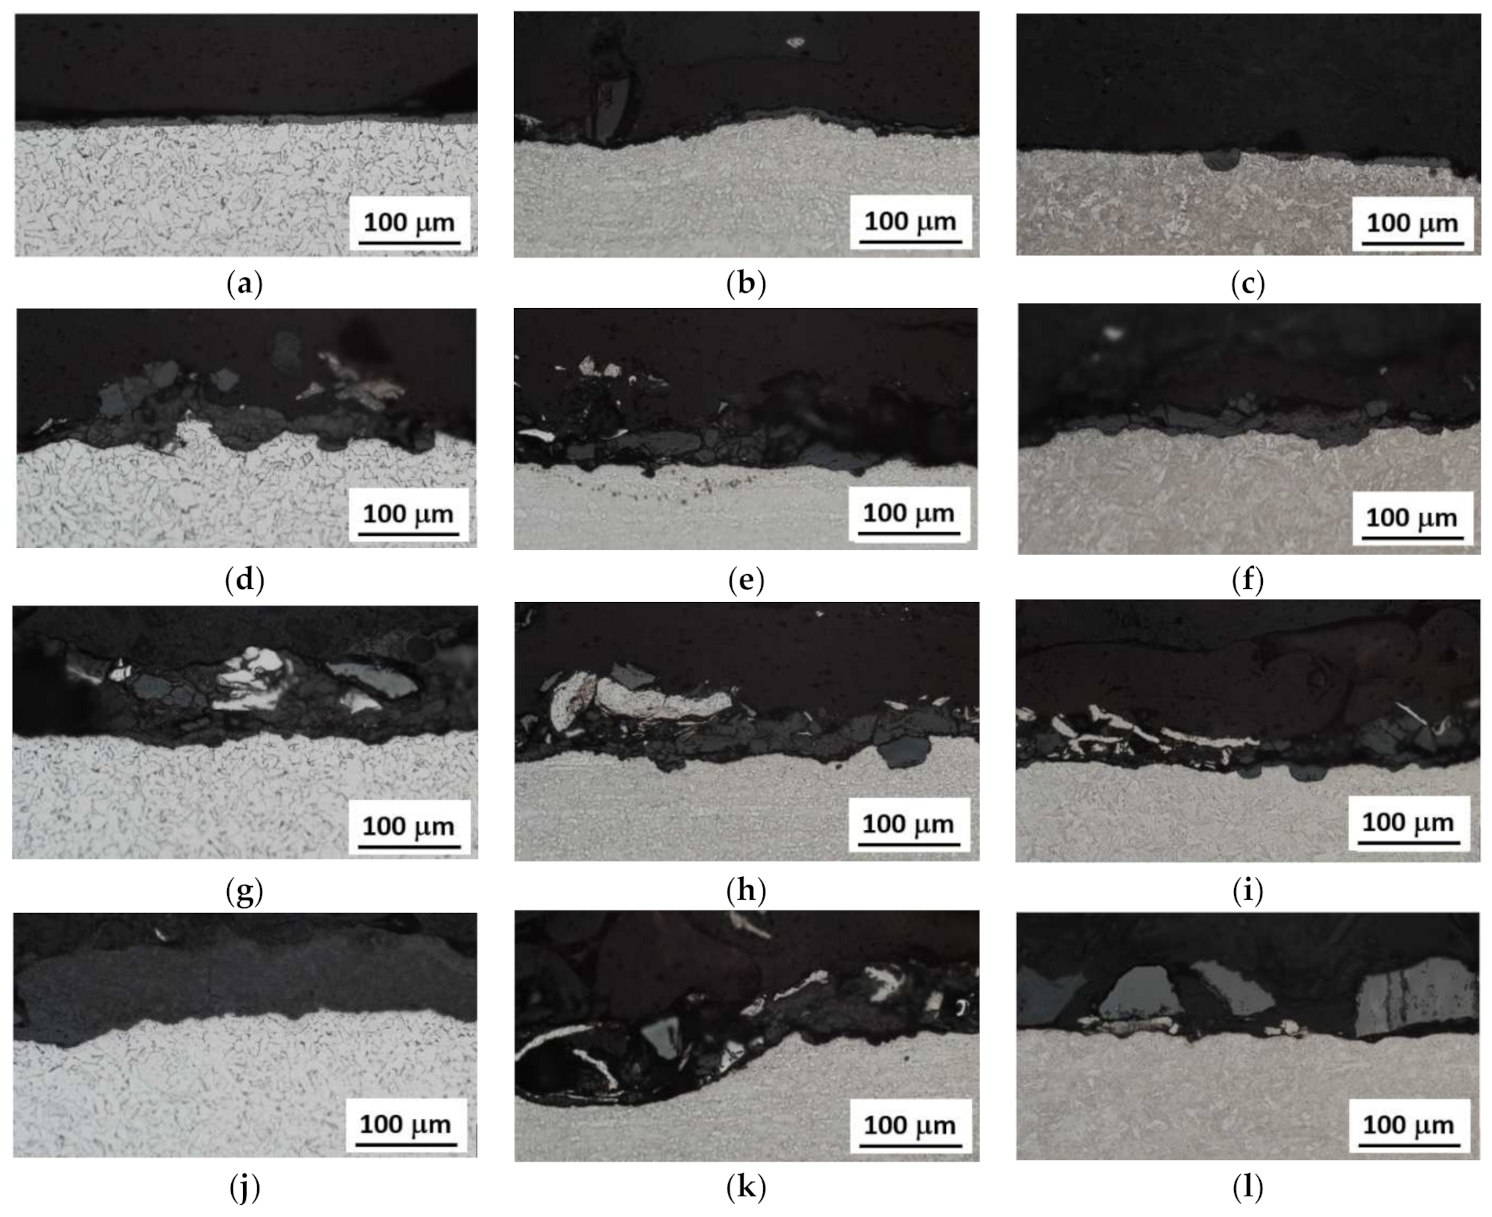
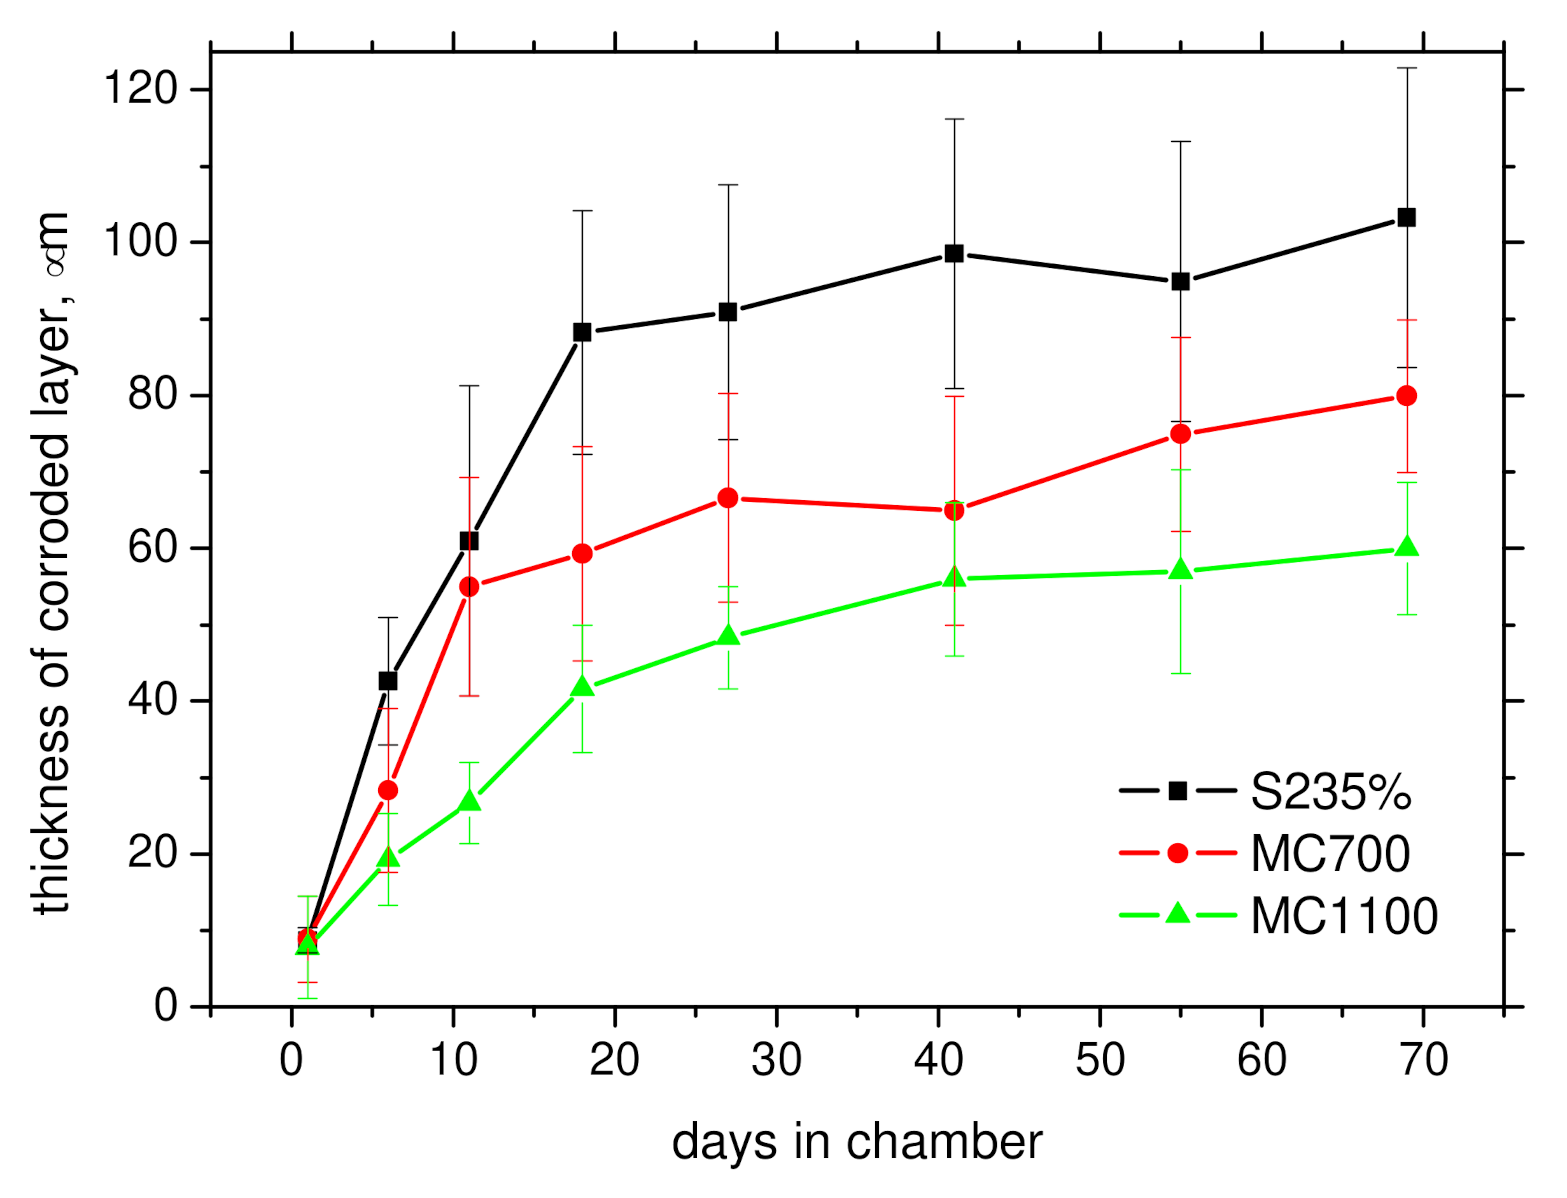
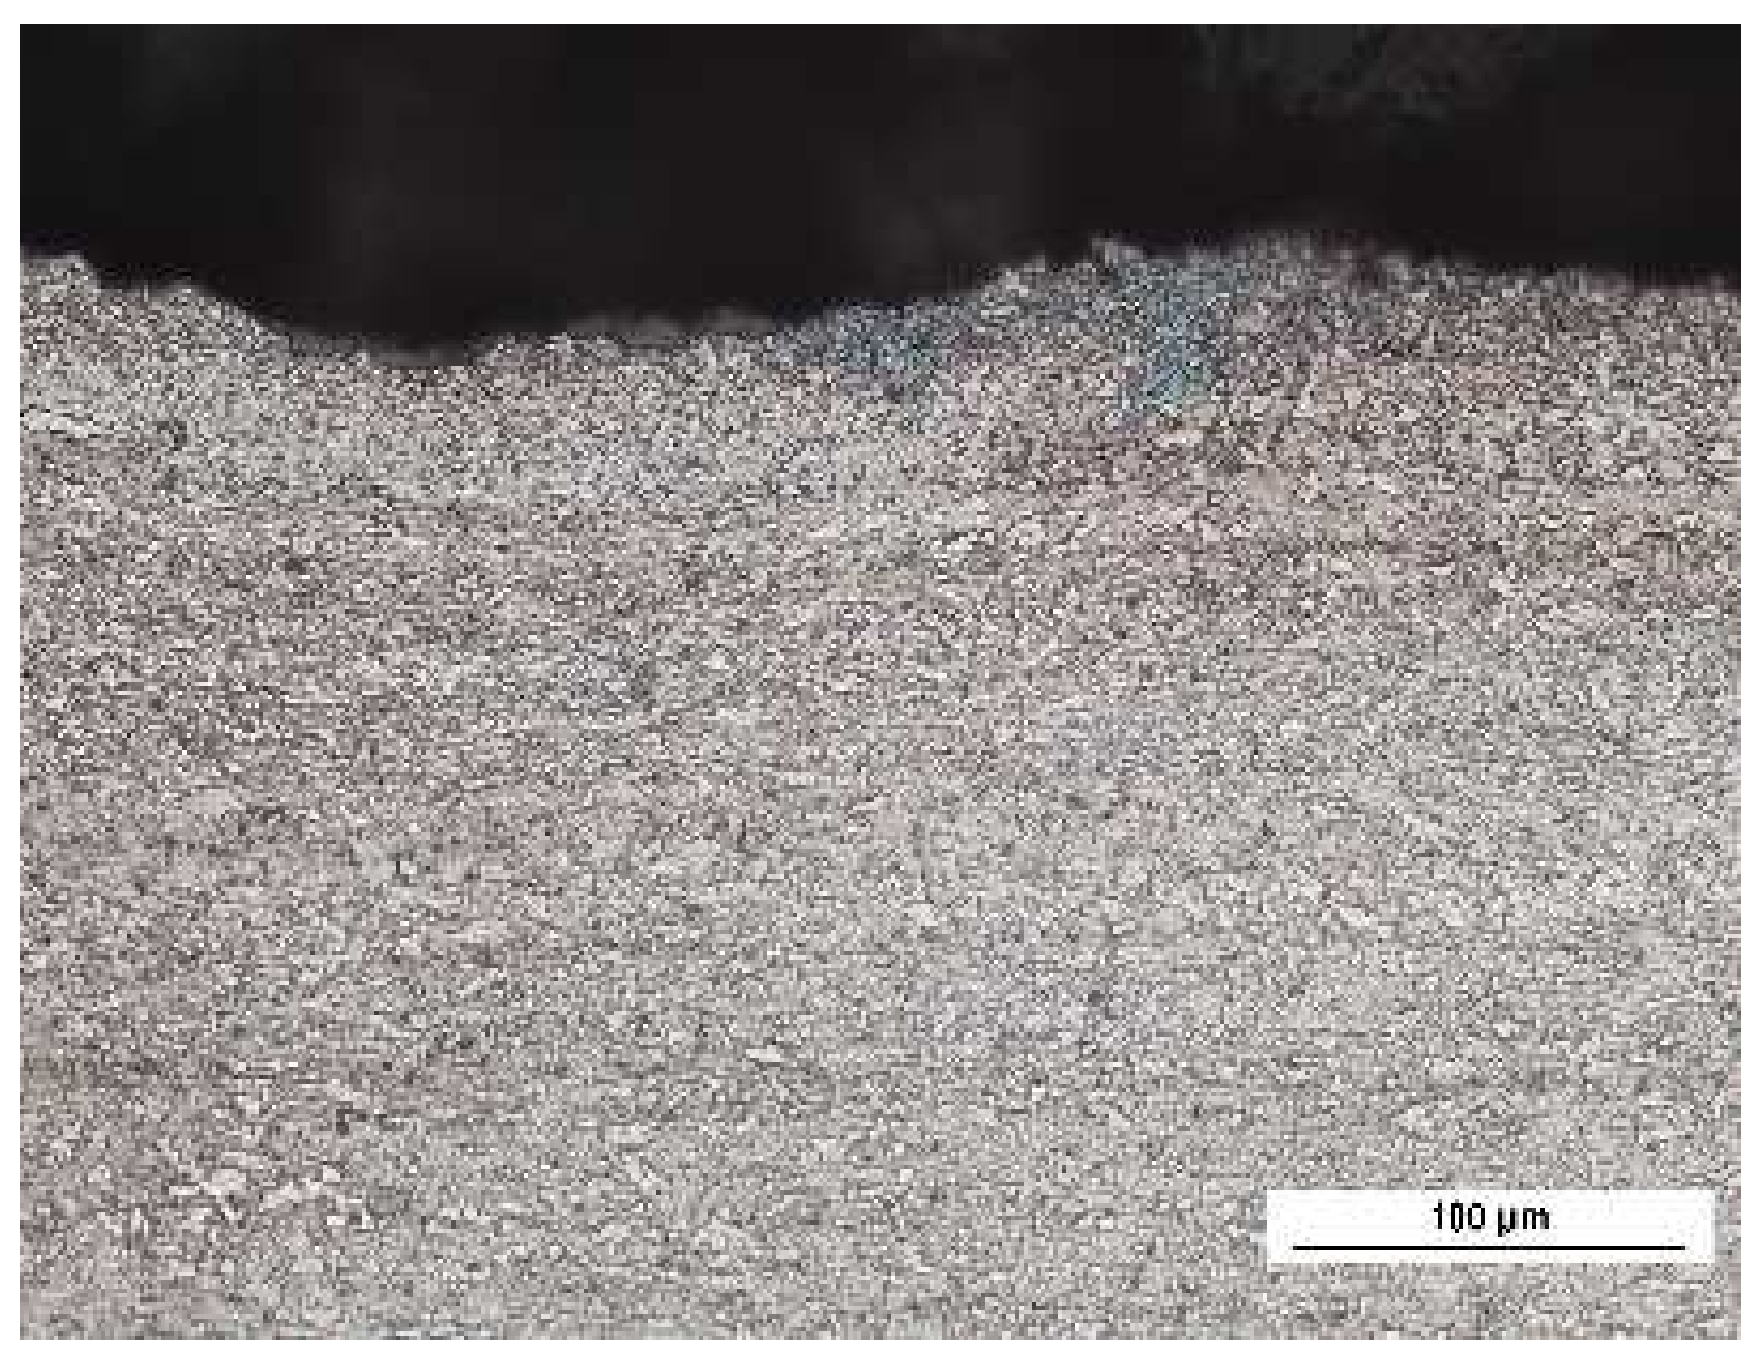
Cross sectional images in Figure 3 demonstrate that the thickness of corroded layer on the samples increases steeply especially in the early phases of corrosion attack and saturates later, see also Figure 5. These figures also depict that corroded layer, which appears dark (grey) on the images, contains in many cases the uncorroded fragments, which appear white (the same colour as the uncorroded matrix) [9]. Figure 3 and Figure 4 also demonstrate that the thickness of corroded layer strongly varies and the regions, in which the corroded layer is quite thick neighbouring with those of limited thickness or/and free of the corroded layer as a result of complex nature of corrosion process in which small regions exposed to the corrosion attack become relatively anodic or cathodic. For this reason, the thickness of corroded layer in some regions is increasing at the expense of the neighbouring ones. Moreover, some products of corrosion were removed from the surface during the cleaning. Figure 3 also shows the increasing height of surface irregularities due to the heterogeneous character of corrosion attack. Finally, it can be found that the thickness of corroded layer can be found the highest for S235 and decreases along with the increasing yield strength of steels. It should be also noticed that delamination of the corroded layer during samples preparation for metallographic observations (cutting, grinding, and polishing) makes observation of the corroded layer complicated (despite the samples surface tapping). For this reason, only those regions being directly connected with the matrix without gaps can be involved into the thickness evaluation of corroded layer. In some cases, delaminated fragments were accumulated below or/and in the tap and these regions were excluded from the measurements.
3.2. MBN Measurements
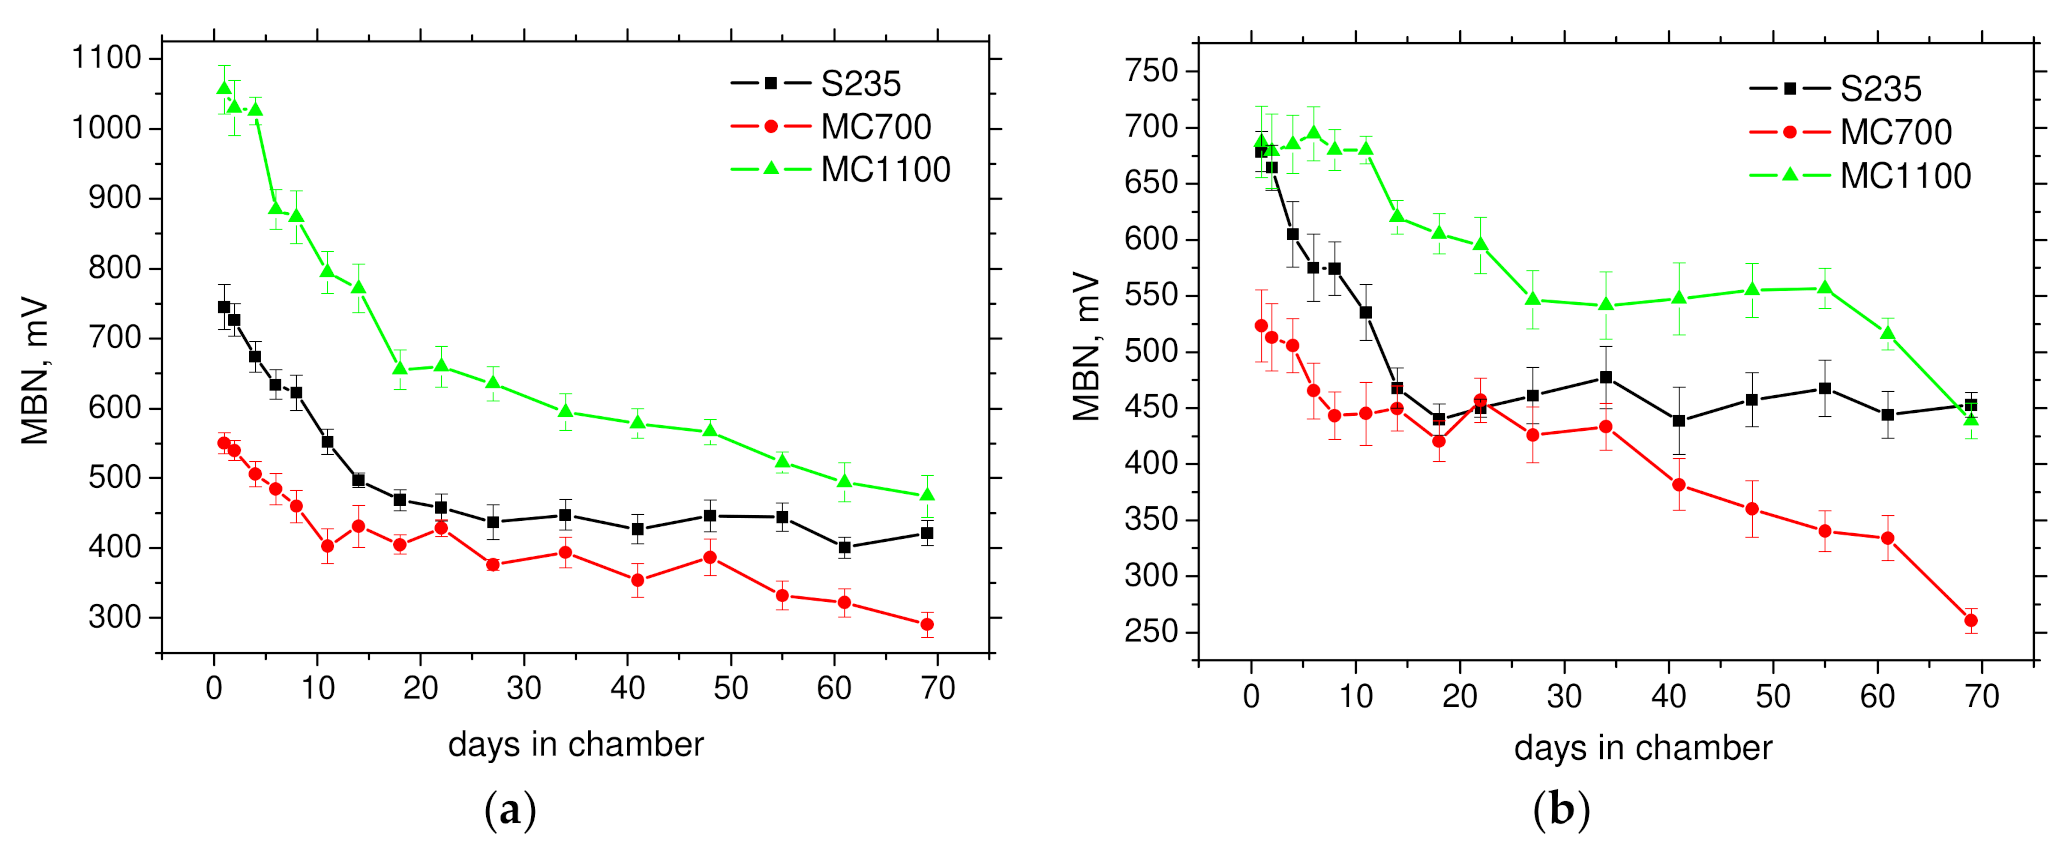
Figure 5 shows evolution of MBN along with the number of days in the chamber. This figure clearly demonstrates that strong sensitivity of MBN against corrosion damage can be found especially in the early phases (low number of days in the chamber) followed by saturation when there is only a moderate decrease of MBN along with number of days. MBN for S235 drops down steeply up to 22 days followed nearly a flat region in RD and well as TD. MBN for MC700 exhibits remarkable decrease in RD and TD up to 11 days followed by moderate decrease in RD (or flat region in TD) and finally more remarkable decrease especially in TD. The best sensitivity of MBN for monitoring corrosion damage can be found for MC1100 in RD as demonstrates Figure 5a. The steep descending region, up to 18 days, is followed by less remarkable, but still valuable decreases in MBN.
Decreasing MBN along with especially increasing thickness of the corroded layer (see also Figure 3) is driven by multiple superimposing effects. MBN acquired on the surface of a corroded sample is composed of MBN pulses originating from small non-corroded particles embedded in the corroded layer [9] and MBN pulses produced by the underlying non-corroded matrix. Therefore, MBN decreases along with more developed corrosion damage (the thickness of corroded layer) is a result of:
- Decreases in size of non-corroded particles in the corroded layer producing MBN pulses of lower amplitude [9];
- Increasing gap between the sensor and the non-corroded matrix as a result of attenuation of magnetic field in the sample during surface magnetisation (decreases rate of change of magnetic field in time-dH/dτ [24]);
- Increasing height of surface irregularities and therefore worsen condition for pulses acquisition [20];
- Corroded layer, which can be considered as a barrier which attenuates the MBN pulses originating from non-corroded matrix during their propagation towards the sensor.
Figure 5 also shows that MBN emission does not develop in a systematic manner with respect of yield strength. MBN emission can be also affected by grain size and phase transformation (strain induced martensite transformation). For this reason, in this particular case, MBN originating from ferrite of finer grain size is richer as a result of higher density of DWs and the corresponding number of MBN pulses [25,26].
where d is the average grain size and Cg is a material constant.
RMS = Cgd−1/2
For this reason, MC1100 emits stronger MBN as compared with S235 (finer grain size of MC1100 [22]). One might expect that the MBN for MC700 would be richer as compared with S235 due to the finer grain size. However, the microstructure of the near surface region (lying within the MBN reading depth) is rougher as contrasted against the deeper layer which in turn contributes to the lower MBN, see Figure 5 and Figure 6 (see also Figure 1b). MC700 steel can be considered as a transient state with respect of microstructure when grain refinement is gently beyond the critical threshold and the matrix is composed of a mixture of the fine ferrite grains and the isolated martensite islands.
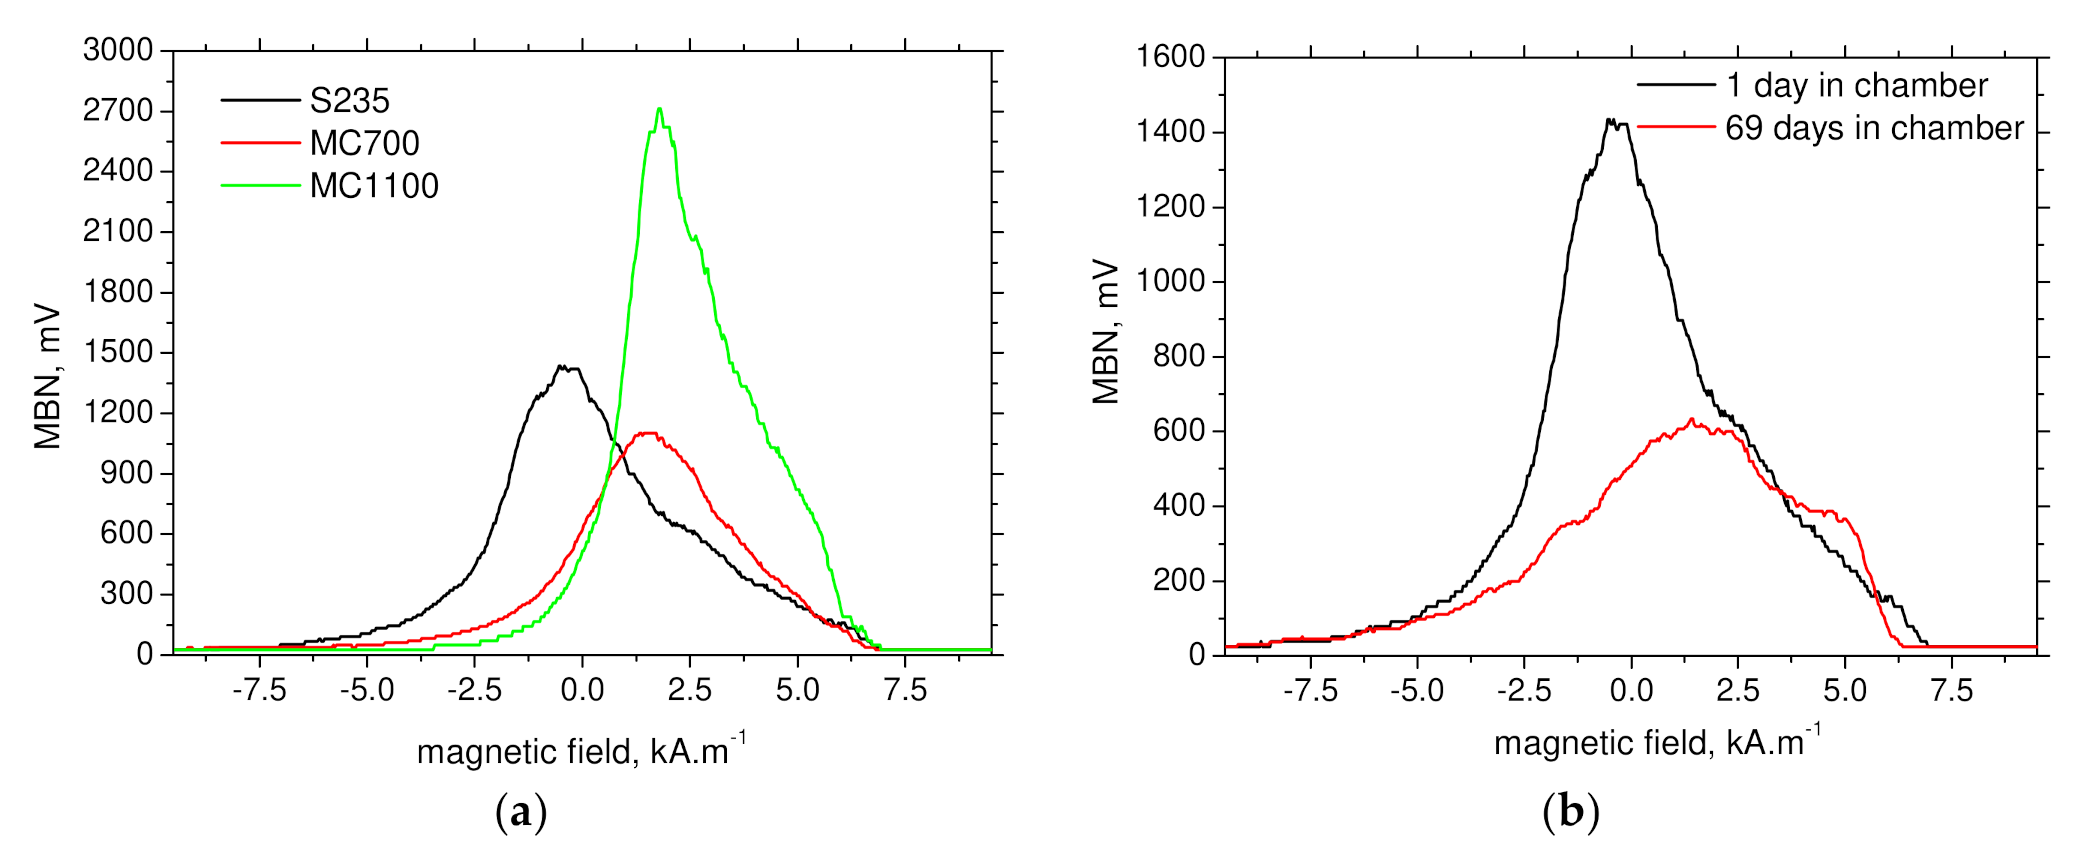
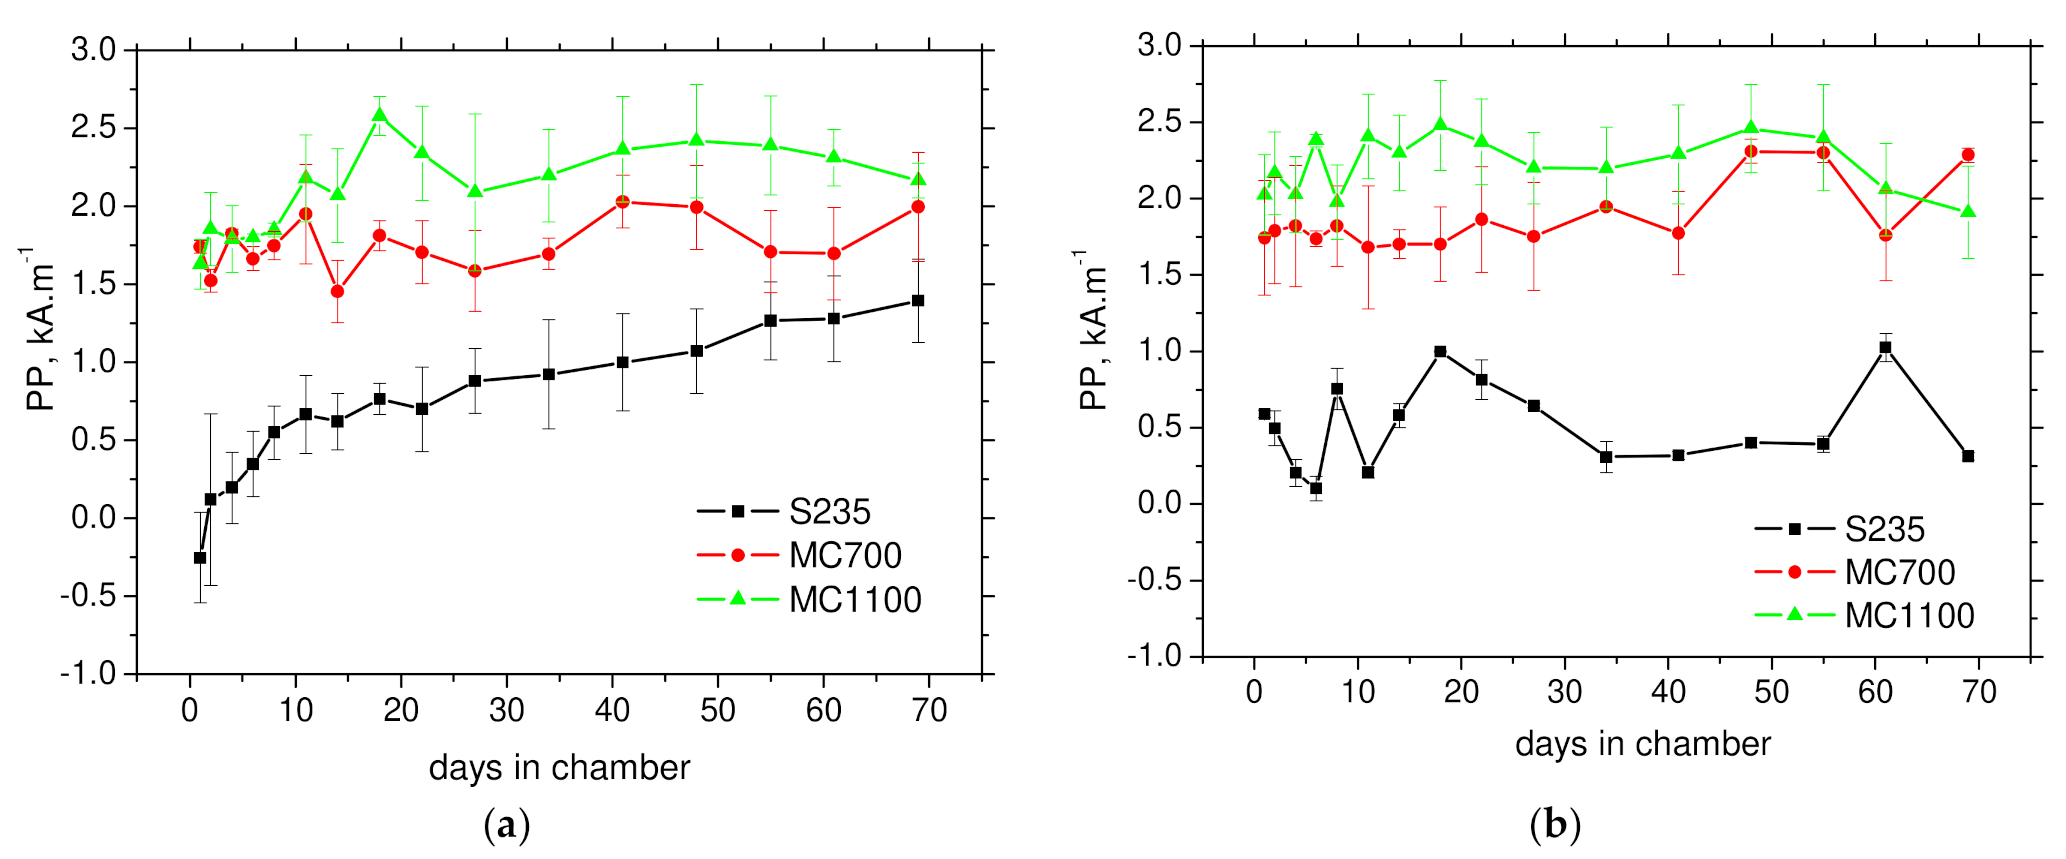
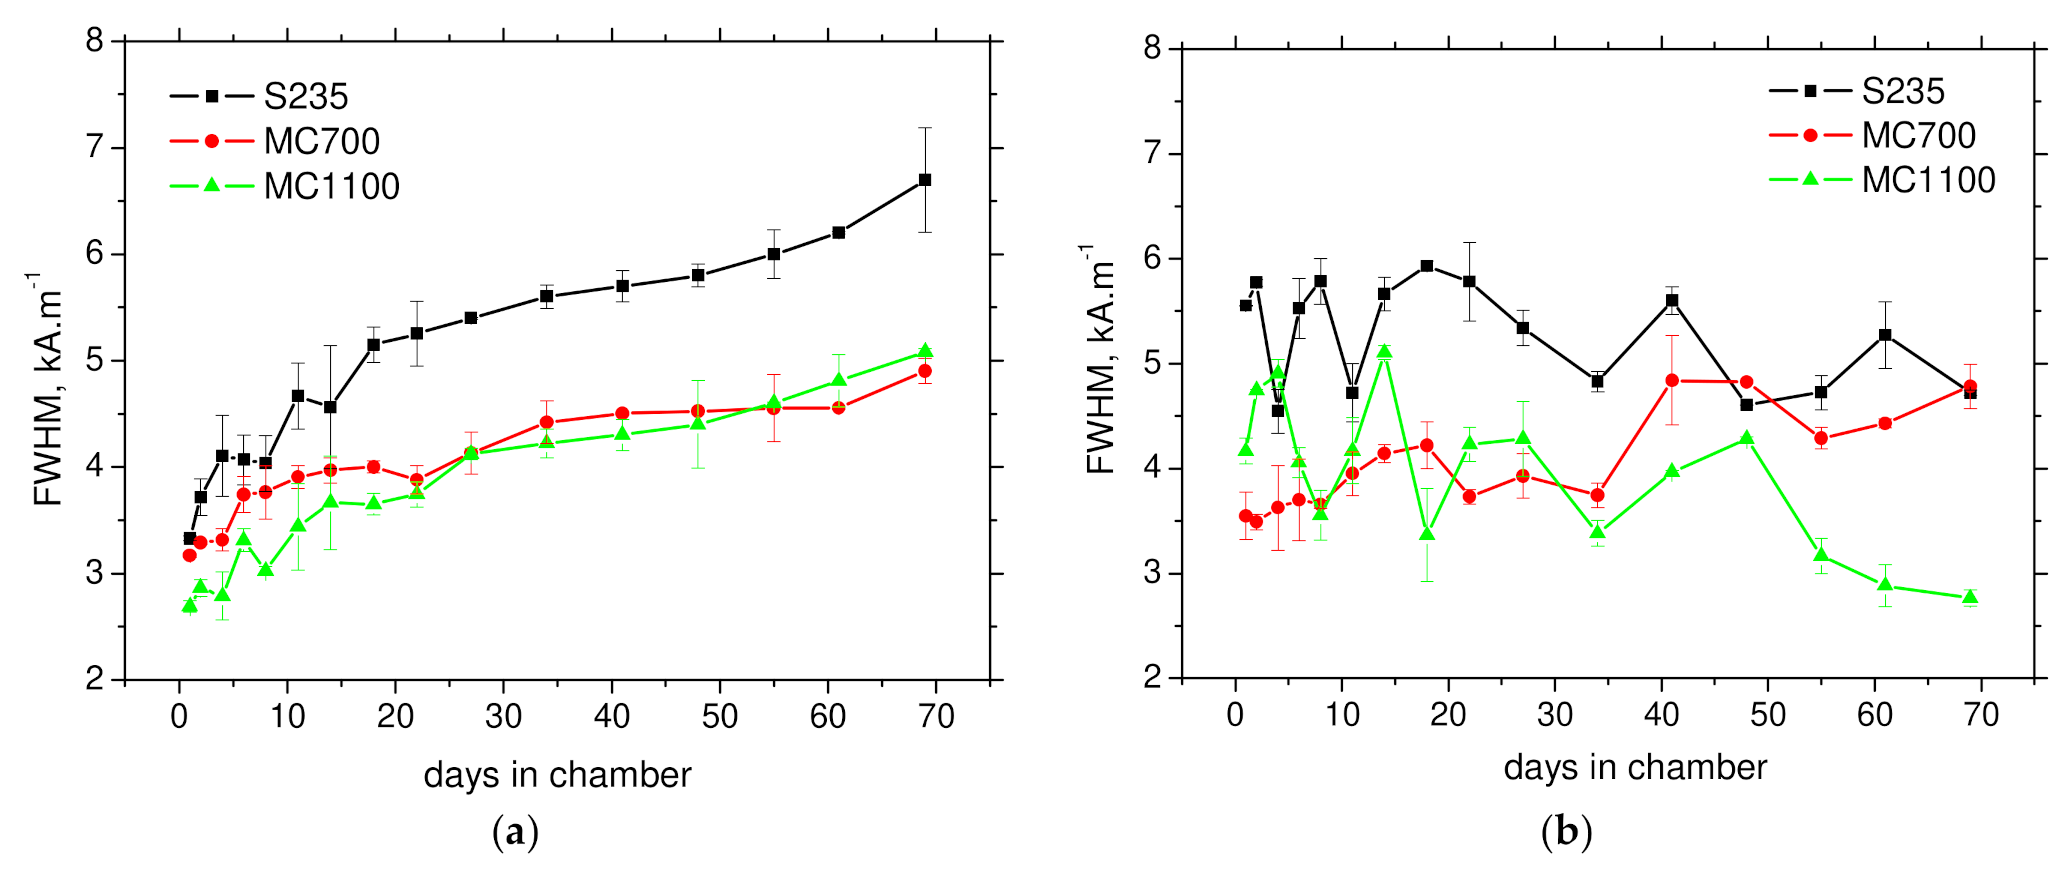
Figure 7 and Figure 8 depict that S235 is softer from magnetic point of view. MBN emission is initiated at lower magnetic field as a result of lower density of pinning sites expressed in term of grain boundary density as well as dislocation density. For this reason, MBN envelopes for S235 can be detected at lower magnetic field (see Figure 7), and therefore, the corresponding PP are lower as compared with MC700 and MC1100 (see Figure 8). Figure 8, Figure 9 and Figure 10 also demonstrate that sensitivity of PP, FWHM as well as the number of detected pulses in TD is very poor.
On the other hand, increasing PP for S235 versus the number of days in chamber are a result of increasing opposition against magnetisation process due to presence of corroded layer of increasing thickness on the surface. However, PP values for thermo-mechanically treated MC700 and MC1100 exhibit poor sensitivity and this feature cannot be proposed for non-destructive monitoring of corrosion damage.
Figure 9a demonstrates that FWHM in RD can be considered as a promising MBN parameter for such purpose. FWHM grows for all investigated steels, but the most pronounced increase can be found for S235. Increasing FWHM for S235 depicts also Figure 7b. Progressive grow of FWHM is driven by increasing diversity of DWs being integrated into clustered DWs motion when the differences among the regions contributing to the entire MBN emission increase with corrosion damage due its non-homogenous nature.
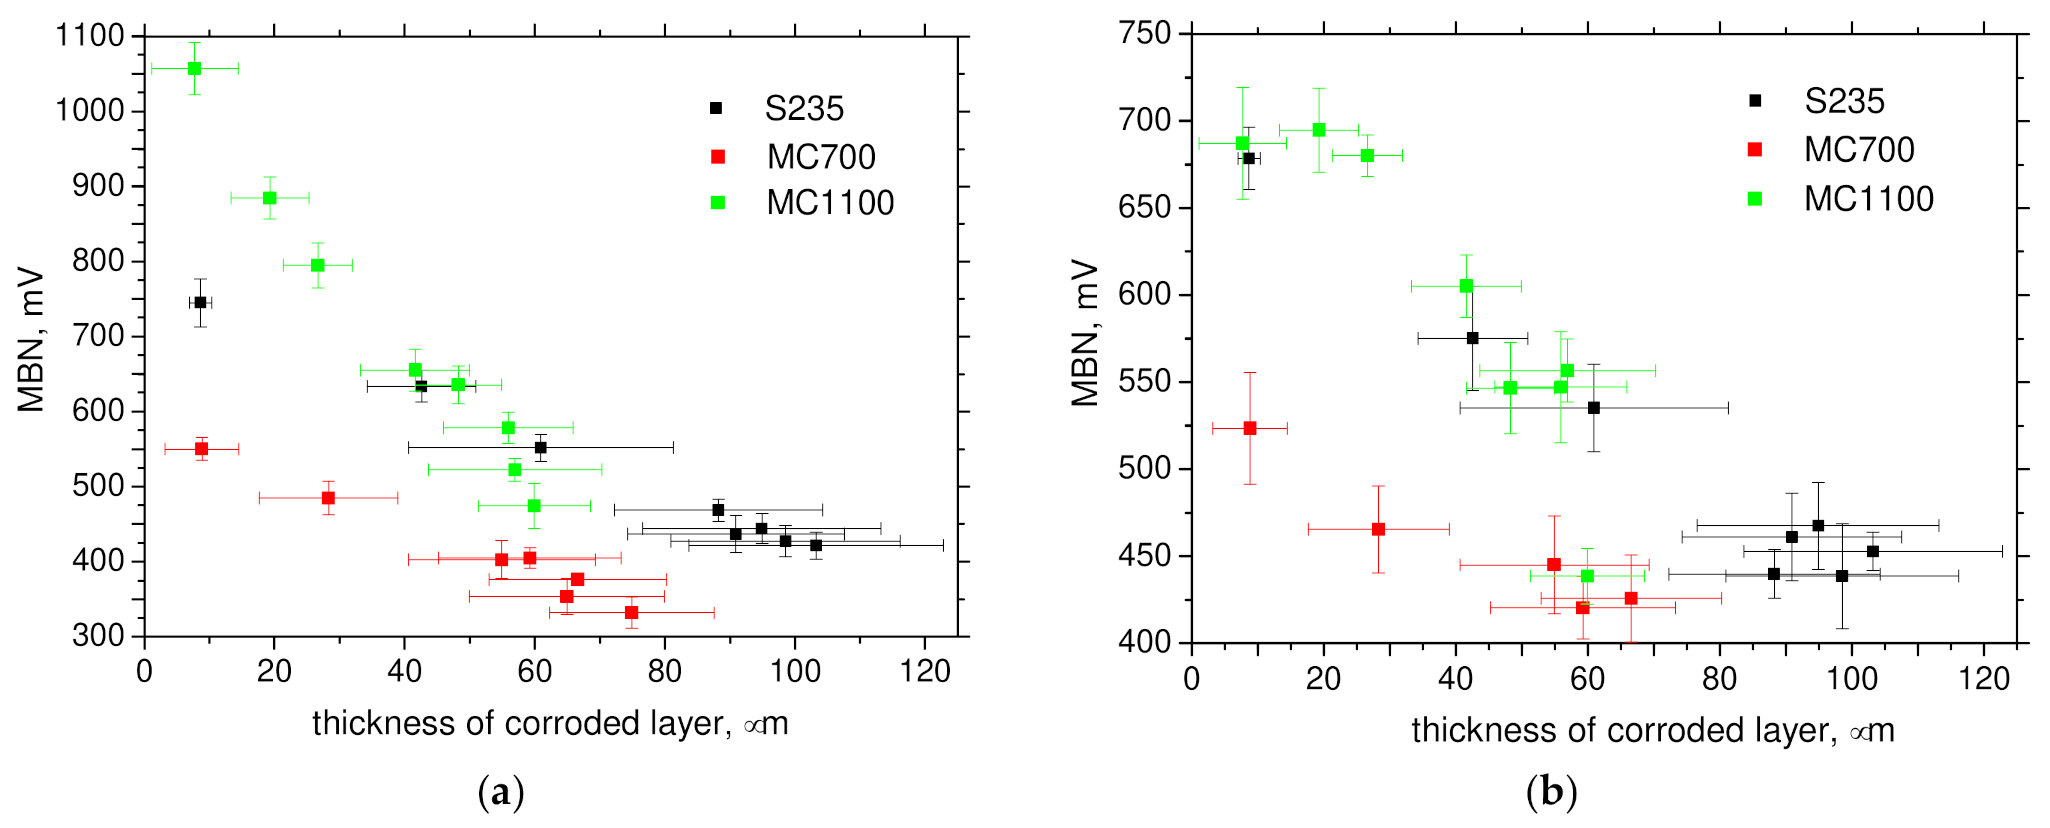
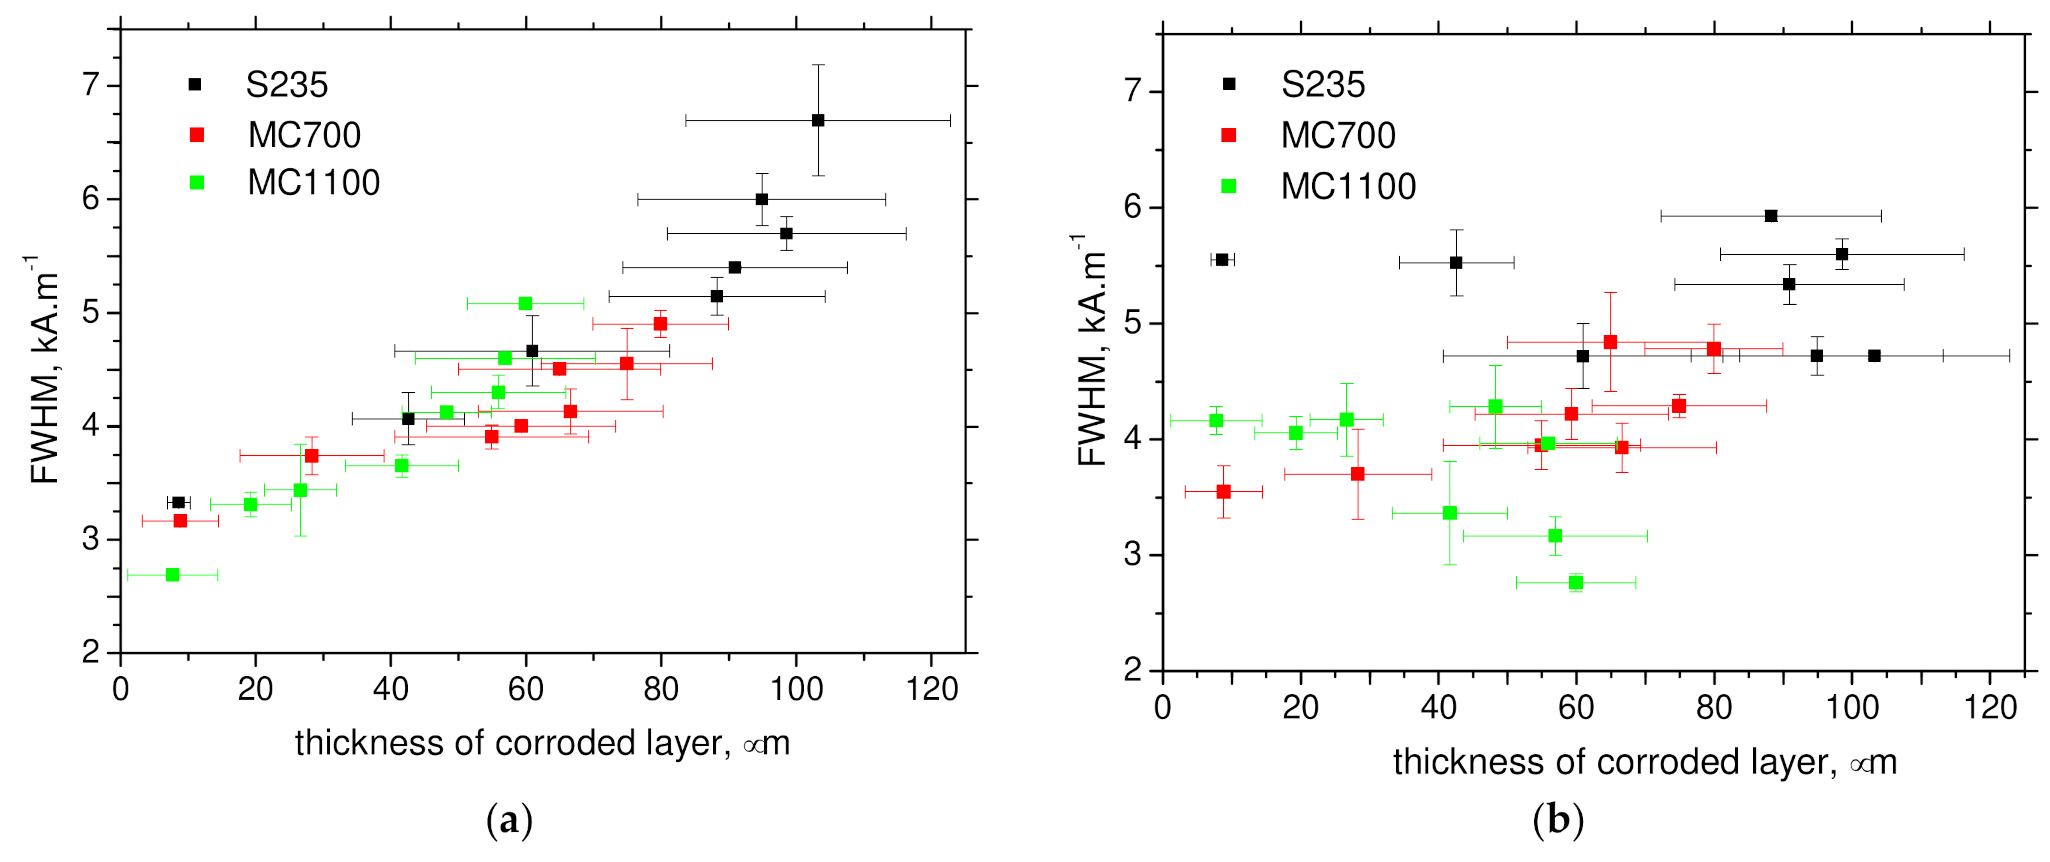
Figure 10 demonstrates that MBN (its rms values) exhibits good sensitivity against the thickness of corroded layer for all steels in RD as well as TD. As soon as the thickness of corroded layer exceeds a certain threshold (for example 80 μm in the case S235), a lack of sensitivity can be found. For this reason, the evolution of the extracted MBN parameters indicates that a reliable concept for monitoring of corrosion damage should be based on a combination of FWHM and the effective value of MBN signal when the high MBN and the low FWHM indicate the lower degree of corrosion attack and vice versa (see Figure 10 and Figure 11). Much better sensitivity can be reported for RD in comparison to TD.
Corroded layer on the underlying ferromagnetic matrix is a barrier for magnetisation of the sample and transfer of MBN pulses from the untouched surface towards the sensing coil. The corroded layer can contain non-corroded ferromagnetic particles. However, their size as well as the corresponding amplitude of produced MBN pulses drops down along with the increasing degree of corrosion damage due to the increasing fraction of 90° DWs at the expense of 180° DWs and the reduced free path of their motion [9]. For this reason, these non-corroded particles cannot fully compensate zero MBN emission originated form the non-ferromagnetic or hard ferromagnetic oxides [10] and MBN emission drops down along with more developed corrosion damage.
MBN emission originating from feritic steels is usually higher as compared with martensitic steel [27] as a result of higher dislocation density and high pinning strength of carbides [16,17] after quenching. However, nearly no precipitates in the form of carbides (as very strong pinning sites) can be found in the low alloyed steels due to the missing elements creating the simple or/and complex carbides (see Table 1). Therefore, the fine-grained structure and the corresponding higher density of DWs in motion can be reported as the main reason for stronger MBN [28] originating from the martensitic MC1100 as contrasted against the feritic S235. The higher hardness and the corresponding higher dislocation density of MC1100 (as well as MC700) [22] only increases the magnetic field in which DWs are unpinned (PP for MC1100 and MC700 are more as compared with S235, see also Figure 8) but takes only the minor role in the amplitude and density of produced MBN pulses.
The MBN technique is very often employed for assessment of stress state of constructions or components [29,30]. It should be noted that the presence of corroded layer on the surface would make difficult assessment of true stress since the contribution of stress is mixed with the contributing role of the corrode layer varying in thickness.
4. Conclusions
Results of the measurements prove that MBN technique could be potentially employed for monitoring of components exposed to the variable degree of corrosion attack. With respect of magnetic measurements such as MBN, the corroded layer on the surface is the hindering barrier. Its role becomes stronger along with its increasing thickness. Effective value of MBN signal exhibits good sensitivity against of corrosion attack especially in its early phases followed by the less remarkable decrease. Reliable monitoring of corrosion damage through the thicker corroded layers can be carried out when the combination of FWHM and effective value of MBN is employed only. Moreover, information about the rolling direction of the body should be known or measured. The combination of the different MBN features extracted from the MBN signals becomes more important for the low alloyed steels of higher strength since the region in which MBN steep decreases occurs is shorter. This paper represents the pilot study since the combination of corrosion damage and the superimposing contribution of stresses should be expected in the real applications.
Author Contributions
Conceptualization, F.P. and M.N.; methodology, M.N., M.P. and M.D.; software, M.N.; validation, M.P. and M.D.; formal analysis, M.P. and M.D.; investigation, F.P., M.P. and M.N.; resources, F.P. and M.P.; data curation, M.N. and M.P.; writing—original draft preparation, M.N. and F.P.; writing—review and editing, F.P. and M.N.; visualization, M.N. and M.D.; supervision, M.P. and F.P.; project administration, F.P. and M.P.; funding acquisition, F.P. and M.N. All authors have read and agreed to the published version of the manuscript.
Funding
This publication was realized with a support of the Operational Program Integrated Infrastructure 2014–2020 of the project: Innovative Solutions for Propulsion, Power and Safety Components of Transport Vehicles, Code ITMS 313011V334, co-financed by the European Regional Development Fund and the project of Operational Programme Integrated Infrastructure: Independent Research and Development of Technological Kits Based on Wearable Electronics Products as the Tools for Raising Hygienic Standards in a Society Exposed to the Virus Causing the COVID-19 disease, ITMS2014+ code 313011ASK8, co-financed by the European Regional Development Fund.
Institutional Review Board Statement
Not applicable.
Informed Consent Statement
Not applicable.
Data Availability Statement
The raw data required to reproduce these findings cannot be shared easily due to technical limitations (especially MBN raw signals are too large due to very high sampling frequency). However, authors can share the data on any individual request (please contact the corresponding author by the use of its mailing address.
Conflicts of Interest
The authors declare no conflict of interest.
References
- Anania, L.; Badalà, A.; D’Agata, G. Damage and collapse mode of existing post tensioned precast concrete bridge: The case of Petrulla viaduct. Eng. Struct. 2018, 162, 226–244. [Google Scholar] [CrossRef]
- Antunes, R.A.; Ichikawa, R.U.; Martinez, L.G.; Costa, I. Characterization of Corrosion Products on Carbon Steel Exposed to Natural Weathering and to Accelerated Corrosion Tests. Int. J. Corros. 2014, 2014, 1–9. [Google Scholar] [CrossRef]
- Li, S.; Hu, P.; Zhao, X.; Chen, K.; Li, J. Atmospheric corrosion performance of wire rope sling in a sulfur dioxide-polluted environment. Adv. Mech. Eng. 2017, 9. [Google Scholar] [CrossRef] [Green Version]
- Martin, J.; Broughton, K.J.; Giannopolous, A. Ultrasonic tomography of grouted duct post-tensioned reinforced concrete bridge beams. NDT E Int. 2001, 34, 107–113. [Google Scholar] [CrossRef]
- Peng, P.-C.; Wang, C.-Y. Use of gamma rays in the inspection of steel wire ropes in suspension bridges. NDT E Int. 2015, 75, 80–86. [Google Scholar] [CrossRef]
- Christen, R.; Bergamini, A.; Motavalli, M. Influence of steel wrapping on magneto-inductive testing of the main cables of suspension bridges. NDT E Int. 2009, 42, 22–27. [Google Scholar] [CrossRef]
- Cao, Y.N.; Zhang, D.L.; Xu, D.G. The state-of-art of quantitative testing of wire rope. Nondestruct. Test. 2005, 27, 91–95. [Google Scholar]
- Li, D.; Yang, W.; Zhang, W. Cluster analysis of stress corrosion mechanisms for steel wires used in bridge cables through acoustic emission particle swarm optimization. Ultrason. 2017, 77, 22–31. [Google Scholar] [CrossRef]
- Neslušan, M.; Bahleda, F.; Minárik, P.; Zgútová, K.; Jambor, M. Non-destructive monitoring of corrosion extent in steel rope wires via Barkhausen noise emission. J. Magn. Magn. Mater. 2019, 484, 179–187. [Google Scholar] [CrossRef]
- Jiles, D. Introduction to Magnetism and Magnetic Materials, 3rd ed.; Taylor & Francis Group: New York, NY, USA, 2016. [Google Scholar]
- Chikazumi, S. Physics of Ferromagnetism, 2nd ed.; Oxford University Press: Oxford, UK, 2005. [Google Scholar]
- Liu, J.; Tian, G.Y.; Gao, B.; Zeng, K.; Zheng, Y.; Chen, J. Micro-macro characteristics between domain wall motion and magnetic Barkhausen noise under tensile stress. J. Magn. Magn. Mater. 2020, 493, 165719. [Google Scholar] [CrossRef]
- Sorsa, A.; Santa-Aho, S.; Wartiainen, J.; Suominen, L.; Vippola, M.; Leiviskä, K. Effect of Shot Peening Parameters to Residual Stress Profiles and Barkhausen Noise. J. Nondestruct. Eval. 2018, 37, 10. [Google Scholar] [CrossRef] [Green Version]
- Kypris, O.; Nlebedim, I.C.; Jiles, D.C. Measuring stress variation with depth using Barkhausen signals. J. Magn. Magn. Mater. 2016, 407, 377–395. [Google Scholar] [CrossRef]
- Cullity, B.D.; Graham, C.D. Introduction to Magnetic Materials, 2nd ed.; John Wiley & Sons: Hoboken, NJ, USA, 2011. [Google Scholar]
- Neslušan, M.; Minárik, P.; Čilliková, M.; Kolařík, K.; Rubešová, K. Barkhausen noise emission in tool steel X210Cr12 after semi-solid processing. Mater. Charact. 2019, 157, 109891. [Google Scholar] [CrossRef]
- Gatelier-Rothea, C.; Chicois, J.; Fougeres, R.; Fleischmann, P. Characterization of pure iron and (130 p.p.m.) carbon–iron binary alloy by Barkhausen noise measurements: Study of the influence of stress and microstructure. Acta Mater. 1998, 46, 4873–4882. [Google Scholar] [CrossRef]
- Ktena, A.; Hristoforou, E.; Gerhardt, G.J.L.; Missell, F.P.; Landgraf, F.J.G.; Rodrigues, D.L.; Alberteris-Campos, M. Barkhausen noise as a microstructure characterization tool. Phys. B Condens. Matter 2014, 435, 109–112. [Google Scholar] [CrossRef]
- Pitoňák, M.; Neslušan, M.; Minárik, P.; Čapek, J.; Zgútová, K.; Jurkovič, M.; Kalina, T. Investigation of Magnetic Anisotropy and Barkhausen Noise Asymmetry Resulting from Uniaxial Plastic Deformation of Steel S235. Appl. Sci. 2021, 11, 3600. [Google Scholar] [CrossRef]
- Deng, Y.; Li, Z.; Chen, J.; Qi, X. The effects of the structure characteristics on Magnetic Barkhausen noise in commercial steels. J. Magn. Magn. Mater. 2018, 451, 276–282. [Google Scholar] [CrossRef]
- Zgútová, K.; Pitoňák, M. Attenuation of Barkhausen Noise Emission due to Variable Coating Thickness. Coatings 2021, 11, 263. [Google Scholar] [CrossRef]
- Minárik, P. EBSD Observation of Low Alloyed Steels of Variable Yield Strength; Charles University: Prague, Czech Republic, 2021. [Google Scholar]
- STN EN ISO 9227 Corrosion Tests in Artificial Atmospheres—Salt SprayTests, 4th ed.; Slovak Technical Standard: Bratislava, Slovakia, 2017; p. 180.
- Varga, R. Domain Walls and Their Dynamics, 1st ed.; Pavol Jozef Šafárik University: Košice, Slovakia, 2014. [Google Scholar]
- Bayramoglu, S.; Gür, C.H.; Alexandrov, I.V.; Abramova, M.M. Characterization of ultra-fine grained steel samples produced by high pressure torsion via magnetic Barkhausen noise analysis. Mater. Sci. Eng. A 2010, 527, 927–933. [Google Scholar] [CrossRef]
- Sakamoto, H.; Okada, M.; Homma, M. Theoretical analysis of Barkhausen noise in carbon steels. IEEE Trans. Magn. 1987, 23, 2236–2238. [Google Scholar] [CrossRef]
- Vashista, M.; Moorthy, V. On the shape of the magnetic Barkhausen noise profile for better revelation of the effect of microstructures on the magnetisation process in ferritic steels. J. Magn. Magn. Mater. 2015, 393, 584–592. [Google Scholar] [CrossRef] [Green Version]
- Yamaura, S.; Furuya, Y.; Watanabe, T. The effect of grain boundary microstructure on Barkhausen noise in ferromagnetic materials. Acta Mater. 2001, 49, 3019–3027. [Google Scholar] [CrossRef]
- Zgútová, K.; Neslušan, M.; Kolářik, K.; Šrámek, J. Non-destructive evaluation of stress state of the highway bridge via Barkhausen noise technique. In Proceedings of the 7th International Conference on Mechanics and Materials in Design, Albufeira, Portugal, 11–15 June 2017. [Google Scholar]
- Neslušan, M.; Bahleda, F.; Moravčík, M.; Zgútová, K.; Pastorek, F. Assessment of Tendon Prestressing after Long-Term Service via the Barkhausen Noise Technique. Materials 2019, 12, 3450. [Google Scholar] [CrossRef] [PubMed] [Green Version]
Figure 1.
Microstructural images of investigated steels. (a) S235, (b) MC700, (c) MC1100.

Figure 2.
Images of corroded surface. (a) S235—1 day, (b) MC700—1 day, (c) MC1100—1 day, (d) S235—11 days, (e) MC700—11 days, (f) MC1100—11 days, (g) S 235—27 days, (h) MC700—27 days, (i) MC1100—27 days, (j) S235—69 days, (k) MC700—69 days, (l) MC1100—69 days.
Figure 2.
Images of corroded surface. (a) S235—1 day, (b) MC700—1 day, (c) MC1100—1 day, (d) S235—11 days, (e) MC700—11 days, (f) MC1100—11 days, (g) S 235—27 days, (h) MC700—27 days, (i) MC1100—27 days, (j) S235—69 days, (k) MC700—69 days, (l) MC1100—69 days.

Figure 3.
Cross sectional metallographic images of corroded, RD. (a) S235—1 day, (b) MC700—1 day, (c) MC1100—1 day, (d) S235—11 days, (e) MC700—11 days, (f) MC1100—11 days, (g) S 235—27 days, (h) MC700—27 days, (i) MC1100—27 days, (j) S235—69 days, (k) MC700—69 days, (l) MC1100—69 days.
Figure 3.
Cross sectional metallographic images of corroded, RD. (a) S235—1 day, (b) MC700—1 day, (c) MC1100—1 day, (d) S235—11 days, (e) MC700—11 days, (f) MC1100—11 days, (g) S 235—27 days, (h) MC700—27 days, (i) MC1100—27 days, (j) S235—69 days, (k) MC700—69 days, (l) MC1100—69 days.

Figure 4.
Evolution of the thickness of the corroded layer.

Figure 5.
Evolution of MBN (rms) along the days in the chamber. (a) RD, (b) TD.

Figure 6.
Optical images of surface of MC700 steels.

Figure 7.
MBN envelopes. (a) 1 day in the chamber-RD, (b) S235-RD.

Figure 8.
Evolution of PP along the days in the chamber. (a) RD, (b) TD.

Figure 9.
Evolution of FWHM along the days in the chamber. (a) RD, (b) TD.

Figure 10.
Thickness of corroded layers versus MBN (rms). (a) RD, (b) TD.

Figure 11.
Thickness of corroded layers versus FWHM. (a) RD, (b) TD.


Table 1.
Chemical composition of investigated steels in wt%.
| Yield Strength (MPa) | Trade Mark | Fe | C | Mn | Si | P | S | Al | Nb + Ti |
|---|---|---|---|---|---|---|---|---|---|
| 235 | S235 | bal. | 0.22 | 1.6 | 0.05 | 0.05 | 0.05 | - | - |
| 700 | MC700 | bal. | 0.05 | 1.8 | 0.02 | 0.01 | 0.002 | 0.034 | 0.21 |
| 1100 | MC1100 | bal. | 0.15 | 1.8 | 0.5 | 0.02 | 0.005 | 0.15 | - |
Table 2.
Number of days in the chamber.
| 1 | 2 | 4 | 6 | 8 | 11 | 14 | 18 | 22 | 27 | 34 | 41 | 48 | 55 | 61 | 69 |
Publisher’s Note: MDPI stays neutral with regard to jurisdictional claims in published maps and institutional affiliations. |
© 2021 by the authors. Licensee MDPI, Basel, Switzerland. This article is an open access article distributed under the terms and conditions of the Creative Commons Attribution (CC BY) license (https://creativecommons.org/licenses/by/4.0/).
Share and Cite
MDPI and ACS Style
Pastorek, F.; Decký, M.; Neslušan, M.; Pitoňák, M. Usage of Barkhausen Noise for Assessment of Corrosion Damage on Different Low Alloyed Steels. Appl. Sci. 2021, 11, 10646. https://0-doi-org.brum.beds.ac.uk/10.3390/app112210646
AMA Style
Pastorek F, Decký M, Neslušan M, Pitoňák M. Usage of Barkhausen Noise for Assessment of Corrosion Damage on Different Low Alloyed Steels. Applied Sciences. 2021; 11(22):10646. https://0-doi-org.brum.beds.ac.uk/10.3390/app112210646
Chicago/Turabian StylePastorek, Filip, Martin Decký, Miroslav Neslušan, and Martin Pitoňák. 2021. "Usage of Barkhausen Noise for Assessment of Corrosion Damage on Different Low Alloyed Steels" Applied Sciences 11, no. 22: 10646. https://0-doi-org.brum.beds.ac.uk/10.3390/app112210646
Note that from the first issue of 2016, this journal uses article numbers instead of page numbers. See further details here.