
Evaluation of the Ultimate Strength of the Ultra-High-Performance Fiber-Reinforced Concrete Beams


Abstract
:1. Introduction
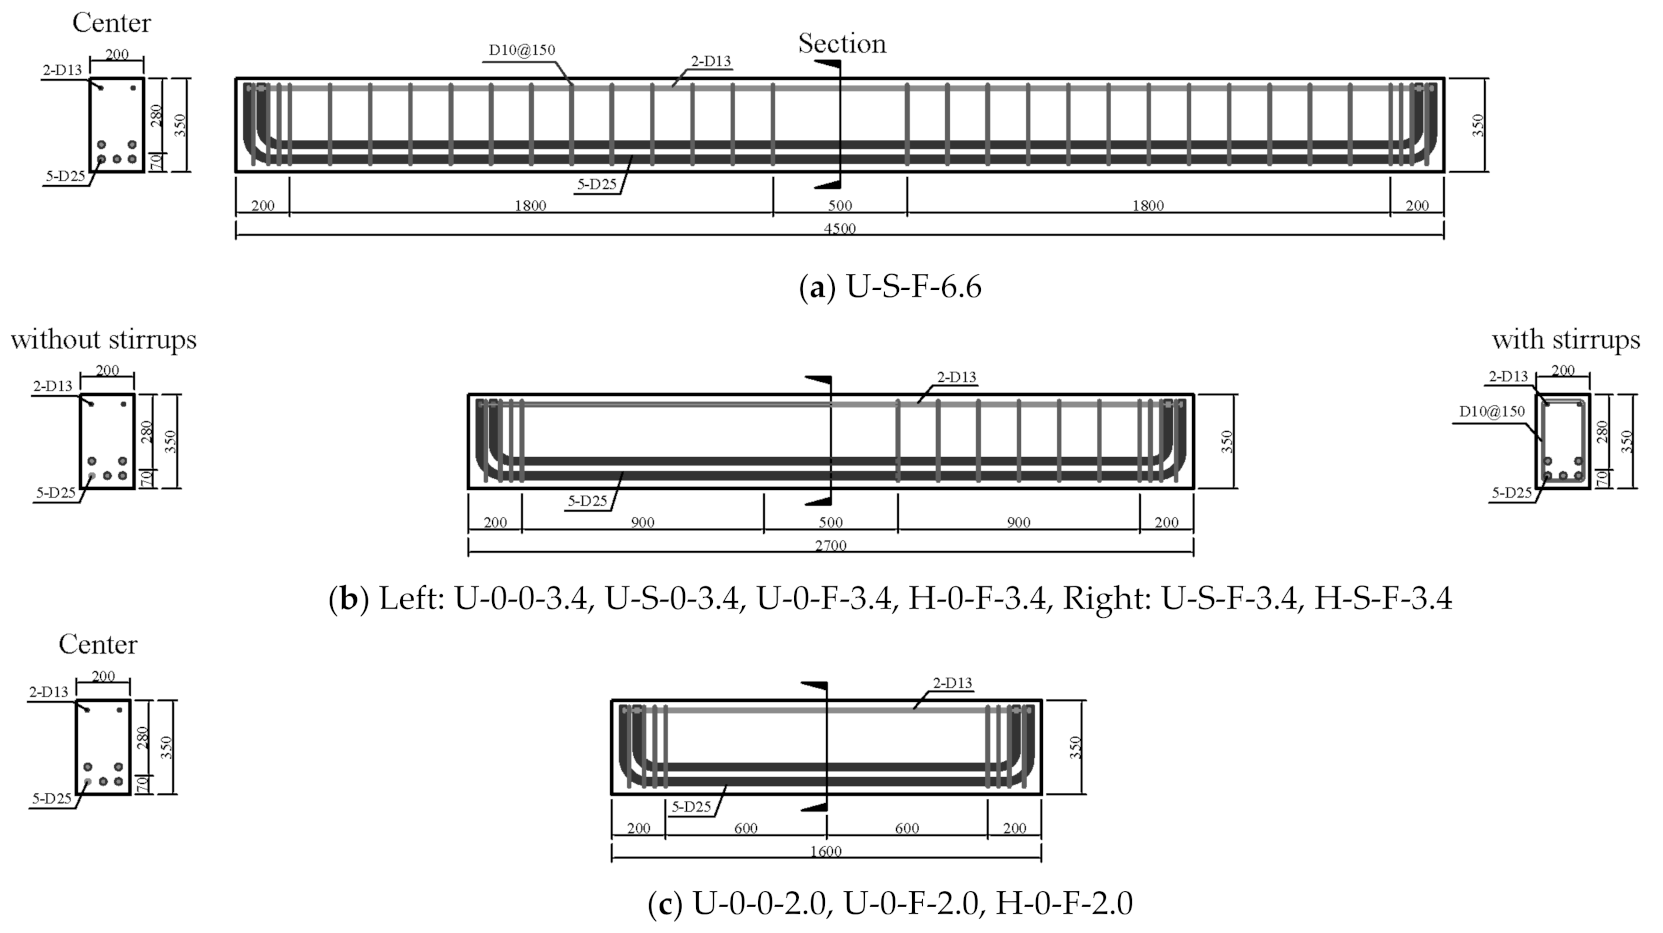
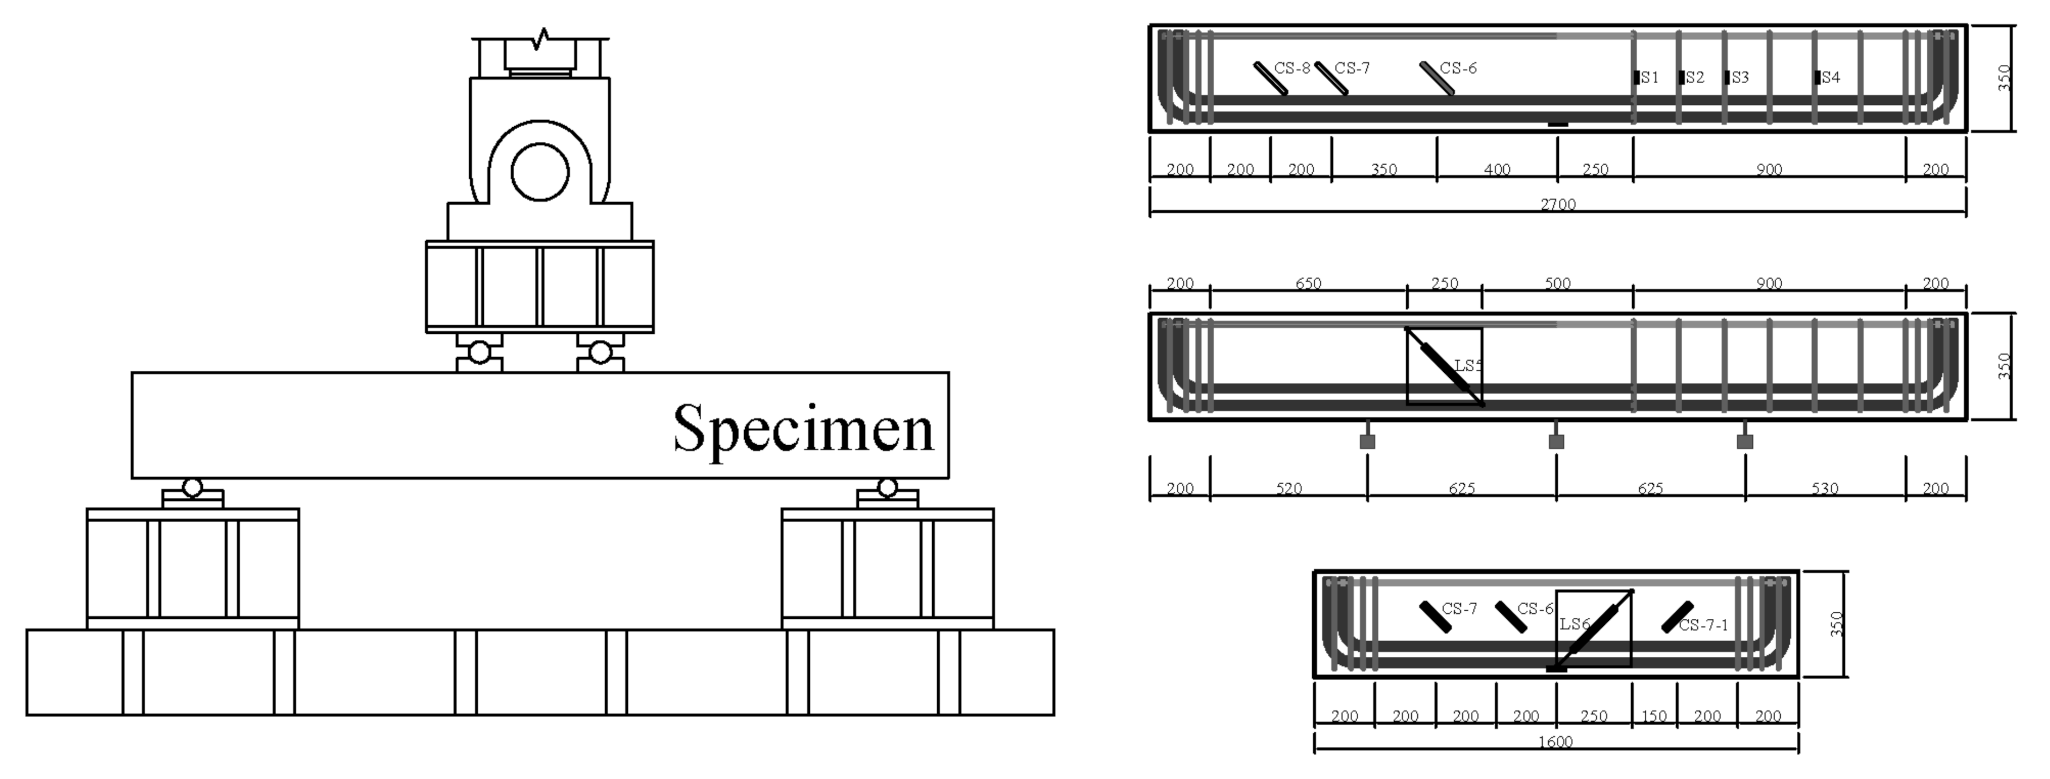
2. Test Program
2.1. Variables
2.2. Materials
3. Test Results
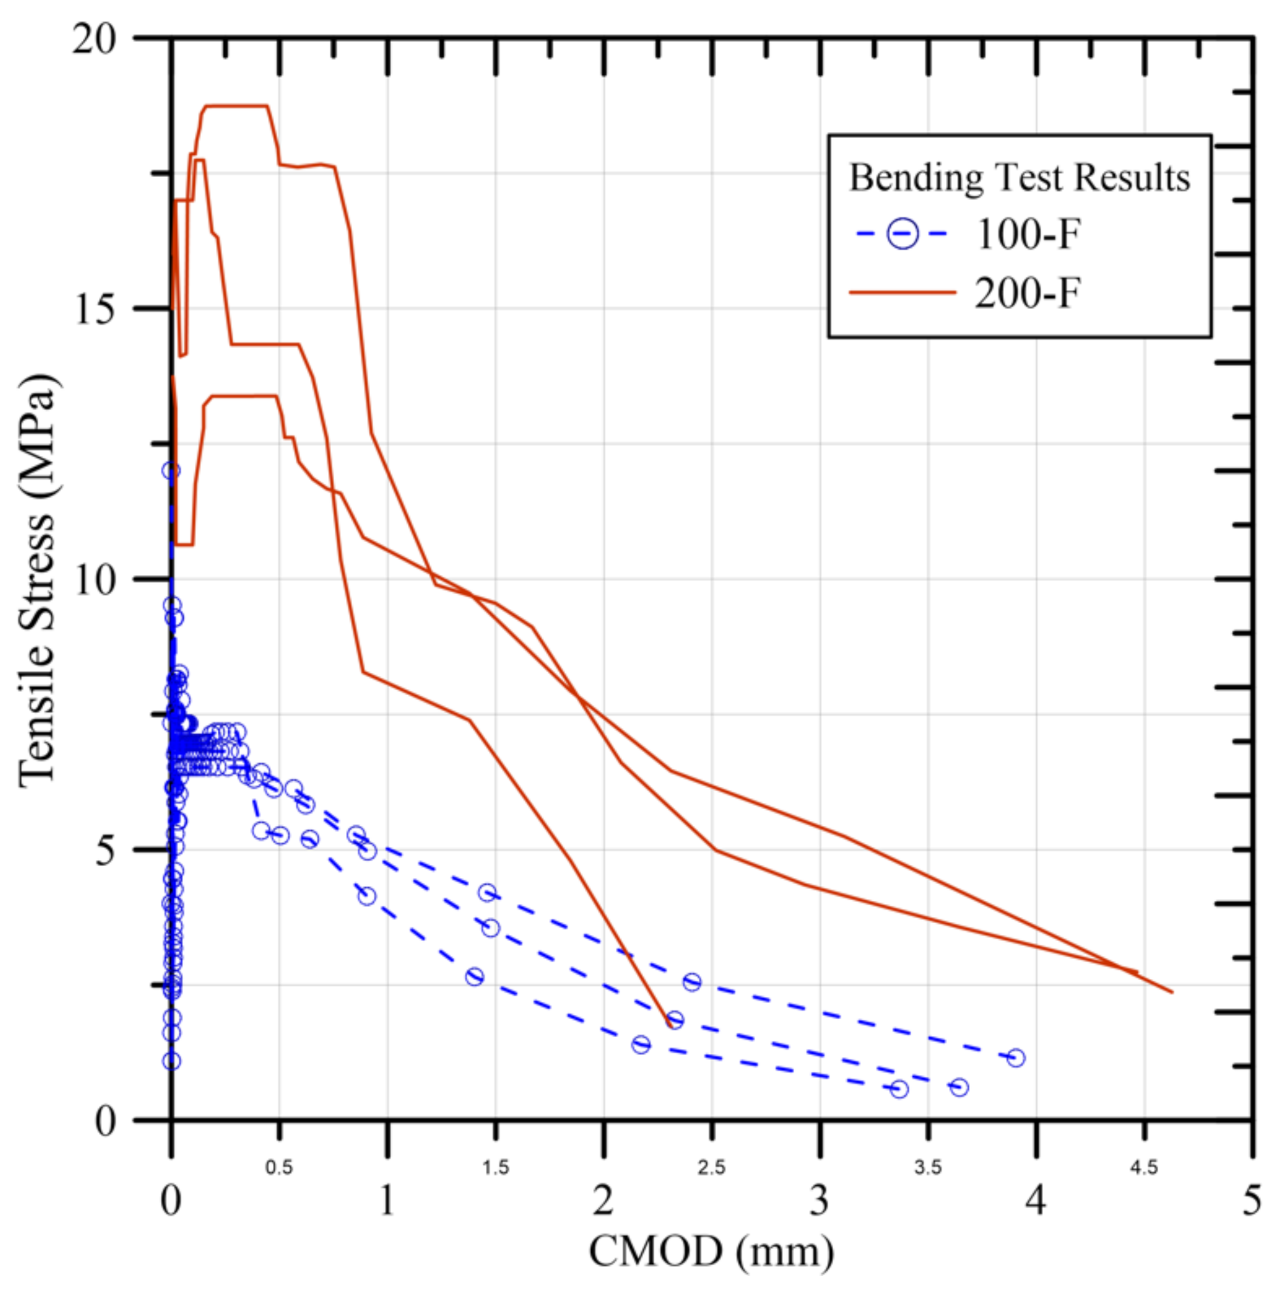
3.1. Properties of Materials
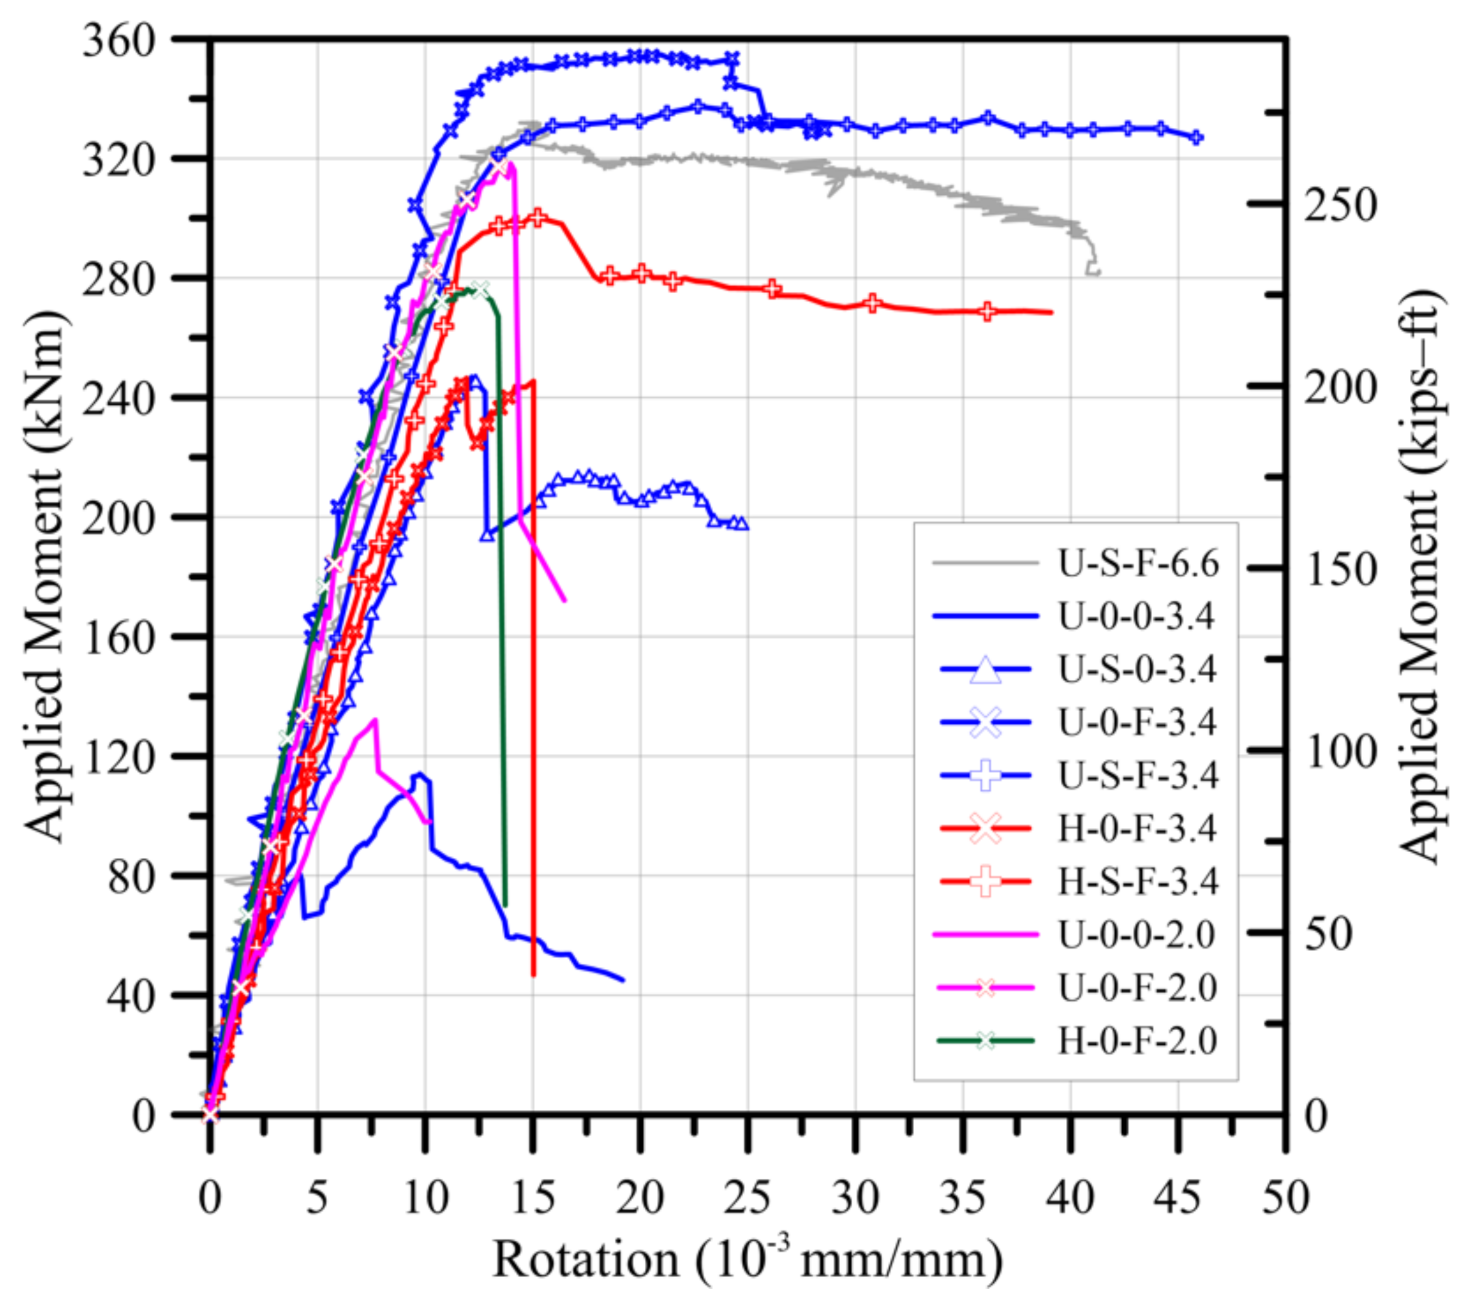
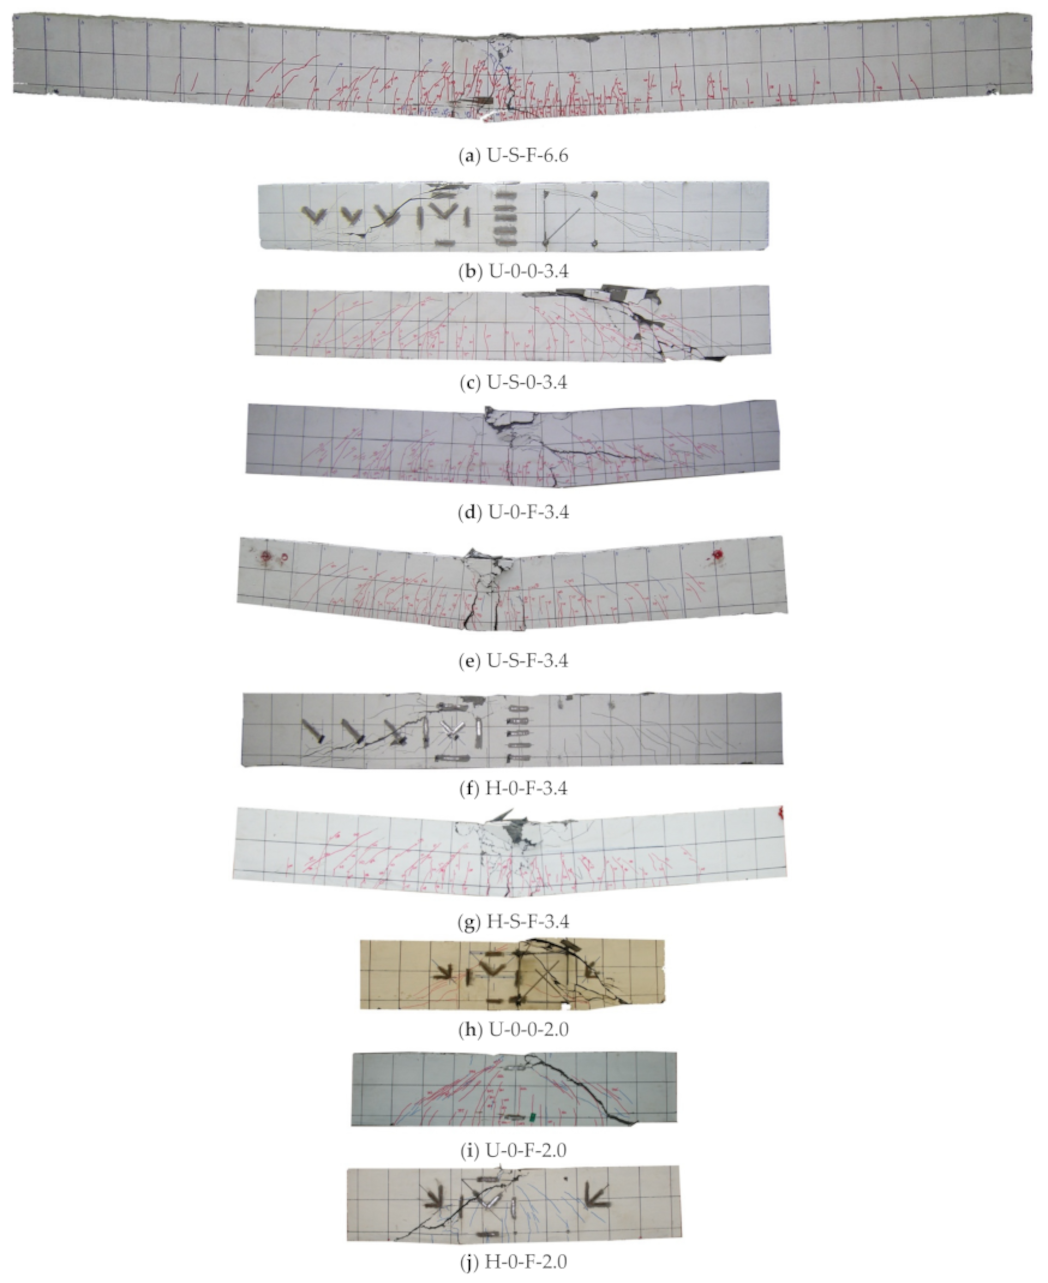
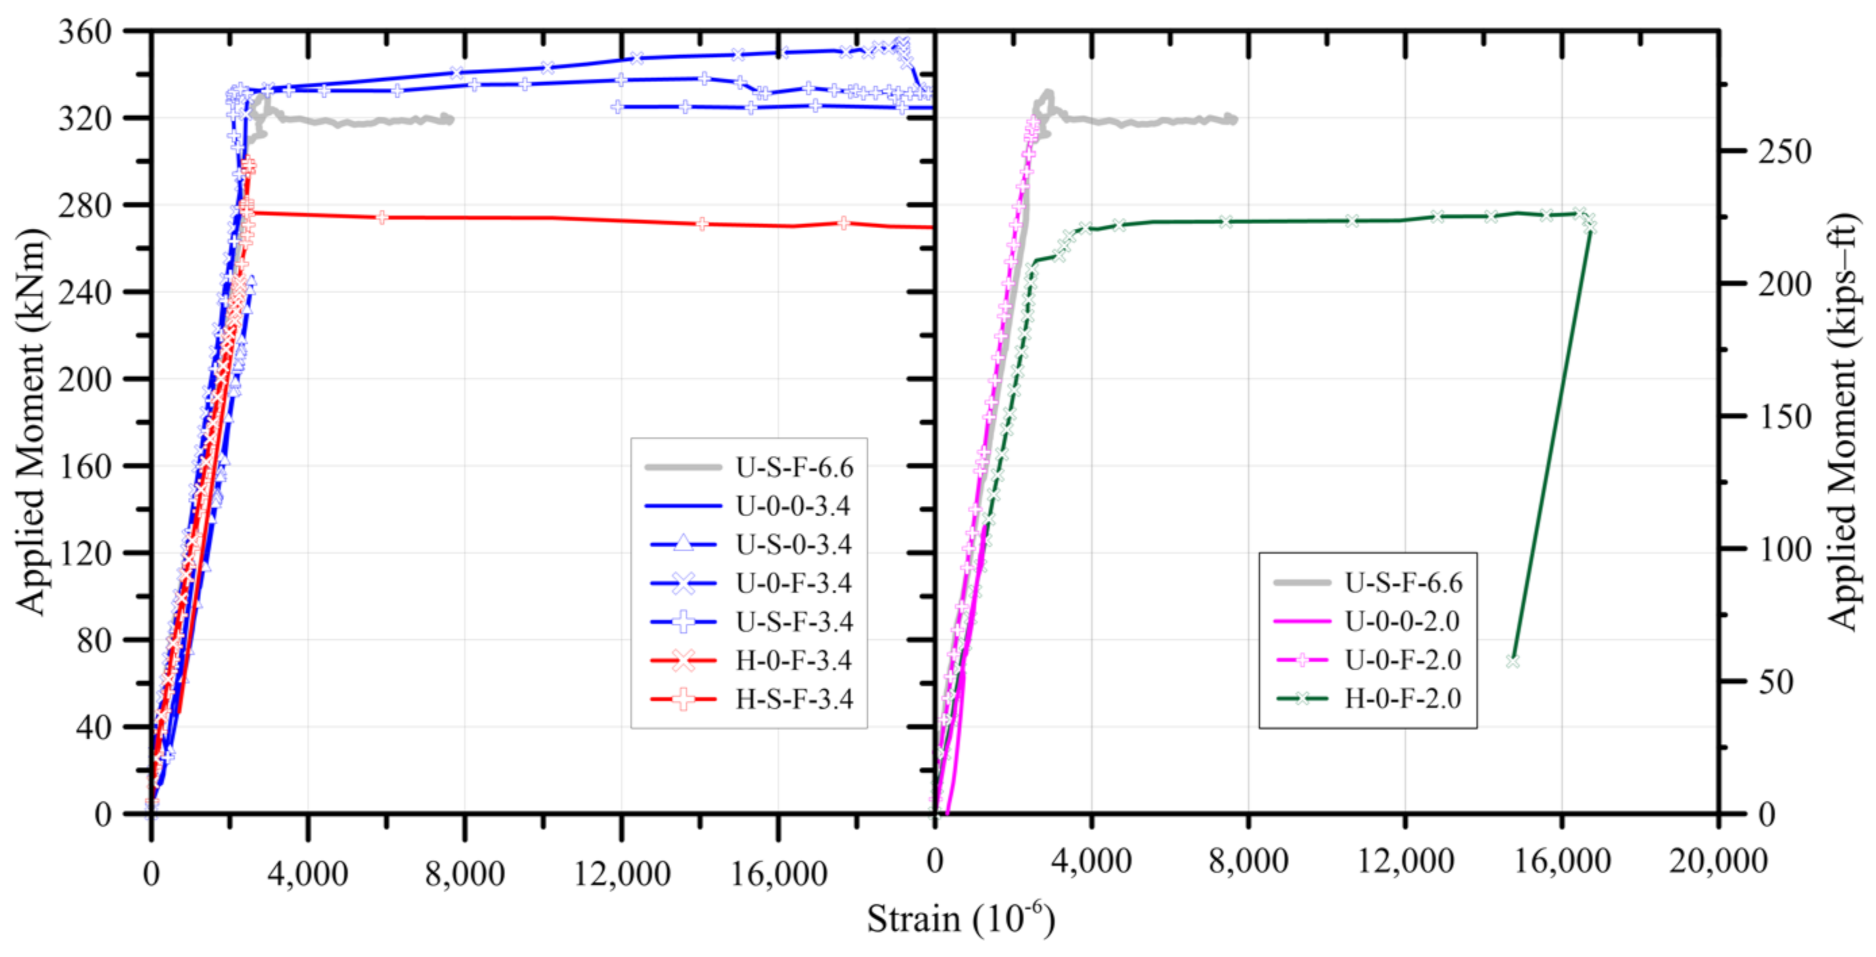
3.2. Moment-Rotation Relation and Crack Pattern
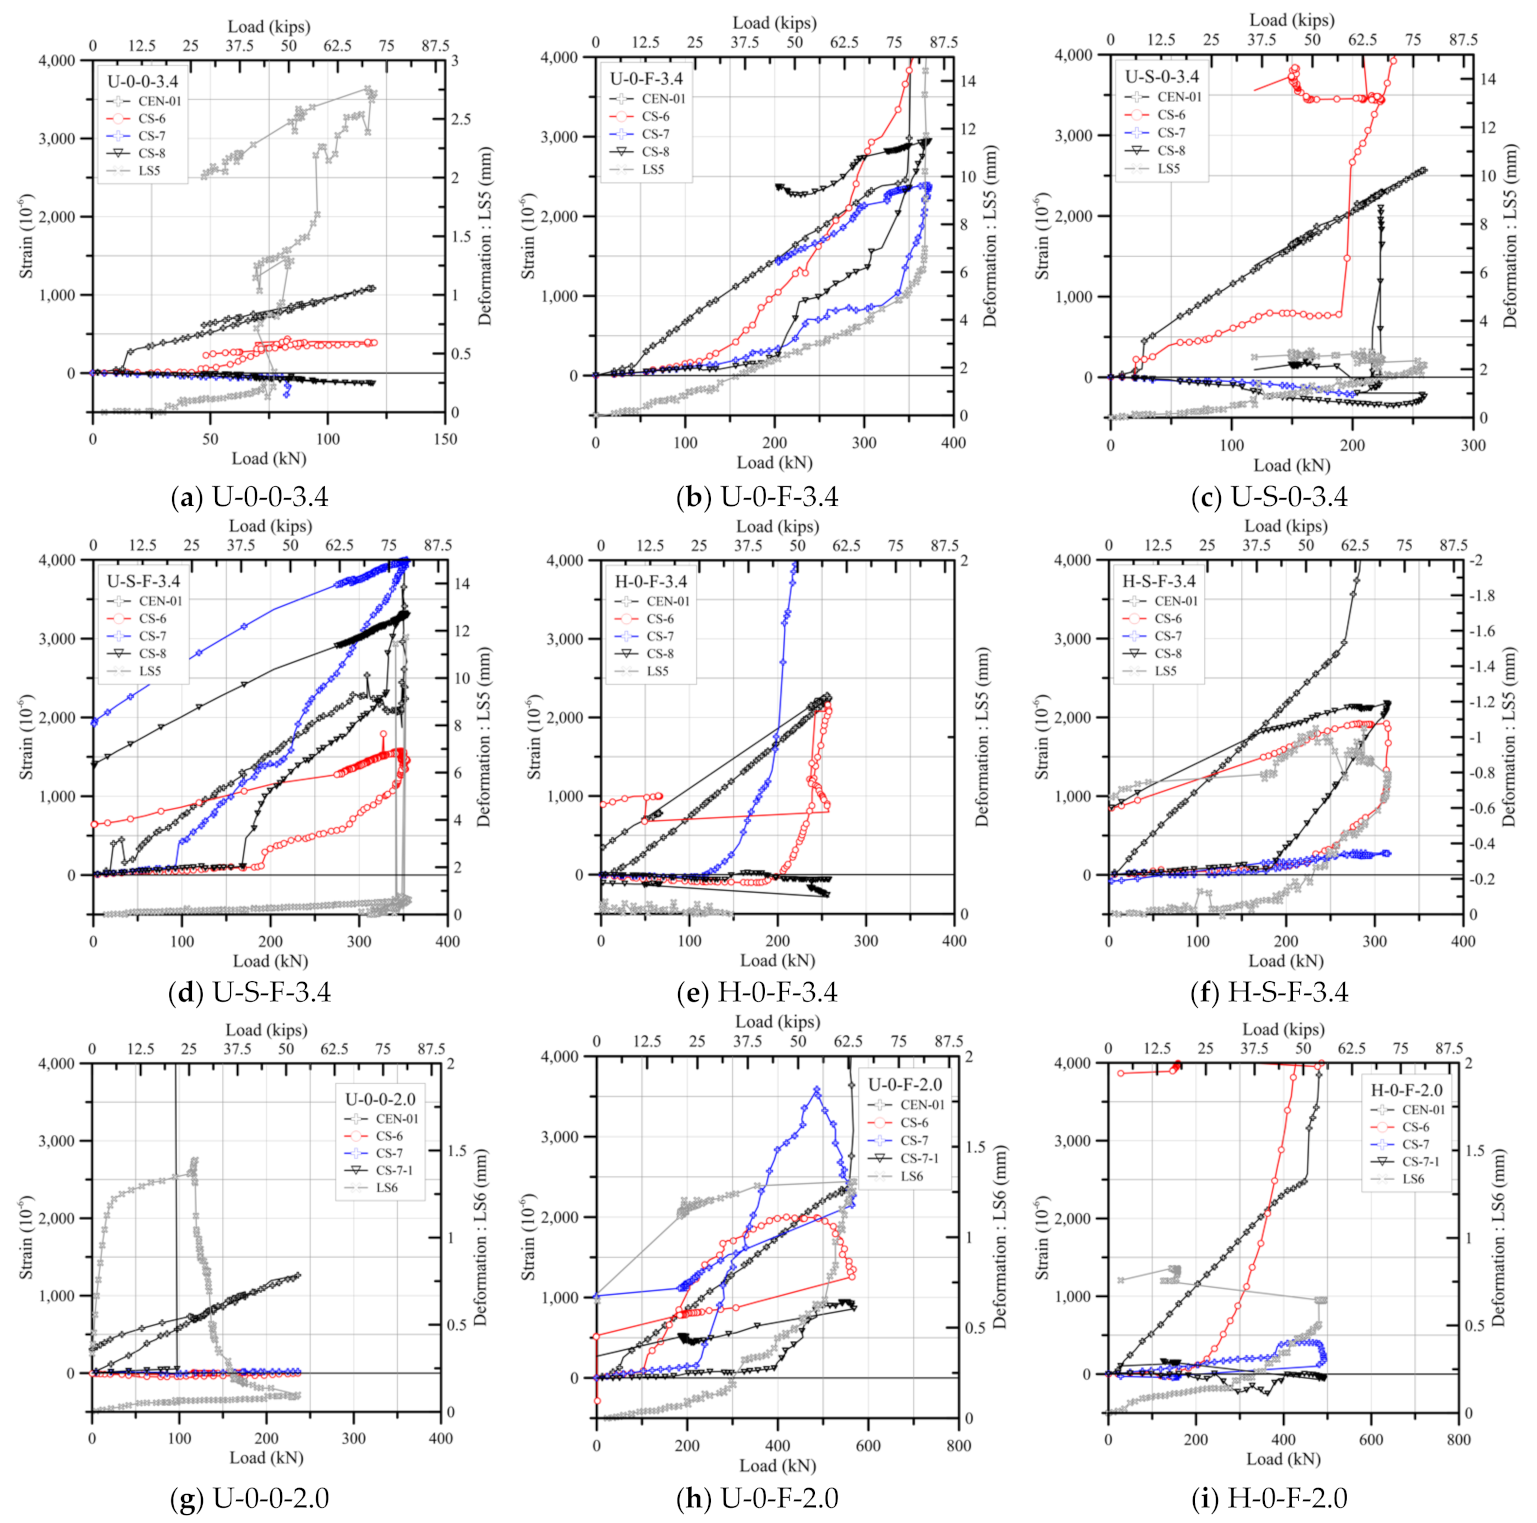
3.3. Strain Distribution and Failure Mode of Test Specimens
3.4. Diagonal Shear Cracking Strength
4. Evaluation of Test Specimens with UHPRC Design Recommendations
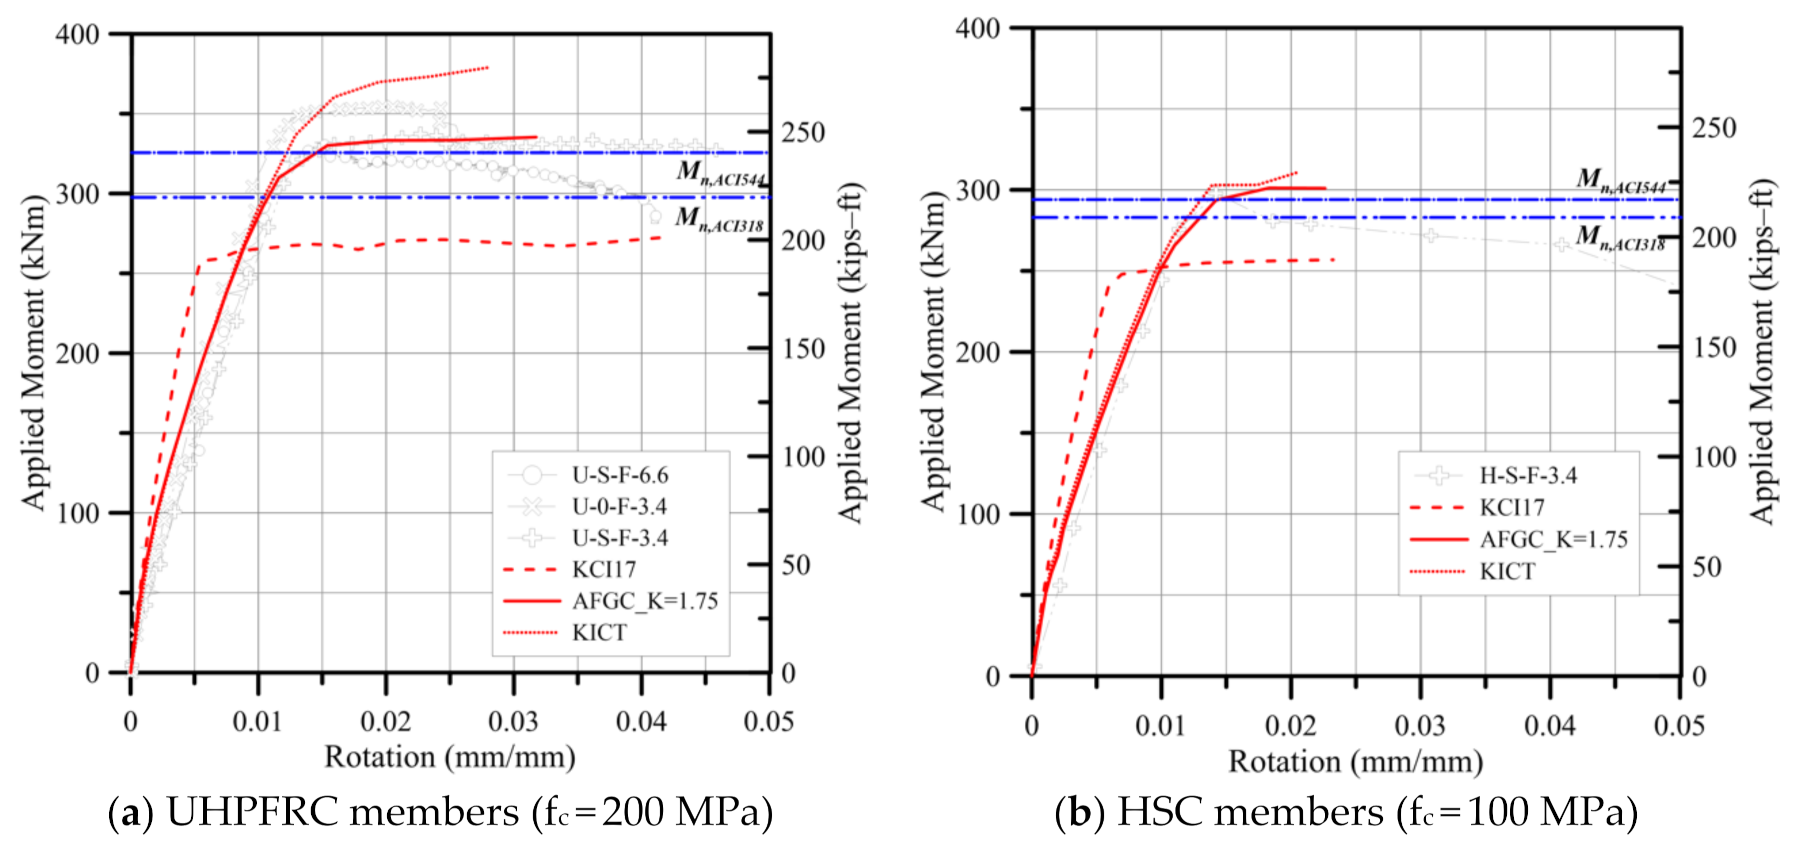
4.1. Flexural Strength Evaluation
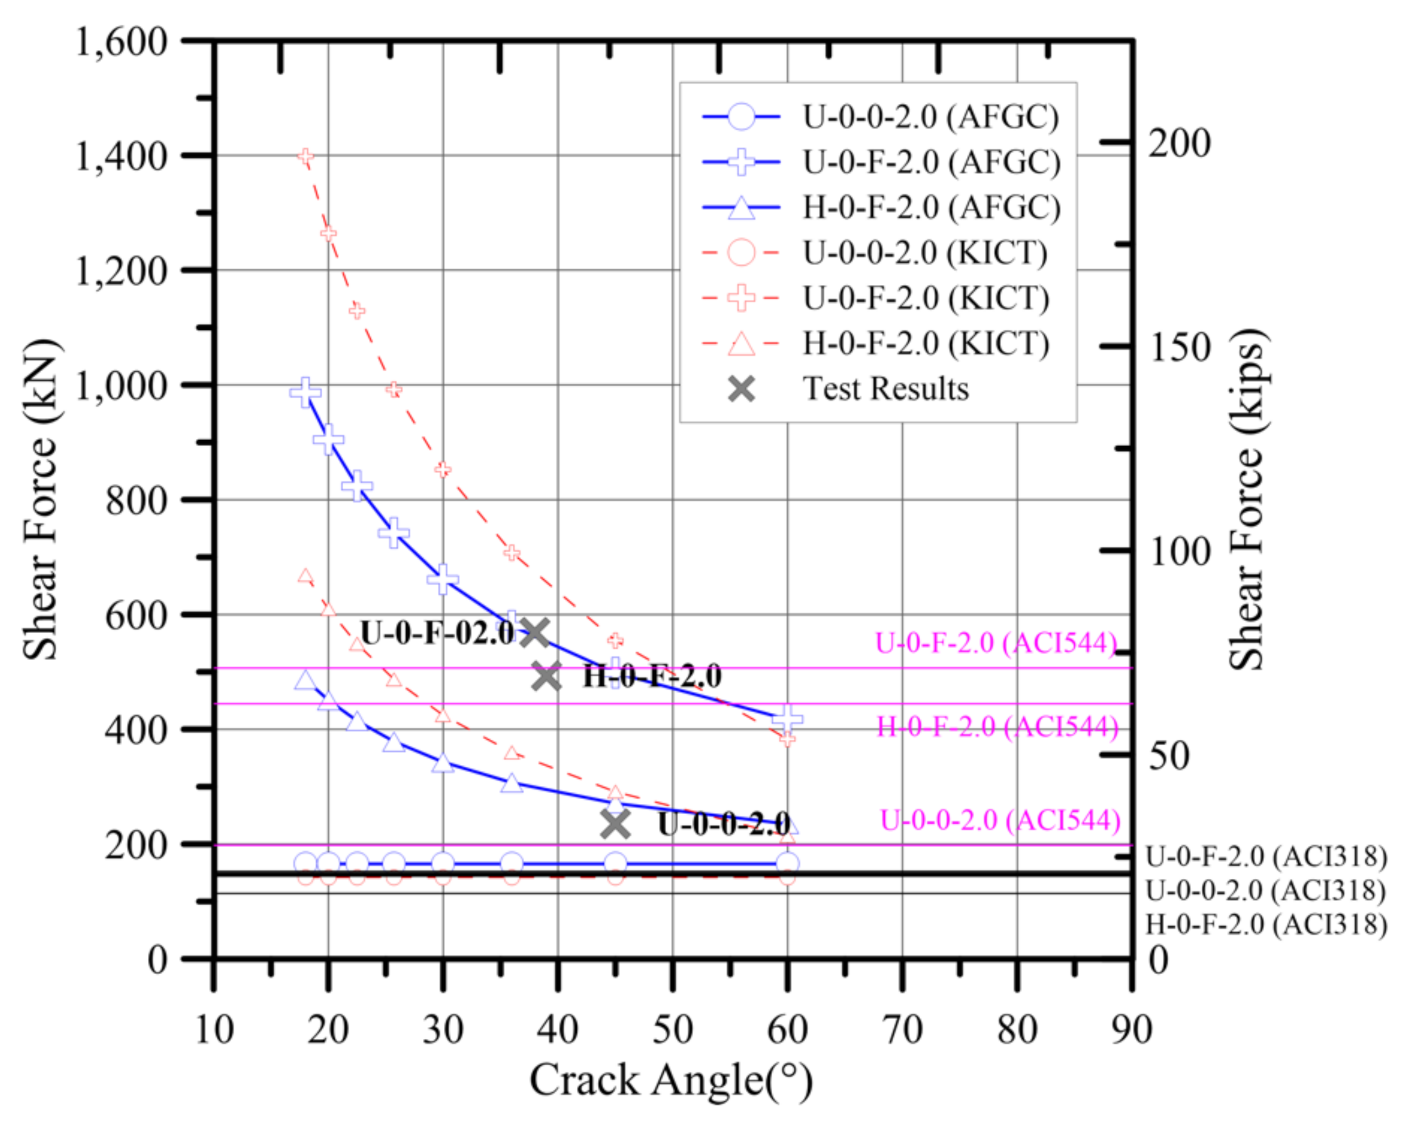
4.2. Shear Strength Evaluation
5. Conclusions
- The ultra-high strength concrete without steel fiber showed a shear failure. However, in specimens reinforced with steel fiber, the appearance and spread of diagonal cracks were observed. However, shear failure caused by the widening of the diagonal shear crack did not occur. It means that 2% volume fraction of steel fiber could change the mode of failure of beams. Moreover, it was found that the diagonal shear cracking strength could be increased by 95% when reinforced with 2% volume fiber of steel fiber.
- The comparison of shear strength of H-0-F-3.4 and U-0-F-3.4 was impossible because the final failure mode of U-0-F-3.4 was a flexural failure. Therefore, as compressive strength increased with 100 MPa, shear strength at least 40% increased. This phenomenon was observed in the diagonal shear cracking strength.
- When the steel fiber was included, the diagonal crack’s angle was lower than that of the case where the steel fiber was not used. Therefore, it was considered that the effective area of the steel fiber became larger, and the shear reinforcing effect of the steel fiber became larger. The decrease of the shear span to depth ratio showed a significant increase in the shear strength because the compressive strength of diagonal compressive struts increases significantly. Dispersion of splitting cracking of diagonal compressive strut delayed the failure and increased shear strength.
- As a result of evaluating the UHPFRC design guideline’s applicability in France and Korea, AFGC showed a conservative evaluation for both flexure and shear. KICT underestimates flexure strength. However, it overestimated the shear strength. Both design recommendations did not consider the increase in shear strength due to the decrease of shear span to depth ratio unless the change in crack angle to shear strength contribution of steel fiber was considered. Thus, each design recommendation had a large conservatism at short shear span to depth ratio specimens. As a result of examining the shear strength of U-0-F-2.0, AFGC showed high accuracy when reflecting crack angle and KICT underestimated shear strength. This is because, as described above, the material used in this study was a strain-softening material, and the enhancement rate of the tensile strength itself was lower than that of the material used in the KICT.
- When the design stress-strain relation of the design recommendation was followed, the flexural behavior was presumed to have a significantly lower ductility ratio than the actual flexural behavior. Therefore, a study on the ultimate strain in the compression fiber proposed by the design recommendation in the flexural design should be added. A study on the ductility ratio of the member should be added.
- The two design recommendations for shear design consist of the sum of the shear strength contributions of concrete, steel fiber, and shear reinforcement. Since the contribution of concrete was not influenced by the present shear span to depth ratio, an additional experiment should be carried out using the shear span to depth ratio and the amount of steel fiber as a variable in the beam using UHPC, which is not reinforced with steel fiber.
- Model code which did not consider the inclusion effect of steel fiber underestimated flexural and shear strength of UHPFRC. However, model code overestimated the shear strength of the test specimens without steel fiber. Therefore, it should be carefully used for the design of UHPFRC.
Author Contributions
Funding
Institutional Review Board Statement
Informed Consent Statement
Data Availability Statement
Conflicts of Interest
References
- ACI (American Concrete Institute). ACI 544.4R-88: Design Considerations for Steel Fiber Reinforced Concrete; American Concrete Institute: Farmington Hills, MI, USA, 2009. [Google Scholar]
- ACI (American Concrete Institute). ACI 318-19: Building Code Requirements for Structural Concrete (ACI 318-19) Commentary on Building Code Requirements for Structural Concrete (ACI318R-19); American Concrete Institute: Farmington Hills, MI, USA, 2019. [Google Scholar]
- FIB (International Federation for Structural Concrete). FIB Model Code for Concrete Structures 2010; Ernst & Sohn: Lausanne, Switzerland, 2013. [Google Scholar]
- Richard, P.; Cheyrezy, M. Composition of reactive powder concretes. Cem. Concr. Res. 1995, 25, 1501–1511. [Google Scholar] [CrossRef]
- AFGC (Association Française de Génie Civil). Interim Recommendations. In Ultra High Performance Fibre Reinforced Concretes; Association Française de Génie Civil: Paris, France, 2013. [Google Scholar]
- Graybeal, B.A. Flexural behaviour of Ultra high performance concrete I-girder. J. Bridge Eng. 2008, 13, 602–610. [Google Scholar] [CrossRef]
- Yang, I.H.; Joh, C.; Kim, B.S. Structural behavior of ultra-high performance concrete beams subjected to bending. Eng. Struct. 2010, 32, 3478. [Google Scholar] [CrossRef]
- Yoo, D.Y.; Yoon, Y.S. Structural performance of ultra high performance concrete beams with different steel fibres. Eng. Struct. 2015, 10, 409–423. [Google Scholar] [CrossRef]
- Graybeal, B.A. Material Property Characterization of Ultra-High Performance Concrete; Rep. No. FHWA-HRT-06-103; Federal Highway Administration: Washington, DC, USA, 2006. [Google Scholar]
- Voo, Y.L.; Poon, W.K.; Foster, S.J. Shear strength of steel fiber-reinforced ultrahigh-performance concrete beams without stirrups. J. Struct. Eng. 2010, 136, 1393–1400. [Google Scholar] [CrossRef]
- Xia, J.; Mackie, K.R.; Saleem, M.A.; Mirmiran, A. Shear failure analysis on ultra-high performance concrete beams reinforced with high strength steel. Eng. Struct. 2011, 33, 3597–3609. [Google Scholar] [CrossRef]
- Baby, F.; Marchand, P.; Toutlemonde, F. Shear behavior of ultrahigh performance fiber-reinforced concrete beams. I: Experimental investigation. J. Struct. Eng. 2013, 140, 04013111. [Google Scholar] [CrossRef]
- Korea Concrete Institute. Design Guidelines for K-UHPC, KCI-M-12-003; Korea Concrete Institute: Seoul, Korea, 2012. [Google Scholar]
- KS (Korean Standard). KS B 0802. In Method of Tensile Test for Metallic Materials; Korean Standard Information Center: Seoul, Korea, 2013. [Google Scholar]
- KS (Korean Standard). KS F 2405. In Standard Test Method for Compressive Strength of Concrete; Korean Standard Information Center: Seoul, Korea, 2010. [Google Scholar]
- KS (Korean Standard). KS F 2423. In Method of Test for Splitting Tensile Strength of Concrete; Korean Standard Information Center: Seoul, Korea, 2011. [Google Scholar]
- JCI (Japan Concrete Institute). JCI-S-001. In Method of Test for Fracture Energy of Concrete by Use of Notched Beam; Japan Concrete Institute: Tokyo, Japan, 2003. [Google Scholar]
- Sharma, A.K. Shear strength of steel fiber reinforced concrete beams. ACI J. Proceeding 1986, 83, 624–628. [Google Scholar]
- KCI. KCI Model Code 2017 (KCI M-18-006); Kimoondang Publishing Company, Korea Concrete Institute (KCI): Seoul, Korea, 2017. (In Korean) [Google Scholar]
- Park, R.; Paulay, T. Reinforced Concrete Structures; John Wiley & Sons, Inc.: New York, NY, USA, 1975. [Google Scholar]


| Specimens | a/d | Concrete | Transverse Steel | Fiber | ||||
|---|---|---|---|---|---|---|---|---|
| s | ||||||||
| (MPa) | (mm) | (mm) | (MPa) | (%) | (mm) | |||
| U-S-F-6.6 | 6.6 | 217 | 9.5 | 150 | 422 | 2 | 13 | 0.2 |
| U-0-0-3.4 | 3.4 | 198 | - | 0 | - | - | ||
| U-S-0-3.4 | 198 | 150 | 0 | |||||
| U-0-F-3.4 | 217 | - | 2 | 13 | 0.2 | |||
| U-S-F-3.4 | 217 | 150 | 2 | |||||
| H-0-F-3.4 | 117 | - | 2 | |||||
| H-S-F-3.4 | 117 | 150 | 2 | |||||
| U-0-0-2.0 | 2.0 | 198 | - | 0 | ||||
| U-0-F-2.0 | 217 | - | 2 | 13 | 0.2 | |||
| H-0-F-2.0 | 117 | - | 2 | |||||
| ID | W/B (%) | C | W | SF | S | Fi | F | SP |
|---|---|---|---|---|---|---|---|---|
| Unit Weight (kg/m3) | ||||||||
| 200-0 | 0.17 | 830 | 176 | 207 | 912 | 246 | 147 | 1.08 |
| 200-F | 0.17 | 830 | 176 | 207 | 912 | 246 | 0 | 1.08 |
| 100-F | 0.25 | 809 | 222 | 80 | 1052 | 162 | 147 | 1 |
| ID | Vf (%) | Ec | fc’ | fsp | ft |
|---|---|---|---|---|---|
| (MPa) | |||||
| 200-0 | 0 | 45,283 | 198.21 | 6.31 | - |
| 200-F | 2.0 | 49,865 | 216.52 | 11.96 | 15.48 |
| 100-F | 2.0 | 38,451 | 109.46 | 9.98 | 7.84 |
| ID | Diameter (mm) | Yield Strength (MPa) | Yield Strain | Tensile Strength (MPa) |
|---|---|---|---|---|
| D10 | 9.5 | 495.32 | 0.00260 | 614.87 |
| D13 | 12.7 | 422.56 | 0.00245 | 526.23 |
| D25 | 25.4 | 445.22 | 0.00261 | 554.87 |
| Specimens | (mm/mm) | (kNm) | (mm/mm) | (kNm) |
|---|---|---|---|---|
| U-S-F-6.6 | 0.01272 | 319.3 | 0.01488 | 331.7 |
| U-0-0-3.4 | - | - | 0.00975 | 114.0 |
| U-S-0-3.4 | - | - | 0.01233 | 245.6 |
| U-0-F-3.4 | 0.01175 | 333.4 | 0.02036 | 355.2 |
| U-S-F-3.4 | 0.01856 | 336.9 | 0.02353 | 338.8 |
| H-0-F-3.4 | - | - | 0.01192 | 246.5 |
| H-S-F-3.4 | 0.01003 | 244.5 | 0.01524 | 300.2 |
| U-0-0-2.0 | - | - | 0.00768 | 132.1 |
| U-0-F-2.0 | - | - | 0.01396 | 318.3 |
| H-0-F-2.0 | 0.00896 | 256.5 | 0.01196 | 276.2 |
| Specimens | (mm/mm) | (kNm) | (mm/mm) | (kNm) |
|---|---|---|---|---|
| U-S-F-6.6 | 0.00116 | 41.6 | 0.00341 | 102.7 |
| U-0-0-3.4 | 0.00029 | 15.1 | 0.00172 | 42.3 |
| U-S-0-3.4 | 0.00061 | 19.0 | 0.00131 | 45.7 |
| U-0-F-3.4 | 0.00121 | 42.5 | 0.00151 | 82.4 |
| U-S-F-3.4 | 0.00103 | 49.1 | 0.00306 | 88.1 |
| H-0-F-3.4 | 0.00082 | 23.2 | 0.00225 | 57.5 |
| H-S-F-3.4 | 0.00082 | 24.1 | 0.00221 | 64.2 |
| U-0-0-2.0 | 0.00054 | 18.7 | 0.00214 | 54.6 |
| U-0-F-2.0 | 0.00125 | 44.2 | 0.00418 | 129.2 |
| H-0-F-2.0 | 0.00071 | 27.7 | 0.00286 | 102.2 |
| Recommendation | Compression | Tension | Curve |
|---|---|---|---|
| AFGC | , , |  | |
| KICT | (pre-design) |  | |
| KCI | () | - |  |
| Specimens | Test | AFGC | KICT | ACI318 | ACI544 | KCI17 | |||||
|---|---|---|---|---|---|---|---|---|---|---|---|
(kNm) | (kNm) | (kNm) | (kNm) | (kNm) | (kNm) | ||||||
| U-S-F-6.6 | 331.7 | 362.8 | 0.99 | 378.9 | 0.88 | 294.8 | 1.14 | 325.6 | 1.02 | 272.5 | 1.22 |
| U-0-0-3.4 | 114.0 | 311.1 | 0.37 | 306.5 | 0.37 | 294.8 | 1.06 | 294.8 | 0.35 | 272.5 | 0.42 |
| U-S-0-3.4 | 245.6 | 311.1 | 0.79 | 306.5 | 0.80 | 294.8 | 1.06 | 294.8 | 0.75 | 272.5 | 0.90 |
| U-0-F-3.4 | 355.2 | 362.8 | 1.06 | 378.9 | 0.94 | 294.8 | 1.14 | 325.6 | 1.09 | 272.5 | 1.30 |
| U-S-F-3.4 | 338.8 | 362.8 | 1.01 | 378.9 | 0.89 | 294.8 | 1.14 | 325.6 | 1.04 | 272.5 | 1.24 |
| H-0-F-3.4 | 246.5 | 301.2 | 0.82 | 311.0 | 0.79 | 286.0 | 1.05 | 293.8 | 0.84 | 256.9 | 0.96 |
| H-S-F-3.4 | 300.2 | 301.2 | 1.00 | 311.0 | 0.97 | 286.0 | 1.05 | 293.8 | 1.02 | 256.9 | 1.17 |
| U-0-0-2.0 | 132.1 | 311.1 | 0.42 | 306.5 | 0.43 | 294.8 | 1.06 | 294.8 | 0.41 | 272.5 | 0.48 |
| U-0-F-2.0 | 318.3 | 362.8 | 0.95 | 378.9 | 0.84 | 294.8 | 1.14 | 325.6 | 0.98 | 272.5 | 1.17 |
| H-0-F-2.0 | 276.2 | 301.2 | 0.92 | 311.0 | 0.89 | 286.0 | 1.05 | 293.8 | 0.94 | 256.9 | 1.08 |
| Recommendation | Equations |
|---|---|
| AFGC | , , , , , |
| KICT | , , , , , , , |
| ACI318 | , |
| ACI544 |
| Specimens | Test | AFGC | KICT | ACI318 | ACI544 | ||||
|---|---|---|---|---|---|---|---|---|---|
(kN) | (kN) | (kN) | (kN) | (kN) | |||||
| U-S-F-6.6 | 179.7 | 599.2 | 0.30 | 221.2 | 0.81 | 269.4 | 0.67 | 409.8 | 0.44 |
| U-0-0-3.4 | 119.8 | 165.6 | 0.72 | 120.6 | 0.99 | 138.3 | 0.87 | 173.5 | 0.69 |
| U-S-0-3.4 | 259.4 | 266.3 | 0.97 | 215.8 | 1.20 | 269.6 | 0.96 | 304.7 | 0.85 |
| U-0-F-3.4 | 373.1 | 498.5 | 0.75 | 471.4 | 0.79 | 144.0 | 2.59 | 328.8 | 1.13 |
| U-S-F-3.4 | 355.9 | 599.2 | 0.59 | 566.5 | 0.63 | 275.3 | 1.29 | 460.1 | 0.77 |
| H-0-F-3.4 | 258.9 | 270.9 | 0.96 | 247.5 | 1.05 | 105.9 | 2.44 | 274.4 | 0.94 |
| H-S-F-3.4 | 315.3 | 371.7 | 0.85 | 342.6 | 0.92 | 237.2 | 1.33 | 363.7 | 0.87 |
| U-0-0-2.0 | 235.4 | 165.6 | 1.42 | 120.6 | 1.95 | 146.8 | 1.60 | 198.1 | 1.19 |
| U-0-F-2.0 | 568.4 | 498.5 | 1.14 | 471.4 | 1.21 | 152.5 | 3.73 | 506.7 | 1.12 |
| H-0-F-2.0 | 493.2 | 270.9 | 1.82 | 247.5 | 1.99 | 114.4 | 4.31 | 444.6 | 1.11 |
Publisher’s Note: MDPI stays neutral with regard to jurisdictional claims in published maps and institutional affiliations. |
© 2021 by the authors. Licensee MDPI, Basel, Switzerland. This article is an open access article distributed under the terms and conditions of the Creative Commons Attribution (CC BY) license (http://creativecommons.org/licenses/by/4.0/).
Share and Cite
Bae, B.-I.; Lee, M.-S.; Choi, C.-S.; Jung, H.-S.; Choi, H.-K. Evaluation of the Ultimate Strength of the Ultra-High-Performance Fiber-Reinforced Concrete Beams. Appl. Sci. 2021, 11, 2951. https://0-doi-org.brum.beds.ac.uk/10.3390/app11072951
Bae B-I, Lee M-S, Choi C-S, Jung H-S, Choi H-K. Evaluation of the Ultimate Strength of the Ultra-High-Performance Fiber-Reinforced Concrete Beams. Applied Sciences. 2021; 11(7):2951. https://0-doi-org.brum.beds.ac.uk/10.3390/app11072951
Chicago/Turabian StyleBae, Baek-Il, Moon-Sung Lee, Chang-Sik Choi, Hyung-Suk Jung, and Hyun-Ki Choi. 2021. "Evaluation of the Ultimate Strength of the Ultra-High-Performance Fiber-Reinforced Concrete Beams" Applied Sciences 11, no. 7: 2951. https://0-doi-org.brum.beds.ac.uk/10.3390/app11072951