
Vision-Based Pavement Marking Detection and Condition Assessment—A Case Study


1
School of Design and the Built Environment, Curtin University, Perth, WA 6102, Australia
2
School of Architecture and Built Environment, Deakin University, Melbourne, VIC 3220, Australia
3
School of Engineering, Design and Built Environment, Western Sydney University, Sydney, NSW 2115, Australia
4
School of Civil Engineering and Architecture, East China Jiao Tong University, Nanchang 330013, China
5
Australasian Joint Research Centre for Building Information Modelling, Curtin University, Perth, WA 6102, Australia
*
Authors to whom correspondence should be addressed.
Appl. Sci. 2021, 11(7), 3152; https://0-doi-org.brum.beds.ac.uk/10.3390/app11073152
Submission received: 18 February 2021
/
Revised: 25 March 2021
/
Accepted: 27 March 2021
/
Published: 1 April 2021
(This article belongs to the Special Issue BIM and Its Integration with Emerging Technologies)
Abstract
:Pavement markings constitute an effective way of conveying regulations and guidance to drivers. They constitute the most fundamental way to communicate with road users, thus, greatly contributing to ensuring safety and order on roads. However, due to the increasingly extensive traffic demand, pavement markings are subject to a series of deterioration issues (e.g., wear and tear). Markings in poor condition typically manifest as being blurred or even missing in certain places. The need for proper maintenance strategies on roadway markings, such as repainting, can only be determined based on a comprehensive understanding of their as-is worn condition. Given the fact that an efficient, automated and accurate approach to collect such condition information is lacking in practice, this study proposes a vision-based framework for pavement marking detection and condition assessment. A hybrid feature detector and a threshold-based method were used for line marking identification and classification. For each identified line marking, its worn/blurred severity level was then quantified in terms of worn percentage at a pixel level. The damage estimation results were compared to manual measurements for evaluation, indicating that the proposed method is capable of providing indicative knowledge about the as-is condition of pavement markings. This paper demonstrates the promising potential of computer vision in the infrastructure sector, in terms of implementing a wider range of managerial operations for roadway management.
1. Introduction
Pavement markings, together with signs, constitute the most fundamental way to communicate with road users and they are, in most cases, the most effective way to regulate, warn and guide traffic [1]. Such efficient communication on roads can greatly contribute to a safe and ordered traffic environment. With the aim to deliver unambiguous instructions to road users, and thereby, expect immediate responses from them, four major categories of pavement markings, namely, longitudinal lines, transverse lines, other markings and raised pavement markers, are used universally all over the world. In addition, these markings have been designed to be highly standardized, in terms of their color and appearance. Colors used for road markings are limited to white and yellow in most cases. Their appearance and detail dimensions, e.g., the width of linear markings, angles in arrow markings and size of other sign markings might differ across countries, yet they always strictly conform to the specifications in the national and/or local standards.
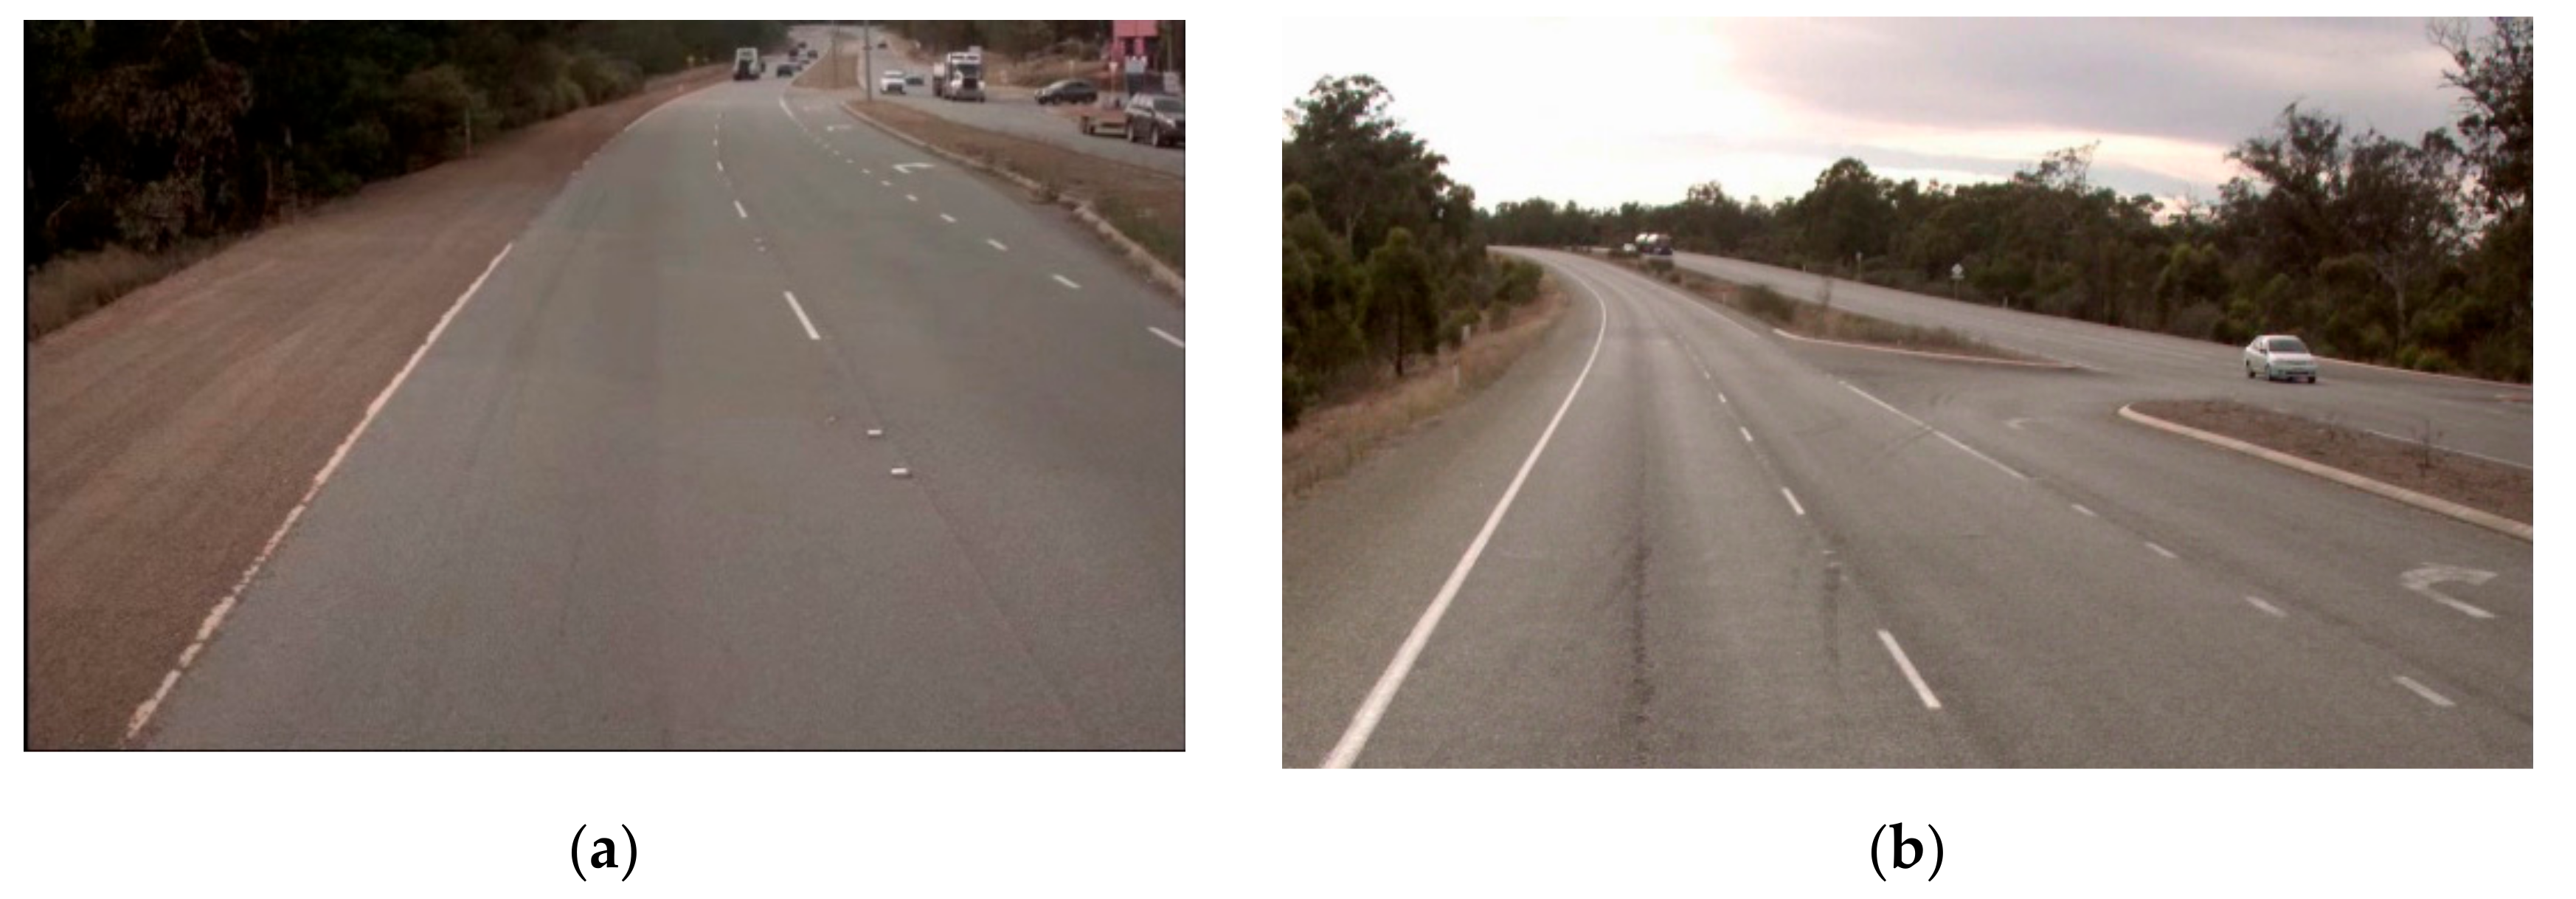
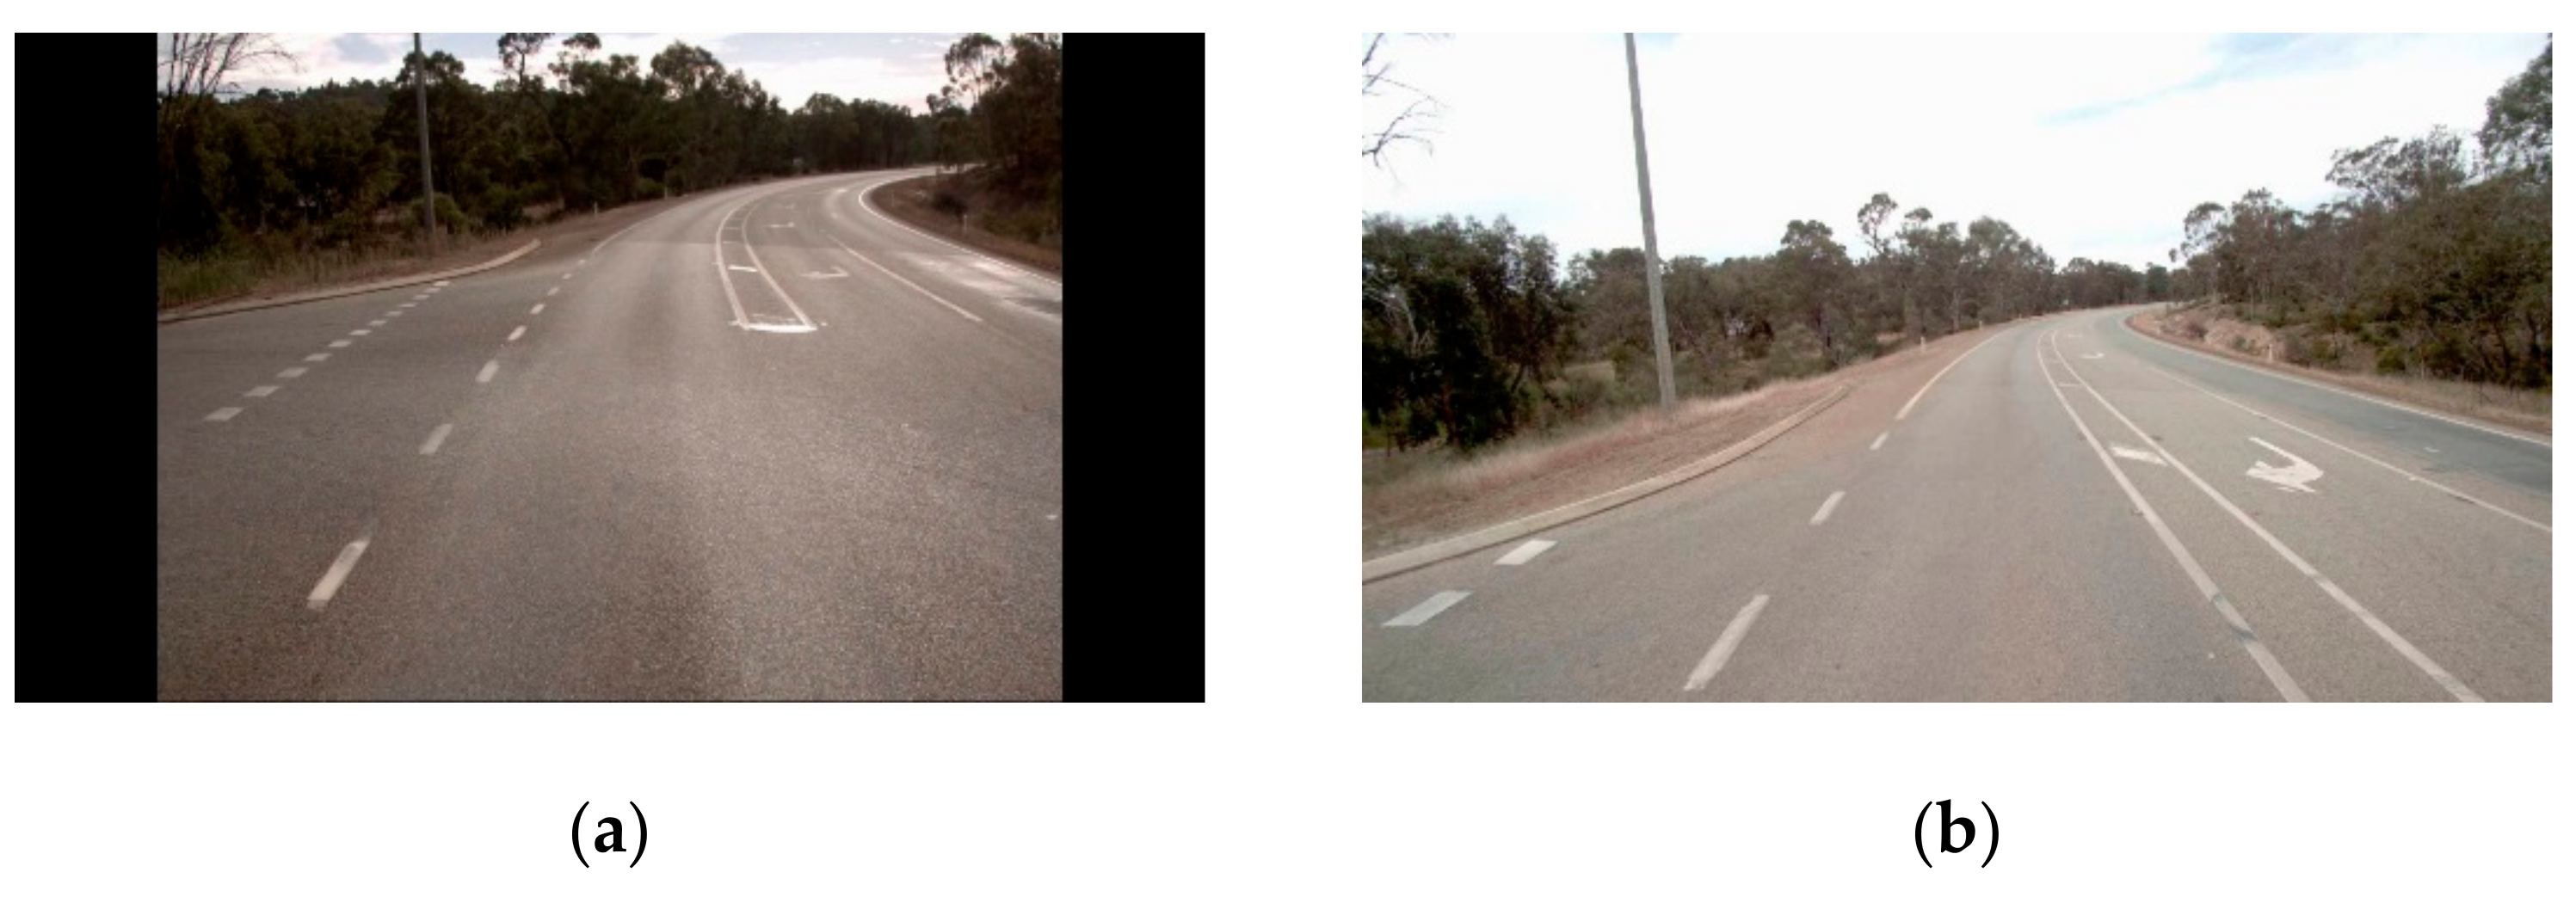
Roadway pavements are subject to a wide range of types of deterioration, such as vehicular friction, since they directly carry traffic loads. Additionally, recent years have witnessed increased traffic demands due to social development, which further imposes challenges on pavement maintenance. Common forms of distress range from cracking, rutting, and potholes to graffiti. Among them, deterioration of pavement markings is one of the most critical issues that road managers are concerned about. All types of markings are faced with wear and tear problems even though long-life materials have been introduced. Worn markings typically manifest as being blurred and in worst case scenarios, missing. Figure 1 presents a few examples of pavement markings that have suffered from wear and tear issues. As a result, pavement markings in poor condition might fail to convey useful information to drivers, imposing potential dangers to traffic.
To maintain road safety and efficiency for citizen’s daily commutes, road agencies and traffic organizers have been dedicated to making sure that pavement markings remain in a satisfactory condition and keep regulating the traffic. They are responsible for regular inspections of the entire road assets and accordingly, proper maintenance decision-makings, e.g., repainting for pavement markings. Other factors, such as environmental costs and benefits, will also be considered during the decision-making process [2]. However, current approaches require (trained) inspectors to tour on site, manually identify roadway markings in poor condition and document such condition data, which involves considerable amount of human effort. Additionally, due to the lack of human resources, some local authorities and/or governments fail to fulfil adequate inspection practices.
An alternative method to manual inspections is to deploy unmanned aerial vehicles (UAVs) and computer vision (CV) technology. In particular, computer vision has gained heated attention from both academia and industry in recent years due to its capability to replace tedious manual work, automate image processing, and obtain reliable information out of visual data. Among the numerous disciplines it has been applied to, its deployment in the architecture, engineering and construction (AEC) community covers the entire lifecycle of civil assets. On construction sites, computer vision-based systems, accompanied by other sensor-based systems, such as Radio Frequency Identification (RFID) technology [3], are capable of monitoring progress, quality control, and ensuring safety [4]. In particular, the deployment of digital twins can further improve workforce safety on sites [5]. During the operation and maintenance phases of infrastructure assets, CV, as an efficient and accurate detector, could help engineers to identify defects in existing structures. Such computer vision systems typically contain either a combination of image processing techniques and machine learning algorithms, or deep learning with additional support (e.g., parallel computing).
Given the importance of pavement markings in traffic regulation and guidance, and the challenges facing the industry in terms of real-life inspection projects, an efficient inspection and management scheme is needed. Inspired by the potential of emerging computer vision technology, this study aims to develop an automated inspection method for pavement markings by making full use of the pavement video data readily archived in most road agencies/authorities. Specifically, a vision-based framework is proposed to (1) identify different types of line markings in pavement images by adopting a hybrid descriptor, and (2) estimate the worn condition of identified markings using a threshold-based method. The contributions of this study are two-fold. For one, a vision-based detection method for both line markings and audible markings is proposed. Unlike other work in the literature which has integrated line marking detection into autonomous vehicles [6,7], this work targets a practically meaningful aim for road authorities, i.e., inventory purposes. Furthermore, condition assessment of line markings is completed in a quantitative way, on top of the detection of blurred markings [8,9]. Additionally, compared with previous work which has employed 3D laser scanners [10], this work is cost-efficient, and thus, naturally feasible in practice. The rest of the paper is structured as follows: Section 2 summarizes the related work about computer vision in roadway pavement scenarios; Section 3 illustrates the proposed framework for pavement marking detection and condition assessment; Section 4 presents a case study, covering topics ranging from data collection to discussion of the results; Section 5 indicates limitations and potential future work of the framework; finally, Section 6 concludes.
2. Related Work
The majority of previous studies have used computer vision to detect line markings that delineate traffic lanes. Together with other modules such as obstacle detection [11], such studies have aimed to support advanced driver assistance systems (ADAS) and the autonomous driving industry. On the basis of extracted lane line markings on road pavements, various models have been developed to fit the geometric shape of lanes, including, but not limited to, linear models, parabolic models, hyperbolic models, the Clothoid model and the spline model. The distinctive features for the detection of line markings vary. For example, Son et al. [12] utilized color information in the YCbCr color space, i.e., yellow and white, to identify line markings and achieved an average detection rate of 93%, regardless of various illumination conditions. While Parajuli et al. [13] relied on vertical gradients of images to identify line markings and achieved a 95.54% detection rate. Specifically, the Lspectra variable, the characteristic spectrum of line markings, was first obtained and used to match line marking points. Alternatively, deep learning algorithms have been employed to replace feature extraction steps, as developed in [14], where Zang et al. adopted a fully convolutional neural network (CNN) to achieve the pixel-wise detection of lane lines. The detection accuracy of the best model reached 82.24% on the test dataset, where there were high reflection cases. To further assist autonomous driving, Chen et al. [15] proposed a general framework for an intelligent transportation system by employing Binarized Normed Gradient (BING) features and a principal component analysis (PCA) network to classify a wide range of road markings including arrows, speed signs, “RAIL” signs, etc. For all of the above-mentioned studies, although they achieved pavement marking detection with satisfactory accuracy/precision, they did not classify them to fulfill management requirements such as inventory data collection.
Another group of research falls into the digital asset management study area. Such studies have aimed to obtain condition information of road assets, by using a combination of image processing techniques and machine learning algorithms. They managed to identify various defects on roadway pavements, classify them and evaluate their severity. Defects targeted in previous studies include cracking, rutting, potholes and patches. As regards the first task (i.e., defect detection), Hoang et al. [16] and Chun et al. [17] achieved the automatic detection of cracking on asphalt pavement, using a combination of a multi-class Support Vector Machine (SVM) classifier and an artificial bee colony optimizer, and a naïve Bayes-based machine learning algorithm, respectively. The detection accuracy reached more than 0.96 in [16]. A few studies targeted potholes for detection [18,19], where Azhar, Murtaza [18] further localized them explicitly using graph-cut segmentation and achieved a precision of 90%. Tedeschi and Benedetto [20] developed a real-time mobile-based system to recognize several types of damage, i.e., pothole, longitudinal–transverse cracking and fatigue cracking. The precision, recall, accuracy and F-measure were satisfactory (more than 0.7), as regards the mobile platforms the system operated on. To cope with a major limitation of the aforementioned studies—that only one particular type of distress can be dealt with at one time—Zalama et al. [21] proposed to classify longitudinal and transverse cracks using Gabor filters and an AdaBoost algorithm. Karaköse et al. [22] developed an approach to further categorize pavement cracks into superficial, crocodile, linear and transverse.
In recent years, deep learning approaches have been increasingly deployed in a wide range of industrial applications [23,24,25,26]. Neural networks (NN), through proper training, can accomplish tasks such as structural damage detection [27], water quality monitoring [28], quality control for shuttlecock production [29] and the adaptive tracking control of nonlinear systems [30,31]. As for road asset management, several studies have successfully employed deep neural networks to identify distress on roadway pavements. For example, Zhang et al. [32] proposed CrackNet, which essentially employed a modified CNN, to identify cracking on 3D asphalt surfaces. It can achieve pixel-level detection and outperforms conventional machine learning and imaging methods with a precision of 90.13% and an F-measure of 88.86%. Fan et al. [33] modelled pavement crack detection as a multi-label problem and solved it based on structured prediction with CNN. Zhang et al. [34] developed a transfer learning-based framework to classify sealed and unsealed cracks and at the same time extract them at the pixel level. Maeda et al. [35] developed a mobile application to determine the damage status of roads, in terms of “no damage”, “minimal damage” and “damage needing repair”.
However, few studies have focused on pavement markings and their condition assessment, except in [8], where Kawano et al. adopted end-to-end deep neural networks (i.e, Yolo) to identify blurry road markings. The mAP of detection reached 30% and the precision for blurred white lines was more than 65%. Another example is in the form of the study by Maeda and Sekimoto [9], who included blur detection of two types of markings, i.e., white line and crosswalk, into the proposed multi-classifier for road damage. The levels of precision and recall, using two different neural networks, were both greater than 0.77 and 0.71, respectively. To date, previous studies have neither focused on the inventory of pavement markings nor realized the quantification of their blurring condition. An efficient framework to identify pavement markings in images/videos and evaluate their condition with numeric indicators is still lacking in the literature. For this reason, this research proposes a vision-based framework for pavement marking detection and condition assessment, so as to automate the collection of relevant inventory data and facilitate maintenance decision-makings for road assets.
3. Vision-Based Line Marking Detection and Condition Assessment
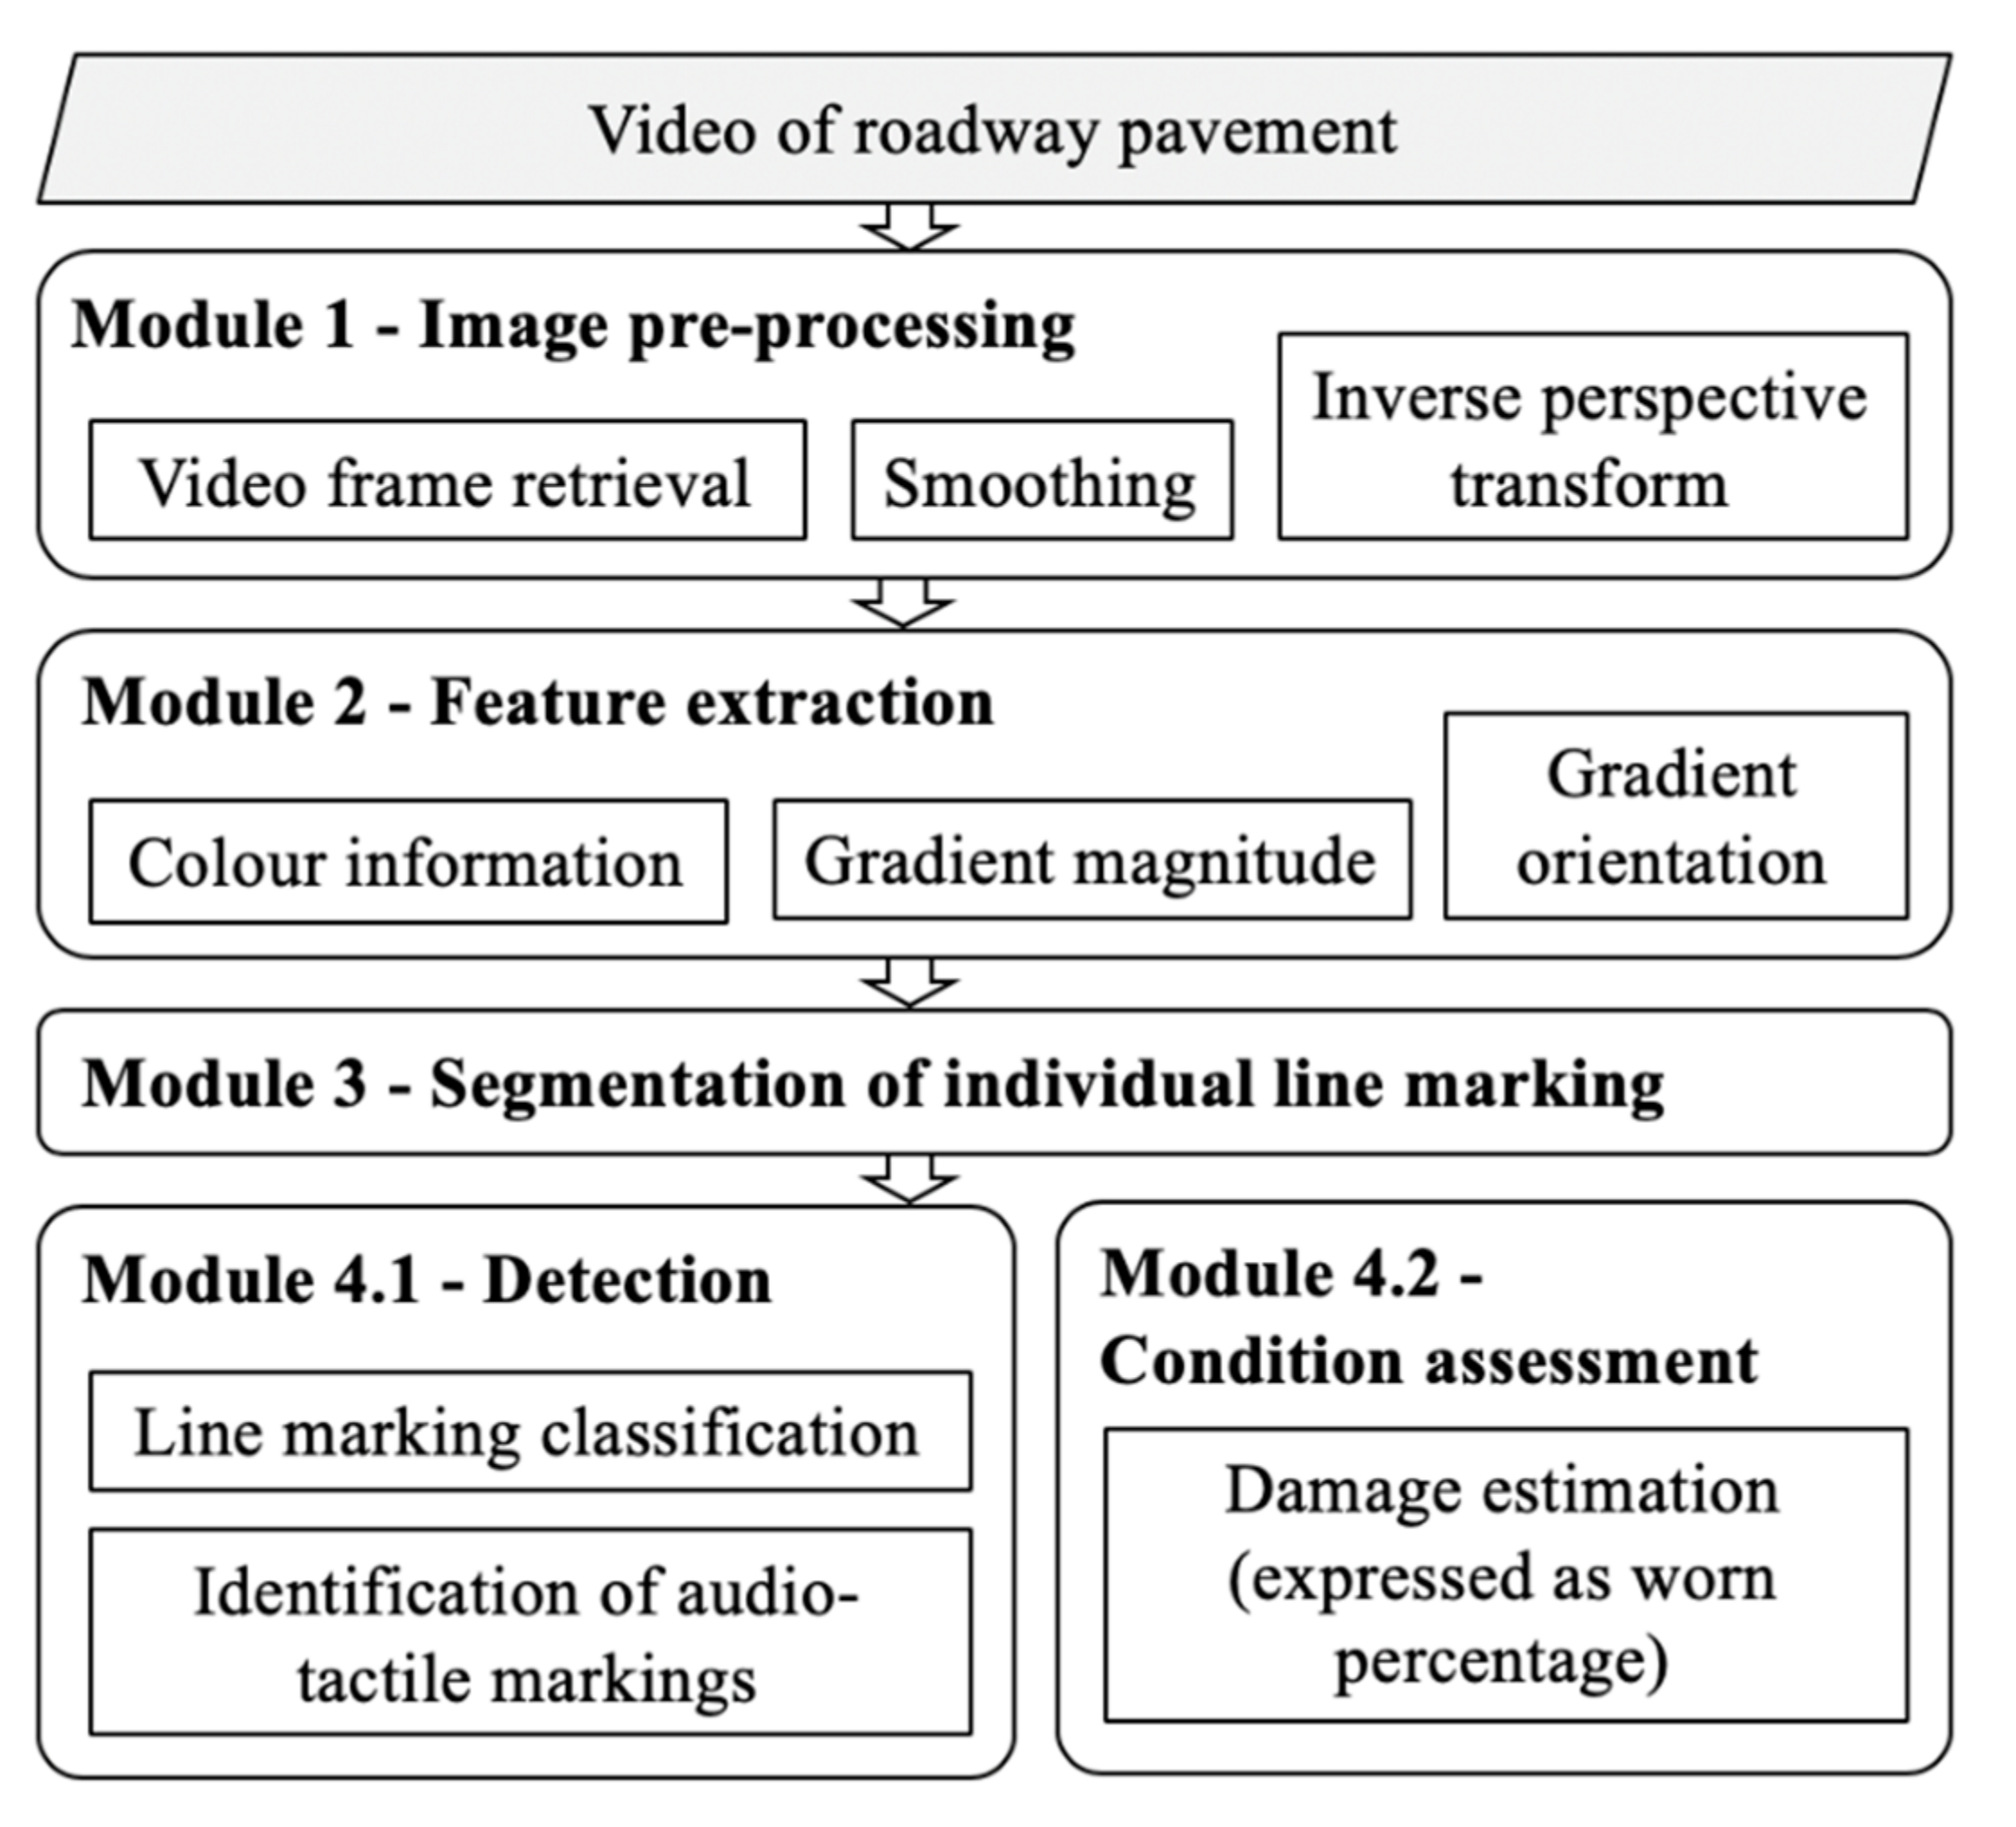
The proposed vision-based framework for line marking detection and condition assessment can be best understood as a flowchart. Figure 2 maps the overall structure of this scheme, and four modules will be illustrated in detail.
3.1. Image Preprocessing
The first module is to pre-process the visual data and prepare them for the following procedures. Our targeted visual data were videotapes collected by an in-vehicle camera. The camera was mounted in the front to capture the front-view of the road pavement as the vehicle forwards. Image frames were first extracted in sequence and cropped to the preferred dimensions. Automatic image quality assessment has been proven to be useful for various image processing applications, especially for singly and multiply distorted stereoscopic images [36]. In this case, smoothing algorithms are applied to obtain the image in a format that is ready for feature extraction in the following steps. Examples include the Gaussian blur median filter, which has been proven to be efficient in eliminating “salt-and-pepper” noise in images. Another vital step in this module is image rectification, which involves removing the perspective effects through inverse perspective transform. Camera calibration is a prevalent method, that involves obtaining the camera’s intrinsic parameters (i.e., the optical center and focal length of the camera) and extrinsic parameters (i.e., the position of the camera in the 3D scene) beforehand. Chessboard is typically utilized in most commercial applications [37]. Alternatively, feature points, which are supposed to be located on two parallel straight lines in the bird’s eye view, can be used to calculate the transform matrix. The reason why it is important to generate plane images of road pavement is that line markings are parallel with each other after transformation, and therefore, this makes segmentation of each instance easier to achieve.
3.2. Feature Extraction
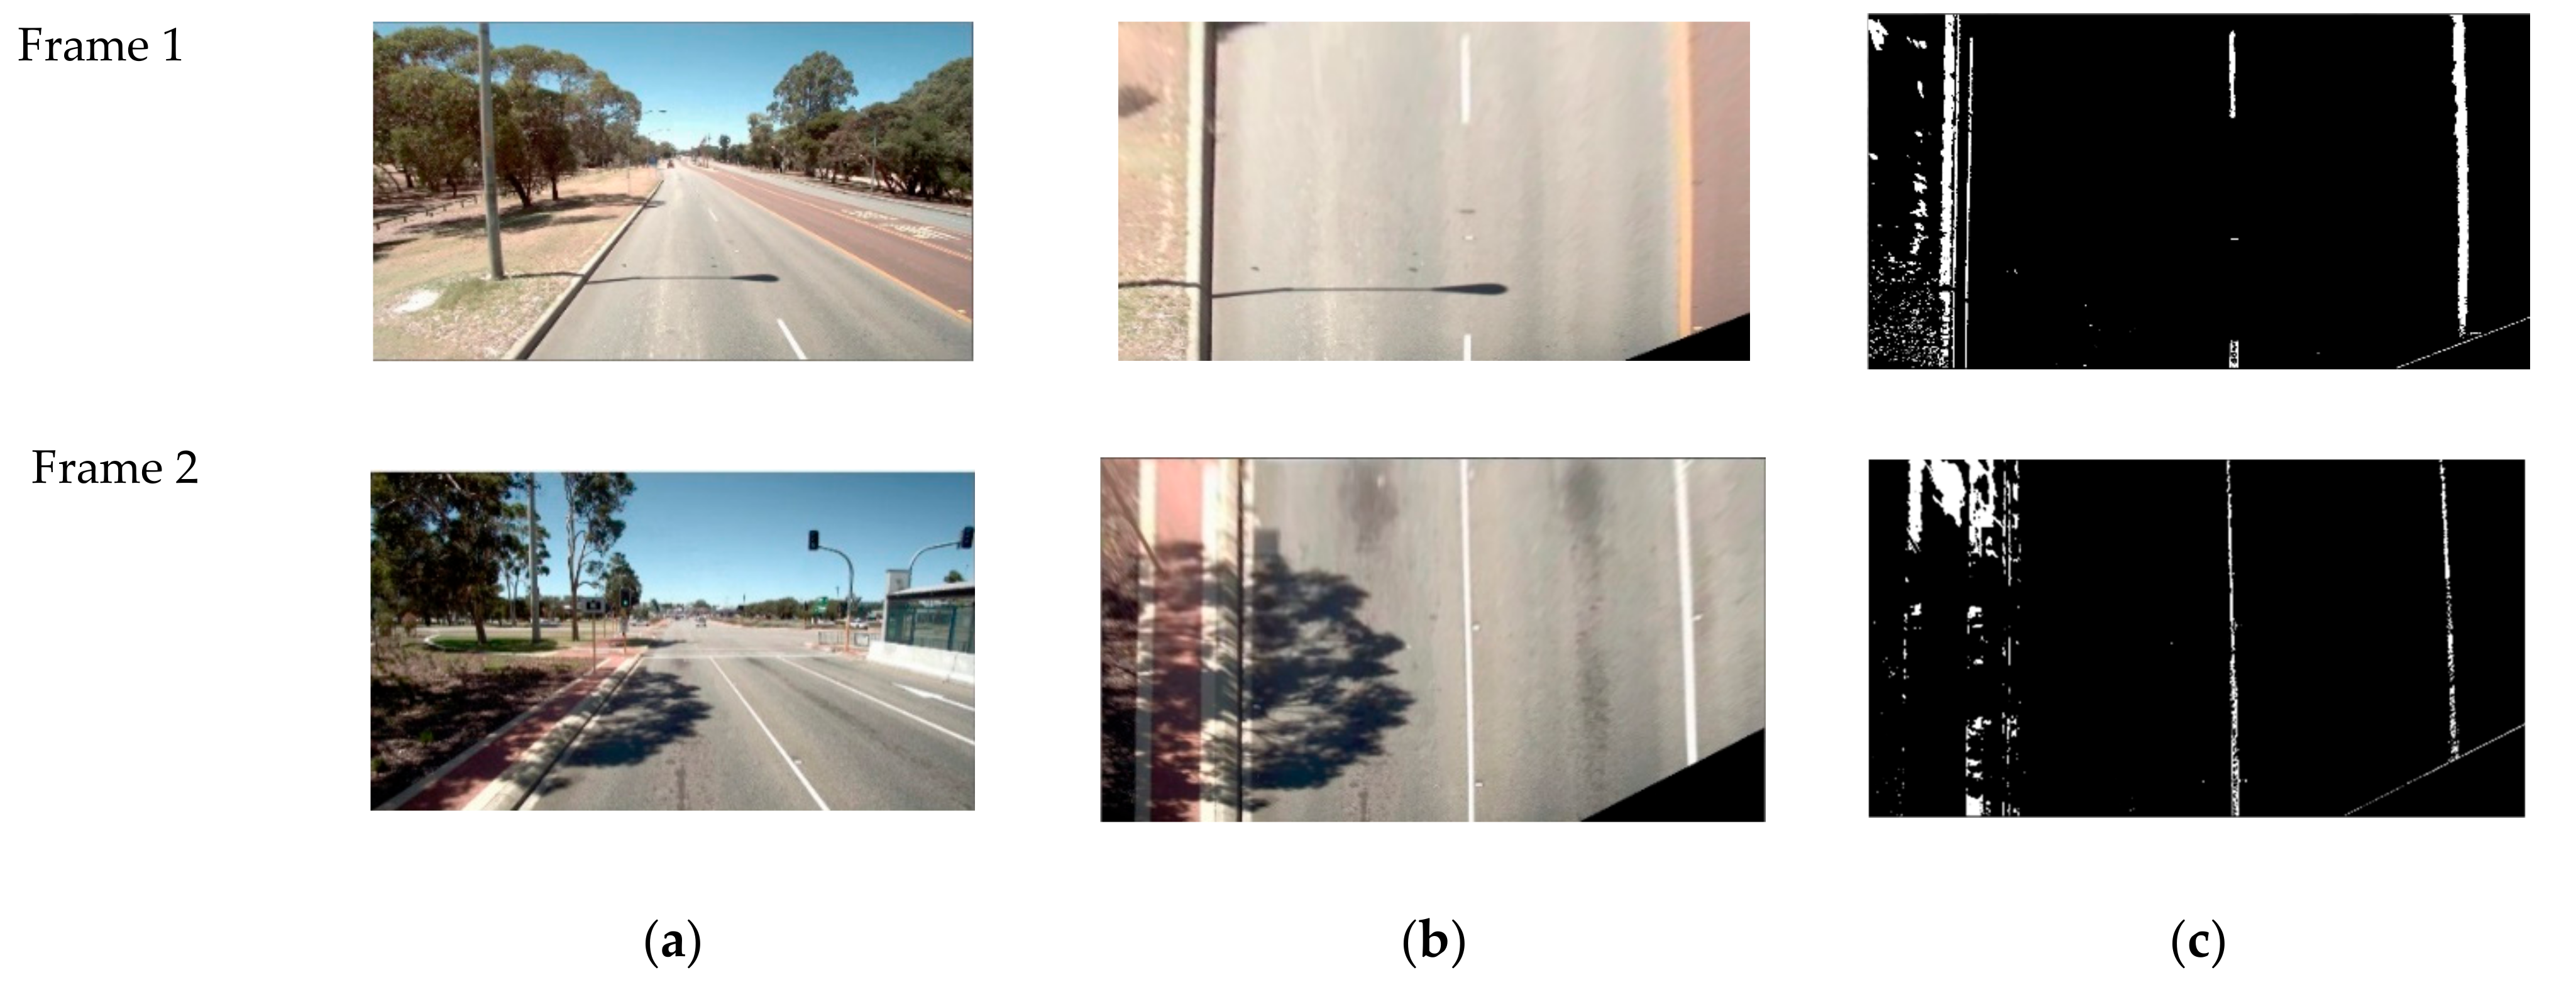
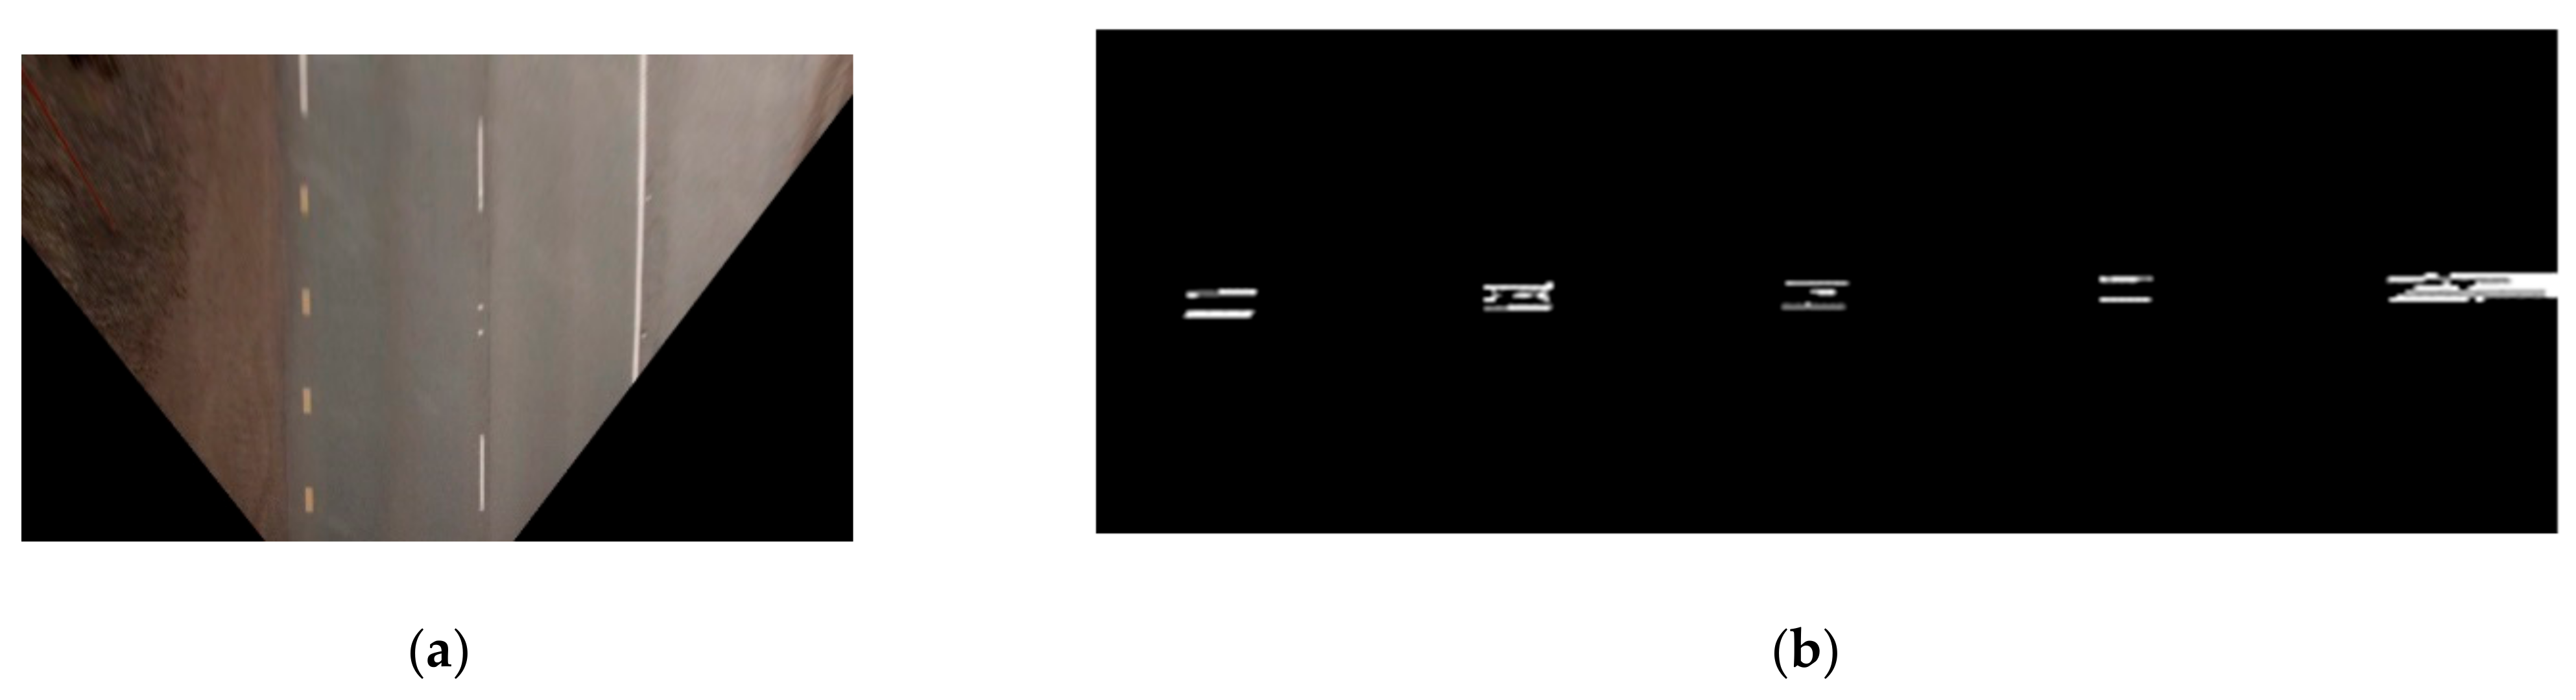
This module aims to extract features of pavement markings using a hybrid detector. Both color information and gradient features [38] are used for detection, so as to cope with a range of environmental factors that can adversely affect the performance of feature extraction. Previous studies have also used color and shape features and achieved image retrieval tasks with improved efficiency [39]. Such factors include considerable variations in image illuminations, noises on the pavement, and occlusions caused by other vehicles. Pavement distress, repairs and shadows of road-side facilities and plants should all be excluded after this module. For this reason, color values in the HSL color space (i.e., Hue, Saturation, and Lightness) are extracted and pre-defined thresholds are applied to filter yellow and white pixels in the image. The Sobel operation [40] is used to compute both gradient magnitude and orientation. This hybrid detector has been tested on a succession of pavement images, and Figure 3 shows a few of the results. The road segment for preliminary tests is located in a metro area and the results indicate that shadows and rutting on pavement can be successfully eliminated.
3.3. Segmentation
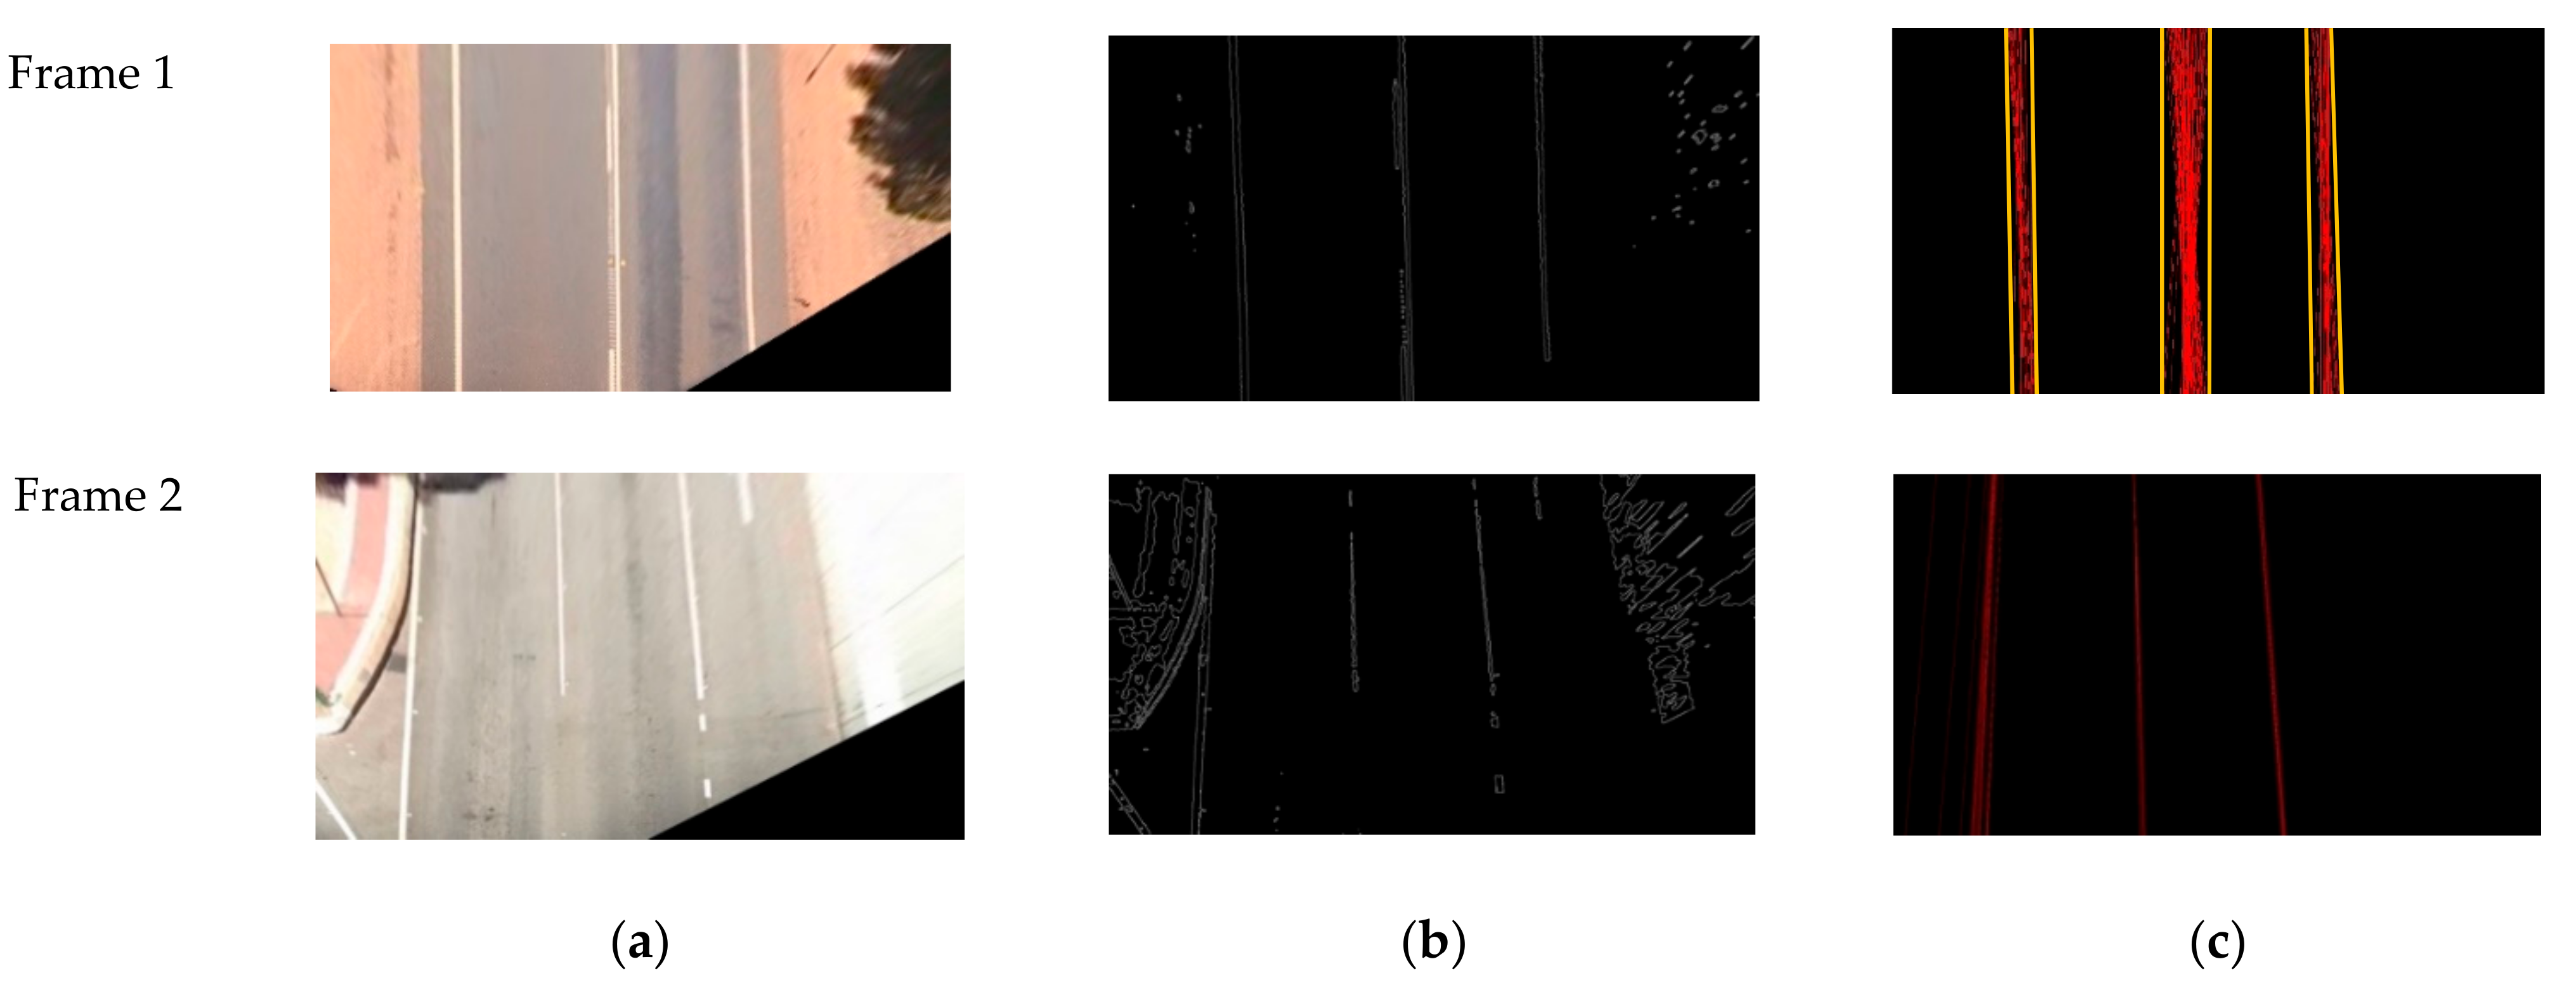
Based on the extracted features, this module applies segmentation on the planar images. Segmentation, also known as grouping or fitting [41], aims to generate distinctive and informative summary representations of pixel groups, which are individual line markings in this case. Single markings are selected and exported as separate image files. To locate pavement marking instances, Canny [42] is used for edge detection, whose outcomes are later fed into a Hough line Transform algorithm. Hough Transform [43] has been intensively used for line detection, which tests links between any random point pairs and select ones with higher votes than the user-defined threshold. To further eliminate outliers, lines with unreasonably large slopes are removed, and those belonging to non-marking areas are also filtered out according to their spatial positions. A grouping method is then applied to determine individual line marking areas. The proposed segmentation method was also tested on the same set of sample images. Figure 4 presents the results.
3.4. Classification and Condition Assessment
Table 1 lists the common categories of longitudinal line markings, as specified in the Australian Standards [44]. A few categories, i.e., edge line, single barrier line, lane line and transition line, convey different instructing messages to road users, yet have a similar pattern, i.e., a continuous single line. Markings with different functional semantics require additional inferences and reasoning to distinguish them. Therefore, such marking are allocated to a single code for classification. In addition, a special category, i.e., audio-tactile marking, is also targeted for detection. These markings are designed to provide warnings to drivers who might drift from the traffic lane and prevent potential hazardous situations. They are normally associated with edge lines and center lines, thus, their presence is separately identified for individual line markings.
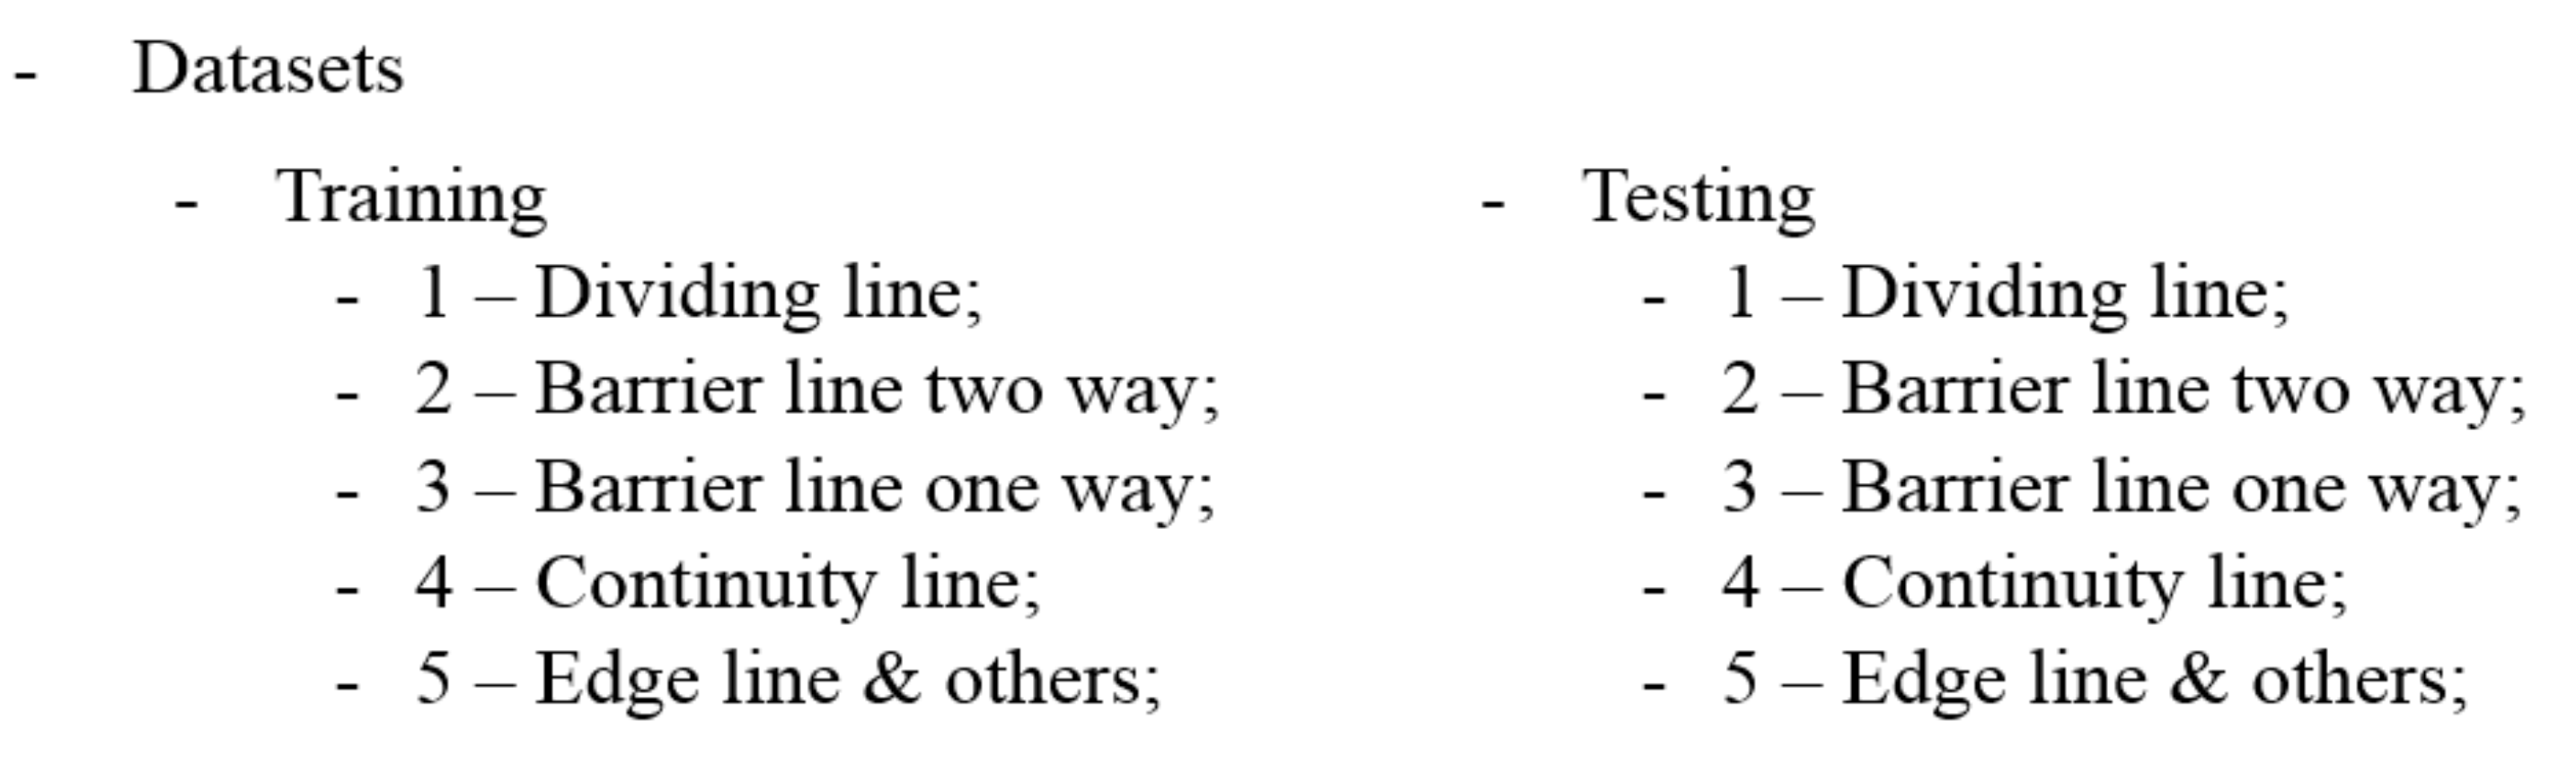
Numeric features of individual line markings, i.e., width along the way, were obtained for classification and condition measurement. A width list is generated by counting the number of pixels at each position on the longitudinal direction. By analyzing the width lists statistically and determining their spatial distributions, a threshold-based method can be developed for line marking classification. The detection and classification of line marking types can be further supported by information on both the color and position. To illustrate, yellow line markings at the center of road pavement are mostly barrier lines, while those located near the boundaries are likely to be edge lines. An alternative option for efficient and accurate categorization is to use deep learning algorithms. An image dataset, including either pavement images with markings labelled correspondingly or individual marking images structured as in Figure 5, should be created. A separate category for classification is the curb, which in some cases co-exist with—or even replace—edge lines, and thus, should be identified separately.
On top of the detection, the condition of identified markings can be assessed in terms of the worn percentage. Based on the pixel-wise extraction of line markings and their width lists, the length of worn marking segments is calculated. A threshold for width is pre-defined in order to determine whether the marking at certain position is worn or not. Then, the worn percentage of an individual line marking in the image space can be estimated according to Formula (1). The formula is expressed as follows:
where N represents the total number of strips that the targeted line marking contains in the region of interest; li represents the length of marking within the ith strip that is determined as worn (i.e., this segment has a smaller width than the pre-defined threshold); Li is the total length of each marking strip. For continuous line markings, such as edge lines and barrier lines, Formula (1) can be further simplified, as expressed in Formula (2).
where L is the total length of the targeted marking in the region of interest and l is the length of worn segment.
To finalize the regional worn condition measurement, the worn percentage estimated in single image frame is averaged over a road section and can be used for managerial operations.
4. Case Study Results
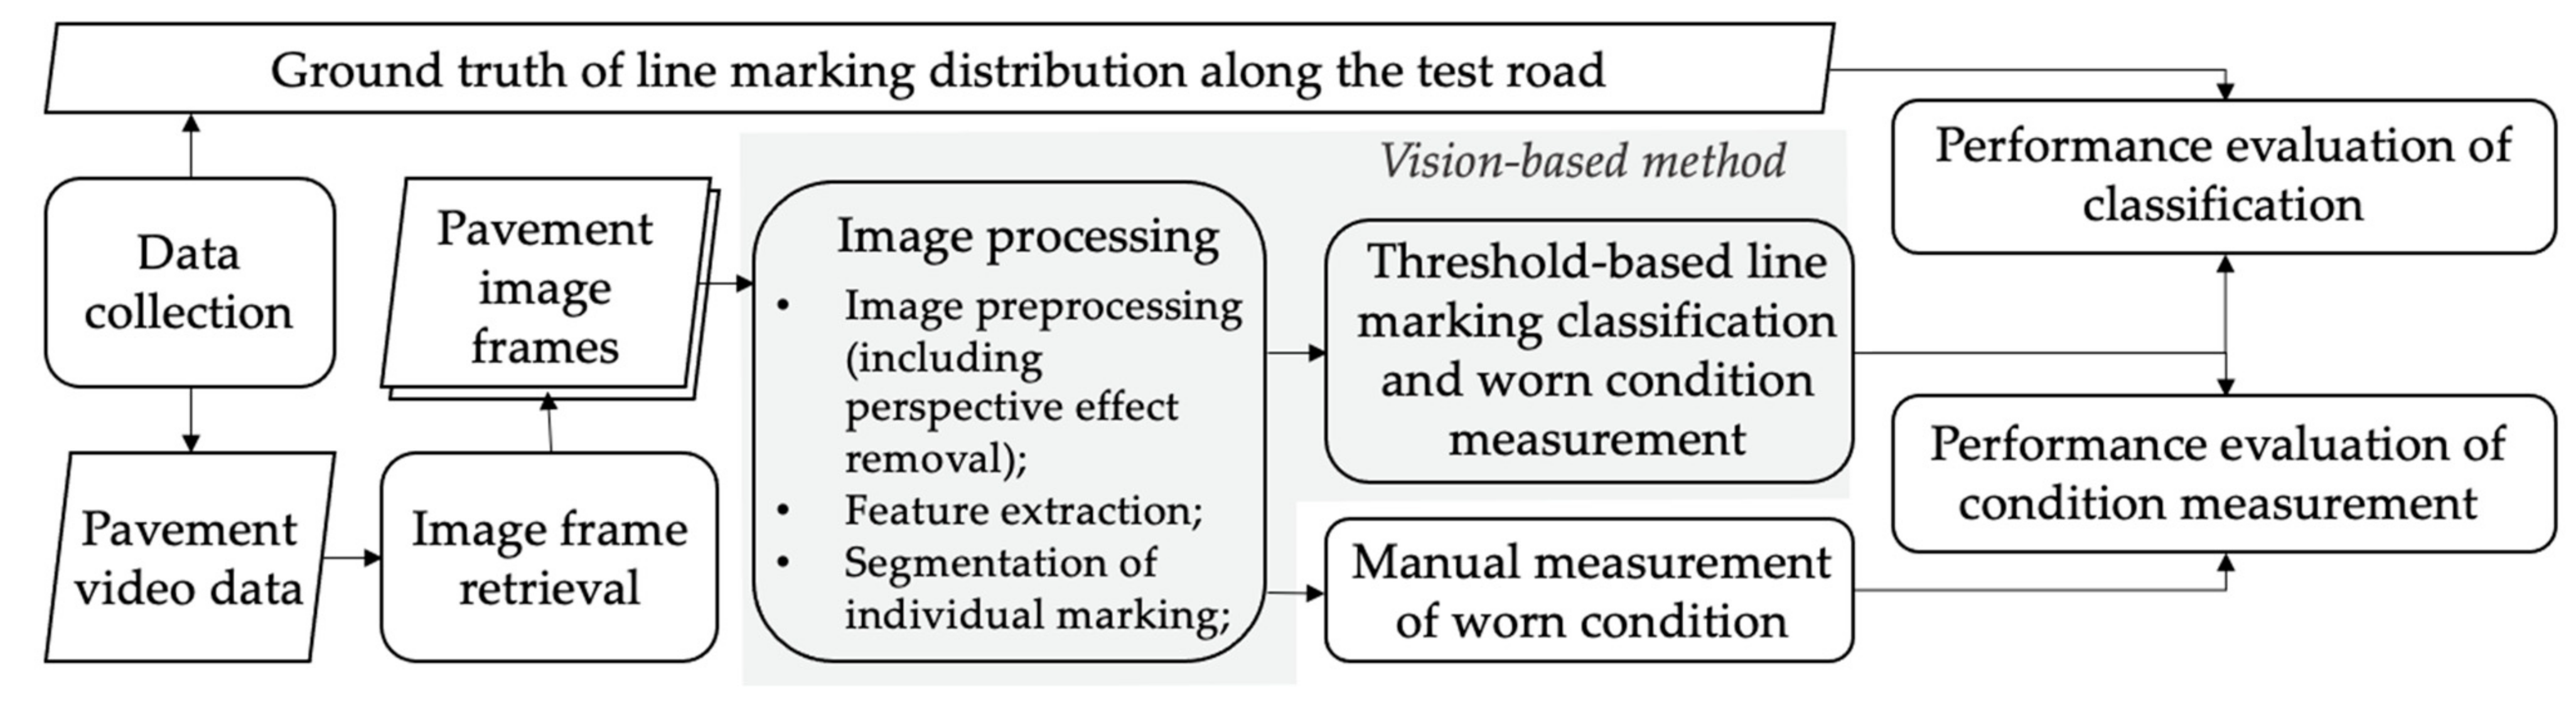
To evaluate the applicability of the proposed framework for vision-based pavement marking detection and condition assessment, a case study on a real-life roadway pavement was designed and carried out. Main Roads Western Australia (MRWA)—the road agency of the Government of Western Australia—archives pavement video data of their roads. Such videos were originally recorded by a vehicle traveling at a uniform speed in both directions of traffic movement. This data collection method ensures that each frame in the video covers approximately a 20 m long road segment, and therefore, far field regions of the pavement can be eliminated for the current frame and analyzed in the next frame. Additionally, the two-direction filming method is especially necessary for roads in metro areas since they are normally too wide to fit into the camera’s field of view. A videotape recording a total of 28 km highway pavement in Western Australia was retrieved. Preliminary tests were run beforehand to evaluate the performance of the candidate methods for each module. Next, a case study was conducted to further validate its effectiveness. The case study can be understood as a flowchart, as shown in Figure 6.
4.1. Image Processing
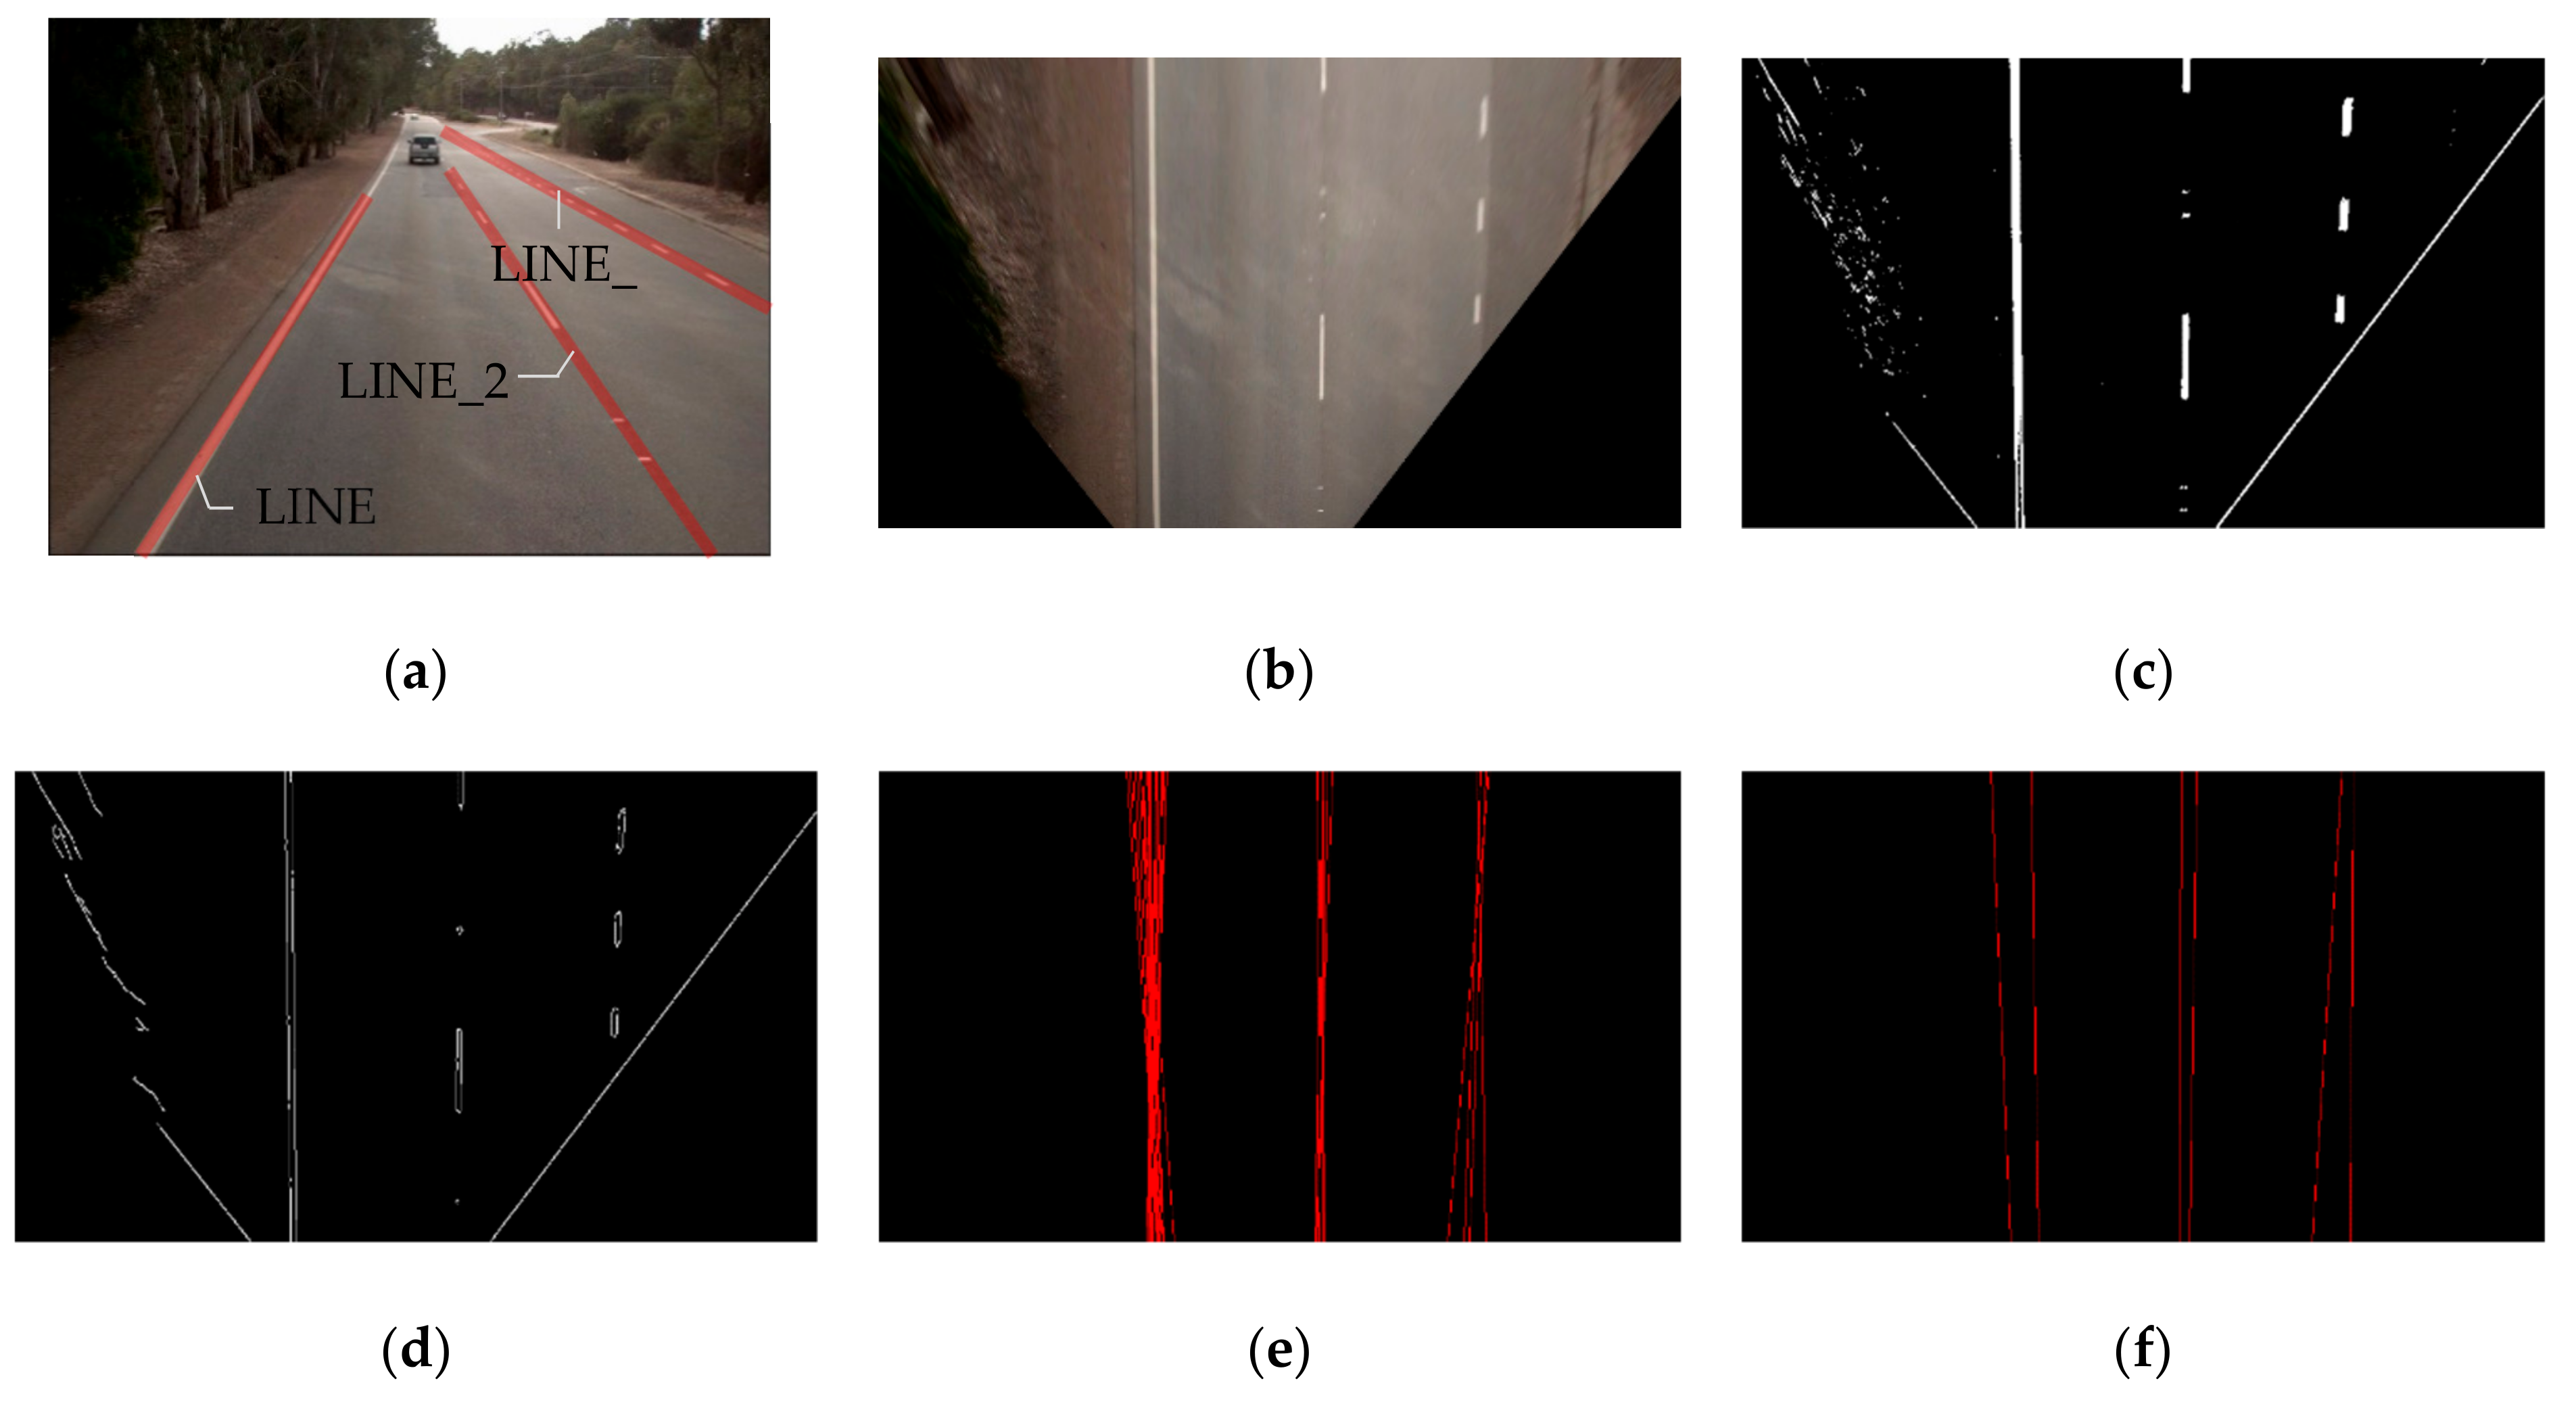
Image frames were first retrieved out of the videotape. Image cropping was applied to exclude miscellaneous regions, such as the sky, which assembles the color feature of pavement markings due to high levels of illumination (Figure 7a). All original image frames were sorted in sequence and numbered accordingly. To remove perspective effects, two feature pairs, which are assumed to be located on two parallel lane lines in the bird’s eye view images, were manually selected. For curved roads, since only a 20 m segment in the near field was targeted, this assumption still holds true. The transform matrix was computed in a way that the resulting images roughly cover the pavement at the widest location along the route and a length of 20 m. Road-side facilities and plants can, to a large extent, be eliminated.
Based on road-plane images, features were then extracted. The hybrid feature extraction method tested in Section 3.2 was modified, by customizing the color feature detector for different line markings. A three-channel filter was used in the HSL color space for yellow markings and a one-dimensional filter was used in the gray-scaled image for white markings. Thresholds were determined to cope with intra-color variations and successfully distinguish inter-color differences. Based on the information for both color and shape (extracted using Sobel operation), a feature map of the pavement markings can be obtained for analysis. The result is shown in Figure 7c.
To further isolate individual line marking for classification and analysis, a combination of Canny edge detection and Hough line transform was utilized, as detailed in Section 3.3. Key parameters in this approach, i.e., the minimum length of lines and the maximum gap between two feature points that belong to the same line, were pre-defined so as to leave out noise from the surroundings. Outlier lines were further removed with regard to their slopes and spatial placement. Figure 7a–f illustrates each step of the image processing method. It shows that a binary feature map of line markings can be obtained and the region of interest (i.e., individual markings) can be successfully segmented.
4.2. Line Marking Detection and Classification
The video data in this case study included five types of longitudinal line markings, namely, edge line, continuity line, transition line, lane line and dividing line. They were assigned to four classes, as indicated in Table 2. An additional category for classification was introduced to represent non-marking objects, such as road-side railings, curbs and other vehicles that appear in the region-of-interest. A threshold-based method was utilized based on distinctive shape features, where dividing lines (code “01”) and continuity lines (code “04”) are both broken markings with different length of strips and gaps, while marking types in code “02” all appear to be single continuous lines. The ground truth of line marking distributions along the test road was collected from the authority. A comparison between the classification results and the ground truth was conducted to evaluate the performance of the proposed methods. Accuracy, as the ratio of successfully classified samples to all samples, was used for evaluation.
Table 2 shows the performance of the threshold-based method for line marking classification. As for the detection of audible markings on top of line markings, the accuracy is 0.82 for the near-field instances. This research was then compared to an existing piece of research [10], which used laser-scanning 3D profile data to detect and measure road markings and achieved a 90.8% level of accuracy for detection. It is worth noting that 3D profile data possess the ability to overcome the impacts of shadows, varying illuminations and occlusions, and provide additional information, such as elevation. Using 2D optical images, this research achieves an average accuracy of 89% and presents a satisfactory performance.
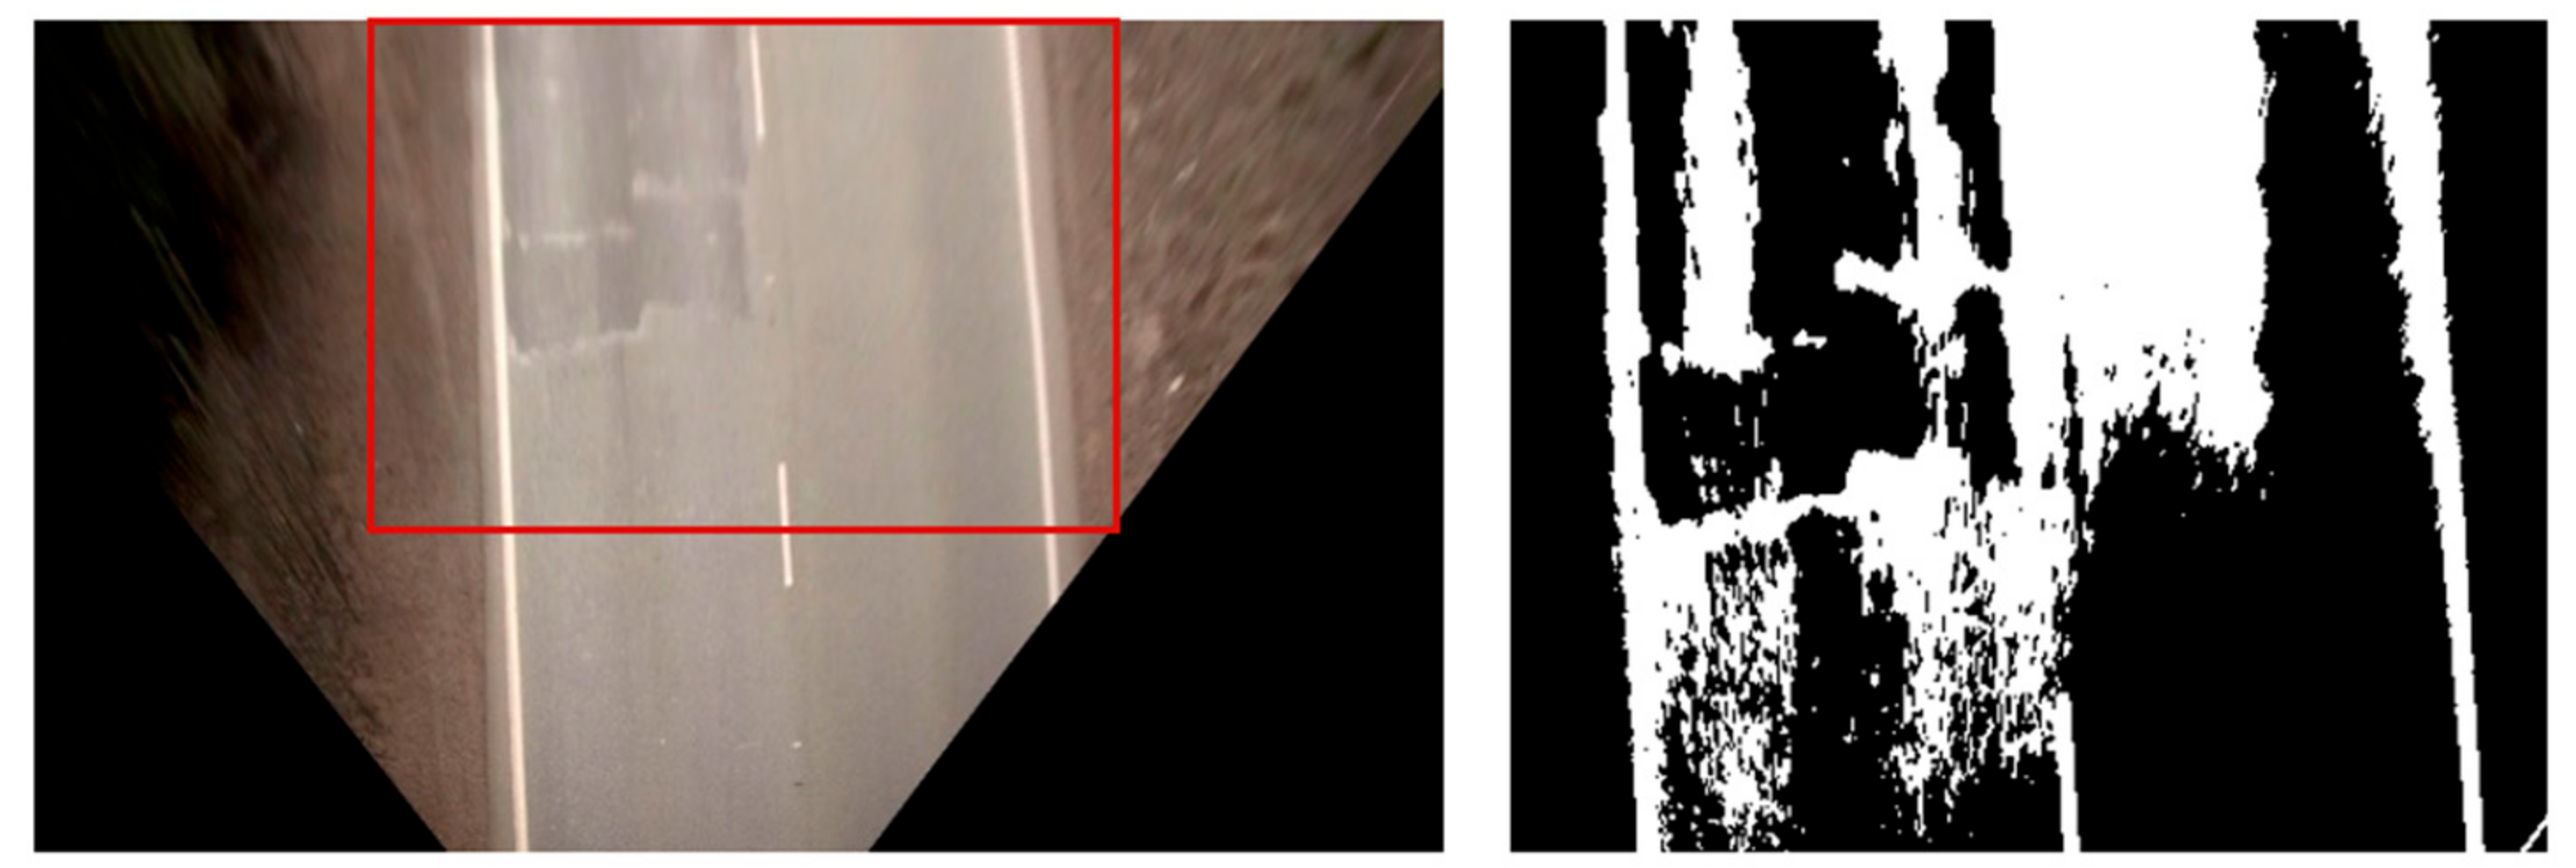
A range of environmental factors account for the detection failures. The road segment in Figure 8 has an extensively polished pavement surface and patches, generating a misleading feature map (shown in the right image). As a result, both the left edge line and the dividing line were mistakenly identified as “Other”. Another notable disturbance hindering accurate classification is vehicles on adjacent lanes, which causes severe occlusion. Such situation typically occurs when overtaking is occurring, and thus, it lasts no more than five frames. Temporary loss of line marking detection in some image frames can be supplemented by referring to their context in the time sequence. Curbs and railings alongside the road, as shown in Figure 9b,c, can also lead to detection errors.
4.3. Worn Condition Assessment
To validate the proposed approach for condition assessment, a roughly 2 km long road segment was further retrieved randomly. To generate a benchmark for their worn condition, images were first superimposed onto a grid and the worn percentage of line marking instances in each image frame were manually measured by the author. The minimum spacing of the underlying grid is five pixels, and therefore, the manual measurement could possibly reach an accuracy of one pixel. Comparisons between the manual measurement and the results of the proposed method are plotted on line charts. Figure 10 presents the result comparison charts for LINE_1, the nearest line marking to the camera to the left, and LINE_3, the farther boundary of the adjacent lane, as illustrated in Figure 7a. The horizontal axis represents the corresponding SLK (Straight Linear Kilometer) number of each frame, as recorded in MRWA’s management system, while the vertical axis is the estimated worn condition in terms of percentage.
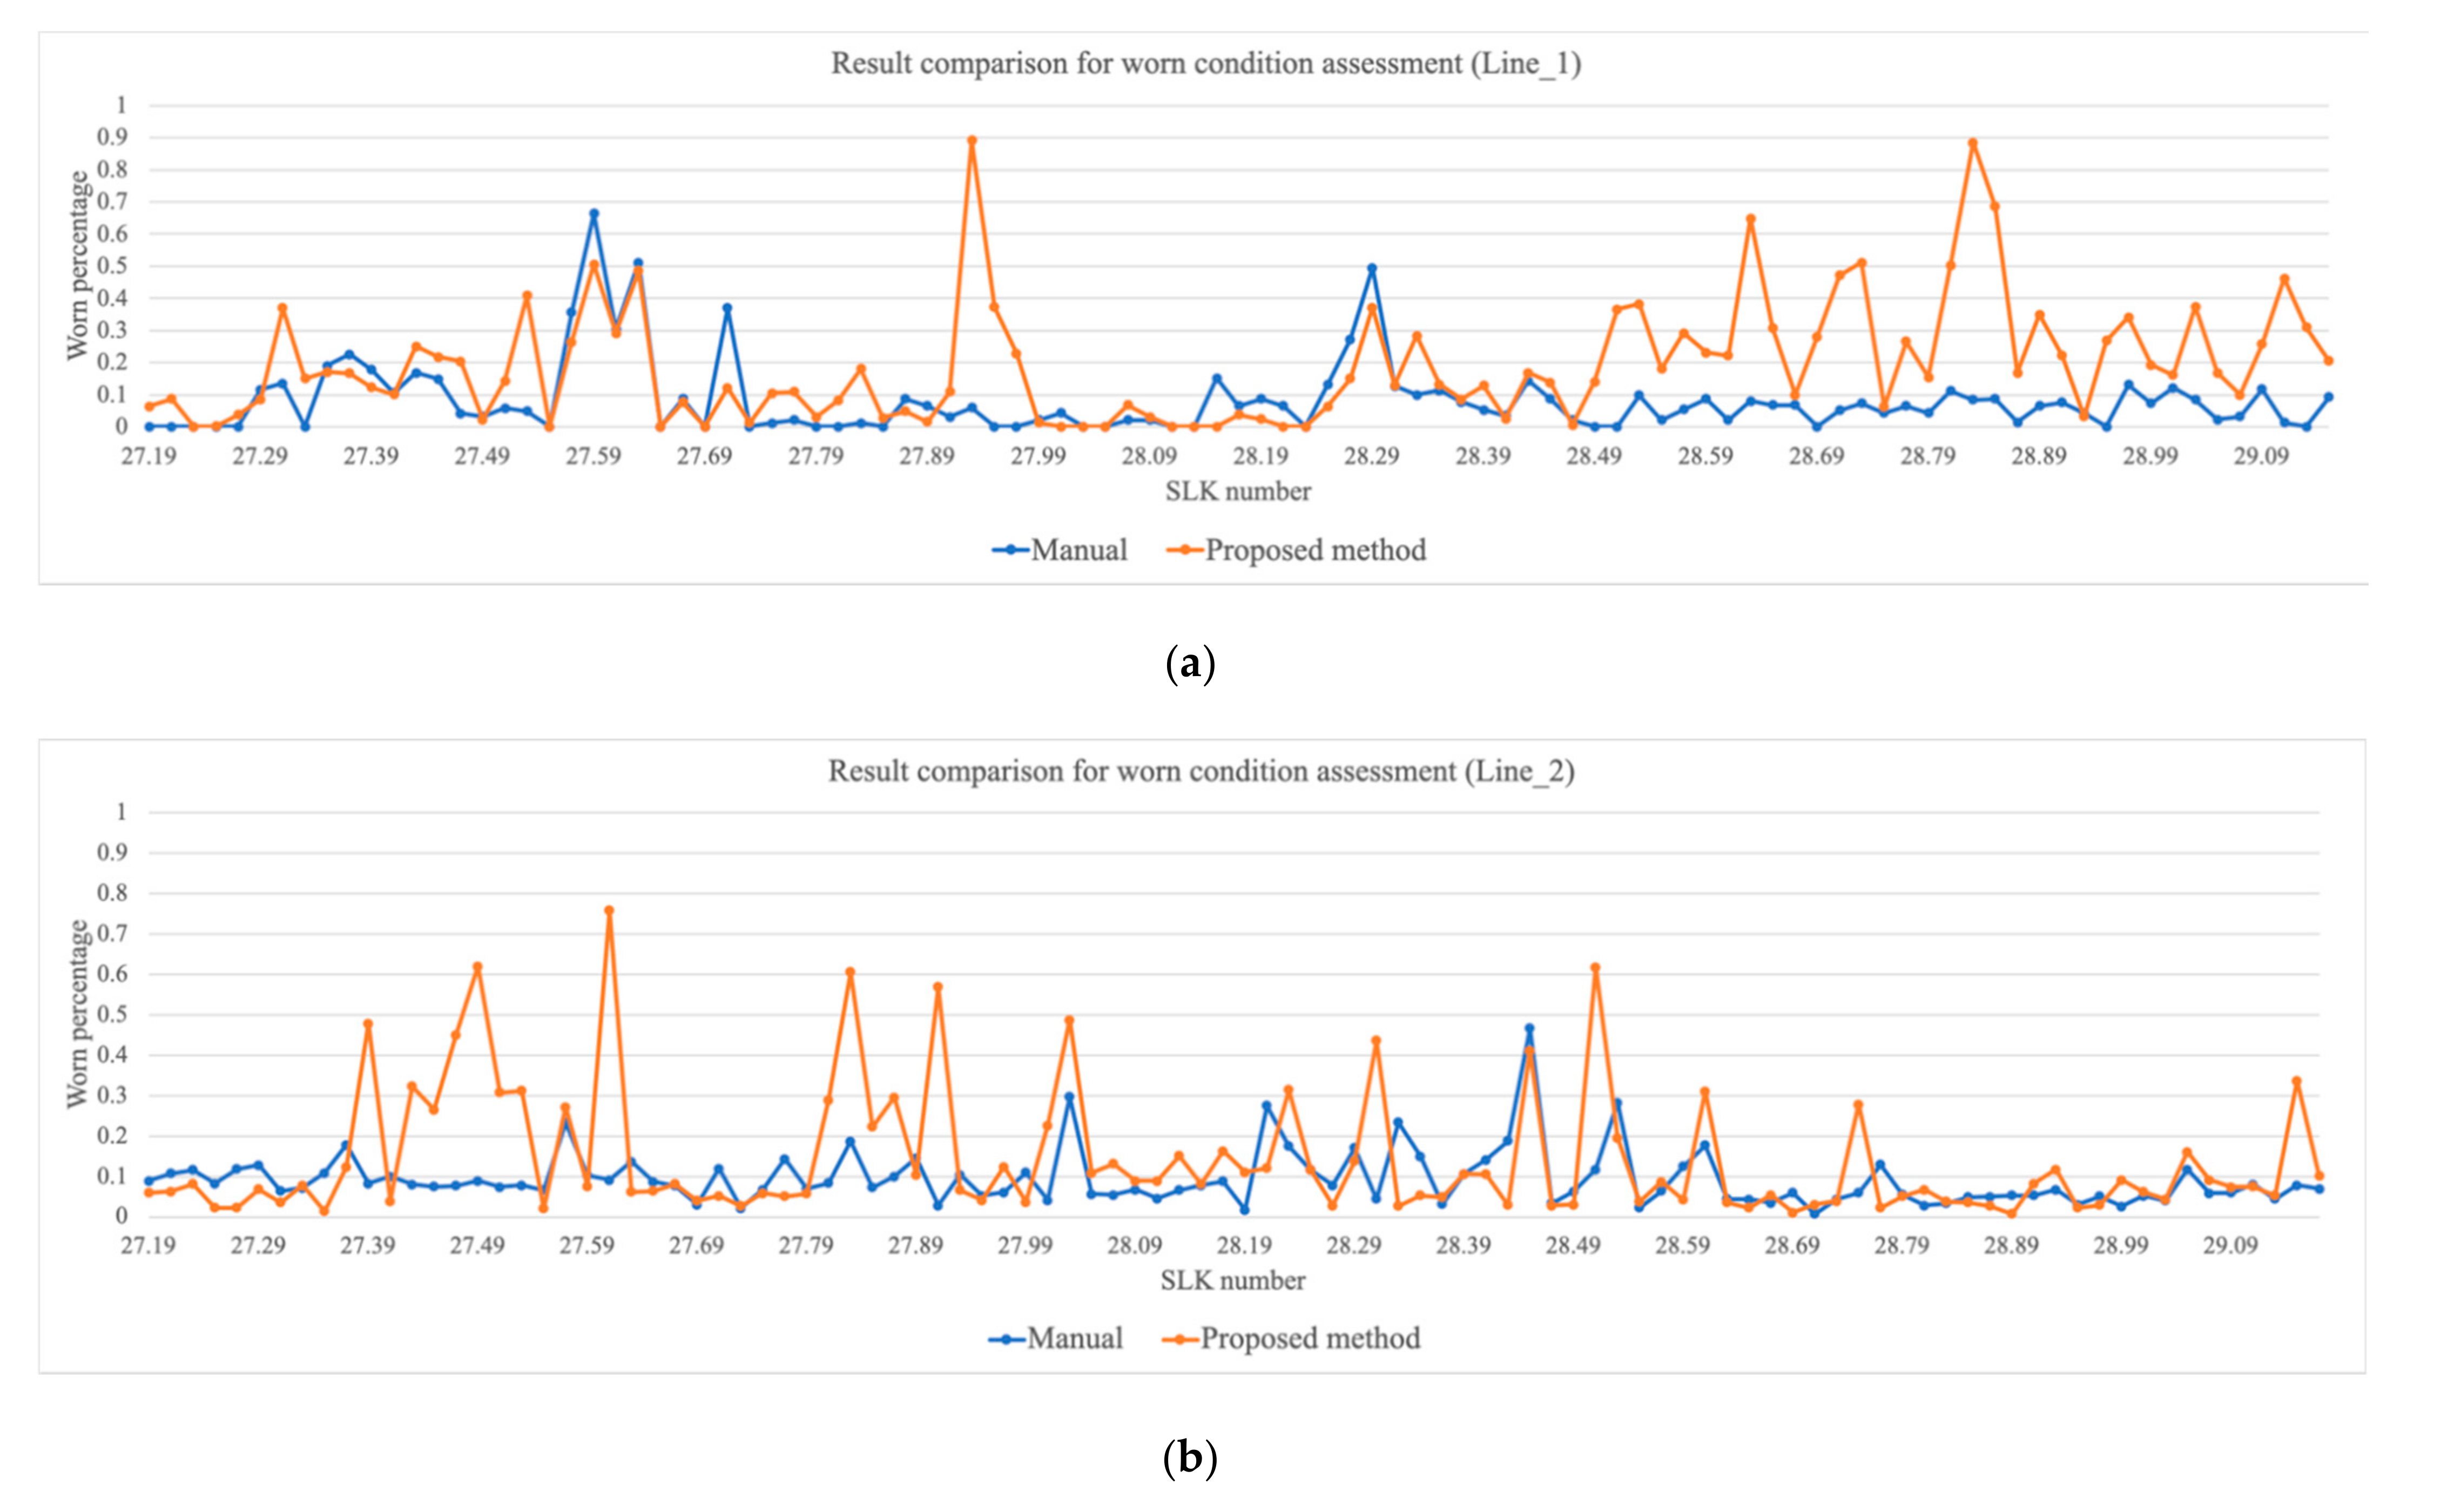
In Figure 8, the worn condition evaluated by the proposed method fits the worn condition assessed through manual measurement, though the former tends to present a higher worn percentage than humans do. For example, it is noted that in Figure 10a, between SLK 27.55 and SLK 27.65, there exists a peak indicating extensive wear of line marking. By referring to the original video data, we found considerable tracing ruts on the marking, as shown in Figure 11a. Similar deteriorations of line marking can be found at SLK 28.23~28.33 (for LINE_1), SLK 28.41~28.47 (for LINE_2 and 3, as shown in Figure 10b, etc. However, there are false warnings for poor marking conditions in both charts (e.g., SLK 27.89~27.99 for LINE_1 and SLK 28.34~28.39 for LINE_3). Such errors are mainly attributed to the color-based feature extractor, which is subject to the changing illuminations and shadows of road-side objects. Figure 12 shows image frame at SLK 27.93, where yellow continuity lines are reduced to only its edges and thereby, received incorrect worn condition results.
In terms of efficiency of the assessment, the manual approach took 3 h per 100 image frames, while the proposed method took less than one minute. Since there is no benchmark readily available in terms of the wear issues of line marking, the proposed method represents a potential option for industrial applications due to its capability to provide instructive information on the condition of pavement markings (e.g., distribution of worn segment), while taking considerably less time.
5. Discussion and Limitations
With regard to the case study results presented in the previous section, this section discusses the limitations of the proposed framework and potential future agendas. Insights into improving the applicability of the proposed scheme are raised based on frequent exploration with our industrial partners as regards practical applications.
In the case study, the removal of perspective effects in original video frames relied on the manual selection of feature points. However, human intervention with the aim of obtaining a satisfactory overhead view of road pavement is not a one-off, since the shooting direction of the camera shifts while the vehicle is moving forward. Figure 13 shows two adjacent frames, where there is a sudden change in camera’s shooting angle. In addition, incremental deviations from the initial camera settings regarding the lane also have adverse impacts on the performance of pre-processing. As a result, re-calibration of the camera is required so as to successfully remove perspective effects in the captured images. A pre-calibrated camera and its stability throughout recording will greatly facilitate the automation.
To apply the proposed condition assessment framework to other pavement markings, such as turning arrows, speed, stop and rail signs, an efficient method to determine their intact contours is essential. Unlike linear markings that have a uniform rectangle shape, other pavement markings tend to present irregular silhouettes due to image distortion and blurring. Noda et al. [45] introduced a generation model to robustly recognize such road markings with changing appearances in a vehicle-mounted camera’s view. Alternatively, deep learning algorithms trained on relevant image datasets can replace image processing techniques and automate the identification, yet their expected contours are still required in order to quantify their worn percentage. For this reason, camera calibration with higher precision levels and stability of the camera throughout the data collection stage could pave the way to generating a baseline for the measurement of worn areas with satisfactory levels of precision.
This research study focused on pavement marking deterioration caused by traffic wear, which typically manifests as blurring. However, the conditions of pavement markings are multi-fold. Another vital property of pavement markings is their reflectorization [1]. Reflectorization is the capability of road markings to be seen under dark driving conditions. Currently, road agencies (e.g., Main Roads Western Australia) employ professional consultants to test the level of reflectivity of pavement markings for their roads. Such events require temporary lane closure, special inspection tools and intensive human effort. Future work should aim to develop an automated approach for the quantification of their reflective properties and potentially investigate the relationship between the appearance of road markings in RGB images and their level of reflectorization, thereby expanding the power of vision systems. When it comes to audio-tactile line markings, their functional integrity is to provide sufficient warning to drivers who start to run off their lane. Both their inventory data and condition should be informed by our industrial partners. As inventory data, road agencies are keen to keep distribution information on pavements in their records. For maintenance decision-making, road owners care about the level wear roads have received. Zhang and Xu [10] assessed their conditions by measuring the elevation of ribs in 3D laser-scanning profile data. The lack of depth information in 2D visual data, therefore, calls for a dimension-independent indicator for assessment of audible marking conditions in images. This will further facilitate the development of an automated, effective, yet cost efficient road management system.
6. Conclusions
Aiming for low-cost, time-efficient and reliable road asset management, this research proposes a vision-based framework to automatically collect the as-is inventory data of road pavements, i.e., line markings, and assess their level of wear. A hybrid detector, integrating color and spatial features, was employed and a threshold-based method was used for line marking identification and classification. Alternative algorithms and classifiers trained by exhausted datasets can be utilized to further improve the performance of this module. Then, the worn condition of identified pavement markings was quantified at the pixel level. By comparing our data with manual measurement results, we have demonstrated that our data show that the proposed method generates instructive information on the distribution of different levels of wear and tear of road markings.
For expanded applicability, the proposed framework should be adapted to other pavement markings (e.g., messages on the pavement) and additional condition indicators. Future studies will also consider including audio-tactile markings into this inspection and management scheme, based on planar visual data.
Author Contributions
Conceptualization, J.W. and P.W.; data curation, J.W. and P.W.; formal analysis, S.X.; funding acquisition, X.W.; investigation, S.X., J.W. and P.W.; methodology, S.X., J.W. and P.W.; project administration, P.W. and W.S.; resources, J.W. and W.S.; software, S.X.; supervision, J.W., X.W. and M.C.; validation, S.X.; visualization, S.X. and J.W.; writing—original draft, S.X.; writing—review and editing, J.W. and P.W. All authors have read and agreed to the published version of the manuscript.
Funding
This research was funded by the Australian Research Council’s Linkage Projects, grant number LP180100222, and Discovery Project, grant number DP180104026.
Institutional Review Board Statement
Not applicable.
Informed Consent Statement
Not applicable.
Data Availability Statement
Not applicable.
Acknowledgments
This research was supported by the Australian Government through the Australian Research Council’s Linkage Projects (#LP180100222) and Discovery Project (#DP180104026).
Conflicts of Interest
The authors declare no conflict of interest.
References
- Traffic Management Traffic Control and Communication Devices. Part 10. In Guide to Traffic Management; Austroads Ltd.: Sydney, Australia, 2019. [Google Scholar]
- Wang, T.; Wang, J.; Wu, P.; Wang, J.; He, Q.; Wang, X. Estimating the Environmental Costs and Benefits of Demolition Waste Using Life Cycle Assessment and Willingness-to-Pay: A Case Study in Shenzhen. J. Clean. Prod. 2018, 172, 17214–17226. [Google Scholar] [CrossRef]
- Wu, C.X.; Wang, M.; Chen, M.J.K. Differential Received Signal Strength Based Rfid Positioning for Construction Equipment Tracking. Adv. Eng. Inform. 2019, 42, 42100960. [Google Scholar] [CrossRef]
- Xu, S.; Wang, J.; Shou, W. Computer Vision Techniques in Construction: A Critical Review. Arch. Computat. Methods Eng. 2020. [Google Scholar] [CrossRef]
- Lei, H.W.; Shaoze, Z.; Guomin, T.; Yongtao, W.X. Literature Review of Digital Twins Applications in Construction Workforce Safety. Appl. Sci. 2021, 11, 339. [Google Scholar]
- Getahun, T.A.; Karimoddini, L.H.; Beni, P.M. A Robust Lane Marking Extraction Algorithm for Self-Driving Vehicles. In Proceedings of the 2018 15th International Conference on Control, Automation, Robotics and Vision, ICARCV 2018, Singapore, 18–21 November 2018; pp. 1779–1784. [Google Scholar]
- Vivacqua, R.P.D.; Bertozzi, M.; Cerri, P.; Martins, F.N.; Vassallo, R.F. Self-Localization Based on Visual Lane Marking Maps: An Accurate Low-Cost Approach for Autonomous Driving. IEEE Trans. Intell. Transp. Syst. 2018, 19, 582–597. [Google Scholar] [CrossRef]
- Kawano, M.K.; Mikami, S.; Yokoyama, T.; Yonezawa, J.N. Road Marking Blur Detection with Drive Recorder. In Proceedings of the 2017 IEEE International Conference on Big Data (Big Data), Boston, MA, USA, 11–14 December 2017; pp. 4092–4097. [Google Scholar]
- Maeda, H.; Sekimoto, Y.; Seto, T.; Kashiyama, T.; Omata, H. Road Damage Detection and Classification Using Deep Neural Networks with Smartphone Images. Comput. Aided Civ. Infrastruct. Eng. 2018, 33, 1127–1141. [Google Scholar] [CrossRef]
- Zhang, D.; Xu, X.; Lin, H.; Gui, R.; Cao, M.; He, L. Automatic Road-Marking Detection and Measurement from Laser-Scanning 3d Profile Data. Autom. Constr. 2019, 108, 102957. [Google Scholar] [CrossRef]
- Hu, J.B.; Zheng, C.; Wang, C.; Zhao, X.; Hou, Q.; Pan, Z.X. A Survey on Multi-Sensor Fusion Based Obstacle Detection for Intelligent Ground Vehicles in Off-Road Environments. Front. Inf. Technol. Electron. Eng. 2020, 21, 675–692. [Google Scholar] [CrossRef]
- Son, J.; Yoo, H.; Kim, S.; Sohn, K. Real-Time Illumination Invariant Lane Detection for Lane Departure Warning System. Expert Syst. Appl. 2015, 42, 1816–1824. [Google Scholar] [CrossRef]
- Parajuli, A.; Celenk, M.; Riley, H.B. Robust Lane Detection in Shadows and Low Illumination Conditions Using Local Gradient Features. Open J. Appl. Sci. 2013, 3, 68. [Google Scholar] [CrossRef] [Green Version]
- Zang, J.; Zhou, W.; Zhang, G.; Duan, Z. Traffic Lane Detection Using Fully Convolutional Neural Network. In Proceedings of the 2018 Asia-Pacific Signal and Information Processing Association Annual Summit and Conference, APSIPA ASC 2018-Proceedings, Honolulu, HI, USA, 12–15 November 2018; pp. 305–311. [Google Scholar]
- Chen, T.Z.; Chen, Q.; Shi, X.H. Road Marking Detection and Classification Using Machine Learning Algorithms. In Proceedings of the 2015 IEEE Intelligent Vehicles Symposium (IV), Shenzhen, China, 19–23 October 2015; pp. 617–621. [Google Scholar]
- Hoang, N.D.Q.L.; Nguyen, D.T.B. Image Processing-Based Classification of Asphalt Pavement Cracks Using Support Vector Machine Optimized by Artificial Bee Colony. J. Comput. Civ. Eng. 2018, 32, 04018037. [Google Scholar] [CrossRef]
- Chun, P.K.; Hashimoto, N.; Kataoka, N.; Kuramoto, M.O. Asphalt Pavement Crack Detection Using Image Processing and Naive Bayes Based Machine Learning Approach. J. Jpn. Soc. Civ. Eng. 2015, 70, 1–8. [Google Scholar]
- Azhar, K.F.; Murtaza, M.H.; Yousaf, H.A.H. Computer Vision Based Detection and Localization of Potholes in Asphalt Pavement Images. In Proceedings of the 2016 IEEE Canadian Conference on Electrical and Computer Engineering (CCECE), Vancouver, BC, Canada, 15–18 May 2016; pp. 1–5. [Google Scholar]
- Jo, Y.S.R. Pothole Detection System Using a Black-Box Camera. Sensors 2015, 15, 29316–29331. [Google Scholar] [CrossRef] [PubMed]
- Tedeschi, A.F.B. A Real-Time Automatic Pavement Crack and Pothole Recognition System for Mobile Android-Based Devices. Adv. Eng. Inform. 2017, 32, 11–25. [Google Scholar] [CrossRef]
- Zalama, E.J.; Gómez-García-Bermejo, R.; Medina, J.L. Road Crack Detection Using Visual Features Extracted by Gabor Filters. Comput. Aided Civil and Infrastruct. Eng. 2014, 29, 342–358. [Google Scholar] [CrossRef]
- Karaköse, M.B.; Akarsu, K.; Parlak, A.; Sarimaden, A.E. A Fast and Adaptive Road Defect Detection Approach Using Computer Vision with Real Time Implementation. Int. J. Appl. Math. Electron. Comput. 2016, 4, 290–295. [Google Scholar]
- Qiu, T.X.; Shi, J.; Wang, Y.; Li, S.; Qu, Q.; Cheng, T.; Cui, S.S. Deep Learning: A Rapid and Efficient Route to Automatic Metasurface Design. Adv. Sci. 2019, 6, 1900128. [Google Scholar] [CrossRef]
- Zhu, Q. Research on Road Traffic Situation Awareness System Based on Image Big Data. IEEE Intell. Syst. 2020, 35, 18–26. [Google Scholar] [CrossRef]
- Mai, X.L.; Tianyi, W.; Zulin, D.; Xin, Y.; Ren, G.Z. Reducing Complexity of Hevc: A Deep Learning Approach. IEEE Trans. Image Process 2018, 27, 5044–5059. [Google Scholar]
- Qian, J.S.; Feng, T.; Tao, Y.; Hu, Y.; Li, Q.; Chen, C.Z. Deep-Learning-Enabled Geometric Constraints and Phase Unwrapping for Single-Shot Absolute 3d Shape Measurement. APL Photonics 2020, 5, 046105. [Google Scholar] [CrossRef]
- Mousavi, A.A.C.; Zhang, S.F.; Masri, G.G. Structural Damage Localization and Quantification Based on a Ceemdan Hilbert Transform Neural Network Approach: A Model Steel Truss Bridge Case Study. Sensors 2020, 20, 1271. [Google Scholar] [CrossRef] [Green Version]
- Chen, H.A.; Chen, L.; Xu, H.; Xie, H.; Qiao, Q.; Lin, K.C. A Deep Learning Cnn Architecture Applied in Smart Near-Infrared Analysis of Water Pollution for Agricultural Irrigation Resources. Agric. Water Manag. 2020, 240, 106303. [Google Scholar] [CrossRef]
- Yue, H.H.; Wang, H.; Chen, K.; Cai, Y.J. Automatic Detection of Feather Defects Using Lie Group and Fuzzy Fisher Criterion for Shuttlecock Production. Mech. Syst. Signal Process. 2020, 141, 106690. [Google Scholar] [CrossRef]
- Ding, L.S.; Li, H.; Gao, Y.-J.; Liu, L.; Huang, Z.D. Adaptive Neural Network-Based Finite-Time Online Optimal Tracking Control of the Nonlinear System with Dead Zone. IEEE Trans. Cybern. 2021, 51, 382–392. [Google Scholar] [CrossRef] [PubMed]
- Ding, L.S.; Li, H.; Gao, C.; Chen, Z.D. Adaptive Partial Reinforcement Learning Neural Network-Based Tracking Control for Wheeled Mobile Robotic Systems. IEEE Trans. Syst. Man. Cybern. Syst. 2020, 50, 2512–2523. [Google Scholar] [CrossRef]
- Zhang, A.K.C.P.; Wang, B.; Li, E.; Yang, X.; Dai, Y.; Peng, Y.; Fei, Y.; Liu, J.Q.; Li, C.C. Automated Pixel-Level Pavement Crack Detection on 3d Asphalt Surfaces Using a Deep-Learning Network. Comput. Aided Civ. Infrastruct. Eng. 2017, 32, 805–819. [Google Scholar] [CrossRef]
- Fan, Z.Y.; Wu, J.; Lu, W.L. Automatic Pavement Crack Detection Based on Structured Prediction with the Convolutional Neural Network. arXiv Prepr. arXiv 2018, 1802, 02208. [Google Scholar]
- Zhang, K.H.; Cheng, B.Z. Unified Approach to Pavement Crack and Sealed Crack Detection Using Preclassification Based on Transfer Learning. J. Comput. Civ. Eng. 2018, 32, 04018001. [Google Scholar] [CrossRef]
- Maeda, H.Y.; Sekimoto, T.S. Lightweight Road Manager: Smartphone-Based Automatic Determination of Road Damage Status by Deep Neural Network. In Proceedings of the 5th ACM SIGSPATIAL International Workshop on Mobile Geographic Information Systems, San Francisco, CA, USA, 31 October–3 November 2016; pp. 37–45. [Google Scholar]
- Qiuping, J.S.; Feng, G.; Wei, C.; Zhuo, J.; Gangyi, H.Y. Unified No-Reference Quality Assessment of Singly and Multiply Distorted Stereoscopic Images. IEEE Trans. Image Process. 2019, 28, 1866–1881. [Google Scholar]
- MathWorks®: Camera Calibrator App in: Computer Vision Toolbox™. 2013. Available online: https://au.mathworks.com/help/vision/ref/cameracalibrator-app (accessed on 11 December 2019).
- Lane-Lines-Detection-Python-Opencv. Available online: https://github.com/tatsuyah/Lane-Lines-Detection-Python-OpenCV (accessed on 11 December 2019).
- Xiong, Z.; Tang, Z.; Chen, X.; Zhang, X.; Zhang, K.; Ye, C. Research on Image Retrieval Algorithm Based on Combination of Color and Shape Features. J. Signal Process. Syst. 2021, 93, 139–146. [Google Scholar]
- Sobel, I.G.F. A 3x3 Isotropic Gradient Operator for Image Processing. A Talk at the Stanford Artificial Project in 1968. Available online: https://www.researchgate.net/publication/285159837_A_33_isotropic_gradient_operator_for_image_processing (accessed on 31 March 2021).
- Forsyth, D.A.J.P. Computer Vision; A Modern Approach; Prentice Hall Professional Technical Reference, Pearson: Saddle River, NJ, USA, 2002. [Google Scholar]
- Canny, J.; Ponce, J. Readings in Computer Vision. In A Computational Approach to Edge Detection; Morgan Kaufmann: San Francisco, CA, SUA, 1987. [Google Scholar]
- Duda, R.O.; Hart, P.E. Use of the Hough Transformation to Detect Lines and Curves in Pictures; Artificial Intelligence Center, Sri International: Menlo Park, CA, USA, 1971. [Google Scholar]
- Australian Standard Manual of Uniform Traffic Control Devices. Part 2: Traffic Control Devices for General Use; Queensland Government: Brisbane, Australia, 2009; Volume 1742, pp. 2–2009.
- Noda, M.T.; Takahashi, I.; Ide, H.; Murase, Y.; Kojima, T. Naito: Recognition of Road Markings from in-Vehicle Camera Images by a Generative Learning Method; MVA: Leonardtown, MD, USA, 2009; pp. 514–517. [Google Scholar]
Figure 1.
Examples of pavement markings in poor condition. (a) Edge line (left side) is worn down and even missing; (b) turning arrows and continuity line (right side) are blurred.
Figure 1.
Examples of pavement markings in poor condition. (a) Edge line (left side) is worn down and even missing; (b) turning arrows and continuity line (right side) are blurred.

Figure 2.
Flowchart of vision-based lane line detection.

Figure 3.
Test of the feature extraction method on pavement images. (a) Original images; (b) results of inverse perspective transform; (c) results of feature extraction.
Figure 3.
Test of the feature extraction method on pavement images. (a) Original images; (b) results of inverse perspective transform; (c) results of feature extraction.

Figure 4.
Test of the segmentation method on pavement images. (a) Planar images; (b) results of Canny edge detection; (c) results of Hough line transform and grouping.
Figure 4.
Test of the segmentation method on pavement images. (a) Planar images; (b) results of Canny edge detection; (c) results of Hough line transform and grouping.

Figure 5.
Hierarchical structure for training dataset.

Figure 6.
Flowchart of case study.

Figure 7.
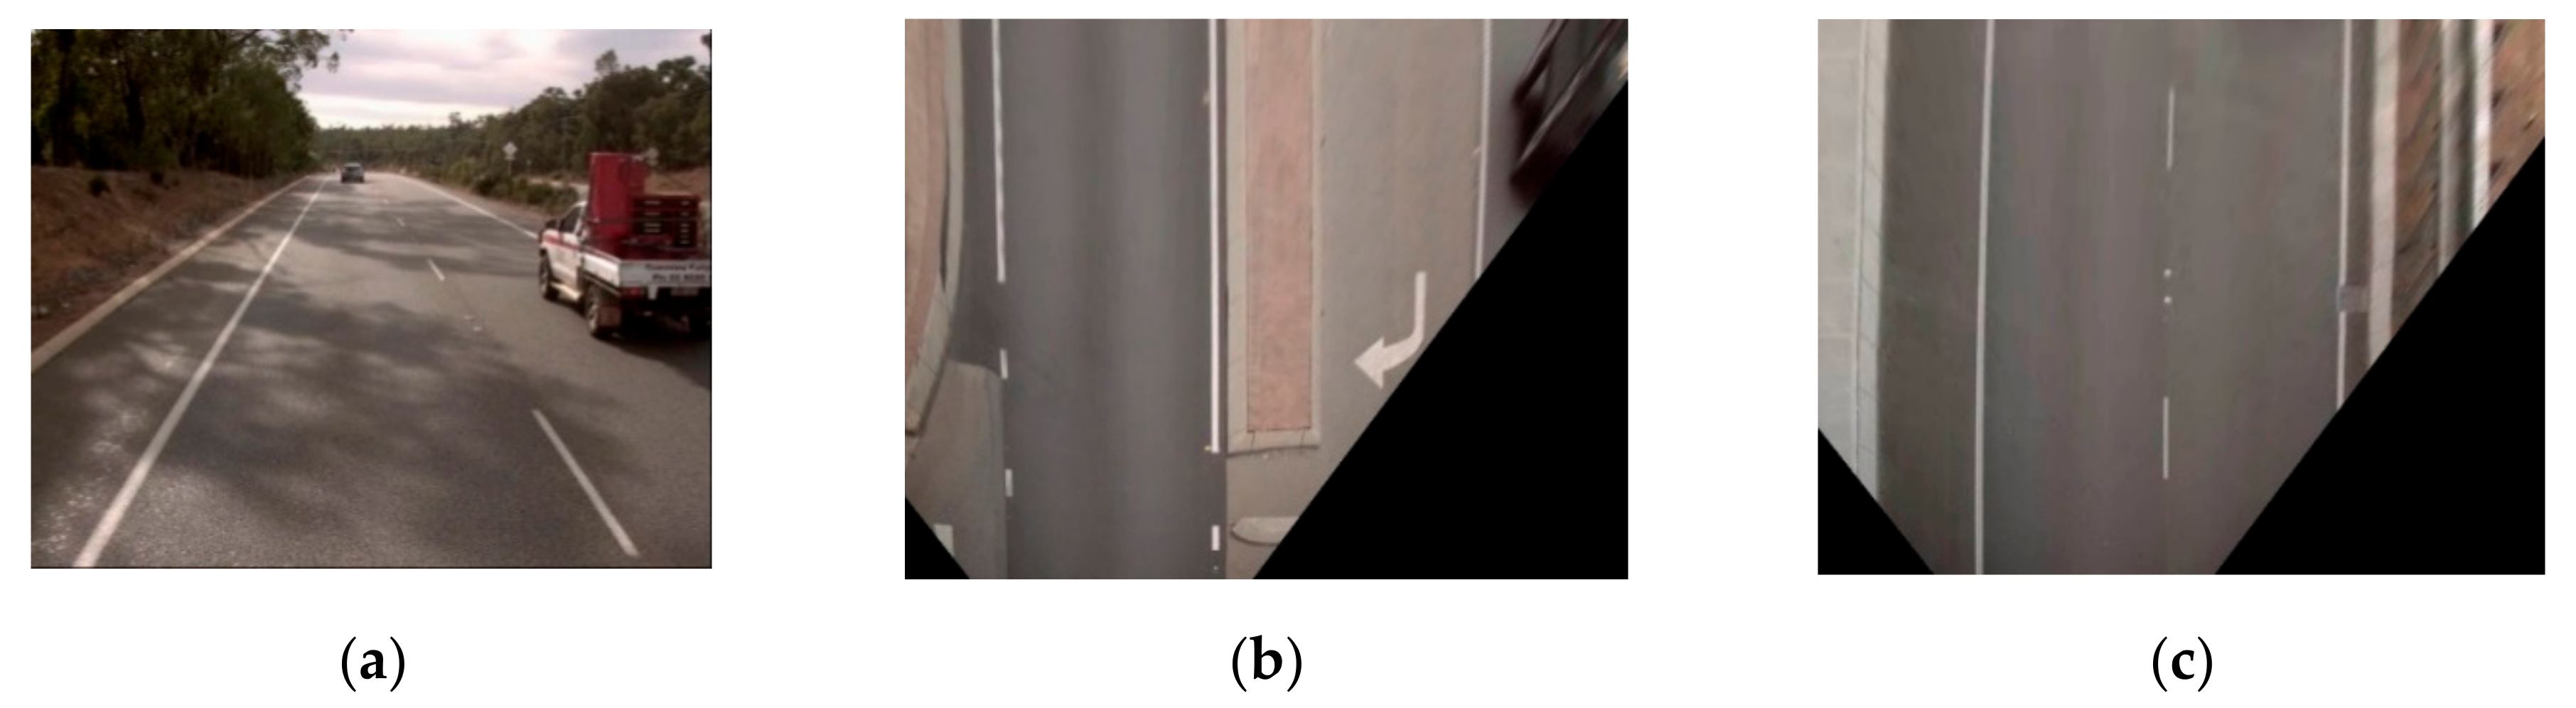
Illustrations of image processing steps, including: (a) original image; (b) bird’s eye view image; (c) output of hybrid descriptor; (d) output of Canny detector; (e) result of Hough transform; (f) result of segmentation.
Figure 7.
Illustrations of image processing steps, including: (a) original image; (b) bird’s eye view image; (c) output of hybrid descriptor; (d) output of Canny detector; (e) result of Hough transform; (f) result of segmentation.

Figure 8.
Example of polished pavement.

Figure 9.
Other noises affecting classification, including: (a) occlusion from other vehicles; (b) curb; (c) road-side railings.
Figure 9.
Other noises affecting classification, including: (a) occlusion from other vehicles; (b) curb; (c) road-side railings.

Figure 10.
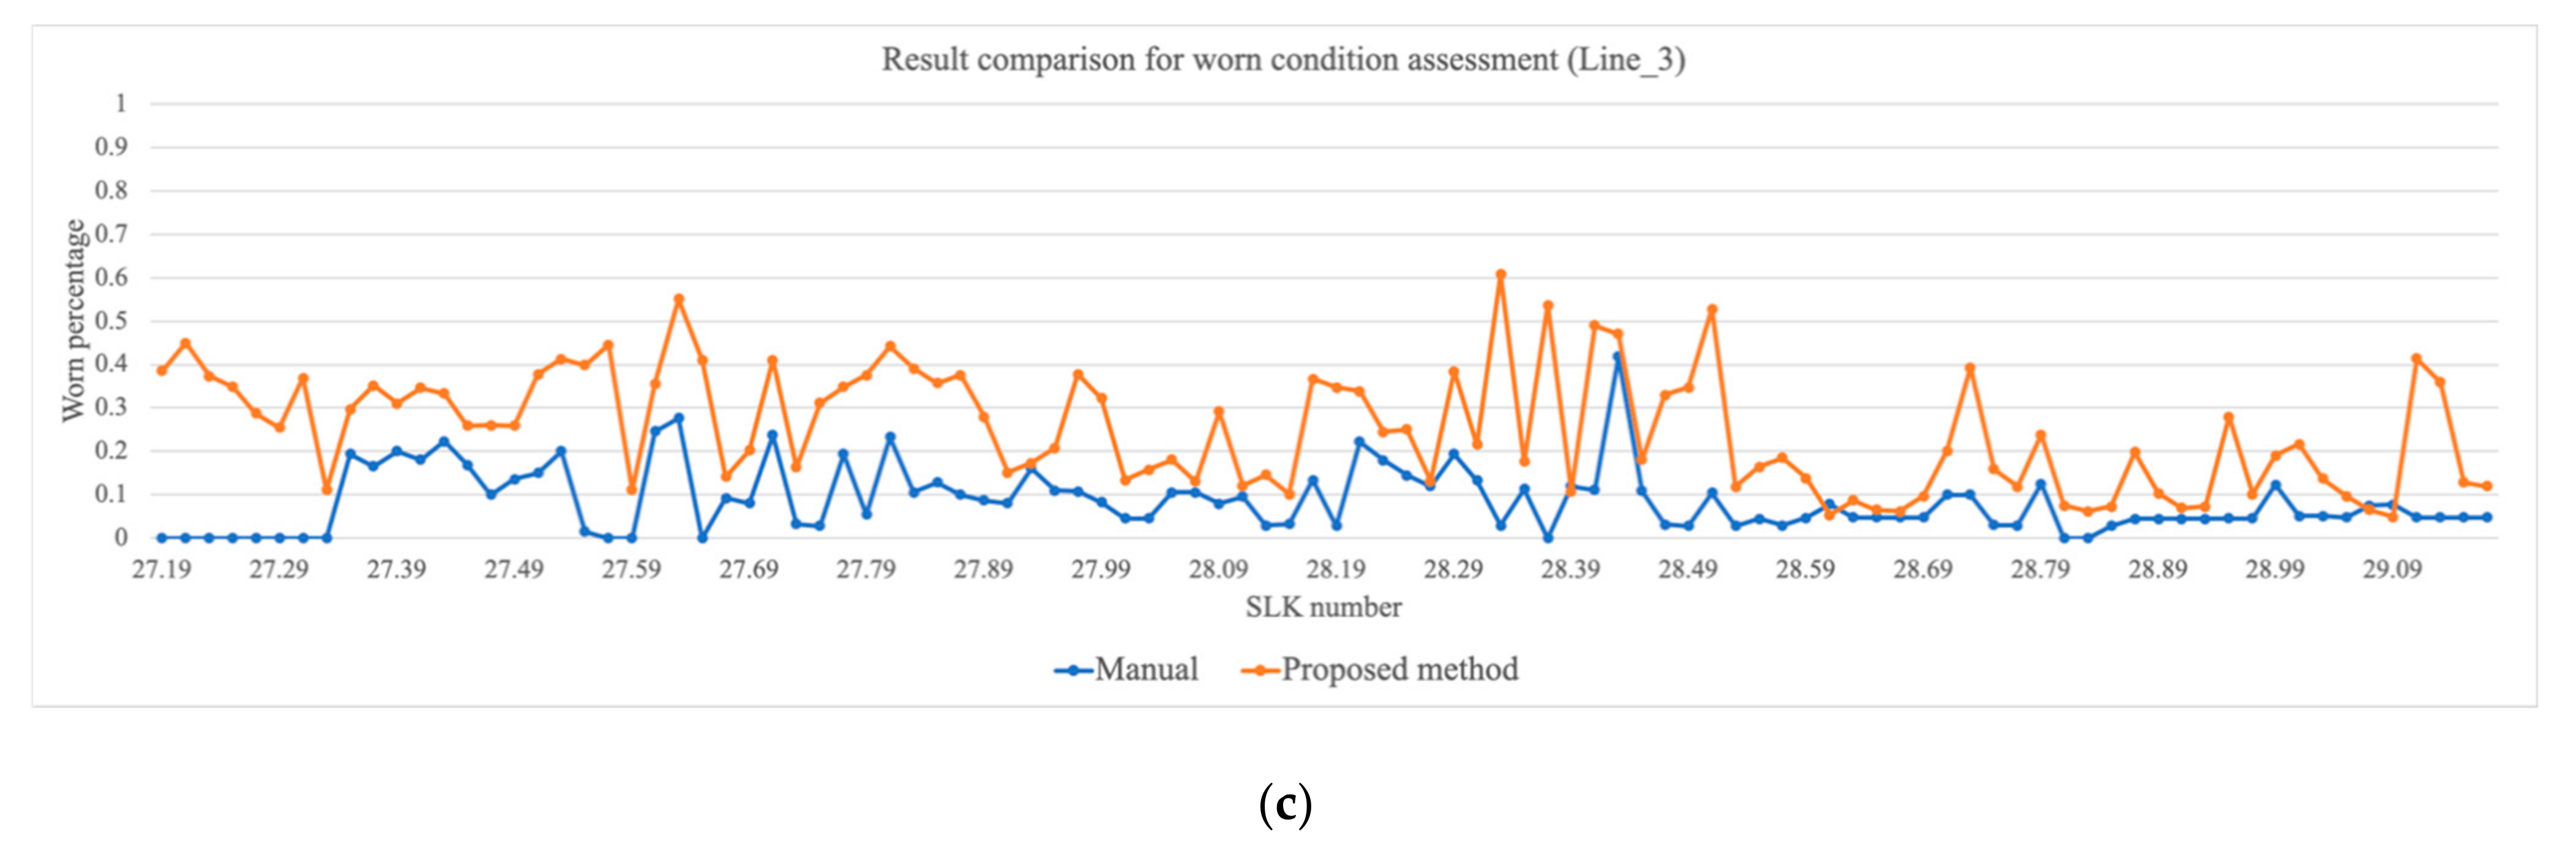
Comparison of worn condition assessment results. (a) Result comparison for Line 1; (b) result comparison for Line 2; (c) result comparison for Line 3.
Figure 10.
Comparison of worn condition assessment results. (a) Result comparison for Line 1; (b) result comparison for Line 2; (c) result comparison for Line 3.


Figure 11.
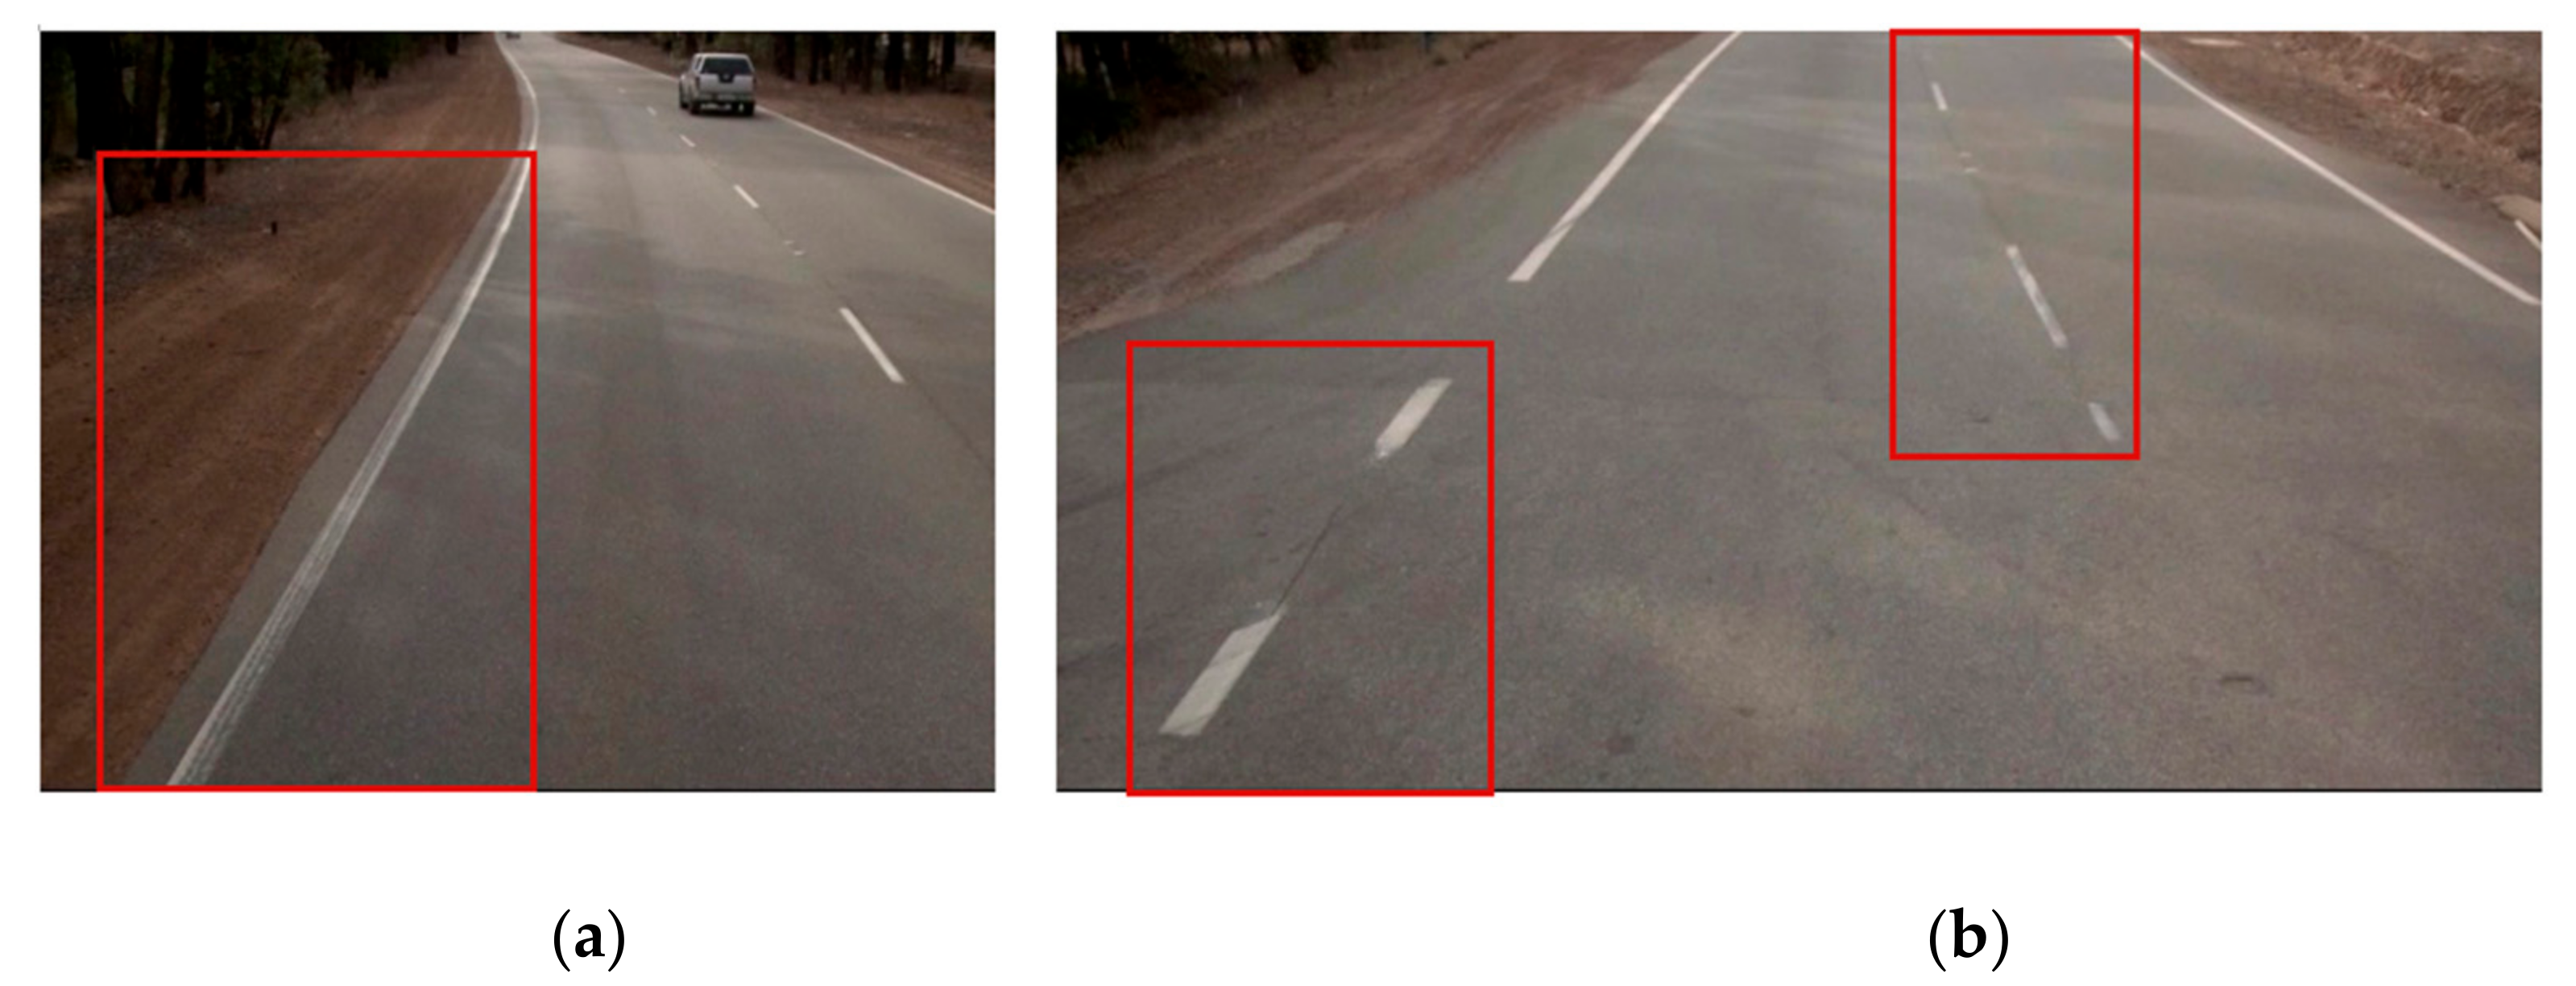
Example frames of worn line marking. They are located at (a) SLK 27.59; (b) SLK 28.45, separately.
Figure 11.
Example frames of worn line marking. They are located at (a) SLK 27.59; (b) SLK 28.45, separately.

Figure 12.
Example frame of false worn condition. (a) Planar image; (b) binary feature map of the yellow line marking.
Figure 12.
Example frame of false worn condition. (a) Planar image; (b) binary feature map of the yellow line marking.

Figure 13.
Example of camera shift during recording. (a) Previous frame; (b) next frame.


Table 1.
Common categories of longitudinal line markings (Adapted from the Australia Standards [44]).
Table 1.
Common categories of longitudinal line markings (Adapted from the Australia Standards [44]).
| Code | Type | Standard Pattern | Dimensions |
|---|---|---|---|
| 1 | Dividing line | Broken single line | Length of painted stripes = 3 m; Length of the gap between = 9 m |
| 2 | Barrier line (Double two-way) | Two parallel lines, both continuous | N/A |
| 3 | Barrier line (Double one-way) | Two parallel lines, one continuous and the other broken | See Dividing line |
| 4 | Continuity line | Broken single line | Length of painted stripes = 1 m; Length of the gap between = 3 m |
| 5 | Single barrier line | Continuous line | Width = 80/100/150 mm |
| Edge line | |||
| Lane line | |||
| Transition line | |||
| N/A | Audio-tactile marking | A line of small projections, i.e., ribs | Rib length = Line width |
Table 2.
Line marking classification results.
| Code | 01 | 02 | 03 | 04 | Overall |
|---|---|---|---|---|---|
| Type(s) | Dividing line | Edge line; | Continuity line | Others | |
| Transition line; | |||||
| Lane line | |||||
| Accuracy | 0.92 | 0.87 | 0.85 | 0.92 | 0.89 |
Accuracy is the ratio of successfully classified samples to all samples.
Publisher’s Note: MDPI stays neutral with regard to jurisdictional claims in published maps and institutional affiliations. |
© 2021 by the authors. Licensee MDPI, Basel, Switzerland. This article is an open access article distributed under the terms and conditions of the Creative Commons Attribution (CC BY) license (https://creativecommons.org/licenses/by/4.0/).
Share and Cite
MDPI and ACS Style
Xu, S.; Wang, J.; Wu, P.; Shou, W.; Wang, X.; Chen, M. Vision-Based Pavement Marking Detection and Condition Assessment—A Case Study. Appl. Sci. 2021, 11, 3152. https://0-doi-org.brum.beds.ac.uk/10.3390/app11073152
AMA Style
Xu S, Wang J, Wu P, Shou W, Wang X, Chen M. Vision-Based Pavement Marking Detection and Condition Assessment—A Case Study. Applied Sciences. 2021; 11(7):3152. https://0-doi-org.brum.beds.ac.uk/10.3390/app11073152
Chicago/Turabian StyleXu, Shuyuan, Jun Wang, Peng Wu, Wenchi Shou, Xiangyu Wang, and Mengcheng Chen. 2021. "Vision-Based Pavement Marking Detection and Condition Assessment—A Case Study" Applied Sciences 11, no. 7: 3152. https://0-doi-org.brum.beds.ac.uk/10.3390/app11073152
Note that from the first issue of 2016, this journal uses article numbers instead of page numbers. See further details here.