Article

Digital Modelling of Underground Volumes, Including the Visualization of Confidence Levels for the Positioning of Subsurface Objects

HEPIA, inPACT Institute, HES-SO University of Applied Sciences and Arts Western Switzerland, 1202 Geneva, Switzerland
*
Author to whom correspondence should be addressed.
Submission received: 5 February 2021 / Revised: 1 April 2021 / Accepted: 5 April 2021 / Published: 13 April 2021
(This article belongs to the Special Issue BIM and Its Integration with Emerging Technologies)

Abstract

:
This paper addresses the issue of offering a consistent 3D visual rendering of subsurface objects when databases face non-completion. Digital modelling of subsurface objects, like utility lines, underground buildings or tree roots, is a difficult task. Data available are incomplete and not precise. The in situ acquisition of existing objects to increase data quality is complex and, therefore, costly. In this paper, a methodology to obtain missing spatial and geometrical data through field or empirical means is proposed. In addition, confidence levels are assigned to existing and derived spatial and geometrical attributes. They are consolidated on a class level and visualized through a bounding shape, called secondary object.

1. Introduction

The increasing utilization of urban underground space (UUS) worldwide affects the field of construction [1]. This development should articulate with the functional needs of cities [2]. In particular, increasing the UUS density offers advantages to better manage the future energy demand in metropolitan areas [3]. The Underground Sustainable Project Appraisal Routine (Uspear) provides a framework to evaluate and improve subsurface projects [4]. Digital modelling and visualization of underground spatial occupation contributes to better management of the aforementioned challenges, to plan new facilities, to avoid damaging utility lines when excavating and, in consequence, economic losses.
The “Underground project”, financed by Swisstopo and the state of Geneva [5], identified subsurface areas as valuable spaces for construction in densely populated urban areas. It developed first use cases and introduces a structure for the digital representation of subsurface objects. The study showed that available data compared to data needed for use cases are heterogeneous, incomplete and imprecise. Although the Geneva state database is renowned for being the most complete one in Switzerland, it misses, e.g., depth information for most of the utilities, moreover the location and geometry of objects are not as accurate as for surface elements.
Interviews with experts in Geneva [6] indicated, that ground-penetrating radar (GPR) can be employed as a non-destructive measurement technology to obtain missing data for existing networks. However, barriers like cost, lack of precision, an important investment in data reprocessing or simply the time needed to obtain all required information, are identified. The UK-based project Mapping the Underworld (MTU) exposes ray tracing [7] as a good candidate to overcome visualizing related challenges.
This leads to the conclusion, that verification to increase data quality is, compared to similar activities for surface objects, difficult and costly. In addition, data are stored in multiple different BIM/GIS (Building Information Modeling/Geographical Information System) formats.
Use cases employing subsurface information, like energy demand estimation on small scale to assess the return of average building retrofits [8], would benefit from linking BIM and GIS data. Interoperability for BIM systems is supported worldwide by buildingSMART international, in particular by their Industry Foundation Classes (IFC) standard. Pauwels [9] proposes to use Web ontology language (OWL) to specify IFC. An OWL representation facilitates the mapping between data models, like BIM/IFC and GIS/CityGML (an open data model and XML-based format). Semantic web technologies are key in interconnecting BIM Infra GIS and energy application areas.
Several proposals have been made to provide convergence for BIM and GIS data structures, e.g., by [10,11,12]: Stouffs [12] uses a triple grammar approach: an initial BIM/IFC graph type, a GIS/CityGML target graph type and a correlation graph to match both of them: this approach is graph-driven.
Adouane [10] treated the conversion of a BIM/IFC towards GIS/CityGML for a building office. The conversion applies a BIM-server to store building data, dedicated mapping for semantics, as well as a series of geometric algorithms to match GIS/CityGML requirements: this approach is model-driven. His methodology has been validated on a general architectural model containing complex geometries.
Biljecki [11] developed a CityGML ADE (application domain extension) to proceed with the conversion on a GIS/CityGML platform: this approach is system-driven. The conversion strategy has been tested in collaboration with the Building and Construction Authority (BCA) of Singapore.
Structuring real-world objects for digital representation is a fundamental requirement: Xu and Cai [13] present a framework for the description and depth management of heterogeneous datasets of underground utilities. They use an ontology, relying on four linked sub-ontologies. Two of them are dedicated to spatial management. Objects are represented via a set of primitives like points, lines, polygons, envelopes or solids in the GEO sub-ontology. In addition to spatial information, restrictions defining relations among objects, like minimal distances between water pipes, are stored in the USRO sub-ontology. This allows to check construction code compliance via SPARQL [14] requests. However, the approach is limited to utility lines without using completion strategies nor confidence intervals.
A case of data incompleteness and corresponding semantic reconstitution is proposed in [15] to find the correct semantic for city objects which are only represented by their geometry. An automated workflow uses heuristics to identify the type of geometrical objects. Surfaces can be classified as walls, slabs or roofs.
Information related to precision in GIS Layers can be modelled using the fuzzy set theory. Hwang [16] developed a membership function to qualify the level of precision of an object’s geo-positioning. The FOOSBALL prototype [17,18] integrates membership functions into queries, assigning a confidence level to query results.
Olde Scholtenhuis et al. [19] propose adding a fuzzy utility zone to the utility network application domain extension (ADE) [20]. This zone integrates precision information to the positioning of objects.
Techniques for visualizing uncertainty presented in [21] show alternatives in expressing the confidence level associated with a point representation on a 2D map. The quantitative assessment of uncertainty parameters based on topographic predictions can be undertaken through the use of a series of estimators enumerated in [22] (e.g., Bias, RBias, ARAD, STD, RMSE).
Approaches mentioned above provide solutions to integrate data available in diverse formats, using mapping approaches based on ontologies. IFC and CityGML mainly cover surface objects or isolated groups of subsurface objects (utility network ADE [20]). Only limited solutions in terms of data completion and appreciation of confidence levels can be found. There is no coherent strategy that classifies existing subsurface objects, completes missing data and assigns confidence levels to the derived attributes, which are finally consolidated on an object-class level.
Research presented in this paper is part of the InnoSubsurface project, funded by the Swiss innovation agency grant number 35265.1 IP-ICT. The project exploits open government data from the State of Geneva [23] by a resource description framework (RDF triple store), providing interoperability between BIM, GIS ontologies and a minimal model for subsurface objects (Figure 1). If required, the data are completed [24,25], such that a full description of the geometric primitives of subsurface objects is possible. The entire workflow has been tested on two subsurface volumes in Geneva and feasibility demonstrated by the implementation partner [26].
This paper concentrates on the description of strategies to complete missing geometric attributes, integrating a probabilistic approach to indicate the interval of 3D spatial confidence for the obtained results (SHACL, Figure 1). Confidence levels are visualized by a twofold object representation in the frontend of the system.

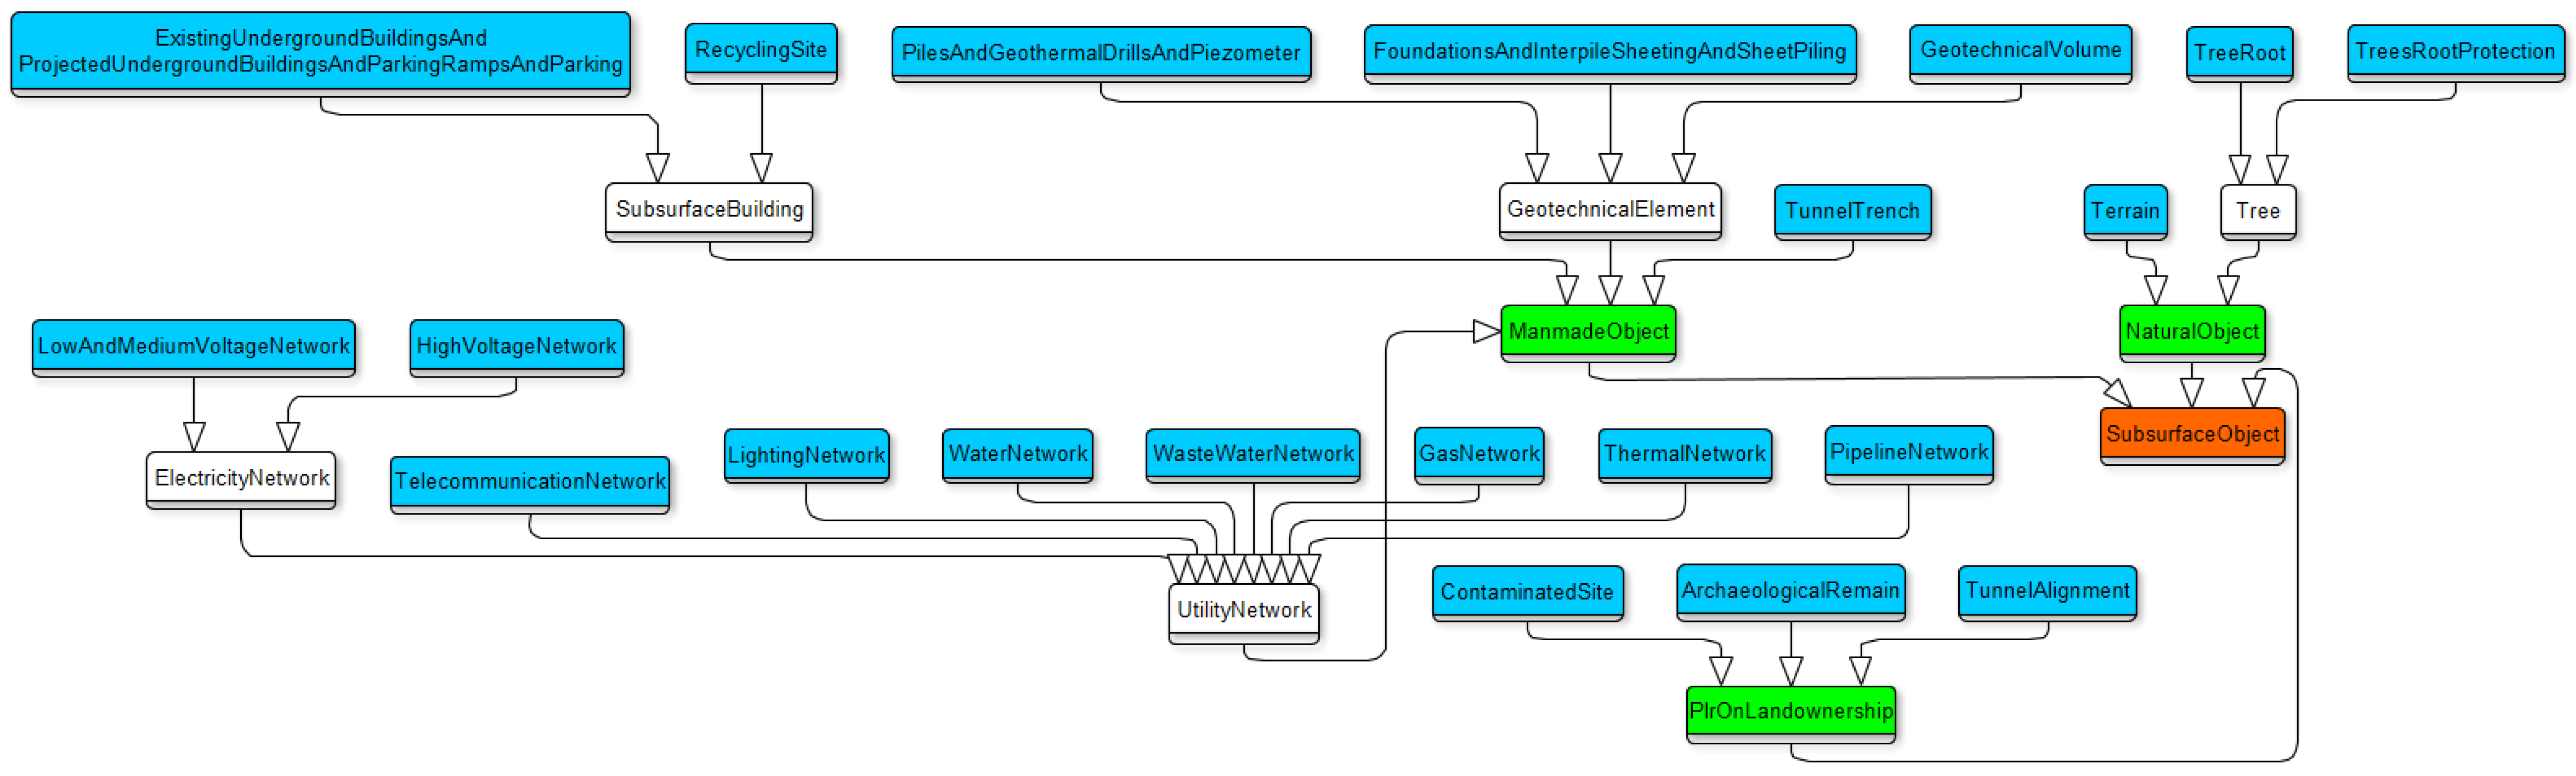
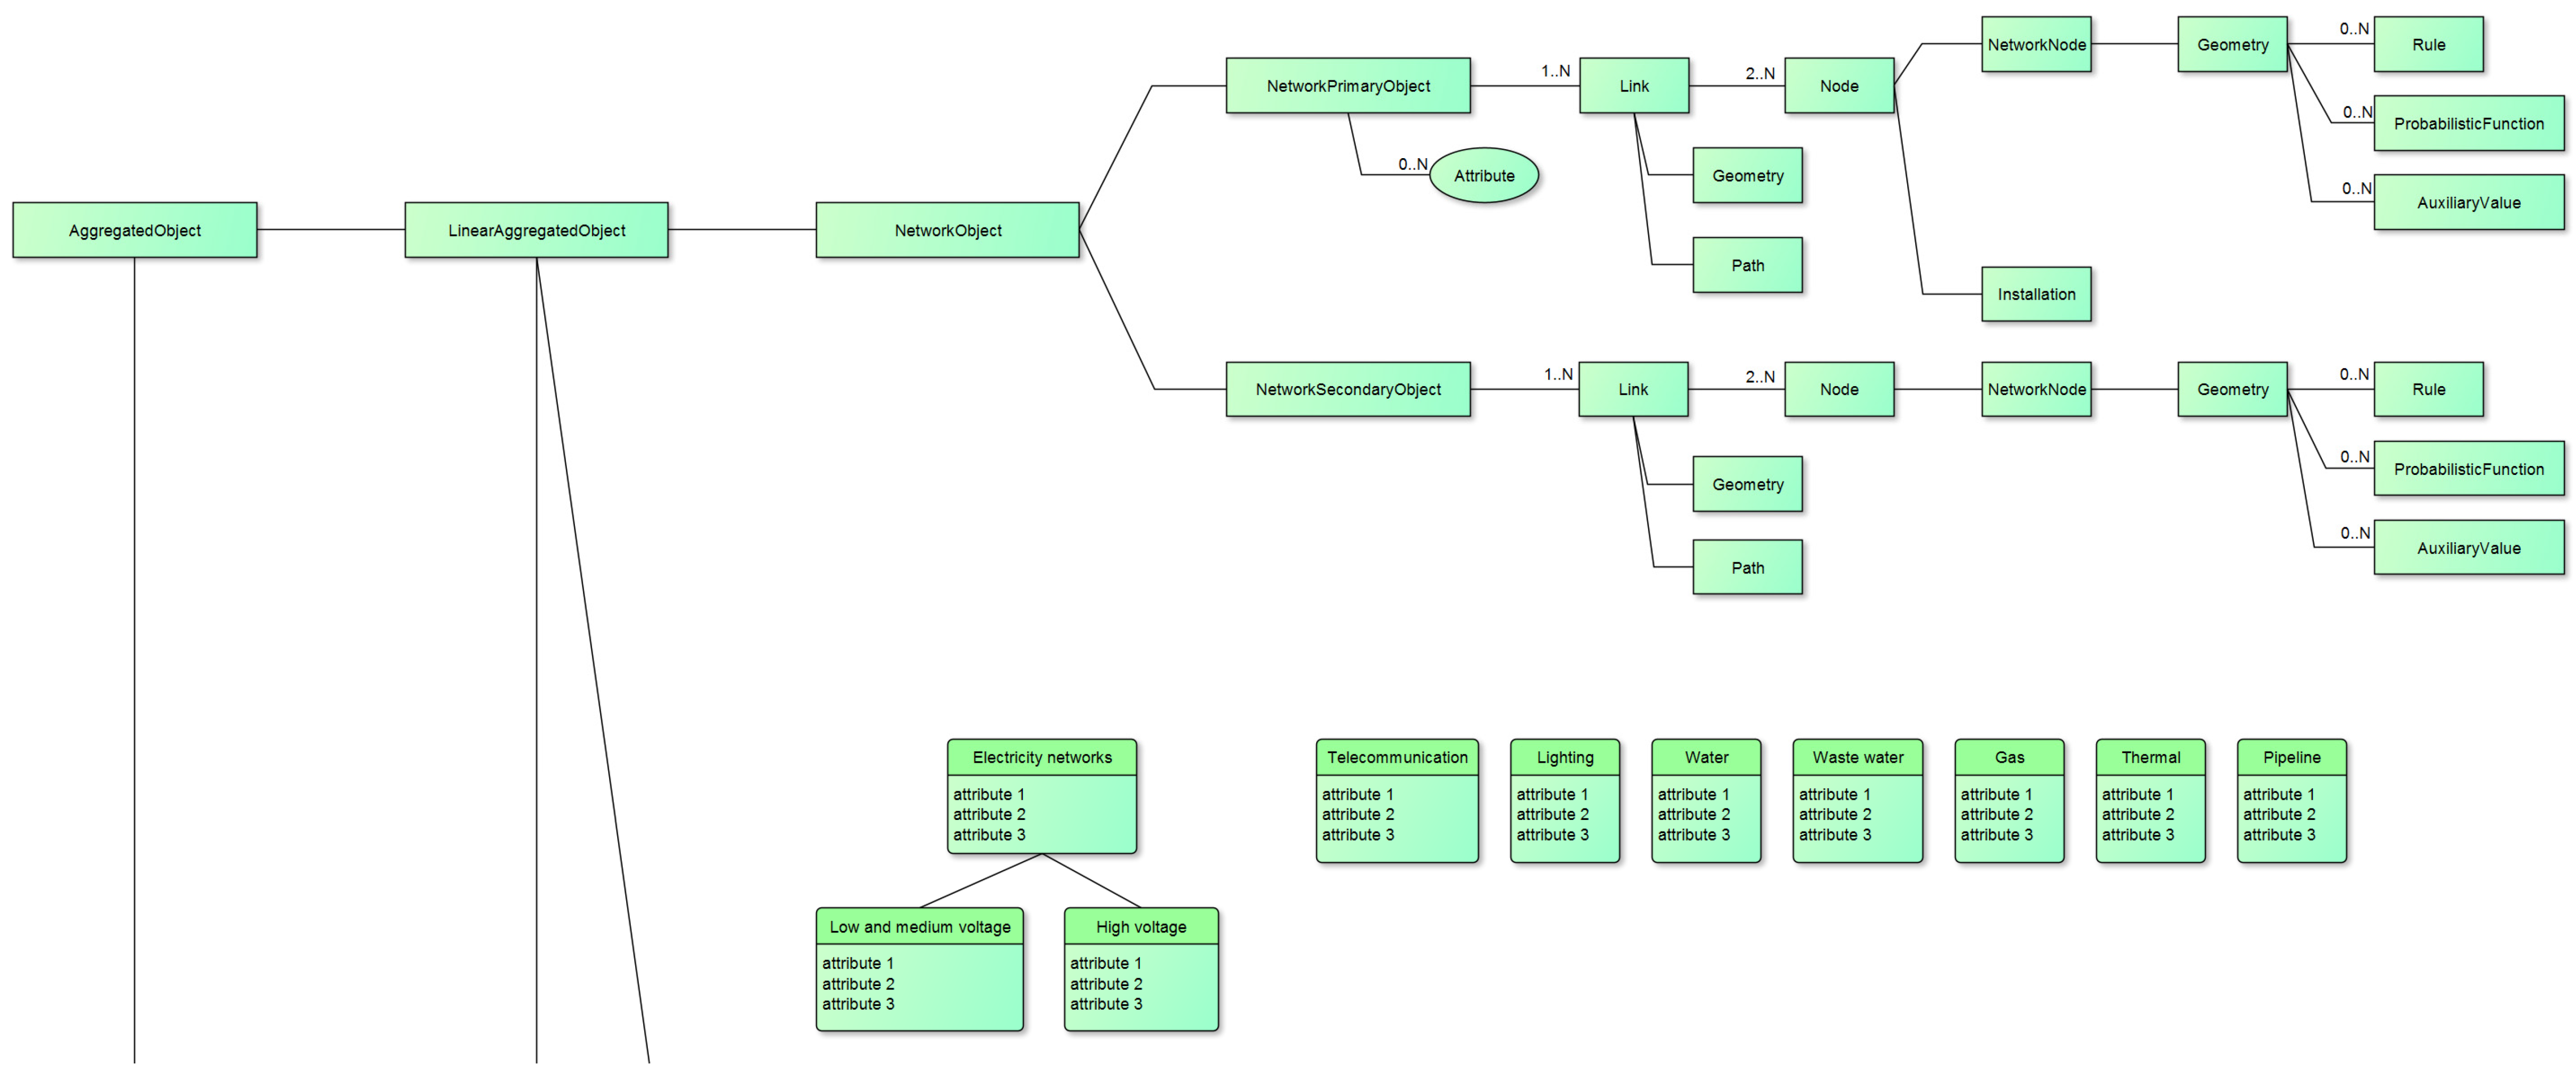
2. Methodology to Complete Missing Spatial and Geometrical Attributes

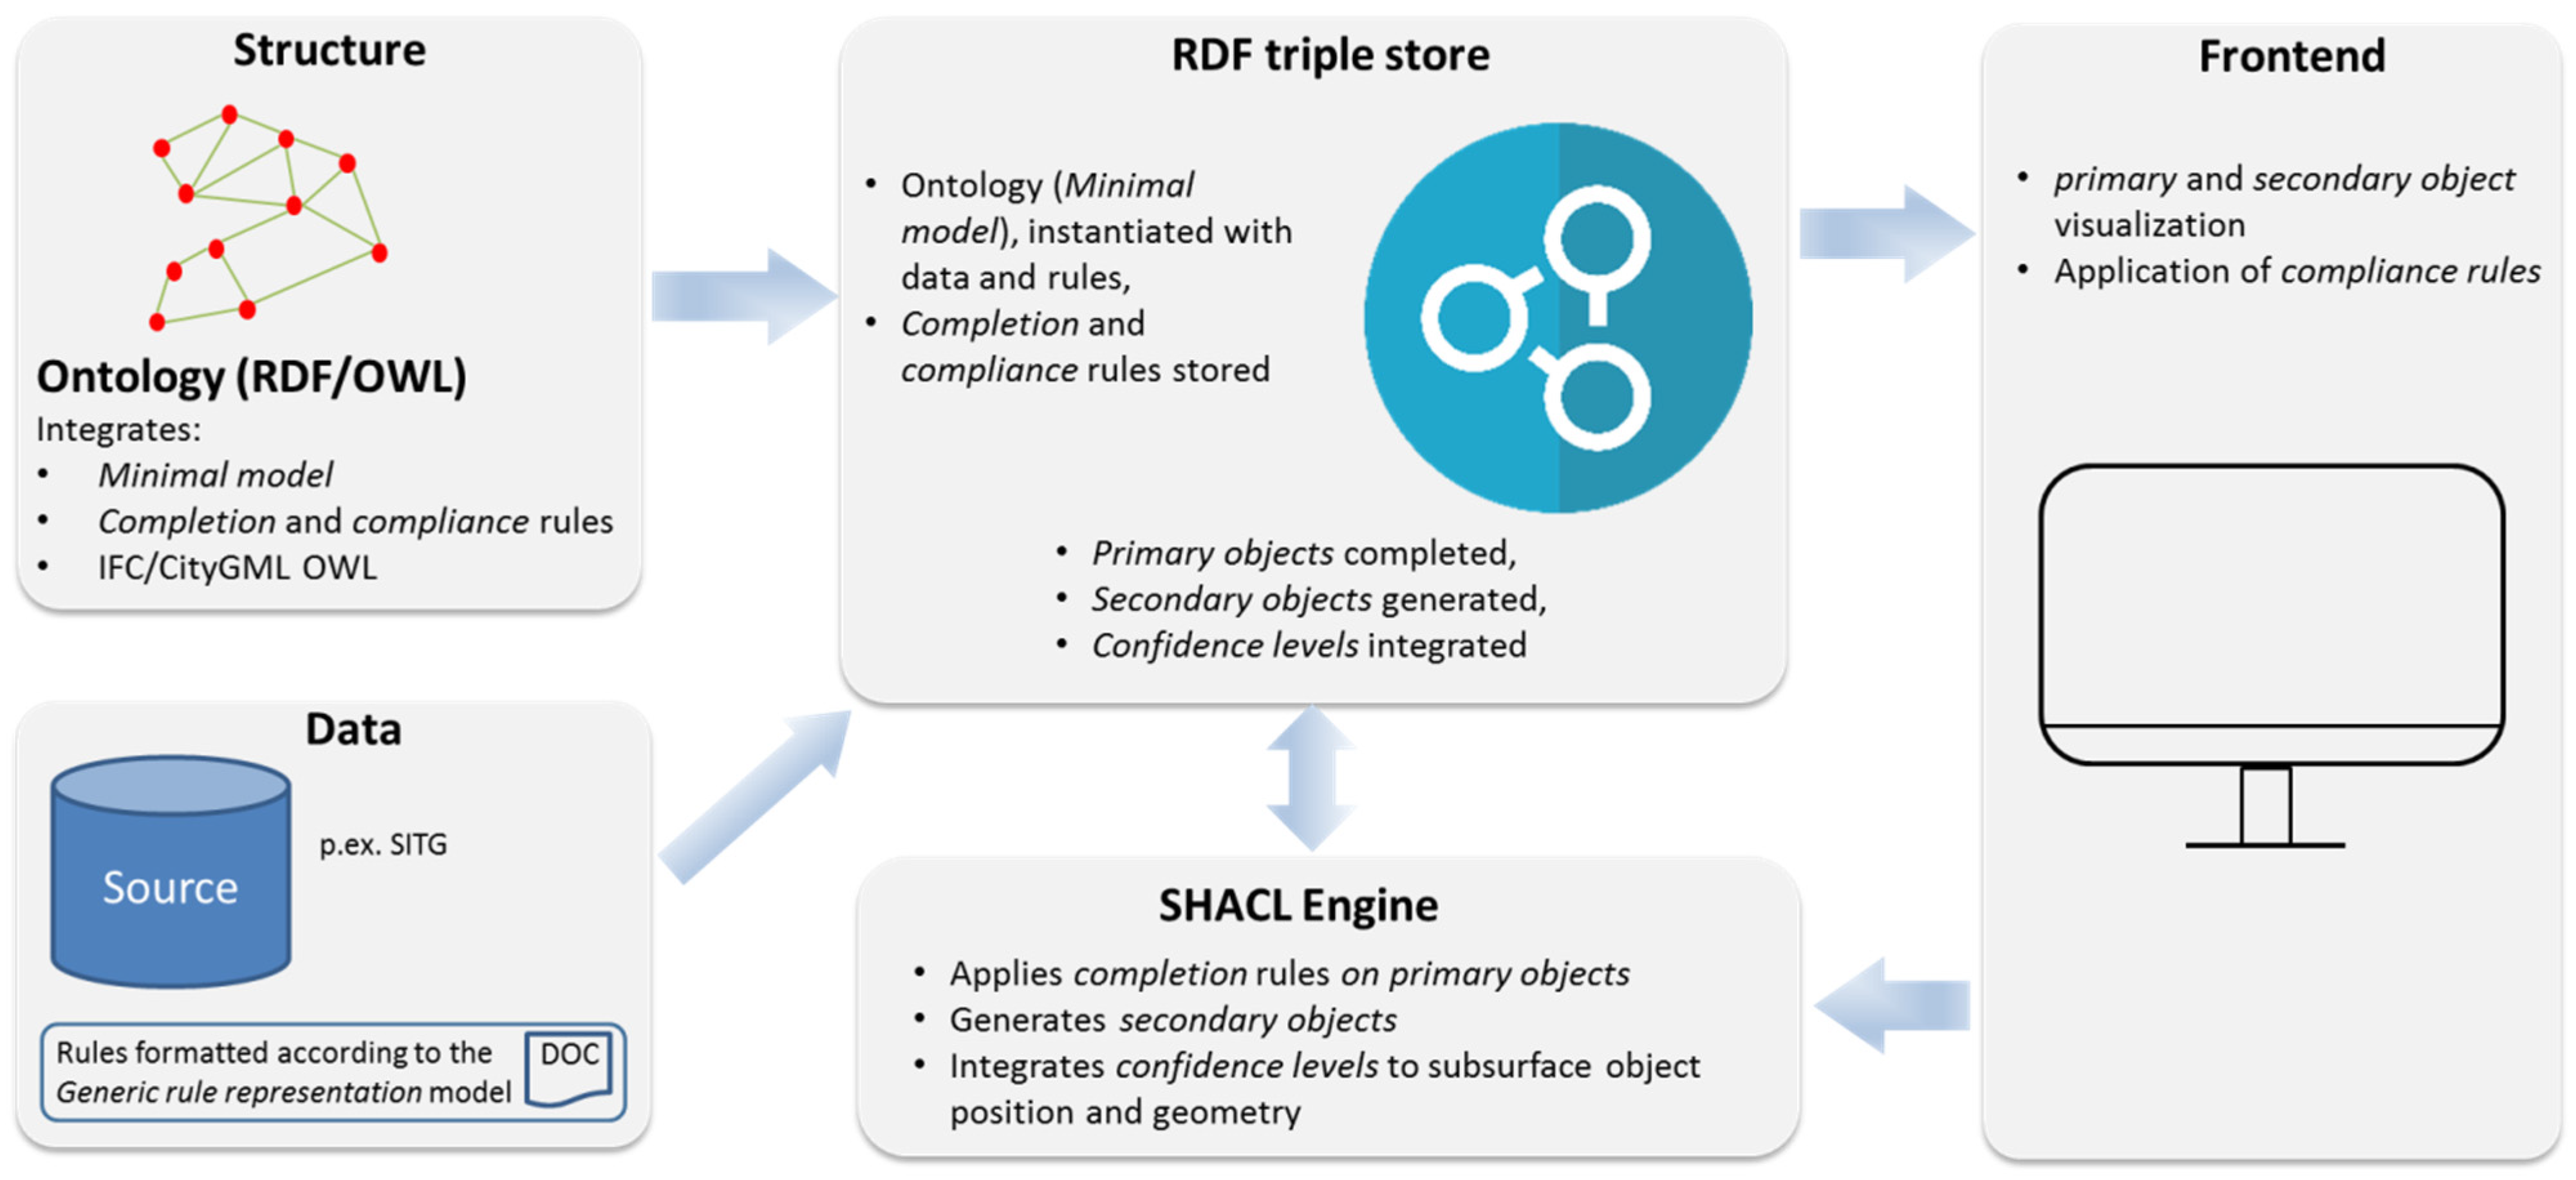
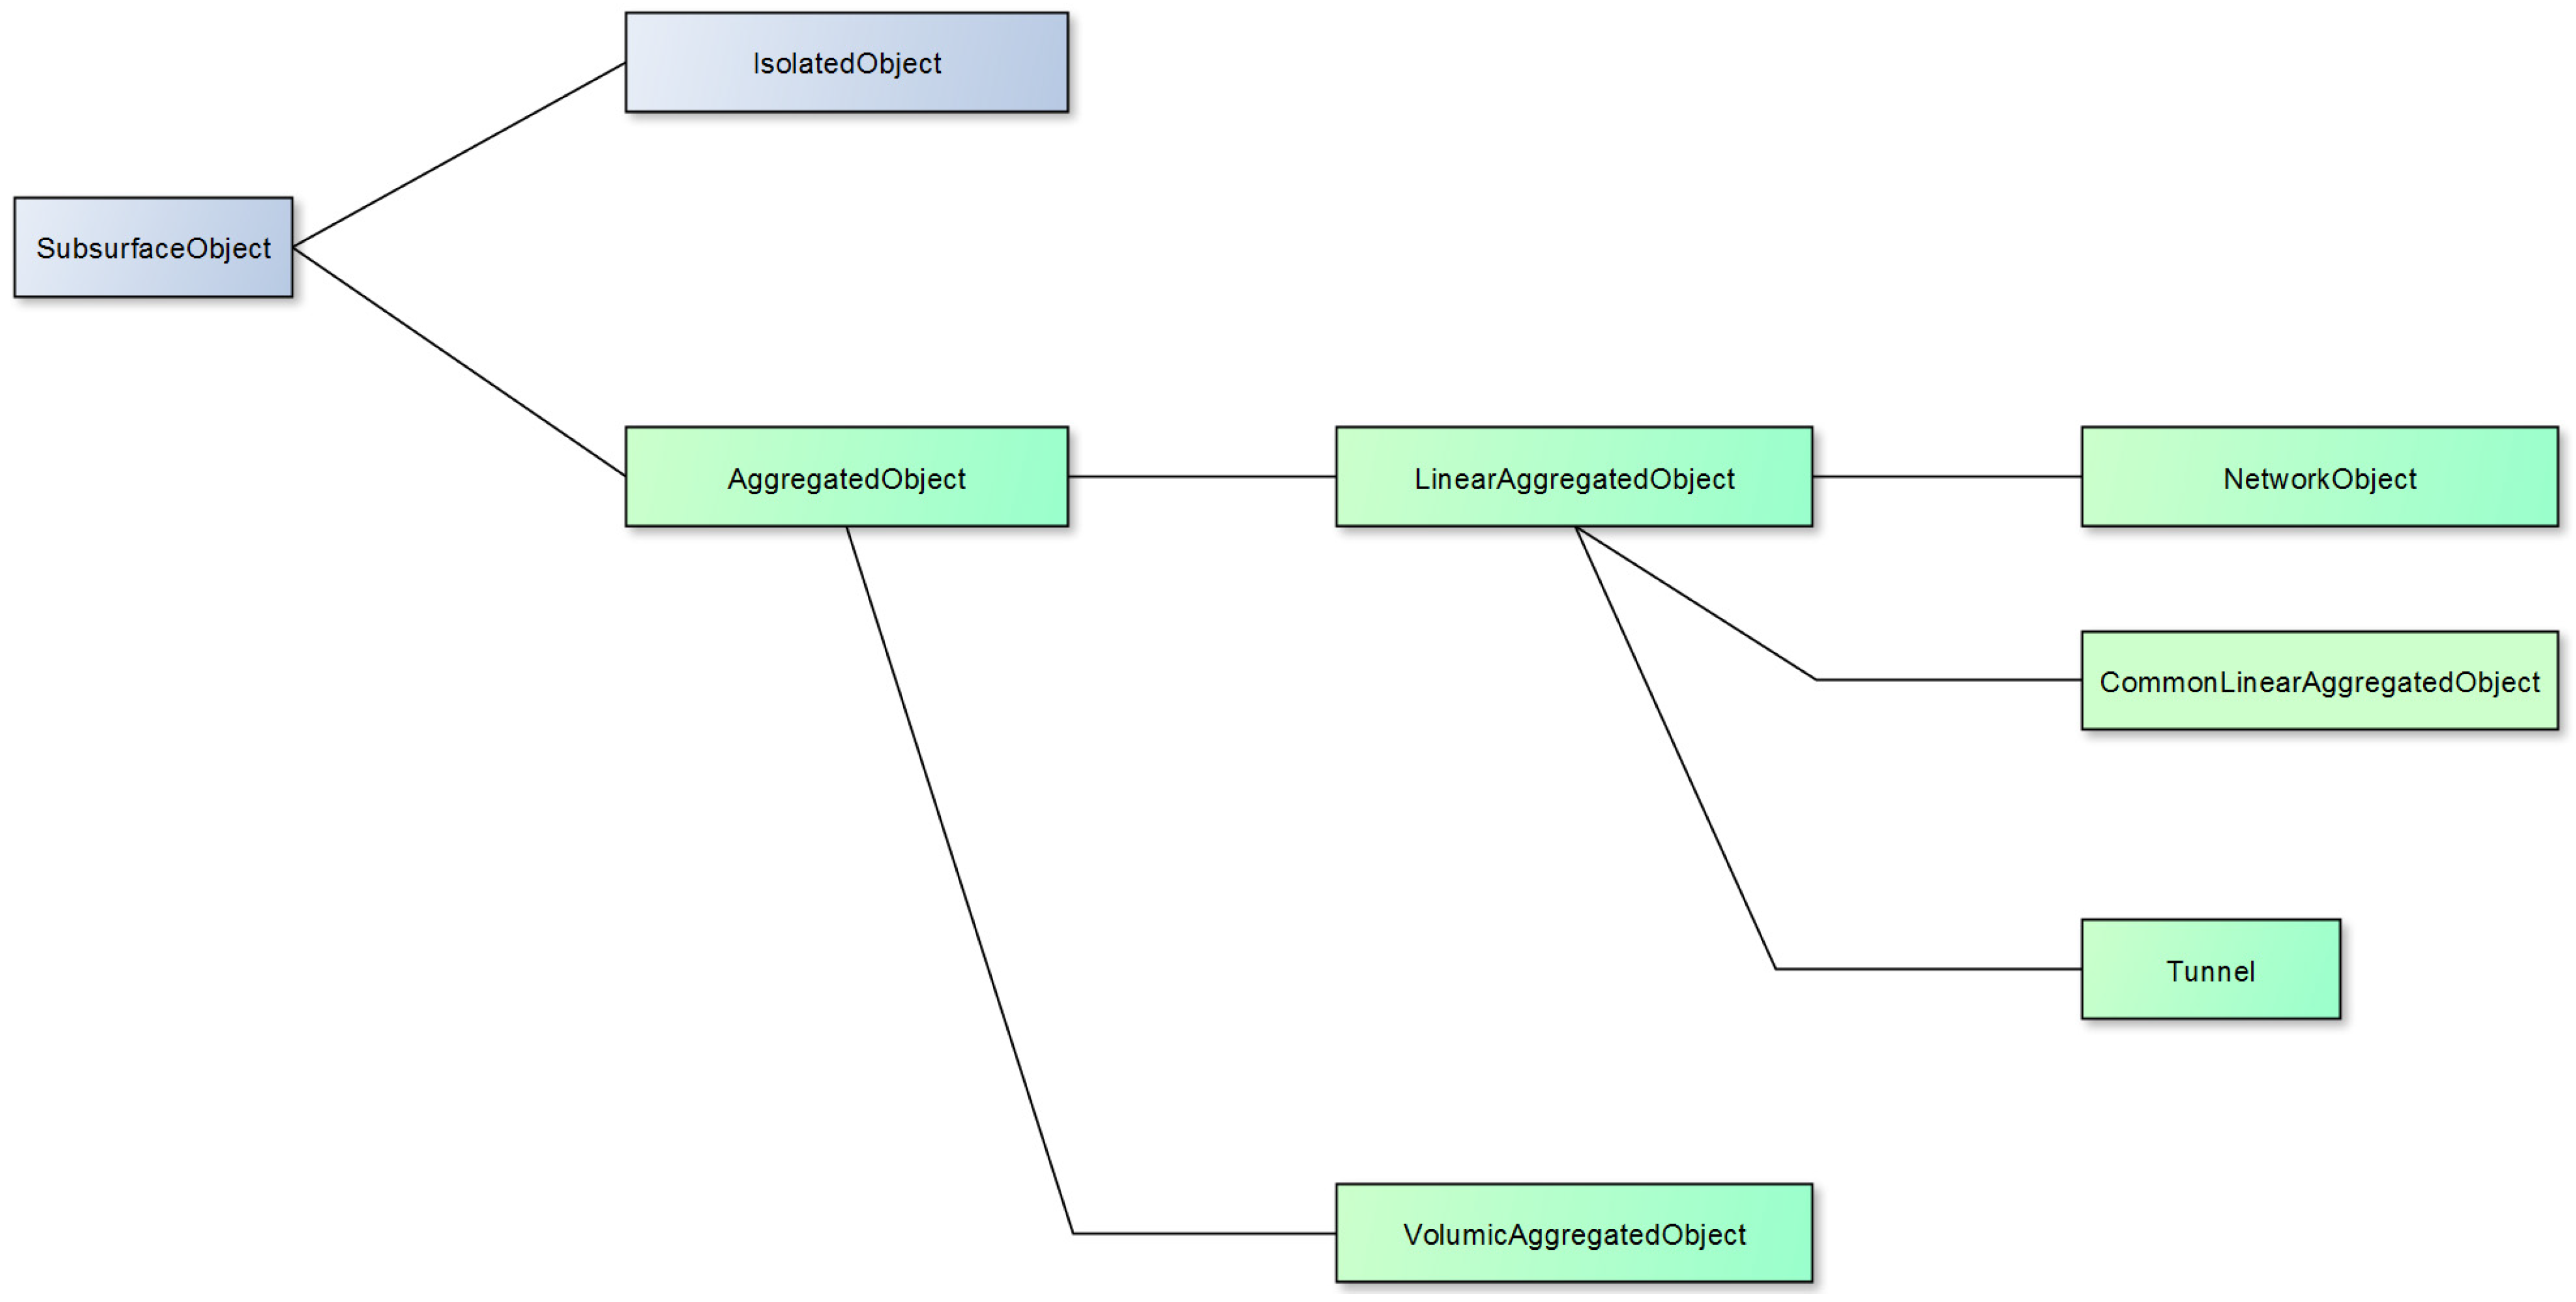
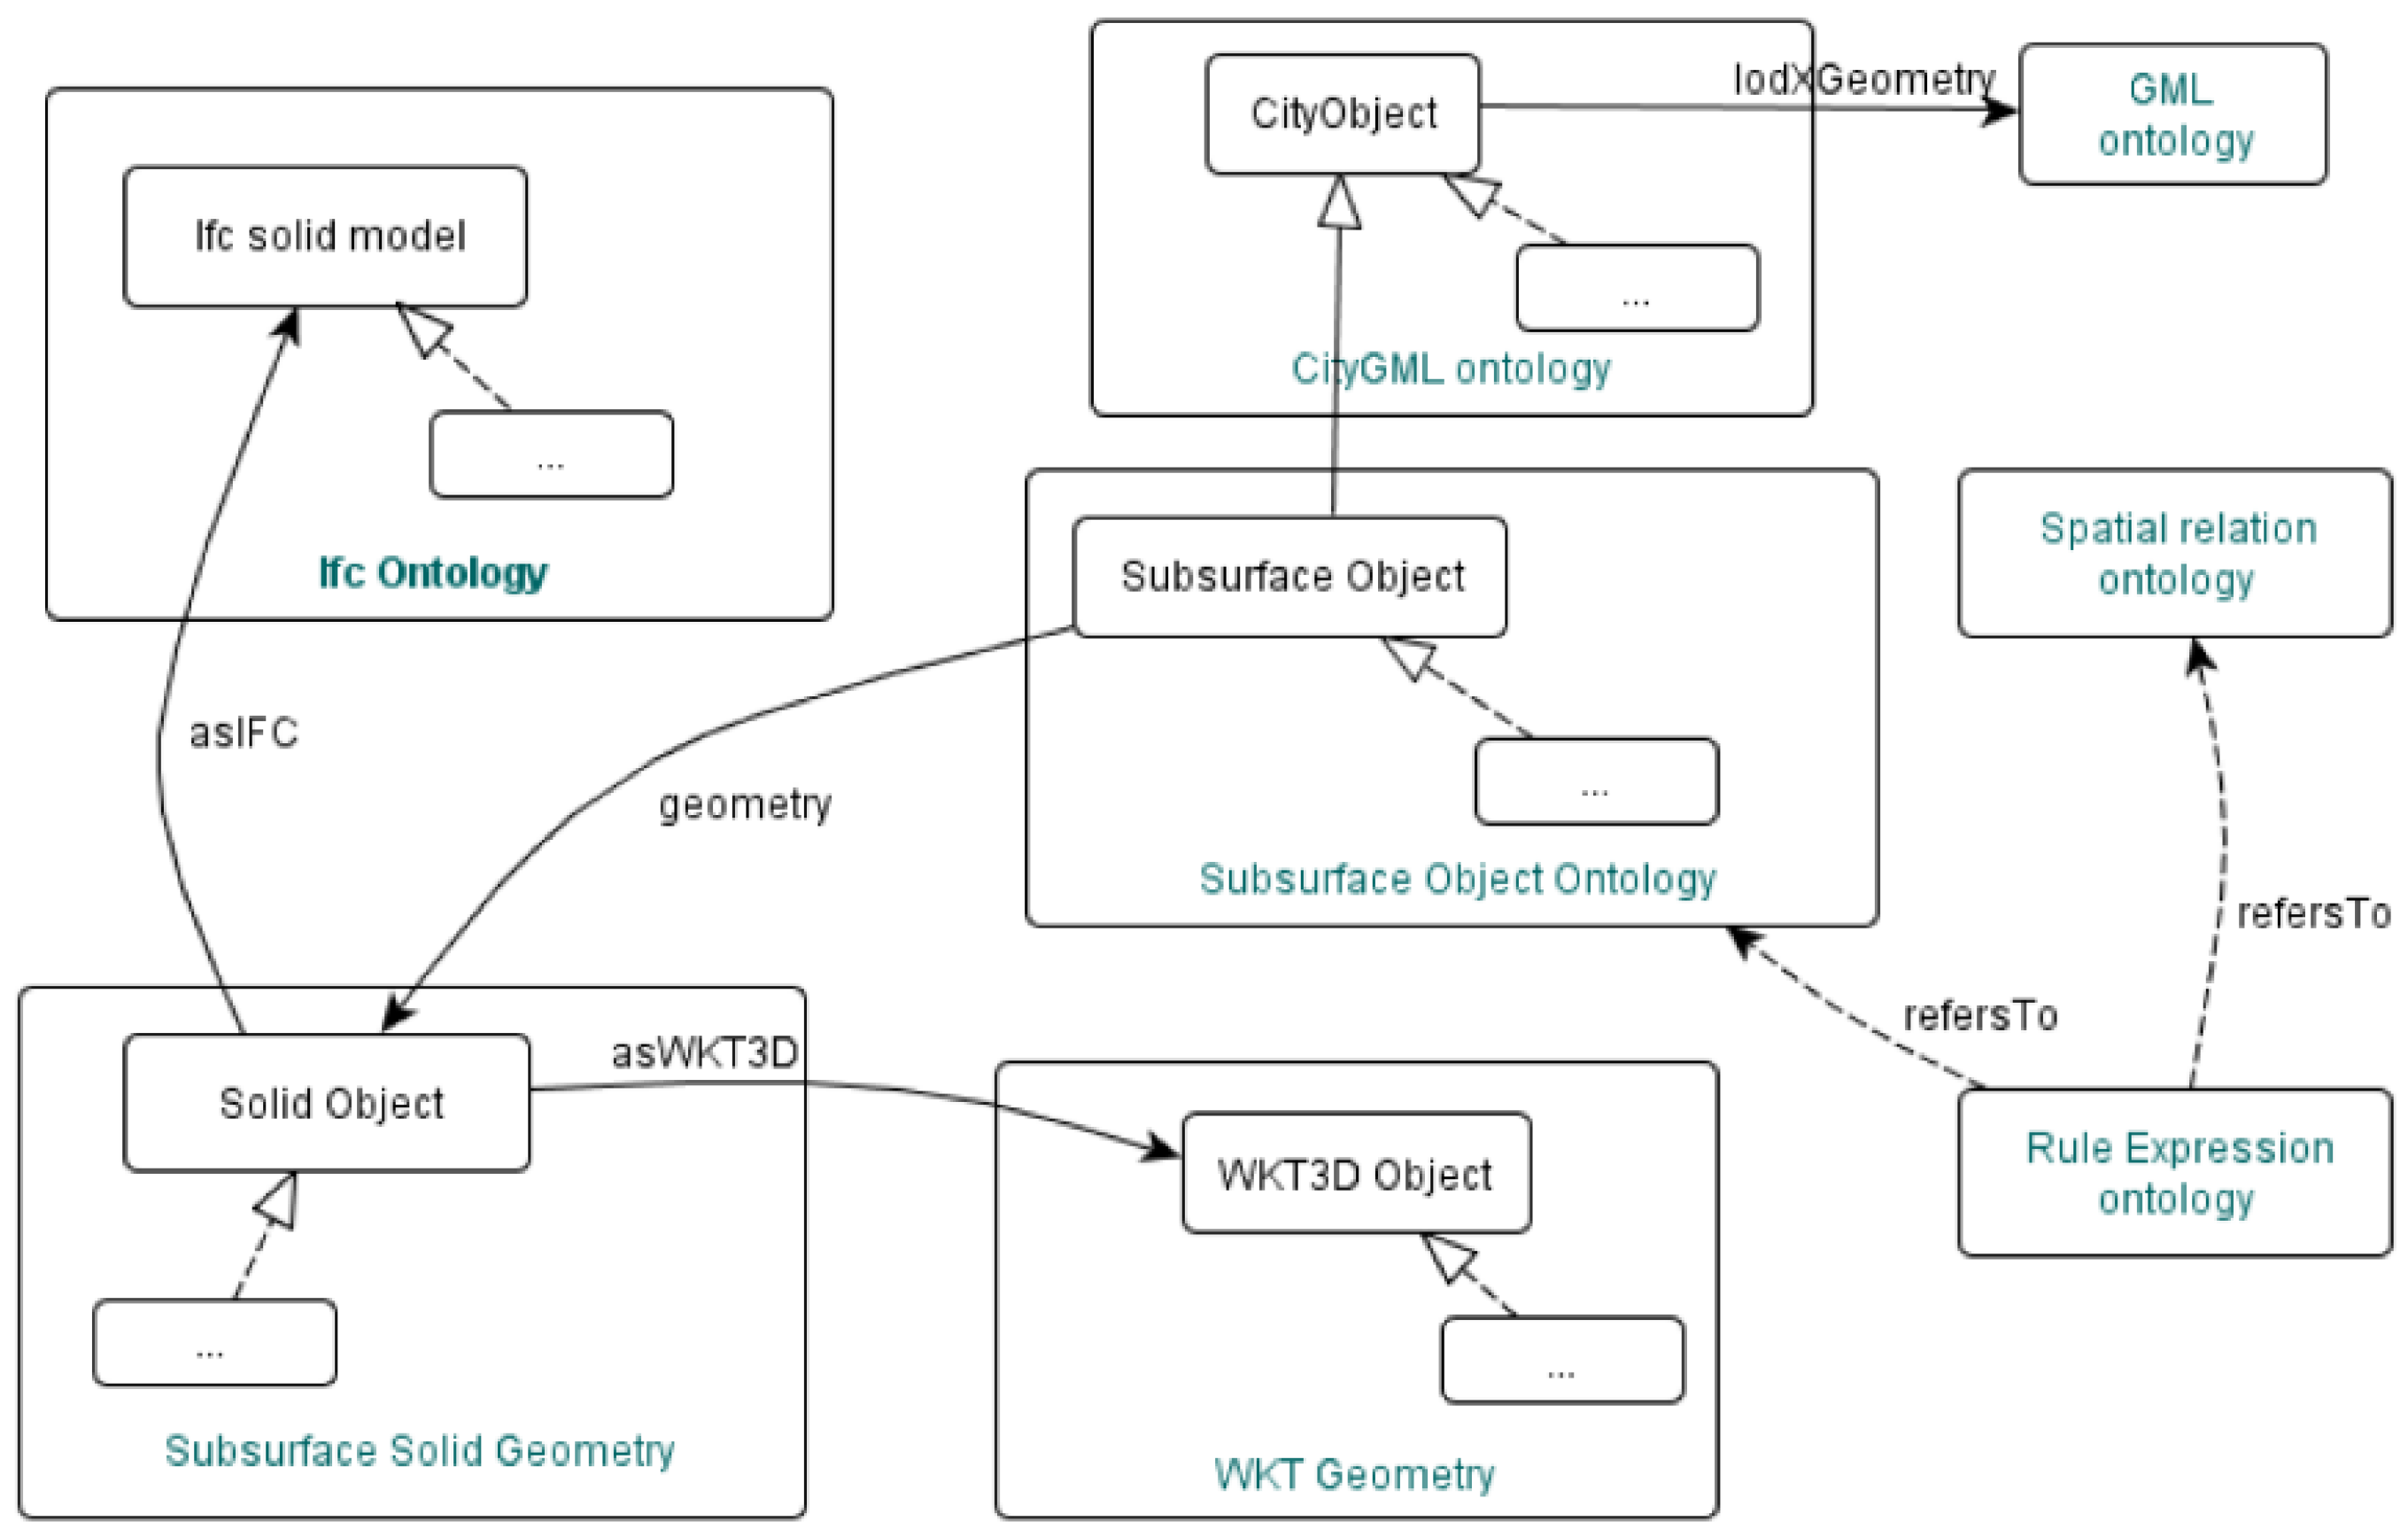
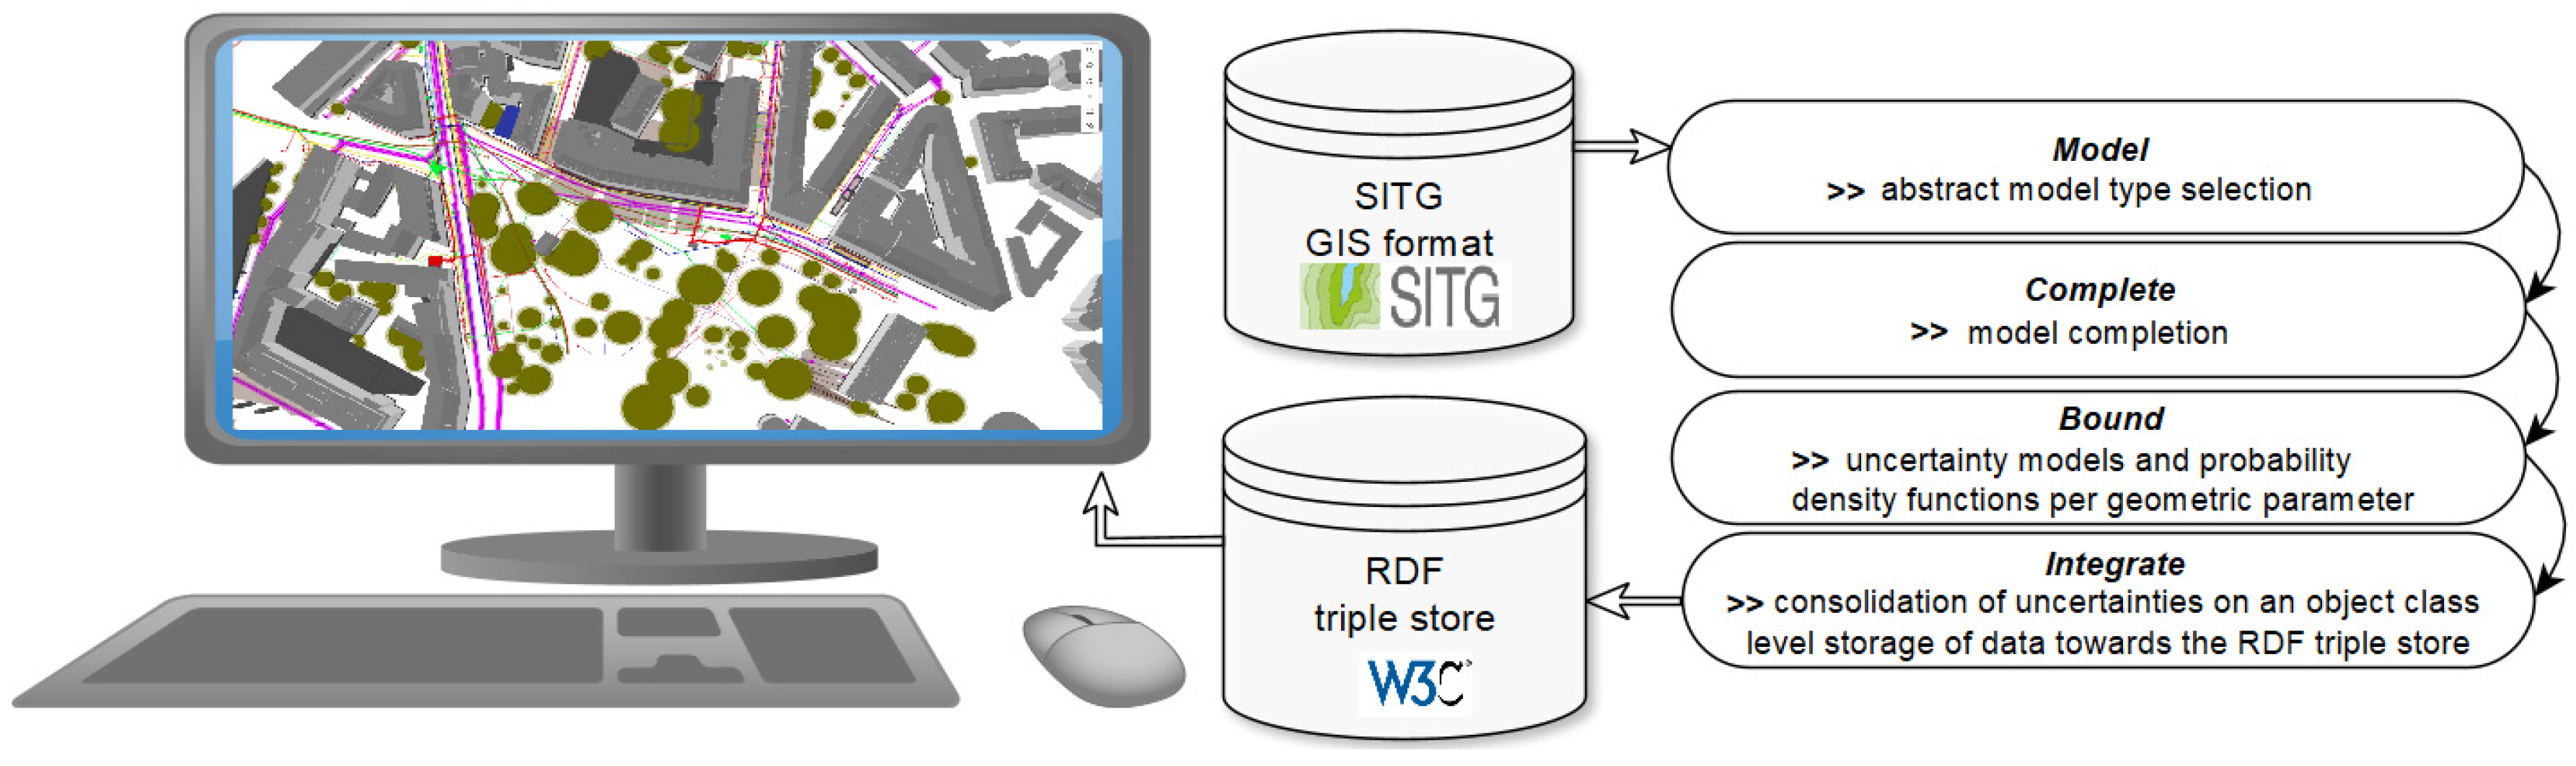
2.1. General Overview

The first inventory of object classes present in subsurface volumes of the preliminary study [5] has been further developed to a minimal model. This minimal model integrates necessary attributes to describe position, geometry, indicating the related confidence level, as well as semantics of subsurface objects.
The model can be presented in several ways, the hierarchic structure of scoped objects (taxonomy) is shown in Appendix A, Figure A1. Figure 2 focuses on the structure of geometrical representation of objects. Objects are classified either as isolated objects (e.g., tree roots), as an aggregation of linear objects (e.g., utility networks) or as volume aggregated objects (e.g., subsurface buildings). This structure has been chosen in the preliminary “Underground” study to represent the different legal contexts and their regulating authorities.
As an example for the detailed description of these subclasses, the representation of linear aggregated objects, mainly used to represent utility networks, can be found in Appendix B, Figure A2.
Métral [24] (Figure 3) provides interoperability between the minimal model, IFC and CityGML using ontologies like ifcOWL [27] and for CityGML [28].
Local and national codes (e.g., [29,30,31,32]) are integrated to describe spatial relations among objects. These relations are called “compliance rules”. They are structured according to a generic rule model presented in [24,25]. Figure 4 shows the structuring of a rule of the Swiss Gas and Water Industry Association [30,31,32], defining the minimal ground cover for a water network: (I) no construction is admitted above the water network, (II) the minimum ground cover for drinkable water is 1.2 m to 1.5 m, (III) a horizontal minimum distance of 0.4 m is necessary.
Strategies to complete missing geometrical attributes of subsurface objects are called “completion rules” and apply the generic rule model as well.
All rule types are stored together with subsurface objects in a triple store database (RDF). The triple store is structured according to the ontology, integrating minimal model, ifcOWL, CityGML and the generic rule model. The ontology provides objects with necessary geometrical and functional attributes as well as with information about the completeness and precision of geographical and geometrical data.
Objects are visualized through a twofold volume representation:
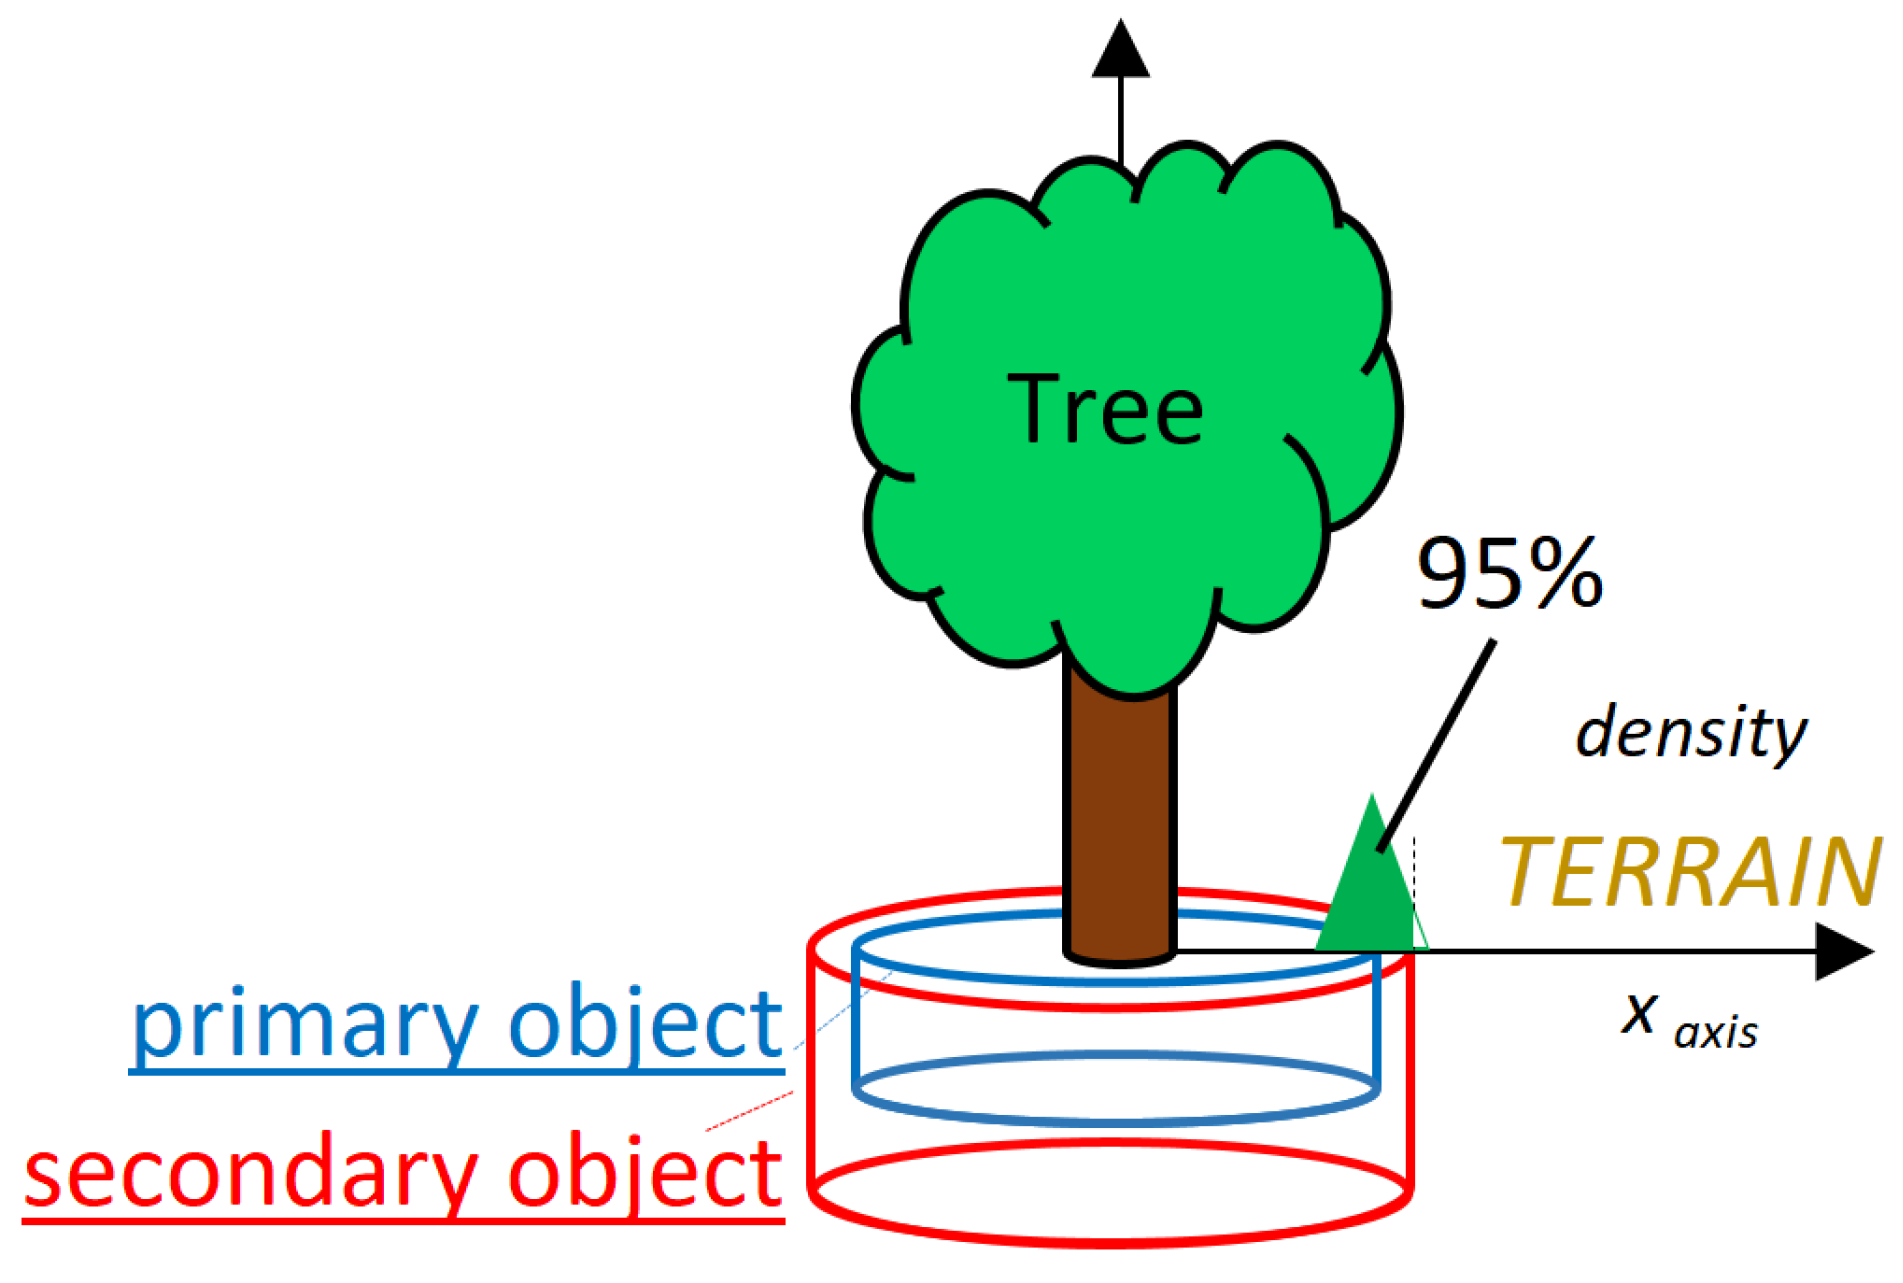
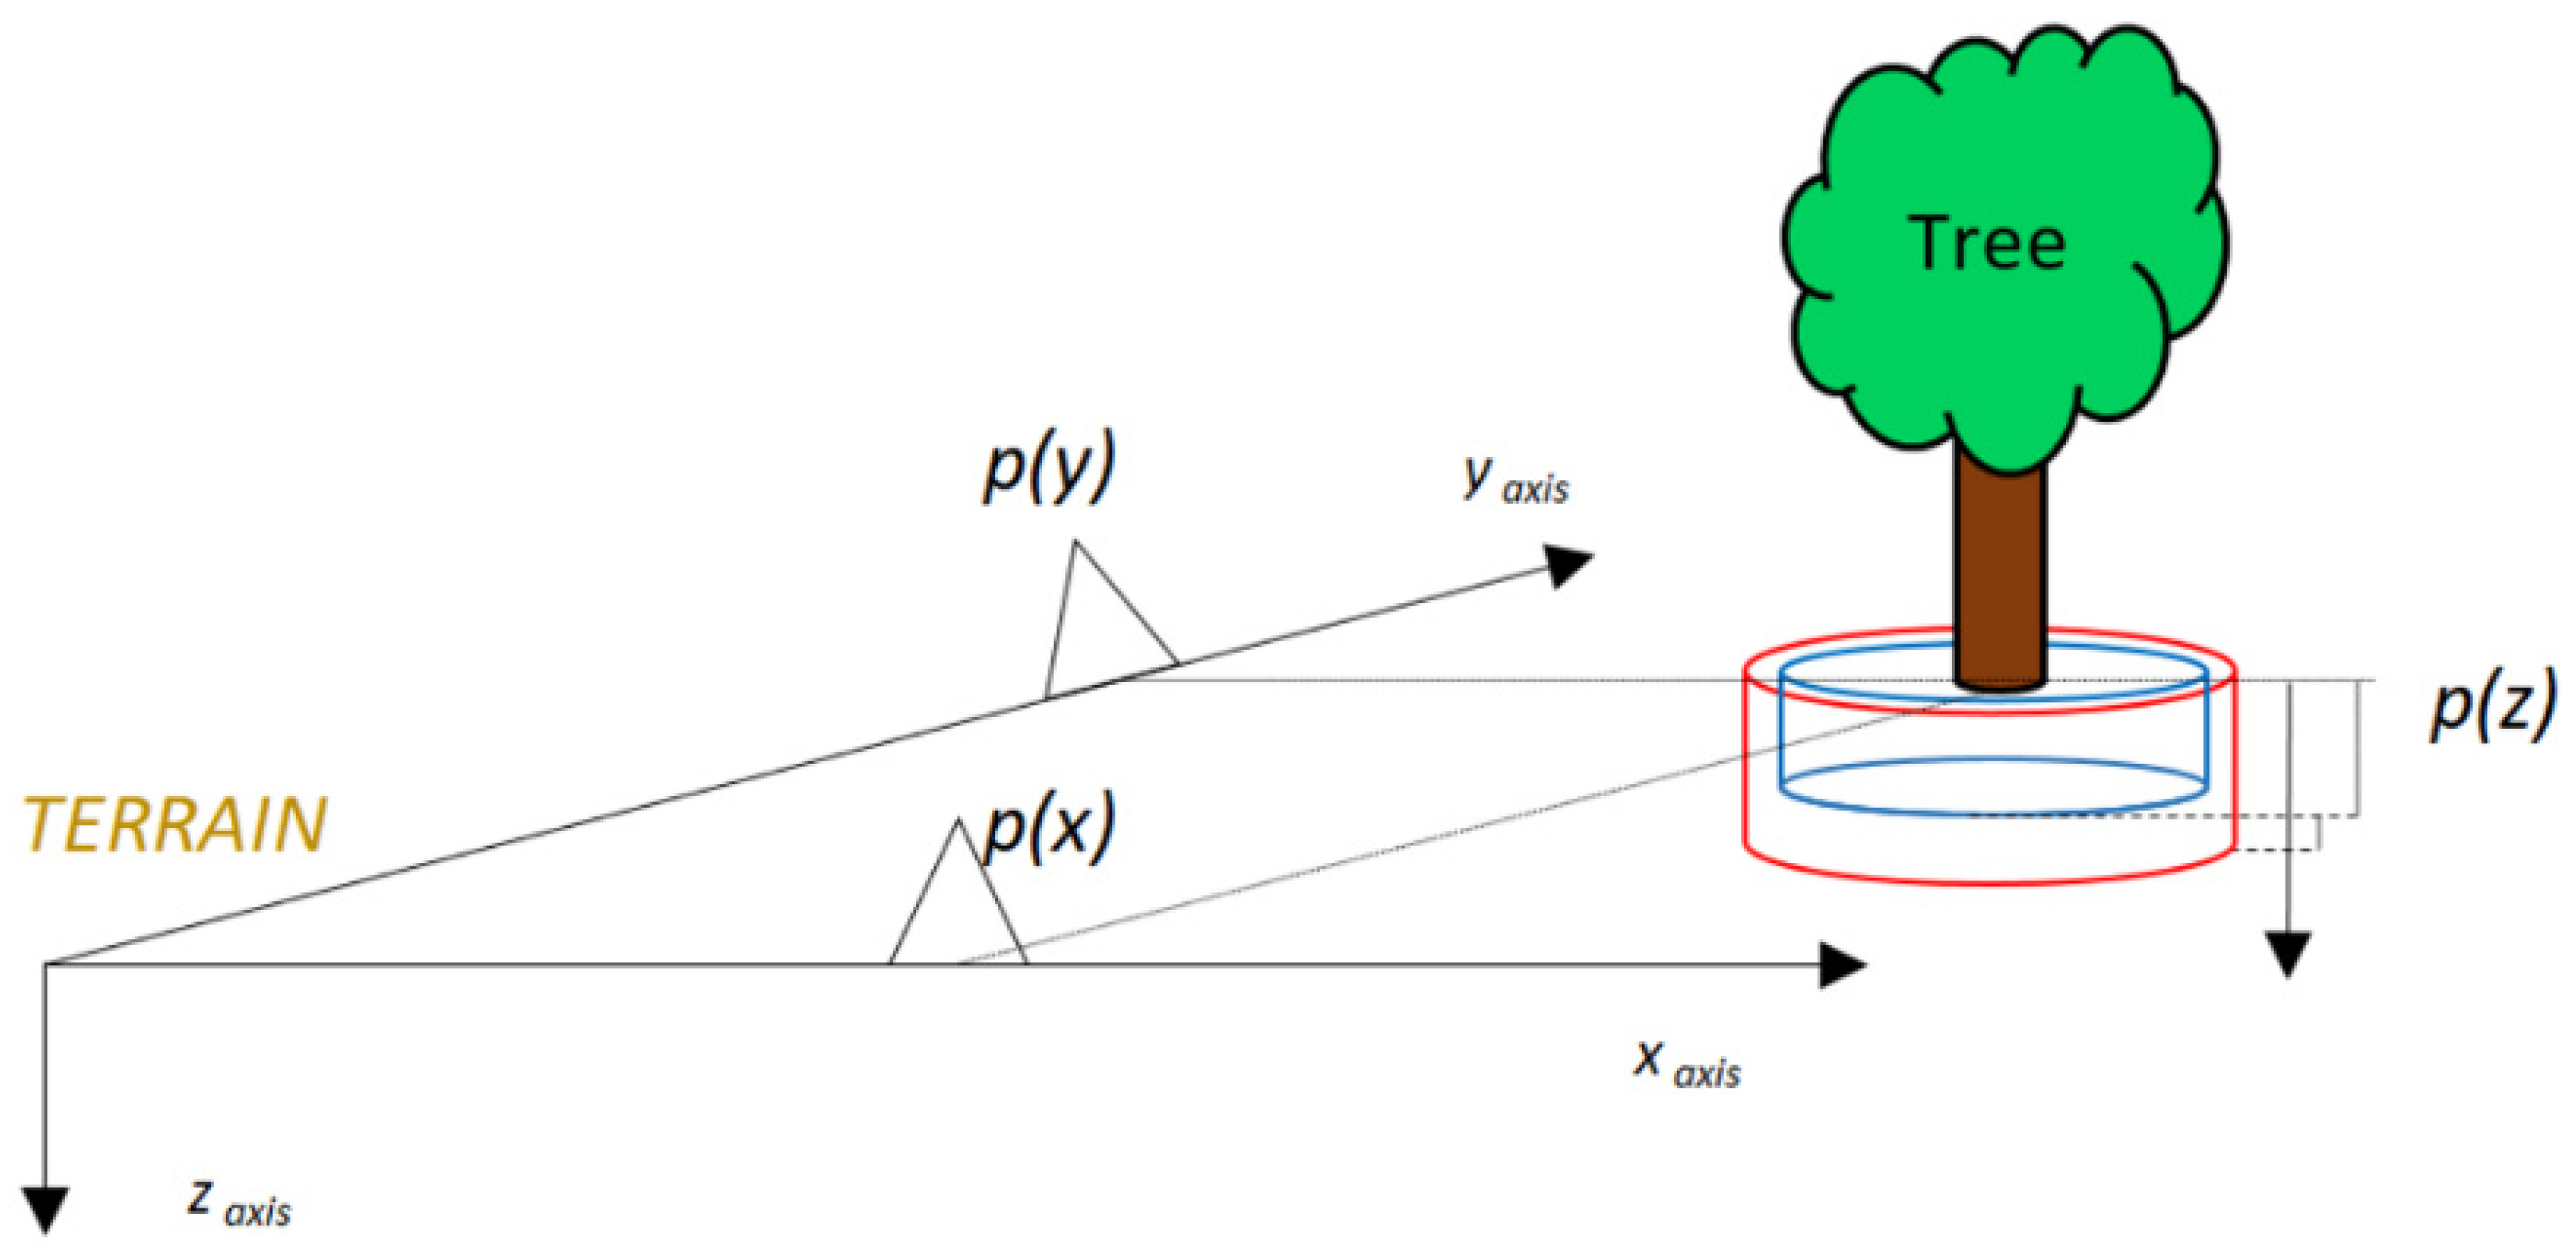
  • A primary object: to describe a geometrically simplified version of the real object, integrating data completion strategies.
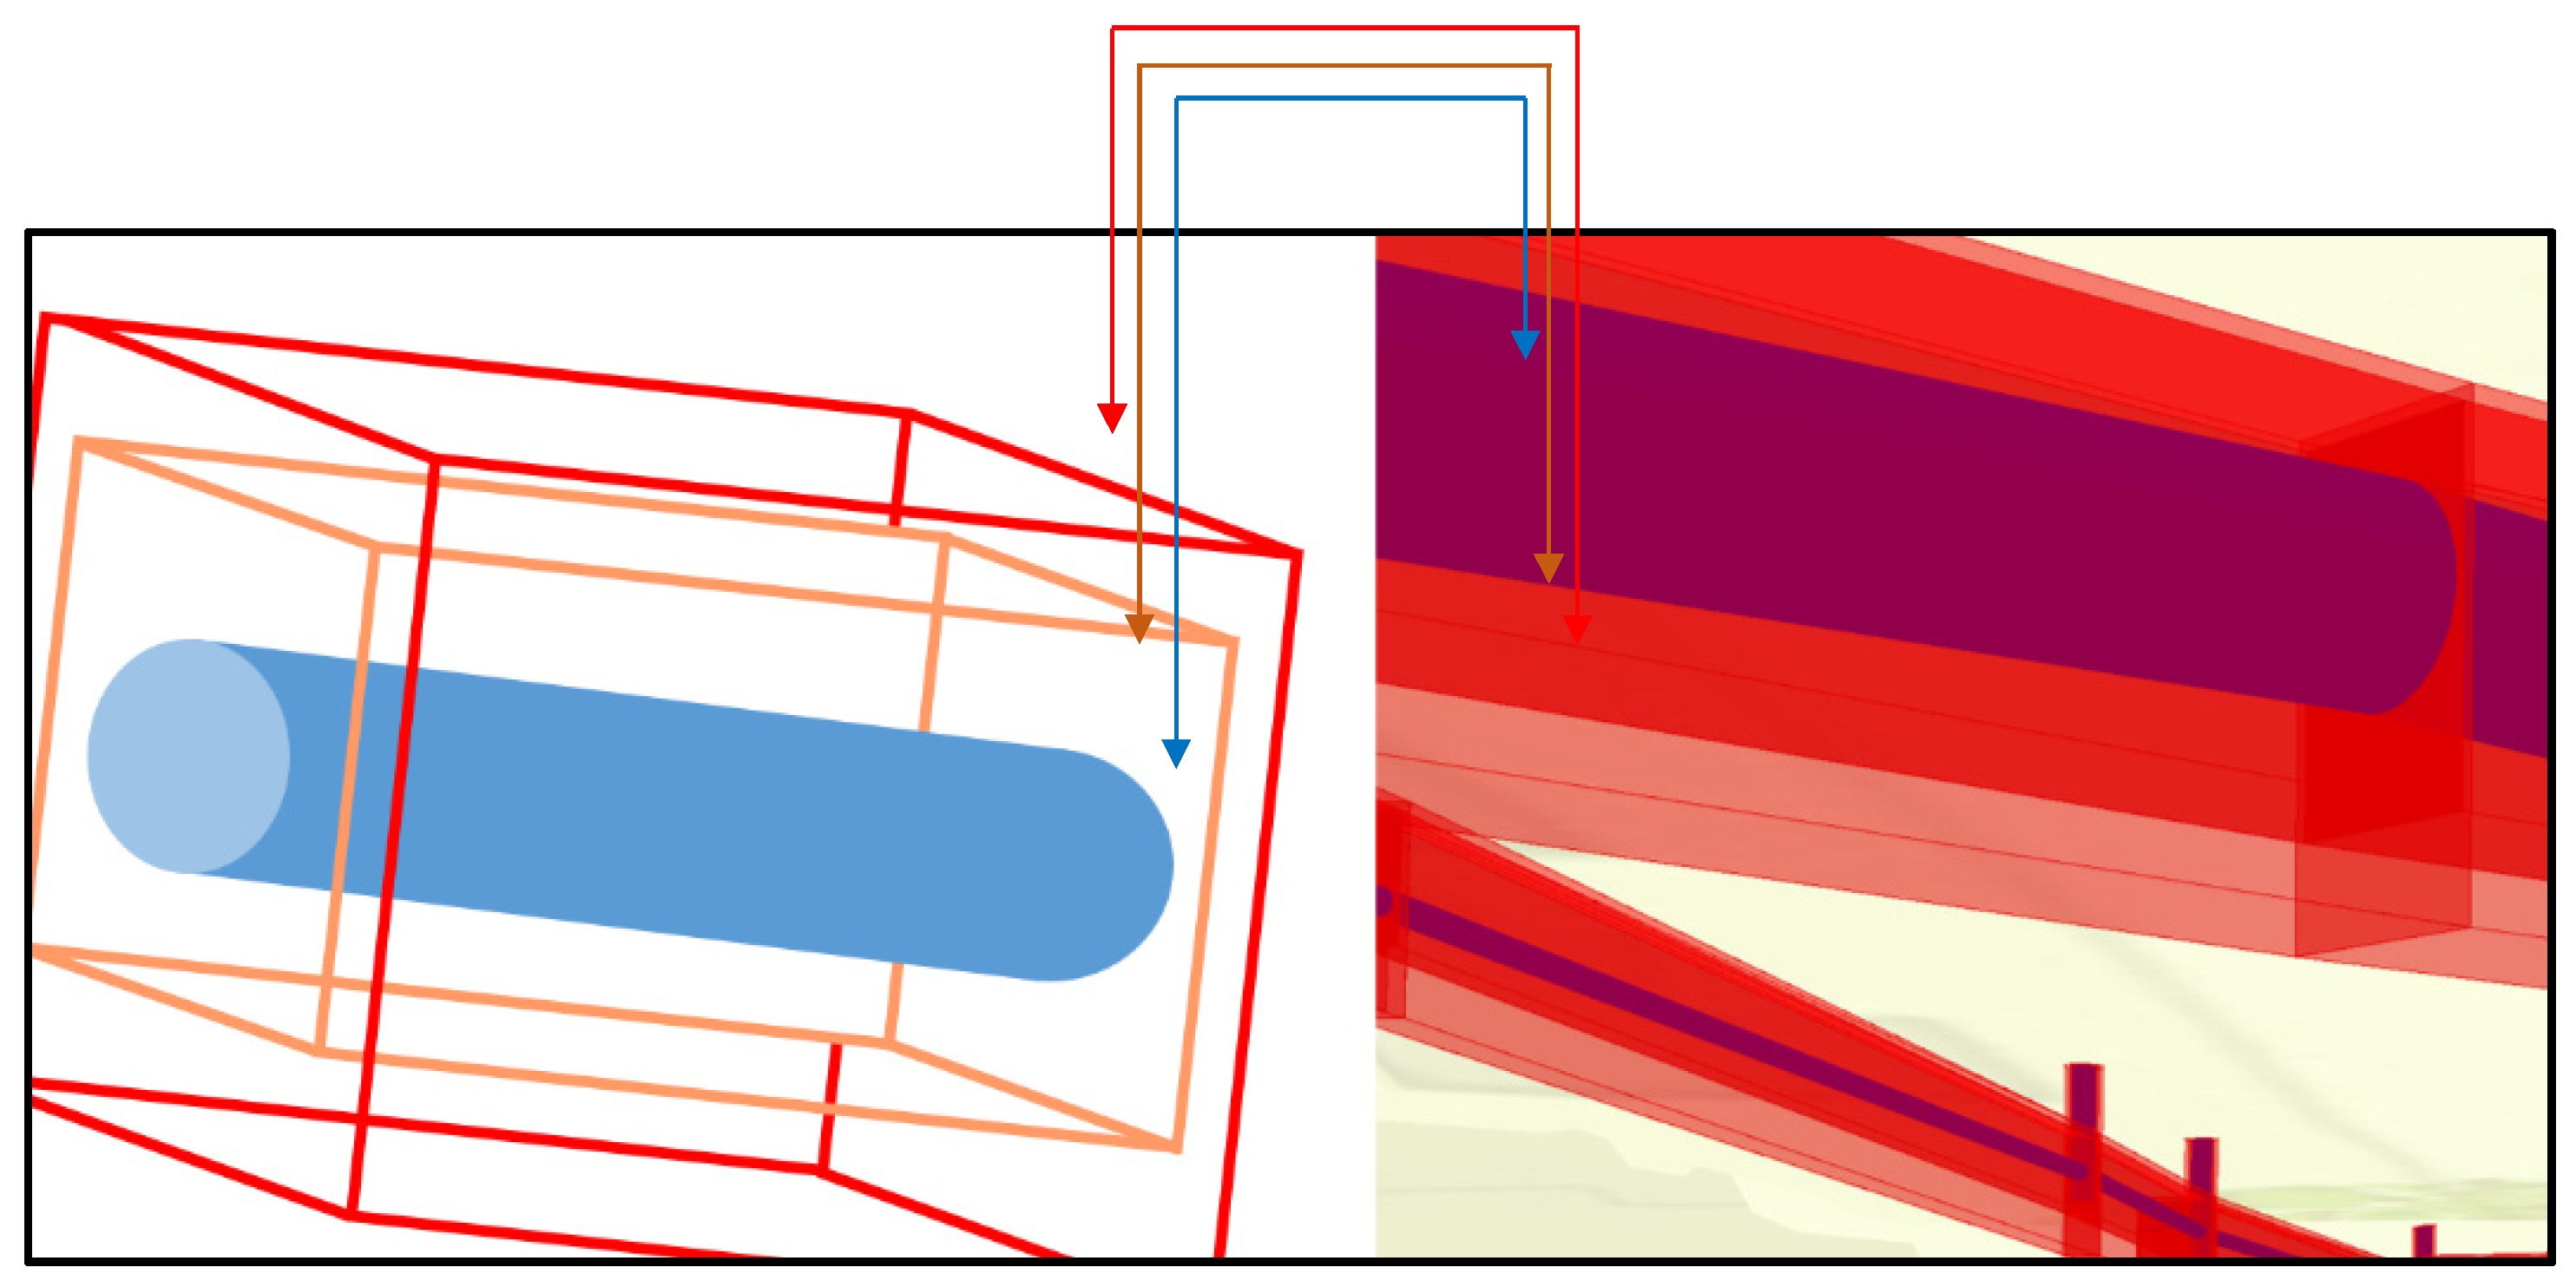
  • A secondary object: to consider a virtual bounding box assigned to a confidence metric aimed at measuring the probability that the full primary object is inside it.
The level of information present in the SITG [23] database is extensive, as shown in Table 1. Priority is given to spatial and geometrical attributes needed for object representation. Additional attributes can be added to the model if required.

2.2. Detailed Methodology and Illustrative Examples

Objects are represented through a series of simplified geometries, including uncertainty measurement parameters. The confidence metric is consolidated on an object-class level. The methodology presented in the following section shows how incomplete data of subsurface objects present in the Geneva territorial information system SITG [23] is completed and confidence levels are associated to position and geometry by applying 4 stages (Figure 5).

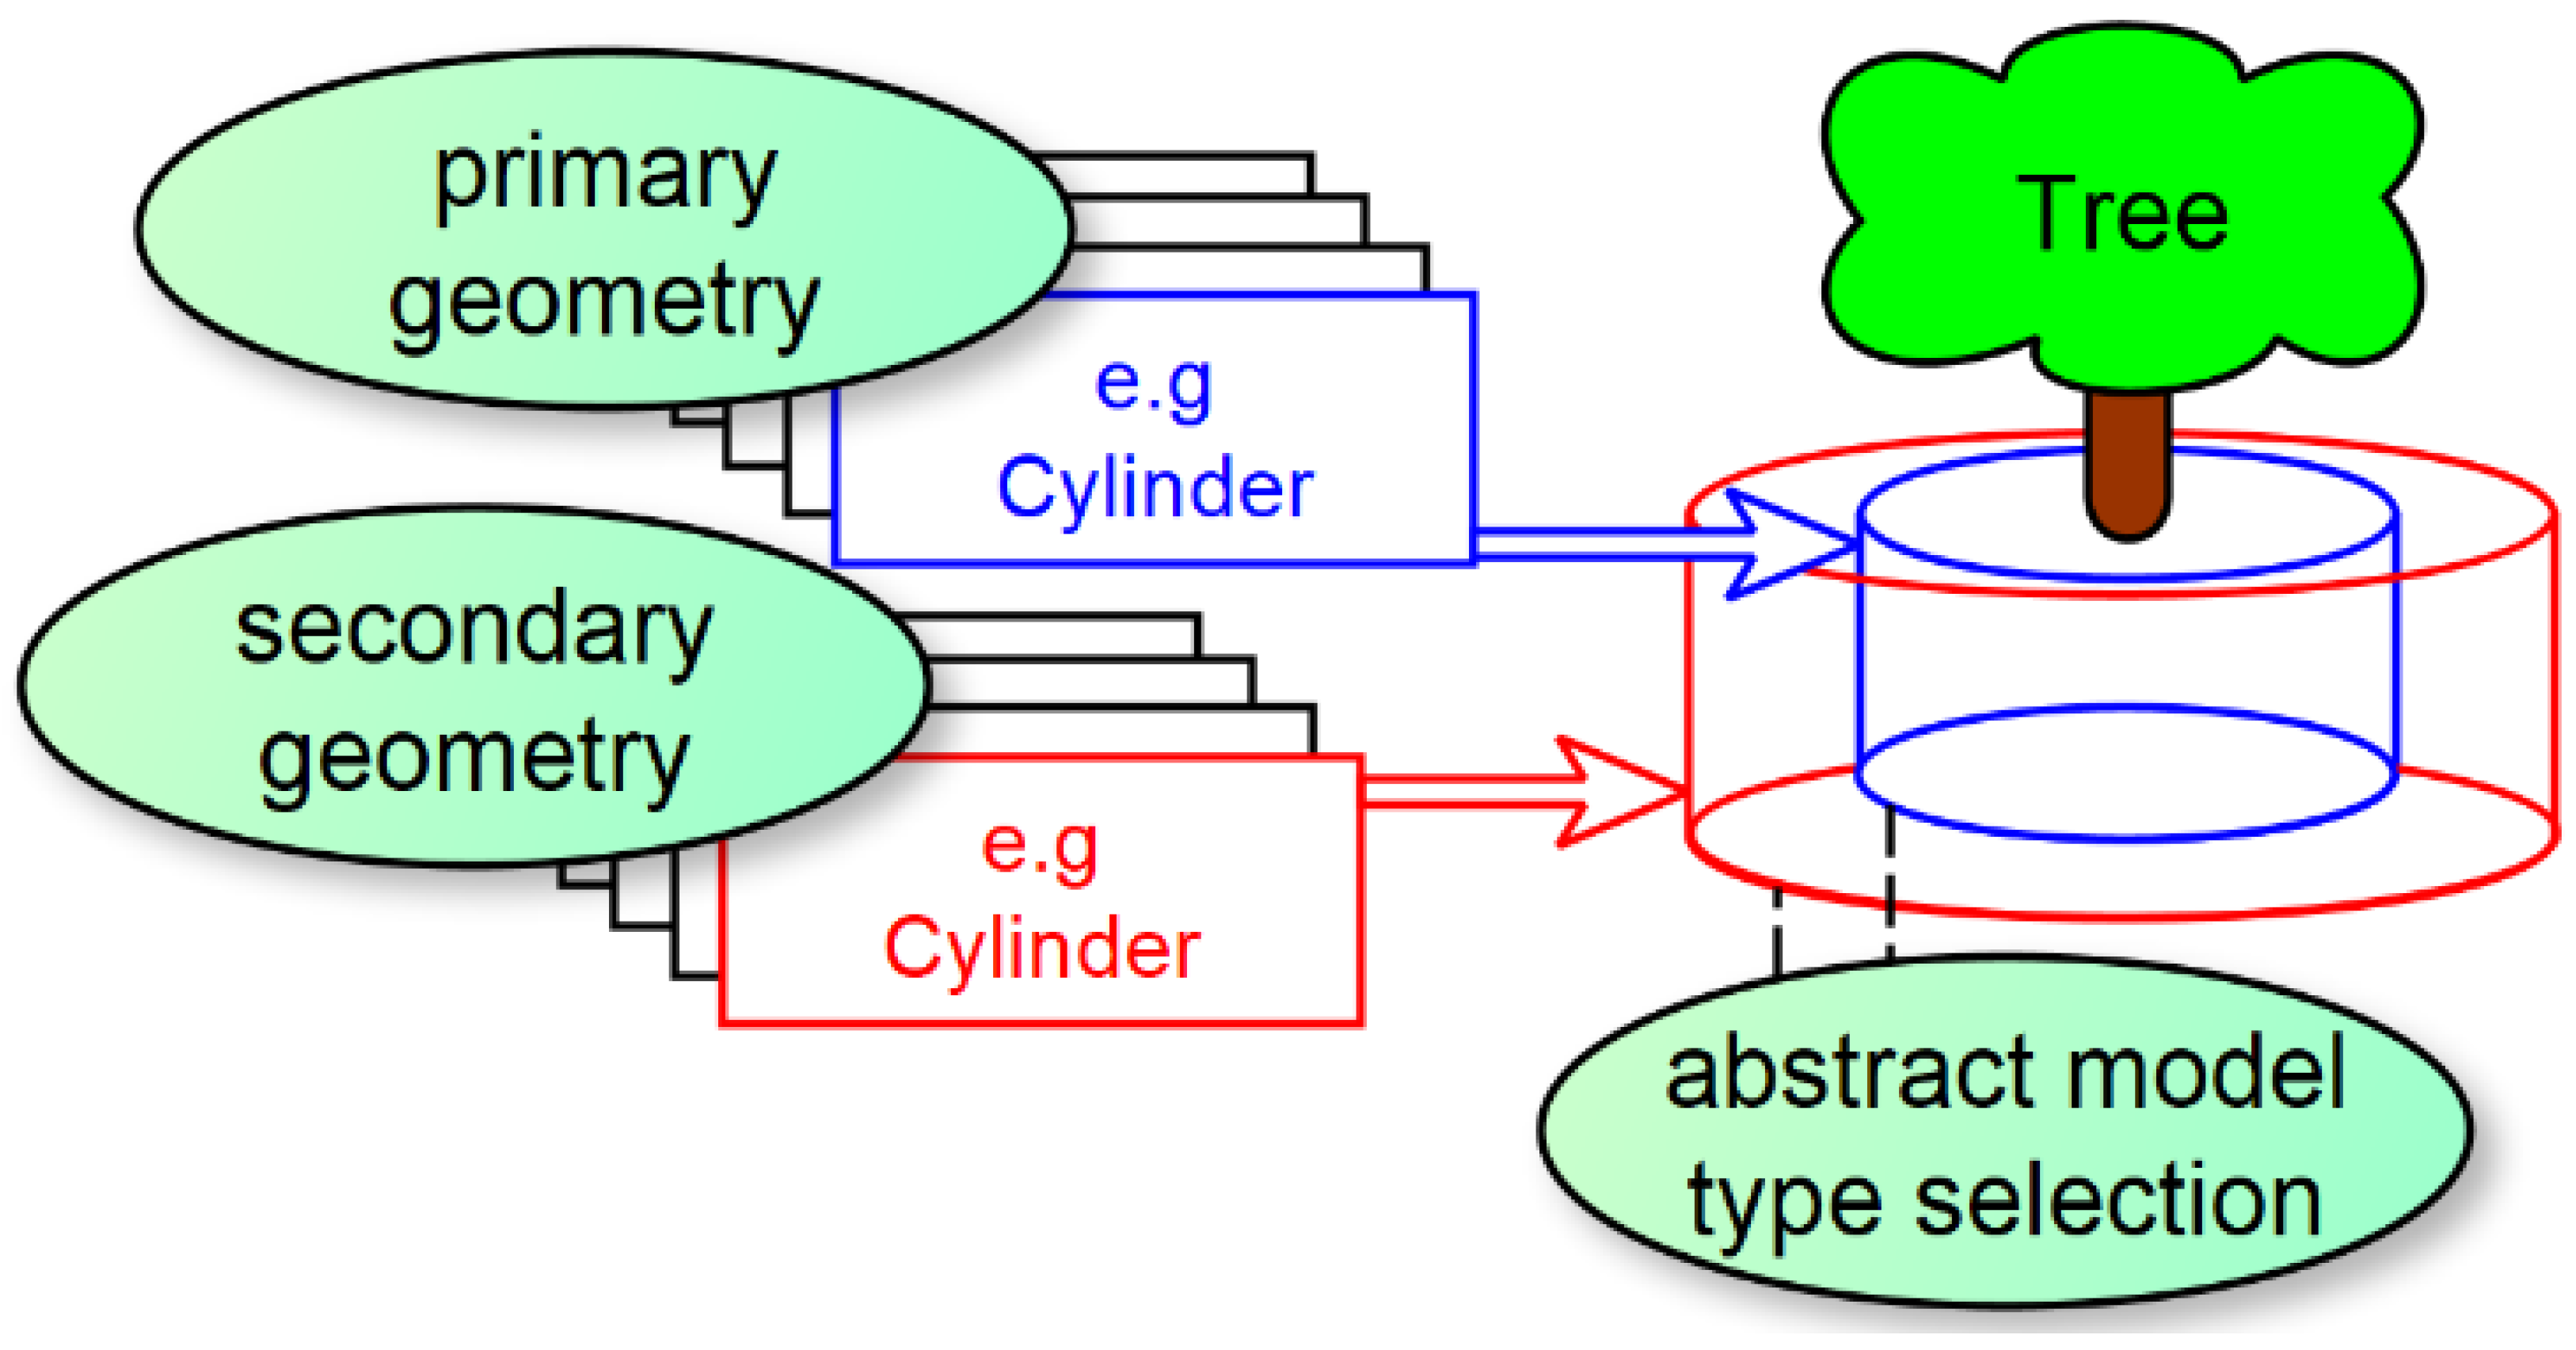
2.2.1. Abstract Model Type Selection Strategy

The first stage is called “Model” and identifies the necessary attributes to geometrically model the primary object as well as the bounding volume (secondary object). The secondary object represents the uncertainty concerning its placement for each object.
Figure 6 shows the selected primitives for the tree root model. A cylinder is used to represent the primary geometry as well as the secondary geometry.

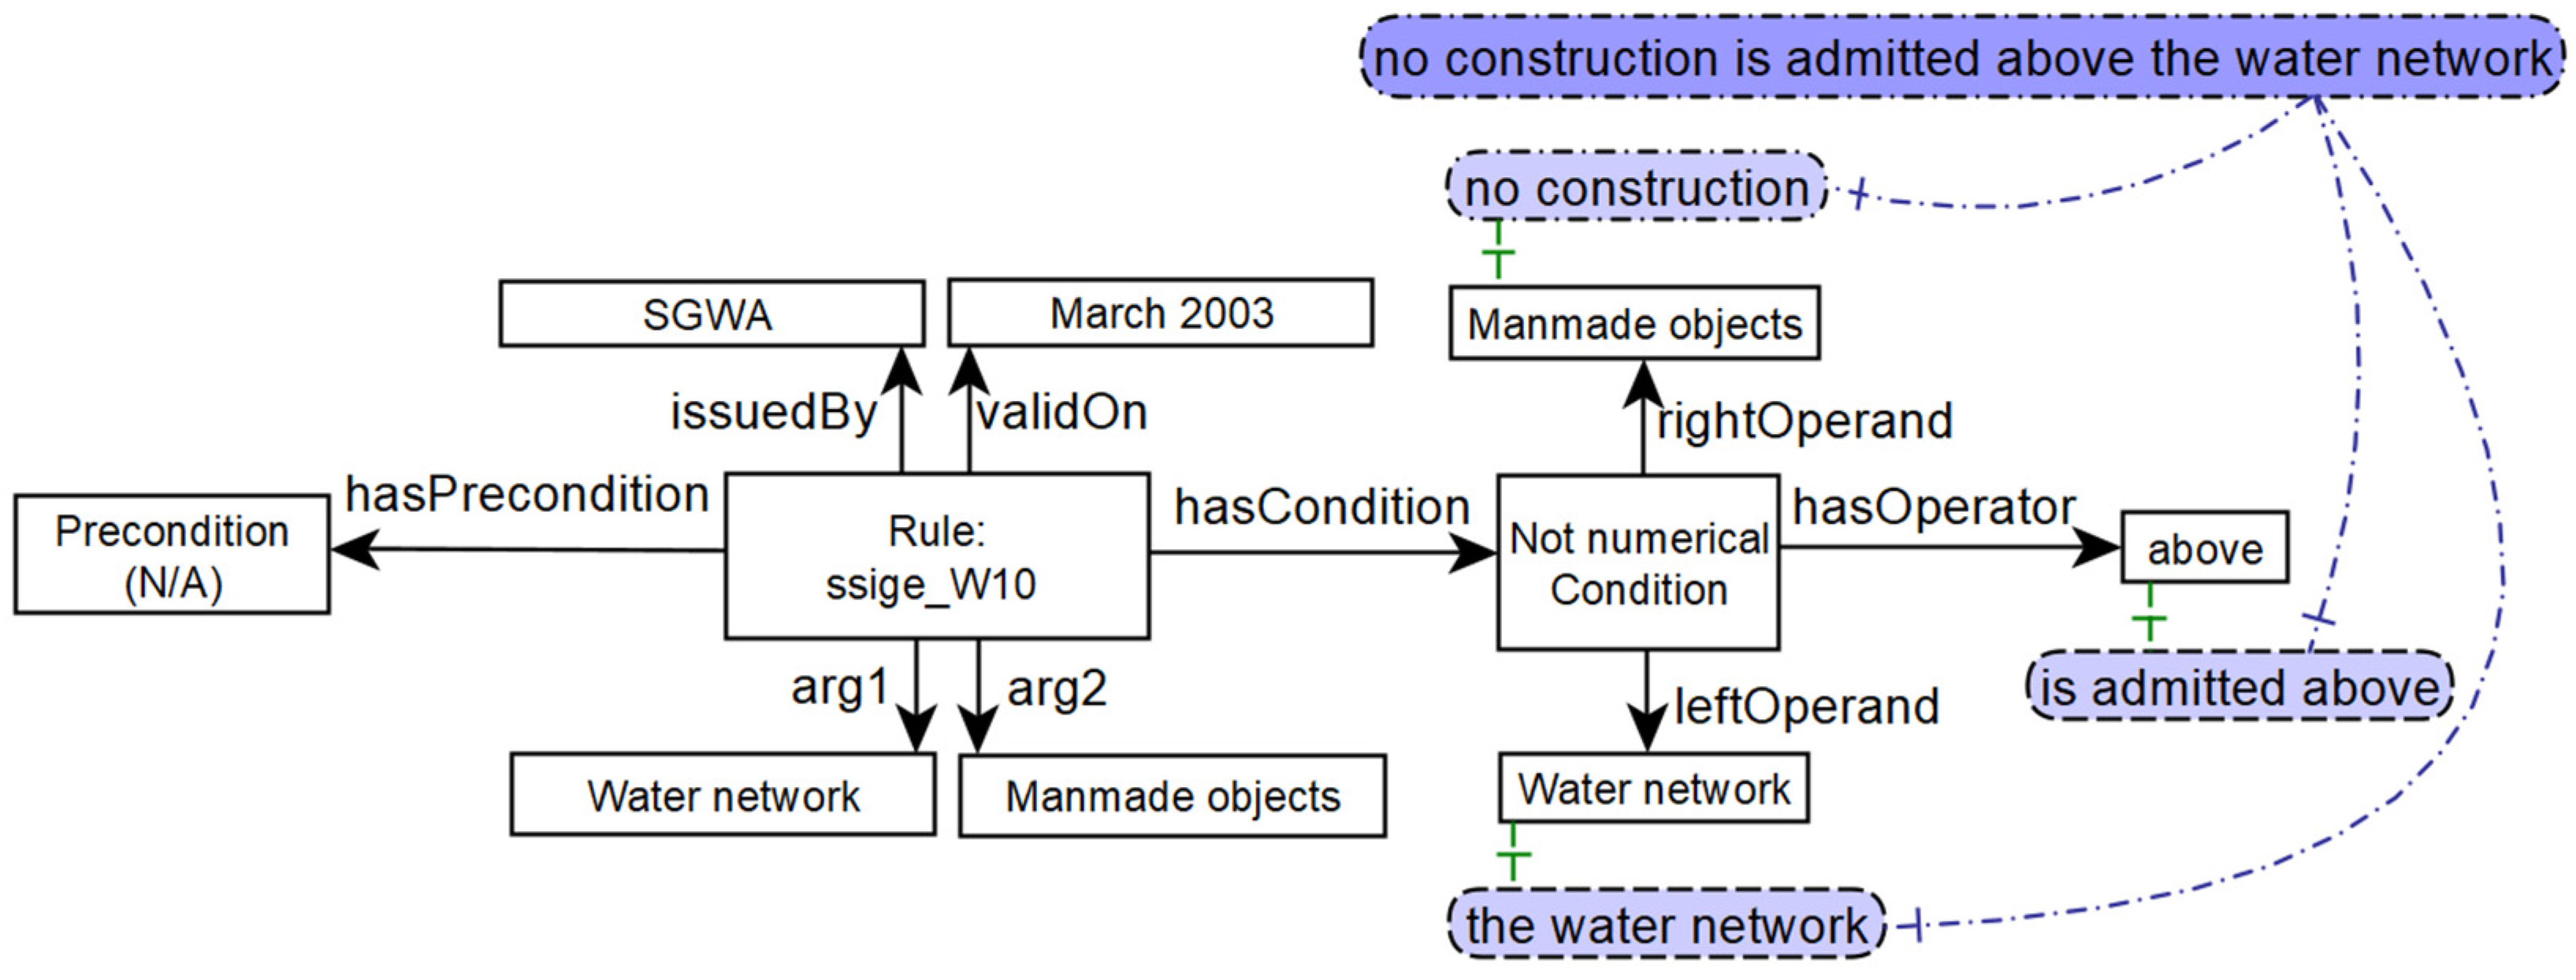
2.2.2. Model Completion Strategy

The model completion stage “Complete” analyses existing data, identifies missing attributes needed for geometrical representation and applies completion rules. Rules are based on the generic rule representation model [25], confidence levels are assigned to completed attributes.
For the tree root object class, the SITG database only provides the planimetric position of the roots. Diameter and depth attributes have to be completed for a 3D representation and are derived by hypotheses. The depth, e.g., is assumed to be 0.2 × Total_Tree_Height.
When attributes of subsurface objects are completed, confidence levels are assigned. In the case of the depth completion, the maximum level of confidence is set to 80%. The confidence level is associated with a stair type function, which rallies 80% of the surface of the cumulative distribution until 0.2 × Total_Tree_Height (Figure 7).
The Dirac probability density function represents the confidence for completion rules of single empirical values. These are, for example, a standard height and quantity for basement floors of buildings, a standard diameter for utility pipelines, etc. Figure 8 presents the model of the Dirac primitive for a gas network node. The maximum level of confidence for such a completion is again set to 80%.
The third example for a completion rule is the spatial depth positioning of natural gas pipeline networks. Two distinct strategies are applied, when the “z” attribute is missing:
  • No depth data is available (Figure 9, left): the standard depth of SGWA [30] is used (in this case 0.8 m).
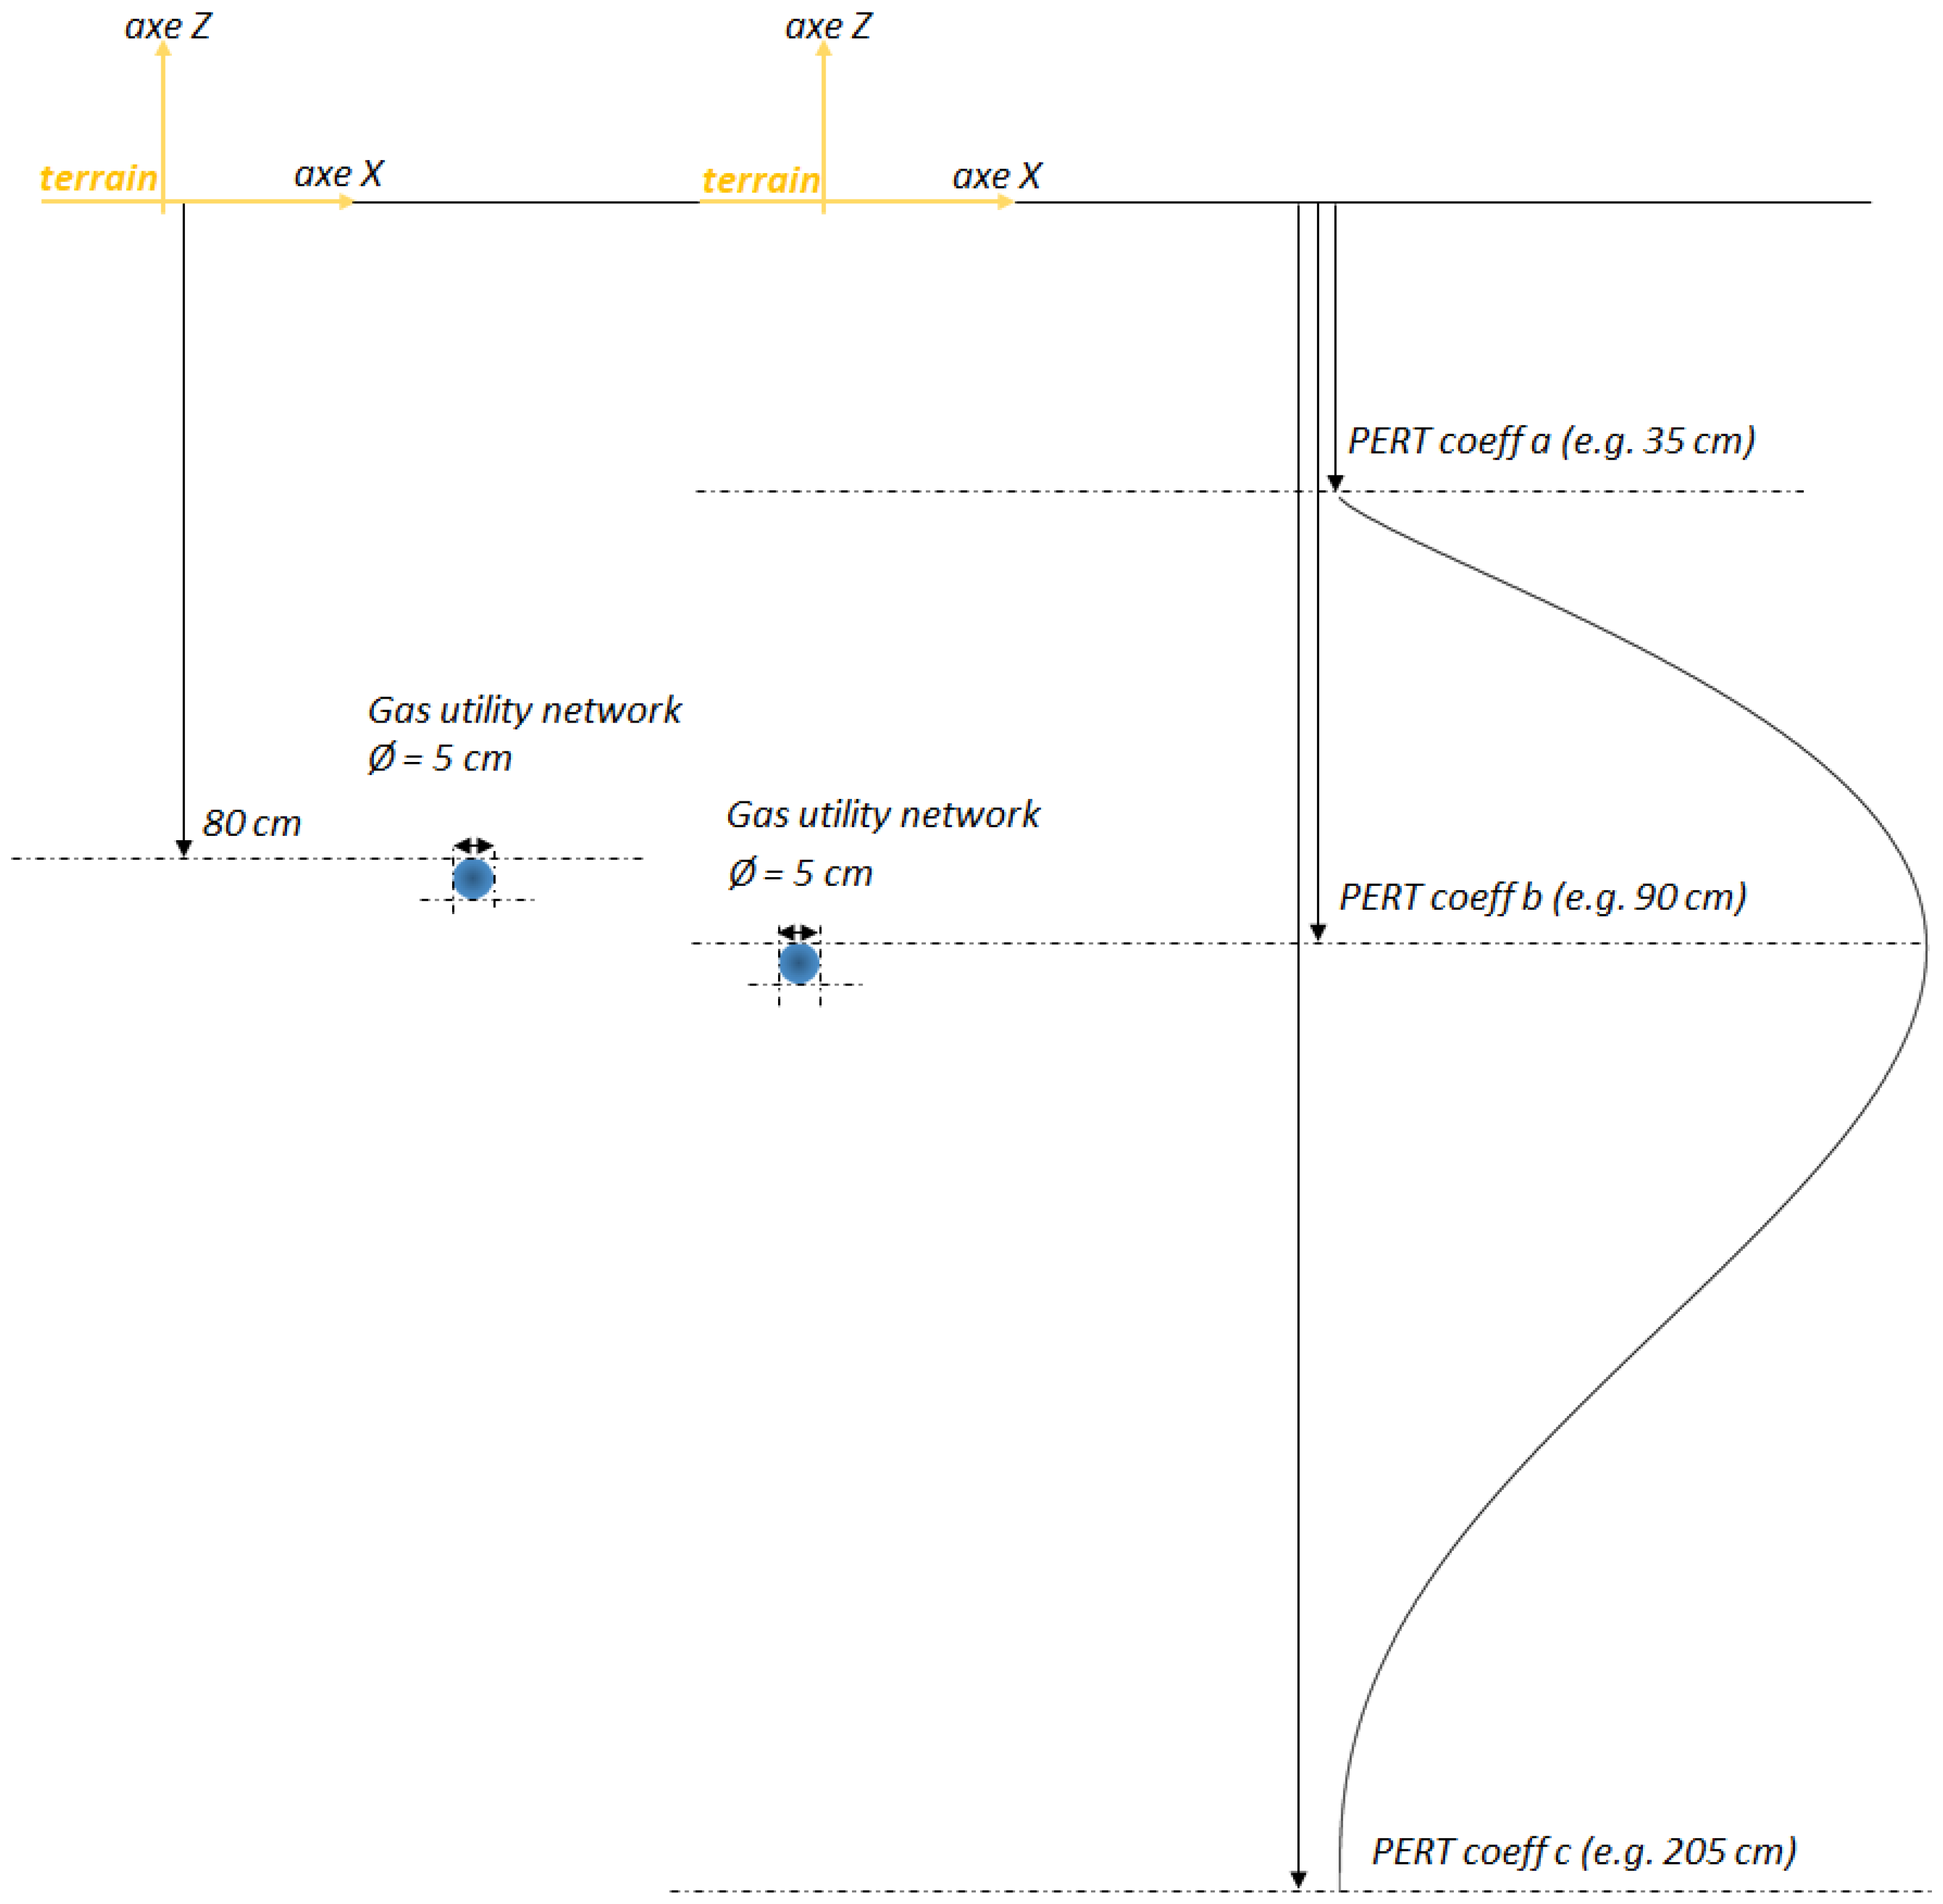
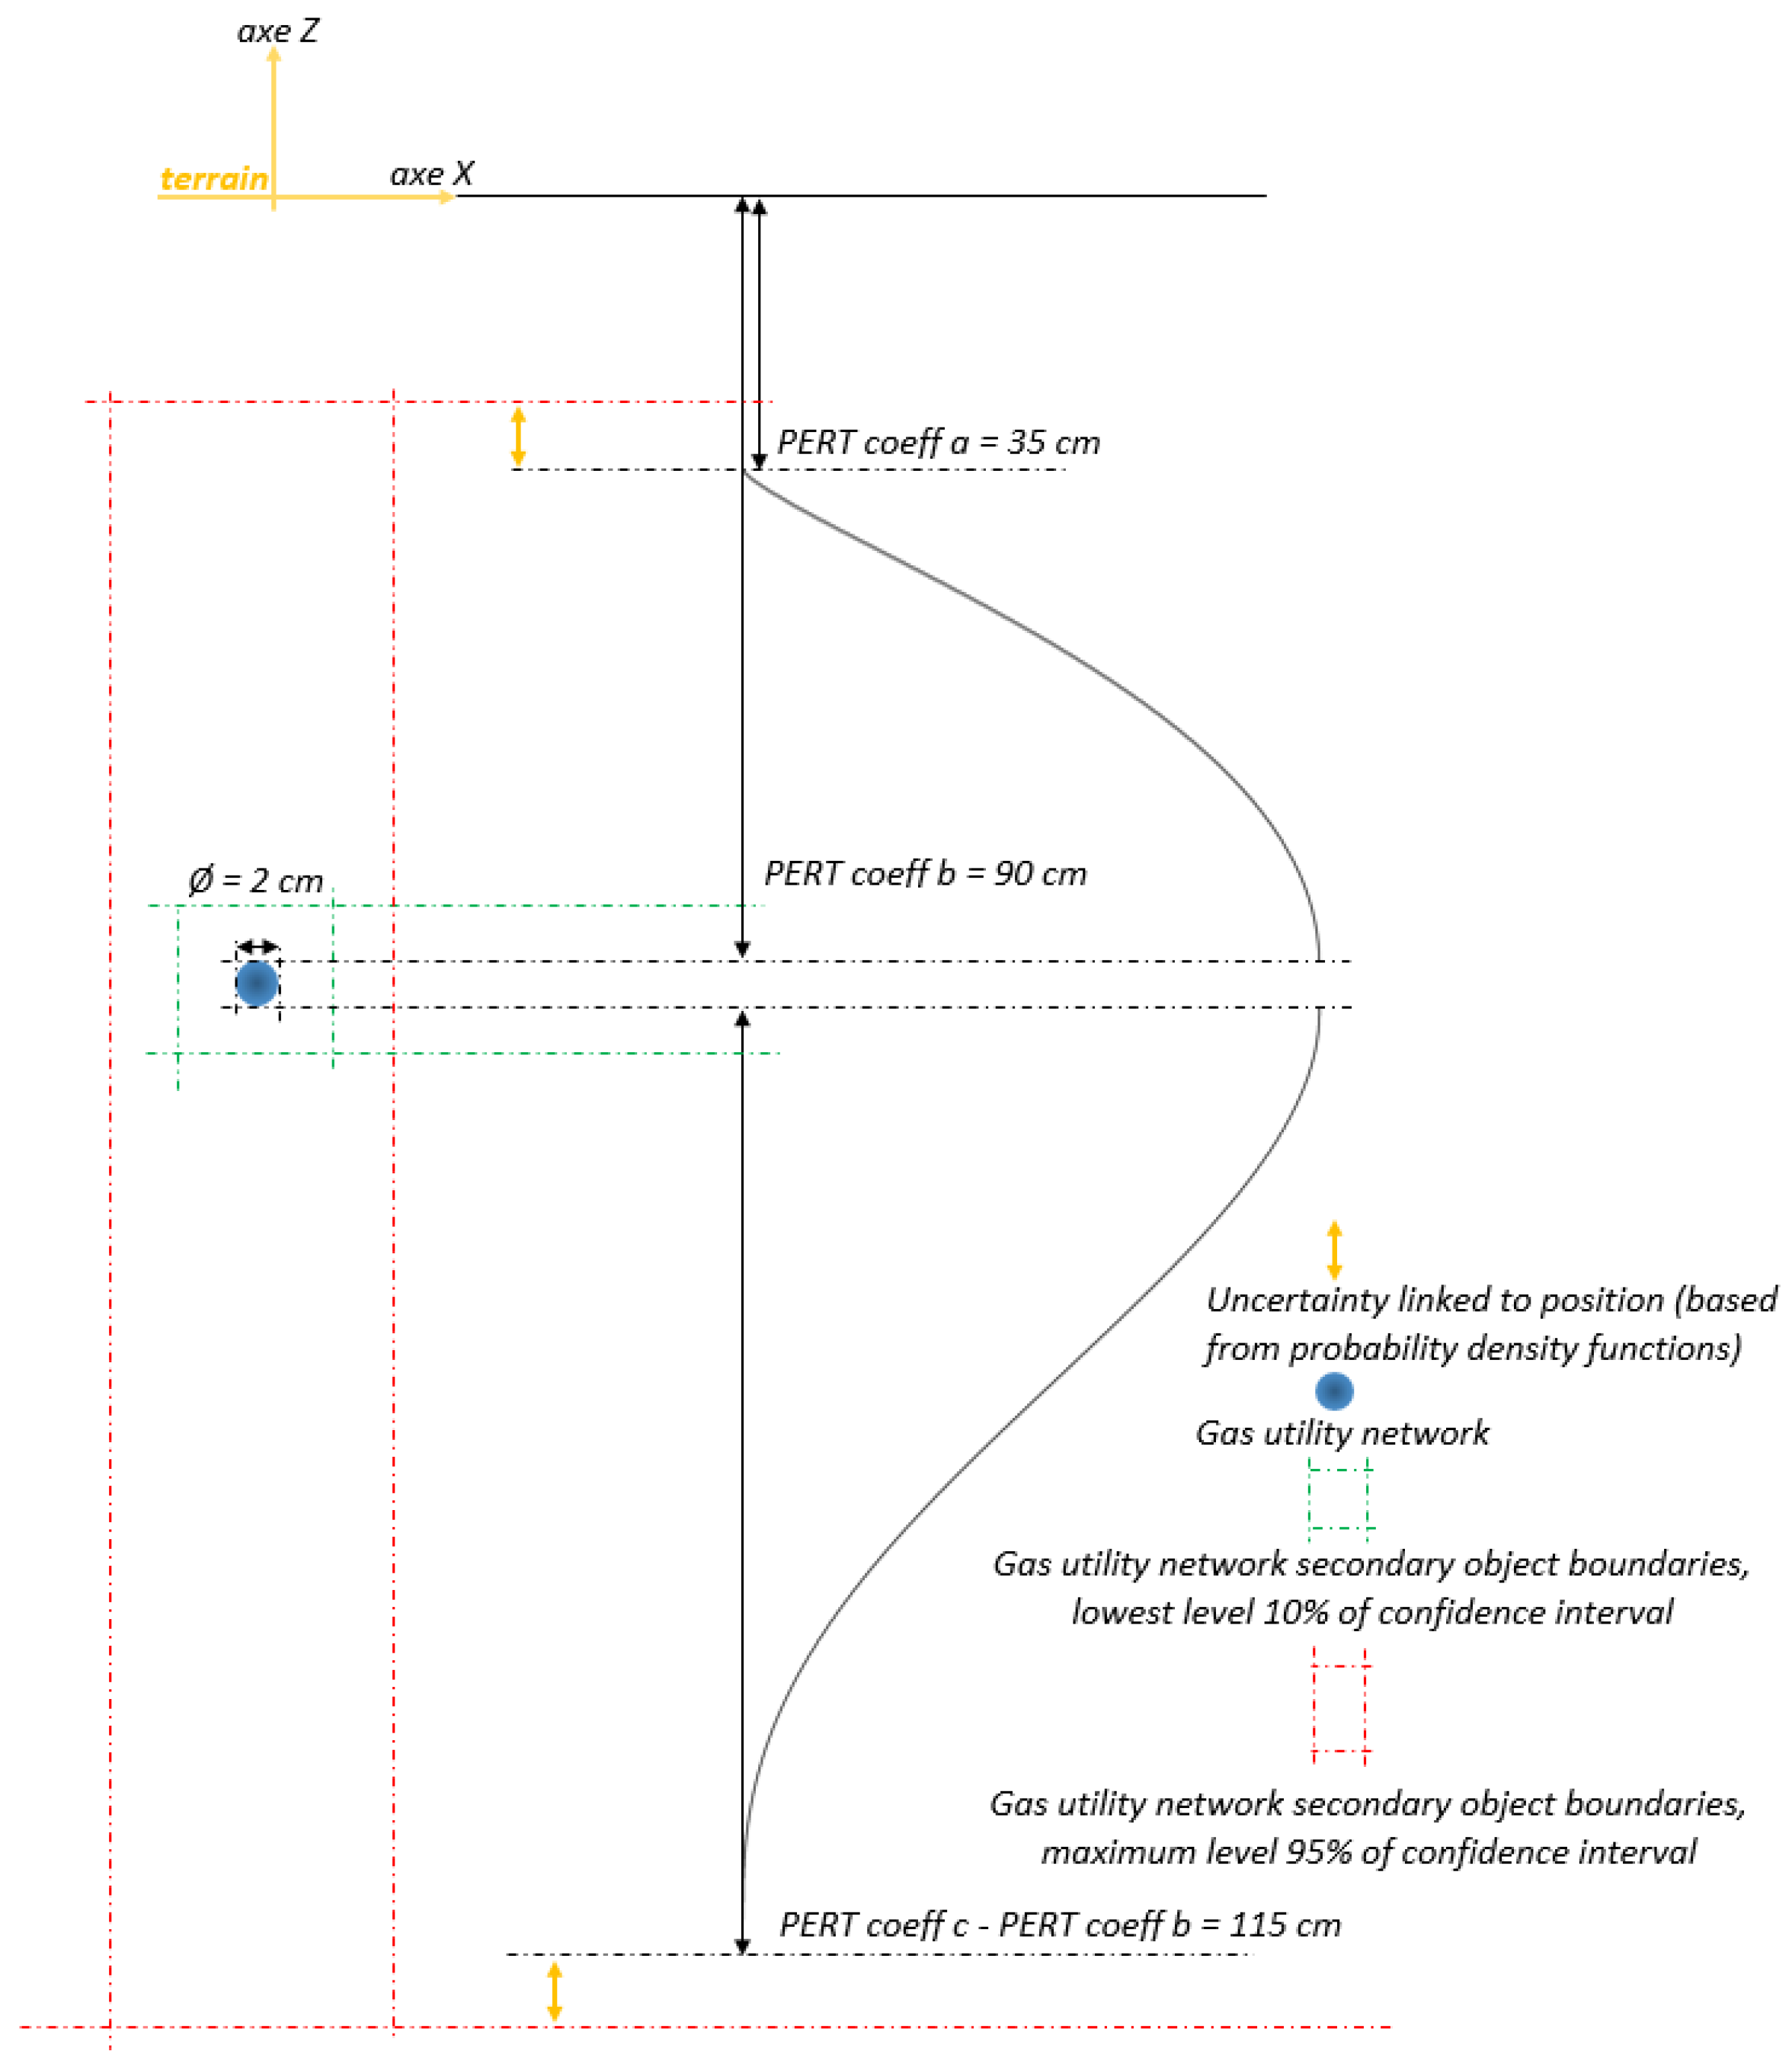
  • Depth data of the same network type close to the one with missing data exists (Figure 9, right): in this case, a “Pert” distribution is established using available data and applied to obtain missing “z” attributes.

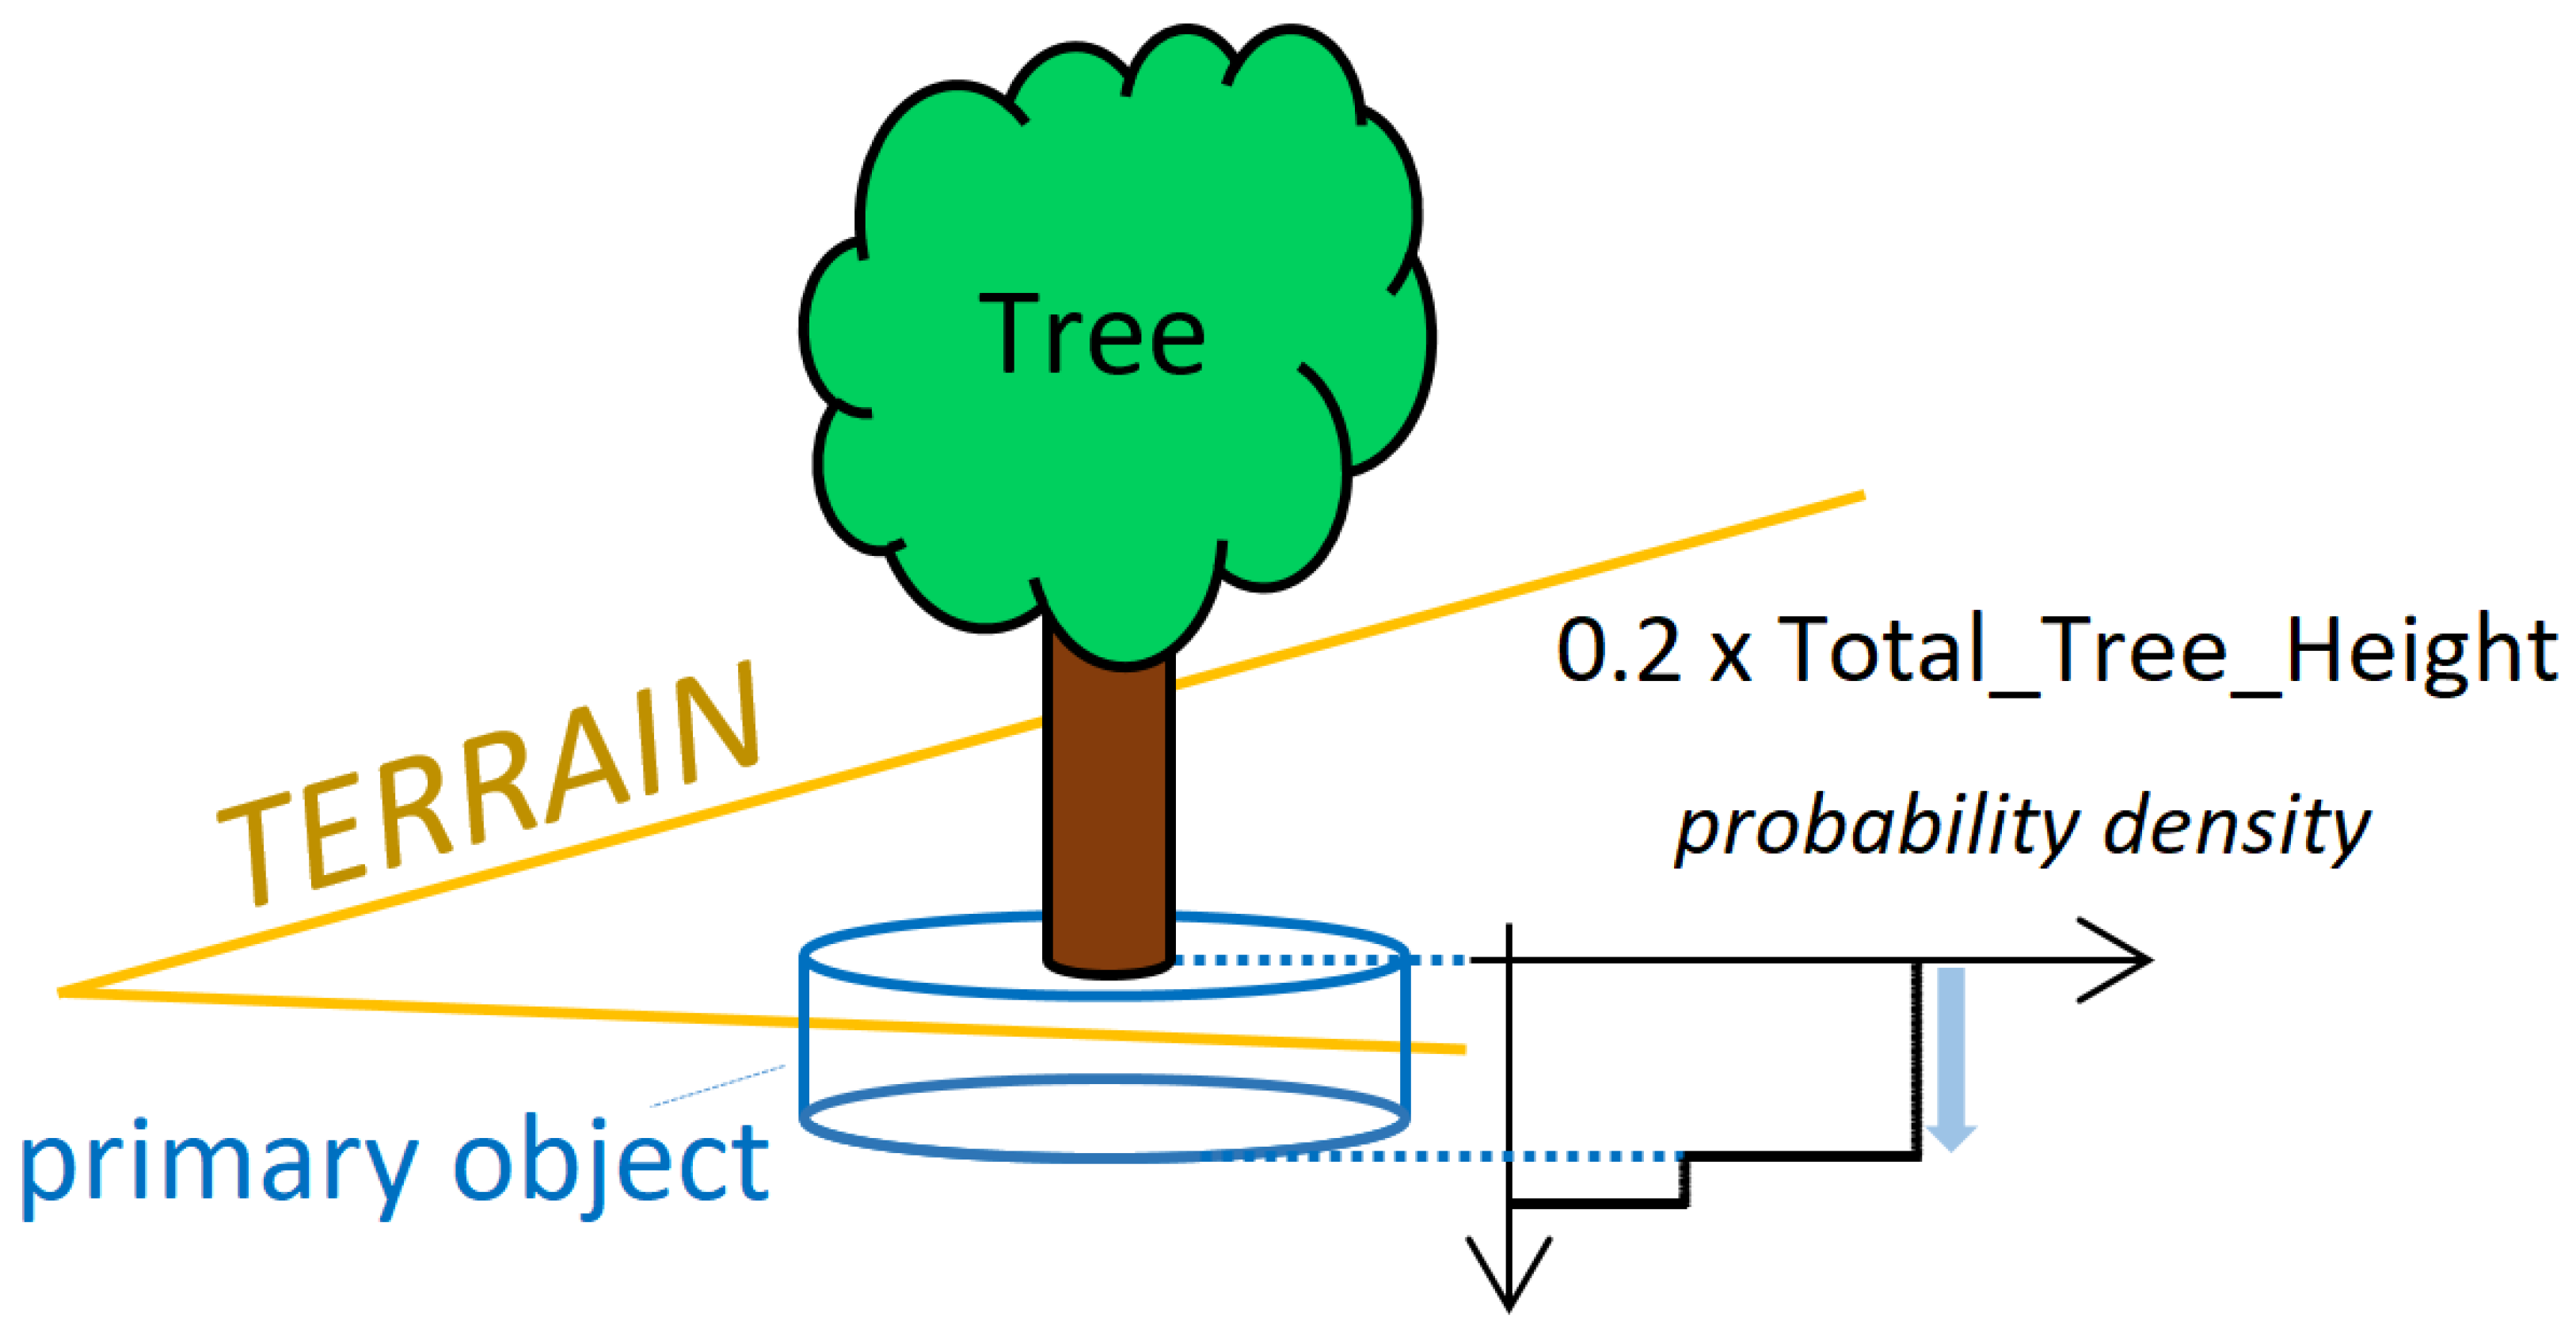
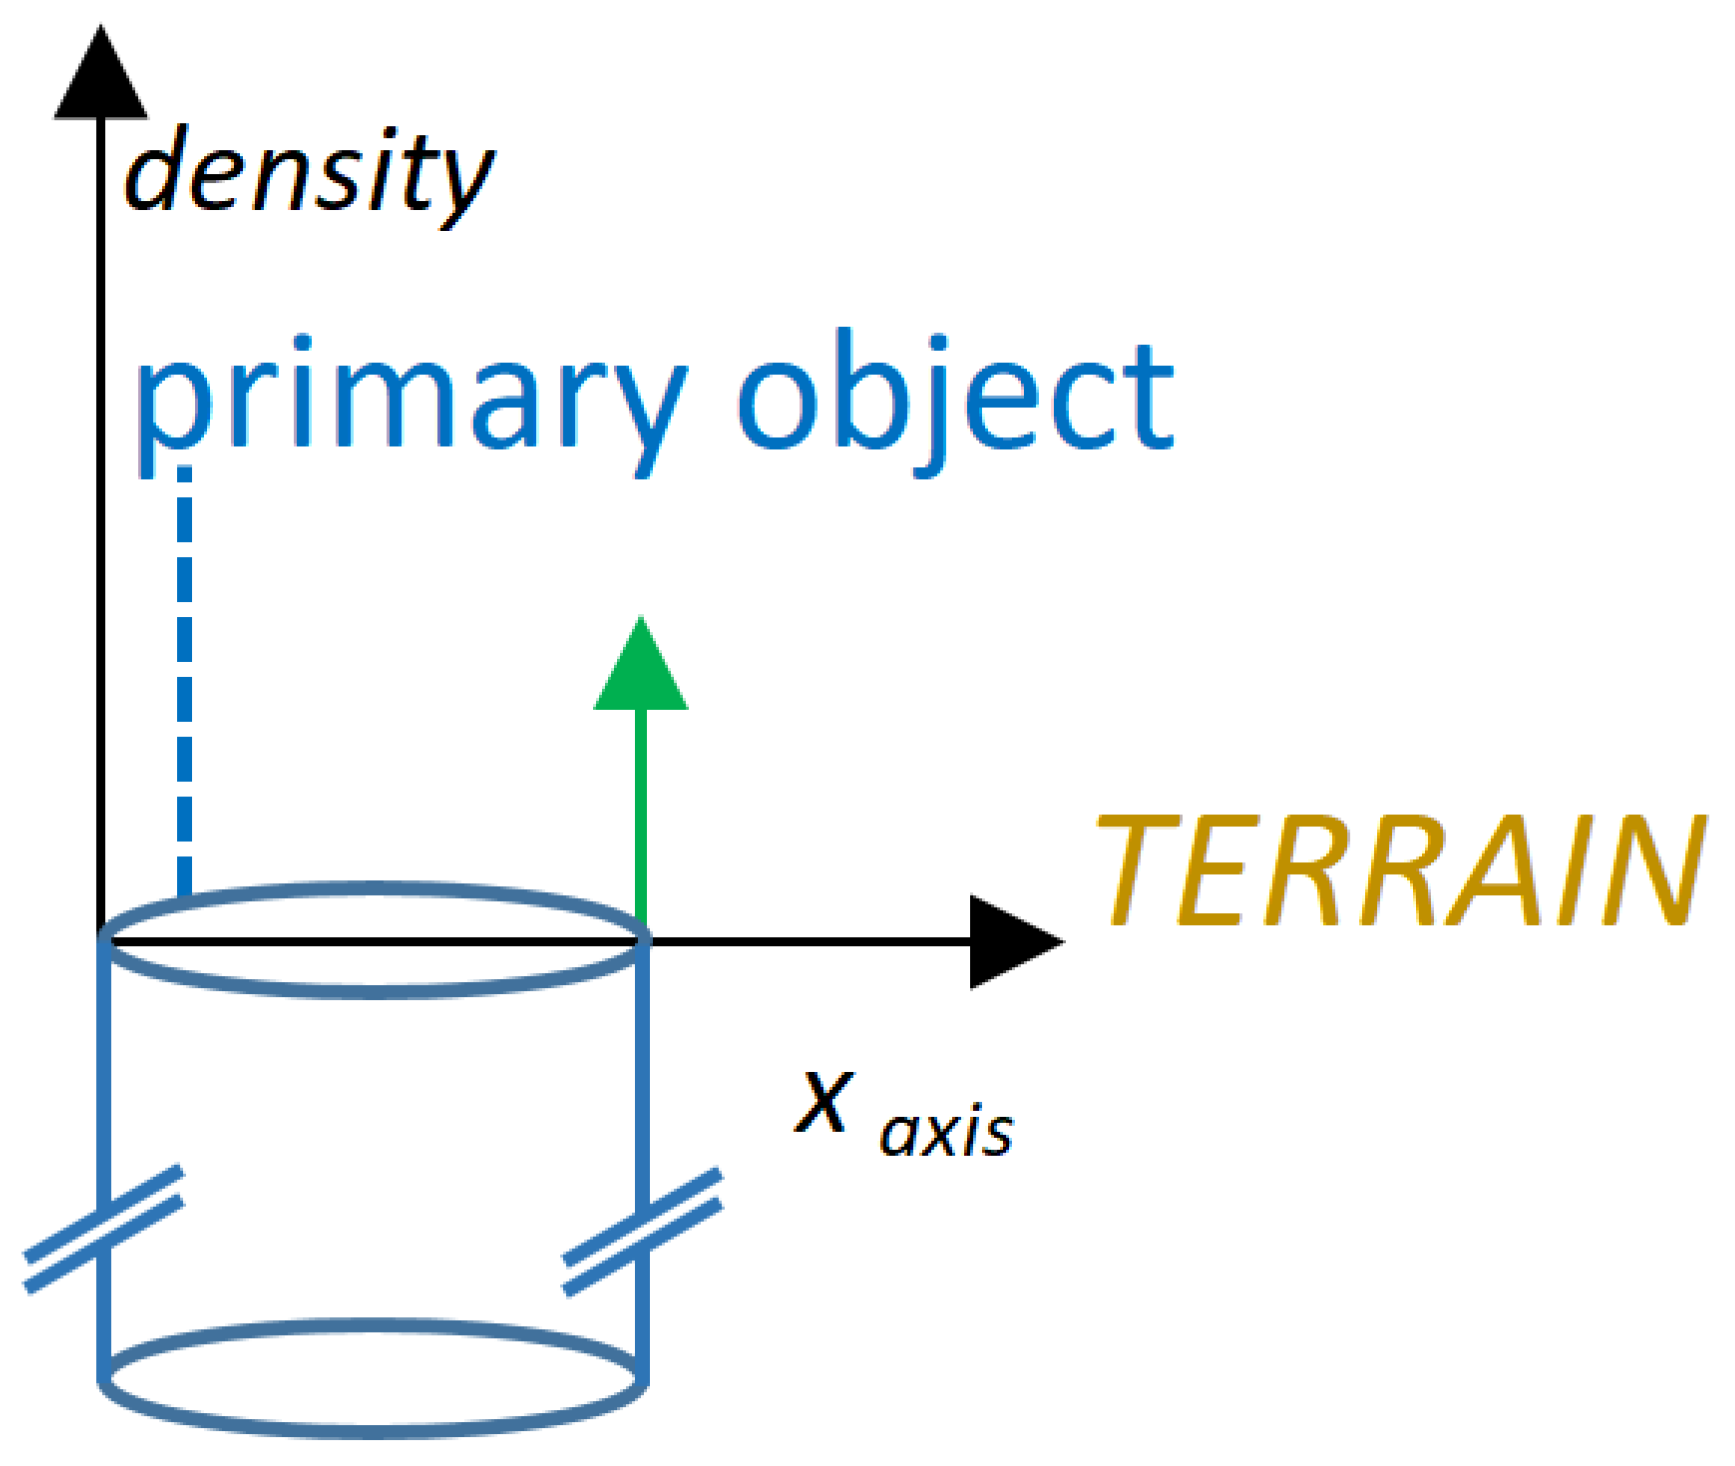
2.2.3. Bound Calibration Strategy

The third step of the process is called “Bound” and applies probability density functions triggered by completion rules, as well as confidence levels associated to positioning attributes, in order to propose a secondary (bounding) geometry. This geometry envelops the primary object and represents the volume in which the subsurface object shall be found with a given probability.
A tree root class object serves as an illustrative example. Topographic and geometric attributes of the object are linked with a precision. The position of the tree (and thereby the tree root) has been measured with an accuracy of +/−10 cm. A triangle distribution, with an overall degree of confidence of 95%, is assigned to the positioning attributes. As presented in Section 2.2.2, the confidence linked to the depth attribute of the tree root is represented by a stair-type probability density function. All these probability density functions are applied to model the secondary object (Figure 10) and consolidate precision on an attribute level to precision on an object level.
For natural gas networks, the secondary object is modeled by a bounding rectangle around the pipeline diameter. The maximal lateral limits of the secondary object are obtained using the triangle probability function, since x and y coordinates are known through measurements. The upper and lower bounds of the secondary object are calculated by adding a second component, obtained by subtracting the measurement uncertainty from the PERT coeff a (for the upper limit) and by adding the measurement uncertainty to PERT coeff c (for the lower limit), see also Figure 11. The size of the secondary object depends on the degree of confidence defined by the user: the bigger the precision confidence interval, the larger the boundaries of the secondary object.

2.2.4. Object Integration Strategy

The forth step “Integrate” consists in building 3D geometric shapes based on completed data stored in the triple store (Figure 12).
Based on a range of uncertainty models, the secondary geometric model is calibrated by combining the primary geometry dimensions convolved (Figure 12) with the probability density functions. A metric (Equation (1)) is associated to the secondary object to evaluate the probability that it bounds the primary object.
O b j e c t u n c e r t a i n t y = d i m e n s i o n p
For the creation of primary and secondary objects of other classes of the taxonomy (e.g., piezometer or utility networks), additional probability density functions have been defined and are used to express the overall Object uncertainty by applying Equation (1).
Equation (1) expresses the confidence level on an individual object basis. It is consolidated on a class level (e.g., all tree roots) by Equation (2). Volumesecondary represents the volume of the secondary volume, Objectuncertainty represents object uncertainty in Equation (1).
c o n f i d e n c e = V o l u m e s e c o n d a r y O b j e c t u n c e r t a i n t y V o l u m e s e c o n d a r y

2.2.5. Recapitulative Table

Table 2 illustrates a summary of the four stages of Figure 5 for objects introduced in Section 2.2.2, Section 2.2.3 and Section 2.2.4, referencing the SITG layers applied. In the integrate section, it can be observed, that the percentage of consolidated confidence level per objects are not identical and vary around 90% (“integrate column”). This is due to the fact, that the total confidence level for each class is calculated by Equation (1). Measured attributes can reach, according to expert interviews, a maximum of 95%, attributes derived by rules a maximum of 80%, depending on the rule. Since each object has a different number of attributes as well as confidence levels, the consolidated confidence level is different from class to class.
Choosing probability density functions such as triangle, Dirac or PERT offer a competitive advantage due to their simplicity of implementation. Moreover, these functions allow to handle the variations of confidence levels introduced by the user more easily.
The SITG data layer holding tree roots is called SIPV_ICA_ARBRE_ISOLE (Table 2). Abstract models for representation are selected (e.g., cylinder) and completed when the layer does not provide sufficient geometrical information. A virtual bounding box, the secondary object, is formed to bound a zone around the primary object. This indicates that the subsurface object can be found inside with a given probability. In the case of the tree root, this uncertainty factor is set to 90% for all objects present in this class (Table 2). The methodology has been applied to all objects scoped in the taxonomy.

3. Results/Validation

Two subsurface volumes have been chosen to validate that the methodology integrates into the workflow between publicly available data (SITG) and the GIS frontend: a first one being nearby the main train station (Cornavin, 0.32 km2) and a second one located around the Arve river (PAV, 0.31 km2).

3.1. Methodology Generalization

The first part of the methodology, “Model”, defined a set of primitive geometries to model spatial elements in the SITG [23] database for all elements present in the taxonomy (Appendix A, Figure A1). Geometries employed were, e.g., cylinders, extruded polygons and truncated cones. Secondary objects were represented by the same geometric model as that used for the primary ones, with exception of utility networks (cuboid instead of a tube) and geothermal drills (truncated cones instead of a cylinder).
The completion stage “Complete” required the identification of meaningful completion rules to correct missing spatial and geometric attributes needed for 3D representation. It was possible to identify and formulate such rules for all attributes. A visual check shows that the description of geometries is consistent (Figure 14).
Calibrations to set the level of confidence for the “Bound” stage have either been identified in collaboration with construction professionals or apply local empirical values and represent results correctly on a visual and a numerical level. Figure 13 shows a typical example of variations in the level of confidence for the case of the secondary water network.
The integration strategy “Integrate” is also validated, since primary and secondary objects are correctly visualized by the GIS frontend. The use of completion rules has an impact on the level of confidence (as see in Table 2).

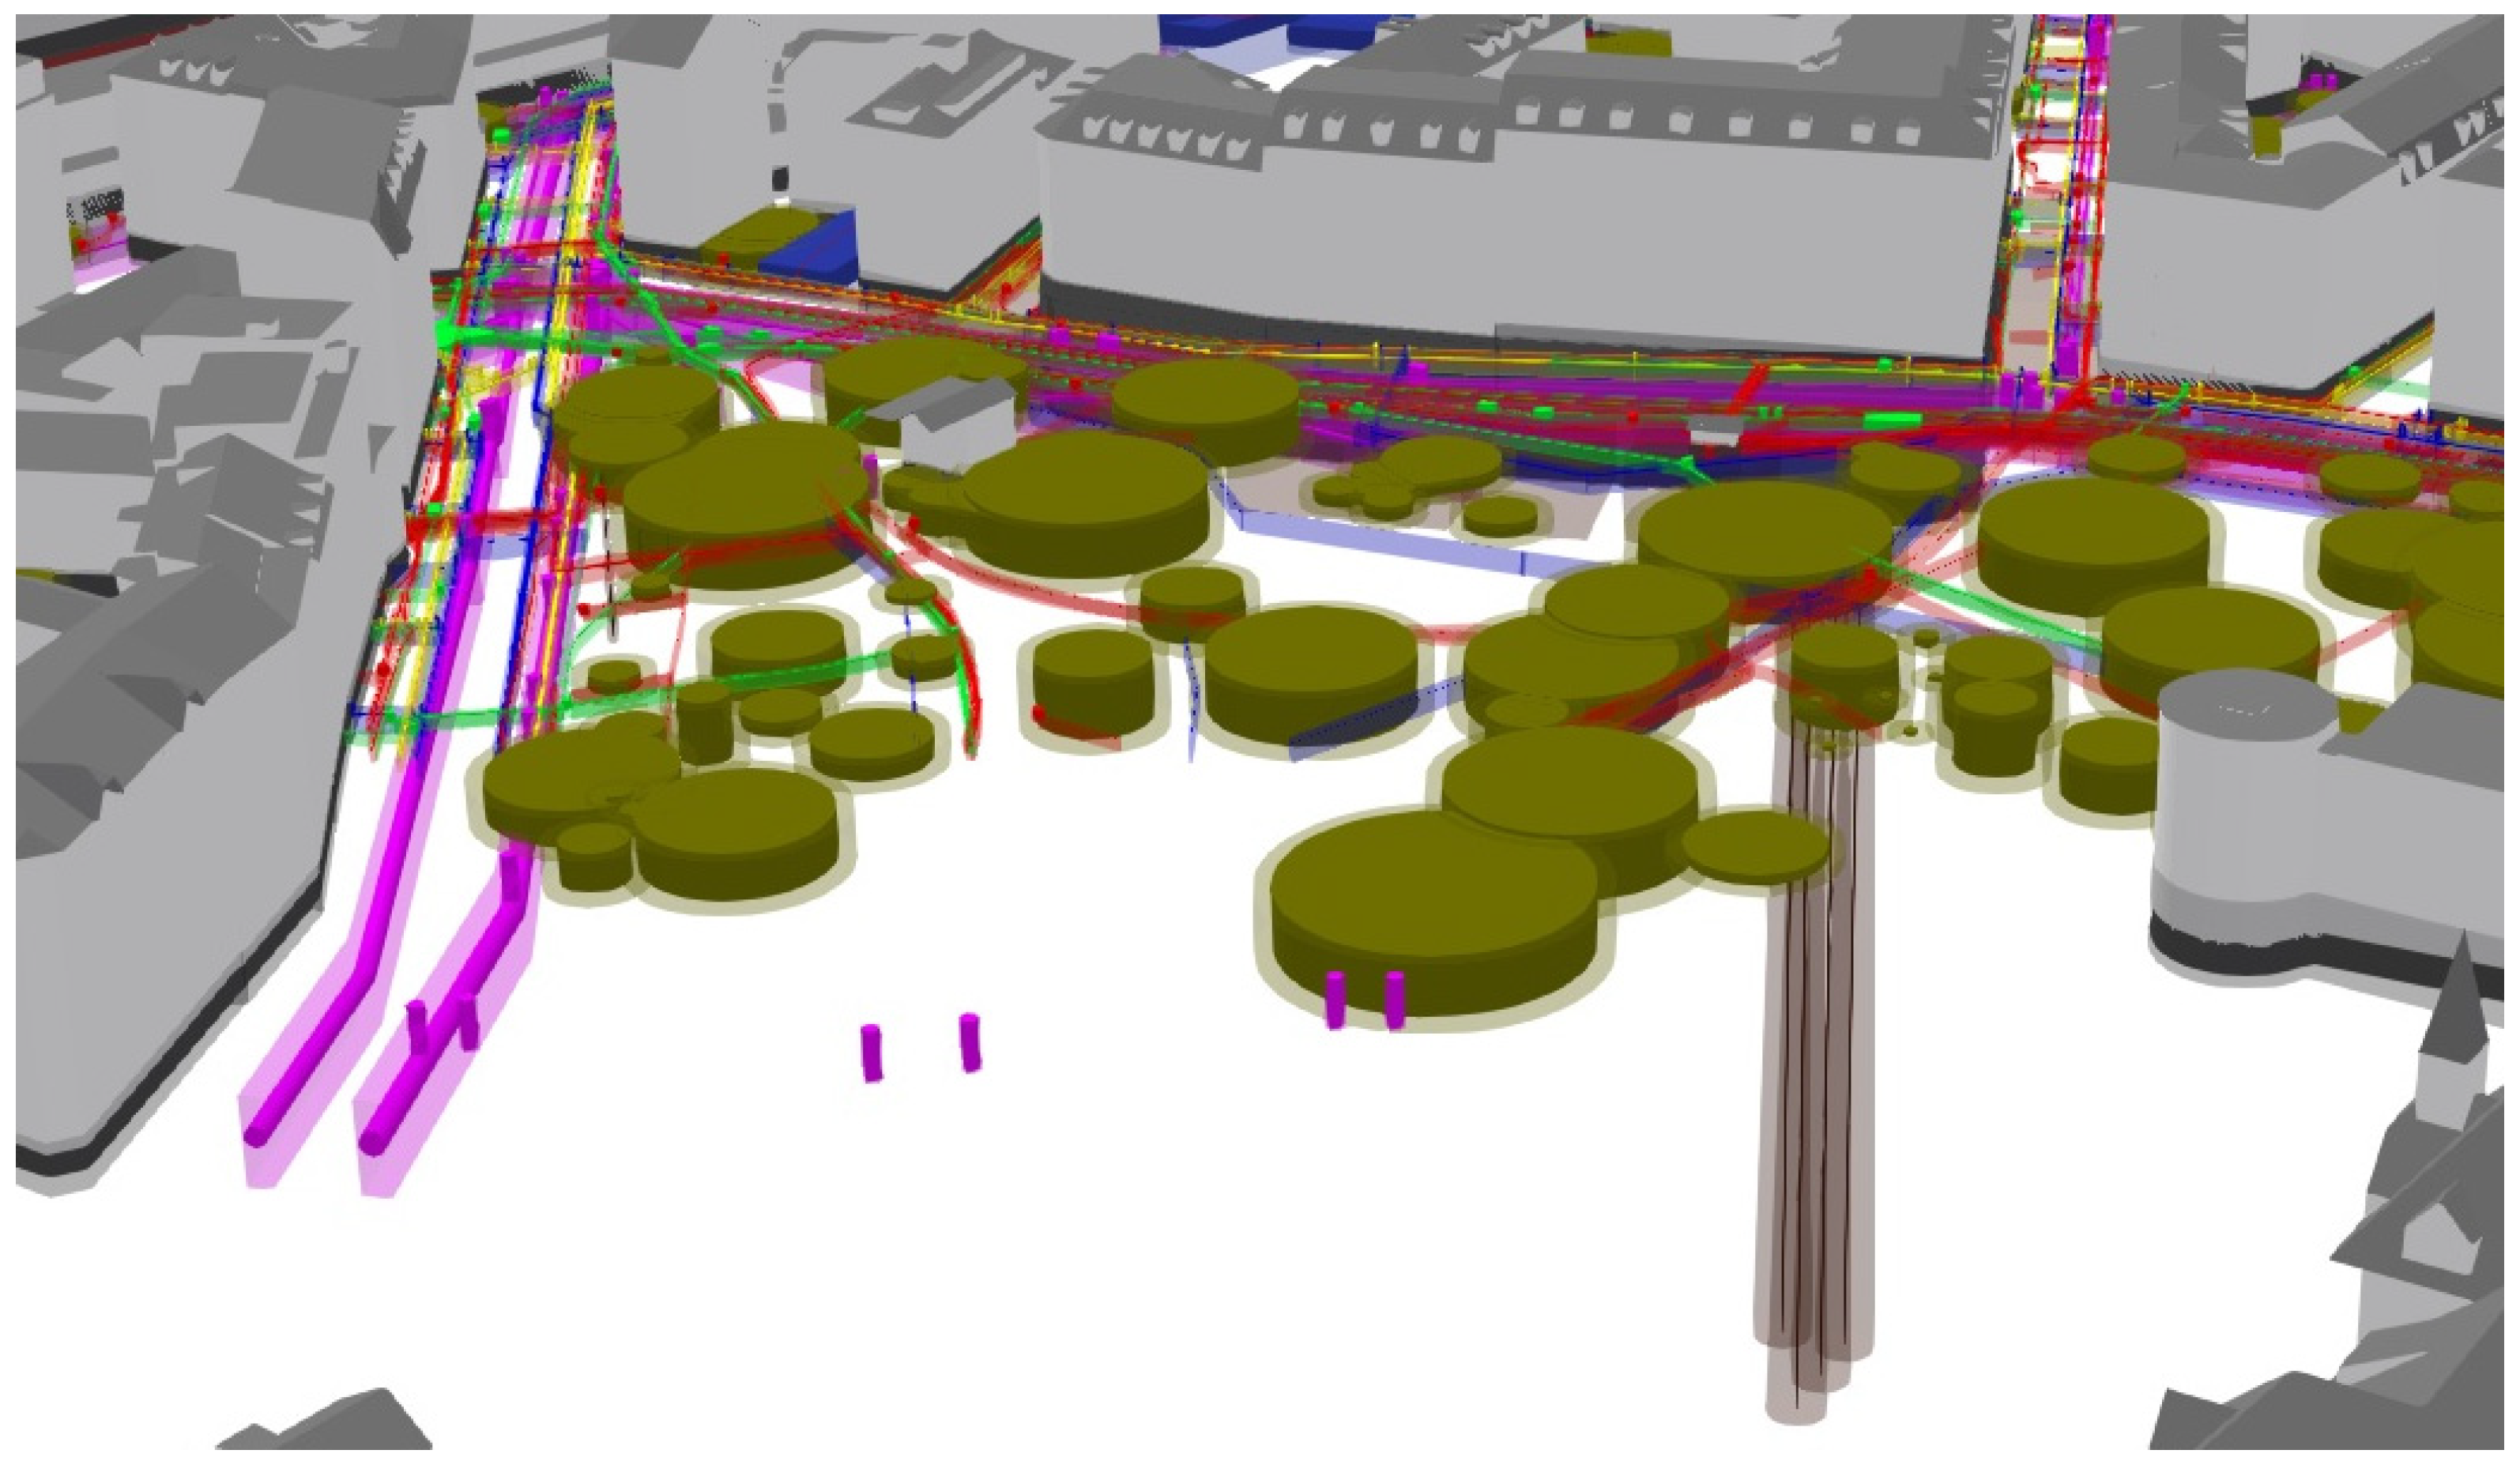
3.2. Visual Representation of Results

Figure 13 shows conceptual (left part) and visual representation (right part) of primary and secondary objects of a water pipeline in the Cornavin underground. The three arrows in the figure relate to the conceptual and the software representation. The blue arrow represents the primary object. The orange arrow shows the secondary object set for a confidence level of 40%, and the red arrow for a confidence level of 80%. Confidence levels can be defined by the user.
Information related to subsurface objects has been extracted from the SITG database for the two zones and stored in the triple store database. Missing positioning and geometrical attributes are derived by the application of completion rules described in Section 2.2.2. Secondary objects are created based on the desired confidence level. Results are stored in the triple store. In this sector, the confidence for all utility networks is evaluated to 92% by Equation (2). Finally, a GIS-Frontend is used to visualize the results (Figure 14). Primary objects are opaque, secondary objects transparent.
Table 3 indicates colors applied to the different objects, based on Swiss construction codes.
Completion strategies have proven their robustness by supplying coherent visual representation of underground objects, to which compliance rules can be applied.

3.3. Qualification of Existing Spatial Information for the Examined Volumes

The urban underground space metric (UUS) [33] is calculated for result validation. For PAV and Cornavin areas, a similar density as a comparable volume in Berlin (Table 4) is obtained.
UUS does not consider the quality of available data. We propose, as a first approach, a refined completeness ratio (Equation (3)), calculated separately for each object class. An average is established for all present object classes. This leverages the parasite effects created by objects with a bigger number of attributes or are present in a greater number than others in the evaluated volume.
Refined   Completeness   Ratio = O b j e c t C l a s s   ϵ   T a x o n o m y O b j e c t   ϵ   O b j e c t C l a s s P r i m i t i v e   P a r a m e t e r s   C o u n t E x i s t i n g ( O b e j e c t ) O b j e c t   ϵ   O b j e c t C l a s s P r i m i t i v e   P a r a m e t e r s   C o u n t R e q u i r e d ( O b e j e c t ) C a r d i n a l ( O b j e c t C l a s s   ϵ   T a x o n o m y )
Table 5 exposes the results of Equation (3) applied to the two zones (Cornavin and PAV). The completeness ratio is calculated to approximately 80%, the refined metric results in approximately 73%.
In addition, it indicates the total number of geometric parameters required to represent the volume (gross geometric parameters). Completeness ratios will be helpful to introduce a threshold, indicating if object completion can be reasonably applied to available data.

4. Discussion

A methodology to model subsurface objects, integrating completion strategies and confidence levels, is proposed. Confidence levels can be chosen by the user and are visualized by bounding volumes, called “secondary objects”. Only simple geometries are used, since uncertainties related to object geometry and positioning would decrease possible advantages of a more precise representation. The methodology has been integrated into the workflow of the InnoSubsurface project and validated on two subsurface volumes.
The concept of primary and secondary objects provides an intuitive way for users to evaluate the degree of saturation of subsurface volumes. The project has been presented at several occasions on a Swiss national level and practitioners in private companies and administration were very receptive to the concept of representing confidence levels together with data, which is a novel approach.
The analysis of missing topographical and geometrical attributes showed that it is always possible to define reasonable hypotheses to complete primary objects and to model secondary objects indicating a level of confidence. However, a quality measure related to the number of missing object attributes, indicating if the application of meaningful results is possible, still needs to be established.
The methodology has been generalized for all subsurface objects represented in the taxonomy and successfully applied for the 3D representation of subsurface objects. We are aware that our approach might still lack precision. There is potential to improve the underlying hypothesis for data completion and the calculation of confidence levels. Nevertheless, we are convinced that this non-intrusive and inexpensive method will help decision makers to obtain a first insight into available subsurface space and serve as a useful tool for subsurface planning.

5. Future Work

The methodology can be extended in several ways. Hypotheses used for the completion of missing attributes, like the radius and the depth of tree roots, are good candidates to be refined using e.g., botanic or mechanical models.
If other locations than Geneva are to be analyzed, we propose to develop an automatic detection of missing object attributes to identify needed completion rules. Completion and compliance rules have to be adapted to construction codes of each region.
Another challenge resides in the development of automatic procedures for disentangling the crossing of multiple utility lines. When geometrical conflicts of such elements are detected, an intelligent geometrical re-arrangement should place elements according to professional rules.
Moreover, we propose the use of the completed data to perform automated compliance checking as suggested in [24,25]. Completed objects, with a primary and a secondary object representation, can be used as a source to check e.g., compliance of new subsurface construction projects with existing ones.

6. Conclusions

The construction industry should use opportunities offered by digital tools to speed up the transition to industry 4.0. This is particularly true for data-driven civil and underground engineering. Today, the collection of all necessary data needed for an efficient analysis of underground objects is complex and prone to errors. Datasets vary largely in precision, completeness, accuracy, levels of detail and format. Time-consuming data curation operations are needed before compiled sets can be used for analysis and design. Undetected spatial conflicts are the cause of important human and economic losses.
A full set of subsurface data employs models coming from BIM and GIS environments. BIM and GIS have different data representation concepts, preventing their interoperability. This paper showed how integrated data from BIM and GIS systems can be successfully applied to the representation of subsurface objects. The structure is based on an ontology that integrates notions of accuracy as well as methods for data correction and completion.
Further research on a general and abstract conceptualization is required. Curation and processing of uncertain and incomplete subsurface data prompts research on models to represent uncertainty and to process data with different confidence levels. It is also necessary to take a more intense look at the use of rule-based systems to automatically infer missing data by applying domain knowledge and heuristic rules. This paper implies a first proof of concept in the detection of potential spatial conflicts of subsurface assets, contributing to the reduced losses described above.

Author Contributions

Conceptualization, K.A., F.B. and B.D.; methodology, K.A. and B.D.; validation, K.A., F.B. and B.D.; writing—original draft preparation, K.A. and B.D.; writing—review and editing, K.A., F.B. and B.D.; visualization, K.A. and F.B.; supervision, K.A. and B.D.; project administration, B.D.; funding acquisition, B.D. All authors have read and agreed to the published version of the manuscript.

Funding

This research is supported by Innosuisse in the framework of the Innovation project 35265.1 IP-ICT, “Impulse-Subsurface: Efficient data exploitation in subsurface planning”.

Institutional Review Board Statement

Not applicable.

Informed Consent Statement

Not applicable.

Data Availability Statement

Provision of data and professional knowledge: State of Geneva (State Direction for Territory Information, Department of Urbanism, Department of Transports, Department of Energy, Department of Water, Industrial Services of Geneva and Geneva Airport).

Acknowledgments

The authors would like to thank Loïc Neuenschwander, Yohann Schatz (HEPIA). Ontology creation, conceptualization of the generic rule model and set up of the triple store database: UNIGE (Pr Giovanna Di Marzo Serugendo, Claudine Metral, Pr Gilles Falquet, Vincenzo Daponte, Ashley Caselli). Industrial partner, GIS-expert, representation and analysis of subsurface volumes in a GIS-Frontend: TOPOMAT (Mr Stéphane Couderq, Marie-Christine Nicolle, Christophe Suter, Alexandre Gauch).

Conflicts of Interest

The authors declare no conflict of interest.

Appendix A

The following illustration shows the listing of objects present in the taxonomy.
Figure A1. Taxonomy.
Applsci 11 03483 g0a1

Appendix B

The following illustration is a simplification of the minimal model for utility networks.
Figure A2. Utility networks, simplified minimal model.
Applsci 11 03483 g0a2

References and Notes

  1. Bobylev, N.; Sterling, R. Urban Underground Space: A Growing Imperative. Tunn. Undergr. Space Technol. 2016, 55, 1–4. [Google Scholar] [CrossRef]
  2. Admiraal, H.; Cornaro, A. Underground Space; Ice Publishing: Tonbridge, UK, 2017; ISBN 978-0-7277-6145-3. [Google Scholar]
  3. Bobylev, N. Transitions to a High Density Urban Underground Space. Procedia Eng. 2016, 165, 184–192. [Google Scholar] [CrossRef]
  4. Zargarian, R.; Hunt, D.V.L.; Braithwaite, P.; Bobylev, N.; Rogers, C.D.F. A New Sustainability Framework for Urban Underground Space. Proc. Inst. Civ. Eng. Eng. Sustain. 2018, 171, 238–253. [Google Scholar] [CrossRef] [Green Version]
  5. Underground. Institut du Paysage, d’Architecture, de la Construction et du Territoire (inPACT) 2019, Méthodes innovantes pour la construction-MIC. Available online: https://www.hesge.ch/hepia/recherche-developpement/projets-recherche/termine/underground (accessed on 5 April 2021).
  6. SIG. 2020. Available online: https://ww2.sig-ge.ch/ (accessed on 5 April 2021).
  7. Shan, Q.; Pennock, S.R.; Redfern, M.A. Investigation of GPR Configurations by Ray-Tracing Methods. In Proceedings of the 2006 IEEE Conference on Radar, Verona, NY, USA, 24–27 April 2006; IEEE: Syracuse, NY, USA, 2006; pp. 335–341. [Google Scholar]
  8. Biljecki, F.; Stoter, J.; Ledoux, H.; Zlatanova, S.; Çöltekin, A. Applications of 3D City Models: State of the Art Review. ISPRS Int. J. Geo-Inf. 2015, 4, 2842–2889. [Google Scholar] [CrossRef] [Green Version]
  9. Pauwels, P.; Zhang, S.; Lee, Y.-C. Semantic Web Technologies in AEC Industry: A Literature Overview. Autom. Constr. 2017, 73, 145–165. [Google Scholar] [CrossRef]
  10. Adouane, K.; Stouffs, R.; Janssen, P.; Domer, B. A Model-Based Approach to Convert a Building BIM-IFC Data Set Model into CityGML. J. Spat. Sci. 2019, 1–24. [Google Scholar] [CrossRef]
  11. Biljecki, F.; Lim, J.; Crawford, J.; Moraru, D.; Tauscher, H.; Konde, A.; Adouane, K.; Lawrence, S.; Janssen, P.; Stouffs, R. Extending CityGML for IFC-Sourced 3D City Models. Autom. Constr. 2021, 121, 103440. [Google Scholar] [CrossRef]
  12. Stouffs, R.; Tauscher, H.; Biljecki, F. Achieving Complete and Near-Lossless Conversion from IFC to CityGML. ISPRS Int. J. Geo-Inf. 2018, 7, 355. [Google Scholar] [CrossRef] [Green Version]
  13. Xu, X.; Cai, H. Semantic Approach to Compliance Checking of Underground Utilities. Autom. Constr. 2020, 109, 103006. [Google Scholar] [CrossRef]
  14. Zou, L. SPARQL. In Encyclopedia of Database Systems; Liu, L., Özsu, M.T., Eds.; Springer: New York, NY, USA, 2018; pp. 3554–3558. ISBN 978-1-4614-8266-6. [Google Scholar]
  15. Rook, M.; Biljecki, F.; Diakité, A.A. Towards automatic semantic labelling of 3D city models. ISPRS Ann. Photogramm. Remote Sens. Spat. Inf. Sci. 2016, IV-2/W1, 23–30. [Google Scholar] [CrossRef]
  16. Hwang, S.; Thill, J.-C. Modeling Localities with Fuzzy Sets and GIS. In Fuzzy Modeling with Spatial Information for Geographic Problems; Petry, F.E., Robinson, V.B., Cobb, M.A., Eds.; Springer: Berlin/Heidelberg, Germany, 2005; pp. 71–104. ISBN 978-3-540-23713-6. [Google Scholar]
  17. Morris, A.; Jankowski, P. Combining Fuzzy Sets and Databases in Multiple Criteria Spatial Decision Making. In Flexible Query Answering Systems; Larsen, H.L., Andreasen, T., Christiansen, H., Kacprzyk, J., Zadrożny, S., Eds.; Physica-Verlag HD: Berlin/Heidelberg, Germany, 2001; pp. 103–116. ISBN 978-3-7908-1347-0. [Google Scholar]
  18. Morris, A.; Jankowski, P. Spatial Decision Making Using Fuzzy GIS. In Fuzzy Modeling with Spatial Information for Geographic Problems; Petry, F.E., Robinson, V.B., Cobb, M.A., Eds.; Springer: Berlin/Heidelberg, Germany, 2005; pp. 275–298. ISBN 978-3-540-23713-6. [Google Scholar]
  19. Olde Scholtenhuis, L.L.; den Duijn, X.; Zlatanova, S. Representing Geographical Uncertainties of Utility Location Data in 3D. Autom. Constr. 2018, 96, 483–493. [Google Scholar] [CrossRef]
  20. Kutzner, T.; Hijazi, I.; Kolbe, T.H. Semantic Modelling of 3D Multi-Utility Networks for Urban Analyses and Simulations: The CityGML Utility Network ADE. Int. J. 3-D Inf. Model. 2018, 7, 1–34. [Google Scholar] [CrossRef] [Green Version]
  21. McKenzie, G.; Hegarty, M.; Barrett, T.; Goodchild, M. Assessing the Effectiveness of Different Visualizations for Judgments of Positional Uncertainty. Int. J. Geogr. Inf. Sci. 2016, 30, 221–239. [Google Scholar] [CrossRef]
  22. Wechsler, S.P.; Kroll, C.N. Quantifying DEM Uncertainty and Its Effect on Topographic Parameters. Photogramm. Eng. Remote Sens. 2006, 72, 1081–1090. [Google Scholar] [CrossRef] [Green Version]
  23. Sitg, L. Territoire Genevois à la Carte. Available online: https://ge.ch/sitg/ (accessed on 26 February 2020).
  24. Métral, C.; Daponte, V.; Caselli, A.; Di Marzo, G.; Falquet, G. Ontology-Based Rule Compliance Checking for Subsurface Objects. Int. Arch. Photogramm. Remote Sens. Spatial Inf. Sci. 2020, XLIV-4/W1-2020, 91–94. [Google Scholar] [CrossRef]
  25. Caselli, A.; Daponte, V.; Falquet, G.; Métral, C. A Rule Language Model for Subsurface Data Refinement in EG-ICE 2020 Workshop on Intelligent Computing in Engineering; Online Technische Universität Berlin: Berlin, Germany, 2020; pp. 443–452. [Google Scholar]
  26. Topomat. Switzerland Partner for Geographical Information Systems; Topomat: Founex, Switzerland, 2021. [Google Scholar]
  27. Pauwels, P.; Krijnen, T.; Terkaj, W.; Beetz, J. Enhancing the IfcOWL Ontology with an Alternative Representation for Geometric Data. Autom. Constr. 2017, 80, 77–94. [Google Scholar] [CrossRef] [Green Version]
  28. Métral, C.; Billen, R.; Cutting-Decelle, A.-F.; van Ruymbeke, M. Ontology-Based Approaches for Improving the Interoperability between 3D Urban Models. J. Inf. Technol. Constr. 2010, 15, 169–184. [Google Scholar]
  29. State of Geneva, Directive for Trees, Version 1.2. 2013.
  30. SGWA, Swiss Gas and Water Industry Association, Gas, G2. 2019.
  31. SGWA, Swiss Gas and Water Industry Association, Water, W4. 2013.
  32. SGWA, Swiss Gas and Water Industry Association, Thermal, F1. 2017.
  33. Bobylev, N. Underground Space as an Urban Indicator: Measuring Use of Subsurface. Tunn. Undergr. Space Technol. 2016, 55, 40–51. [Google Scholar] [CrossRef] [Green Version]
Figure 1. Subsurface global workflow.
Applsci 11 03483 g001
Figure 2. Minimal model focused on simplified geometric representation.
Applsci 11 03483 g002
Figure 3. Minimal model (subsurface solid geometry) mapped to IFC and CityGML, from Métral [24].
Applsci 11 03483 g003
Figure 4. SGWA W10 rule to manage the spatial interaction between the water network and manmade objects, adapted from [24,25].
Applsci 11 03483 g004
Figure 5. Data work flow from Geographical Information System (GIS) store to resource description framework (RDF) triple store.
Applsci 11 03483 g005
Figure 6. Geometry model selection for the tree root object-class in the taxonomy.
Applsci 11 03483 g006
Figure 7. Primary geometry, depth completion and stair type probability density function along the Z-axis.
Applsci 11 03483 g007
Figure 8. Use of a Dirac probability density function along the X-axis for a diameter completion of a gas network node.
Applsci 11 03483 g008
Figure 9. Calibration of a minimum ground cover when no data is available (left side) or when local is available (right side).
Applsci 11 03483 g009
Figure 10. Secondary geometry and radius calibration based on the triangle probability density function along the X-axis.
Applsci 11 03483 g010
Figure 11. Bounding box for a natural gas network secondary object.
Applsci 11 03483 g011
Figure 12. Integration of 3D original and convolved shapes in an RDF triple store.
Applsci 11 03483 g012
Figure 13. Water pipeline networks primary/secondary in Cornavin undergrounds, conceptual/visual.
Applsci 11 03483 g013
Figure 14. Three-dimensional view of underground volumes, developed [26].
Applsci 11 03483 g014
Table 1. Attributes for trees provided by SITG [23].
Attribute NameValueAttribute NameValue
object ID1status of developmentadult
original nameacer campestrevitalitygood
situationgardenground typestandard mix
type of plantationgroupsurface typeshrub
number of truncs1life esperance2100
formBaliveautype speciesdicotylédone
Table 2. Flow from the GIS layer towards RDF triple store database.
GIS LayerTaxonomy ElementModel PrimaryModel SecondaryCompleteBoundIntegrate
SIPV_ICA_ARBRE_ISOLEtree rootcylindercylinder_radius
_depth
_triangle90.0%
CAD_SS_GAZ_CONDUITEnatural gas network pipelineExtruded polygonExtruded polygon_depth_triangle
_PERT
93.0%
GOL_PIEZOMETREpiezometertruncated conetruncated cone_radius
_depth
_triangle92.0%
Table 3. Color codes used in Figure 14.
ColourObjectColourObject
olivetree rootredelectricity network
bluenatural water networkgreentelecommunication
magentawastewateryellowgas
light greygeothermal drillsdark greysubsurface buildings
Table 4. Urban underground space (UUS) for PAV (Arve river) and Cornavin zones.
MetricPAV SectorCornavin SectorBerlin [33]
surface, km20.310.32
primary volumes, m3 (000 000)0.490.42
UUS m3/m2 (in cm)156.8133.7128.0
Table 5. Description of data completeness ratios for PAV and Cornavin zones.
AreaCompleteness RatioRefined Completeness RatioGross Geometric Parameters
Cornavin80.22%72.33%387′282
PAV79.36%73.76%147′468
Publisher’s Note: MDPI stays neutral with regard to jurisdictional claims in published maps and institutional affiliations.

