Article

Characterizing Air Pollution and Its Association with Emission Sources in Lahore: A Guide to Adaptation Action Plans to Control Pollution and Smog

1
Department of Mechanical Engineering, School of Engineering, University of Management & Technology, Lahore 54782, Pakistan
2
Department of Civil Engineering, School of Engineering, University of Management & Technology, Lahore 54782, Pakistan
3
Department of Land Surveying and Geo-Informatics, The Hong Kong Polytechnic University, Hong Kong SAR 999077, China
4
Remote Sensing, GIS and Climatic Research Lab (RSGCRL), National Center of GIS and Space Applications, University of the Punjab, Lahore 54590, Pakistan
*
Authors to whom correspondence should be addressed.
These authors contributed equally to this work.
Submission received: 1 April 2022 / Revised: 4 May 2022 / Accepted: 10 May 2022 / Published: 19 May 2022

Abstract

:

Featured Application

Low-cost surveillance of emission sources for eminent pollutants to combat smog in cities using remote sensing.

Abstract

Lahore, the home of 11 million people, is one of the most polluted cities in the world. Pollution causes deaths, birth defects, and years of life lost. This study’s real-time data analysis of the air quality index (AQI) showed that air pollution remained “unhealthy for everyone” for 54% of the time, and “unhealthy for sensitive groups” for 88% of the time, during the last three years (June 2019–September 2021). The air quality index (AQI) value in Lahore reached 175 µg/m3 in 2021. This alarmingly hazardous air situation was analyzed by selecting fourteen sites based on the provenance of industrialization and tailpipe emissions. An analysis of remote sensing data for these sites was performed, in addition to field surveys, to identify the relationship between pollutant concentration and on-ground current practices. The key primary and secondary air pollutants selected for analysis were carbon monoxide (CO), nitrogen dioxide (NO2), sulphur dioxide (SO2), aerosol optical depth (AOD), methane (CH4), and formaldehyde (HCHO). The assessment was carried out for the study period of July 2018 to April 2021. The real-time AQI was plotted against each pollutant’s monthly concentration, which showed a significant positive correlation of AQI with SO2, NO2, and CO. A plotting of the percentage contribution of each pollutant with its emission sources highlighted the main pollutant to take action to reduce, as a priority on those particular sites. The pollutant hotspot within each economic activity was also determined. Assessments showed that the AQI value was higher on weekends than on weekdays. These findings can help to develop smart adaptation action plans for immediate implementation, to dilute the current environmental risks in the city.

1. Introduction

Approximately 200 of every 100,000 deaths are attributed to environmental factors [1]. Air quality has a significant impact on human health. According to the WHO, the total number of deaths attributed to ambient air pollution and its consequential diseases, such as ALRI (acute lower respiratory infection), COPD (chronic obstructive pulmonary disease), lung cancer, IHD (ischemic heart disease), and stroke, in Pakistan in 2012, was 60,000 [2]. This number increased to 105,000 in 2020 [3]. The high health cost of air pollution-related diseases is 1% of total gross domestic product (GDP), whereas the total cost of environmental degradation is 6% of GDP. Around 30 million inhabitants of the urban population are affected by smog [4]. In a study conducted in 2021, the avoidable mortality of only IHD and lung cancer, was over 2 million people, with the total cost related to this mortality being USD 1000 million in Pakistan [5]. Pakistan is ranked in the top 10 countries of the world in having the highest concentration of particulate matter, PM2.5, with an annual mean of 44.21 µg/m3, which is far higher than the recommended value of 10 µg/m3 by the WHO [6,7].
Lahore, Pakistan, once called “The City of Gardens” is seeing its worst environmental catastrophe in the form of smog [8]. The average PM2.5 concentration in Lahore in 2010 was 121.8 µg/m3, and the value has increased with each passing year [9,10]. In 2020, Lahore was ranked as the 18th most polluted city in the world, and the second most polluted mega-city, based on PM2.5 [11,12]. Dealing with climate issues is now an unavoidable reality for Pakistan. Data of the source appointment of PM2.5 for Lahore were only available until 2010, which suggested that vehicles (diesel, 28%, plus petrol, 8%) account for 36% of PM2.5. Secondary PM in the forms of biomass burning, coal combustion, and industrial emissions, are accountable for 30%, 15%, 13%, and 6%, respectively [13,14]. Work on the resource allocation of the highest contributing economic activity/emission sources must be studied to help policymakers identify impactful laws and create legislation.
The goal of this study is to understand the association between emission sources and their significant pollutants including carbon monoxide (CO), nitrogen dioxide (NO2), sulphur dioxide (SO2), aerosol optical depth (AOD), methane (CH4), and formaldehyde (HCHO). To achieve this, various sites were selected with a range of economic activities. Field surveys were performed to observe current practices at the selected sites. A correlation between maximum AQI in a month to the total concentration of each pollutant, was established. The aim of the work was to determine how remote sensing can be utilized for low-cost surveillance in high activity industrial zones and congested traffic sites. From our work, it is envisaged that a smart analytic tool in the form of digital application can be developed. It will identify significant pollutant emitting at a site and its relevant remedial action. To the best of our knowledge, no such study has yet been conducted in Pakistan involving sectoral emissions to help develop emission-specific mitigation strategies. The same tool can be adopted for other mega-cities facing this pandemic. The top pollutant contributor within each economic activity was identified to determine pollution hotspots. Our study is novel in providing a comparison of remote sensing data with on-ground attributes of activities, which can provide the basis for adaptation action plans to combat smog. This study presents the first remote-sensing-based characterization of air pollution from three different sources including main roads, brick kilns, and industrial estates in Lahore. The weekly trend of AQI was observed to determine the variation between weekdays and weekends. The results presented here are therefore timely, and will not only contribute to understanding the environmental dynamics in the city, but also to measuring and controlling their adverse impacts.

2. Literature Review

Various models have been developed to determine the relation between PM2.5 and AOD [15,16]. AOD-based estimation is hindered by clouds, snow cover or high concentration of air pollution [17], as air pollutants, themselves, are indicators of AQI [18,19]. Regression analysis showed a positive correlation between PM2.5 and CO, and NO2, and SO2 concentration, and a negative correlation with O3, for the period of 2007 to 2011. The study also showed that PM2.5 was 4% higher on weekends compared with weekdays [20]. The positive correlation studied in [20] by regression analysis of five-year data from 2007 to 2011 was verified in this work using remote sensing data and the spatial concentration of these pollutants from June 2018 to April 2021.
Emissions from fossil fuel-based thermal power plants, industries, and tremendously growing traffic, has deteriorated the environment of Pakistan, especially the metropolitan cities [17,21,22]. The health and economic effects of indoor and outdoor ambient air conditions have already been studied [3,4,5,6]. Vehicular emission plays a vital role in smog in Pakistan mainly due to the lack of use of emission control devices. The number of vehicles in Pakistan increased from 2 million to 10.6 million within 20 years, i.e., an 80% increase, which reduced to 66% from 2006 to 2015, due to saturation [23,24].
Many independent studies have been performed globally, to determine the maximum pollution contributing site, or primary cause of pollution [25]. Similar studies have highlighted the relationship between the maximum pollution-contributing site in the mega-cities of Pakistan, including Karachi, Lahore and Islamabad [26,27,28,29]. Independent studies on the impact of traffic on CO emissions have been studied, and their relevancy to mass transit vehicles and mass transit systems have been explored [30]. Similarly, the emission levels of various vehicles and their correlation with other factors such as the number of vehicles, speed, and type of fuel, have also been studied [24]. Previous investigations have shown that air quality is directly related to weather conditions, and the corresponding activities of sites [31,32]. Only one author has discussed the emission source as the prime contributor of PM2.5 for two sites [13].

3. Materials and Methods

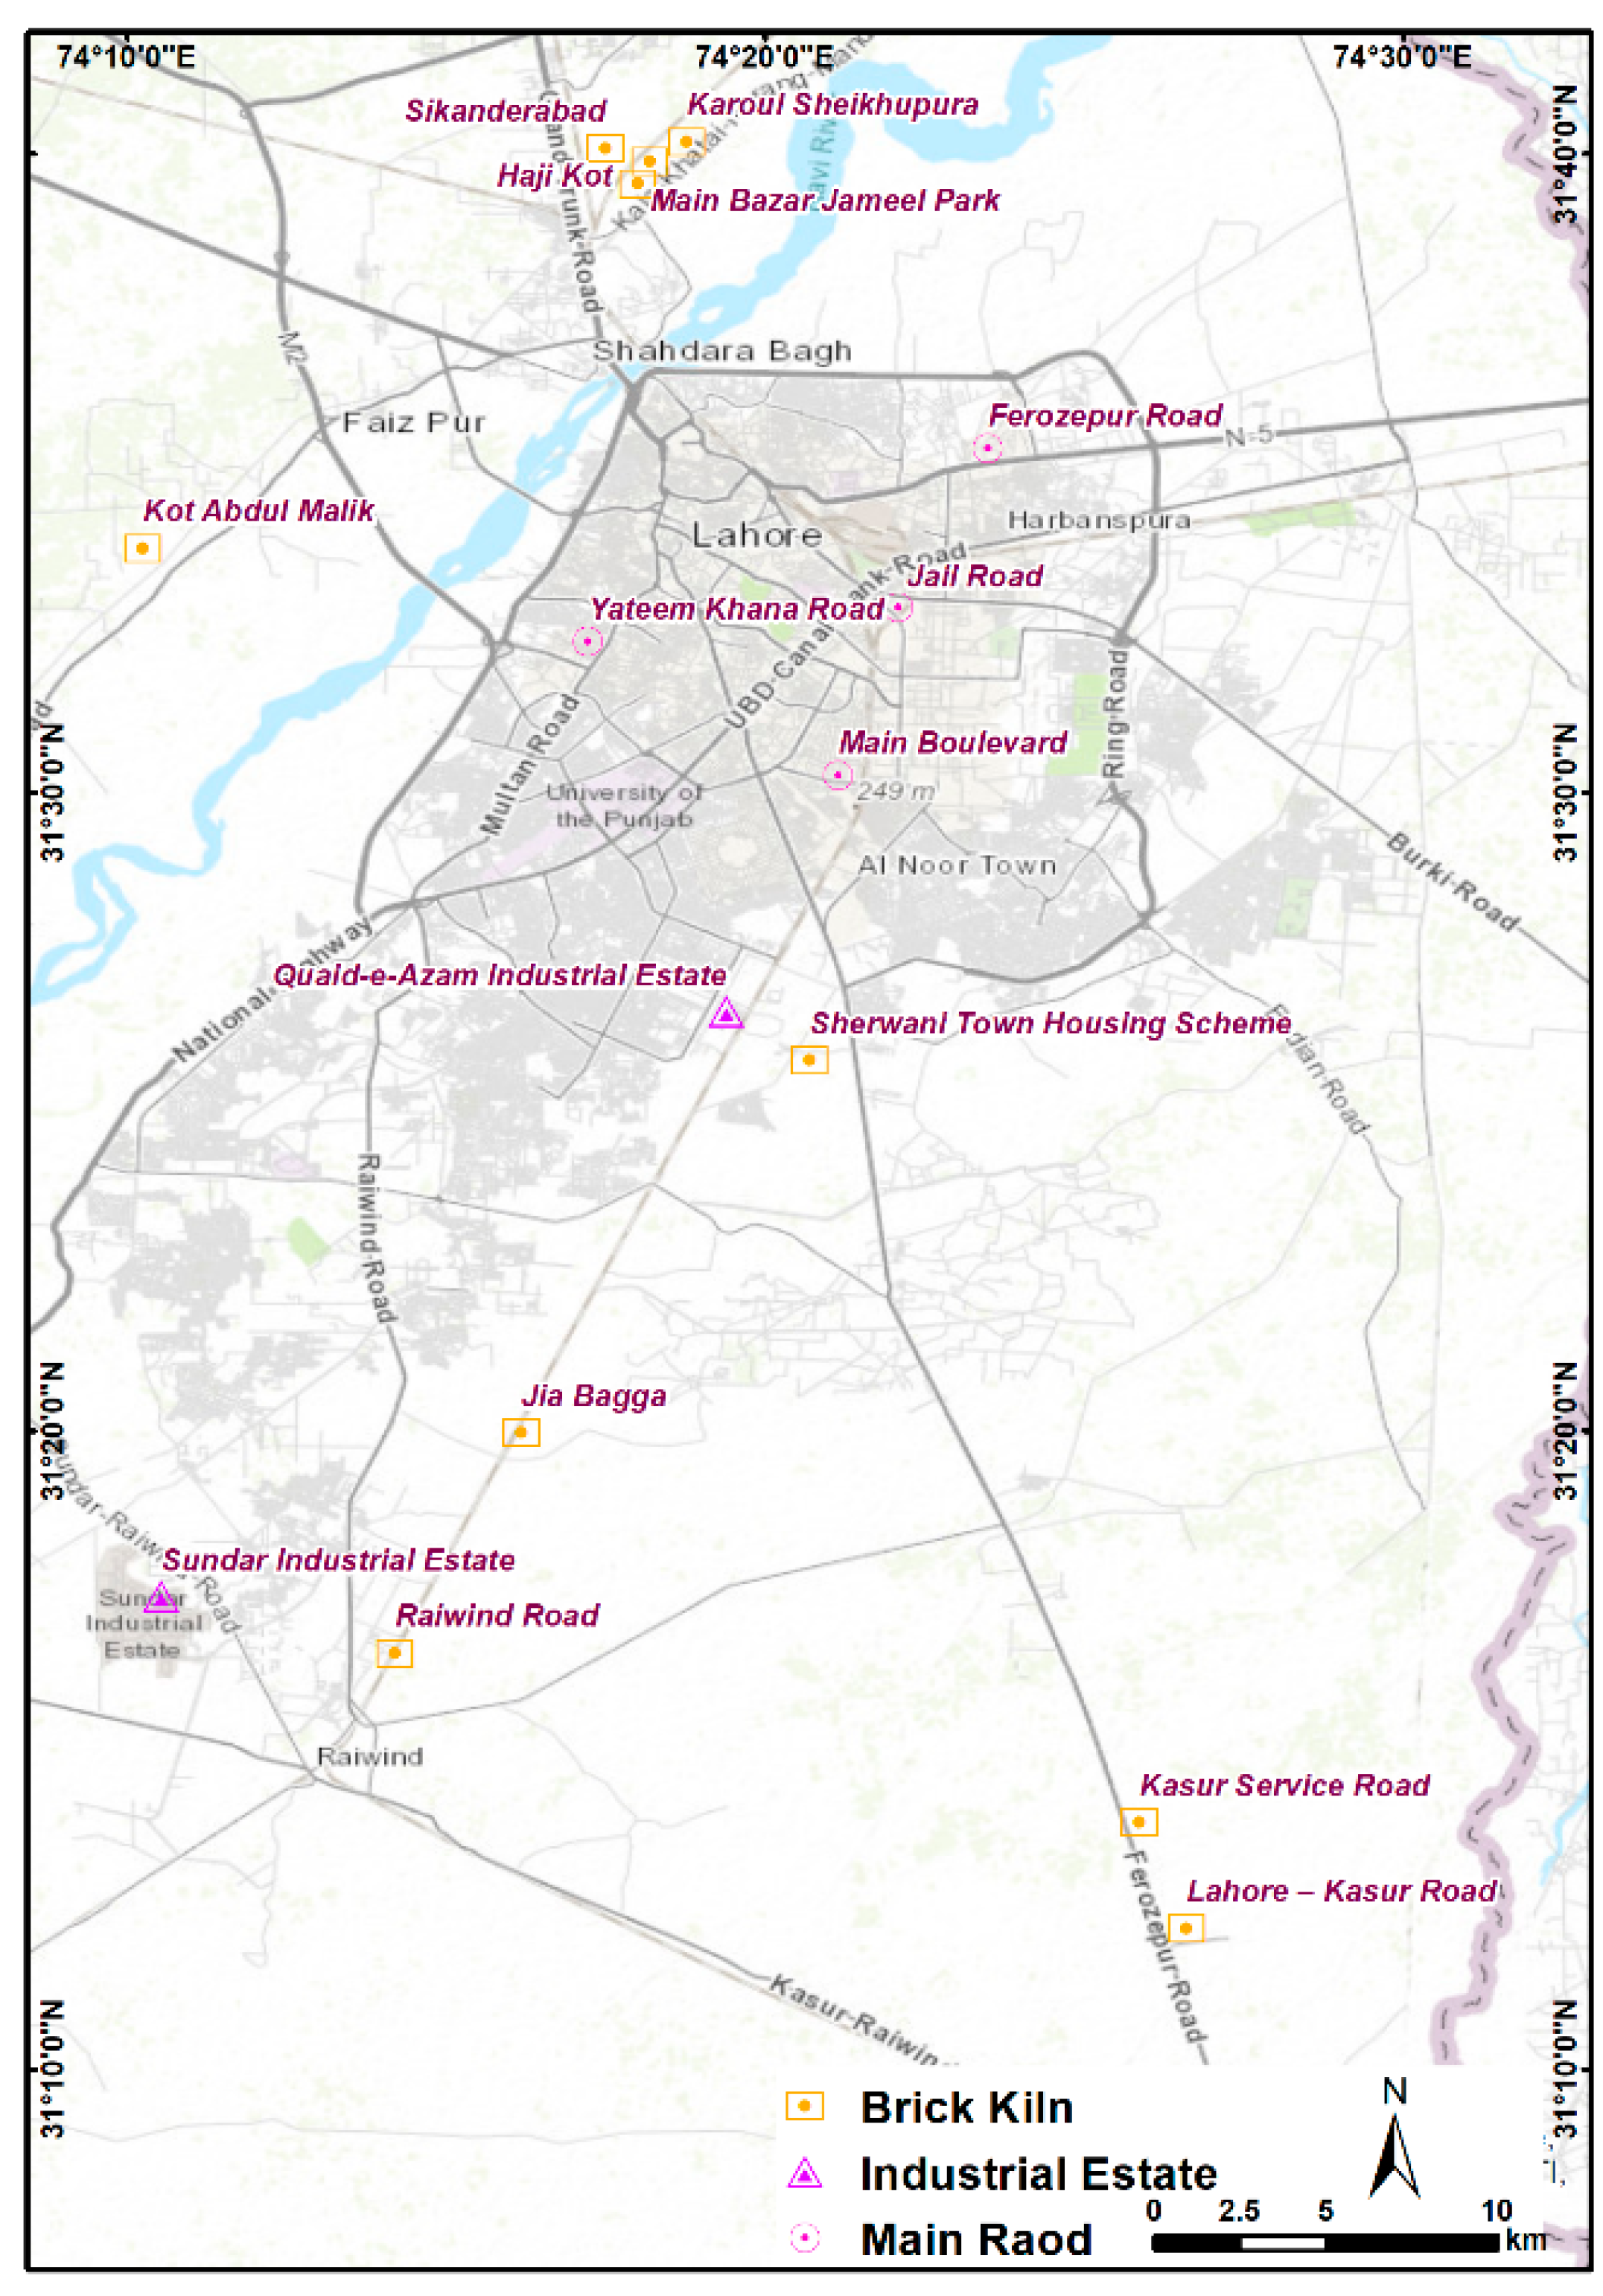
3.1. Description of Study Area and Field Surveys of Selected Sites

The study area comprised the Lahore district. The total area of the district is ~1772 km2 and is located between 31°15′0″ N to 31°45′0″ N, and 74°01′0″ E to 74°39′0″ E, in the Punjab province of Pakistan (Figure 1).
With a total population of 1.12 million [33], Lahore is ranked 26th among the most densely populated cities in the world [34]. The total population of Lahore has almost doubled since 1998, increasing from 6.31 million in 1998 to 11.13 million in 2017 [35], with a current population density of 6300 persons per km2 [35]. Lahore’s climate features a hot, wet summer (May–September), and a cool, dry winter (November–February). The mean annual rainfall is 2398 mm, but 80% of this amount falls between May and September, and the mean annual temperature is 23.3 °C.
Tailpipe emissions, brick kilns and industry are among the major air pollution contributors in the city [13]. Two industrial estates (Quaid-e-Azam Industrial Estate and Sundar Industrial Estate), four heavily trafficked roads (Ferozpur Road, Jail Road, Yateem Khana, and Main Boulevard) [24], and eight brick kilns were selected as the study sites (Figure 1). These sites represent a broad distribution in their locations, and cover almost the entirety of Lahore, as shown in Figure 1. A consecutive 10 day visit to different industrial estates and selected brick kilns was conducted at the end of August 2020, to observe current practices such as type of fuel used, compliance with International Standard Organization (ISO) standards regarding emission control, and technology used. Previous research on the number of vehicles on the selected roads was used [24]. The data obtained are summarized in Table 1.

3.2. Remote Sensing Data

To explore the associated environmental impacts and suggest a relevant adaptation action plan for a particular region, the satellite observational monthly data for nitrogen dioxide (NO2), carbon monoxide (CO), sulphur dioxide (SO2), formaldehyde (HCHO), methane (CH4), and aerosol optical depth (AOD) were acquired from July 2018 to April 2021. These data were obtained and processed using the cloud computing platform of Google Earth Engine (GEE) API [16].
To quantify the concentration of air pollutants associated with the three major economic activities (industry, traffic, and brick kiln), three primary pollutants (NO2, CO, SO2) and two secondary (HCHO, CH4) pollutants were selected [22,36,37]. Air pollution concentration data were obtained from the tropospheric monitoring instrument (TROPOMI) on-board Sentinel 5P [17]. The Level 3 data were produced at a spatial resolution of 0.01 [18]. The product contained high-quality pixels (‘qa_value’ ≥ 0.75), while the poor-quality pixels were removed [10]. Furthermore, pixels with a cloud cover probability of more than 0.2 were removed from all datasets to avoid any misleading results. While meteorological conditions may vary the atmospheric concentration of the pollutants, monthly averaging and long time series may help to avoid severe bias from meteorological conditions. However, the influence of weather conditions was considered to be minimum when comparing sites in nearby locations. AOD provided a wide range of spatial information with near-daily global coverage at 0.01 spatial resolution [19]. A Level 2 product, MCD19A2-V6, of AOD at 550 nm was derived from the moderate resolution imaging spectroradiometer (MODIS). The product was derived by combining terra and aqua data using the multi-angle implementation of atmospheric correction (MAIAC) [20]. The quality tags layer “AOD_QA” was used to retain good quality pixels, while pixels labelled as ‘Possibly Cloudy’, ‘Cloudy’, and ‘Cloud Shadow’ were removed using the “Cloud” mask. All datasets were acquired by taking the average of the pixels acquired over the selected sites.

3.3. Lahore Air Quality Evaluation

AQI data (June 2019–September 2021) were explored for their correlation with the WHO guidelines. For this, real-time AQI values were taken from the Pakistan Air Quality Monitor—U.S. EPA World Air Quality Index Project (31.559989968731156, 74.33600917621109) [10]. Graphical Astronomy and Image Analysis (GAIA) air quality monitoring sensors were used. To achieve meaningful results, the data were correlated with WHO recommendations to determine the fitness of air quality for a human being.

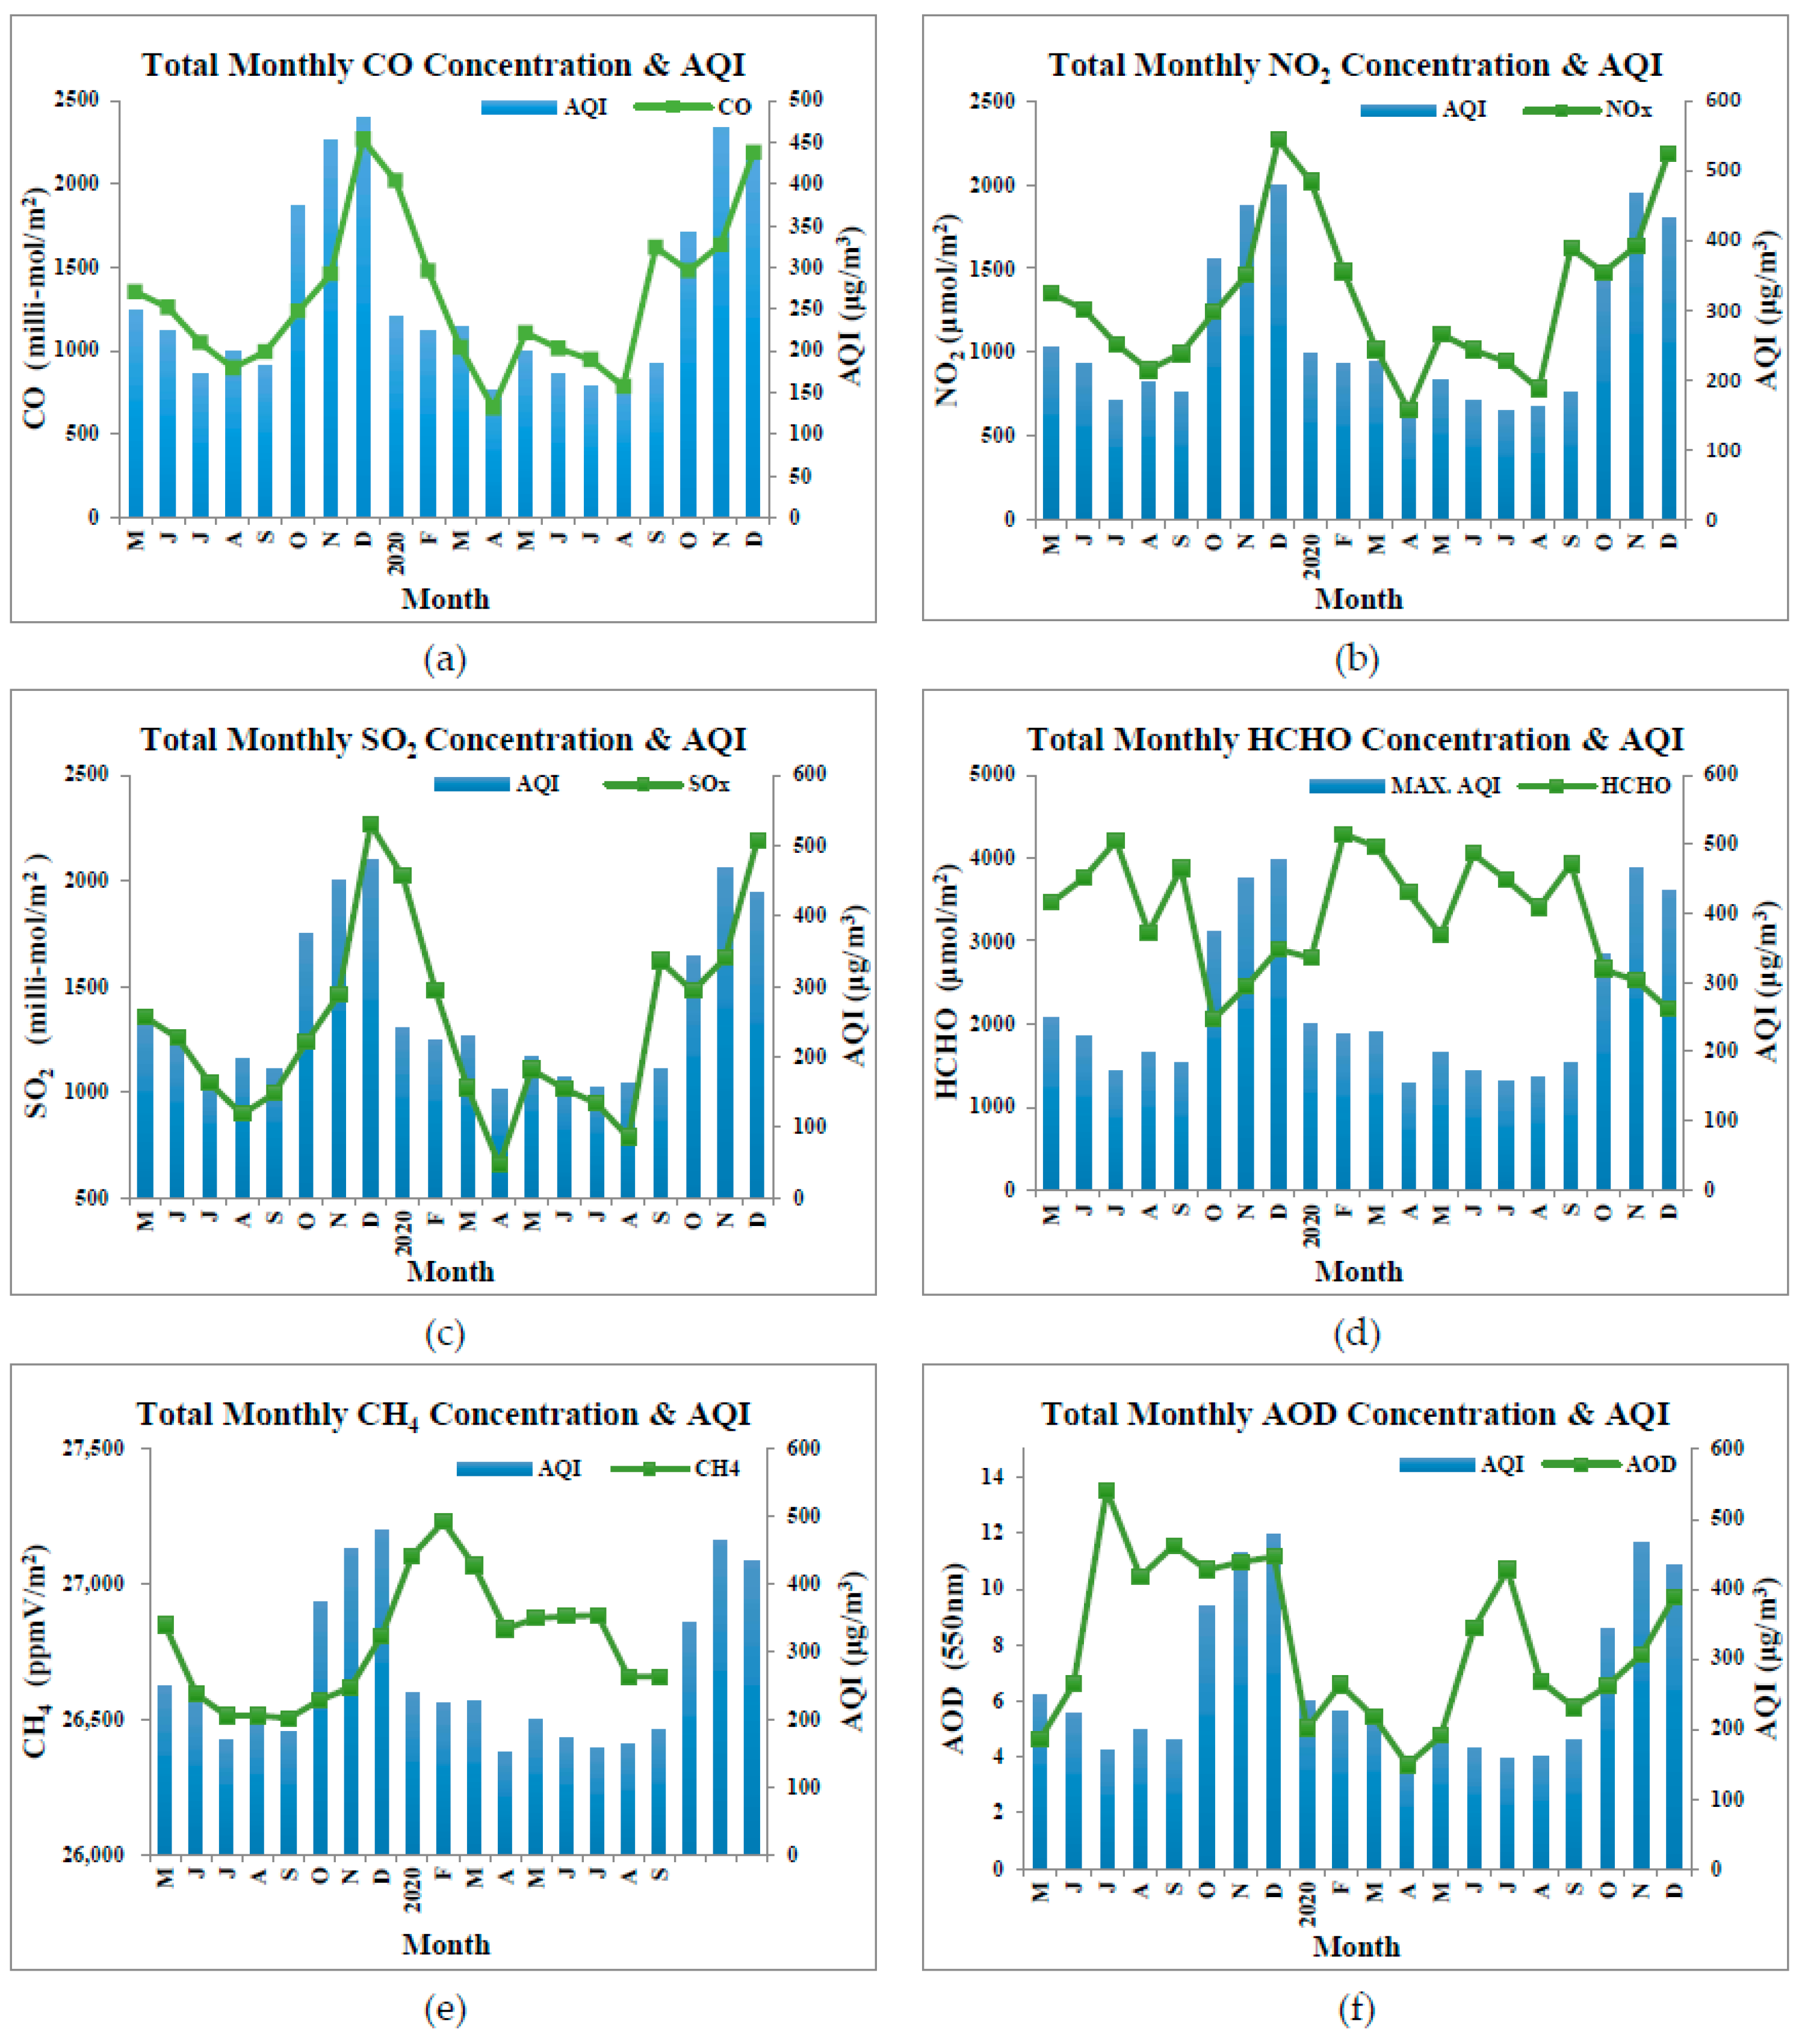
3.4. AQI Relevance with Pollutants Spatial Data

To determine the relationship between the effects of change in the overall concentration of each pollutant with the respective AQI value in Lahore, the sum of the concentration of monthly peak values of all sites for each pollutant was plotted against the monthly maximum AQI values. This was undertaken to help ensure remote sensing data relevancy with AQI results, in order to determine whether we could use spatial pollutant concentrations in addition to AOD results, as a valid indicator of AQI. It will also assist in determining which of the smog-causing principal pollutants, to focus action plans on.
The COVID-19 pandemic emerged in February 2020 and the subsequent lockdown was also implemented, to some extent, on transportation activities and industrial activities over multiple phases. A nation-wide lockdown was implemented in Pakistan from 25 March to 15 April 2020, which was gradually reduced by 15 May 2020. In early May, smart lockdowns started to be implemented in hotspot areas [22]. The reduction in emissions of this study is based on previous studies. An assumption about the overall composition of the pollutants has been made.

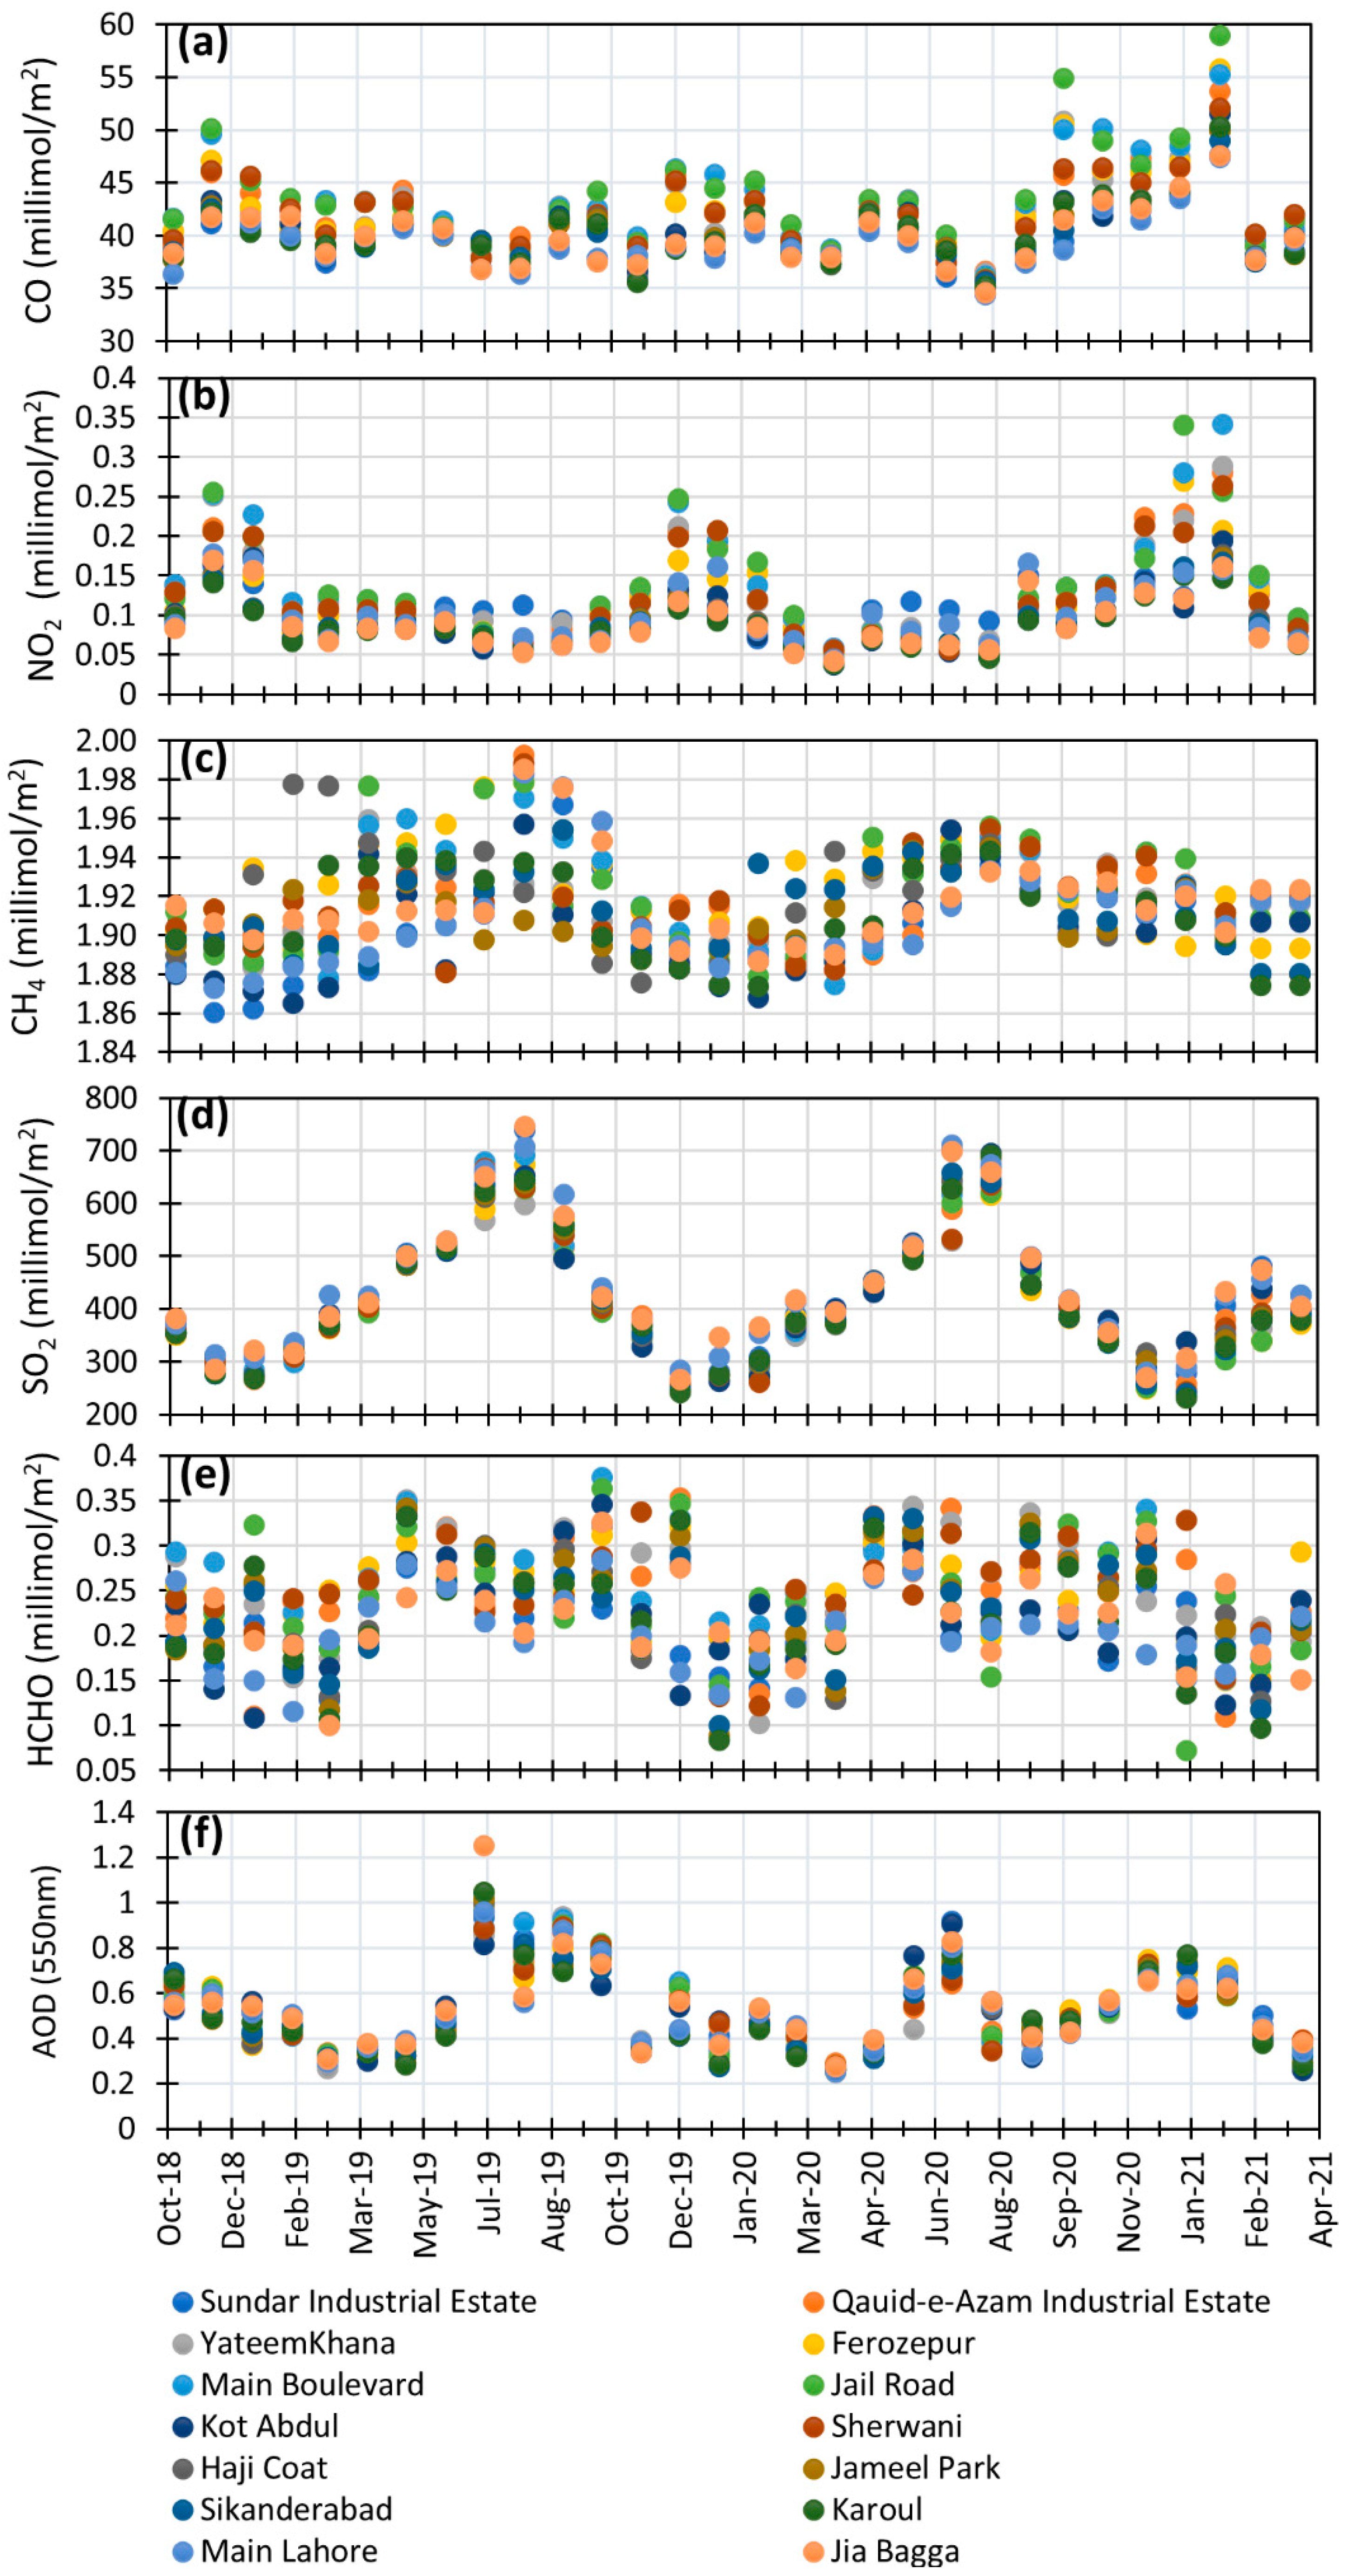
3.5. Site-Specific Pollutants’ Concentertaion

To determine the contribution of each site to the overall Lahore air globe, the sum of the concentration of each pollutant for the entire data period at each site was determined. The quantity was converted into a percentage to discover the prominent responsible emission source. This is intended to serve as a tool to determine which pollutant should be considered as the main concern at a particular site when future policies and laws/legislation are being developed. The results can also be converted into a handy tool or digital application for regular surveillance of sites, to take the action against top pollutant-contributing sites.

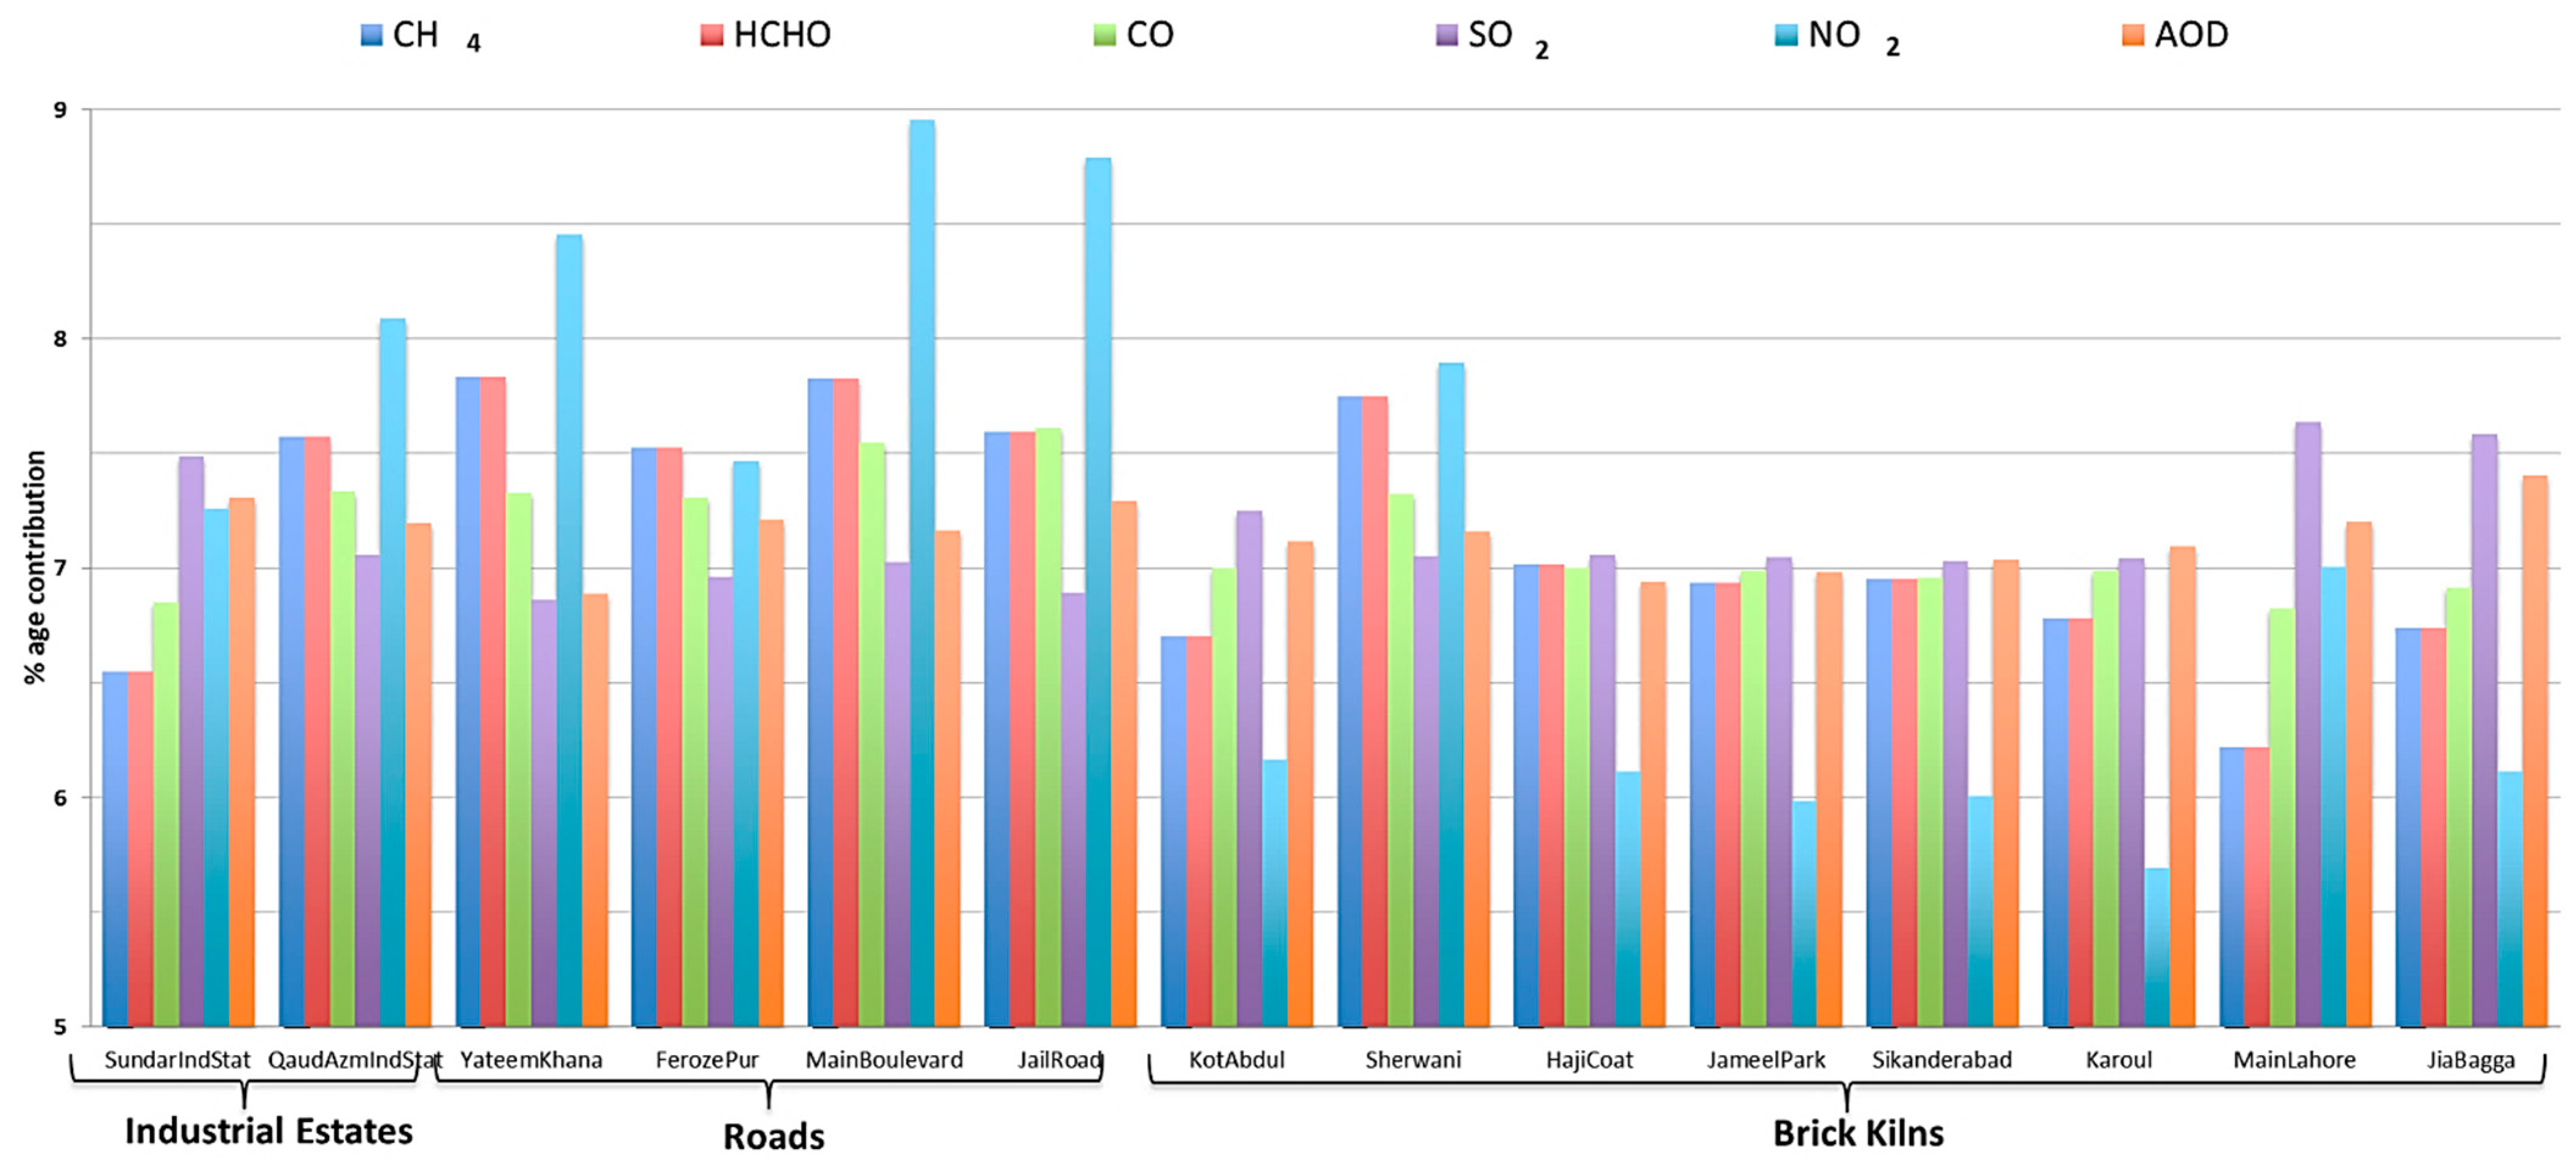
3.6. Identification of Major Contributing Economic Activity within Emission Sources

The fourteen sites were subdivided into three sets based on emission source explained in Table 1 and the percentage of times the specific site most prominently contributed to each economic activity, and the results were determined and plotted as a pie chart. The results not only determined the major contributor but correlated the current practices and on-ground observations of similar economic activities with the concentration of each pollutant. This may also help to suggest, in the future, relevant mitigation techniques and to prioritize their area of focus.

3.7. Correlation with On-Ground Sources and Policy Guidelines

To determine the main sources of pollution at the pollutant’s hotspots and major contributing sites, a literature survey was performed. The on-ground realities were compared with previously published results and the results of this study. This suggested a focus towards which practices should be adopted and which should be avoided. This will also suggest alternative approaches and relevant mitigation techniques to policymakers.

3.8. Examining the Weekly Trend of AQI

The AQI at the Lahore U.S. Embassy (31.559989968731156, 74.33600917621109) is located in the business hub of Lahore. All main roads pass by there, and the traffic shows a drop on weekends compared with weekdays. The change in AQI value during weekdays and weekends will give fruitful insights into the dependency of AQI on vehicular emissions. The everyday AQI was plotted against weekend AQI values, highlighting when peaks occurred most (June 2019–April 2021). Similarly, an average value for weekdays compared with weekends is also plotted.

4. Results

4.1. Primary Results through Remote Sensing

The sites’ spatial data provided the peak values of every month for a period of two and a half years (June 2018–April 2021). These primary spatial data, as shown in Figure 2, are key to further research and will serve as a basis for multiple conclusions. The data showed the average concentration of each pollutant during the selected time. These results also highlight the location responsible for the highest contributor of each pollutant in the air globe of Lahore.
The average CO concentration of all sites in the data set was 41.1 millimol/m2. The maximum value was for Jail Road (58.982 millimol/m2), and the minimum was at Jia Bagga (34.57 millimol/m2). NO2 average accumulation was 0.1010 millimol/m2, with the maximum value of 0.255 millimol/m2 obtained from Jail Road, and the minimum value of 0.037 millimol/m2 from Kot Abdul. The SO2 concentration on average in Lahore was 0.428 millimol/m2. The maximum value obtained was 0.747 millimol/m2 at Jia Bagga, and the minimum was 0.232 millimol/m2 at Karol. The CH4 average value was 1.914 millimol/m2, the maximum was 1.993 millimol/m2 in Quaid-e-Azam Industrial Estate, and the minimum was 1.860 millimol/m2 in Sundar Industrial Estate. The HCHO on average was 0.236 millimol/m2. The maximum value was obtained from Main Boulevard at 0.376 millimol/m2, and the minimum from Jail Road at 0.079 millimol/m2. The average AOD value in Lahore was 0.54 (550 nm) or 0.98 µm. The maximum value was 2.27 µm from Jia Bagga, and the minimum was 0.46 µm. According to the U.S. EPA standard, the safe range for AOD is 0.1 µm–0.4 µm [36]. The ambient air of Lahore did not meet this standard, not for a single time, at any location. The maximum value was 5.6 times higher than the upper limit of the safe range. This calls for deep interpretation of this data for practical and immediate adaptation action plans.

4.2. Prevailing Condition of Air Quality and Its Effect on Human Life

The average AQI in Lahore in 2010 was 121.8 µg/m3 which increased to approximately 175 µg/m3 in 2021 [9]. For 88.4% of the year, the air quality index (AQI) values of Lahore remained greater than 100, which is stated as unhealthy for sensitive groups (children, elderly, and patients) by the WHO, while it remained ”Unhealthy for everyone” for 54%, and “Very Unhealthy” for 26% of the year. In the last 3 years (2019–2021), it was “good” for 12 days and “moderate” for only 104 days. These results are summarized in Table 2 with the WHO recommendations. Several factors such as the use of fossil fuels, industrial practices, and noncompliance with environmental standards are responsible for the contribution of hazardous pollutants. These pollutants cause damage in multiple ways, based on exposure in both the short and long duration, which in return puts pressure on the infrastructure and the economy [37].

4.3. Characterization of Lahore Pollution

In Figure 3, it can be seen that there was a drastic increase in the AQI value from an average of 175 µg/m3, reaching a maximum of 478 µg/m3 and 466 µg/m3 in 2019 and 2020, respectively, during the smog season (October to December, every year). The variation in CO, SO2, and NO2 primary pollutant concentrations coincided considerably with the respective AQI plot.
It can be observed that when the AQI value began to increase, the accumulation of primary pollutants showed lower values, compared with AQI values. On the contrary, when AQI values started to decrease, the actual accumulation of pollutants did not fall very fast. This showed that the AQI value calculation method must be improved, if not changed, to accommodate this difference. Neither HCHO, CH4, nor any secondary pollutant had a similar impact on AQI values. Conversely, although AOD values were higher during the smog season than the rest of the year, they were maximum during the monsoon season when AQI values were comparatively low [3].
Emission reduction due the implementation of the lockdown has been documented by several studies. Three comprehensive assessments of impacts of COVID-19-induced lockdowns on pollutant concentrations have been published [10,38,39]. The studies observed an average of 37% reduction in NO2 in mega-city centers, and an average of 25% decline in AOD concentration for industrial sectors. In Lahore, a 43% decline in the NO2 concentration was observed. However, the aim of this study was to characterize the pollutants in the three sectors, and we assumed that the reduction in the emission did not change the overall composition of the pollutants emitted from the sites.

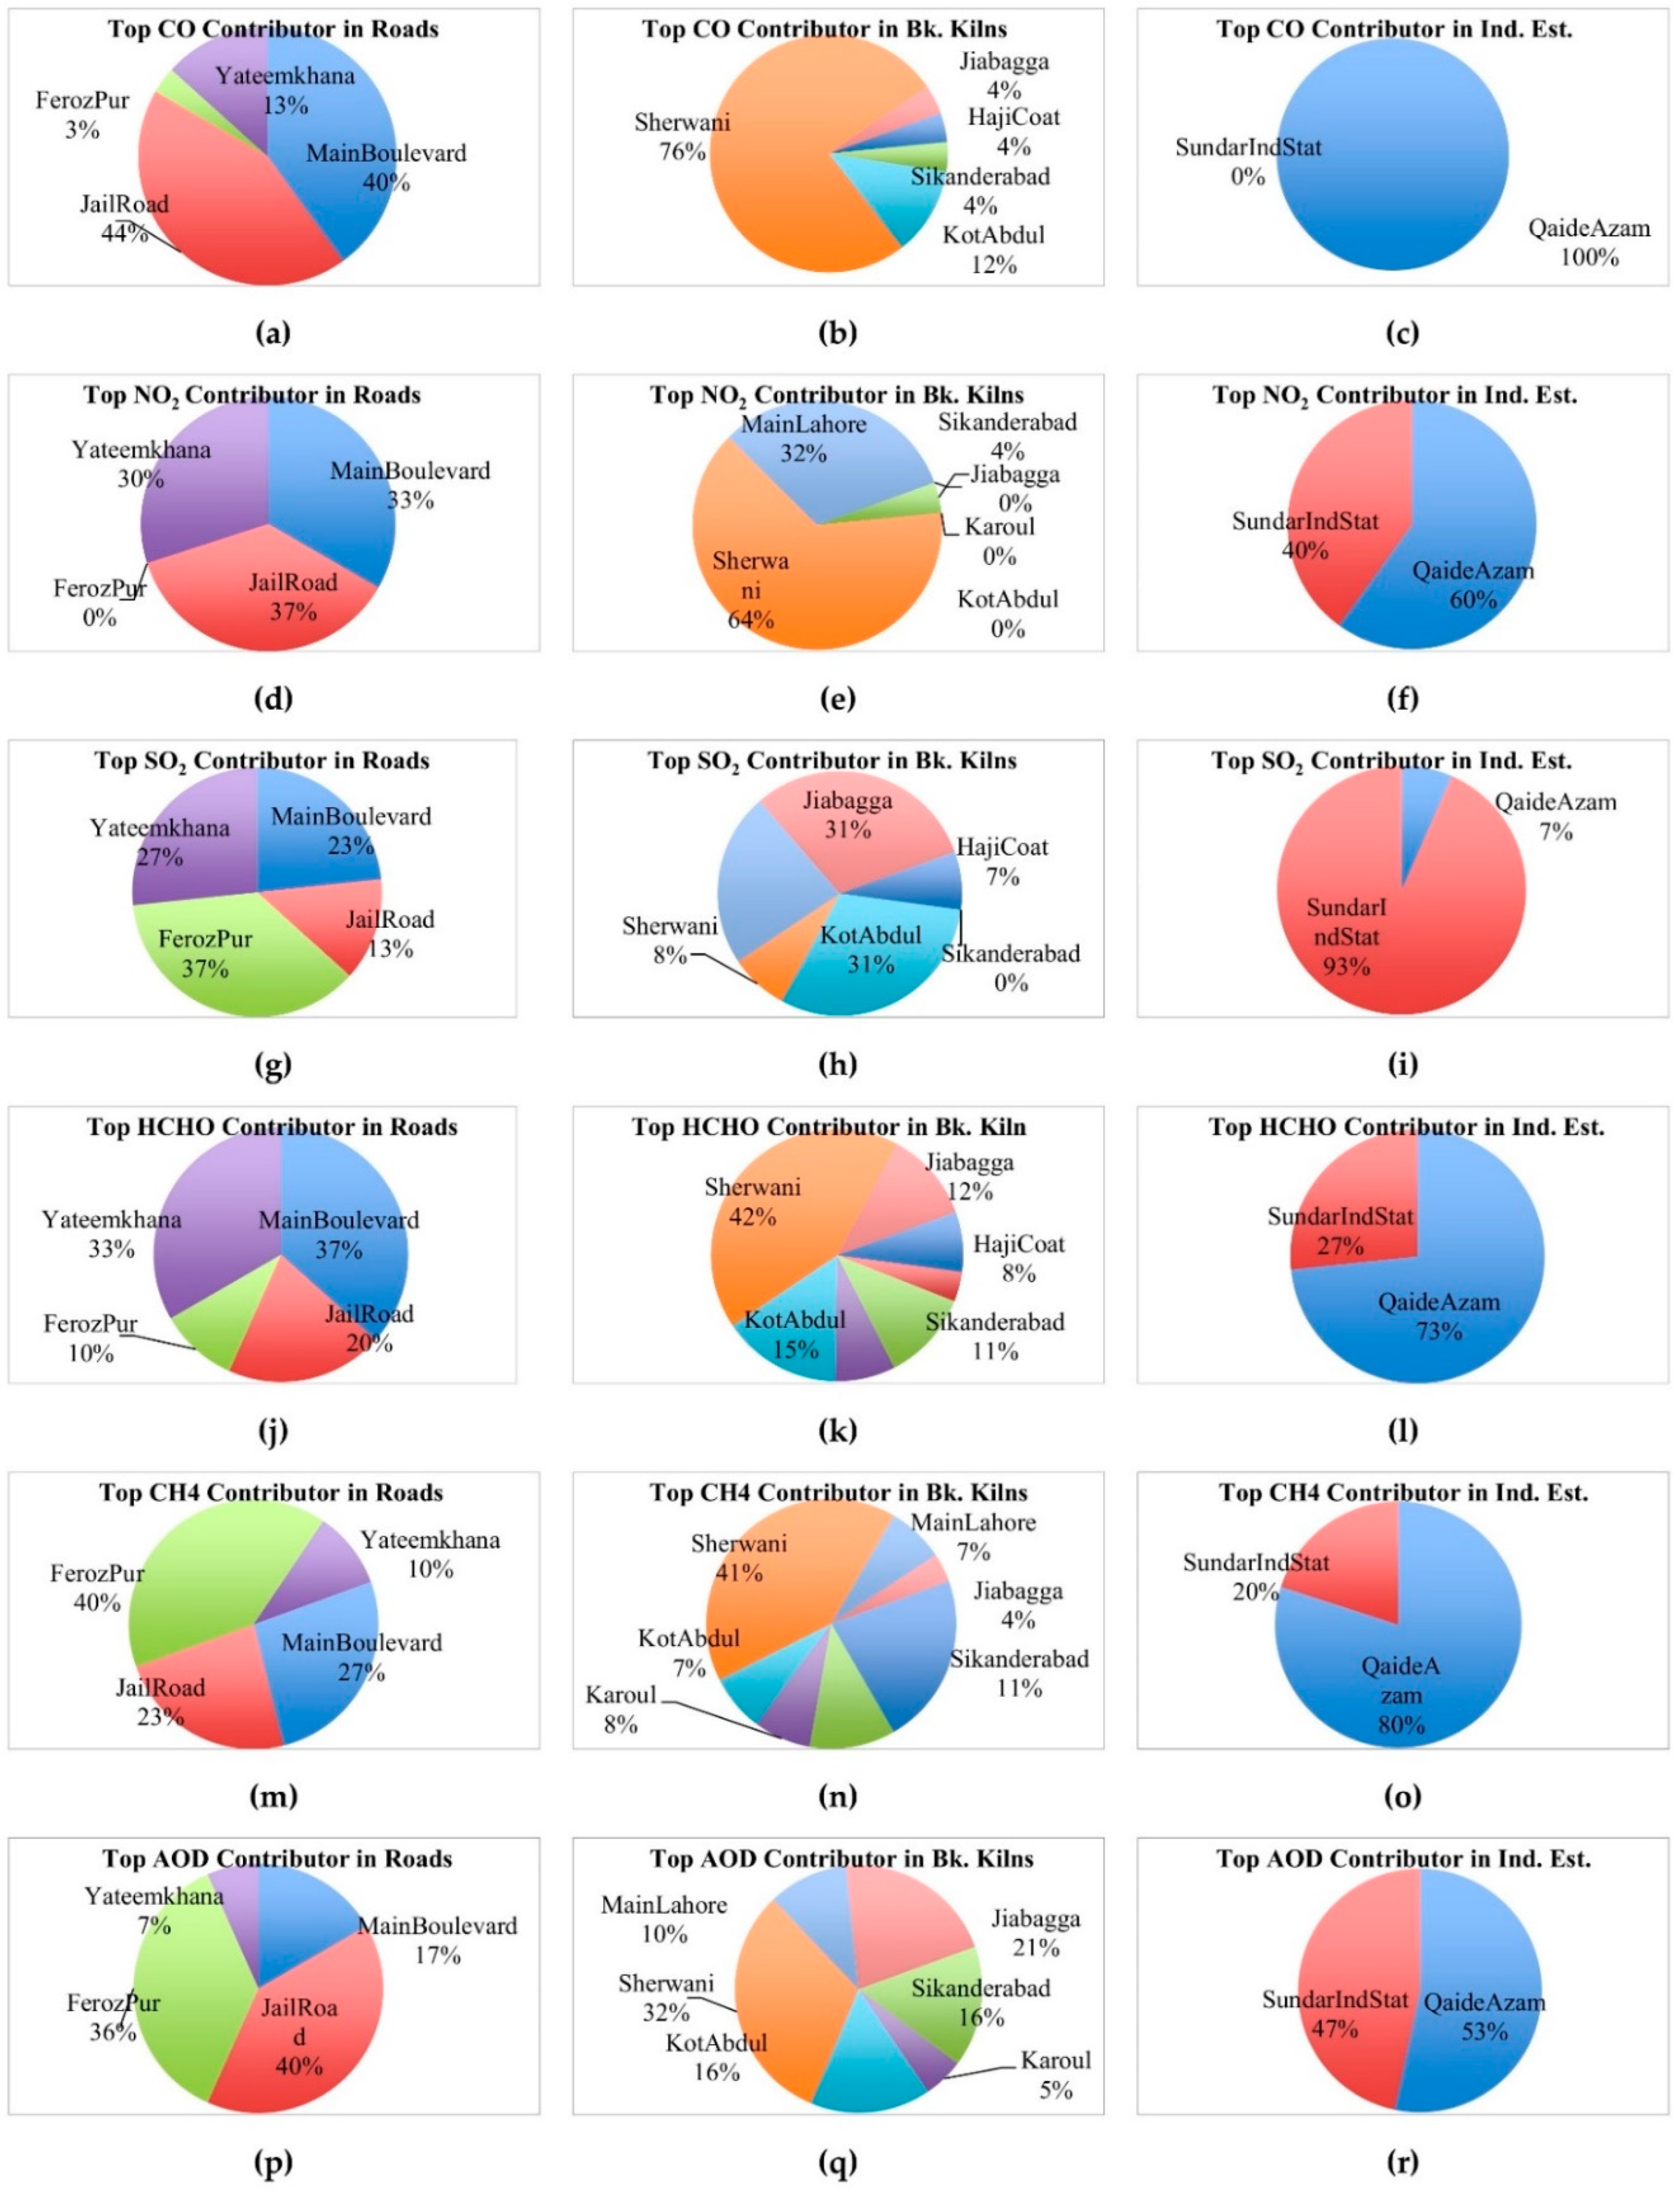
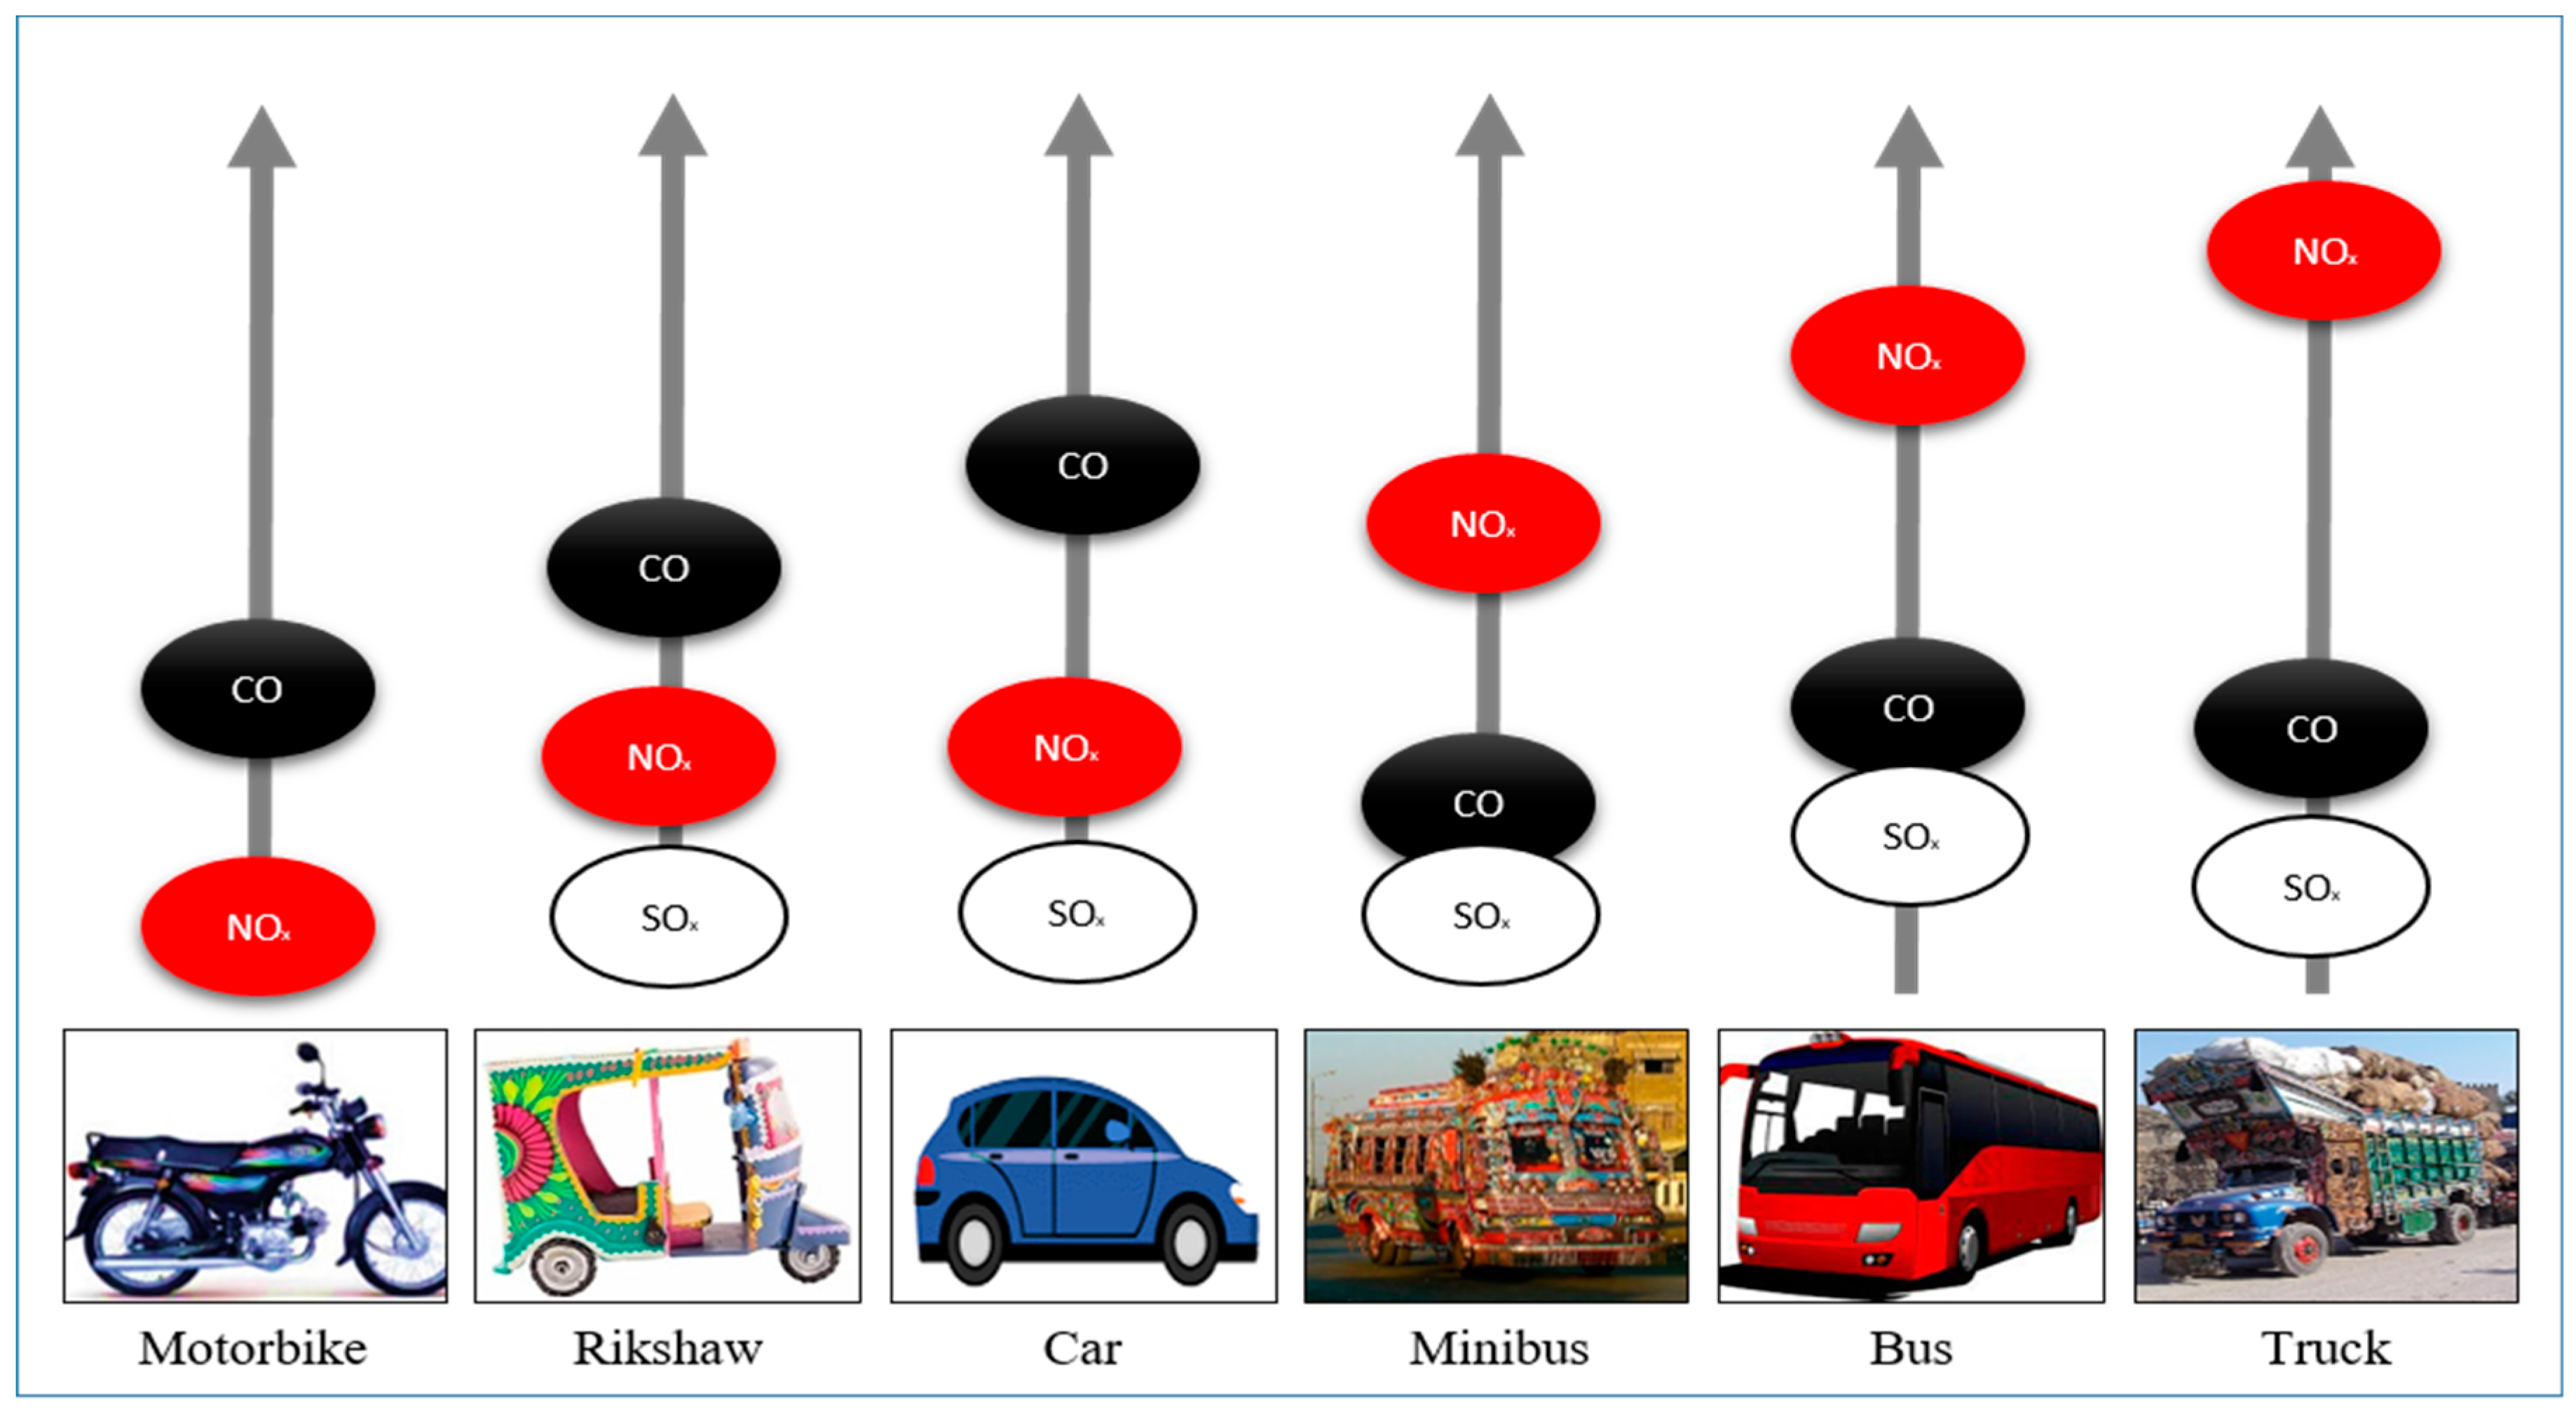
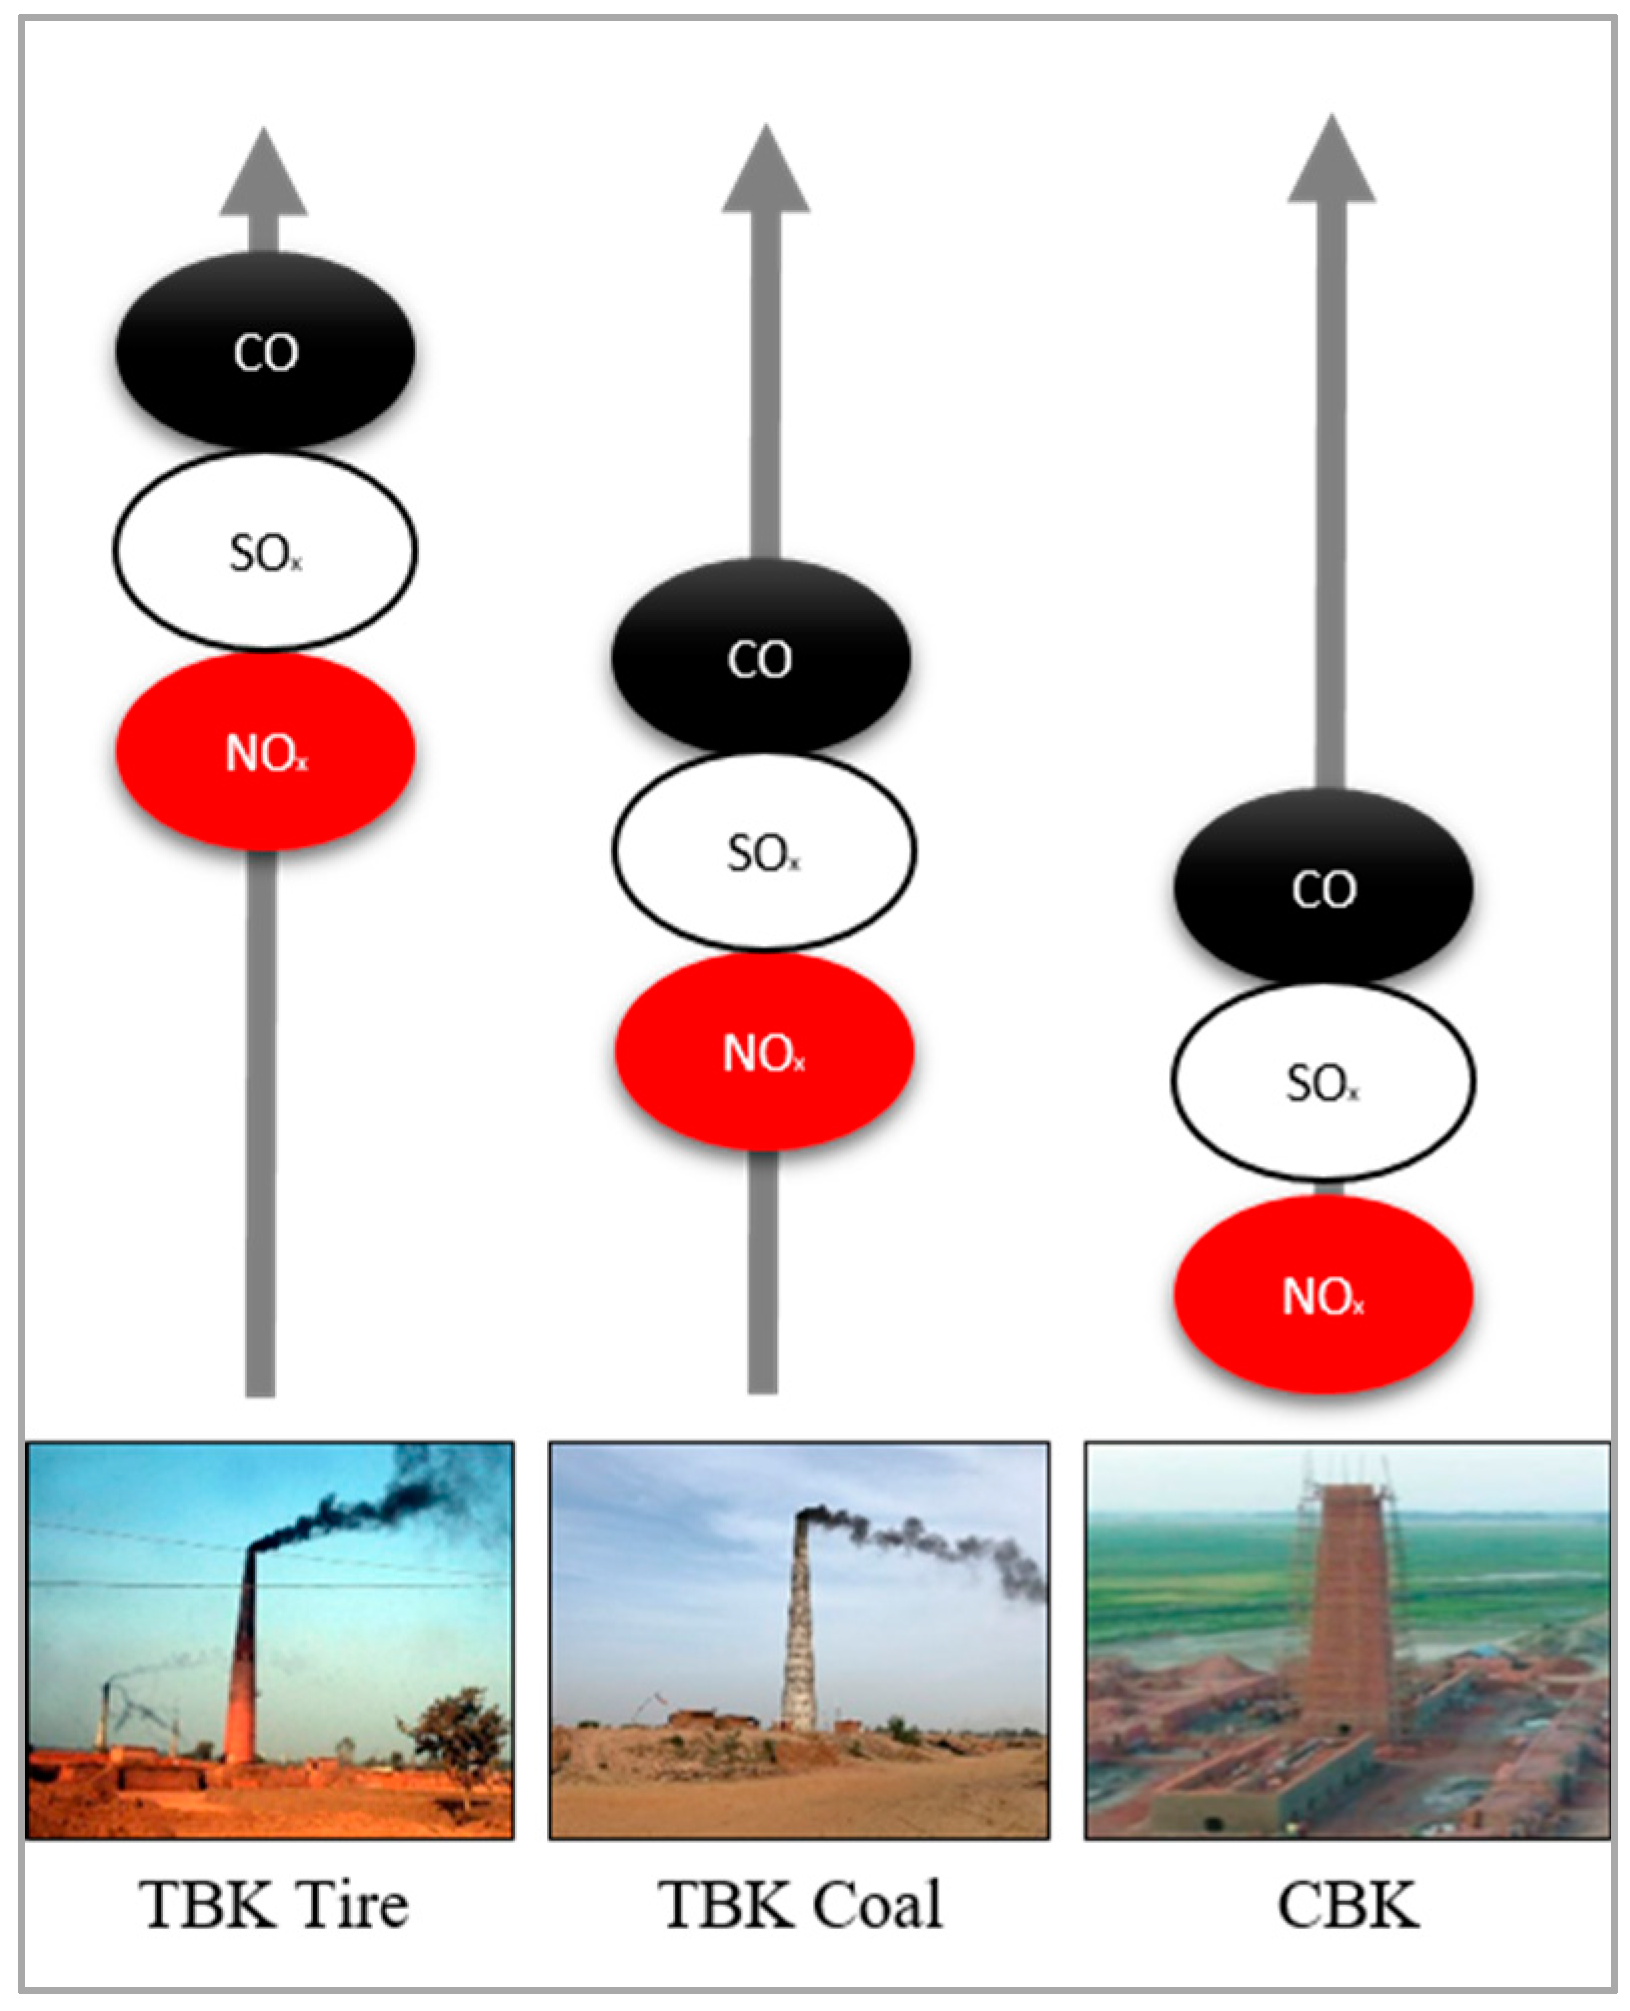
4.4. Locating Major Contributors of Pollutants

The annual maximum of pollutants in different economic activities were determined, and are plotted in Figure 4. The result was an indication of the highest pollutant of each site, which demands an immediate remedial action plan. With the help of on-ground data, the cause of its high concentration can be discussed, enabling guidance toward needed policy decisions. The highest contributors of CO were Jail Road (within roads), Sherwani (within brick kilns), and Quaid-e-Azam Industrial Estate (within industrial estates). Therefore, in the future, when mitigation is adopted or surveillance must be conducted, CO filters must be used in these locations. Ferozpur was the cleanest in terms of NO2 contribution; all other sites had equally high contributions compared with other activities. Similarly, on average, the CO contribution of brick kilns was low, and the Quaid-e-Azam Industrial Estate was high. As Sherwani is near Quaid-e-Azam Industrial Estate, the area was more polluted. Ferozepur was highest in SO2 contribution, although was not contributing as much to CO and NO2 contribution. Jia Bagga and Kot Abdul were the top contributors of SO2 within brick kilns. Sundar Industrial Estate contributed most to SO2 emissions although the various industries operating there were ISO 14001 certified.

4.5. Surveillance of Major Pollutant Hotspot

The top pollution hotspots were identified through the percentage contribution of each pollutant at all fourteen sites are plotted in Figure 5.
The CO, SO2, NO2, HCHO, and CH4 pollutants showed variation at different sites. The top contributor of NO2 was roads, except that Ferozpur was followed by Quaid-e-Azam Industrial Estate and its nearest brick kiln, Sherwani. Similarly, roads were the top contributors of CO, followed by Quaid-e-Azam Industrial Estate. SO2 should be the main concern at Sundar Industrial Estate and a few brick kilns, such as Main Lahore and Jia Bagga. Unauthorized fuel usage could be an issue here. Formaldehyde should be the main concern at Yateemkhana (Road), Main Boulevard (Road), and Sherwani (Brick Kiln). This result suggests that the type of vehicles (there were high proportions of buses and trucks) on these roads use low-quality fuel. The results suggested that the potential sources of HCHO were mainly roads, followed by the Quaid-e-Azam Industrial Estate. Not all brick kilns were hotspots for HCHO and NO2 concentration, except for Sherwani which is located near Quaid-e-Azam Industrial Estate. The graph shows that to control AQI, an integrated control strategy for multiple pollutants must be adopted. GIS can provide low-cost surveillance at these sites and can recommend fuel optimization or restriction of specific fuel usages, such as tires, etc., to brick kilns, and fuel types for vehicles to particular locations. This graph could be used as a tool to determine which locations require urgent action. It can also be converted into a handy digital application including remote sensing data and a similar graph plot that could be used by authorities and people working on the development of mitigation strategies/devices, so as to know which pollutant to focus on.

4.6. Association of Remote Sensing Observations with Ground Data

After exploring and analyzing remote sensing data, on-ground characteristics, type of vehicle, and type of fuel, a correlation was suggested based on the literature survey [24] in Figure 6. The purpose of suggesting a correlation with pollutants was to develop a key to transform the results obtained from this study into surveillance policies and action. In Pakistan, motorcycles and cars use petrol, rikshaws use liquefied petroleum gas (LPG), and buses and trucks are powered by diesel, generally with little variation. As can be seen from Figure 6, the high CO was the result of faulty rikshaws and cars; similarly, high NO2 was due to trucks and buses. Similarly, in Ferozpur, SO2 was high, suggesting that buses must be restricted to enter the city only partially, or must be checked for maintenance. The brick kilns, which were high contributors of SO2, must be converted to a better technology, such as contemporary brick kilns. The comparative pollution contribution of different type of brick kilns have been explained in Figure 7 [40].

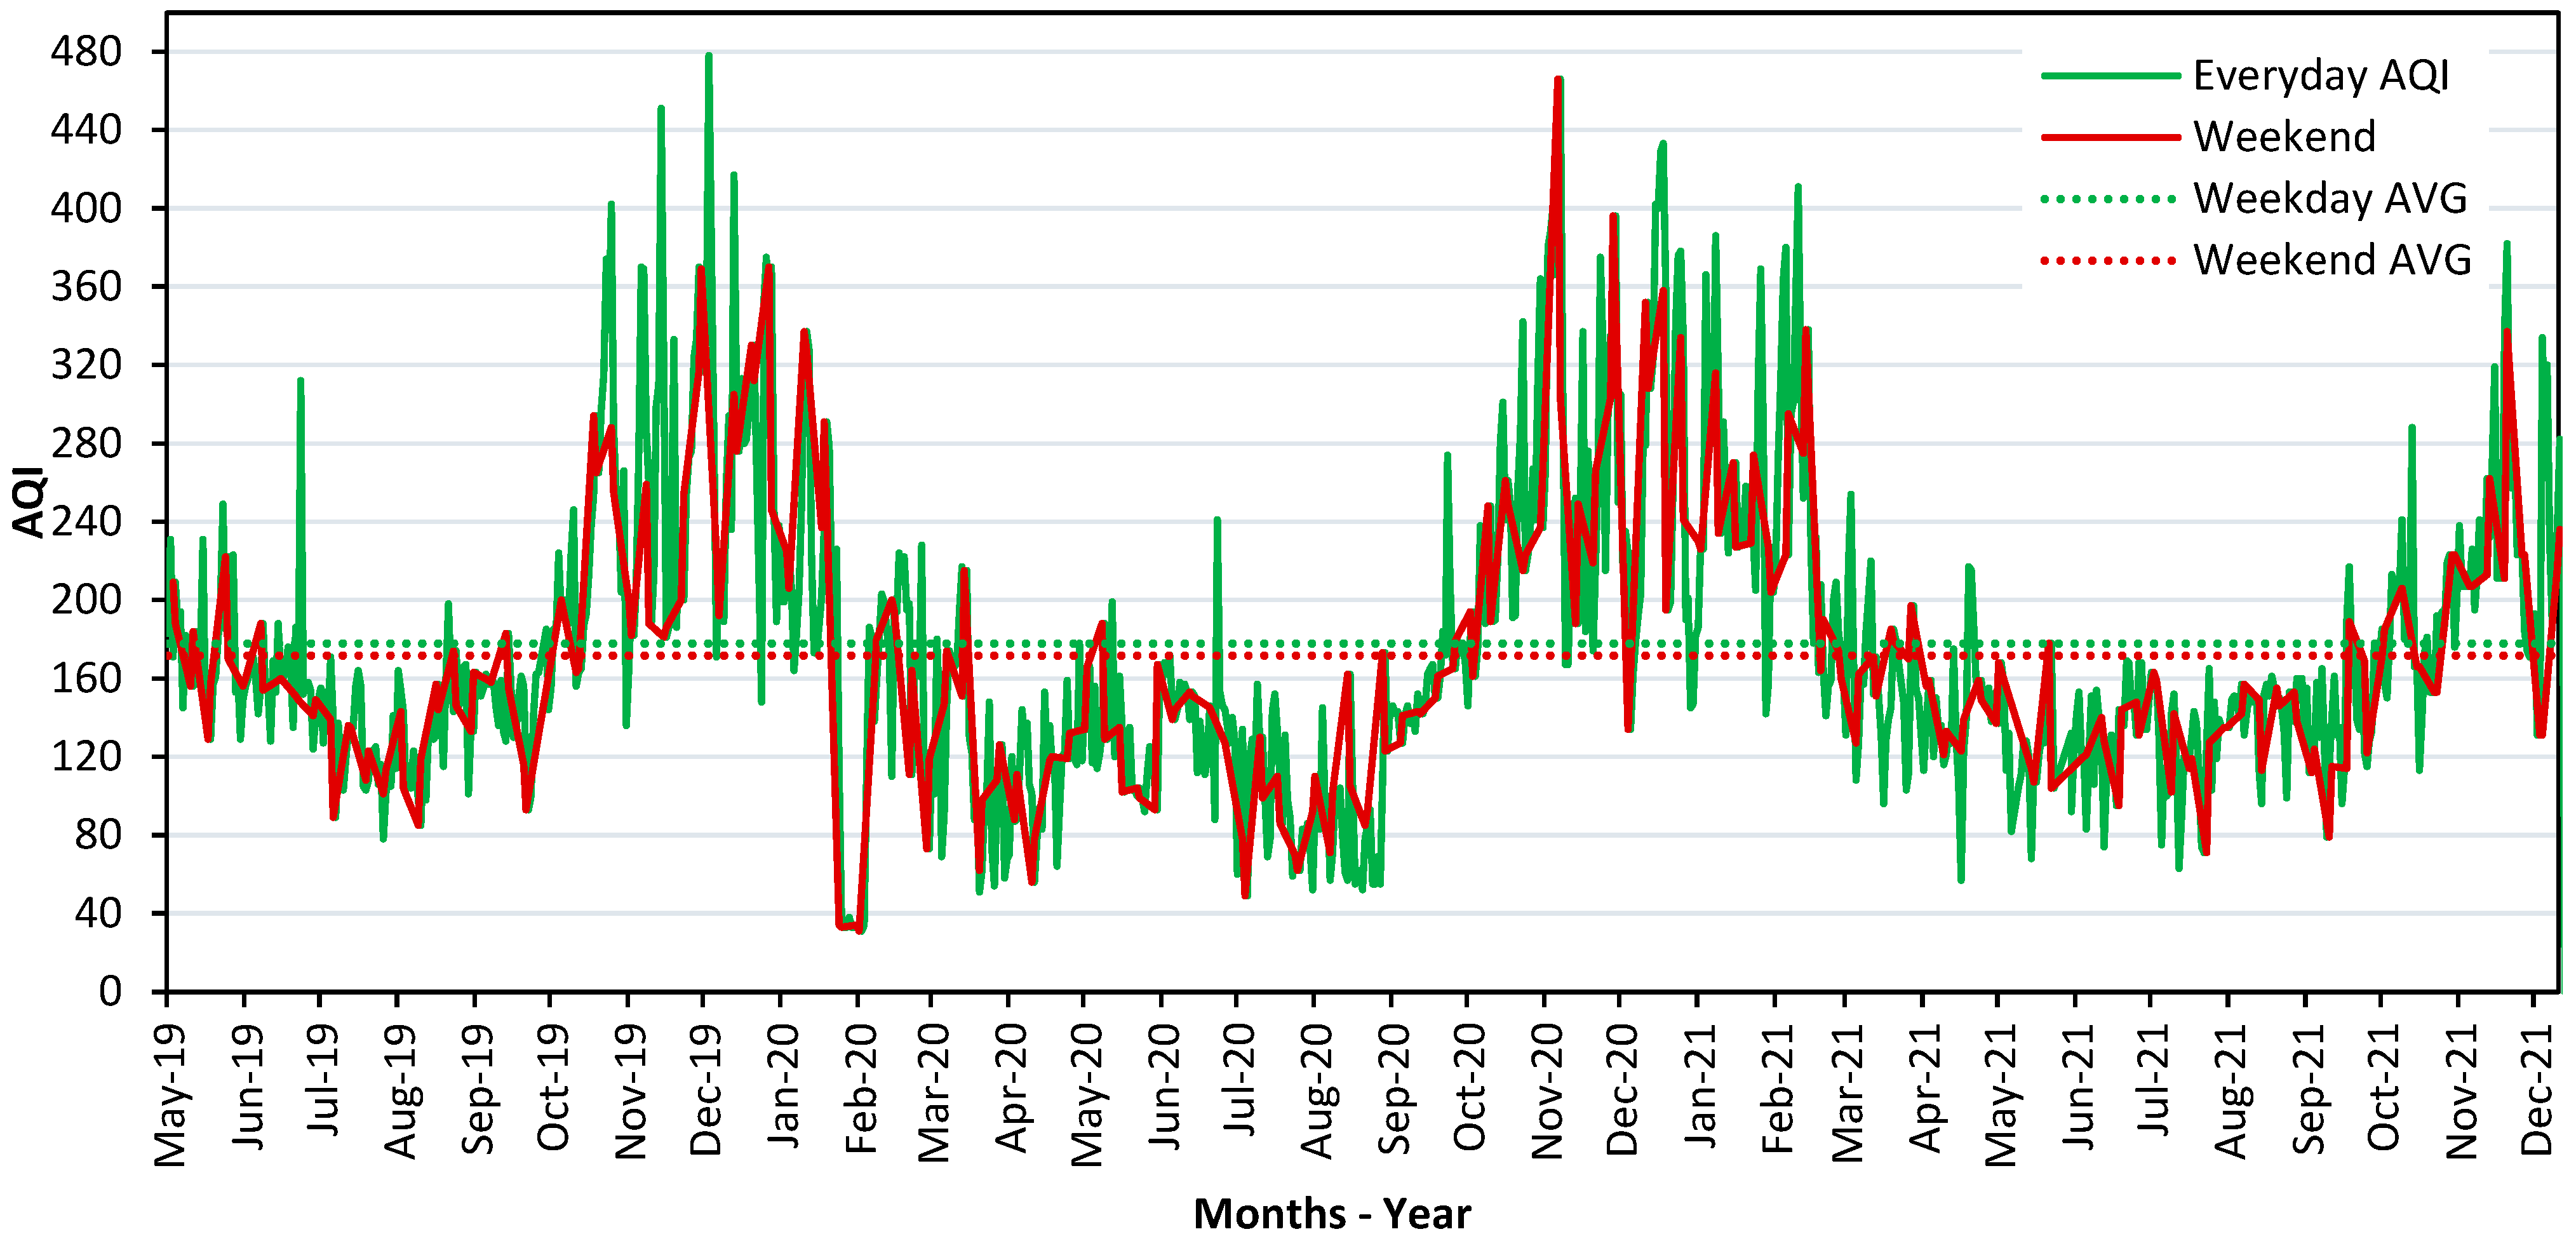
4.7. Weekly Trend of AQI

A comparative assessment of weekdays and weekend AQI was performed to identify the peak timing of emissions during the study period is plotted in Figure 8. As observed from the weekly trend, the results were similar to the previous investigation conducted on townships and town halls [20]. The results suggested that most peak values occurred during weekdays, with few deviations. The weekday average AQI was (178) higher than the average weekend AQI value (172).

5. Discussions

Lahore remained “very unhealthy” 26% of the time, and “unhealthy for everyone” 54% of the time, during the last three years (July 2019–April 2021). For 88.4% of the study period (July 2019–April 2021) the AQI values of Lahore remained greater than 100 for 88.4% of the time, and greater than 150 for 54% of the time, which is stated as unhealthy for sensitive groups (children, elderly, and patients) by the WHO. It remained “good” for 12 and “moderate” for only 104 days during the last 3 years (2019–2021). The average PM concentration in Lahore in 2010 was 121.8 µg/m3 [9]. The value increased to 167 µg/m3 in 2020 and 175 µg/m3 in 2021, as determined through real-time data. The AQI value reached a maximum of 478 and 466, in 2019 and 2020, respectively, during the smog season from October to December every year. The average AOD value in Lahore was 0.98 µm. The maximum value was 2.27 µm from Jia Bagga, and the minimum was 0.46 µm. According to the U.S. EPA standard, the safe range is (0.1 µm–0.4 µm) [36]. The ambient air of Lahore did not meet this standard, not for a single time, at any location. The maximum value was 5.6 times higher than the upper limit of the safe range.
It can be concluded that during the entire three year period, roads have played a vital role in pollution and smog. Quaid-e-Azam Industrial Estate more vigorously contributed to CO emissions, whereas Sundar Industrial Estate and brick kilns contributed more vigorously to SO2. The indoor environment, particularly hospitals and schools, must use air purifiers with a relevant filter.
Variations in the sum of the concentrations of CO, SO2, and NO2 determined through remote sensing coincided considerably with the respective AQI plot, and therefore, that NO2, CO, and SO2 can be used as an indicator of the AQI in Lahore. Similar results were reported by Ashraf for NO2 in the drastic smog season of 2016 [32]. Additionally, it was further inferred that any of the NO2, CO and SO2 concentrations obtained through remote sensing can be used for initial surveillance of AQI in Lahore. This paper has validated the results of previous work for the period 2007 to 2011 [22]. Through plotting, it was observed that in the period when AQI rose, cumulative values of each pollutant did not rise correspondingly. Similarly, when AQI dropped, the actual value of each pollutant did not drop rapidly. Neither HCHO, CH4, nor AOD had a similar relationship with AQI values. Although AOD values were higher during the smog season than the rest of the year, they were maximum during the monsoon season, when AQI values were comparatively low. The findings of this work also included that AOD, which has been reported as an indicator of AQI in several previous kinds of research, is a parameter which, in the case of Lahore, is little misleading [41,42].
On-ground observational data were obtained, with the following results. After the analysis of 14 Lahore sites and reduction of data into three zones, i.e., industrial estates, roads, and brick kilns, it was concluded that within industrial estates, peak values of CO, NO2, HCHO, and CH4 occurred at the Quaid-e-Azam Industrial Estate. The peak value of CO that occurred in February 2021, when the complete lockdown was lifted, is shown in Figure 4. The Sundar Industrial Estate was a heavy participant in SO2 contribution.
Heavily trafficked roads, followed by Quaid-e-Azam Industrial Estate, were the main contributors of CO, formaldehyde, and NO2. Within roads, NO2 values were highest on Jail Road and Main Boulevard, as seen in Figure 5. Formaldehyde should be the main concern at Yateem Khana (Road) and Main Boulevard (Road).
Brick kilns were the main contributor of SO2, particularly Main Lahore and Jia Bagga, due to the type of fuel used. The on-ground survey of the Shardra brick kilns (four brick kilns within a 300 m buffer) showed that there was less use of tires as fuel, and their participation for various pollutants was low, although they are present in the near vicinity.
Earth Observation Remote Sensing can provide low-cost surveillance at these sites, and can recommend fuel optimization or restriction of specific fuel usages, such as tires to brick kilns, and fuel types for vehicles. This graph could be used as a tool to determine the locations which require the most urgent action. In future, cross emission factors can also be included. Similarly, mitigation techniques and devices based on the prominent pollutant must be identified. For indoor and outdoor air conditioning, filters, with a focus on relevant pollutants, can be developed.
This study has suggested that AQI values during the week are higher than weekend values, a result different to a previous study [22]. The present location of the real-time AQI sensor is at the U.S. Embassy in the business hub of Lahore, and has high traffic, whereas, in the previous study, it was located near a residential–industrial area where traffic was high on weekends. It suggests traffic must be given preference when solution actions are performed.

6. Conclusions

  • The air quality index (AQI) values of Lahore remained greater than 100 for 88.4% of the time, and greater than 150 for 54% of the time. It remained “good” for 12 and “moderate” for only 104 days in the last 3 years (2019–2021);
  • The average PM2.5 concentration in Lahore in 2020 was 167 µg/m3, and 175 µg/m3 in 2021, as determined through real-time data. The AQI value reached a maximum of 478 and 466, in 2019 and 2020, respectively;
  • The average CO concentration for all sites in the data set was 41.1 millimol/m2. The maximum value was for Jail Road (58.982 millimol/m2) and the minimum was at Jia Bagga (34.57 millimol/m2). NO2 average accumulation was 0.1010 millimol/m2, with the maximum value of 0.255 millimol/m2 obtained from Jail Road, and the minimum value of 0.037 millimol/m2 from Kot Abdul. The SO2 concentration on average in Lahore was 0.428 millimol/m2. The maximum value obtained was 0.747 millimol/m2 at Jia Bagga, and the minimum was 0.232 millimol/m2 at Karol. The CH4 average value was 1.914 millimol/m2, the maximum was 1.993 millimol/m2 in Quaid-e-Azam Industrial Estate, and the minimum was 1.860 millimol/m2 in Sundar Industrial Estate. The HCHO on average was 0.236 millimol/m2. The maximum value was obtained from Main Boulevard at 0.376 millimol/m2, and the minimum value was from Jail Road at 0.079 millimol/m2;
  • The average AOD value in Lahore was 0.98 µm. The maximum value was 2.27 µm from Jia Bagga, and the minimum was 0.46 µm;
  • Variations in the sum of the concentrations of CO, SO2, and NO2 determined through remote sensing coincided considerably with the respective AQI plot. Neither HCHO, CH4, nor AOD had a similar relationship with AQI values;
  • The results showed that economic activities/emission sources have an impact on the type of pollutant in which they are participating most. CO, SO2, NO2, HCHO, CH4, and AOD showed variation at different sites. Thus, the sites which contribute most to a particular pollutant can be identified, and respective mitigation can be adopted;
  • The results suggested that AQI values during the week were higher than the weekend.

7. Policy Recommendations

All public vehicles must gradually be converted to electric vehicles. Regular Ministry of Transport (MOT) checks must be conducted to reduce tailpipe pollution emissions. Catalytic converters must work in all vehicles, and low-cost alternatives must be developed. The site marked as Jail Road, which resulted as the highest contributor of CO and NO2, is comprised of road intersections and has congested traffic. Such congestions must be avoided, and can be achieved by providing alternate routes. Ferozpur Road was the cleanest, although the number of LTV (light transport vehicles) was highest here. A regular and recurring MOT check system for HTVs (heavy transport vehicles) must be implemented on a priority basis. Catalytic converters in mass transit vehicles must be equipped with efficient CO, HCHO and NO2 removal. Buses were the highest contributors of SO2 due to low quality fuel usage. Restrictions on such fuel usage and its import must transpire. It is recommended that, as the presence of industrial estates create a high concentration of pollution, they must be moved to outside the city so as to avoid damage to human life. It must also be further investigated as to why ISO environmental standardized industries were still emitting SO2. Local authorities and EPA must encourage industries to use relevant scrubbers or other smog control devices. Other cities of Punjab must be given more growth funds so that their populations do not need to travel for necessities such as higher education, better living, etc. As we can see from Figure 4, we can identify the sites that contribute most to a particular pollutant. This model can be utilized by government to control industries and brick kilns for unauthorized fuel usage.

Author Contributions

Conceptualization, M.A.; methodology, M.A.; software, M.A., I.S., S.A.; validation, M.A., I.S.; formal analysis, M.A., I.S., S.A.; investigation, M.A., S.A.; resources, M.A., S.A.; data curation, M.A., I.S.; writing—original draft preparation, M.A., I.S.; writing—review and editing, M.A., I.S., S.A.; visualization, I.S., M.A.; supervision, M.A.; project administration, M.A. All authors have read and agreed to the published version of the manuscript.

Funding

This research received no external funding.

Institutional Review Board Statement

Not applicable.

Informed Consent Statement

Not applicable.

Data Availability Statement

The real-time AQI data has been taken from the US Embassy Lahore Pakistan website [13]. All analysis, location of the sites, and remote sensing data are available and will be provided on demand.

Acknowledgments

We would like to thank Adnan Hanif, Chief Executive Officer of Enertec Engineering, for his feedback. We used a few pieces of equipment from the University of Management and Technology, Lahore. We are thankful to Umer Javed for his help in drafting the study area map.

Conflicts of Interest

The authors declare no conflict of interest. We know of no conflicts of interest associated with this publication, and there has been no significant financial support for this work that could have influenced its outcomes. As the corresponding author, I confirm that the manuscript has been read and approved for submission by all the named authors.

References

  1. Ortolano, L.; Sanchez-Triana, E.; Afzal, J.; Ali, C.L.; Rebellón, S.A. Cleaner production in Pakistan’s leather and textile sectors. J. Clean. Prod. 2014, 68, 121–129. [Google Scholar] [CrossRef] [Green Version]
  2. WHO. Ambient Air Pollution: A Global Assessment of Exposure and Burden of Disease; World Health Organization: Geneva, Switzerland, 2016. [Google Scholar]
  3. Anjum, M.S.; Ali, S.M.; Imad-Ud-Din, M.; Subhani, M.A.; Anwar, M.N.; Nizami, A.-S.; Ashraf, U.; Khokhar, M.F. An Emerged Challenge of Air Pollution and Ever-Increasing Particulate Matter in Pakistan; A Critical Review. J. Hazard. Mater. 2021, 402, 123943. [Google Scholar] [CrossRef]
  4. Park, Y.-W. The Environment and Climate Change: Outlook of Pakistan; United Nations Environment Programme (UNEP): Nairobi, Kenya, 2013; p. 107. [Google Scholar]
  5. Hassan, A.; Ilyas, S.Z.; Agathopoulos, S.; Hussain, S.M.; Jalil, A.; Ahmed, S.; Baqir, Y. Evaluation of adverse effects of particulate matter on human life. Heliyon 2021, 7, e05968. [Google Scholar] [CrossRef] [PubMed]
  6. Owusu, P.A.; Sarkodie, S.A. Global estimation of mortality, disability-adjusted life years and welfare cost from exposure to ambient air pollution. Sci. Total Environ. 2020, 742, 140636. [Google Scholar] [CrossRef] [PubMed]
  7. World Health Organisation. Ambient (Outdoor) Air Pollution Guidelines. 2018. Available online: https://www.who.int/news-room/fact-sheets/detail/ambient-(outdoor)-air-quality-and-health (accessed on 23 January 2022).
  8. Shahid, A.; Ansub, M.; Hafeez, A.; Saleem, H.; Basharat, A. Socio-Economic Impacts of Transit Projects (A Case Study of Orange Line Lahore). Saudi J. Civ. Eng. 2020, 4, 161–169. [Google Scholar] [CrossRef]
  9. Government of Pakistan, Ministry of Communications. Traffic Study Report Peshawar to Torkham Section. Available online: http://nha.gov.pk/uploads/topics/16244486166661.pdf (accessed on 23 January 2022).
  10. Lahore US Embassy Air Pollution: Real-Time Air Quality Index (AQI). 2021. Available online: https://aqicn.org/city/pakistan/lahore/us-embassy/ (accessed on 23 January 2022).
  11. IQ Air. World’s Most Polluted Cities 2020 (PM2.5). Available online: https://www.iqair.com/world-most-polluted-cities?continent=&country=&state=&page=1&perPage=50&cities=Dt8HhEj6mC2eatyBr (accessed on 23 January 2022).
  12. World Air Quality Resport 2020. Available online: https://www.google.com/search?q=World+Air+Quality+Resport+2020&ei=cV6DYpygDpCp4t4P_om86AI&ved=0ahUKEwjcnM2-kOb3AhWQlNgFHf4EDy0Q4dUDCA4&uact=5&oq=World+Air+Quality+Resport+2020&gs_lcp=Cgdnd3Mtd2l6EAxKBAhBGABKBAhGGABQAFgAYABoAHAAeACAAQCIAQCSAQCYAQA&sclient=gws-wiz (accessed on 23 January 2022).
  13. Raja, S.; Biswas, K.F.; Husain, L.; Hopke, P.K. Source apportionment of the atmospheric aerosol in Lahore, Pakistan. Water Air Soil Pollut. 2010, 208, 43–57. [Google Scholar] [CrossRef]
  14. Lodhi, A.; Ghauri, B.; Khan, M.R.; Rahman, S.; Shafique, S. Particulate matter (PM2.5) concentration and source apportionment in Lahore. J. Braz. Chem. Soc. 2009, 20, 1811–1820. [Google Scholar] [CrossRef]
  15. Bagheri, H. A machine learning-based framework for high resolution mapping of PM2.5 in Tehran, Iran, using MAIAC AOD data. Adv. Space Res. 2022, 69, 3333–3349. [Google Scholar] [CrossRef]
  16. Basu, E.; Salui, C.L. Estimating Particulate Matter Concentrations from MODIS AOD Considering Meteorological Parameters Using Random Forest Algorithm. In Spatial Modeling and Assessment of Environmental Contaminants; Springer: Cham, Switzerland, 2021; p. 591. [Google Scholar]
  17. Alkon, M.; He, X.; Paris, A.R.; Liao, W.; Hodson, T.; Wanders, N.; Wang, Y. Water security implications of coal-fired power plants financed through China’s Belt and Road Initiative. Energy Policy 2019, 132, 1101–1109. [Google Scholar] [CrossRef]
  18. Liu, H.; Li, Q.; Yu, D.; Gu, Y. Air quality index and air pollutant concentration prediction based on machine learning algorithms. Appl. Sci. 2019, 9, 4069. [Google Scholar] [CrossRef] [Green Version]
  19. Zaib, S.; Lu, J.; Bilal, M. Spatio-Temporal Characteristics of Air Quality Index (AQI) over Northwest China. Atmosphere 2022, 13, 375. [Google Scholar] [CrossRef]
  20. Khanum, F.; Chaudhry, M.N.; Kumar, P. Characterization of five-year observation data of fine particulate matter in the metropolitan area of Lahore. Air Qual. Atmos. Health 2017, 10, 725–736. [Google Scholar] [CrossRef] [Green Version]
  21. Fatmi, M.R. COVID-19 impact on urban mobility. J. Urban Manag. 2020, 9, 270–275. [Google Scholar] [CrossRef]
  22. Ali, G.; Abbas, S.; Qamer, F.M.; Wong, M.S.; Rasul, G.; Irteza, S.M.; Shahzad, N. Environmental impacts of shifts in energy, emissions, and urban heat island during the COVID-19 lockdown across Pakistan. J. Clean. Prod. 2021, 291, 125806. [Google Scholar] [CrossRef]
  23. Iqbal, W. Report of the Smog Commission. 2018. Available online: https://vdocument.in/in-the-lahore-high-court-lahore-writ-petition-no-34789-commission-reportpdf.html?page=1 (accessed on 23 January 2022).
  24. Haider, R.; Yasar, A.; Tabinda, A.B. Impact of transport sustainability on air quality in Lahore, Pakistan. Curr. Sci. 2018, 114, 2380–2386. [Google Scholar] [CrossRef]
  25. Amiri, T.T.F. Assessment of contribution of SO2, CO, and NO2 in different urban land use in Bushehr region, Iran. Arab. J. Geosci. 2021, 14, 833. [Google Scholar]
  26. Lin, H.; Taniyasu, S.; Yamashita, N.; Khan, M.K.; Masood, S.S.; Saied, S.; Khwaja, H.A. Per-and polyfluoroalkyl substances in the atmospheric total suspended particles in Karachi, Pakistan: Profiles, potential sources, and daily intake estimates. Chemosphere 2022, 288, 132432. [Google Scholar] [CrossRef]
  27. Colbeck, I.; Nasir, Z.A.; Ahmad, S.; Ali, Z. Exposure to PM10, PM2.5, PM1 and carbon monoxide on roads in Lahore, Pakistan. Aerosol Air Qual. Res. 2011, 11, 689–695. [Google Scholar] [CrossRef] [Green Version]
  28. Jahangir, S.; Ahmad, S.S.; Aziz, N.; Shah, M.T. Spatial Variation of Nitrogen dioxide Concentration in Private and Public Hospitals of Rawalpindi and Islamabad, Pakistan. J. Int. Environ. Appl. Sci. 2013, 8, 16–24. [Google Scholar]
  29. Khwaja, M.A.; Shams, T. Pakistan National Ambient Air Quality Standards: A Comparative Assessment with Selected Asian Countries and World Health Organization (WHO). 2020. Available online: https://www.think-asia.org/handle/11540/12764 (accessed on 23 January 2022).
  30. Aziz, A.; Bajwa, I.U. Minimizing human health effects of urban air pollution through quantification and control of motor vehicular carbon monoxide (CO) in Lahore. Environ. Monit. Assess. 2007, 135, 459–464. [Google Scholar] [CrossRef]
  31. Ashraf, N.; Mushtaq, M.; Sultana, B.; Iqbal, M.; Ullah, I.; Shahid, S.A. Preliminary monitoring of tropospheric air quality of Lahore City in Pakistan. Sustain. Dev. 2013, 3, 19–28. [Google Scholar]
  32. Rasheed, A.; Aneja, V.P.; Aiyyer, A.; Rafique, U. Measurement and analysis of fine particulate matter (PM2.5) in urban areas of Pakistan. Aerosol Air Qual. Res. 2015, 15, 426–439. [Google Scholar] [CrossRef]
  33. Pakistan Bureau of Statistics. Ministry of Population. Islamabad. 2017. Available online: https://www.pbs.gov.pk/ (accessed on 23 January 2022).
  34. Shahzadi, S.; Shirazi, S. Analysis of seasonal and annual temperature at local scale: A case study of lahore. Pak. J. Sci. 2020, 72, 189. [Google Scholar]
  35. Pakistan Bureau of Statistics. Pakistan Population Census 2017. 2021. Available online: https://www.pbs.gov.pk/content/final-results-census-2017 (accessed on 23 January 2022).
  36. Global Monitoring Laboratory. Global Radiation and Aerosols. 2021. Available online: https://gml.noaa.gov/grad/surfrad/aod/ (accessed on 2 November 2021).
  37. Mehmood, U.; Azhar, A.; Qayyum, F.; Nawaz, H.; Tariq, S. Air pollution and hospitalization in megacities: Empirical evidence from Pakistan. Environ. Sci. Pollut. Res. 2021, 28, 51384–51390. [Google Scholar] [CrossRef] [PubMed]
  38. Abbas, S.; Ali, G.; Qamer, F.M.; Irteza, S.M. Associations of air pollution concentrations and energy production dynamics in Pakistan during lockdown. Environ. Sci. Pollut. Res. 2022, 29, 35036–35047. [Google Scholar] [CrossRef]
  39. Ali, G.; Abbas, S.; Qamer, F.M.; Irteza, S.M. Environmental spatial heterogeneity of the impacts of COVID-19 on the top-20 metropolitan cities of Asia-Pacific. Sci. Rep. 2021, 11, 20339. [Google Scholar] [CrossRef]
  40. Khan, M.W.; Ali, Y.; De Felice, F.; Salman, A.; Petrillo, A. Impact of brick kilns industry on environment and human health in Pakistan. Sci. Total Environ. 2019, 678, 383–389. [Google Scholar] [CrossRef]
  41. Gu, Y. Estimating PM2.5 Concentrations Using 3 km MODIS AOD Products: A Case Study in British Columbia, Canada. Master’s Thesis, University of Waterloo, Waterloo, ON, Canada, 2019. [Google Scholar]
  42. Chen, J.; Lin, S.; Yongji, W.; Xikong, Z. Accuracy verification of AOD products with 1 km resolution in Beijing-Tianjin-Hebei region and correlation analysis with air pollution. Adv. Lasers Optoelectron. 2020, 57, 232802. [Google Scholar] [CrossRef]
Figure 1. Study area map indicating selected sites in the Lahore district and its surrounding areas.
Applsci 12 05102 g001
Figure 2. Temporal patterns of pollutant concentrations across spatially dispersed sites belonging to three sectors (roads, industrial estates, and brick kilns): (a) carbon monoxide (CO), (b) nitrogen dioxide (NO2), (c) methane (CH4), (d) sulphur dioxide (SO2), (e) formaldehyde (HCHO), (f) aerosol optical depth (AOD).
Applsci 12 05102 g002
Figure 3. Total monthly contribution of different pollutants and their relevancy to maximum AQI in Lahore, from March 2018 to December 2020: (a) CO, (b) NO2, (c) SO2, (d) HCHO, (e) CH4, (f) AOD.
Applsci 12 05102 g003
Figure 4. The percentage contribution of each site on the corresponding pollutant.
Applsci 12 05102 g004
Figure 5. The top contributor of specific pollutants within various economic activities. The top contributor of (a) CO in Roads (b) CO in Brick kilns (c) CO in Industrial Estates (d) NO2 in Roads (e) NO2 in Brick kilns (f) NO2 in Industrial Estates (g) SO2 in Roads (h) SO2 in Brick kilns (i) SO2 in Industrial Estates (j) HCHO in Roads (k) HCHO in Brick kilns (l) HCHO in Industrial Estates (m) CH4 in Roads (n) CH4 in Brick kilns (o) CH4 in Industrial Estates (p) AOD in Roads (q) AOD in Brick kilns (r) AOD in Industrial Estates.
Applsci 12 05102 g005
Figure 6. The comparative contribution of pollutants based on vehicle type.
Applsci 12 05102 g006
Figure 7. The comparative contribution of pollutants based on the brick kiln type, i.e., traditional brick kilns (TBK) and contemporary brick kilns (CBK).
Applsci 12 05102 g007
Figure 8. The daily trend of AQI in Lahore to identify the difference in weekday and weekend trends.
Applsci 12 05102 g008
Table 1. Location and economic activity description of selected sites.
Emission SourceSite Name and
Location
Description
Industrial EstateSundar
(31.28992854, 74.17545758)
  • Total industries: 400 (including pharmaceutical, food processing, textile packaging, etc.);
  • 80% of industries used electricity;
  • 40% of industries used diesel as an alternate fuel;
  • 15% of industries used coal as an alternate fuel;
  • Many industries had new equipment and ISO 14001 certifications;
  • Overall environmental protection guidelines were being followed.
Quaid-e-Azam
(31.44257016, 74.32317393)
  • Total industries: 470 (including pharmaceutical, food processing, textile packaging, etc.);
  • 50% of industries used coal as the primary fuel;
  • 40% of industries used diesel as an alternate fuel;
  • 60% of industries used coal as an alternate fuel;
  • Old equipment;
  • Environmental protection guidelines were not practiced.
Heavy Traffic RoadsYateem Khana
(Multan Road)
31.53927142, 74.2869128
  • Total vehicle count greater than 73,000 per day (more than 40,000 bikes, 19,000 cars, 17,000 vans and buses, 500 trucks, and 8000 auto-rickshaws);
  • 40 km/h average speed;
  • Overpass and underpass.
Ferozepur Road
31.58970752, 74.39132723
  • Total vehicle count greater than 1 million per day (more than 60,000 bikes, 26,000 cars, 2000 vans and buses, 800 trucks, and 10,000 auto-rickshaws);
  • 40 km/h average vehicle speed;
  • Underpasses and overheads with signal-free tracks;
  • Mass transit vehicles 48/h.
Main Boulevard
(Gulberg Road)
31.50428009, 74.35241608
  • Total vehicle count greater than 43,000 per day (more than 22,000 bikes, 13,000 cars, 1000 vans and buses, 300 trucks, and 4500 auto-rickshaws);
  • 50 km/h average speed;
  • Overpass and underpass;
  • Mass transit vehicles 56/h.
Jail Road
31.54812736, 74.36799651
  • Total vehicle count greater than 34,000 per day (more than 24,000 bikes, 19,000 cars, 2500 vans and buses, 309 trucks, and 4700 auto-rickshaws);
  • 50 km/h average speed;
  • Mass transit vehicles 59/h, the location occurred in the congested area near a chowk.
Brick KilnsKot Abdul Malik
31.56366011, 74.17074445
  • Coal used as primary fuel; near ring road with heavy traffic and trucks;
  • No zig-zag technology.
Sherwani
31.42993779, 74.34483113
  • Coal used as primary fuel; in the vicinity of Quaid-e-Azam Industrial Estate;
  • No zig-zag technology.
HajiCoat
31.65890873, 74.30011335
  • Coal used as primary fuel; 3 more brick kilns in 300 m buffer;
  • No zig-zag technology.
Jameel Park
31.66475319, 74.30303159
  • Coal used as primary fuel, 3 more brick kilns in 300 m buffer;
  • No zig-zag technology.
Sikanderabad
31.66811359, 74.29153028
  • Coal used as primary fuel, 3 more brick kilns in 300 m buffer;
  • No zig-zag technology.
Karol
31.66972069, 74.31281629
  • Coal used as primary fuel, 3 more brick kilns in 300 m buffer;
  • No zig-zag technology.
Main Lahore
31.27522257, 74.2365742
  • Coal used as a primary fuel, with partial use of tires as fuel;
  • No zig-zag technology.
Jia Bagga
31.33274712, 74.26961359
  • Coal used as a primary fuel, with partial use of tires as fuel;
  • No zig-zag technology.
Table 2. Lahore AQI values and their effects on human life.
AQI ValueAQI Value in Number of Days/Total DaysPercentageWHO
Recommendations
Outdoor
Activity
Restrictions
Greater than 100764 days/867 days88% of the time in the last three yearsUnhealthy for sensitive groups Applsci 12 05102 i001
Greater than 150470 days/867 days54% of the time in the last three yearsUnhealthy for everyone Applsci 12 05102 i002
Greater than 200221 days/867 days26% of the time in the last three yearsVery unhealthy Applsci 12 05102 i003
Greater than 250128 days/867 days14% of the time in the last three yearsHazardous Applsci 12 05102 i004
Applsci 12 05102 i005
Publisher’s Note: MDPI stays neutral with regard to jurisdictional claims in published maps and institutional affiliations.

