
Application of the Signal Spectrum-Based Image Pattern Recognition in the Vibration Process Analysis

Electrical Department, Institute of Control and Industrial Electronics, Warsaw University of Technology, 00-661 Warsaw, Poland
Appl. Sci. 2022, 12(10), 5160; https://0-doi-org.brum.beds.ac.uk/10.3390/app12105160
Submission received: 3 April 2022
/
Accepted: 18 May 2022
/
Published: 20 May 2022
(This article belongs to the Special Issue Alternative Techniques in Vibration Measurement and Analysis)
Abstract
:One of the aims of vibration signal analysis is the assessment of the condition of technical objects at each stage of operation based on a cause-and-effect relationship between the technical condition of the device and the features of the vibration signal available through the measurement experiment. The essential features of the signal (in the form of certain measures) are available through appropriate operations on the measurement signal. The problem arises when the measuring signal is not a fully deterministic one, it shows features common to deterministic and random signals. Consequently, some simple periodic signal measures such as spectrum frequency components introduce some level of uncertainty in the before mentioned cause-and-effect relationship. Thus, the assessment of the technical condition in the selected frequency components of the spectrum of the measuring signal may not be reliable. These difficulties can be overcome by using the frequency-frequency analysis of the diagnostic signal. The entire frequency spectrum is converted into an image in which the frequency components form characteristic patterns unique to the actual condition of the technical object. The final assessment of the condition is achieved through the identification of a unique image pattern by comparison with reference image patterns created with a generation model.
1. Introduction
The analysis of the vibration signal enables the assessment of the design features and operating conditions (supply, load, manufacturing errors, degree of wear or negative change in the functional properties of the material) of technical objects, assuming a cause-and-effect relationship between the dynamic state of a particular node and the features of the vibration signal available through the measurement experiment. The final evaluation of the technical condition is possible thanks to the inference system equipped with an objective classifier of features [1,2,3,4]. One of the possible implementations of the features classifier is a comparison of the measurement signal’s selected features with the reference signal’s features. Signal features are obtained based on the signal generation and propagation model, taking into account the existence of a wide range of physical phenomena mutually influencing each other (e.g., electric and magnetic circuits, force and temperature fields within a mechanical system with specific material characteristics) [5]. Since several vibration processes coexist, revealing the essential features of the signal requires appropriate operations on the measurement signal. The subject of consideration is a periodically changing vibration signal (modulated strictly periodic and nearly-periodic signals) for which the frequency spectrum can be determined. In general, vibration signals are generated in complex mechanical and electro-mechanical systems’ mechanical rotating devices as well as rotating and linear electrical machines. The measuring signal, despite the steady-state operations of the electro-mechanical system, is not a fully deterministic one; it has features common to deterministic and random signals. The features of a deterministic signal result from the fact that a specific input causes a reaction in individual circuits and nodes of the system, which is influenced by the geometry of individual elements of the mechanical system and their material parameters. The features of the random signal are related to the fluctuation of the input and the heterogeneity of the internal structure of the materials, and the technological tolerance of the geometrical dimensions of the individual elements of the system, in particular, the imperfect fit of the mating surfaces and their mutual clearances. Consequently, the frequency components of the measurement signal are characterized by some degree of uncertainty. Their amplitude and frequency cannot be precisely predicted and may differ from the frequency components of the reference signal. The evolution of the technical condition (the appearance of specific damages of increasing intensity) causes further changes in the measurement signal. New or previously existing signal frequency components appear or are modified [4]. All this means that the assessment of the technical condition on the basis of only selected frequency components of the spectrum of the measuring signal may not be reliable. These difficulties can be avoided by the frequency-frequency analysis of the diagnostic signal proposed by the author. The entire frequency spectrum is converted into an image (hereinafter referred to as the F-F image) in which the frequency components and their higher harmonics form characteristic patterns. Image patterns reflect the unique distribution of frequency components generated by particular vibrational processes. Instead of analyzing a chosen frequency component of the spectrum, entire unique patterns appearing in the F-F image are analyzed. It should be emphasized that several image patterns can be superimposed since several vibration processes coexist.
2. Generation of F-F Image
The real part of the discrete frequency spectrum (DFT) of the diagnostic signal after the removal of the element representing the constant component is treated as the vector S = [sk]; k = 1, 2, 3,… ks; ks = 1/2(T/Δt) is the vector S length; T, measurement duration; Δt, vibration signal sampling period. The parameter sk represents the amplitude of the spectral band with the frequency kΔf; Δf = 1/T is the spectrum frequency resolution. The vector S is converted into the array P:
where:
- n = 1, 2, 3,… np, np is line length;
- m = 1, 2, 3,… mp, mp is column length;
- in such a way that successive parts of the vector S of length np form successive rows of the P table, where ks ≤ npmp. The quantity fP = npΔf will be called the characteristic frequency of the table P. In the F-F image created on the basis of the P table, the amplitudes of individual frequency components are represented by the color or degree of intensity of a given color, uniquely related to the adopted system of contour lines (similarly to cartographic maps) [6,7]. The F-F image is organized such that the p1,1 element is in the lower left corner. The frequency of the spectral lines associated with the cells of the P table is uniquely described by the indices n and m:
Thus, successive elements in the row are distant by the frequency Δf, while successive elements of the column are distant by the characteristic frequency fP. The shift of the successive parts of the vector S, such that their first element occupies appropriate cells of the first column of table P, can also be considered as a shift of the given part of the vector S by the frequency fP in the frequency domain. This means that the frequency component fP and its harmonics and their sidebands distant by the frequency fb or its higher harmonics, resulting from the modulation process, appear in the appropriate columns described by the indices fP and fP ± nfb (n = 1, 2, 3, …; harmonic order) and create vertical patterns in the F-F image.
The measurement signal, discrete in time and amplitude domain, significantly affects the result of the approximation using the Fourier series. Determining the DFT is equivalent to finding the transform of the product of the signal and the rectangular window with the same time duration. Consequently, only the frequency components of the signal whose period is commensurate with the duration of the rectangular window are represented by a single spectral line; the remaining incommensurable frequency components are represented by the diffuse spectrum. The diffuse spectrum decreases with the increase in frequency resolution of the spectrum and thus with the duration of the analyzed signal. As mentioned in the introduction, in the signal, one should expect frequency components with frequencies both commensurate and incommensurate with the signal duration (also with frequencies closely related to each other) and frequency components resulting from the modulation processes taking place in the tested electro-mechanical system. Thus, when planning a measurement experiment, the sampling frequency (Nyquist condition) and the frequency resolution of the spectrum (duration of the measurement signal is directly connected with the steady-state of the device operation) should be properly selected so as not to lose important information about the frequency components of the signal, and to minimize the effects of DFT approximation and, consequently, obtain an F-F image representative of all processes taking place in the diagnosed system.
A separate problem while creating F-F images based on the spectrum of the experimentally obtained signal is the elimination of the background noise from the useful signal. For the purpose of selection, only those frequency components carrying useful information and removing the remaining noise frequency components, a simple amplitude criterion can be used.
3. Analytical Calculation of Force Frequency Components of the Electro-Mechanical System
The diagnosed electro-mechanical system is an induction motor. The force acting on the separated area of the electric machine system is the sum of the electromagnetic volumetric and surface forces expressed by the products of magnetic quantities: the magnetic induction vector B and the magnetic field strength vector H. It is the basis for determining the forces acting on the boundary surfaces of ferromagnetic areas. When taking the stator and rotor core surfaces of an electric machine as the ferromagnetic boundary regions, the magnitude of the magnetic tension force acting in the radial direction per unit area (radial Maxwell tension) is described by the expression:
where:
- bδ(α,t), instantaneous value of flux density in the gap of the electric machine;
- μ0, magnetic permeability of air;
- α, coordinate describing the point of the gap between the rotor and the stator;
- t, time.
Radial forces are responsible mainly for the vibration of the stator core and outer casing of an electrical machine [8].
The flux density in the electric machine gap, with the simplifying assumption that the magnetic conductivity of the ferromagnetic areas μFe >> μ0 and accepting that the magnetic voltage between the stator and the rotor is equal to the resultant magnetomotive force of the stator and rotor θ(α,t), is inversely proportional to the air gap width distribution δ(α,t) between the stator and rotor:
where λ is the air gap magnetic conductivity per unit area.
The geometry of the air gap, which determines the conductivity of the air gap λ(α,t), depends on the shape of the stator and rotor slots and the distance between the outer and inner surfaces of the rotor and stator [9]. Thus, the induction of bδ(α,t) depends on the geometry of the air gap, the distribution of the stator and rotor windings and the method of powering the electrical machine.
The electromagnetic torque produced in the electro-mechanical system is identical to the electromagnetic tangential forces between the stator and rotor. Tangential forces whose magnitude per unit area is described by the expression:
arise as a result of the interaction of the resultant magnetic field b(α,t) of the stator and the rotor with the current sheet of the rotor A(α,t). Here, too, there is a dependency on the geometry of the stator and rotor. Dependencies (3)–(5) clearly indicate the modulation processes occurring. It should be noted that the displacements caused by the radial force introduce additional changes in the conductivity of the air gap, while the fluctuations of the electromagnetic (or mechanical) torque affect the instantaneous change of the rotational speed. The mutual influence of the discussed physical phenomena results in the occurrence of appropriate amplitude and frequency modulation processes [10].
The vibrations generated by the forces of electromagnetic and mechanical origin trigger the reaction of the mechanical supports of the rotating element (rotor), such as commonly used rolling bearings. Stresses between rolling elements and raceways are revealed in the form of mechanical vibrations with fundamental frequencies (identical to the so-called operating frequencies of the bearings) determined on the basis of the geometric dimensions of the bearing and the relative rotational frequency of the inner and outer raceways [11,12,13]. The relationships between the operating frequencies of the bearings are as follows:
where:
- fep, frequency of rolling of the rolling elements on the outer raceway;
- fip, frequency of rolling of the rolling elements on the inner raceway;
- nb, number of bearing rolling elements;
- fc, bearing cage frequency;
- fs, the relative rotational frequency of the inner and outer race equal to the rotational frequency of the shaft.
Damage to a given bearing element causes the appearance or increase of the amplitude of vibrations of the appropriate frequency.
Analytically calculated vibration frequency components are used to create a reference pattern of an FF image. It has to be emphasized that analytical calculations determine the frequency of potential frequency components.
The individual elements of the electro-mechanical system are characterized by strictly defined natural frequencies depending on the shape and material parameters. Resonant vibrations can occur when exciting forces of appropriate frequencies appear. Usually, the frequencies of the forces of electromagnetic origin (3) and (5) are sufficiently distant from the natural frequencies to induce significant resonant vibrations. Mechanical shocks are the most common forces forcing resonant vibrations. In the analyzed electro-mechanical system, shocks are caused by damage to a given bearing element (local defect or disturbance of its continuity).
4. Diagnostic Interpretation of F-F Images
Diagnostic analysis of F-F images will be presented on the basis of the vibration acceleration signal of unloaded 1.5 kW three-phase, one pair of pole (p = 1) induction motors, powered by an alternating voltage of 380 V and rated speed of 2780 rpm. Number of stator teeth zs = 24, number of rotor teeth zr = 17. The rotor of the motor is seated in 6205 Z bearings containing nb = 9 rolling elements. The vibration acceleration sensor is positioned on the outer casing of the motor at an equal distance from both bearing shields. The duration of the measurement is 10 s, ensuring sufficient frequency resolution and guaranteeing that the motor operating condition remains unchanged. The sampling frequency has been adjusted to the highest frequency range of the vibration process and is 40 kHz. The diagnosed objects are characterized by relatively small deviations from the correct technical condition in order to demonstrate the usefulness of the presented diagnostic method in detecting the initial stage of progressing faults.
4.1. Healthy Motor
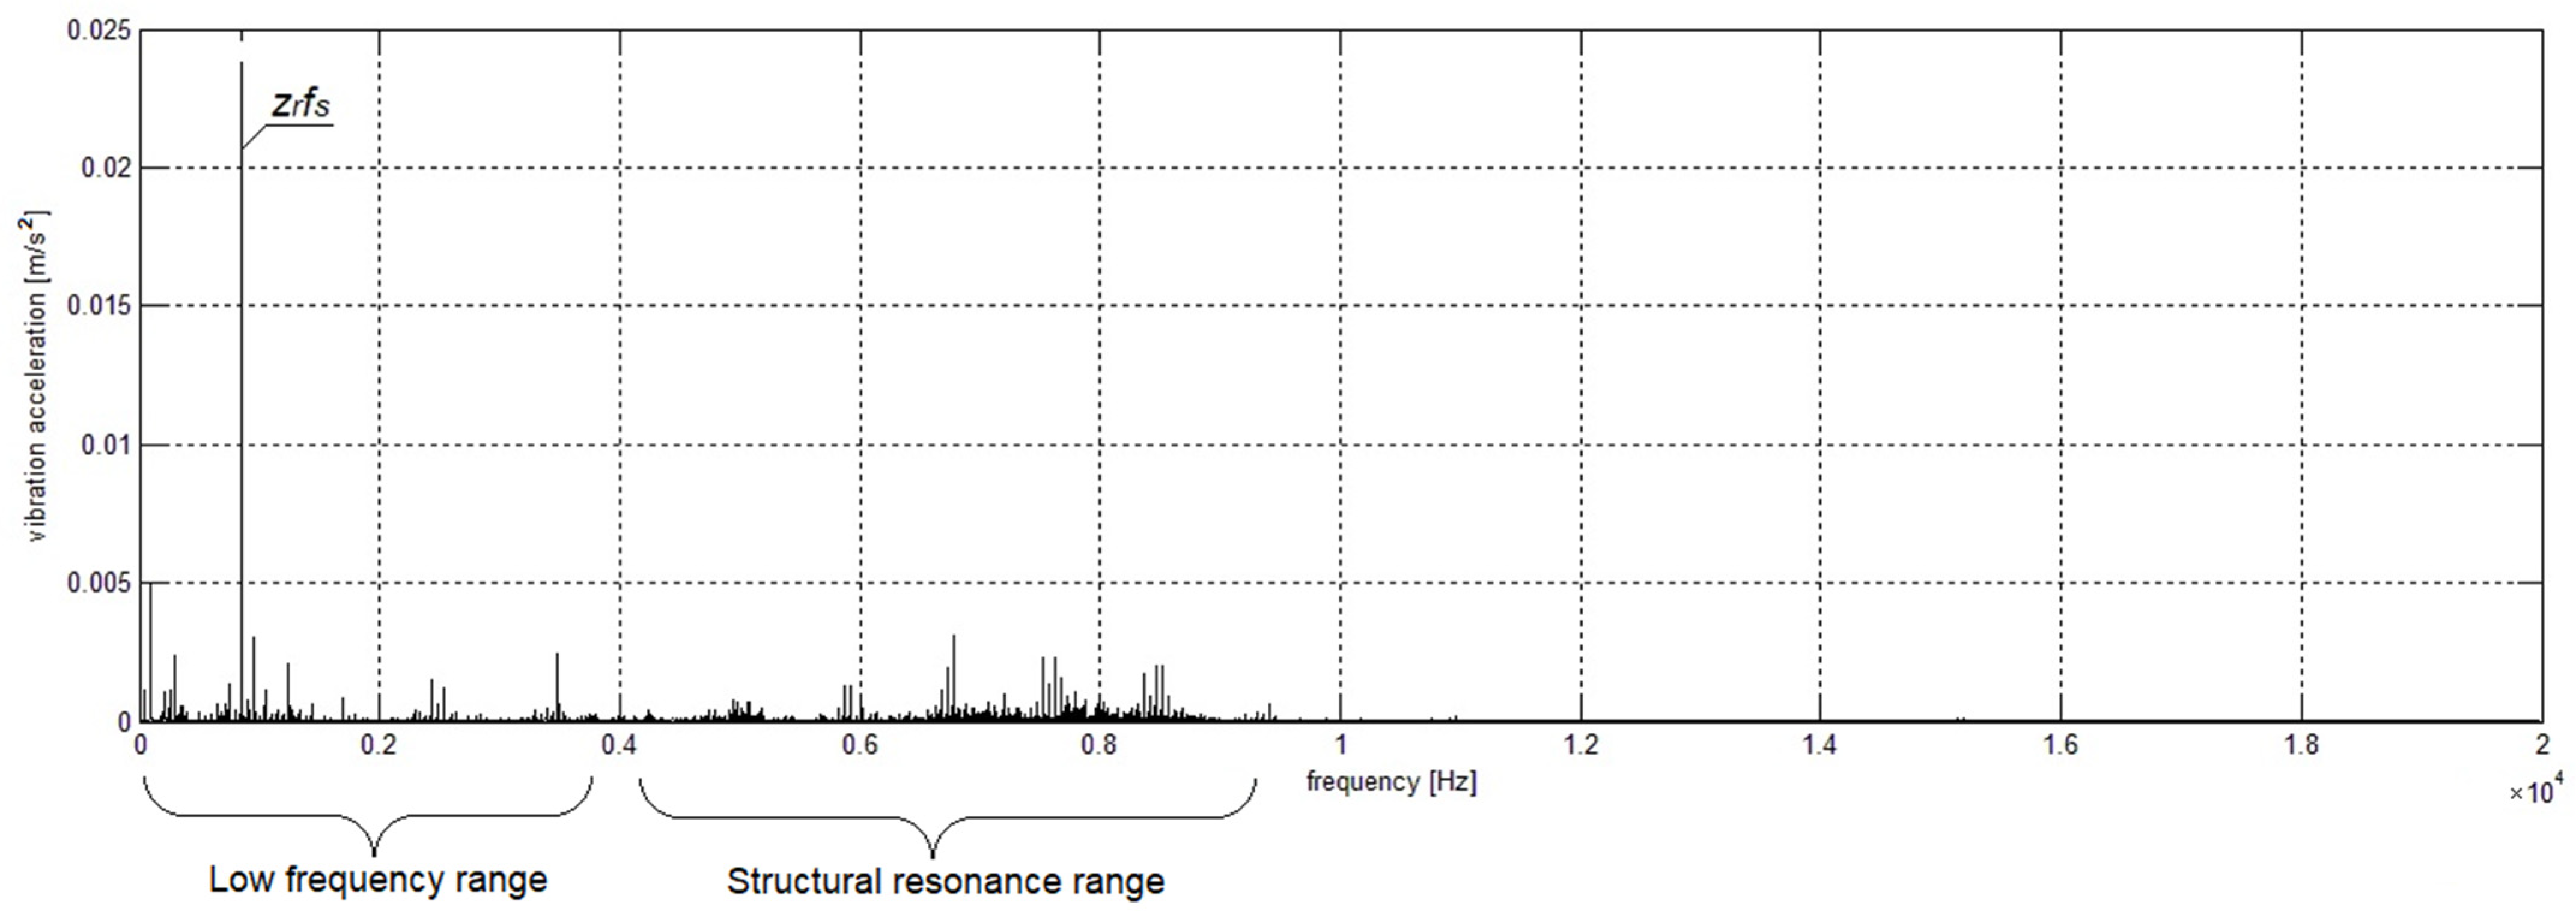
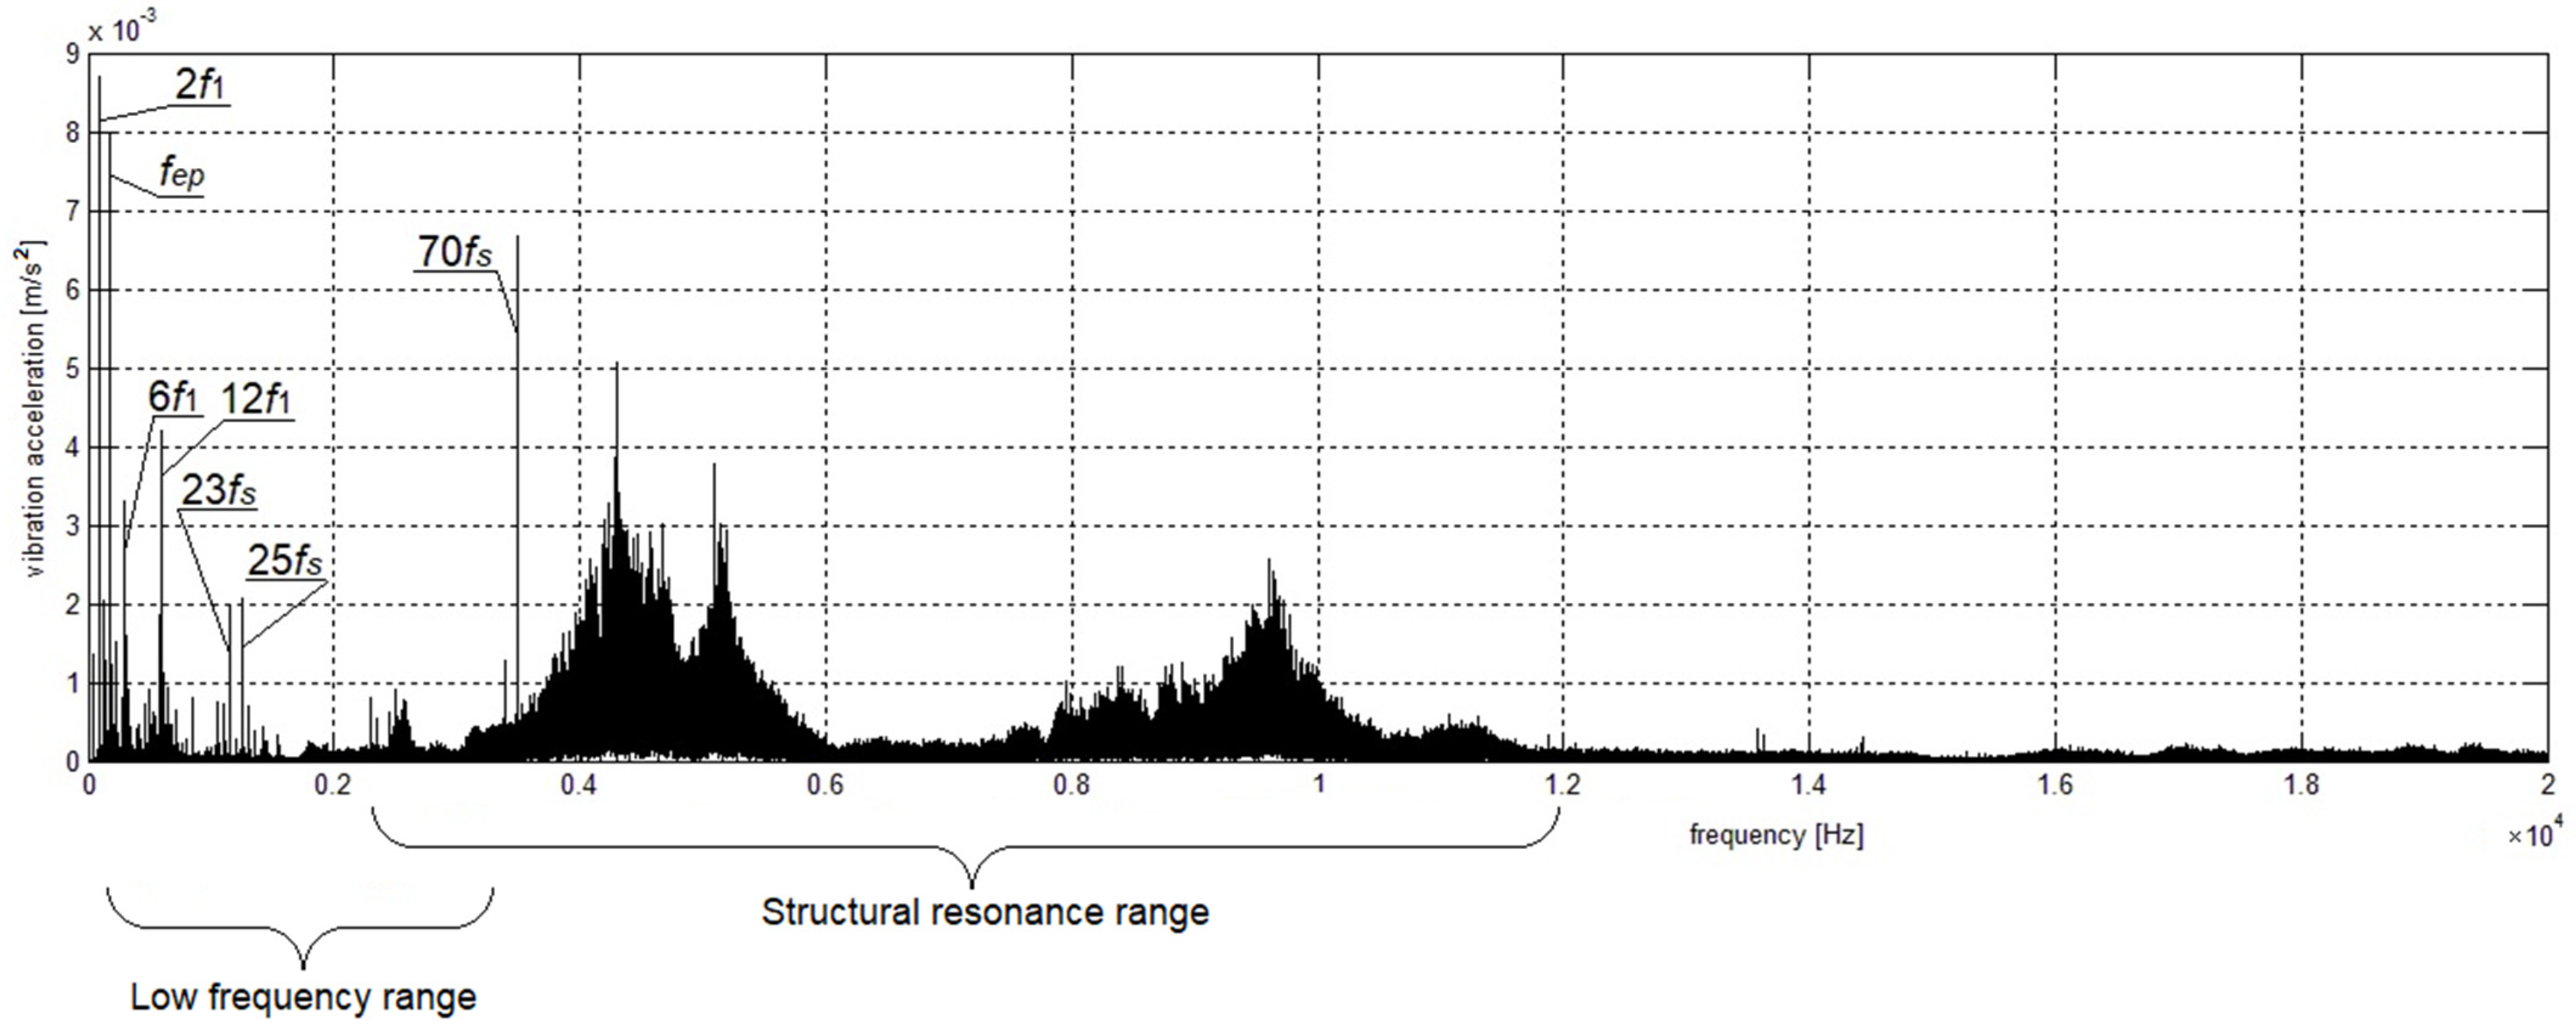
Figure 1 shows the spectrum of vibrations of the outer casing of a fully operational engine that can be divided into two ranges: low frequency without structural resonances and high frequency dominated by structural resonances.
The dominant frequency component is the low frequency range component caused by the radial forces (according to (3)) with the frequency zrfs, where fs is the rotor rotational frequency [14]. Amplitudes of structural resonance range frequency components are relatively low, which indicates a lack of mechanical shocks that may excite resonance vibrations.
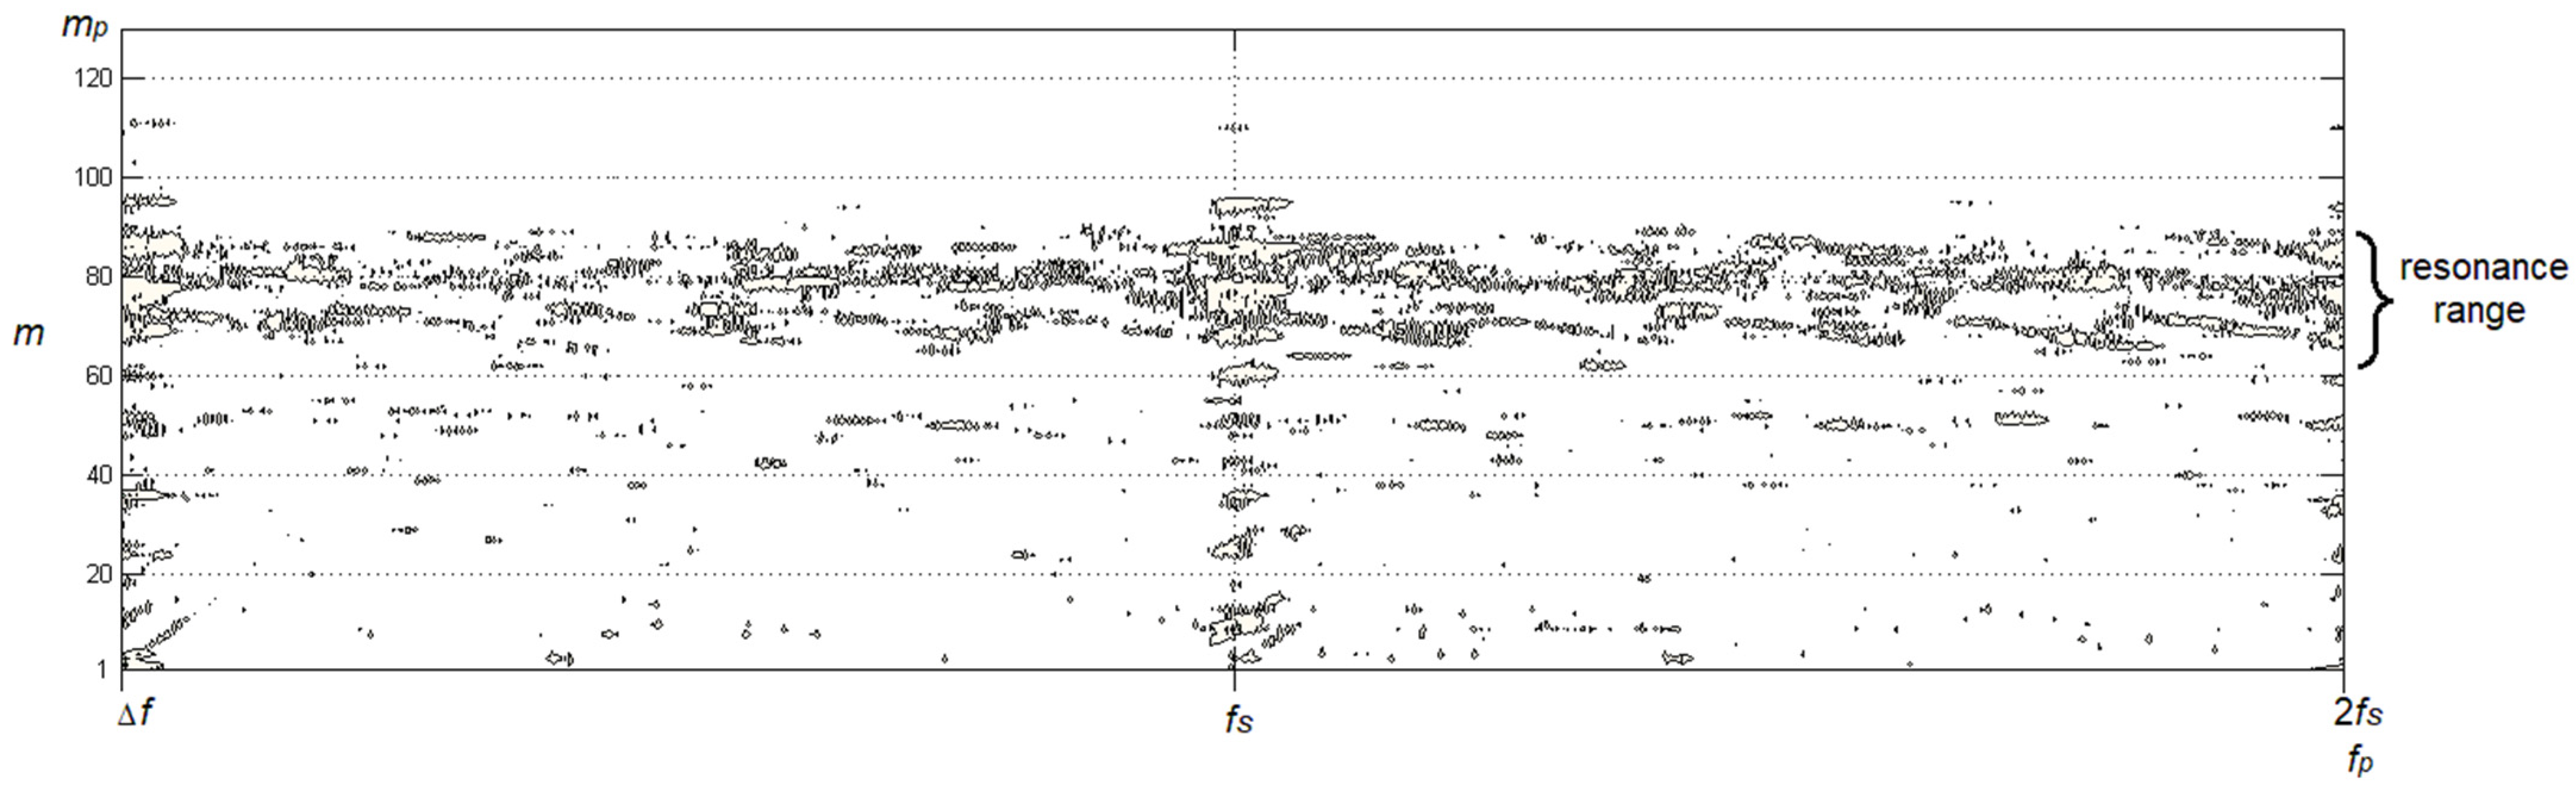
The F-F image (Figure 2) created with the characteristic frequency equal to the double rotor revolution frequency fP = 2fs reveals subtle details of the vibration process. Such a selection of the characteristic frequency enables the assessment of the vibration state caused by the fundamental and odd and even harmonics of the radial forces. Noticeable vertical patterns (indexed by rotational frequency) represent the vibration induced by the toothed structure of the rotating rotor. Random vibrations without any regular pattern that appear in the resonance area are imposed over noticeable vertical patterns.
The reference pattern connected with the toothed structure of the rotating rotor is created based on the analytical model of radial forces in which Equation (4) (and in consequence, Equation (3)) is presented in the form of a harmonic series:
where:
- Λ0, constant air gap conductivity;
- Λmλ, amplitude of air gap conductivity frequency component mλ;
- mλ = 2n – 1;
- n = 1, 2, 3, …;
- ωs = 2πfs;
- Λmθ, amplitude of resultant flow frequency component mθ;
- mθ = 6n ± 1;
- ω1 = 2πf1;
- f1, electrical machine supply current frequency.
Limiting the highest range of expected vibration frequencies to the few first multiples of zrfs, and the discussed frequency components to ones with the highest amplitudes, the reference F-F image pattern is created by the reduced number of frequency components with frequencies:
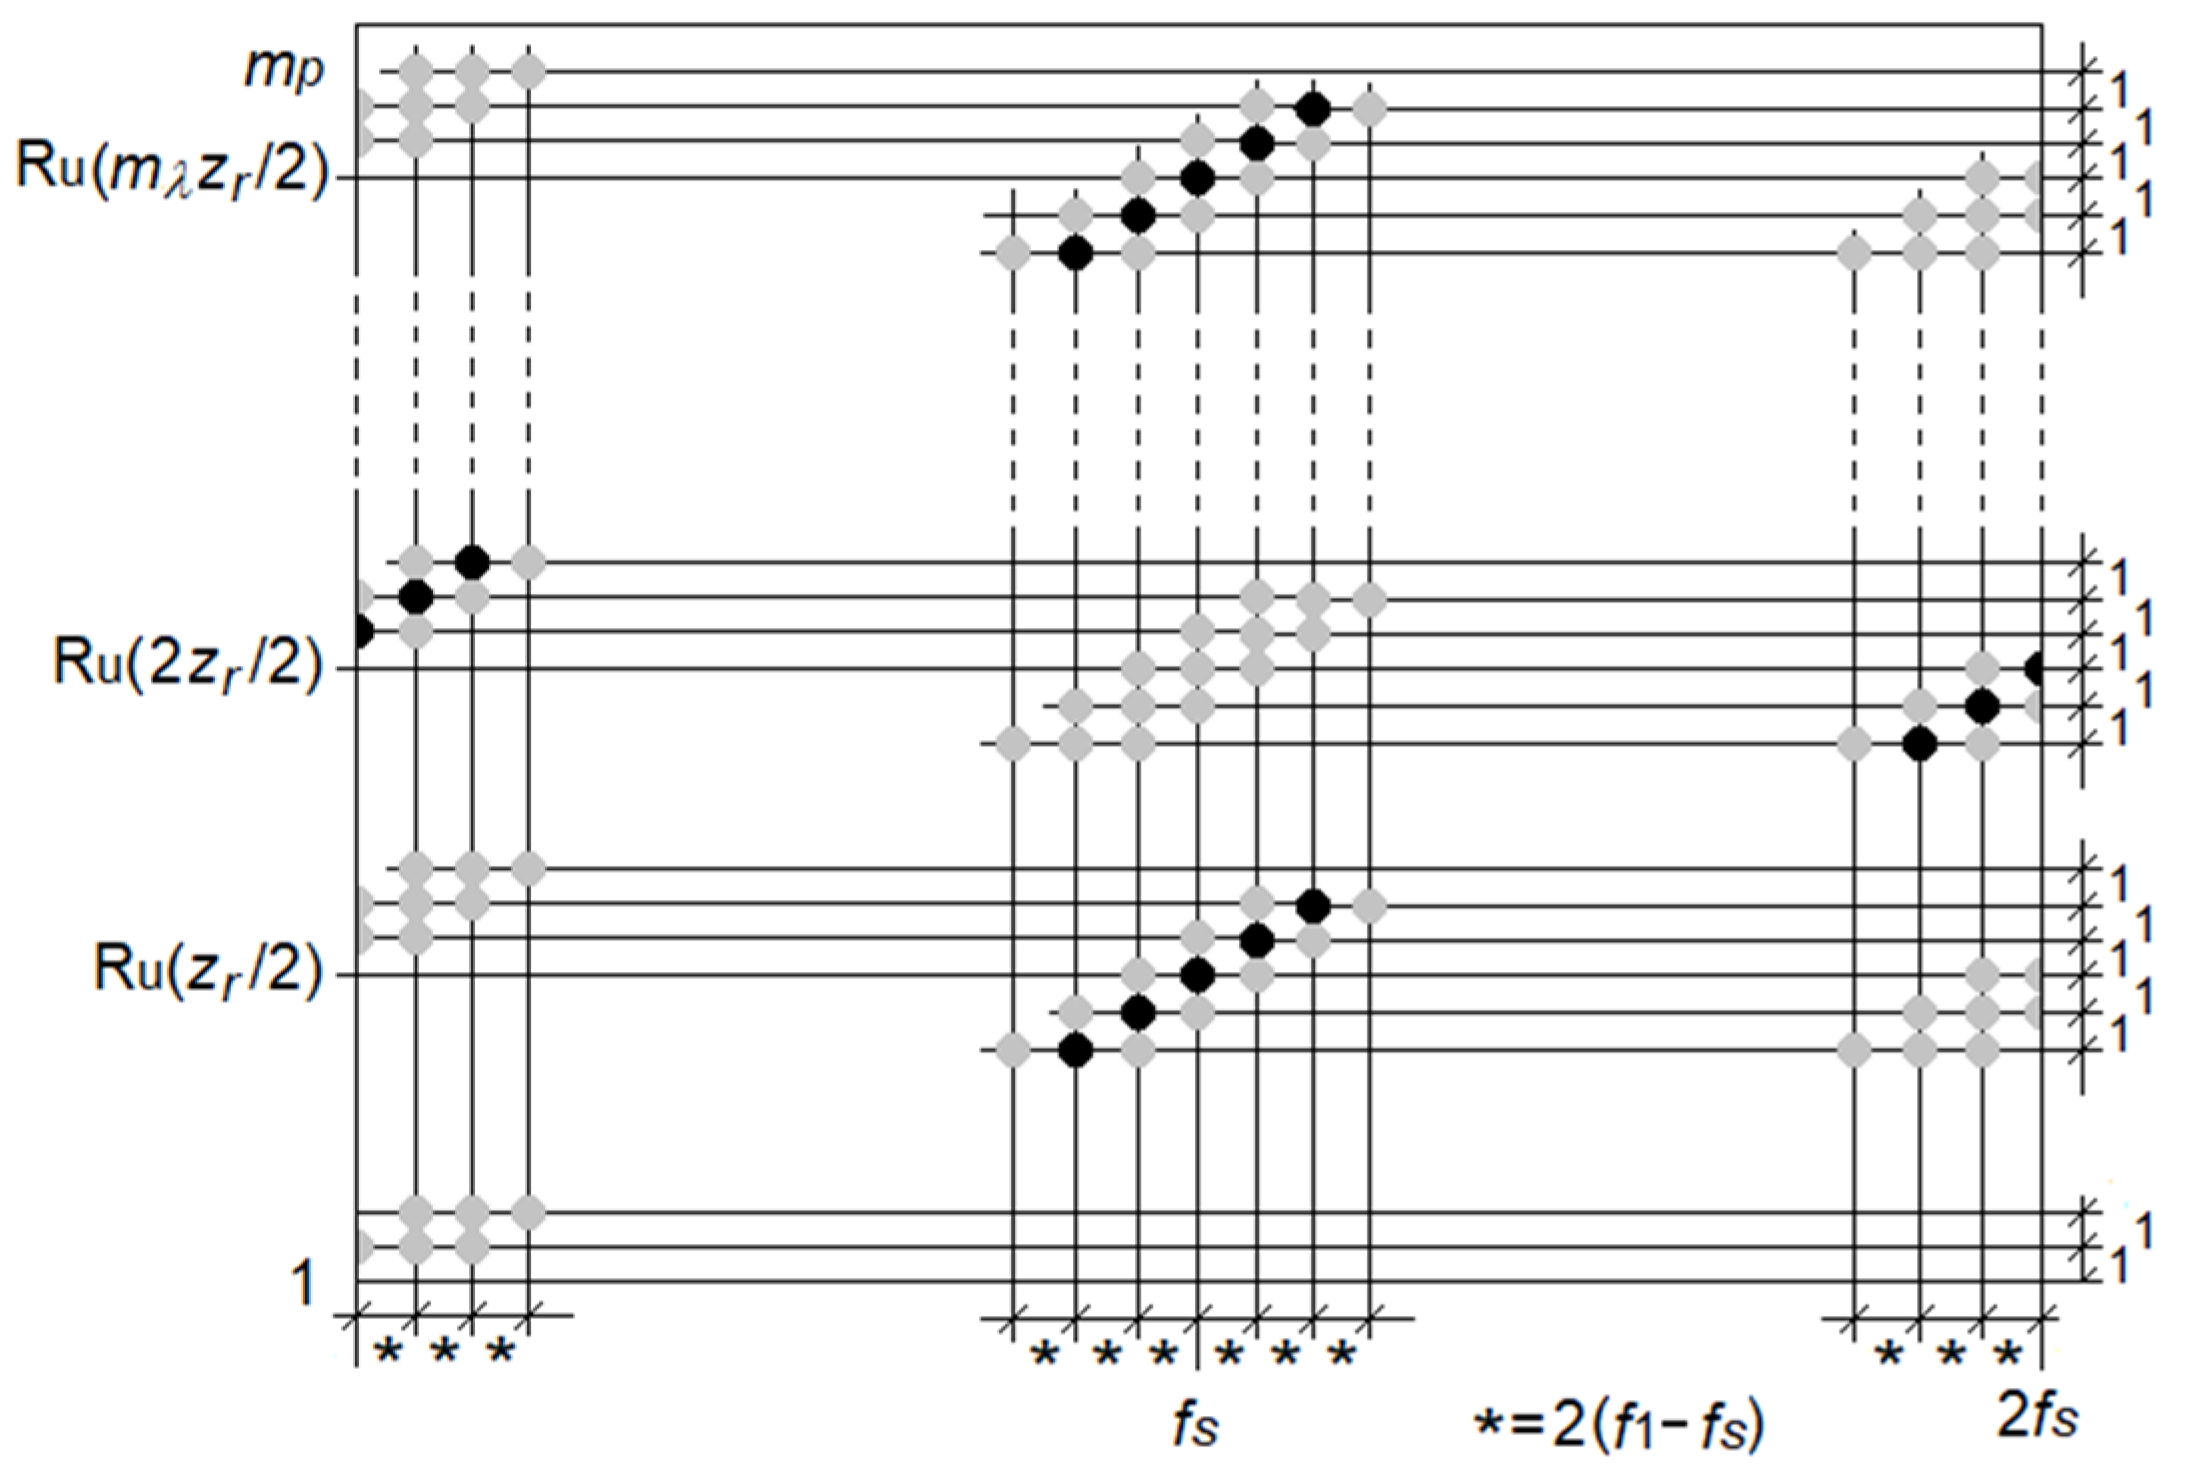
The above relation describes the perfectly symmetrical model from the point of view of mechanical and electrical parts of the three-phase motor. The corresponding reference pattern with a limited number of frequency components is marked with black dots in Figure 3. Extended simulations show that the resultant magnetomotive force and air gap dissymmetry lead to the appearance of additional frequency components, with the sidebands being multiples of 2(f1 − fs) frequency and odd multiples of fs frequency. An exemplary reference pattern with a limited number of sidebands is presented in Figure 3. Sidebands associated with dissymmetry are marked with gray dots. The frequency component position is determined by vertical coordinates (distant by multiples of double slip frequency 2(f1 − fs) around fs and 2fs frequencies) and horizontal coordinates (distant by multiples of 1 around natural number Ru(mλzr/2) where Ru is the rounded up number operation).
It is important to underline that the reference pattern indicates the area of the potential presence of frequency components of real vibration processes.
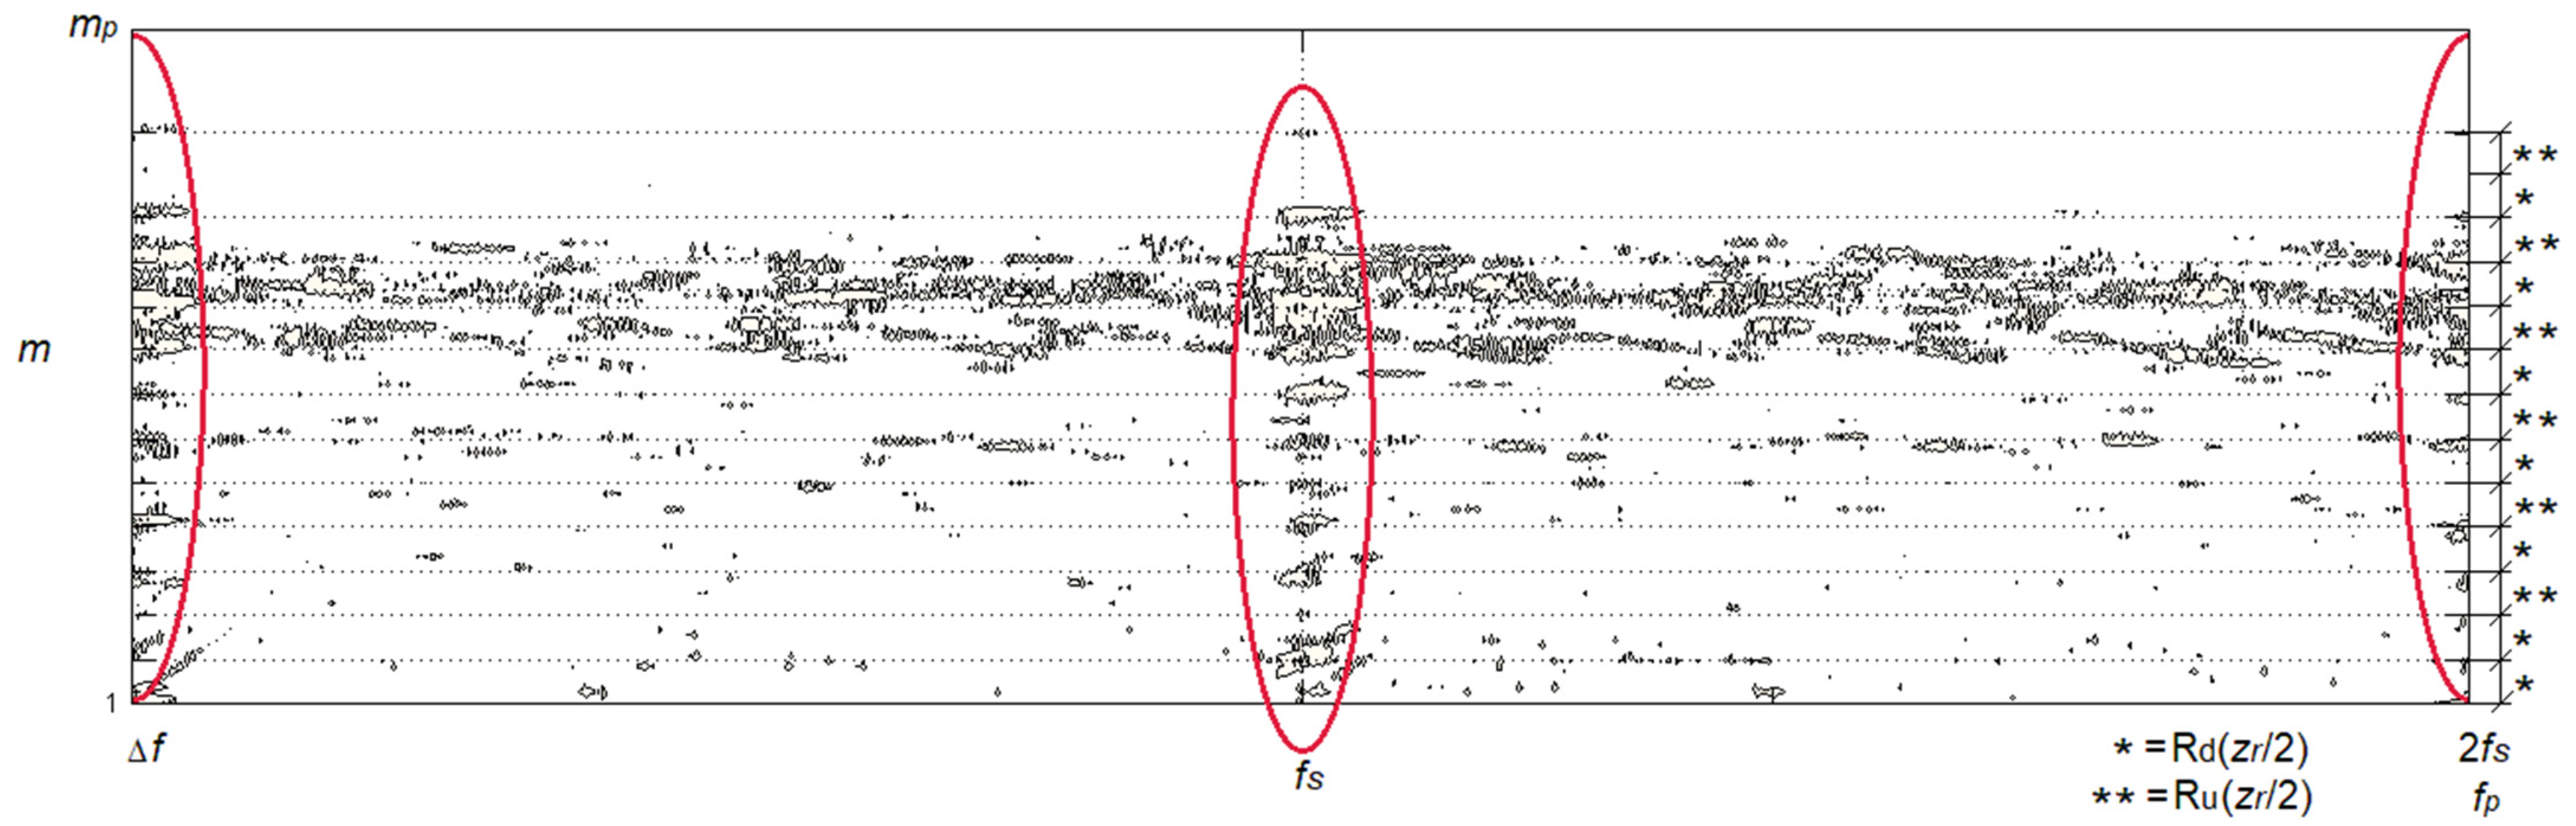
The reference pattern presented in Figure 3 corresponds to the vertical pattern marked by red ovals in Figure 4. This indicates a slightly tested machine dissymmetry. Dissymmetry level can be judged by the amplitude of experimental frequency components that create the discussed pattern.
The enlarged lower-central part of the F-F image from Figure 4 is presented in Figure 5 with marked reference pattern vertical (yellow lines) and central horizontal (dashed lines) coordinates. The difference between the f1 and fs frequencies depends on the load of the tested motor. With an increase in machine load, the fs frequency decreases, and, therefore, the distance between the reference pattern vertical lines is directly linked with load level.
Dissymmetry level can be judged by the amplitude of experimental frequency components that create the discussed pattern.
4.2. Motor with Damaged Bearing Cage
Figure 6 shows the vibrations spectrum of the outer casing of a motor with slight damage to the bearing cage on the drive shaft side. Local damage to the cage means that two of the nine rolling elements are not kept symmetrical to the others. The dominant frequency components are the low frequency range components. The one is a multiple of the frequency fc component. Other significant frequency components are multiples of the rotational frequency fs, but at frequencies higher than in the case of an undamaged machine. This points to the simultaneous presence of vibration processes evoked by radial forces and bearings. Amplitudes of structural resonance range frequency components are now higher, which indicates the presence of mechanical shocks that excite resonance vibrations.
The F-F image with characteristic frequency fP = 2fs (Figure 7) reveals that the vibration process is much more complicated; several separated processes coexist. In addition to the weakly marked vertical pattern related to the toothed rotor frequencies (indexed by rotational frequency), there are much more intense oblique patterns in the area of resonant vibrations. Oblique patterns are caused by irregular rolling of the rolling elements of the bearing along the outer race (patterns tilted to the right) and the inner race (patterns tilted to the left).
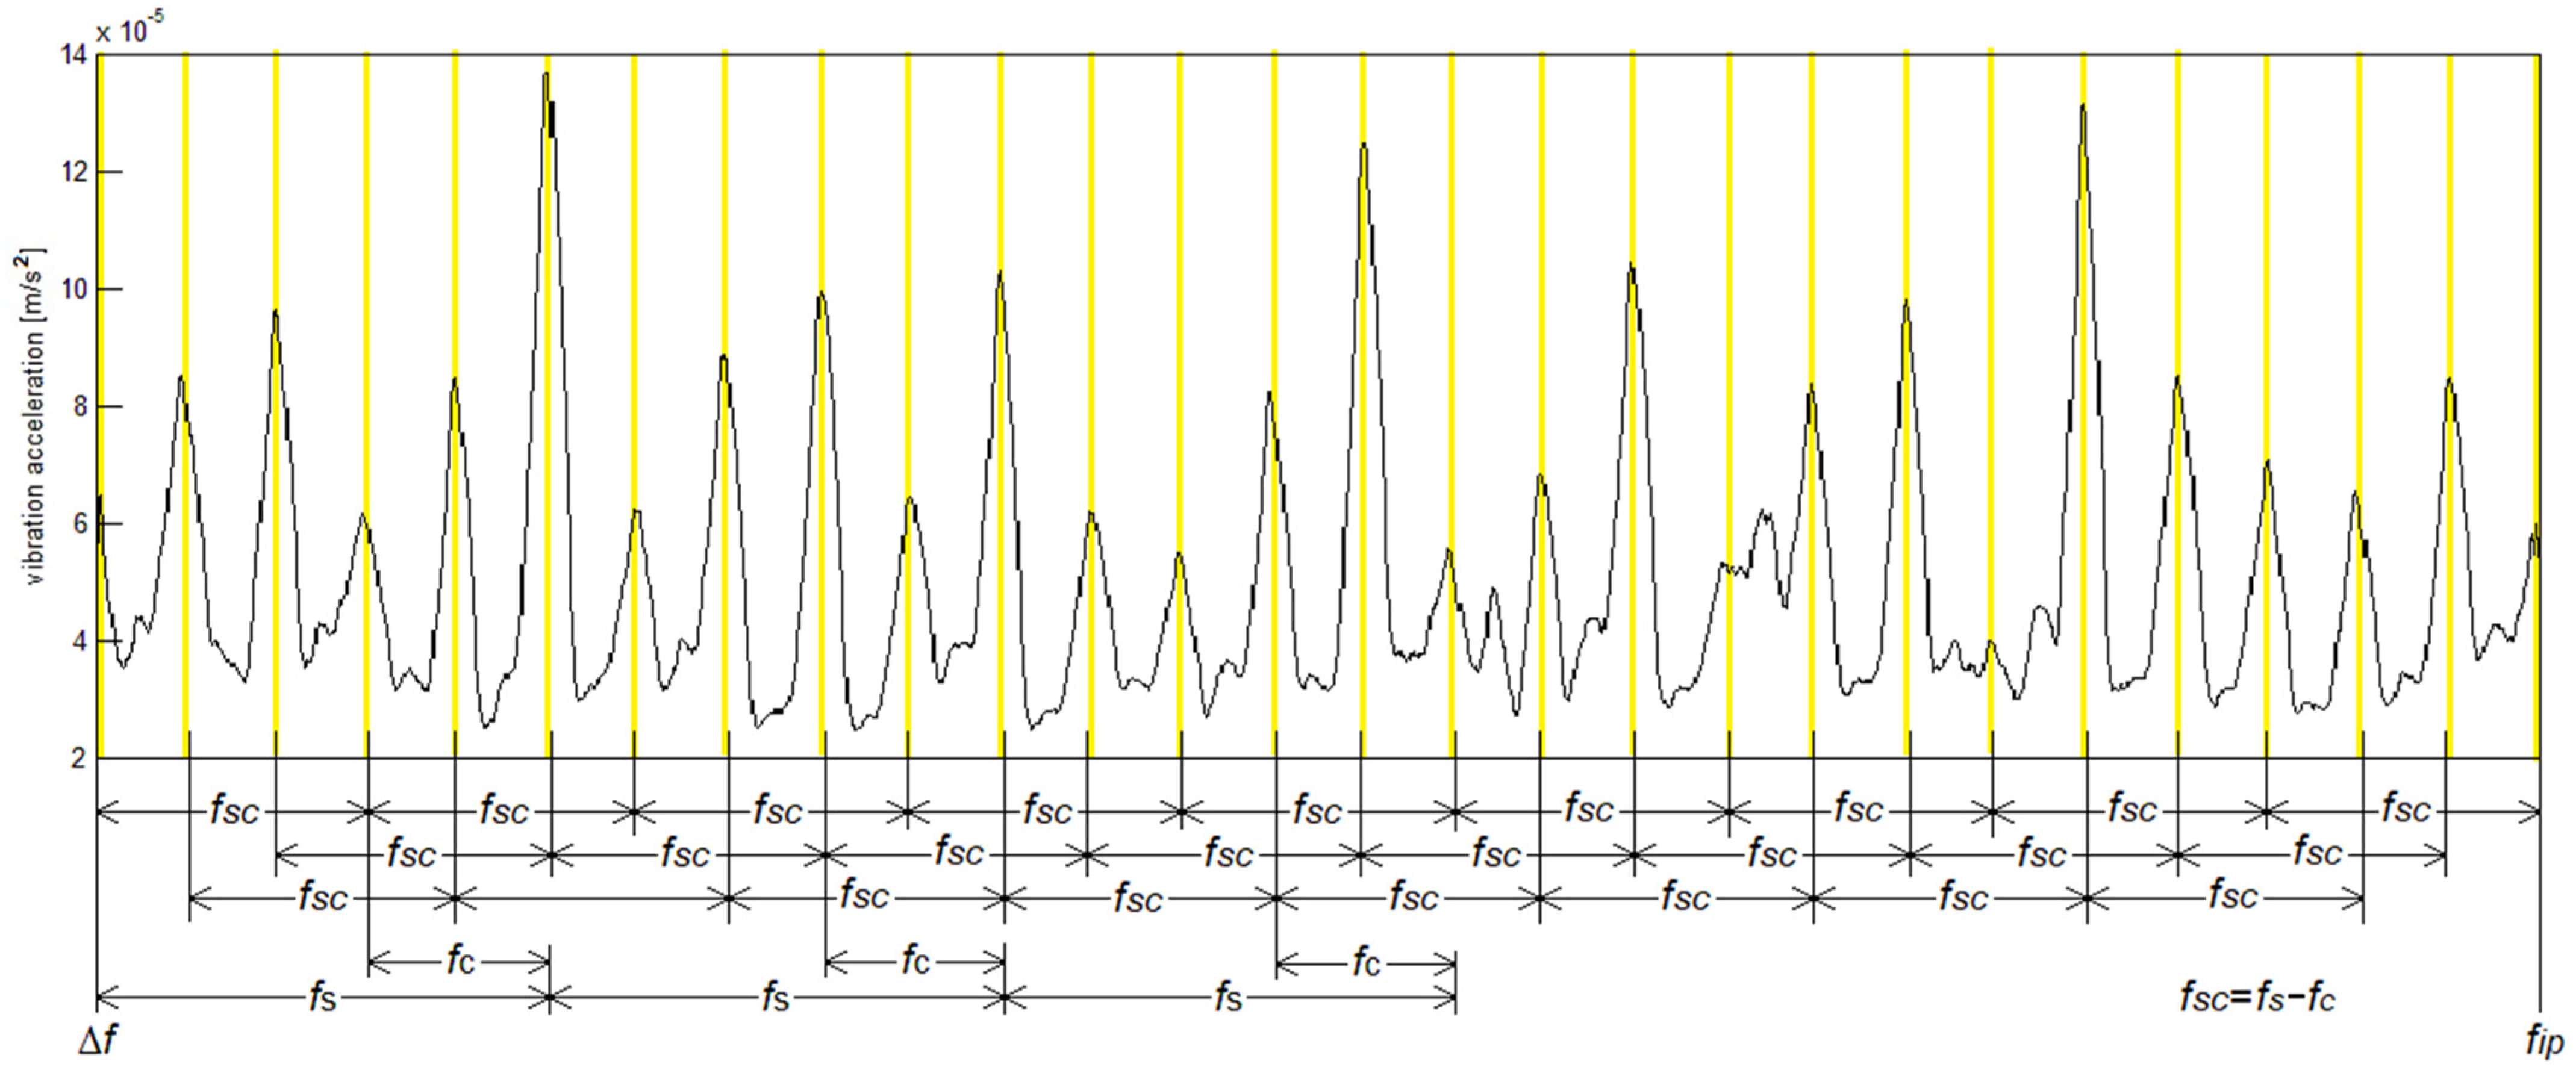
The F-F images with the characteristic frequencies fP = fep (Figure 8) and frequency fP = fip (Figure 9) reveal patterns related to the rolling of the rolling elements along the outer and inner bearing raceways. Vertical patterns present in the sidebands distant by fc and fs–fc frequencies and their higher harmonics from resonance frequencies describe the response of the motor core and outer casing to the mechanical shocks. Broadening and irregularity of vertical patterns point to the partly random process of mechanical shock generation. The strict pattern verticality confirms the commensurability of the mean value of frequencies fc and fep (relation (6)) and the frequencies fs–fc and fep (relation (7)). The reference pattern that characterizes the potential position of the discussed image pattern consists of columns in which the position is denoted by multiple appropriate specific bearing frequencies. In Figure 8 and Figure 9, the reference pattern is marked by vertical yellow lines. In the case of the F-F image presented in Figure 8, vertical patterns associated with the rolling of the rolling element on the external race are masked by diagonal patterns associated with vibration processes generated by the rolling of the rolling element on the internal race. This points to a different path of vibration disturbance propagation to the transducer.
Determination of the characteristic bearing frequencies fep and fip base on the simple bearing model that utilizes the geometry of bearing components offers results that may differ, to some extent, from experimental values.
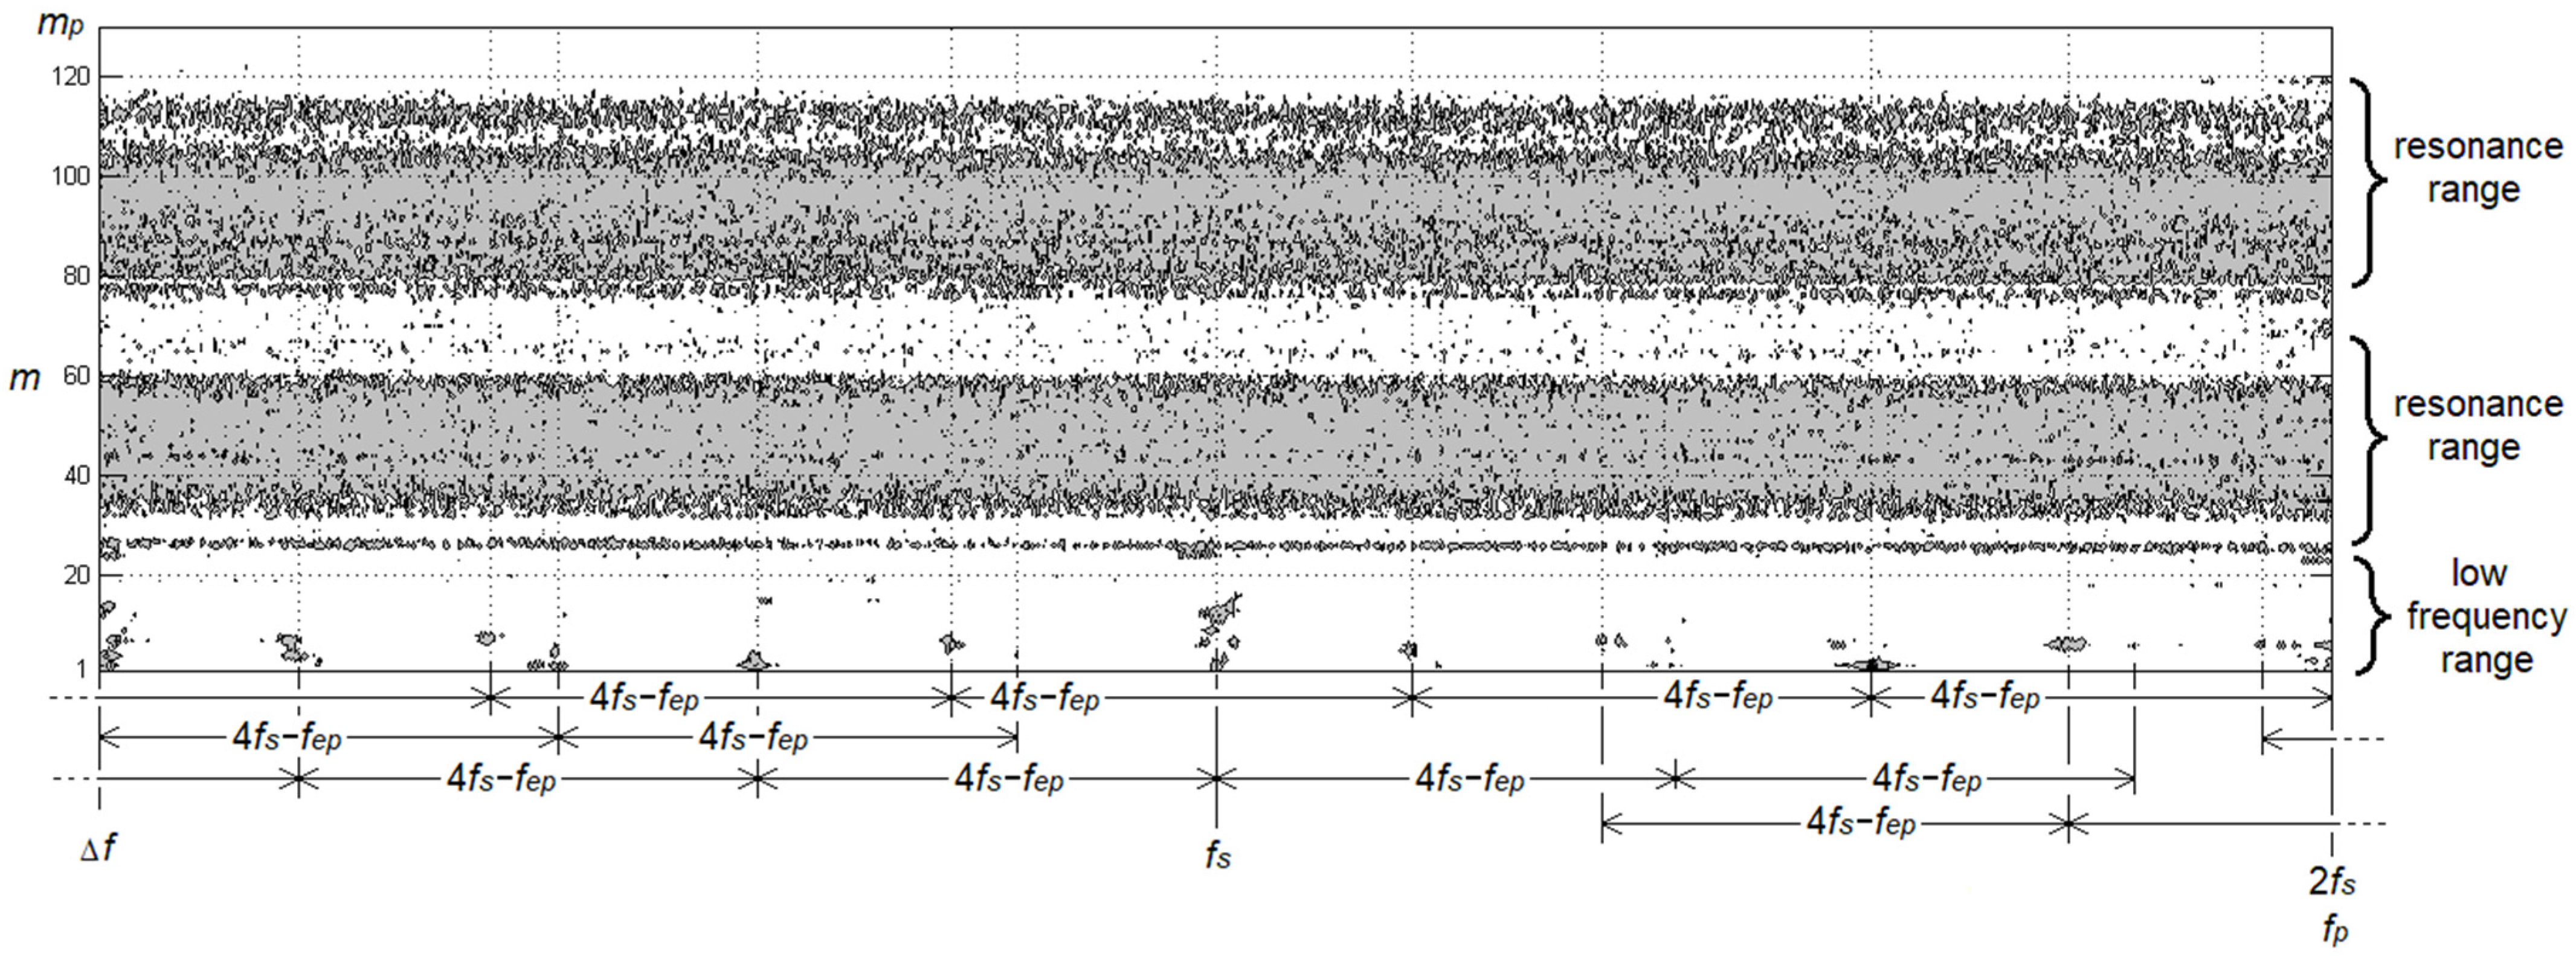
It is interesting that patterns of comparatively equal intensity are present only in the resonance range of the signal spectrum. Figure 10 presents resonance range vertical pattern intensity defined as the mean value of frequency component amplitudes of the consecutive column of array P in the resonance range:
where m1 and m2 are array P lines that limit resonance area, calculated on the basis of the F-F image presented in Figure 9. Intensity similarity is a strong premise of bearing rolling elements' non-uniformity distribution.
The maximum vertical pattern’s horizontal density is identical to the reference pattern position marked in Figure 10 by yellow vertical lines.
4.3. Motor with a Defective Spring That Resets the Bearing Slackness
The spring washer erasing the bearing slack (axial pressure) does not fulfill its task due to the too-deep seating of the bearings in the bearing shields. As a result, there is a play between the rolling elements and the inner and outer raceways. Figure 11 shows the spectrum of vibrations of the motor’s outer casing without pre-compensated bearing clearances. The dominant frequency components are low frequency range components at multiples of the supply voltage frequency f1, rotational frequency fs and bearing frequency fep. In the frequency range 4–6 kHz and 7.5–12 kHz, there are significant resonant vibrations induced by totally random impacts of the rolling elements on the inner and outer rolling surface of the bearing.
The F-F image with characteristic frequency fP = 2fs (Figure 12) reveals the occurrence of the dominating chaotic vibration process in the resonance range. The random nature of the vibrations is evidenced by the lack of any pattern. In the low frequency range, apart of the vertical pattern is indexed by frequencies fs and 2fs related to the toothed rotor frequencies; also, another new frequency component appears.
Frequency components with frequencies feps being a result of the modulation of the rotational frequency fs and its higher harmonics, and the bearing frequency fep and its higher harmonics:
where:
- nep = 1, 2, 3, …, order of the harmonic component of vibrations caused by rolling of the rolling elements along the outer race of the bearing;
- ns = 1, 2, 3, …, order of the harmonic component of the rotor’s rotational frequency;
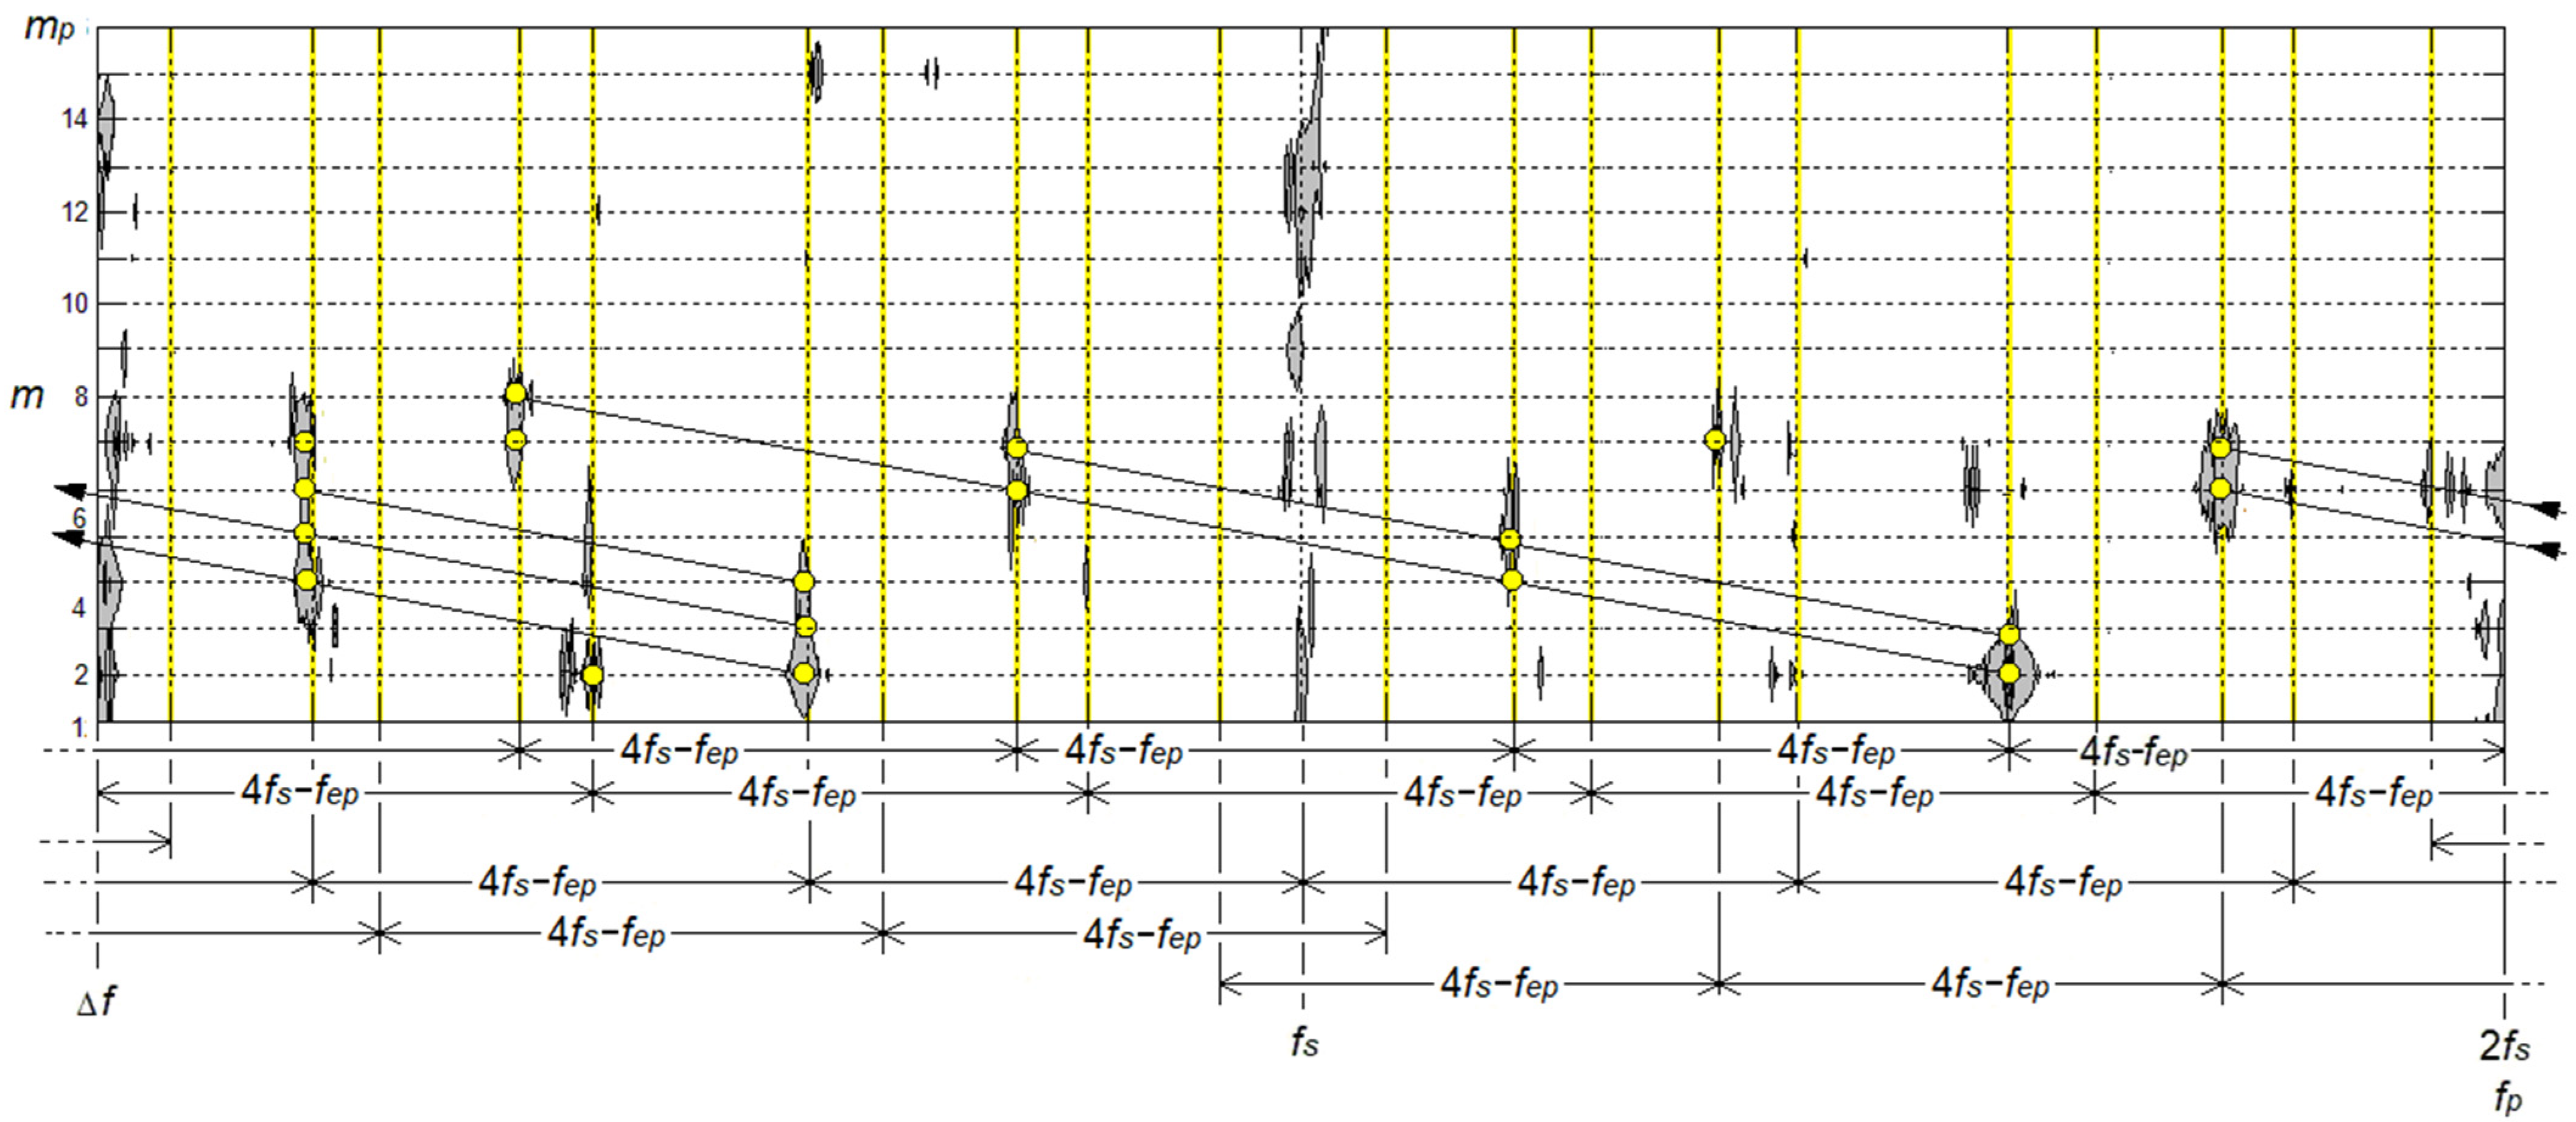
- form the elements of the image pattern that is present in the low frequency range. Identified frequency components and their mutual position on the F-F image reduced to the low frequency range are presented in Figure 13.
The position of identified frequency components, limited to the ones with the highest amplitudes, are marked with yellow dots. Successive elements of the column are distant by the frequency 2fs, while the frequency difference between two frequency components linked by diagonal lines is equal to fep. The frequency distance between two columns containing the abovementioned frequency components takes the value of the smallest difference between fep frequency and multiples of 2fs frequency (in this case, 4fs–fep).
The reference pattern indicates the possible position of the above-discussed frequency components consists of columns with positions denoted by sidebands with frequency 4fs–fep and its multiples around frequency fs and its multiples. The reference pattern is marked by yellow lines. Frequency components occupy only some positions in the reference pattern. They appear only at positions that are coincident with the reference pattern and slant lines linking the frequency components distant by fep frequency. Their distribution is unique to individual electro-mechanical construction.
5. Discussion
The frequency structures of the presented vibration processes show significant differences, despite the fact that two of them are associated with only a relatively low level of failure of the mechanical system. In the case of an efficient machine, the measurement signal is correctly mapped by the reference signal obtained on the basis of a simple model of a vibration signal generated by radial electromagnetic forces; the bearing response is negligible. The occurrence of the above-discussed malfunctions of the mechanical system significantly changes the frequency structure of the measuring signal. The F-F image patterns formed by the frequency components of the measurement signal reveal complicated modulation and signal propagation processes of the vibration disturbance.
The presented F-F pictures have an interesting feature. It is the total or local horizontal symmetry of the position of vertical patterns. Total symmetry occurs when the product of modulation is commensurate with the characteristic frequency fP. Vertical patterns are uniformly distributed, and each forms a symmetry line. This kind of symmetry is visible in the resonance range of F-F images presented in Figure 8 and Figure 9. Local horizontal symmetry occurs when only one modulation agent is commensurate with the characteristic frequency fP. This kind of symmetry is representative of the image patterns generated by radial force-induced vibrations (Figure 2 and Figure 3) and vibrations caused by the impact of rolling elements on the bearing race caused by bearing play (Figure 13). Vertical patterns (or image columns that indicate potential positions of vertical patterns with a limited number of frequency components) show local similarity, horizontal symmetry lines can only be associated with chosen vertical patterns (in the case of image patterns presented in Figure 13 only).
Let the frequency components that form the F-F image constitute a set of features creating a qualitative and quantitative description of the condition of the object-physical phenomena occurring in the diagnosed electro-mechanical system. Under this assumption, the F-F image is identical to the feature space. It should be noted that the above-described selection of the characteristic frequency fP in the process of creating F-F images meets the condition of the optimal separation of features. Experimental F-F image patterns may get the simplest possible shape—the vertical shape (Figure 8 and Figure 9)—or uniform vertically distributed image pattern elements (Figure 4).
Identification of a given set of features (equivalent to identification of the common area of occurrence of a given reference image pattern and experimental pattern) can be treated as a specific filter to perform image segmentation that is equivalent to distinguishing those elements of the F-F image that carry information about the specific state of a given electro-mechanical system. An example of the separation of features is shown in Figure 5, Figure 8, Figure 9 and Figure 13. Introducing measures of the intensity level of the features related to a given object’s condition (for example, in the form of determination of vertical pattern intensity described by relation (10)) enables a qualitative and quantitative description of the condition of the diagnosed object.
6. Conclusions
In this paper, an alternate approach to electro-mechanical system technical condition assessment is proposed. The full vibration spectrum is converted to an image, and the presence of characteristic patterns created by frequency components is analyzed. In this paper, the analyzed vibration process images show significant differences despite the fact that they are associated with only a relatively low level of dysfunction in the mechanical system. Thus, F-F image patterns show unique individuality depending on the analyzed electro-mechanical system operating conditions and show high levels of sensitivity. Assessment of technical conditions relies on the identification of characteristic patterns by comparison with reference patterns assuming the adoption of a specific characteristic frequency of an F-F image (characteristic frequency is directly linked with the fundamental frequency of the searched disturbance). Reference patterns created on the basis of analytical calculations determine the area of the potential appearance of experimental patterns that indicate a particular vibration process. Vibration origin is identified by the presence of experimental pattern frequency components in the area (or area proximity) indicated by the reference pattern. Frequency components of properly identified vibration processes occupy defined columns of the F-F image. The discussed approach to vibration origin identification allows one to overcome the problem of the simultaneous presence of several separate vibration disturbances originated in different nodes of electro-mechanical systems by the maximum possible separation of their characteristic patterns.
Funding
This research received no external funding.
Institutional Review Board Statement
Not applicable.
Informed Consent Statement
Not applicable.
Conflicts of Interest
The authors declare no conflict of interest.
References
- Vas, P. Parameter Estimation, Condition Monitoring and Diagnosis of Electrical Machines; Clarendon Press: Oxford, UK, 1993. [Google Scholar]
- Mechefske, C.K. Objective Machinery Fault Diagnosis Using Fuzzy Logic. Mech. Syst. Signal Process. 1998, 12, 855–862. [Google Scholar] [CrossRef]
- Kurek, J.; Osowski, S. Support Vector Machine for Fault Diagnosis of the Broken rotor Bars of Squirrel-Cage Induction Motor. Neural Comput. Appl. 2010, 19, 557–567. [Google Scholar] [CrossRef]
- Henao, H.; Capolino, G.A.; Fernandez-Cabanas, M.; Filippetti, F.; Bruzzese, C.; Strangas, E.; Pusca, R.; Estima, J.; Riera-Guasp, M.; Hedayati-Kia, S. Trends in Fault Diagnosis for Electrical Machines. A Review of Diagnostic Techniques. IEEE Ind. Electron. Mag. 2014, 8, 31–42. [Google Scholar] [CrossRef]
- Lindh, T.; Ahola, J.; Partanen, J. Bearing Monitoring of Electrical Motors and Poverline Communications in Low Voltage Industrial Distribution Networks; Tutkimusraportti/Research report 16, TESLA-raportti 79/2002; Lappeenranta University of Technology, Department of Electrical Engineering: Lappeenranta, Finland, 2002. [Google Scholar]
- Biernat, A. Coil-turn short-circuit of PMSM influence on the transformed phase voltage frequency pattern. Przegląd Elektrotechniczny 2017, 2, 5–9. [Google Scholar] [CrossRef] [Green Version]
- Karimi, H.R. Vibration Control and Actuation of Large-Scale Systems; Emerging Methodologies and Applications in Modeling, Identification and Control; Elsevier: Amsterdam, The Netherlands, 2020. [Google Scholar]
- Couturier, C.; Cassoret, B.; Witczak, P.; Brudny, J.F. A Contribution to the Study of Induction Machine Stator Resonance Frequencies. In Recent Developments of Electrical Drives; Springer: Dordrecht, The Netherlands, 2006; pp. 485–489. [Google Scholar]
- Heller, B.; Hamata, V. Harmonic Field Effects in Induction Machines; ACADEMIA, Czechoslovak Academy of Science: Prague, Czech Republic, 1977. [Google Scholar]
- Biernat, A.; Jackiewicz, K.; Bieńkowski, K. Analysis of Radial Vibrations Frequency Structure of Variable Reluctance Generator. In Proceedings of the 2018 International Symposium on Electrical Machines (SME), Andrychow, Poland, 10–13 June 2018; IEEE: Piscataway, NJ, USA, 2018; pp. 1–6, ISBN 978-1-5386-5210-7/18. [Google Scholar]
- Eschmann, P.; Hasbargen, L.; Weigand, K. Ball and Roller Bearings—Theory, Design and Application; John Wiley and Sons: Hoboken, NJ, USA, 1985. [Google Scholar]
- Harris, T.A. Rolling Bearing Analysis; John Wiley and Sons: New York, NY, USA, 1966. [Google Scholar]
- James, I.T. The Vibration Analysis Handbook—A Practical Guide for Solving Rotating Machinery Problems; Engineering Resources: Fort Wayne, IN, USA, 2019. [Google Scholar]
- Nandi, S.; Ahmed, S.; Toliyat, H.A. Detection of rotor slot and other eccentricity related harmonics in a three phase induction motor with different rotor cages. IEEE Trans. Energy Convers. 2015, 16, 253–260. [Google Scholar] [CrossRef]
Figure 1.
Frequency spectrum of vibration acceleration of the outer casing of a healthy motor. The dominant frequency component of vibrations is marked.
Figure 1.
Frequency spectrum of vibration acceleration of the outer casing of a healthy motor. The dominant frequency component of vibrations is marked.

Figure 2.
F-F image of the frequency spectrum of the vibration acceleration of the outer casing of a healthy motor (fP = 2fs).
Figure 2.
F-F image of the frequency spectrum of the vibration acceleration of the outer casing of a healthy motor (fP = 2fs).

Figure 3.
Reference F-F image pattern associated with toothed rotor structure origin radial force of electrical machine with air gap and flow dissymmetry.
Figure 3.
Reference F-F image pattern associated with toothed rotor structure origin radial force of electrical machine with air gap and flow dissymmetry.

Figure 4.
F-F image of the frequency spectrum of the vibration acceleration of the outer casing of a healthy motor with marked reference-like pattern associated with rotor grove-tooth frequency. Rd is the rounded down and Ru is the rounded up number operation.
Figure 4.
F-F image of the frequency spectrum of the vibration acceleration of the outer casing of a healthy motor with marked reference-like pattern associated with rotor grove-tooth frequency. Rd is the rounded down and Ru is the rounded up number operation.

Figure 5.
Enlarged central part of F-F image of the frequency spectrum of a healthy motor’s outer casing vibration acceleration (fP = 2fs), with marked reference pattern horizontal and vertical coordinates.
Figure 5.
Enlarged central part of F-F image of the frequency spectrum of a healthy motor’s outer casing vibration acceleration (fP = 2fs), with marked reference pattern horizontal and vertical coordinates.

Figure 6.
Frequency spectrum of vibration acceleration of the outer casing of the motor with a damaged bearing cage. The dominant frequency components of vibrations are marked.
Figure 6.
Frequency spectrum of vibration acceleration of the outer casing of the motor with a damaged bearing cage. The dominant frequency components of vibrations are marked.

Figure 7.
F-F image of the frequency spectrum of the vibration acceleration of the motor’s outer casing with a damaged bearing cage (fP = 2fs). The positions of the new diagonal patterns are marked with arrows.
Figure 7.
F-F image of the frequency spectrum of the vibration acceleration of the motor’s outer casing with a damaged bearing cage (fP = 2fs). The positions of the new diagonal patterns are marked with arrows.

Figure 8.
F-F image of the frequency spectrum of the vibration acceleration of the motor’s outer casing with a damaged bearing cage (fP = fep).
Figure 8.
F-F image of the frequency spectrum of the vibration acceleration of the motor’s outer casing with a damaged bearing cage (fP = fep).

Figure 9.
F-F image of the frequency spectrum of the vibration acceleration of the motor’s outer casing with a damaged bearing cage (fP = fip).
Figure 9.
F-F image of the frequency spectrum of the vibration acceleration of the motor’s outer casing with a damaged bearing cage (fP = fip).

Figure 10.
Resonance range vertical pattern intensity of F-F image presented in Figure 9.
Figure 10.
Resonance range vertical pattern intensity of F-F image presented in Figure 9.

Figure 11.
Frequency spectrum of vibration acceleration of the outer casing of the motor with a bearing slackness. The dominant frequency components of vibrations are marked.
Figure 11.
Frequency spectrum of vibration acceleration of the outer casing of the motor with a bearing slackness. The dominant frequency components of vibrations are marked.

Figure 12.
F-F image of the frequency spectrum of the vibration acceleration of the motor’s outer casing with the bearing slackness (fP = 2fs).
Figure 12.
F-F image of the frequency spectrum of the vibration acceleration of the motor’s outer casing with the bearing slackness (fP = 2fs).

Figure 13.
F-F image of the frequency spectrum of the vibration acceleration of the motor’s outer casing with the bearing slackness (fP = 2fs) reduced to the low frequency range.
Figure 13.
F-F image of the frequency spectrum of the vibration acceleration of the motor’s outer casing with the bearing slackness (fP = 2fs) reduced to the low frequency range.

Publisher’s Note: MDPI stays neutral with regard to jurisdictional claims in published maps and institutional affiliations. |
© 2022 by the author. Licensee MDPI, Basel, Switzerland. This article is an open access article distributed under the terms and conditions of the Creative Commons Attribution (CC BY) license (https://creativecommons.org/licenses/by/4.0/).
Share and Cite
MDPI and ACS Style
Biernat, A. Application of the Signal Spectrum-Based Image Pattern Recognition in the Vibration Process Analysis. Appl. Sci. 2022, 12, 5160. https://0-doi-org.brum.beds.ac.uk/10.3390/app12105160
AMA Style
Biernat A. Application of the Signal Spectrum-Based Image Pattern Recognition in the Vibration Process Analysis. Applied Sciences. 2022; 12(10):5160. https://0-doi-org.brum.beds.ac.uk/10.3390/app12105160
Chicago/Turabian StyleBiernat, Adam. 2022. "Application of the Signal Spectrum-Based Image Pattern Recognition in the Vibration Process Analysis" Applied Sciences 12, no. 10: 5160. https://0-doi-org.brum.beds.ac.uk/10.3390/app12105160
Note that from the first issue of 2016, this journal uses article numbers instead of page numbers. See further details here.