Article

Investigation of Tip Leakage Vortex Structure and Trajectory in a Centrifugal Pump with a New Omega Vortex Identification Method

1
Chn Energy Dadu River Repair & Installation Co., Ltd., Leshan 614900, China
2
State Key Laboratory of Eco-hydraulics in Northwest Arid Region of China, Institute of Water Resources and Hydro-electric Engineering, Xi’an University of Technology, Xi’an 710048, China
*
Author to whom correspondence should be addressed.
Submission received: 27 April 2022 / Revised: 17 May 2022 / Accepted: 20 May 2022 / Published: 23 May 2022

Abstract

:
Semi-open centrifugal pumps are widely used in various fields. However, the tip leakage vortex (TLV) has a malign effect on the impeller flow field. The structure and trajectory of a TLV under different discharge conditions were simulated and are discussed herein. Then, the characteristics of the TLV were analyzed using a new omega vortex identification method. The external characteristic and pressure fluctuation of the simulation and experiment were consistent. A secondary leakage vortex near the blade outlet was formed under the high-discharge condition. A leading-edge overflow phenomenon under the low-discharge condition and led to the formation of a reverse-flow vortex. The interface between the main flow and tip leakage flow moved toward the impeller upstream with decreased discharge. As a result, the peak of the entropy production curve moved upstream, and leading-edge overflow and reverse flow occurred. The tip leakage flow changed the blade pressure distribution, resulting in a decrease in the blade load.

1. Introduction

Centrifugal pumps are important equipment in fluid-conveying systems and the main energy consumption component of industrial production [1]. The pressure difference causes the formation of tip leakage flow in a semi-open centrifugal pump. Thus, the energy performance and stability of the pump decrease [2,3,4].
Vortex, as a basic flow pattern, is defined as a region with concentrated vorticity. The location of a vortex can be determined by identifying the core of the vortex. The Q and λ2 criteria are widely used in rotating machinery [5,6,7]. However, these two vortex identification methods have some limitations. The results are significantly influenced by the selection of critical values. Thus, a new omega method to identify the vortex was proposed in [8]. The coefficient R was raised by defining a ratio between the vortical vorticity and total vorticity. The vortex can be identified in different conditions when R is equal to 0.52. Zhang et al. [9,10] compared and analyzed the Q and omega criteria and found that the omega criterion has striking advantages. The omega criterion can identify vortices with different intensities. This theory has been adopted to analyze the flow characteristics of pump turbines [11].
Tip leakage flow generated in the tip region is complex and includes separation vortex, leakage vortex, and secondary flows. It leads to an increase in the internal flow-field instabilities and a decline in pump performance. Jia et al. [12] investigated the centrifugal impeller and reported that tip leakage flow caused by tip clearance could increase flow loss, thereby causing head and efficiency degradation. However, the hump effect was improved when the clearance was increased. Boitel et al. [13] and Cui et al. [14] reached the same conclusion. The influence of tip clearance on the external characteristics of the pump is also related to the operating conditions. Farid et al. [15] reported that the decline in pump head and efficiency under low-discharge conditions is remarkably smaller than that under high-flow conditions. However, He et al. [16] studied a centrifugal compressor and drew different conclusions. The smaller the flow coefficient, the faster the decrease in pressure when the tip size is the same.
TLV has two distinct characteristics, namely the unsteadiness of trajectory and the complexity of the motion mechanism. Yang et al. [17] found that the static pressure at 90% span presents unsteady characteristics, which lead to a change in leakage vortex and a periodic shedding of the wake vortex. Zhao et al. [18] found that the period of unsteady flow is approximately half of the passage frequency of blades. Wu et al. [19] investigated the connection between the stall and leakage vortex of an axial compressor. The leakage vortex trajectory flowed to the pressure surface with a decrease in discharge. A leading-edge overflow was formed, and tip stall was induced when the leakage vortex trajectory reached the leading edge of the adjacent blade. Zhang et al. [20] reported the same conclusion in their study of a centrifugal compressor. Lu et al. [21] studied tip leakage flow in a centrifugal pump and argued that the low-pressure region near the blade tip changes periodically. As a result, a low-frequency vibration was developed. Furthermore, the TLV increased the amplitude of pressure fluctuation [22,23,24].
To better understand the TLV trajectory, Chen et al. [25] first proposed the linear law of the leakage vortex trajectory of an axial compressor by decomposing the three-dimensional flow field. The angle between the leakage vortex trajectory and the blade skeleton line was assumed to be a function of the impeller inlet velocity and blade load. The coefficient k in the function was confirmed to be equal to 0.46 through experimentation. However, Matzgeller et al. [26] investigated a subsonic axial compressor and summarized that coefficient k was affected by the boundary condition of the clearance layer. Zhao et al. [27] improved Chen’s model by describing the leakage vortex trajectory of a centrifugal compressor and found that k was related to the dimensionless coefficient h/b, which is the ratio of clearance height to blade width. Moreover, they summarized the piecewise function of k and h/b.
In summary, tip clearance leads to performance degradation of fluid machinery on the one hand, especially when the operation deviates from the optimal condition. The induced unsteady flows compromise the safe operation and stability of the system. On the other hand, research on the leakage vortex of centrifugal pumps is relatively rare. In addition, traditional vortex identification methods are subject to some limitations. Therefore, a new omega vortex identification method was used in the present research to analyze the tip leakage flow in a centrifugal pump. The characteristics of the vortex structure under different discharge conditions were clarified. Then, the formation and development mechanisms of the TLV were revealed by analyzing the absolute flow angle, entropy production, and blade load. Finally, the effect of discharge on the TLV trajectory is summarized. The research results provide a reference for the design and operation of centrifugal pumps.

2. Computational Model and Method

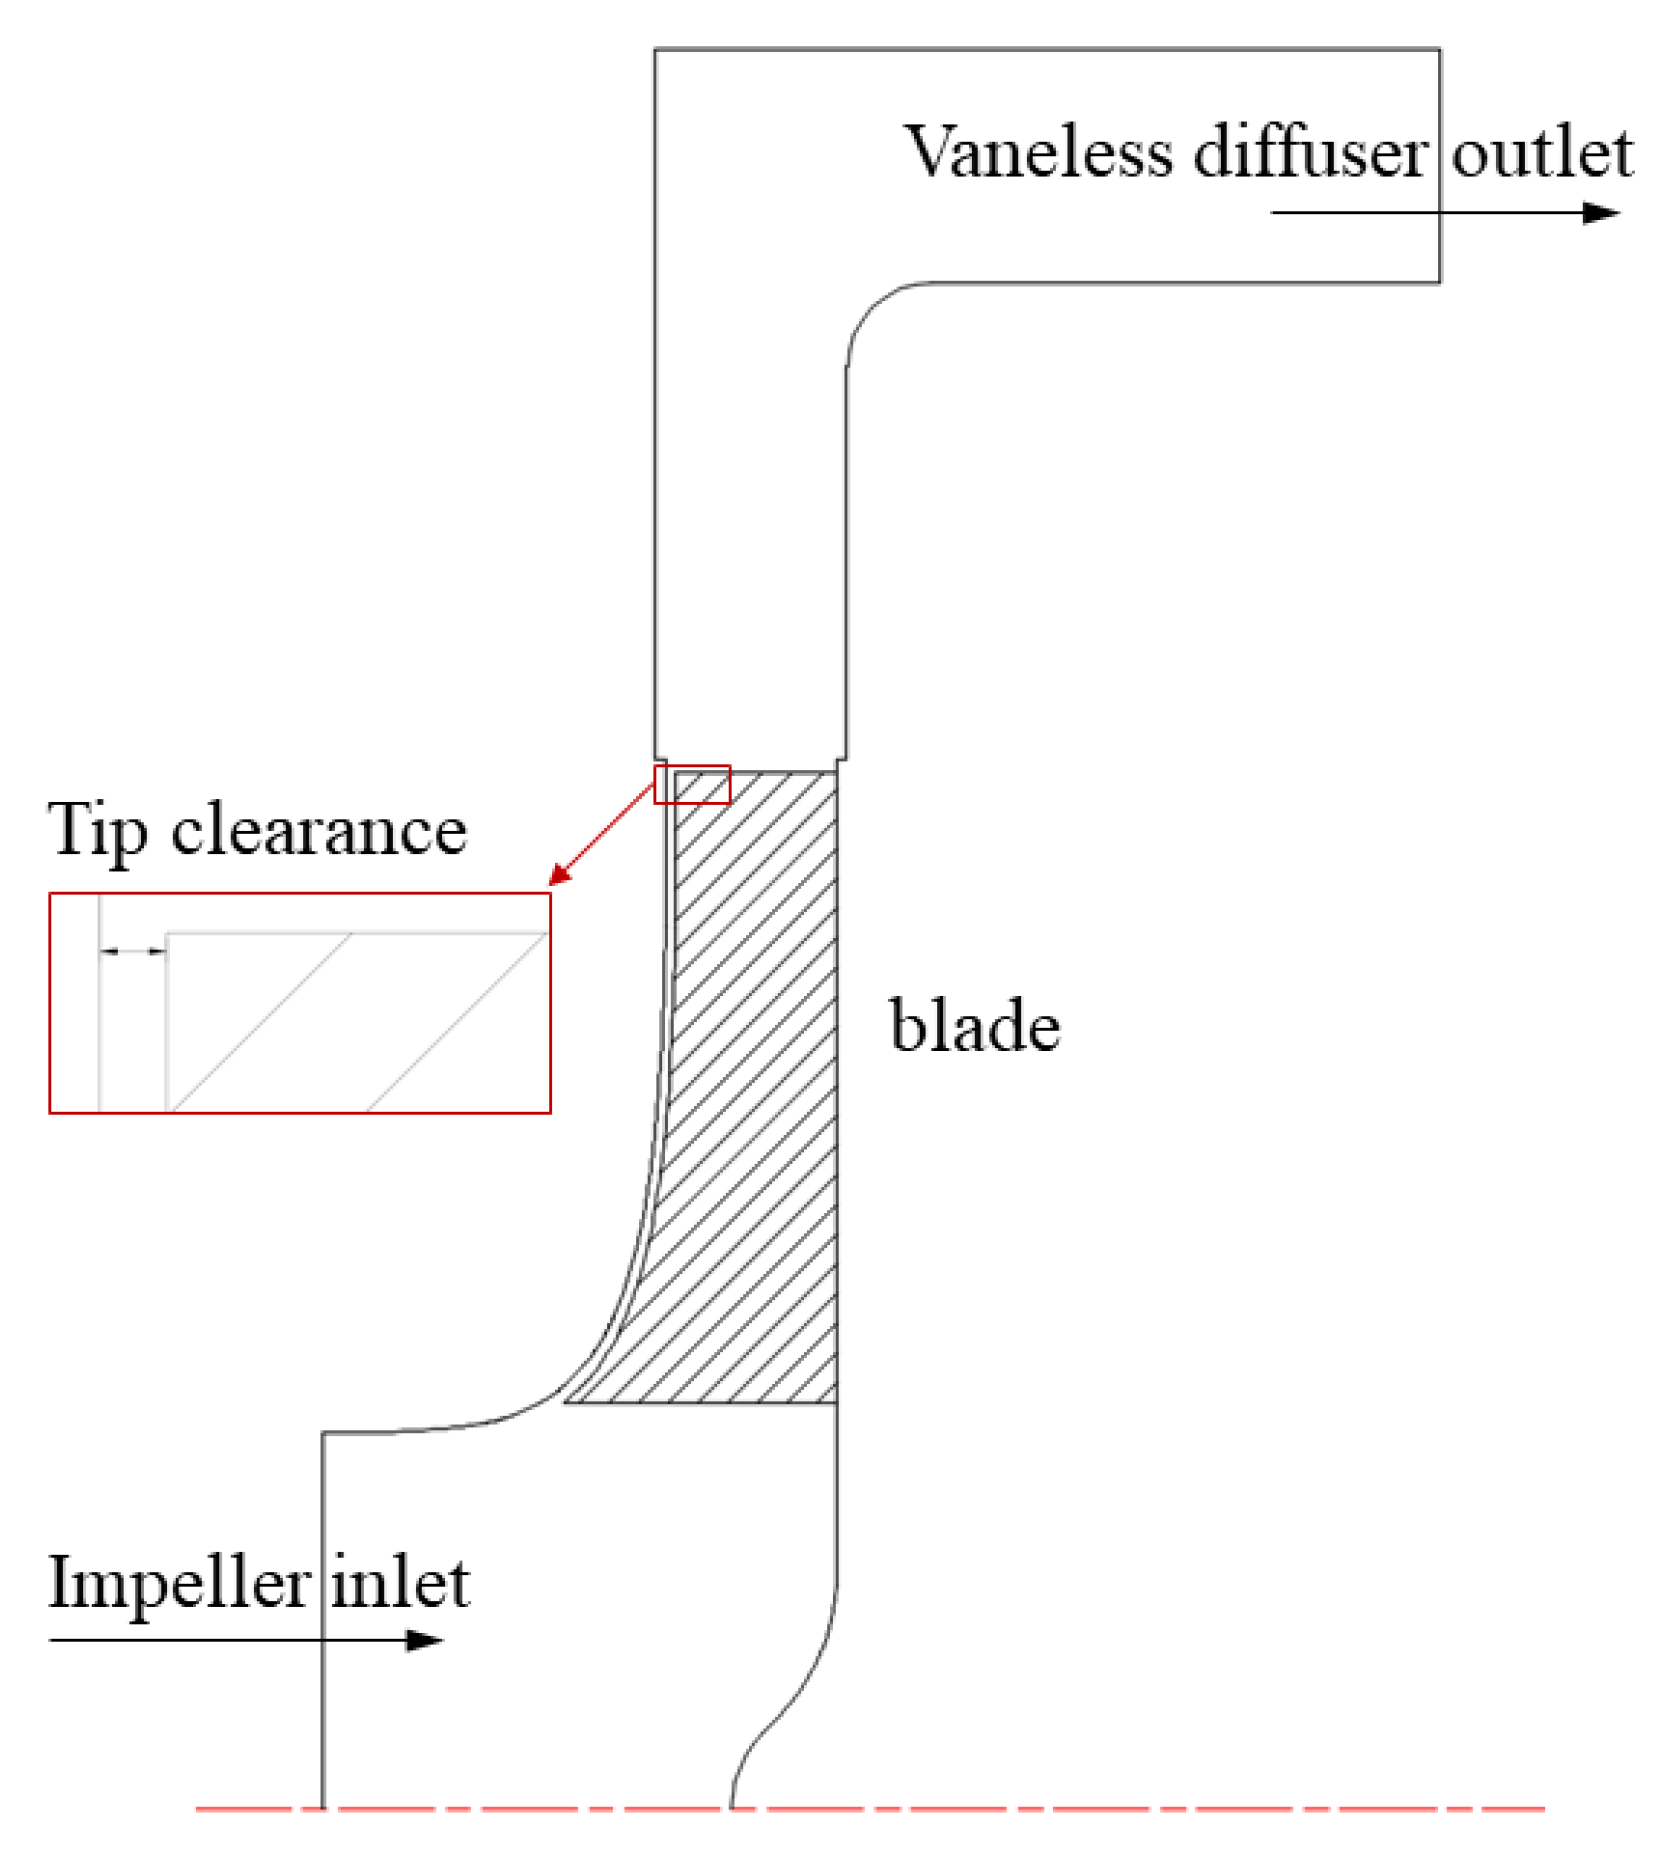
2.1. Specifications of the Pump

A semi-open centrifugal pump was designed. Figure 1 shows the main components of the model pump. The tip clearance remained unchanged from impeller inlet to outlet, both of which measured 1 mm, as shown in Figure 2. The head and discharge of design point are 7 m and 0.013 m3/s; the rotating speed is 980 r/min. Water at 25 °C was selected as the flow medium.

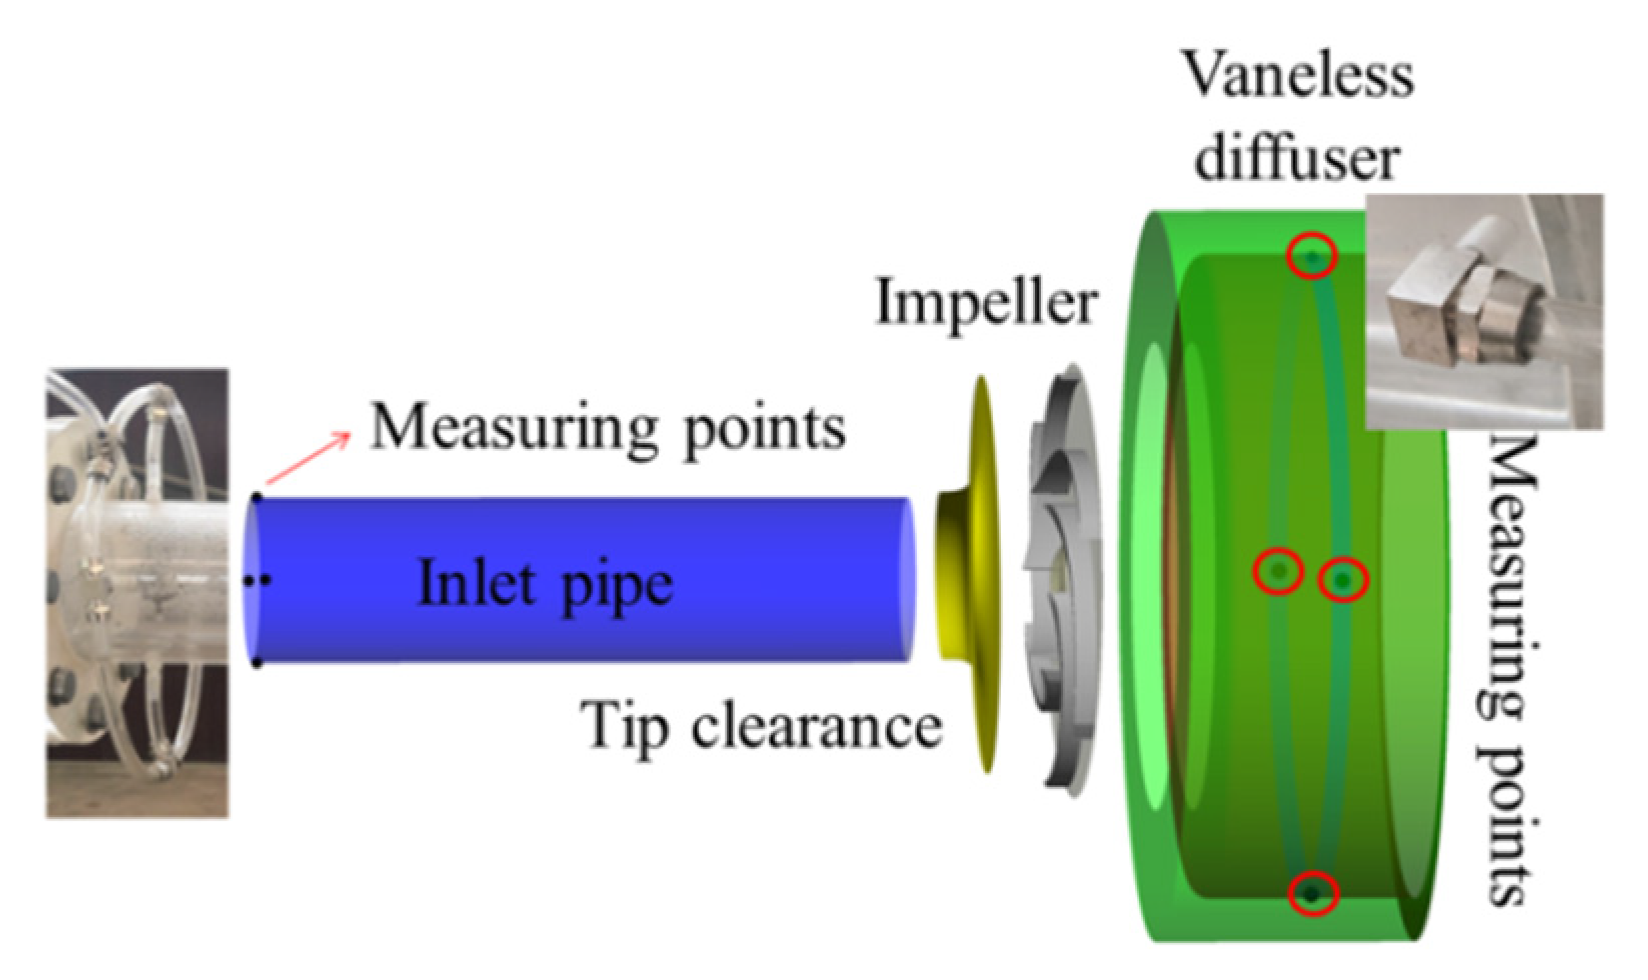
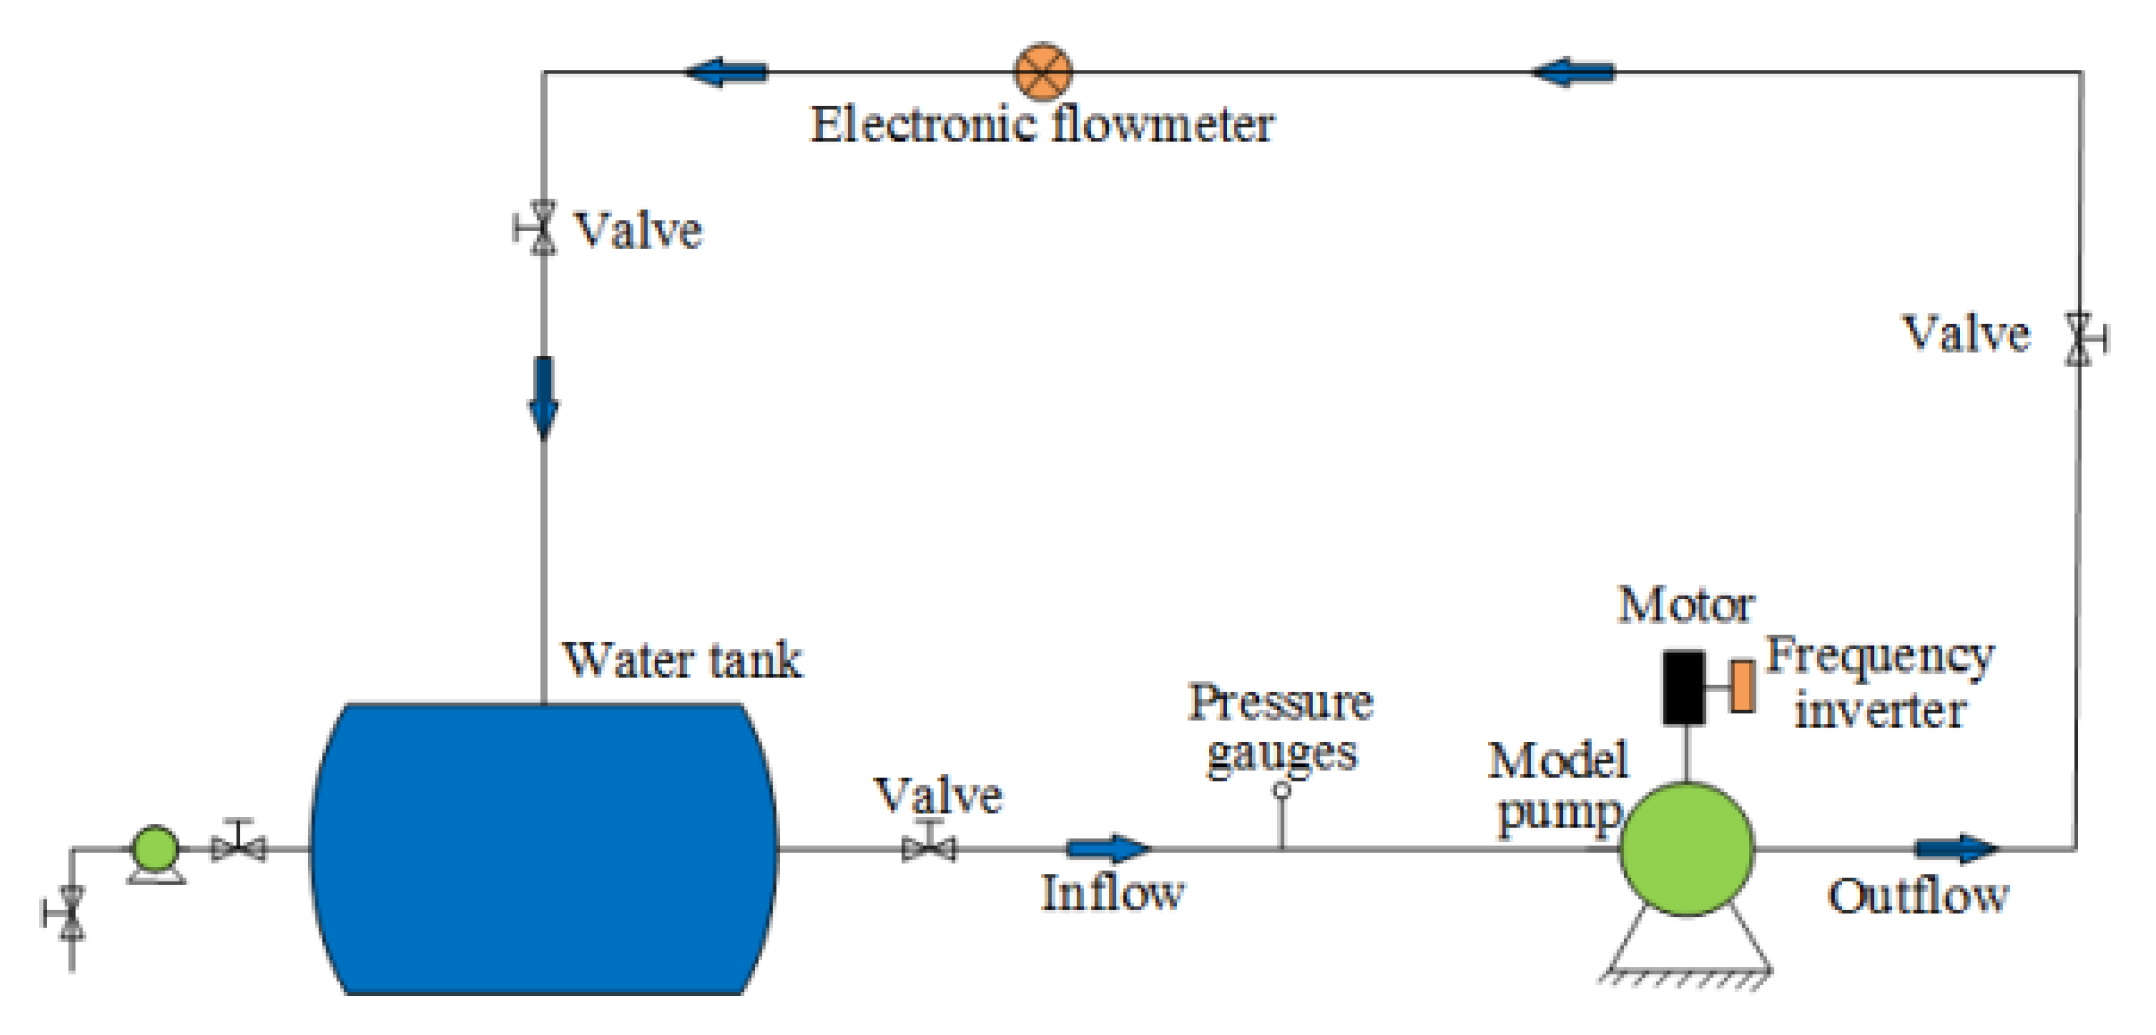
2.2. Experimental Setup

A sketch of the experimental system is shown in Figure 3. The pump head was calculated by the inlet and outlet pressure, which were measured by pressure sensors. Four pressure taps were arranged in the circumferential direction to ensure the accuracy of the measurement, and the average pressure was recorded. Torque was obtained using a TQ-660 torque speed meter with an accuracy of 0.25%. The discharge was measured using an electromagnetic flowmeter. A frequency inverter was adopted to adjust the motor speed and keep the shaft operating at 980 r/min.

2.3. Numerical Setup

ANSYS CFX software was adopted for calculations and flow analysis. The continuity and momentum equations are expressed as follows:
( ρ u i ) x i = 0 ,
ρ D u i D t = ρ F i p x i + x j [ μ ( u i x j + u j x i ) ] + x i ( λ v ) ,
where Fi is the unit mass force; P and ρ are the pressure and density, respectively; t is time; μ is the dynamic viscosity; ui and uj are the components of absolute velocity, v; and λ is the volume expansion coefficient.
The shear stress transport k-ω two-equation turbulence model was adopted in the present study. This model can precisely predict flow separation phenomena. The equations are as follows:
( ρ k ) t + u j ( ρ k ) x j = x j [ ( μ + μ t σ k 3 ) k x j ] + P k β * ρ k ω ,
t ( ρ ω ) + u j x j ( ρ ω ) = x j ( ( μ + μ t σ ω 3 ) ω x j ) + 2 ρ σ ω 2 ( 1 F 1 ) ω k x i ω x i + α 3 ω k P k β 3 ρ ω 2 ,
where F1 and F2 represent the blending function; k and ω represent the turbulence kinetic energy and turbulence eddy frequency, respectively; Pk is the excessive generation of turbulence energy; μt is the eddy viscosity coefficient; and α3, β*, β3, σk3, σω2, and σω3 are the constants.
In the present research, a total pressure of 101,325 Pa and mass discharge were adopted at the computational domain inlet and outlet. A no-slip wall boundary condition was imposed on all solid walls. For the interface between the rotating part and the fixed part, we adopted a frozen rotor. Cavitation was not taken into consideration.

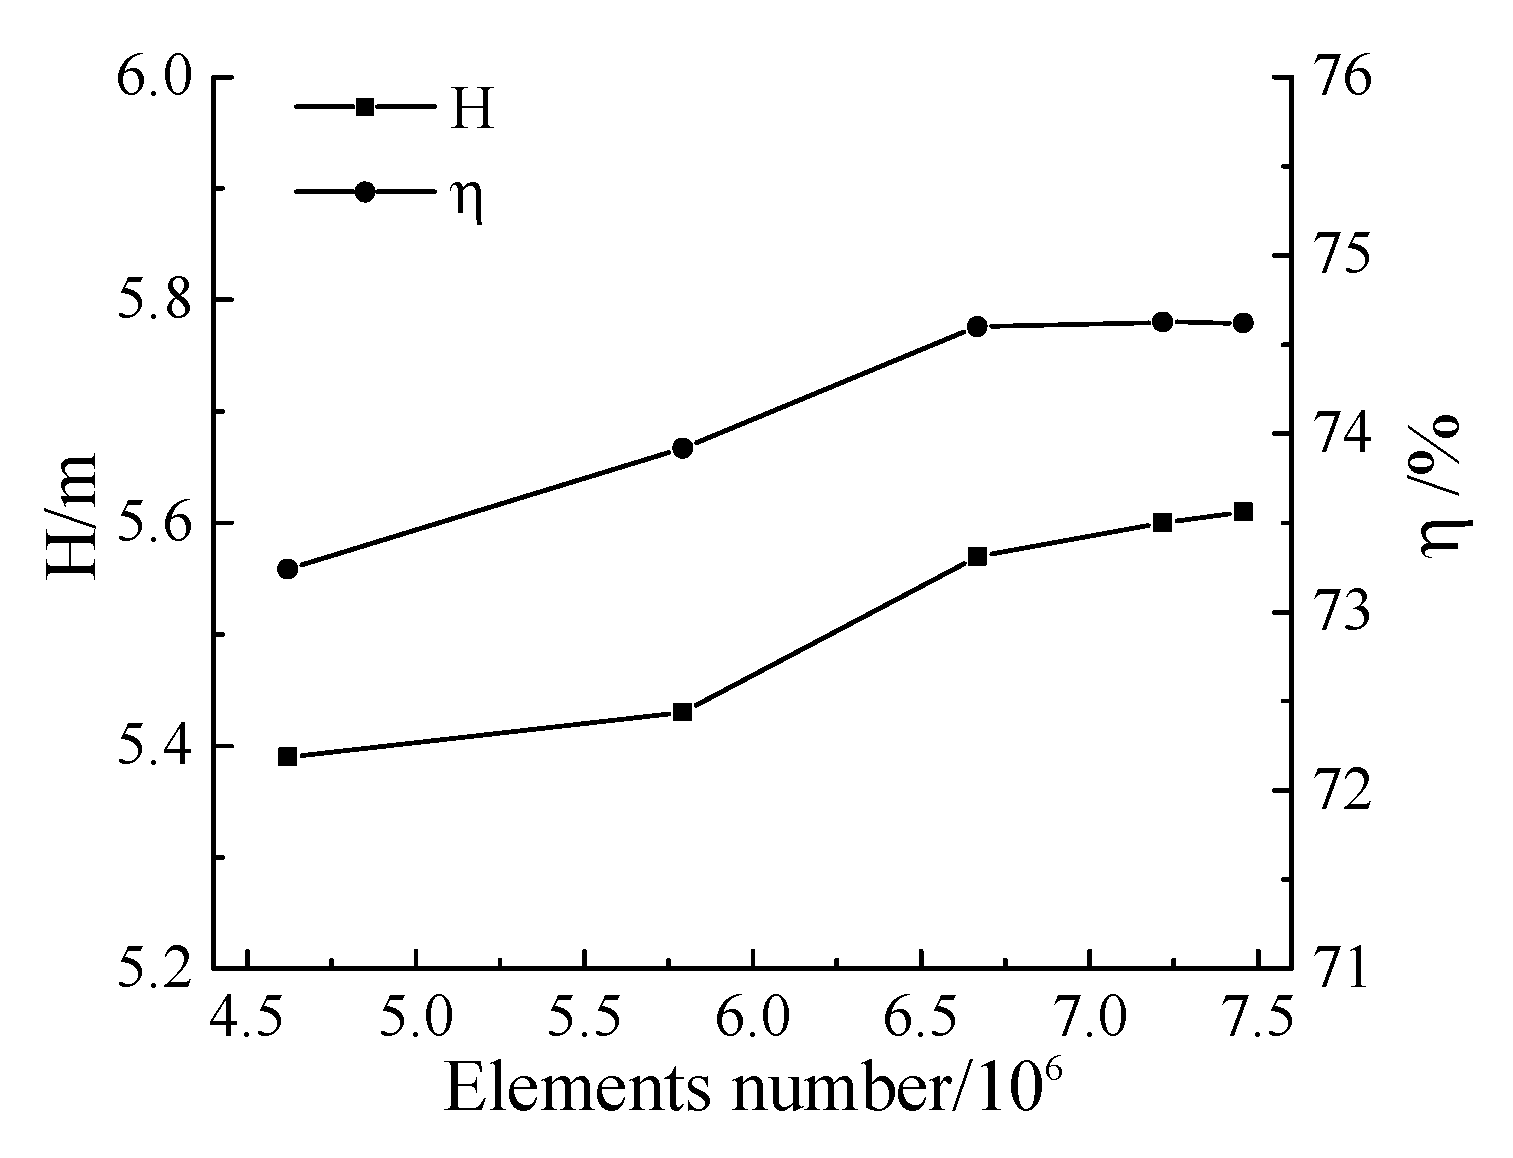
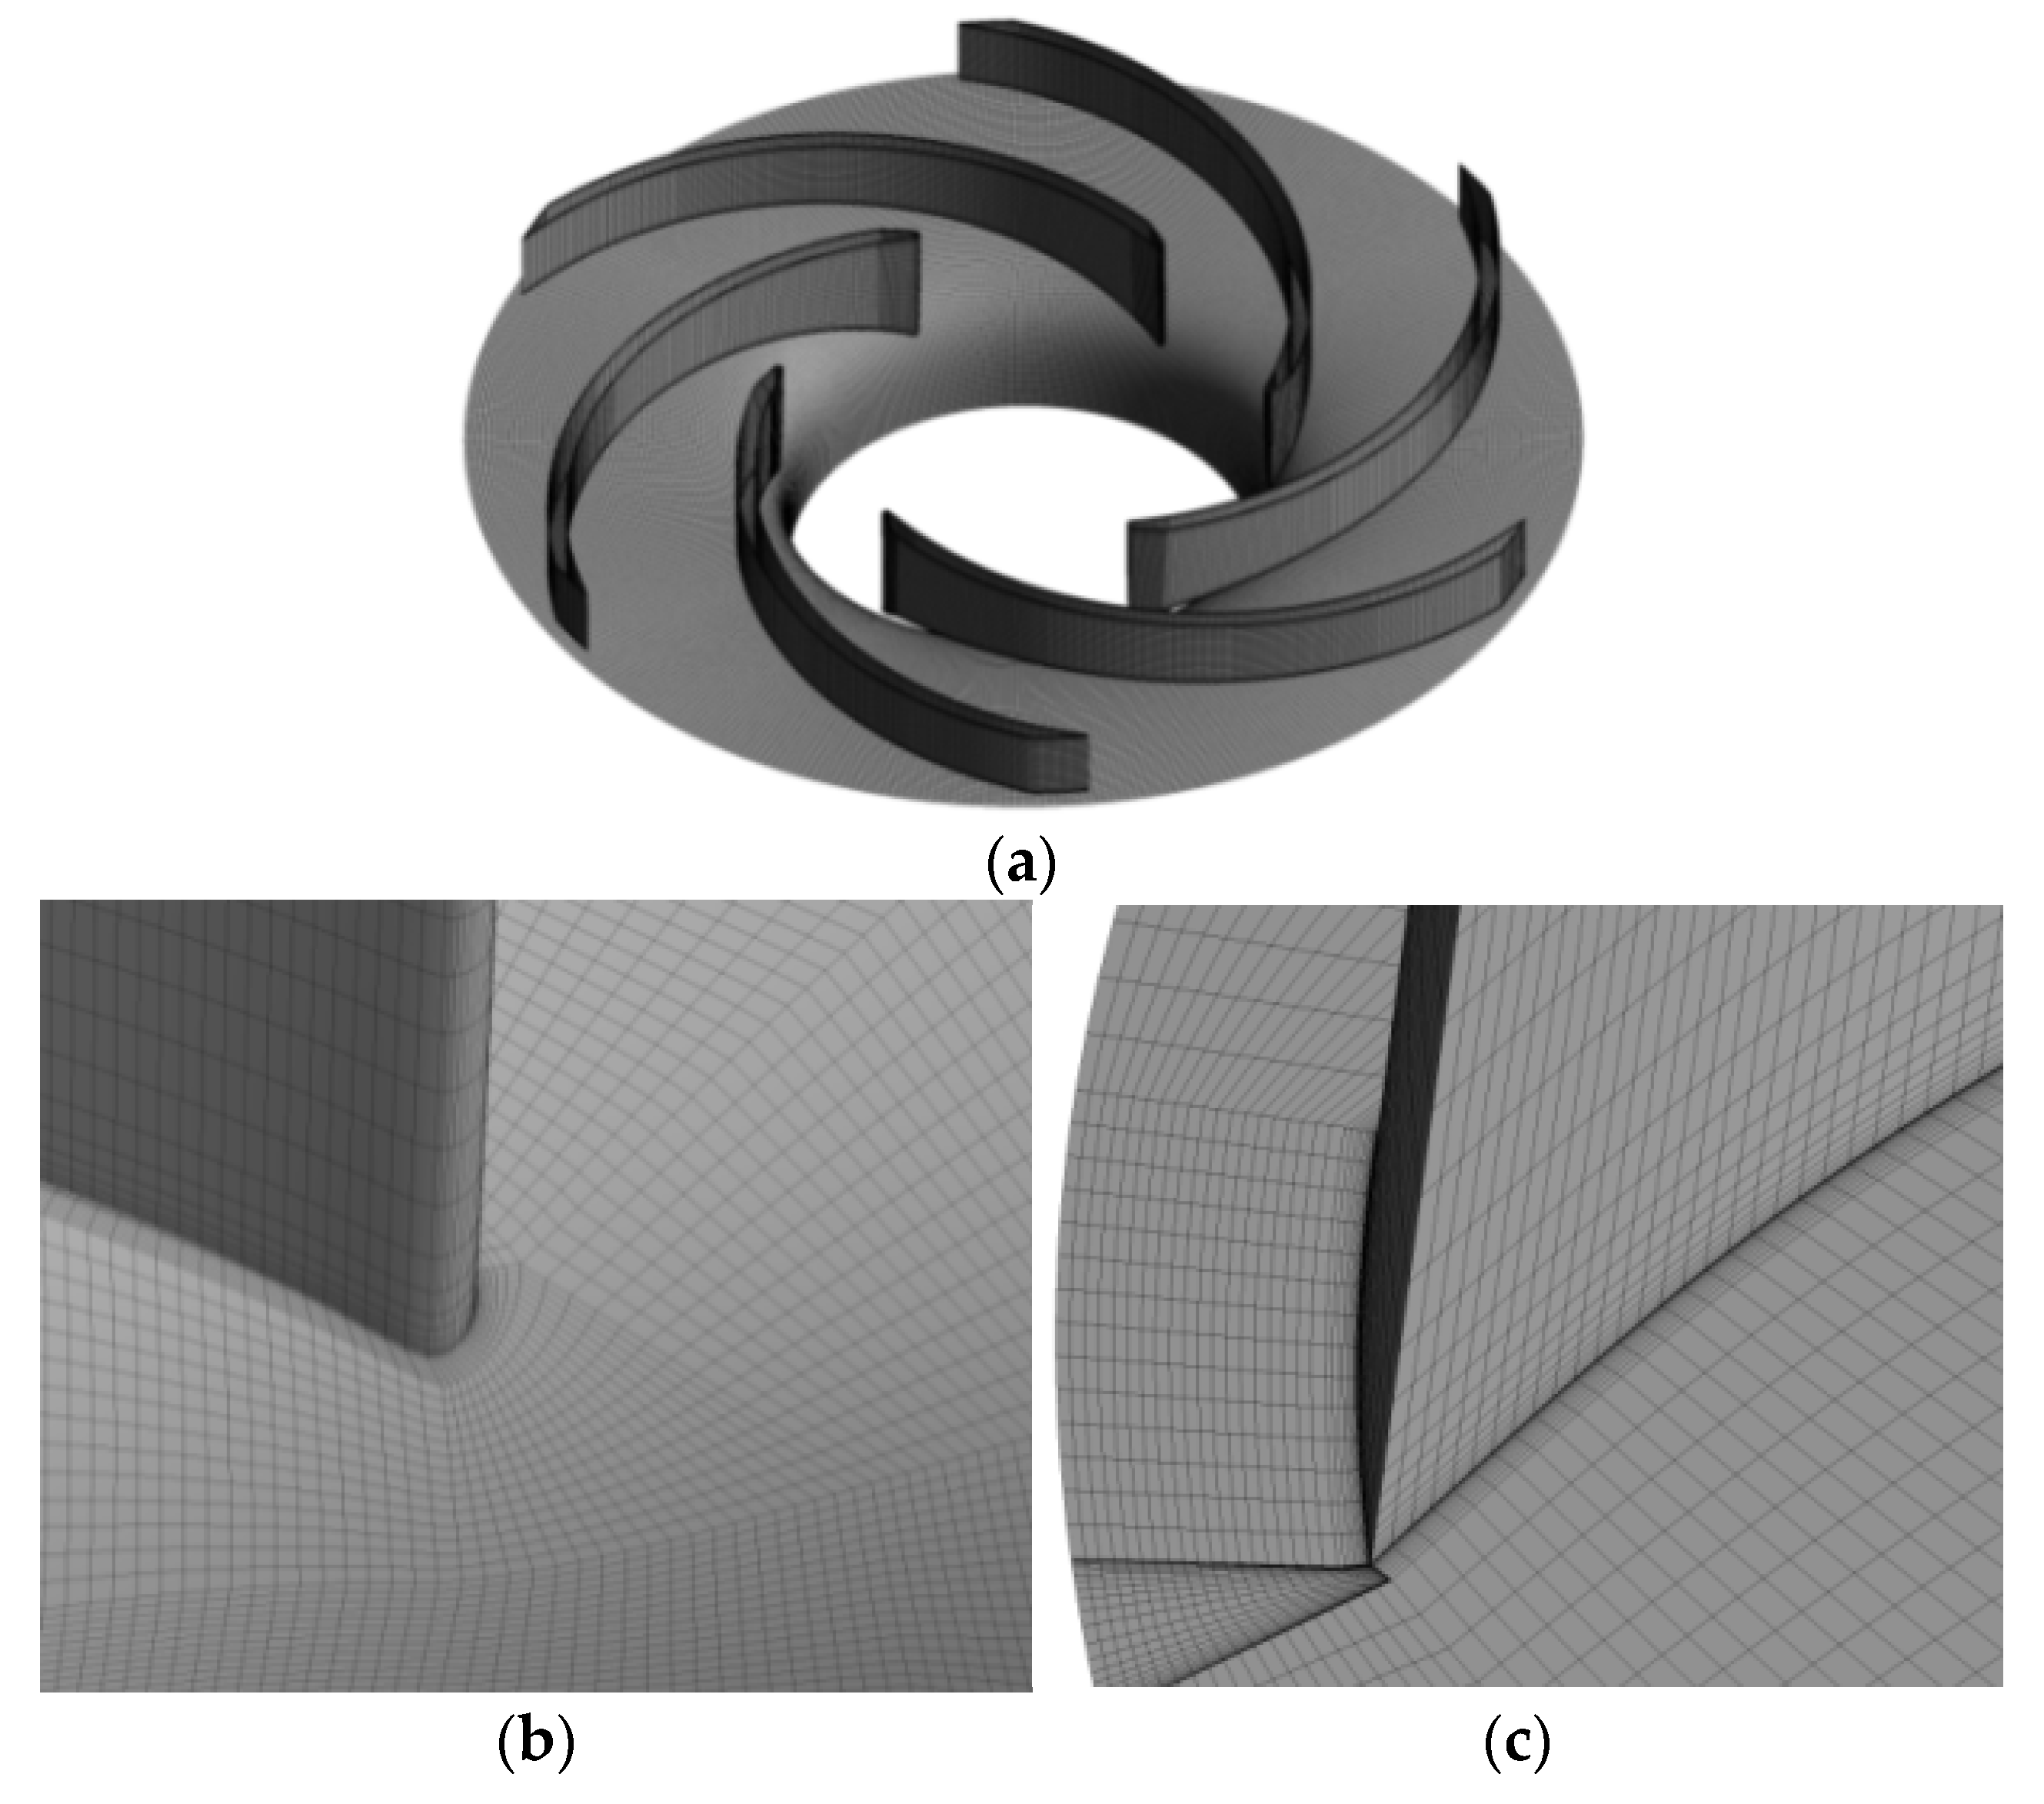
2.4. Grid Production

All components were meshed by hexahedral grids using ANSYS ICEM software. Mesh independence was determined with five sets of elements in design condition, as shown in Figure 4. The head and efficiency increase when the element number increases from Mesh 1 to Mesh 3 but remain almost unchanged when the element number increases from Mesh 3 to Mesh 5. Therefore, Mesh 3, with 6.66 million elements, was chosen for the simulation. In addition, the impeller tip clearance was meshed with 20 nodes to capture tip clearance flow. The average y plus of blade surface is 2.8. The angle and quality of the grid are greater than 18° and 0.5, respectively. The impeller mesh distribution is shown in Figure 5.

3. Results and Discussion

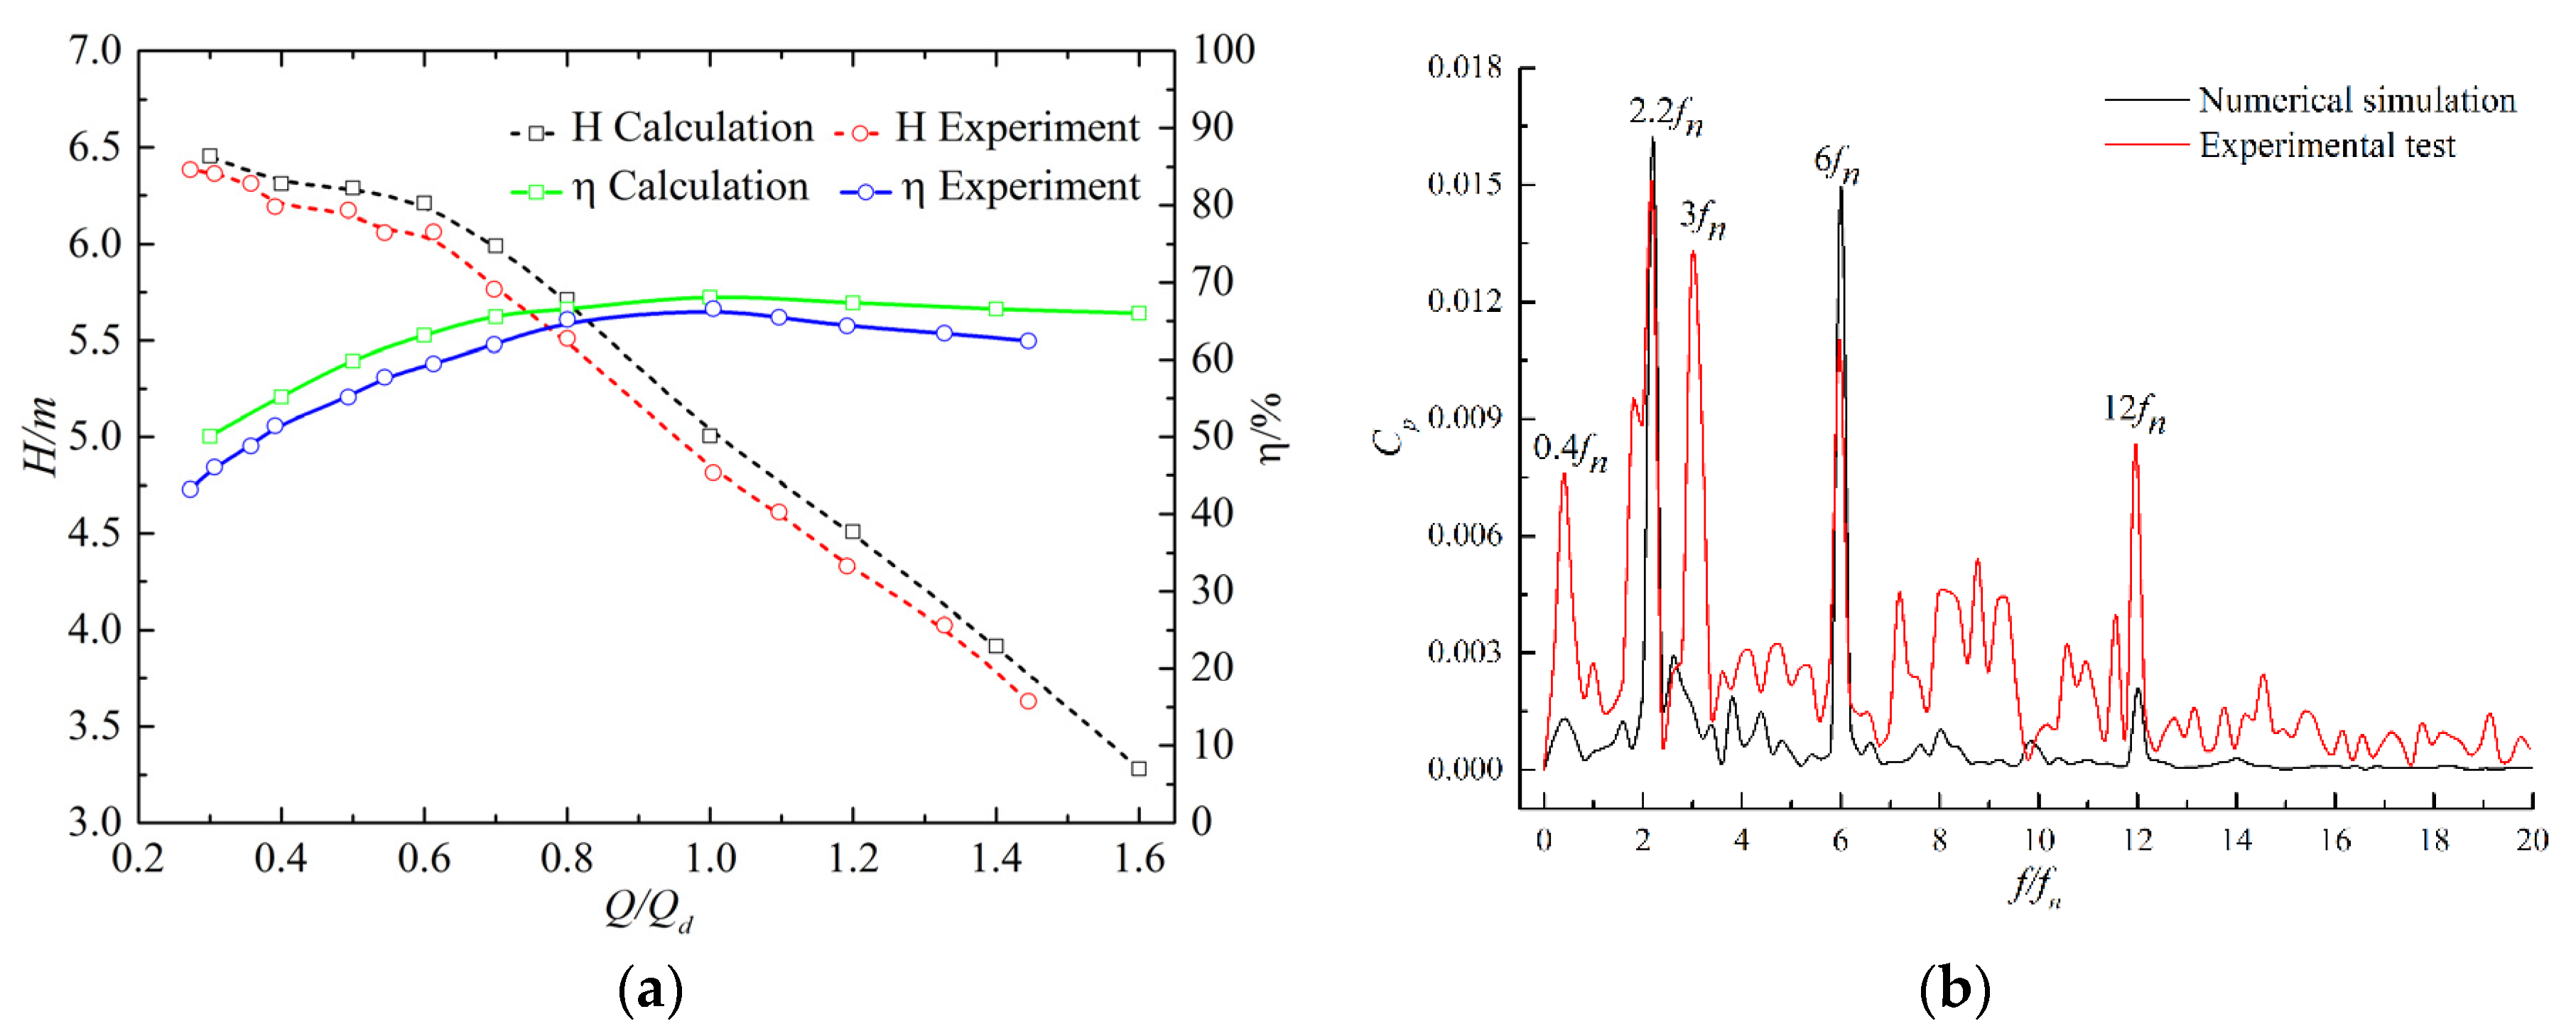
3.1. Numerical Result Validation

We conducted a comparison between experimental and numerical data, as shown in Figure 6. The experimental data are consistent with the calculated results. Under all discharge conditions, the maximum errors of head and efficiency were 4.2% and 4.7%, respectively. The pressure fluctuation under the low-discharge condition is shown in Figure 6b. The measuring point is in the inlet pipe near the impeller inlet. The frequencies of 2.2fn and 6fn appeared both in the numerical simulation and experimental test. 3fn appeared in the experiment but not in the numerical simulation, possibly as a result of the mechanical vibration caused by impeller rotation. The results show that the numerical simulation is accurate.

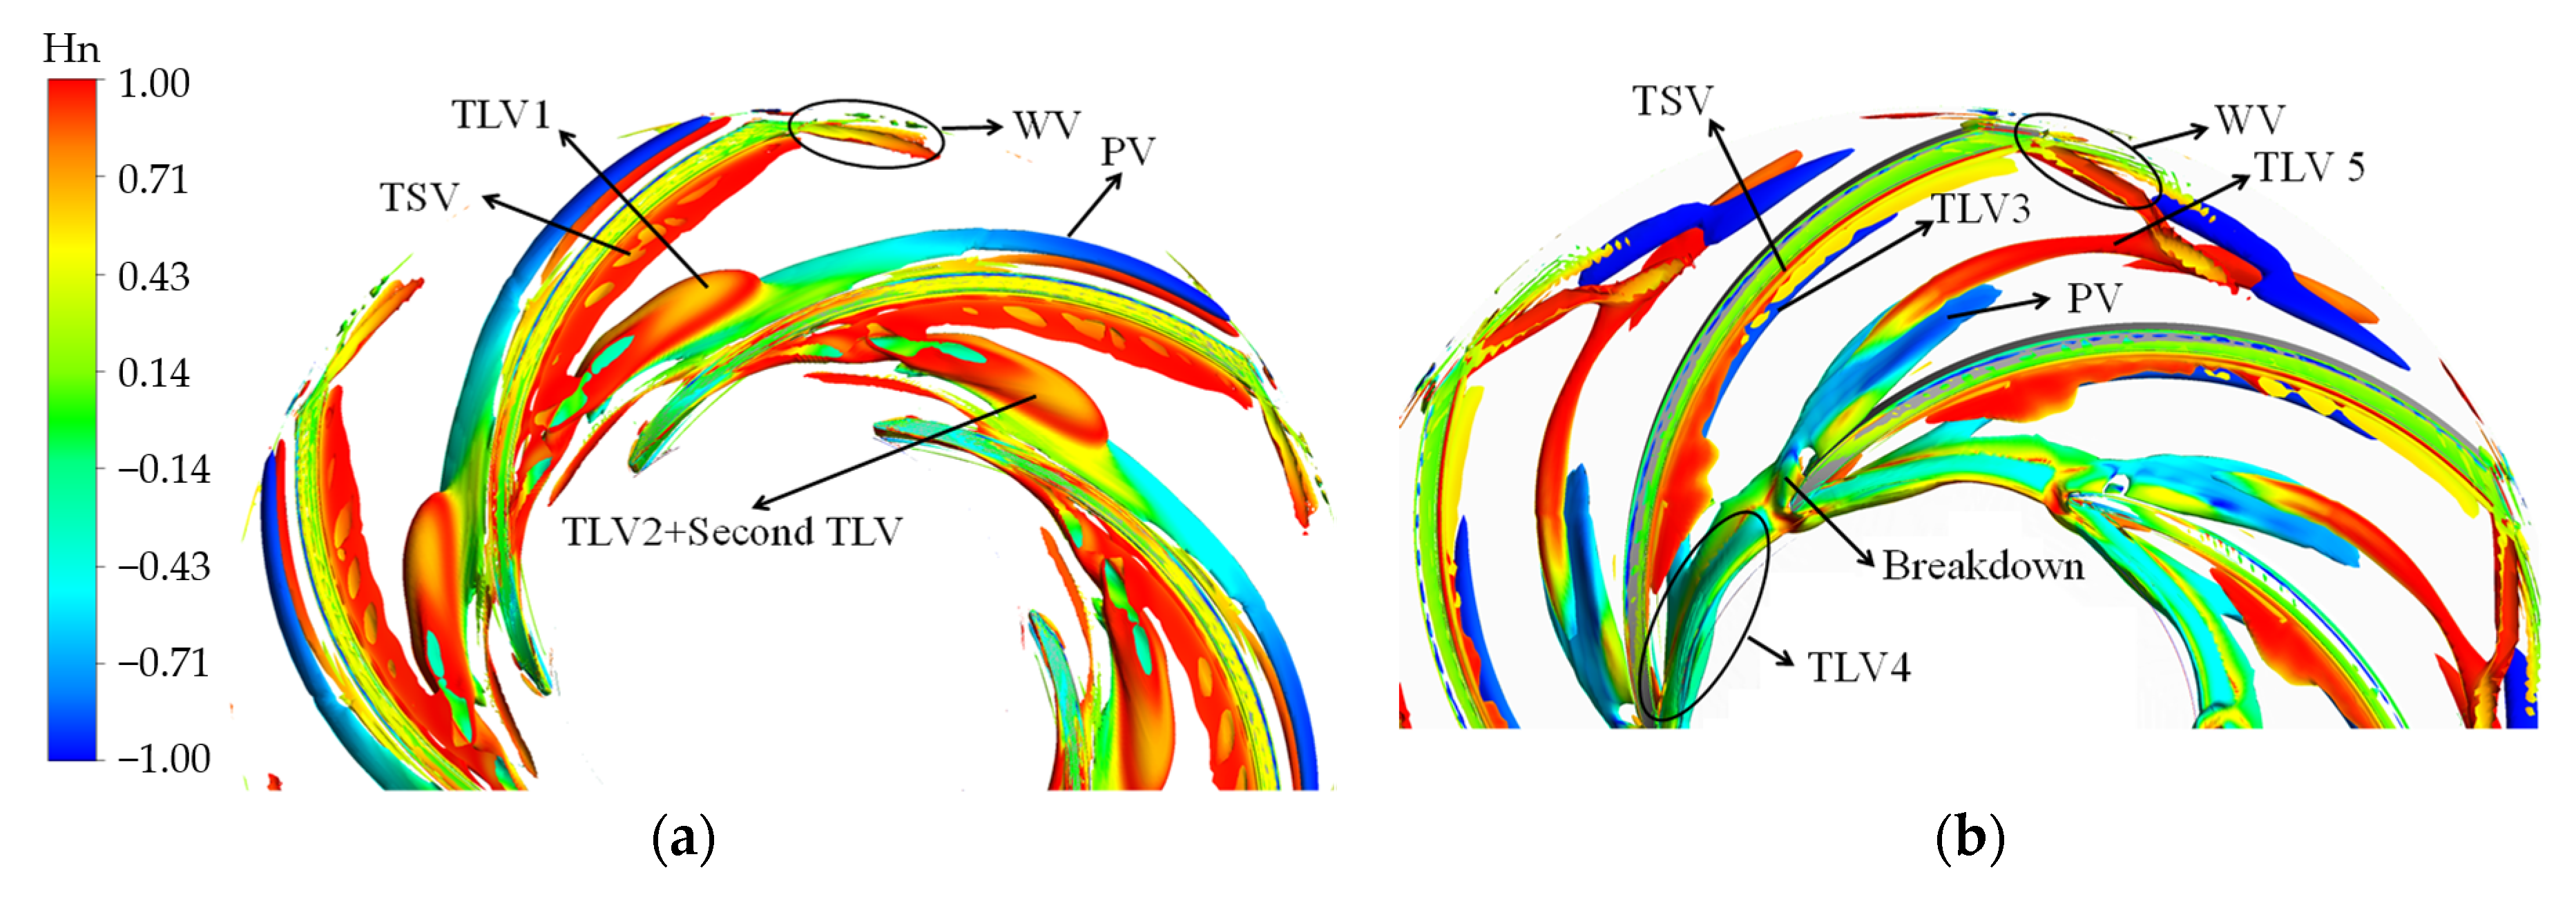
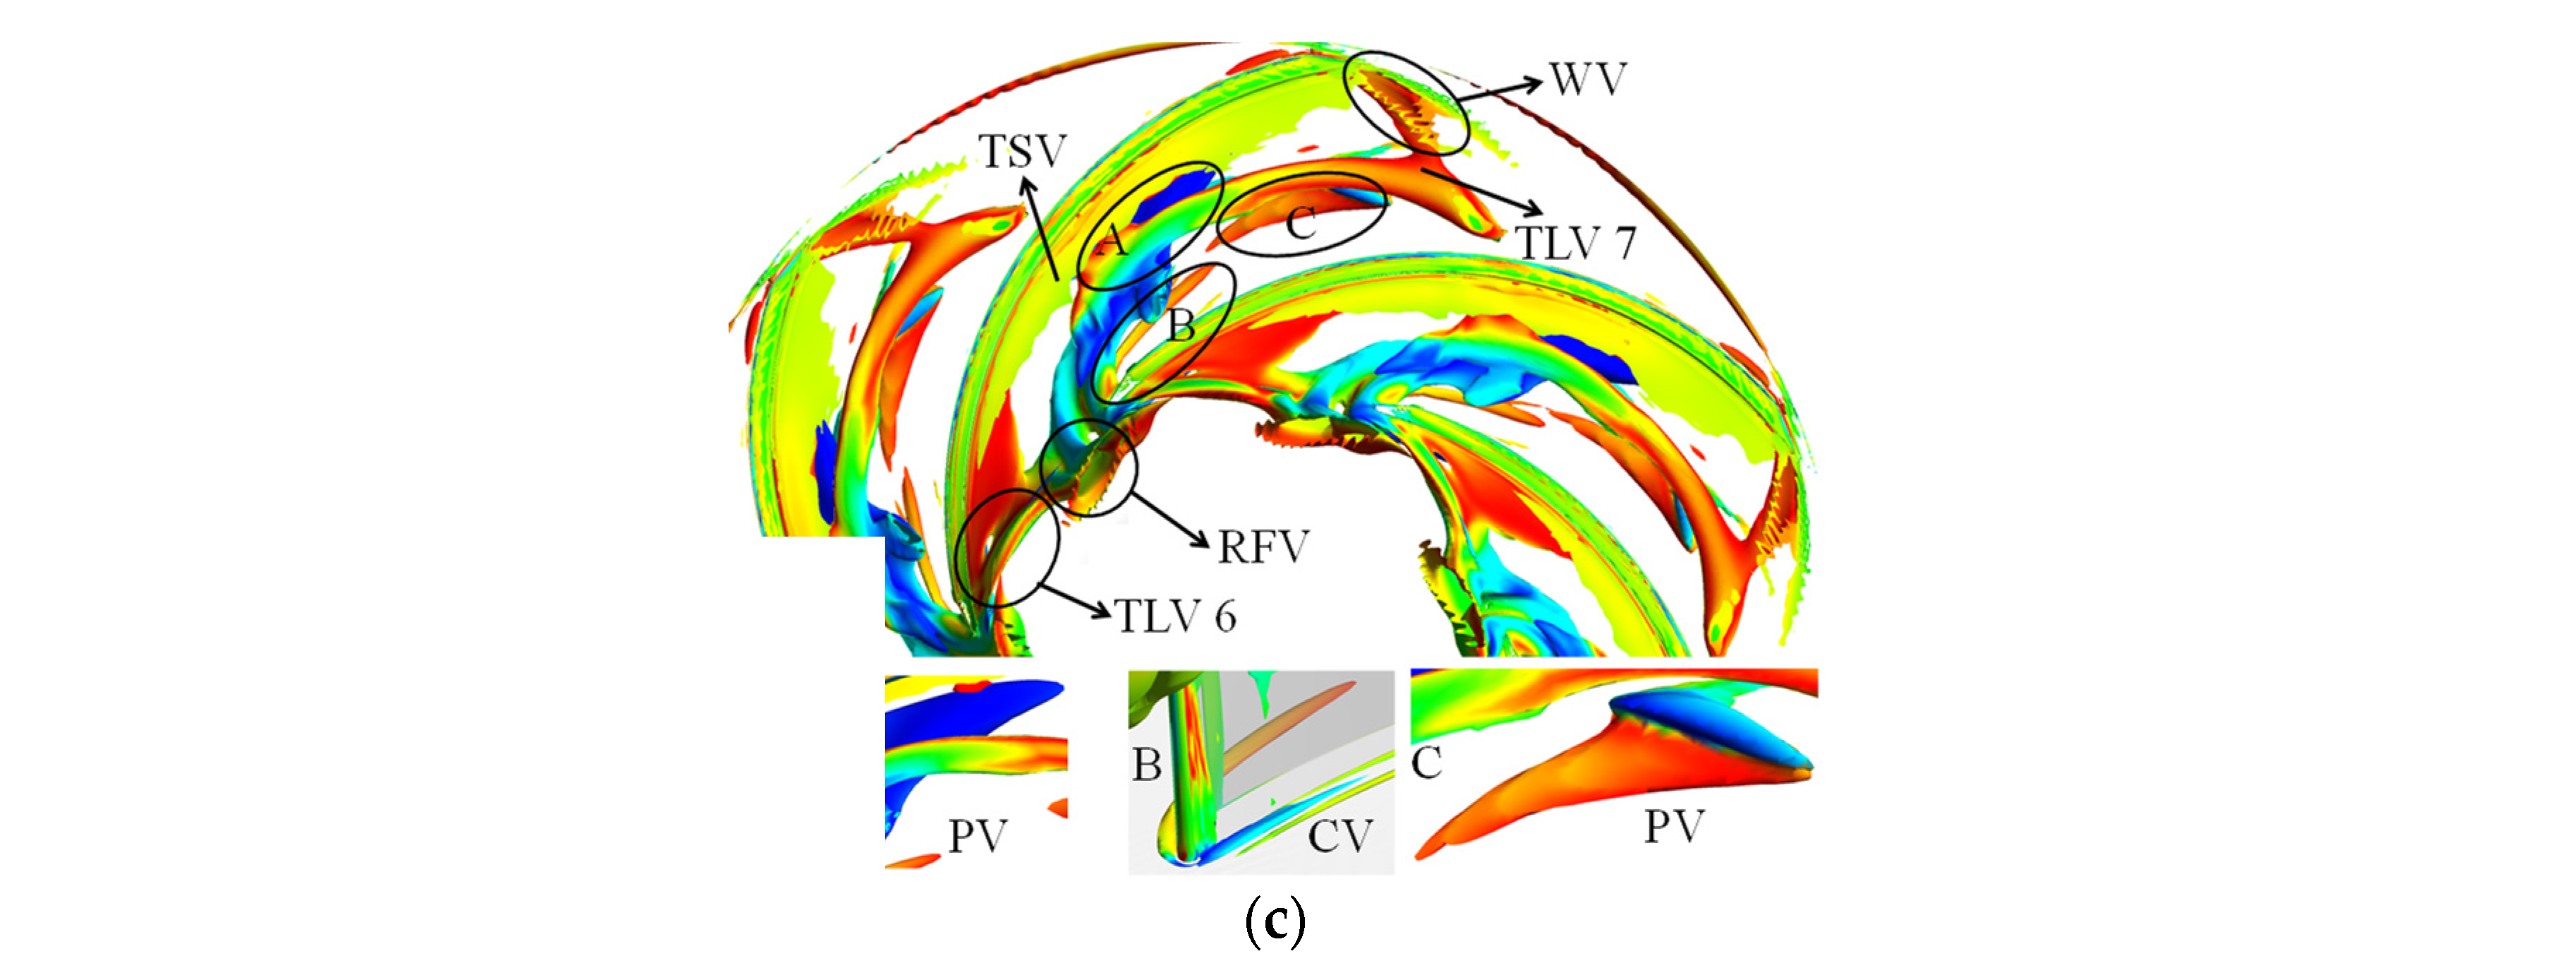
3.2. Vortex Structure

The TLV structure can be characterized by the proposed novel omega vortex identification method. The equations are as follows [9]:
Ω = Ω 2 S 2 + Ω 2 + ε ,
ε = 0.001 ( Ω 2 S 2 ) max ,
where Ω and S are the vortex vector and strain rate tensor, respectively; ε is set to ensure that the denominator does not equal 0.
Hn quantitatively identifies the vortex structure [28,29]. The equation of standard helicity is expressed as:
H n = Ω W | Ω | | W | ,
where W is the relative velocity vector.
Hn can represent the vortex core when it equals to 1 or −1. The vortex structure in the impeller colored by Hn is shown in Figure 7. Figure 8 depicts streamline released from the middle line of the tip clearance. The value “M” denotes the meridional distance of the blade; the values “0.0 M” and “1.0 M” indicate blade inlet and outlet, respectively. Under the high-flow condition, the streamline released at 0.0–0.1 M flows along the tip clearance. Then, the streamline flows to the suction surface, which follows the leakage flow released at 0.1–0.3 M. The streamline released at 0.3–0.6 M forms the main TLV (TLV 1). Hn of TLV 1 is approximately equal to one. The direction of the main TLV vector is the same as the direction of the relative velocity. TLV 1 flows to the downstream and moves to the pressure side of the adjacent blade. As a result, a passage vortex (PV) occurs. The vast majority of the streamline released at 0.6–1.0 M forms the secondary TLV or even a tertiary leakage vortex. They merge and develop with the main TLV, resulting in an increase in the leakage vortex strength.
Under the BEP condition, the initial position of the TLV located in the blade inlet, as well as the circumferential motion trend, increases. The tip leakage flow includes three parts. First, TLV 3 is formed by the streamline released at 0.0–0.1 M, which flows to the downstream along the suction surface with a relatively stable flow state. Moreover, TLV 4 is formed by the streamline released at 0.1–0.6 M. TLV 4 moves to the adjacent blade in the opposite direction of the impeller rotation and breaks after collision with the wall surface. The vortex breakdown results in the appearance of PV. Finally, TLV 5, which extends to the impeller outlet, is formed by the streamline released at 0.6–1.0 M.
The vortex structure is complex under the low-discharge condition. The vortex structure comprises the corner vortex (CV) and reverse-flow vortex (RFV), except for TLV and PV. The CV caused by the positive attack angle appears in the connection of the hub and the blade. The TLV 6 generated at the blade inlet moves toward the upstream of the impeller and breaks when it is close to the adjacent blade. Part of the leakage vortex induces PV, whereas the rest forms the RFV. The streamline released at 0.2–0.6 M flows through the adjacent blade. Thus, leading-edge overflow occurs.
In addition to the above vortices, the wake vortex and tip separation vortex (TSV) are also formed under all conditions. The area of the TSV is the smallest under the BEP condition. The intensity of TSV increases when the operation deviates from the BEP condition.

3.3. Internal Flow Field

The absolute flow angle can reflect the flow pattern of the fluid. Therefore, the absolute flow angle on the blade leading edge was investigated. Figure 9 shows the absolute flow angle distribution along the circumferential direction of 0.93 span. The absolute flow angle presents evident periodicity. Under the high-flow condition, the absolute flow angle increases to 95° in the circumferential middle position and then decreases to 85° on the blade leading edge. The distribution range of absolute flow angle is between 85° and 100°. The initial position of the leakage vortex is 0.33 M, and the leakage vortex flows to the downstream with the mainstream. As a result, the leading edge of the blade is almost unaffected by the leakage vortex, which indicates that the water can successfully flow to the impeller. Under the BEP condition, the absolute flow angle increases remarkably. The distribution range of absolute flow angle is between 150° and 170°. There are two peaks in one period. The locations of the maximum value and minimum value are circumferential middle position and blade leading edge, respectively. Under the low-discharge condition, the absolute flow angle is further increased. The distribution range of the absolute flow angle is between 160° and 180°. The absolute flow angle on the leading edge of every blade is close to 180°. The inlet of the blade is considerably affected by the leakage vortex because the initial position of the TLV moves forward to the upstream. A low-speed region is formed, and an obvious reverse flow appears.
For fluid machinery, hydraulic loss caused by unstable flows is inevitable. Entropy production represents the irreversibility of a system. According to entropy theory, the location and strength of the energy dissipation can be ensured quantitatively. Thus, entropy theory was adopted to determine the internal flow-loss mechanism in rotating machinery, such as centrifugal pumps [30], centrifugal fans [31], and pump turbines [32].
To analyze the three-dimensional structure of the flow at the tip clearance, different sections were made from the inlet to the outlet of the blade, and the entropy production rate (EPR) distribution was adopted to reflect the action range of the TLV. As shown in Figure 10, the high-EPR region is caused by the TLV, and the low-entropy production area represents the unaffected area. Figure 10 shows that the high EPR is mainly distributed in two regions: the blade tip clearance and the inside of the flow channel. On one hand, tip leakage flow is formed in the blade tip region. The high EPR is caused by the high-velocity gradient in the blade tip. On the other hand, the tip leakage flow mixes and rolls up with the main flow in the channel, which leads to the appearance of TLV. The high EPR distributes around the TLV.
To quantitatively analyze the change in EPR under different flow conditions, the distribution of circumferential average EPR in the impeller is shown in Figure 11. There are two different peaks in the curves. The peak of EPR on the trailing edge is affected by the wake vortex. Regardless of the influence of the wake vortex, the distribution line of the EPR can be approximated as a “bell curve”. This curve first increases and then decreases. Therefore, it can be divided into two parts: the dominant part of the main flow with a positive slope and the dominant part of leakage flow with a negative slope. The position of the peak depends on the balance between the main flow momentum and tip leakage flow momentum.
The peak of the “bell curve” moves upstream from the high- to low-discharge condition. Thus, the position with the high EPR peak moves toward the leading edge, which is consistent with the direction of the initial position movement of the TLV. The position of the peak almost coincides with the initial position of the TLV. In addition, the decrease in discharge leads to a decrease in EPR. However, under the low-discharge condition, the flow field from the impeller inlet to the leading edge of blade with a remarkably higher EPR compared with the other two conditions is affected by RFV and leading-edge overflow.
The blade load can accurately reflect the turbocharging performance and is associated with the characteristics of the TLV. The static pressure coefficient, Cp, is introduced to analyze the blade load.
C p = p p ¯ 0.5 ρ u o u t 2 ,
where p is the static pressure, p is the static pressure of the inlet, and uout is the impeller circumferential velocity.
The blade load under different conditions is shown in Figure 12. The Cp distribution law of the 0.05 span is in accordance with that of the 0.50 span, and the distribution lines almost coincide. However, the static pressure near the tip clearance is remarkably lower than that at mid-span and near the hub. Thus, the blade load near the shroud is reduced. In addition, the static pressure of the suction surface no longer increases gradually but first decreases and then increases near the initial position of the TLV, which is shown in the green circles.
The blade load distribution varies depending on the condition. Under the 1.6 Qd condition, Cp of the pressure surface near the tip at the blade inlet is approximately the same as the suction surface. Thus, a zero load appears on the blade surface. This phenomenon explains why the streamline flows along the tip clearance in Figure 7a. Under the BEP condition, ΔCP first increases and then decreases. The load at the middle of the blade chord is larger than at other positions. Under the 0.7 Qd condition, ΔCP and blade load decrease but tend to remain stable along the radial direction. As a result, the leakage flow intensity decreases.

3.4. TLV Trajectory

An Analysis of TLV trajectory with different discharges is necessary to investigate the movement law of TLV. The TLV trajectory is consistent with that of low-pressure troughs near the shroud, as shown by the red arrow in Figure 13. The TLV moves downstream toward the pressure surface of the adjacent blade. An angle exists between the TLV trajectory and camber line. The angle increases with decreased discharge. The TLV initial position varies depending on the condition and gradually moves upstream with decreased discharge. Under the 0.7 Qd condition, the leakage vortex trajectory includes two parts, corresponding to TLV6, which moves circumferentially, and RFV (Figure 6). The TLV was selected for subsequent analysis.
The position with the highest-entropy gradient is the interface between the main flow and the leakage flow, as shown by the red arrow in Figure 14. Under the 1.6 Qd condition, the interface is a straight line. However, the interface folds into a curve with decreased discharge. Under the 0.7 Qd condition, the interface moves to the impeller inlet and exceeds the blade inlet. Thus, the formation of overflow is triggered. The interface is concave in the passage and convex on the blade leading edge. The RFV moves to the impeller inlet with a large angle because TLV breaks on the leading edge and forms RFV. This occurrence results in a change in the entropy gradient.

4. Conclusions

In this study, the structural characteristics and trajectory of TLV were systematically studied and analyzed. The detailed conclusions are as follows:
(1)
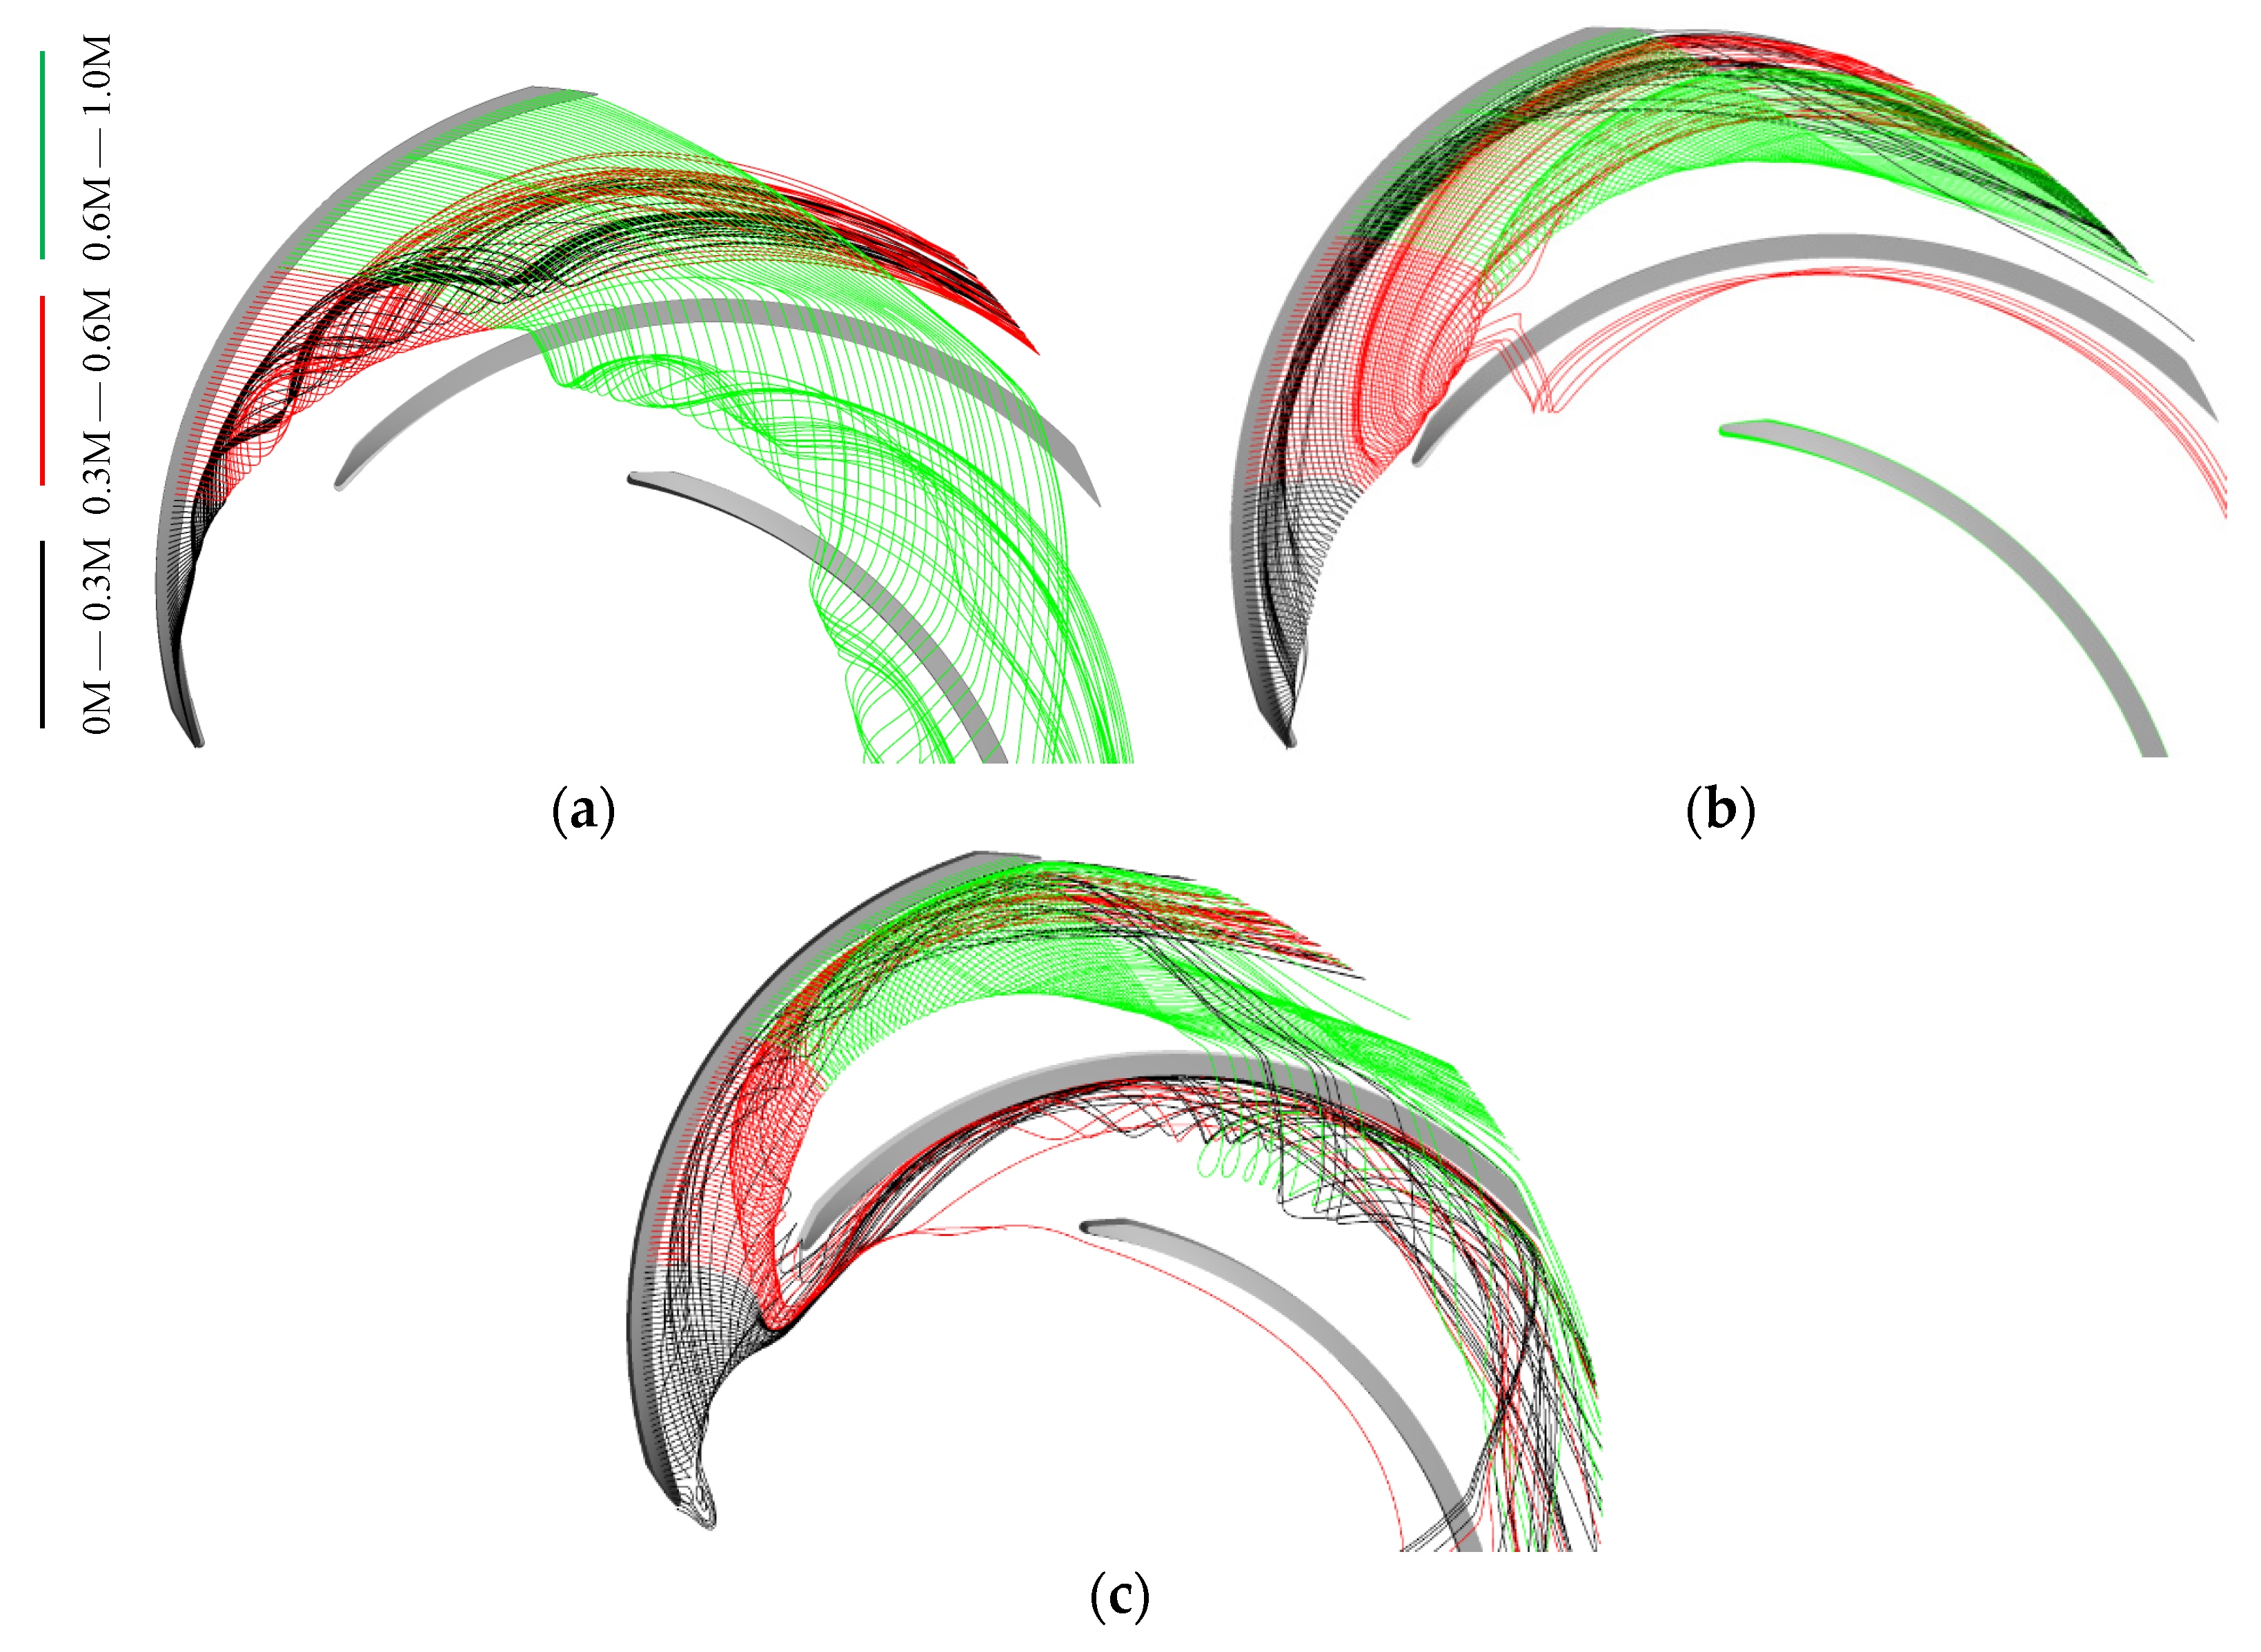
With the exception of the main leakage vortex, the secondary leakage vortex or even tertiary leakage vortex near the impeller outlet is formed under the high-discharge condition. The vortex structure under the low-discharge condition is more complex than under the high-discharge condition. The indicator of a leakage vortex under the low-discharge condition is a leading-edge overflow phenomenon, which causes a reverse-flow vortex.
(2)
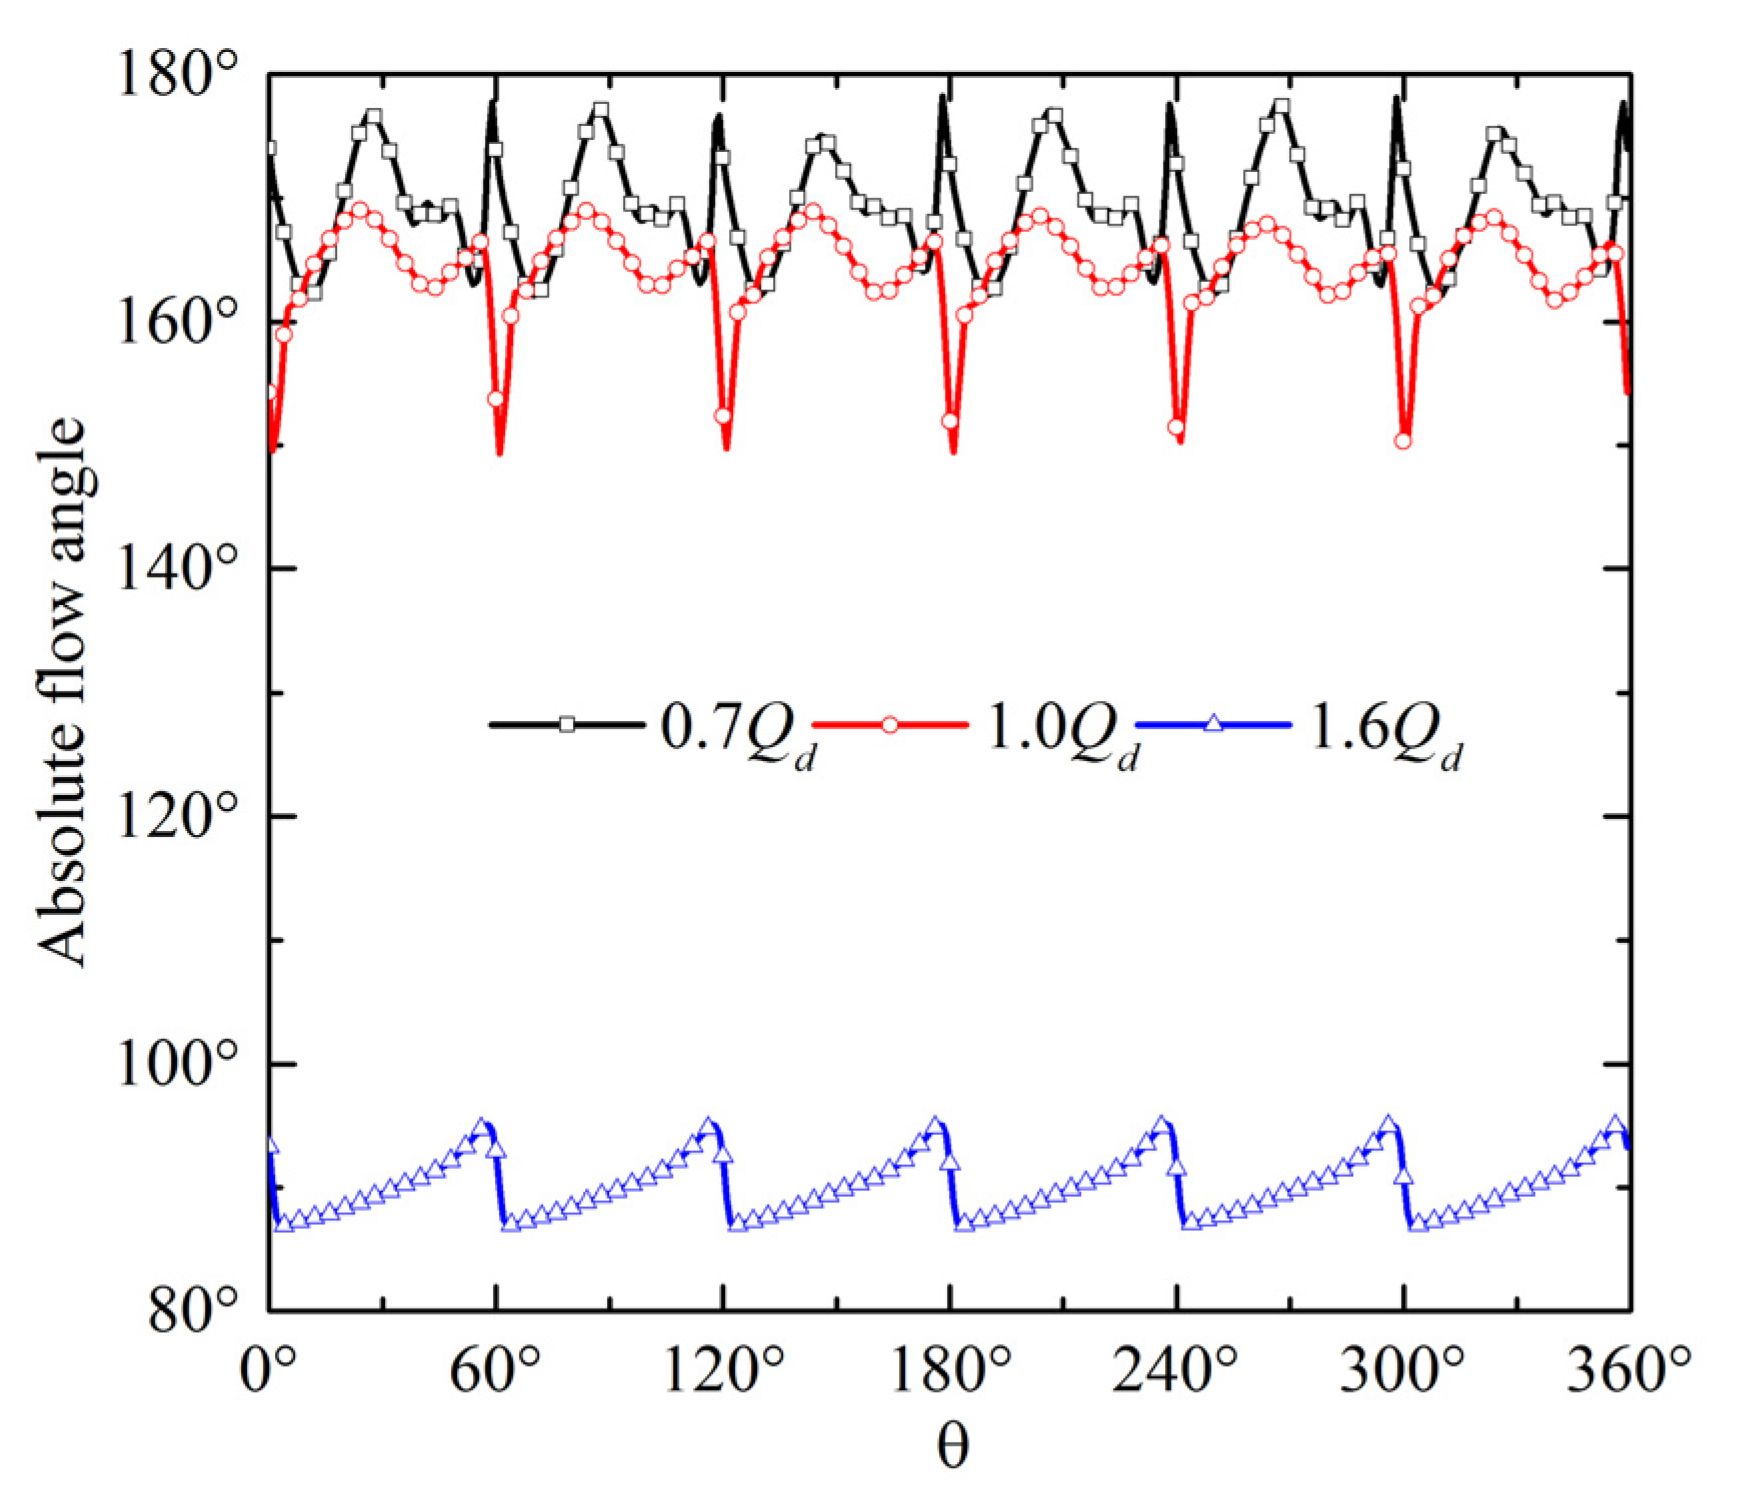
The absolute flow angle reflects the flow pattern in the blade inlet. With decreasing discharge, the absolute flow angle increases, and the initial position of the leakage vortex moves forward to the leading edge. An obvious reverse flow is formed under the low-discharge condition, leading to an absolute flow angle close to 180°.
(3)
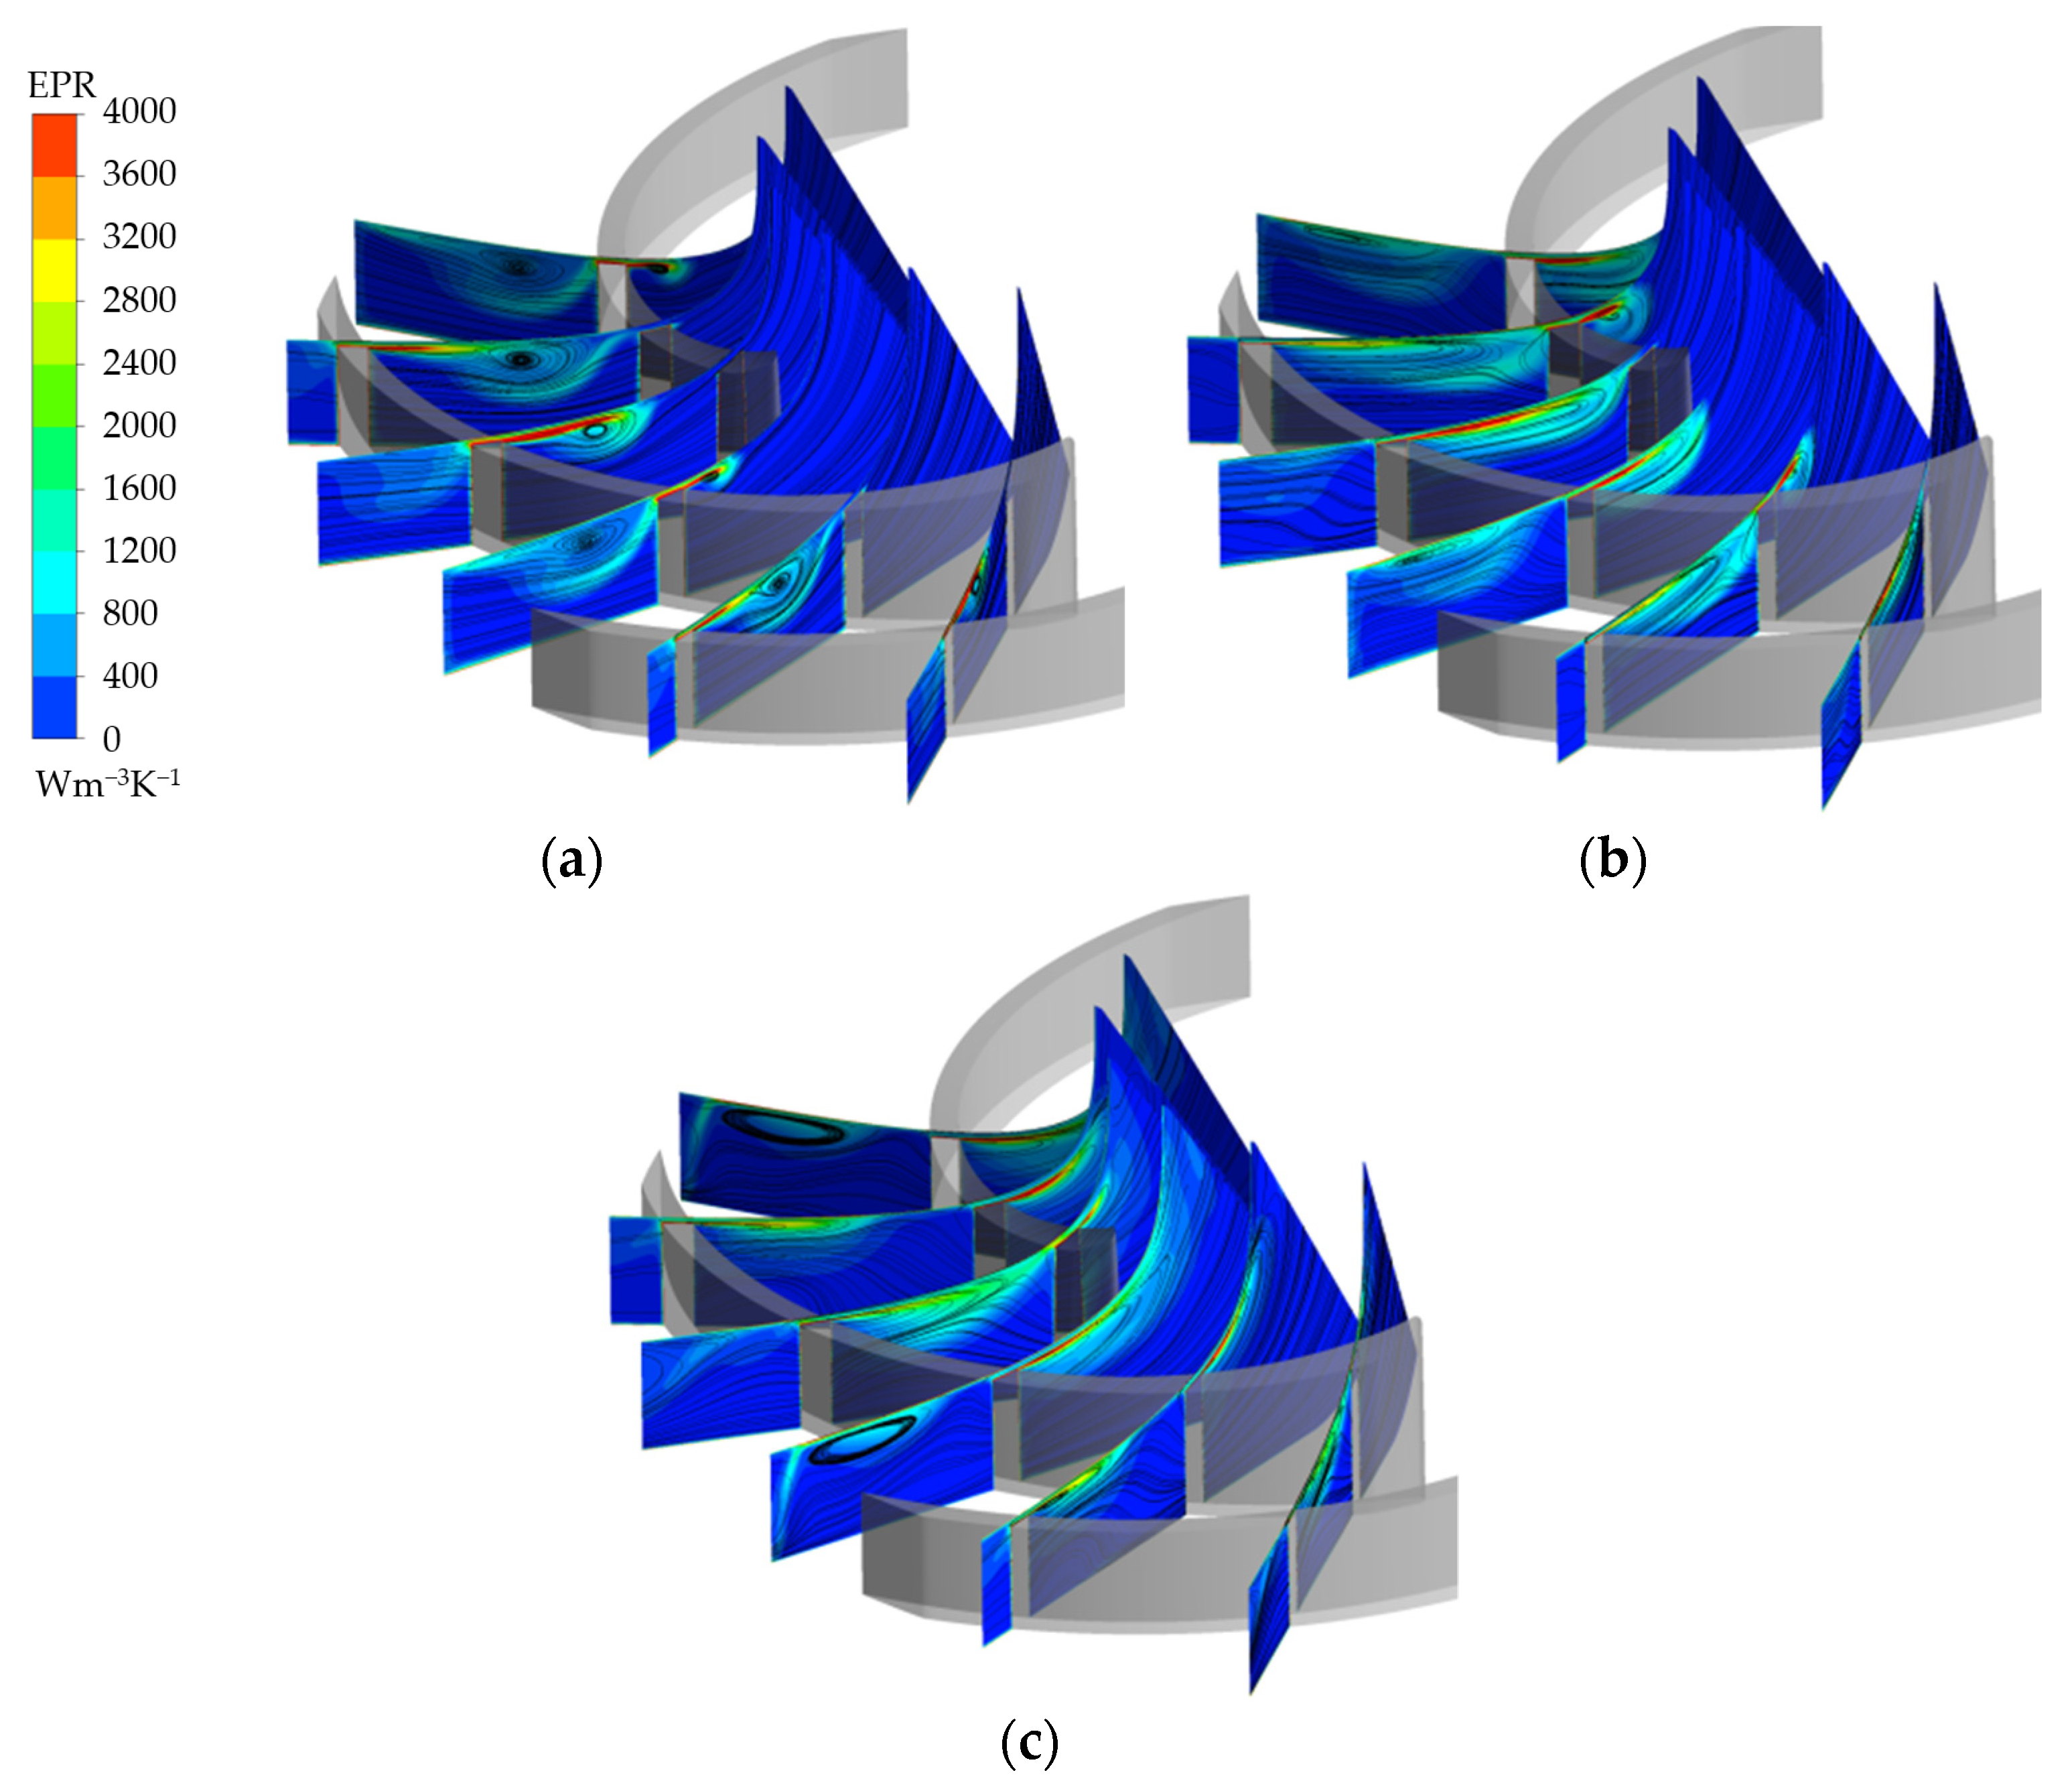
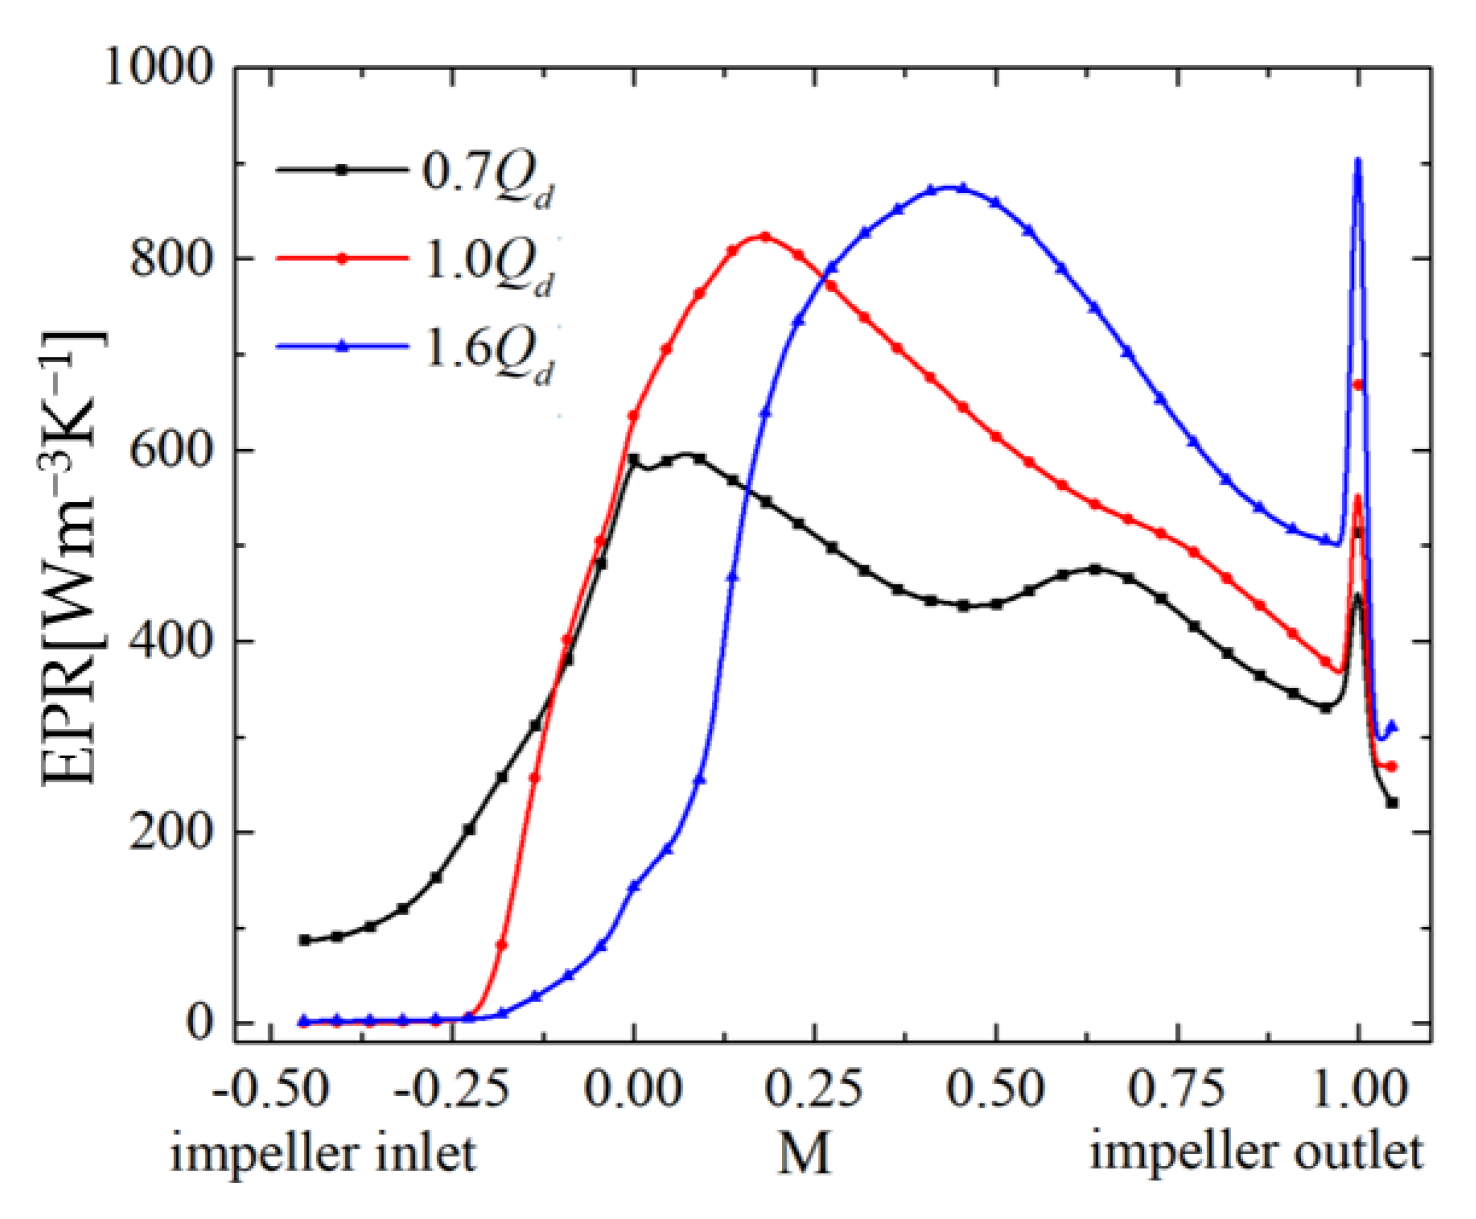
Unstable flow can be characterized by entropy production theory. A region with high EPR is caused by a high-velocity gradient, as well as mixing and rolling up between the tip leakage flow and main flow. With decreased discharge, the peak of the EPR distribution curve moves upstream; this is consistent with the direction of the initial position movement of the TLV. The blade load is reduced, and the distribution law is changed near the tip clearance.
(4)
The TLV trajectory is consistent with that of low pressure and the highest-entropy gradient troughs near the shroud. With decreased discharge, the TLV initial position and the interface between the main flow and the leakage flow gradually move upstream. The tip leakage angle increases significantly.

Author Contributions

Conceptualization, B.Q. and Y.C.; methodology, Y.C.; software, L.W.; validation, B.Q., Y.C. and Q.D.; formal analysis, W.S. and L.W.; investigation, W.S.; resources, B.Q.; data curation, B.Q.; writing—original draft preparation, D.Z.; writing—review and editing, D.Z.; visualization, Q.D.; supervision, D.Z.; project administration, W.S.; funding acquisition, D.Z. All authors have read and agreed to the published version of the manuscript.

Funding

This research was funded by the National Natural Science Foundation of China, grant number 52179089.

Institutional Review Board Statement

Not applicable.

Informed Consent Statement

Not applicable.

Data Availability Statement

Not applicable.

Conflicts of Interest

The authors declare no conflict of interest.

Nomenclature

QdDesign discharge
HdDesign head
HnStandard helicity
MMeridional distance of blade
TLVTip leakage vortex
PVPassage vortex
BEPBest efficiency point
WVWave vortex
CVCorner vortex
RVFReverse flow vortex
EPREntropy production rate
CpStatic pressure coefficient

References

  1. Huang, S.; Su, X.; Guo, J.; Yue, L. Unsteady numerical simulation for gas–liquid two-phase flow in self-priming process of centrifugal pump. Energy Conv. Manag. 2014, 85, 694–700. [Google Scholar] [CrossRef]
  2. Wang, L.K.; Lu, J.L.; Liao, W.L.; Zhao, Y.P.; Wang, W. Numerical Simulation of the Tip Leakage Vortex Characteristics in a Semi-Open Centrifugal Pump. Appl. Sci. 2019, 9, 5244. [Google Scholar] [CrossRef] [Green Version]
  3. Michael, M.; Bernd, W.; Thévenin, D. Effect of tip clearance gap and inducer on the transport of two-phase air-water flows by centrifugal pumps. Exp. Therm. Fluid Sci. 2018, 99, 487–509. [Google Scholar]
  4. Liu, Y.; Tan, L.; Hao, Y.; Xun, Y. Energy performance and flow patterns of a mixed flow pump with different tip clearance sizes. Energies 2017, 10, 191. [Google Scholar] [CrossRef]
  5. Zhang, H.; Yang, C.; Yang, D.; Wang, W. Investigation on the Stall Inception Circumferential Position and Stall Process Behavior in a Centrifugal Compressor with Volute. J. Eng. Gas Turb. Power 2019, 141, 021030. [Google Scholar] [CrossRef]
  6. KC, A.; Lee, Y.; Thapa, B. CFD study on prediction of vortex shedding in draft tube of Francis turbine and vortex control techniques. Renew. Energy 2016, 86, 1406–1421. [Google Scholar] [CrossRef]
  7. Lu, J.; Wang, L.; Liao, W.; Zhao, Y.; Ji, Q. Entropy Production Analysis for Vortex Rope of a Turbine Model. J. Hydraul. Eng. 2019, 50, 233–241. [Google Scholar]
  8. Liu, C.; Wang, Y.; Yang, Y.; Duan, Z. New omega vortex identification method. Sci. China Phys. Mech. 2016, 59, 684711. [Google Scholar] [CrossRef]
  9. Zhang, Y.; Wang, X.; Zhang, Y.; Liu, C. Comparisons of and analyses of vortex identification between omega method and Q criterion. J. Hydrodyn. 2019, 31, 224–230. [Google Scholar] [CrossRef]
  10. Zhang, Y.; Qiu, X.; Chen, F.; Liu, K.; Dong, X. A selected review of vortex identification methods with applications. J. Hydrodyn. 2018, 30, 767–779. [Google Scholar] [CrossRef]
  11. Zhang, Y.; Liu, K.; Li, J.; Xian, H.; Du, X. Analysis of the vortices in the inner flow of reversible pump turbine with the new omega vortex identification method. J. Hydrodyn. 2018, 30, 463–469. [Google Scholar] [CrossRef]
  12. Jia, X.; Cui, B.; Zhang, Y.; Zhu, Z. Study on Internal Flow and External Performance of a Semi-open Impeller Centrifugal Pump with Different Tip Clearances. Int. J. Turbo. Jet-Engines 2015, 32, 1–12. [Google Scholar] [CrossRef]
  13. Boitel, G.; Fedala, D.; Myon, N. Tip clearance effects on loads and performances of semi-open impeller centrifugal pumps at different specific speeds. Earth Environ. Sci. 2016, 49, 032013. [Google Scholar] [CrossRef]
  14. Cui, B.; Huang, S.; Shi, P.; Jin, Q. Effect of tip clearance on performance of low specific speed centrifugal pump with semi-open impeller. J. Drain Irrig. Mach. Eng. 2012, 30, 283–288. [Google Scholar]
  15. Farid, A.; Abdalla, H.; Abou, E. Effect of semi-open impeller side clearance on the centrifugal pump performance using CFD. Aerosp. Sci. Technol. 2015, 47, 247–255. [Google Scholar]
  16. He, X.; Gong, W.; Deng, J.; Li, J.; Liang, L. Influence of Impeller Tip Clearance on the Performance of Centrifugal Refrigeration Compressor. J. Xi’an Jiaotong Univ. 2019, 53, 30–37. [Google Scholar]
  17. Yang, C.; Shan, S.; Li, D. Inlet Recirculation Influence to the Flow Structure of Centrifugal Impeller. Chin. J. Mech. Eng. 2010, 23, 647–654. [Google Scholar] [CrossRef]
  18. Zhao, H.; Wang, Z.; Xi, G. Unsteady flow structures in the tip region for a centrifugal compressor impeller before rotating stall. Sci. China-Technol. Sci. 2017, 60, 122–132. [Google Scholar] [CrossRef]
  19. Wu, Y.; Li, Q.; Chu, W.; Su, Z. Numerical investigation of the unsteady behaviour of tip clearance flow and its possible link to stall inception. Proc. Inst. Mech. Eng. Part A-J. Power Energy 2010, 224, 85–96. [Google Scholar] [CrossRef]
  20. Zhang, Y.; Lu, X.; Chu, W.; Zhu, J. Numerical Investigation of the Unsteady Tip Leakage Flow and Rotating Stall Inception in a Transonic Compressor. J. Therm. Sci. 2010, 19, 310–317. [Google Scholar] [CrossRef]
  21. Lu, J.; Guo, L.; Wang, L.; Wang, W.; Guo, P.; Luo, X. Research on the Unsteady Flow of Tip Clearance in Semi-open Impeller Centrifugal Pump. Trans. Chin. Soc. Agric. Eng. 2019, 50, 163–172. [Google Scholar]
  22. Xu, Y.; Tan, L.; Liu, Y.; Hao, Y.; Zhu, B.; Cao, S. Pressure fluctuation and flow pattern of a mixed flow pump with different blade tip clearances under cavitation condition. Adv. Mech. Eng. 2017, 9. [Google Scholar] [CrossRef]
  23. Li, X.; Yuan, S.; Pan, Z.; Li, Y.; Liu, W. Dynamic Characteristics of Rotating Stall in Mixed Flow Pump. J. Appl. Math. 2013, 10, 4819–4828. [Google Scholar] [CrossRef]
  24. Wang, L.; Lu, J.; Liao, W. Numerical investigation on vibration and pressure fluctuation characteristics in a centrifugal pump under low flow rate. Proc. Inst. Mech. Eng. Part C J. Mech. Eng. Sci. 2021, 235, 3888–3899. [Google Scholar] [CrossRef]
  25. Chen, G.; Greitzer, E.; Tan, C. Similarity Analysis of Compressor Tip Clearance Flow Structure. J. Turbo 1991, 113, 260–269. [Google Scholar] [CrossRef]
  26. Matzgeller, R.; Burgold, Y. Investigation of Compressor Tip Clearance Flow Structure. In Proceedings of the ASME Turbo Expo 2010: Power for Land, Sea, and Air, Glasgow, UK, 14–18 June 2010; Volume 7: Turbomachinery, Parts A, B, and C, pp. 455–464. [Google Scholar]
  27. Zhao, H.; Wang, Z.; Ye, S.; Xi, G. Numerical investigations on tip leakage flow characteristics and vortex trajectory prediction model in centrifugal compressor. Proc. Inst. Mech. Eng. Part A-J. Power Energy 2016, 230, 757–772. [Google Scholar] [CrossRef]
  28. Iwakiri, K.; Furukawa, M.; Ibaraki, S.; Tomita, I. Unsteady and Three-Dimensional Flow Phenomena in a Transonic Centrifugal Compressor Impeller at Rotating Stall. In Proceedings of the ASME Turbo Expo 2009: Power for Land, Sea, and Air, Orlando, FL, USA, 8–12 June 2009; Volume 7: Turbomachinery, Parts A and B, pp. 1611–1622. [Google Scholar]
  29. Hong, S.; Huang, G.; Lu, W.; Yang, Y. Flow Characteristics of a Centrifugal Compressor in near Stall Condition and Rolling up Vortex Model of Tip Leakage Vortex. J. Prop. Tech. 2018, 39, 78–86. [Google Scholar]
  30. Jia, X.; Zhu, Z.; Yu, X.; Zhang, Y. Internal unsteady flow characteristics of centrifugal pump based on entropy generation rate and vibration energy. Proc. Inst. Mech. Eng. Part E-J. Process. Mech. Eng. 2019, 233, 456–473. [Google Scholar] [CrossRef]
  31. Behzadmehr, A.; Mercadier, Y. Numerical study of flow parameters and entropy generation on a centrifugal fan. Int. J. Exergy 2009, 6, 80–92. [Google Scholar] [CrossRef]
  32. Li, D.; Wang, H.; Qin, Y.; Han, L.; Wei, X.; Qin, D. Entropy production analysis of hysteresis characteristic of a pump-turbine model. Energy Conv. Manag. 2017, 149, 175–191. [Google Scholar] [CrossRef]
Figure 1. Semi-open centrifugal pump.
Applsci 12 05270 g001
Figure 2. Impeller and vaneless diffuser meridional shape.
Applsci 12 05270 g002
Figure 3. Schematic sketch of the experimental system.
Applsci 12 05270 g003
Figure 4. Mesh independence.
Applsci 12 05270 g004
Figure 5. Computational domain grids of the impeller. (a) Impeller; (b) Blade inlet; (c) Blade outlet.
Applsci 12 05270 g005
Figure 6. Comparison between experimental and numerical data: (a) external characteristic curves; (b) pressure fluctuation under low-discharge condition.
Applsci 12 05270 g006
Figure 7. Vortex structure defined by the proposed omega vortex identification method: (a) 1.6 Qd; (b) 1.0 Qd; (c) 0.7 Qd.
Applsci 12 05270 g007aApplsci 12 05270 g007b
Figure 8. Tip streamline distribution along the streamwise direction: (a) 1.6 Qd; (b) 1.0 Qd; (c) 0.7 Qd.
Applsci 12 05270 g008
Figure 9. Absolute flow-angle distribution along the circumferential direction at 0.93 span.
Applsci 12 05270 g009
Figure 10. Tip streamline distribution along the streamwise direction: (a) 1.6 Qd; (b) 1.0 Qd; (c) 0.7 Qd.
Applsci 12 05270 g010
Figure 11. EPR distribution along the streamwise direction.
Applsci 12 05270 g011
Figure 12. Blade load of different span planes: (a) 1.6 Qd; (b) 1.0 Qd; (c) 0.7 Qd.
Applsci 12 05270 g012
Figure 13. Cp distribution at 0.93 span: (a) 1.6 Qd; (b) 1.0 Qd; (c) 0.7 Qd.
Applsci 12 05270 g013
Figure 14. EPR distribution at 0.93 span: (a) 1.6 Qd; (b) 1.0 Qd; (c) 0.7 Qd.
Applsci 12 05270 g014
Publisher’s Note: MDPI stays neutral with regard to jurisdictional claims in published maps and institutional affiliations.

