Article

Few-Layer Graphene as an Efficient Buffer for GaN/AlN Epitaxy on a SiO2/Si Substrate: A Joint Experimental and Theoret-ical Study

by
Denis Petrovich Borisenko
1,*,
Alexander Sergeevich Gusev
1,*,
Nikolay Ivanovich Kargin
1,
Petr Leonidovich Dobrokhotov
1,
Alexey Afanasievich Timofeev
1,
Vladimir Arkhipovich Labunov
1,2,
Mikhail Mikhailovich Mikhalik
2,
Konstantin Petrovich Katin
1,*,
Mikhail Mikhailovich Maslov
1,
Pavel Sergeevich Dzhumaev
1 and
Ivan Vladimirovich Komissarov
2
1
Nanoengineering in Electronics, Spintronics and Photonics Institute, National Research Nuclear University “MEPhI”, Kashirskoe Shosse 31, 115409 Moscow, Russia
2
Laboratory “Integrated Micro- and Nanosystems”, Belarusian State University of Informatics and Radioelectronics, 6 P. Browka Street, 220013 Minsk, Belarus
*
Authors to whom correspondence should be addressed.
Submission received: 13 October 2022 / Revised: 8 November 2022 / Accepted: 9 November 2022 / Published: 13 November 2022

Abstract

:
Single-layer (SLG)/few-layer (FLG) and multilayer graphene (MLG) (>15 layers) samples were obtained using the CVD method on high-textured Cu foil catalysts. In turn, plasma-assisted molecular beam epitaxy was applied to carry out the GaN graphene-assisted growth. A thin AlN layer was used at the initial stage to promote the nucleation process. The effect of graphene defectiveness and thickness on the quality of the GaN epilayers was studied. The bilayer graphene showed the lowest strain and provided optimal conditions for the growth of GaN/AlN. Theoretical studies based on the density functional theory have shown that the energy of interaction between graphene and AlN is almost the same as between graphite sheets (194 mJ/m2). However, the presence of vacancies and other defects as well as compression-induced ripples and nitrogen doping leads to a significant change in this energy.

1. Introduction

Heteroepitaxy of III-nitrides is one of the most widely developed techniques for the manufacturing of devices for optoelectronics (light-emitting diodes [1,2], laser diodes [3,4], ultraviolet emitters [5]) and high-frequency power electronics [6,7]. Due to the lack of cheap GaN or AlN wafers of sufficient size, GaN-based structures are usually deposited on various foreign substrates such as sapphire, 4H-SiC (0001) or silicon (111). The main drawback of sapphire is its low thermal conductivity, whereas silicon carbide substrates are still rather expensive. Silicon wafers are more manufacturable and significantly cheaper [8]. They have sufficient size (up to 8 inches) and higher thermal conductivity than Al2O3. The ability to manufacture GaN-based devices in fully depreciated 6- or 8-inch wafer silicon fabrication plants provides the cost competitiveness of GaN-on-Si technology [9]. Despite all the successes, obtaining III-nitrides on Si substrates is still problematic due to the differences in lattice constants (18%) and thermal expansion coefficients (46%) of these materials [10]. Thus, GaN-on-Si technology requires a complex buffer design including different transition layers and superlattices [11,12] to reduce the dislocation density and residual stresses.
In some recent works, researchers regarded graphene as a suitable 2D buffer, which facilitated the high-quality epitaxy of III-nitrides layers on a silicon substrate via both the MOCVD [13,14,15,16] and MBE techniques [17,18,19]. Graphene has a hexagonal crystal lattice comparable to the (0001) plane of a GaN (AlN) crystal in the wurtzite phase. In addition, graphene is thermally stable and can be transferred to an arbitrary substrate. The Van der Waals interaction at the III-nitride/graphene interface provides reliable binding despite some lattice constants mismatch. In addition, gallium atoms can migrate on the graphene surface due to the sufficiently low migration barrier (12 meV) [20]. On the other hand, the nucleation on the pristine graphene is very difficult due to the absence of dangling bonds on its surface [21]. Islands of nuclei appear primarily at the graphene wrinkles. This effect leads to poor morphology and high defect density in GaN epilayers. Oxygen [22] or nitrogen [23,24] plasma pretreatment can be applied to promote GaN nucleation and growth on the graphene surface. In addition, the work function, surface potential, surface oxidation and chemical activity of few-layer graphene highly depend on the number of layers. Therefore, number of layers influence on the density and activity of nucleation sites.
Despite the growing interest in the graphene-assisted epitaxy of III-nitrides, there are only a few studies considering the dependence of the nucleation process on the number of graphene layers [21,25,26,27]. The only work devoted to the growth of GaN by MBE on graphene-coated SiO2 substrates was conducted by [25]. However, the authors of [25] considered only XRD data. In our previous works [18,28], GaN and AlN graphene-assisted epitaxy using the PA-MBE method on an amorphous substrate was demonstrated. In the present paper, we investigate the epitaxy of GaN/AlN on few-layer and multilayer CVD graphene. The effect of the number of graphene sheets, surface properties and defectiveness of the 2D buffer on the quality of the resulting III-nitrides epitaxial layers are considered in detail. A theoretical study of the AlN–graphene interaction conducted using the density functional theory complements the experimental results.

2. Experimental Section

We deposited graphene on pure copper foil (99.999%, Alfa Aesar) using atmospheric-pressure chemical vapor deposition (AP-CVD). Two gases, methane and ethylene, were used as precursors. The synthesis took place in a cylindrical quartz reactor with a diameter of 14 mm. We used a custom-made CVD setup (Figure S1e). The sample size was equal to 35 × 45 mm2. The temperature and duration of the catalyst annealing were equal to 1 h at 1050 °C, respectively. Two gases, nitrogen N2 and hydrogen H2, were involved during annealing. Their flow rates were equal to 100 and 150 cm3 min−1, respectively. Single-layer (SLG)/few-layer (FLG) and multilayer graphene (MLG) (>15 layers) samples were obtained from the reactor at 1054 °C within 20 min. Subsequent cooling of the reactor in the presence of gaseous nitrogen flow was conducted at a rate of 50 °C min−1. For SLG, in order to preserve the integrity of the graphene during wet-chemical transfer, we used a polymer support, which was subsequently removed using special techniques. In the case of multilayer graphene, a wet-chemical transfer was carried out without polymer support. After the process of graphene synthesis, the copper catalyst was completely etched in an aqueous solution of FeCl3. After removal of the catalyst, the graphene films were carefully transferred to the surface of 3-inch silicon wafers with 500 nm-thick thermal oxide (SiO2/Si).
The methods of scanning electron microscopy and scanning probe microscopy were used to study the morphology and surface relief of the experimental samples. For all AFM measurements, a Solver Open microscope (NT-MDT) was applied in the semi-contact scanning mode with a NSG01-brand cantilever. The typical tip curvature radius for this cantilever is 10 nm.
The analysis of the crystal structure and crystalline perfection was carried out by the electron backscatter diffraction (EBSD) and high-resolution X-ray diffraction (HRXRD) methods. An Ultima IV (Rigaku) diffractometer provided XRD patterns of the considered samples. We used the wavelength λ corresponding to CuKα (0.15406 nm).
Deformations, doping, defectiveness, thickness, and quality of graphene were estimated via Raman spectroscopy. We used a confocal micro-Raman spectrometer Confotec NR500. It provides an excitation wavelength, spectral resolution and spectral accuracy of about 532 nm, 1 cm−1, and ~1 cm−1, respectively.
The number of graphene layers was also estimated using the classical light transmission method. Here, optical quartz plates were used as a substrate. Spectral measurements were performed using a UV-2600 Shimadzu spectrometer.
In this work the plasma-assisted molecular beam epitaxy system Veeco GEN 930 was used to carry out the process of III-nitrides graphene-assisted growth. After low-temperature annealing (200 °C) in the load-lock chamber, the wafer with the graphene buffer was attached to a substrate holder in the growth module. This was followed by high-temperature annealing at growth temperature (in the range of 700–720 °C) under ultrahigh vacuum conditions. First, a 35 nm-thick AlN wetting layer was deposited. The temperature of the Al effusion cell was 1060 °C providing nitrogen enriched conditions. Both shutters (for Al and N cells) were opened simultaneously and remained open throughout the entire time of the AlN nucleation growth (480 s). After that, a 500 nm-thick GaN layer was grown. The temperature of the Ga cell was 970 °C providing metal-rich conditions. A Metal Modulated Epitaxy (MME) technique was used which consists in the pulsed gallium supply to prevent its accumulation on the surface in the form of liquid metal droplets, while the flow of active nitrogen remained constant throughout the entire GaN growth process. The pulse duration (open state time of the Ga shutter), monitored with an optical pyrometer, was 8 s, while the pulse repetition period was 22 s. The GaN growth consisted of 300 periods. The nitrogen consumption in both cases (AlN and GaN growth) was 1.6 sccm at an RF source power of 350 W. The power of the substrate heater was maintained at a constant level throughout the growth process.
The experimental samples were also investigated using an in situ reflection high-energy electron diffraction technique (RHEED). RHEED patterns at all growth stages were monitored using a standard 15 kV RHEED (STAIB Instruments) system equipped with a 6-inch phosphor screen flange and a high-resolution CCD camera. The electron beam in RHEED hits the wafer surface at an angle of inclination (~1°), which makes this method extremely valuable for studying the crystal integrity of graphene samples and can be a valuable tool for checking the structure and quality of graphene on the surface of amorphous substrates before manufacturing various devices. It should be noted that RHEED patterns can be obtained in the entire range of azimuthal angles φ from 0° to 360° due to the possibility of wafer holder rotation controlled by a stepper motor. The beam reflection profiles were obtained at different sample rotation angles in increments of 1°.
To supplement the obtained experimental results, we carried out modelling of the AlN–graphene interaction. Calculations were carried out within the density functional theory with dispersion Grimme corrections [29], which ensure correct accounting for non-covalent interlayer interactions, as provided in the Quantum Espresso package [30,31]. Ultrasoft pseudopotentials with the GGA-PBE functional were used for all elements [32,33]. The cutoff energy of the plane wave basis was chosen to be equal to 45 Ry. The number of points of the Monkhorst-Pack grid [34] in k-space was 4 × 4 × 1. The first order Metfessel-Paxton scheme with 0.01 Ry smearing was used [35]. Structural optimization continued until the residual forces became less than 0.1 meV/Å.

3. Results and Discussion

Figure 1a shows the scanning electron microscopy (SEM) image of 25 μm thick Cu foil after graphene growth. Additional SEM and AFM images of the copper foil surface are given in the supporting information (Figure S1a,b). The surface of Cu is smooth, without pits, with an average grain size of 80–150 µm. The dominant orientation of the copper grains was analyzed using the XRD method (Figure 1b,c).
As follows from the X-ray diffraction analysis, the copper catalyst used has a predominant (100) orientation (Figure 1b). The measured XRD θ–2θ scan (Figure 1b), shows a Cu (200) peak (2θ = 50.37°). The presence of one diffraction peak indicates a good texture with out-of-plane grain orientation along the <100> direction. The inset to Figure 1b shows the Cu (200) peak profile, with a characteristic small width at half maximum (FWHM) of ~0.19°. The small value of the FWHM suggests that the Cu film has a high crystalline quality. For additional study of the texture, an incomplete X-ray pole figure (PF) (100) was assembled (Figure 1c). The maximum tilt angle at this PF does not exceed 70°, so only the central maxima are visible. To evaluate the domain sizes and microstructure of the Cu (100) foil, an EBSD analysis was performed (Figure 1d–f). Figure 1d shows a crystallographic map of the Cu film orientation using the inverse pole figure (IPF)-Z component, which correlates spatial crystallographic orientations with respect to the normal sample surface. The color uniformity in Figure 1d (corresponding to the stereographic triangle in Figure 1e) suggests that the normal direction of the sample is <100> over the entire map. Figure S1c shows the <100> angular deviation orientation map of copper grains. The dominance of one color demonstrates the mutual direction of all copper grains along the direction with a slight misorientation of several degrees (~2°) (Figure S1d). Figure 1f shows the Cu (100) EBSD PF in the sample normal direction, which is fully consistent with the results of the X-ray diffraction (Figure 1c).
After transfer to an amorphous substrate, the graphene samples were analyzed using the SEM and AFM methods to obtain information on the quality of the surface morphology, the presence of contaminants, wrinkles or various defects. Figure 2a–c shows the quality of the SiO2/Si surface morphology. The root mean square roughness (RMS) calculated from AFM data is about 0.4 nm.
Contrast changes in the SEM images (Figure 2d) indicate the presence of SLG and few-layer graphene (FLG) regions, which were purposefully obtained in the process of graphene synthesis on Cu (100) by the CVD method. However, the AFM is the main method for directly determining and confirming the thickness and roughness of single- and few-layer graphene [36,37,38]. Figure 2e,h shows typical AFM results for transferred graphene on the SiO2/Si substrate surface. As a result of the use of liquid transfer and subsequent drying of the sample, graphene can be raised several additional angstroms above the amorphous substrate [37]. According to the measurements of the AFM profiles (Figure 2f), the height of the areas of multi-layer graphene corresponds to 0.7–0.9 nm and can be identified as two-layer graphene [38]. The observed differences in surface morphology (Figure 2e,h) on the graphene samples are caused by the influence of the number of layers of crumpled graphene on the surface of the SiO2/Si substrate [38]. When using a polymer framework and liquid transfer of graphene onto an amorphous substrate, a certain amount of polymer residues, wrinkles and tears are present on the surface, the number of which is significantly reduced after the process of thermal annealing in the PA-MBE chamber. The liquid process of transferring graphene to the substrate contributes to the deformation of graphene layers, such as bubbles and wrinkles, often formed by the capture of water, gas, or solid nanoparticles at the interface (Figure 2h,i) [39,40,41].
Analysis of the graphene samples’ surface transfer to the SiO2/Si substrate by the EDX method (Figure S2) demonstrates the presence of only three elements: carbon (C), oxygen (O) and silicon (Si). This indicates that we have carried out high-quality operations to cleanse graphene from contamination.
According to the light transmission measurements (Figure 3a), the transmission at 550 nm demonstrates a value of 96.3% for FLG (blue curve) and 60% for MLG (black curve). The first value corresponds to a number of graphene layers between 1 (97.5%) and 2 (95.5%) [42,43]. The second measurement indicates that we have obtained multilayer graphene with a large number of layers (more than 15) [43].
To confirm the morphology and structural quality of the FLG and MLG samples, we applied Raman spectroscopy associated with the emission (Stokes process) or absorption (anti-Stokes process) of phonons [44]. Micro-Raman spectroscopy is particularly useful in obtaining information on the quality, thickness, doping levels, and strain of graphene [45,46,47,48,49,50,51]. Figure 3b,c shows the typical Raman spectra from SLG (red line), FLG (blue line) and MLG (black line), measured at random sections of the substrates. Several main peaks appear on the Raman spectrum of the graphene: the primary mode of vibrations in the plane, G (~1580 cm−1); another vibration in the plane, D (~1350 cm−1); the second-order overtone, 2D (~2690 cm−1) [45]. As known, the G peak corresponds to sp2-hybridized graphene, whereas the D peak arises from defects induced in a perfect sp2-hybridized structure [46]. Peak D is correlated with the disorder in graphene lattice. The positions of the peaks D and 2D are dispersive, so they depend on the energy of laser excitation [46]. In this paper, measurements were obtained using a laser with an excitation of 532 nm. Due to the additional forces arising from the interaction between graphene layers, as the number of layers increases, the spectrum will differ from the spectrum of single-layer graphene, namely the splitting of the 2D peak into an increasing number of modes [47]. Peak G also experiences displacement due to an increase in the number of layers [51]. Thus, to study the number of graphene layers, it is necessary to analyze the ratio of peak intensities 2D and G (I2D/IG), as well as the positions and shapes of these peaks (Figure 3d,g) [50]. In turn, the ratio of ID to IG (ID/IG) reflects the quality of the graphene (Figure 3e,h) [46].
Figure 3d–i shows the maps for the intensity ratio of 2D and G (I2D/IG), the intensity ratio of D and G (ID/IG) Raman bands and maps of 2D peak FWHM. From these maps we can identify areas with different values of the ratios I2D/IG and ID/IG. The value of the I2D/IG ratio greater than 1.3 apparently belongs to the areas of a single-layer graphene with characteristic values of FWHM 2D bands ~30 cm−1 [46,50,51,52,53,54,55]. In addition, these sections of graphene have a slight value of ID/IG (~0.175) (Figure S3c), which also corresponds to single-layer graphene with a small number of defects [46]. Besides the regions typical of SLG, there are areas of FLG graphene with a lower I2D/IG ratio. For such regions the value of the I2D/IG ratio is mainly from 0.5 to 1.25 (Figure 3d and Figure S3a). The value of the FWHM 2D-range is between 44 and 68 cm−1. This indicates the presence of regions of few-layer graphene. It is noteworthy that for regions of FLG, the values of the ID/IG (~0.11) (Figure S3d) ratio are less than that for SLG (Figure S3c). In particular, an increase in the ID/IG ratio suggests that much higher defects prevail and are easily induced in thinner layers [55]. A comparative analysis of histograms of the I2D/IG intensity ratios and ID/IG for an area of 70 × 70 µm (Figure S3) indicates the predominance of single-layer over two-layer fractions in the resulting graphene, which is also confirmed by spectrophotometry data (see Figure 3a). The average values of the FWHM 2D bands for SLG and FLG are about 41 and 56 cm−1, respectively (Figure S3e,f).
In turn, a sample of a multilayer graphene is characterized by a significant decrease in the ratio of I2D/IG (Figure 3g) and an increase in the ratio of ID/IG (Figure 3h). The value of the FWHM 2D bands are significantly increased (Figure 3i). A comparative analysis of the histograms (Figure S3) demonstrates the average value of the ratio I2D/IG is ~0.08 and ~0.61 for ID/IG, while the average value of the FWHM 2D bands is ~111 cm−1 (Figure S3b,g,h). These results indicate the similarity of the synthesized multilayer graphene with graphitized carbon [56].
Various types of defects play an important role in the process of the nucleation and growth of III-nitrides on the graphene surface [21,57]. The studied samples differed in the values of the RMS (Figure 2b,e,h) and the density of defects (Figure 3e,h). A Raman analysis confirmed this conclusion (we adopted the ID/IG ratio as a measure of the density of point defects in graphene [58,59,60,61,62,63,64]). The defect density ( n D ) in the graphene samples used was quantified from the ID/IG ratio as n D ( S L G ) ~3.93 × 1010 cm−2,   n D ( F L G ) = 2.47 × 1010 cm−2 and n D ( M L G ) = 1.37 × 1011 cm−2 for SLG, FLG and MLG, respectively. The topic of distinguishing between the Raman spectra of one and another type of defective sp2 carbon remains an area for future study.
Thus, for further studies of the epitaxy of nitrides, we obtained two separate graphene samples transferred to the amorphous surface of SiO2/Si substrates. Based on the results of Raman spectroscopy and light transmission (Figure 3) of the obtained graphene samples, it is possible to identify SLG, FLG and MLG regions.
It was previously shown [28,65,66], the RHEED technique can be applied for visualization of graphene reciprocal structure and to analyze the ordering of its crystalline domains. Previously [38], it was shown that in the case of a single-crystal 2D material, its reciprocal space structure consists of vertical rods. Because of the relatively large wave vector of electrons in RHEED, the Ewald sphere is large and crosses the rods in reciprocal space. In general, bands form in RHEED patterns in 2D materials (Figure S4a). We obtained the reciprocal lattice of the 2D material by the measuring of streaks as a function of the momentum transfer parallel to the surface (k) at different azimuthal angles φ [28,65,66]. We constructed a reverse space map for graphene with two types of crystallites with a mutual rotation of 30° (Figure S4c), which is synthesized on a Cu (100) catalyst using the CVD method [28].
The RHEED method was used to analyze the graphene in situ and control the processes of nucleation and subsequent stages of III-nitride growth (Figure 4 and Figure 5). Figure 4 shows the RHEED patterns from the FLG (Figure 4a) and MLG (Figure 4d) transferred to a SiO2/Si substrate. The in-plane structures of graphene and GaN/AlN films can be derived from their observed structures in 2D reciprocal space. In the reciprocal space, the radius and polar angle correspond to the reciprocal distance from the (00) spot and azimuthal angle, respectively. Figure 4b,e shows the intensity profiles of line scans as a function of k|| (the distances from (hk) to (00)) at a fixed value k [28,65]. Since a sample with FLG is more characterized by SLG regions, the widened peaks characteristic of graphene are noticeable in the RHEED images (Figure 4a–c). In the case of MLG, the main peaks are characterized by a smaller FWHM (Figure 4e), which leads to the more contrasting RHEED reciprocal space structure (Figure 4f). A smaller half-width value is associated with a larger value of the thickness of the MLG film compared to FLG.
The growth kinetics of the AlN wetting layer on graphene to improve the quality of the GaN epitaxial layers is not well-studied. Nevertheless, in this work, we used the standard nucleation process, which showed itself well during the growth of heterostructures on SiC (30–40 nm-thickness of the AlN layer under a N2-rich regime at TS = 710 °C). PA-MBE growth at this stage was also controlled by the RHEED method (Figures S5.1 and S5.2).
The next RHEED patterns (Figure 5a,e) measured along the axes of the [0110] band follow the PA-MBE growth of GaN/AlN epilayers on different regions of the graphene buffer: FLG (Figure 5a) and MLG (Figure 5e). Note that the axes of the [0110] band correspond to φ = 0°.
Figure 4c,f shows the reciprocal space structures of the transferred FLG and MLG. Figure 4c,f, shows twelve mutually symmetrical spots at the reciprocal distances of 2.9 and 5.1 Å−1 from the center. These correspond to graphene domains randomly oriented with respect to each other. According to our previous study [28], the direction of graphene growth is rotated by 30° because of the 60° crossing of in-plane grain boundaries. Therefore, twelve observed peaks point to two graphene domains disoriented by 30°. Figure 5c,g shows constructed structures of the 2D reciprocal space derived from our experiments Figure 5c,g). Characteristic peaks from GaN grown on FLG (Figure 5a–c) demonstrate a greater intensity value with a smaller FWHM compared to nitride on MLG (Figure 5e–g). These results indicate the production of a higher-quality gallium nitride with a smooth surface morphology on FLG.
Figure 6 shows SEM images of the surface of GaN grown on an AlN/graphene/SiO2/Si substrate. One can trace the difference between GaN growth on the SLG (Figure 6a,b) and FLG (Figure 6c) regions. The SEM images clearly show areas of different contrast (Figure 7a), differing in the quality of the epitaxial layers and surface morphology (Figure 6b,c). These areas correlate well with areas of single-layer and few-layer graphene (Figure 2d,e) before PA-MBE growth. Figure 6d shows a general AFM scan of the GaN/AlN film on SLG and FLG. Figure 6e,f shows AFM scans of GaN/AlN films on the SLG (Figure 6e) and FLG (Figure 6f) areas separately. Figure 6g–i shows SEM and AFM images of GaN/AlN film grown on MLG.
In the PA-MBE process, epitaxial GaN/AlN layers grow directly on the graphene-coated regions; in other places, the nitride layers are polycrystalline. The formation of polycrystalline GaN/AlN occurs due to the low surface mobility of the adatom and rare nucleation sites. These regions possess increased reactivity and therefore facilitate nucleation of AlN. The improvement in the quality of the GaN layers in the sections of FLG indicates that the density of AlN cores correlates with the density of defects in graphene and its root-mean-square roughness. This correlates well when comparing the growth of GaN/AlN on graphene with different numbers of layers (Figure 6).
The thickness of the graphene significantly affects the selectivity of the growth of layers of III nitrides. Figure 6 confirms this conclusion for all the samples studied. A particularly clear contrast is observed in Figure 2e, where FLG regions are present. The contrast is due to the different number of graphene layers. The light and dark areas in the figure correspond to small and large numbers of graphene layers, respectively. Epitaxial layers of nitrides of the best quality are formed only in the darker regions (few-layer graphene), while in the light regions (low-layer graphene) the nucleation of nitrides is worse, as can be seen from Figure 6a–f. We assume that the role of graphene n-layers can be explained by differences in surface potential or chemical reactivity.
In the case of the growth of nitrides on multilayer graphene, epitaxial layers are characterized by a developed surface morphology with the presence of a large number of structural defects (Figure 6g–i). There are also distinctly traced areas of a circular shape (Figure 6i), where bubbles with liquid were presumably present after the transfer of multilayer graphene to the surface of the amorphous substrate (Figure 2g–i). The surface of the bubbles was characterized by a convex shape (Figure 2i), which led to the formation of a polycrystalline layers of nitrides on its surface (Figure 6i). EDX analysis (Figure S6f) of nitride film on MLG indicates the presence of a small amount of copper, which confirms the nature of the observed bubbles due to fluid residues during the liquid transfer of graphene to the amorphous substrate.
By mapping Raman spectra and determining the intensity of the graphene and nitride peaks, we can identify regions of SLG and FLG graphene after PA-MBE of the III-nitride layers. Figure 7 shows the Raman maps for the obtained experimental samples. In the spectra of epitaxial layers, it is possible to identify the combination peaks of graphene (D-band, G-band, and 2D-band), as well as the characteristic E2(high)-peak of GaN allowed for a c-oriented wurtzite structure. These data indicate that graphene remained under the nitride film. To characterize areas with a different number of graphene layers (SLG and FLG), maps of the G-peak intensity (Figure 7b,e) and maps of the E2(high) peak intensity (Figure 7b,e) and position (Figure 7c,f) were constructed. Raman spectral mapping of high peak GaN E2 (Figure 7a,c) confirmed the selectivity of the GaN cores with respect to graphene-coated wafer areas. Analyzing the Raman spectral maps of the G-peak intensity (Figure 7a,d and Figure S7a,b), it can be seen that the areas with a high intensity value (>200) of the G-peak can be attributed to FLG, and areas with a lower intensity value (<200) to SLG (Figure 7a and Figure S7a). Analyzing the maps of the position and intensity of the E2(high)-peak of GaN (Figure 7b,c and Figure S7c–f), it can be concluded that the characteristic areas of SLG and FLG experience different stress values in the epitaxial layers of nitrides (Figure 7c). The difference in stress values may be associated with stress relaxation due to the occurrence of additional defects during growth on more defective sections of graphene that correspond to SLG. Thus, nitride nucleation occurs more qualitatively on the FLG regions, which are less defective than the SLG regions.
The observed differences in the surface morphology of the obtained epitaxial layers of III-nitrides can be explained by the initial difference between graphene areas. For SLG sections, the average value of the E2(high) band position is ω~567.6 (Figure 7b and Figure S7e). At the same time, we observed a slight red shift of the E2(high) band (ω = 567.4 cm−1), as indicated in Figure 7b and Figure S7f. Figure 7e and Figure S7h show a significant shift for GaN grown on the MLG buffer (ω = 568.4 cm–1). Red shift of E2(high) mode frequency usually indicates a tensile strain, typical for epitaxial GaN grown on Si (111) substrate. The coefficient 4.2 cm−1 GPa−1 describes the linear dependence between biaxial stress and spectral shift of the E2 phonon mode. Therefore, we calculated a tensile stress of GaN equal to 0.05 ± 0.01 GPa and ~0.2 ± 0.01 GPa for GaN grown on FLG and MLG, respectively. This value is much lower than the typical stress of GaN on silicon substrate (0.4–0.68 GPa). The results of the Raman spectroscopy show that the formation of nitrides on graphene with higher roughness leads to a significant increase in graphene defects and deterioration in the quality of the nitride layers.
We investigated the interaction of graphene with AlN crystal and the effect of defects on the interaction energy between the layers. As an atomistic model, a rectangular C100Al64N64H32 cell was considered, containing one graphene layer and two layers of aluminum nitride (see Figure 8). The outer surface of aluminum nitride was passivated by hydrogen atoms. The ratio of the AlN and graphene lattices constants is close to 5:4, therefore the aluminum nitride and graphene layers contained 4 × 4 and 5 × 5 elementary cells, respectively. The positions of atoms and the lattice vectors were optimized simultaneously. As a result, we obtained the optimal cell size of 12.37 × 21.33 Å2. The energy of the interaction between graphene and aluminum nitride was calculated by the formula:
Eb = (E(C100) + E(Al64N64H32) − E(C100Al64N64H32))/S
where S is the cell area. The resulting interaction energy was 0.194 J/m2, which is very close to the energy of interlayer interaction in graphite. Thus, the graphene/graphene and graphene/AlN interfaces are almost equally energetically feasible. The optimal distance between graphene and AlN layers was equal to 3.66 Å.
Next, we investigated the effect of uniaxial stretching and compression, as well as characteristic defects in graphene (vacancies, Stone–Wales defect and impurity atom of nitrogen) by Eb. Stretching and defects may occur as a result of the interaction of graphene with a silicon substrate if the number of graphene layers is not large enough. It is well known that graphene compression leads to its wave-like curvature without substantial shortening of C-C bonds. Therefore, the simulation of compressed graphene provides an estimation of the effect of sheet roughness on its interaction with AlN. In our study, the compression of the system by 5% led to roughness, at which the distance between the graphene and AlN layer was changed in the range of 3.2 to 4.3 Å.
The influence of various defects on the EB value is represented in Table 1. Only one defect per cell shown in Figure 8 was introduced. Table 1 confirms that increased roughness due to graphene compression significantly enhances the interaction of graphene with AlN. In contrast, graphene stretching weakens this interaction. As for defects, only vacancies in graphene lead to a significant increase in the magnitude of EB.
On Figure 9a,c fragments of XRD spectra are shown, including GaN (0002) (2θ = 34.63°) and AlN (0002) (2θ = 36.06°) maxima for FLG (Figure 9a) and MLG (Figure 9c). The FWHM value of the (0002) rocking curve for GaN grown on an FLG buffer is 6.95 arc. min. For GaN on MLG the FWHM of the (0002) rocking curve was 7.848.
In turn, Figure 9b,d shows the ω (rocking) scans for GaN/AlN samples, grown on FLG and MLG buffers, respectively. The peaks are centered at 34.56°, and a higher number of graphene layers results in the peaks broadening. The FWHM value increases from 55.55 to 60.00 arc. min. for samples grown on FLG and MLG buffers, respectively. The wider peaks observed in the case of using the MLG buffer confirm a poorer orientation and a large number of defects in the GaN grown on MLG.

4. Conclusions

In summary, we grew a bulk GaN/AlN on CVD graphene, transferred on silicon substrate coated by an amorphous oxide layer. In comparison with our previous works [18,28] on the study of nitrides epitaxy using a graphene buffer, in this research we clearly demonstrate that the number of graphene layers, the type of strain and defects are crucial for the high-quality epitaxy of GaN/AlN by the PA-MBE method. We found a strong correlation between the number of graphene layers and the quality of GaN/AlN grown on it. Bilayer and few-layer graphene were recognized as the most suitable buffers, which provide plasma-assisted molecular beam epitaxy of perfect GaN/AlN films. This fact can be explained by the difference in the FLG and MLG stiffness and defectiveness. We believe that our investigation contributes to the development of GaN-on-Si technology, which promises some benefits, such as low cost and high manufacturability. Due to its flat structure, moderate activity and tendency to non-covalent interaction, graphene probably can also be used for epitaxial growth of III-nitrides on other substrates which are amorphous of have a crystal lattice unsuitable for binding to III nitrides.

Supplementary Materials

The following supporting information can be downloaded at: https://0-www-mdpi-com.brum.beds.ac.uk/article/10.3390/app122211516/s1.

Author Contributions

Conceptualization, N.I.K., A.S.G., and D.P.B.; methodology, D.P.B., A.S.G., I.V.K., and K.P.K.; software, D.P.B. and K.P.K.; validation, D.P.B., A.S.G., I.V.K., and K.P.K.; formal analysis, D.P.B., A.S.G., I.V.K., and K.P.K.; investigation, D.P.B., A.S.G., P.L.D., A.A.T., M.M.M. (Mikhail Mikhailovich Mikhalik), K.P.K., M.M.M. (Mikhail Mikhailovich Maslov), and P.S.D.; resources, N.I.K., A.S.G., I.V.K., and K.P.K.; data curation, D.P.B., A.S.G., and I.V.K.; writing—original draft preparation, D.P.B.; writing—review editing, K.P.K., A.S.G., and D.P.B.; visualization, D.P.B., A.S.G., and K.P.K.; supervision, N.I.K. and V.A.L.; project administration, N.I.K.; funding acquisition, N.I.K. All authors have read and agreed to the published version of the manuscript.

Funding

This research received no external funding.

Institutional Review Board Statement

Not applicable.

Informed Consent Statement

Not applicable.

Data Availability Statement

The data presented in this study are available in Supplementary Materials.

Acknowledgments

This work was carried out using the equipment of the MEPhI Shared-Use Equipment Center (http://ckp-nano.mephi.ru, accessed on 31 October 2022).

Conflicts of Interest

The authors declare not conflict of interest.

References

  1. Nakamura, S.; Krames, M.R. History of Gallium–Nitride-Based Light-Emitting Diodes for Illumination. Proc. IEEE 2013, 101, 2211–2220. [Google Scholar] [CrossRef]
  2. Nakamura, S.; Mukai, T.; Senoh, M. Candela-class high-brightness InGaN/AlGaN double-heterostructure blue-light-emitting diodes. Appl. Phys. Lett. 1994, 64, 1687–1689. [Google Scholar] [CrossRef]
  3. Nakamura, S.; Senoh, M.; Nagahama, S.; Iwasa, N.; Yamada, T.; Matsushita, T. and Sugimoto, Y. InGaN-Based Multi-Quantum-Well-Structure Laser Diodes. Jpn. J. Appl. Phys. 1996, 35 Pt 2, L74–L76. [Google Scholar] [CrossRef]
  4. Watson, S.; Tan, M.; Najda, S.P.; Perlin, P.; Leszczynski, M.; Targowski, G.; Grzanka, S.; Kelly, A.E. Visible light communications using a directly modulated 422 nm GaN laser diode. Opt. Lett. 2013, 38, 3792–3794. [Google Scholar] [CrossRef] [PubMed]
  5. Kneissl, M.; Seong, T.-Y.; Han, J.; Amano, H. The emergence and prospects of deep-ultraviolet light-emitting diode technologies. Nat. Photonics 2019, 13, 233–244. [Google Scholar] [CrossRef]
  6. Asif Khan, M.; Bhattarai, A.; Kuznia, J.N.; Olson, D.T. High electron mobility transistor based on a GaN-AlxGa1−xN heterojunction. Appl. Phys. Lett. 1993, 63, 1214–1215. [Google Scholar] [CrossRef]
  7. Mishra, U.K.; Shen, L.; Kazior, T.E.; Wu, Y.-F. GaN-Based RF Power Devices and Amplifiers. Proc. IEEE 2008, 96, 287–305. [Google Scholar] [CrossRef]
  8. Dadgar, A.; Poschenrieder, M.; Bläsing, J.; Contreras, O.; Bertram, F.; Riemann, T.; Krost, A. MOVPE growth of GaN on Si (111) substrates. J. Cryst. Growth 2003, 248, 556–562. [Google Scholar] [CrossRef]
  9. Chen, K.J.; Häberlen, O.; Lidow, A.; Tsai, C.l.; Ueda, T.; Uemoto, Y.; Wu, Y. GaN-on-Si Power Technology: Devices and Applications. IEEE Trans. Electron Devices 2017, 64, 779–795. [Google Scholar] [CrossRef]
  10. Morkoç, H. General properties of nitrides. In Handbook of Nitride Semiconductors and Devices; Wiley-VCH: Hoboken, NJ, USA, 2009. [Google Scholar]
  11. Nikishin, S.A.; Faleev, N.N.; Antipov, V.G.; Francoeur, S.; Grave de Peralta, L.; Seryogin, G.A.; Temkin, H. High quality GaN grown on Si (111) by gas source molecular beam epitaxy with ammonia. Appl. Phys. Lett. 1999, 75, 2073–2075. [Google Scholar] [CrossRef]
  12. Marchand, H.; Zhao, L.; Zhang, N.; Moran, B.; Coffie, R.; Mishra, U.K.; Speck, J.S.; DenBaars, S.P. Metalorganic chemical vapor deposition of GaN on Si (111): Stress control and application to field-effect transistors. J. Appl. Phys. 2001, 89, 7846–7851. [Google Scholar] [CrossRef]
  13. Chung, K.; Lee, C.-H.; Yi, G.-C. Transferable GaN Layers Grown on ZnO-Coated Graphene Layers for Optoelectronic Devices. Science 2010, 330, 655–657. [Google Scholar] [CrossRef] [PubMed]
  14. Chung, K.; Park, S.; Baek, H.; Chung, J.-S.; Yi, G.-C. High-quality GaN films grown on chemical vapor-deposited graphene films. NPG Asia Mater. 2012, 4, e24. [Google Scholar] [CrossRef]
  15. Gupta, P.; Rahman, A.A.; Hatui, N.; Gokhale, M.R.; Deshmukh, M.M.; Bhattacharya, A. MOVPE growth of semipolar III-nitride semiconductors on CVD graphene. J. Cryst. Growth 2013, 372, 105–108. [Google Scholar] [CrossRef]
  16. Li, T.; Liu, C.; Zhang, Z.; Yu, B.; Dong, H.; Jia, W.; Xu, B. GaN epitaxial layers grown on multilayer graphene by MOCVD. AIP Adv. 2018, 8, 045105. [Google Scholar] [CrossRef]
  17. Araki, T.; Uchimura, S.; Sakaguchi, J. Radio-frequency plasma-excited molecular beam epitaxy growth of GaN on graphene/Si (100) substrates. Appl. Phys. Express 2014, 7, 071001. [Google Scholar] [CrossRef]
  18. Borisenko, D.P.; Gusev, A.S.; Kargin, N.I.; Komissarov, I.V.; Kovalchuk, N.G.; Labunov, V.A. Plasma assisted-MBE of GaN and AlN on graphene buffer layers. Jpn. J. Appl. Phys. 2019, 58, SC1046. [Google Scholar] [CrossRef]
  19. Yu, J.; Hao, Z.; Deng, J.; Li, X.; Wang, L.; Luo, Y.; Wang, J.; Sun, C.; Han, Y.; Xiong, B.; et al. Low-temperature van der Waals epitaxy of GaN films on graphene through AlN buffer by plasma-assisted molecular beam epitaxy. J. Alloys Comp. 2021, 855, 157508. [Google Scholar] [CrossRef]
  20. Yan, H.; Ku, P.-C.; Gan, Z.-Y.; Liu, S.; Li, P. Strain Effects in Gallium Nitride Adsorption on Defective and Doped Graphene: First-Principles Calculations. Crystals 2018, 8, 58. [Google Scholar] [CrossRef] [Green Version]
  21. Al Balushi, Z.Y.; Miyagi, T.; Lin, Y.-C.; Wang, K.; Calderin, L.; Bhimanapati, G.; Redwing, J.M.; Robinson, J.A. The impact of graphene properties on GaN and AlN nucleation. Surf. Sci. 2015, 634, 81–88. [Google Scholar] [CrossRef]
  22. Li, T.; Liu, C.; Zhang, Z.; Yu, B.; Dong, H.; Jia, W.; Jia, Z.; Yu, C.; Gan, L.; Xu, B.; et al. Understanding the Growth Mechanism of GaN Epitaxial Layers on Mechanically Exfoliated Graphite. Nanoscale Res. Lett. 2018, 13, 130. [Google Scholar] [CrossRef] [PubMed] [Green Version]
  23. Yu, Y.; Wang, T.; Chen, X.; Zhang, L.; Wang, Y.; Niu, Y.; Yu, J.; Ma, H.; Li, X.; Liu, F.; et al. Demonstration of epitaxial growth of strain-relaxed GaN films on graphene/SiC substrates for long wavelength light-emitting diodes. Light. Sci. Appl. 2021, 10, 117. [Google Scholar] [CrossRef] [PubMed]
  24. Chen, Z.L.; Liu, Z.Q.; Wei, T.B.; Yang, S.; Dou, Z.; Wang, Y.; Ci, H.; Chang, H.; Qi, Y.; Yan, J.; et al. Improved Epitaxy of AlN Film for Deep-Ultraviolet Light-Emitting Diodes Enabled by Graphene. Adv. Mater. 2019, 31, 1807345. [Google Scholar] [CrossRef] [PubMed]
  25. Fuke, S.; Sasaki, T.; Takahasi, M.; Hibino, H. In-situ X-ray diffraction analysis of GaN growth on graphene-covered amorphous substrates. Jpn. J. Appl. Phys. 2020, 59, 070902. [Google Scholar] [CrossRef]
  26. Xu, Y.; Cao, B.; Li, Z.; Cai, D.; Zhang, Y.; Ren, G.; Xu, K. Growth Model of van der Waals Epitaxy of Films: A Case of AlN Films on Multilayer Graphene/SiC. ACS Appl. Mater. Interf. 2017, 9, 44001–44009. [Google Scholar] [CrossRef]
  27. Lin, Y.-C.; Lu, N.; Perea-Lopez, N.; Li, J.; Lin, Z.; Peng, X.; Robinson, J.A. Direct Synthesis of van der Waals Solids. ACS Nano 2014, 8, 3715–3723. [Google Scholar] [CrossRef]
  28. Borisenko, D.P.; Gusev, A.S.; Kargin, N.I.; Dobrokhotov, P.L.; Timofeev, A.A.; Labunov, V.A.; Kovalchuk, N.G.; Mikhalik, M.M.; Komissarov, I.V. Effect of graphene domains orientation on quasi van der Waals epitaxy of GaN. J. Appl. Phys. 2021, 130, 185304. [Google Scholar] [CrossRef]
  29. Grimme, S. Semiempirical GGA-type density functional constructed with a long-range dispersion correction. J. Comput. Chem. 2006, 27, 1787–1799. [Google Scholar] [CrossRef]
  30. Giannozzi, P.; Baroni, S.; Bonini, N.; Calandra, M.; Car, R.; Cavazzoni, C.; Ceresoli, D.; Chiarotti, G.L.; Cococcioni, M.; Dabo, I.; et al. QUANTUM ESPRESSO: A modular and open-source software project for quantum simulations of materials. J. Phys. Condens. Matter 2009, 21, 395502. [Google Scholar] [CrossRef]
  31. Giannozzi, P.; Andreussi, O.; Brumme, T.; Bunau, O.; Buongiorno Nardelli, M.; Calandra, M.; Car, R.; Cavazzoni, C.; Ceresoli, D.; Cococcioni, M.; et al. Advanced capabilities for materials modelling with Quantum ESPRESSO. J. Phys. Condens. Matter 2017, 29, 465901. [Google Scholar] [CrossRef]
  32. Perdew, J.P.; Burke, K.; Ernzerhof, M. Generalized Gradient Approximation Made Simple. Phys. Rev. Lett. 1996, 77, 3865–3868. [Google Scholar] [CrossRef] [PubMed] [Green Version]
  33. Kresse, G.; Joubert, D. From ultrasoft pseudopotentials to the projector augmented-wave method. Phys. Rev. B 1999, 59, 1758–1775. [Google Scholar] [CrossRef]
  34. Monkhorst, H.J.; Pack, J.D. Special points for Brillouin-zone integrations. Phys. Rev. B 1976, 13, 5188–5192. [Google Scholar] [CrossRef]
  35. Methfessel, M.; Paxton, A.T. High-precision sampling for Brillouin-zone integration in metals. Phys. Rev. B 1989, 40, 3616–3621. [Google Scholar] [CrossRef] [Green Version]
  36. Yao, Y.; Ren, L.; Gao, S.; Li, S. Histogram method for reliable thickness measurements of graphene films using atomic force microscopy (AFM). J. Mater. Sci. Technol. 2017, 33, 815–820. [Google Scholar] [CrossRef]
  37. Shen, Z.; Li, J.; Yi, M.; Zhang, X.; Ma, S. Preparation of graphene by jet cavitation. Nanotechnology 2011, 22, 365306. [Google Scholar] [CrossRef]
  38. Meyer, J.C.; Geim, A.K.; Katsnelson, M.I.; Novoselov, K.S.; Obergfell, D.; Roth, S.; Girit, C.; Zettl, A. On the roughness of single- and bi-layer graphene membranes. Solid State Commum. 2007, 143, 101–109. [Google Scholar] [CrossRef] [Green Version]
  39. Pham, P.H.Q.; Quach, N.V.; Li, J.; Burke, P.J. Scalable and reusable micro-bubble removal method to flatten large-area 2D materials. Appl. Phys. Lett. 2018, 112, 163106. [Google Scholar] [CrossRef]
  40. Ma, L.; Ren, W.; Cheng, H. Transfer Methods of Graphene from Metal Substrates: A Review. Small Methods 2019, 3, 1900049. [Google Scholar] [CrossRef]
  41. Khestanova, E.; Guinea, F.; Fumagalli, L.; Geim, A.K.; Grigorieva, I.V. Universal shape and pressure inside bubbles appearing in van der Waals heterostructures. Nat. Commum. 2016, 7, 12587. [Google Scholar] [CrossRef]
  42. Nair, R.R.; Blake, P.; Grigorenko, A.N.; Novoselov, K.S.; Booth, T.J.; Stauber, T.; Geim, A.K. Fine Structure Constant Defines Visual Transparency of Graphene. Science 2008, 320, 1308. [Google Scholar] [CrossRef] [PubMed] [Green Version]
  43. Zhu, S.-E.; Yuan, S.; Janssen, G.C.A.M. Optical transmittance of multilayer graphene. EPL (Europhys. Lett.) 2014, 108, 17007. [Google Scholar] [CrossRef] [Green Version]
  44. Cardona, M.; Güntherodt, G. (Eds.) Light Scattering in Solids II; Springer: Berlin/Heidelberg, Germany, 1982; Volume 50, pp. 19–176. [Google Scholar]
  45. Saito, R.; Hofmann, M.; Dresselhaus, G.; Jorio, A.; Dresselhaus, M.S. Raman spectroscopy of graphene and carbon nanotubes. Adv. Phys. 2011, 60, 413–550. [Google Scholar] [CrossRef]
  46. Shazni Mohammad Haniff, M.A.; Zainal Ariffin, N.H.; Ooi, P.C.; Mohd Razip Wee, M.F.; Mohamed, M.A.; Hamzah, A.A.; Syono, M.I.; Hashim, A.M. Practical Route for the Low-Temperature Growth of Large-Area Bilayer Graphene on Polycrystalline Nickel by Cold-Wall Chemical Vapor Deposition. ACS Omega 2021, 6, 12143–12154. [Google Scholar] [CrossRef] [PubMed]
  47. Ferrari, A.C. Raman spectroscopy of graphene and graphite: Disorder, electron–phonon coupling, doping and nonadiabatic effects. Solid State Commun. 2007, 143, 47–57. [Google Scholar] [CrossRef]
  48. Ferrari, A.C.; Meyer, J.C.; Scardaci, V.; Casiraghi, C.; Lazzeri, M.; Mauri, F.; Piscanec, S.; Jiang, D.; Novoselov, K.S.; Roth, S.; et al. Raman Spectrum of Graphene and Graphene Layers. Phys. Rev. Lett. 2006, 97, 187401. [Google Scholar] [CrossRef] [PubMed] [Green Version]
  49. Gupta, A.; Chen, G.; Joshi, P.; Tadigadapa, S.; Eklund, P.C. Raman Scattering from High-Frequency Phonons in Supported n-Graphene Layer Films. Nano Lett. 2006, 6, 2667–2673. [Google Scholar] [CrossRef] [Green Version]
  50. Li, J.; Ji, H.; Zhang, X.; Wang, X.; Jin, Z.; Wang, D.; Wan, L.-J. Controllable atmospheric pressure growth of monolayer, bilayer and trilayer graphene. Chem. Commun. 2014, 50, 11012–11015. [Google Scholar] [CrossRef]
  51. Karamat, S.; Sonuşen, S.; Dede, M.; Uysallı, Y.; Özgönül, E.; Oral, A. Coalescence of few layer graphene grains grown by chemical vapor deposition and their stacking sequence. J. Mater. Res. 2015, 31, 46–54. [Google Scholar] [CrossRef] [Green Version]
  52. Malard, L.M.; Pimenta, M.A.; Dresselhaus, G.; Dresselhaus, M.S. Raman spectroscopy in graphene. Phys. Rep. 2009, 473, 51–87. [Google Scholar] [CrossRef]
  53. Zhao, H.; Lin, Y.-C.; Yeh, C.-H.; Tian, H.; Chen, Y.-C.; Xie, D.; Yang, Y.; Suenaga, K.; Ren, T.-L.; Chiu, P.-W. Growth and Raman Spectra of Single-Crystal Trilayer Graphene with Different Stacking Orientations. ACS Nano 2014, 8, 10766–10773. [Google Scholar] [CrossRef] [PubMed]
  54. Kim, K.; Coh, S.; Tan, L.Z.; Regan, W.; Yuk, J.M.; Chatterjee, E.; Crommie, M.F.; Cohen, M.L.; Louie, S.G.; Zettl, A. Raman Spectroscopy Study of Rotated Double-Layer Graphene: Misorientation-Angle Dependence of Electronic Structure. Phys. Rev. Lett. 2012, 108, 246103. [Google Scholar] [CrossRef] [Green Version]
  55. Ni, Z.; Wang, Y.; Yu, T.; Shen, Z. Raman spectroscopy and imaging of graphene. Nano Res. 2008, 1, 273–291. [Google Scholar] [CrossRef] [Green Version]
  56. Goldie, S.J.; Bush, S.; Cumming, J.A.; Coleman, K.S. A Statistical Approach to Raman Analysis of Graphene-Related Materials: Implications for Quality Control. ACS Appl. Nano Mater. 2020, 3, 11229–11239. [Google Scholar] [CrossRef]
  57. Chen, Q.; Yin, Y.; Ren, F.; Liang, M.; Yi, X.; Liu, Z. Van der Waals Epitaxy of III-Nitrides and Its Applications. Materials 2020, 13, 3835. [Google Scholar] [CrossRef] [PubMed]
  58. Cançado, L.G.; Jorio, A.; Ferreira, E.H.M.; Stavale, F.; Achete, C.A.; Capaz, R.B.; Moutinho, M.V.O.; Lombardo, A.; Kulmala, T.S.; Ferrari, A.C. Quantifying Defects in Graphene via Raman Spectroscopy at Different Excitation Energies. Nano Lett. 2011, 11, 3190–3196. [Google Scholar] [CrossRef] [Green Version]
  59. Banhart, F.; Kotakoski, J.; Krasheninnikov, A.V. Structural Defects in Graphene. ACS Nano 2010, 5, 26–41. [Google Scholar] [CrossRef] [Green Version]
  60. Jia, Y.; Zhang, L.; Du, A.; Gao, G.; Chen, J.; Yan, X.; Brown, C.L.; Yao, X. Defect Graphene as a Trifunctional Catalyst for Electrochemical Reactions. Adv. Mater. 2016, 28, 9532–9538. [Google Scholar] [CrossRef]
  61. Zandiatashbar, A.; Lee, G.-H.; An, S.J.; Lee, S.; Mathew, N.; Terrones, M.; Hayashi, T.; Picu, C.R.; Hone, J.; Koratkar, N. Effect of defects on the intrinsic strength and stiffness of graphene. Nat. Commun. 2014, 5, 3186. [Google Scholar] [CrossRef] [Green Version]
  62. Eckmann, A.; Felten, A.; Mishchenko, A.; Britnell, L.; Krupke, R.; Novoselov, K.S.; Casiraghi, C. Probing the Nature of Defects in Graphene by Raman Spectroscopy. Nano Lett. 2012, 12, 3925–3930. [Google Scholar] [CrossRef]
  63. Sato, K.; Saito, R.; Oyama, Y.; Jiang, J.; Cançado, L.G.; Pimenta, M.A.; Jorio, A.; Samsonidze, G.; Dresselhaus, G.; Dresselhaus, M. D-band Raman intensity of graphitic materials as a function of laser energy and crystallite size. Chem. Phys. Lett. 2006, 427, 117–121. [Google Scholar] [CrossRef]
  64. Ferrari, A.C.; Basko, D.M. Raman spectroscopy as a versatile tool for studying the properties of graphene. Nat. Nanotechnol. 2013, 8, 235–246. [Google Scholar] [CrossRef] [PubMed] [Green Version]
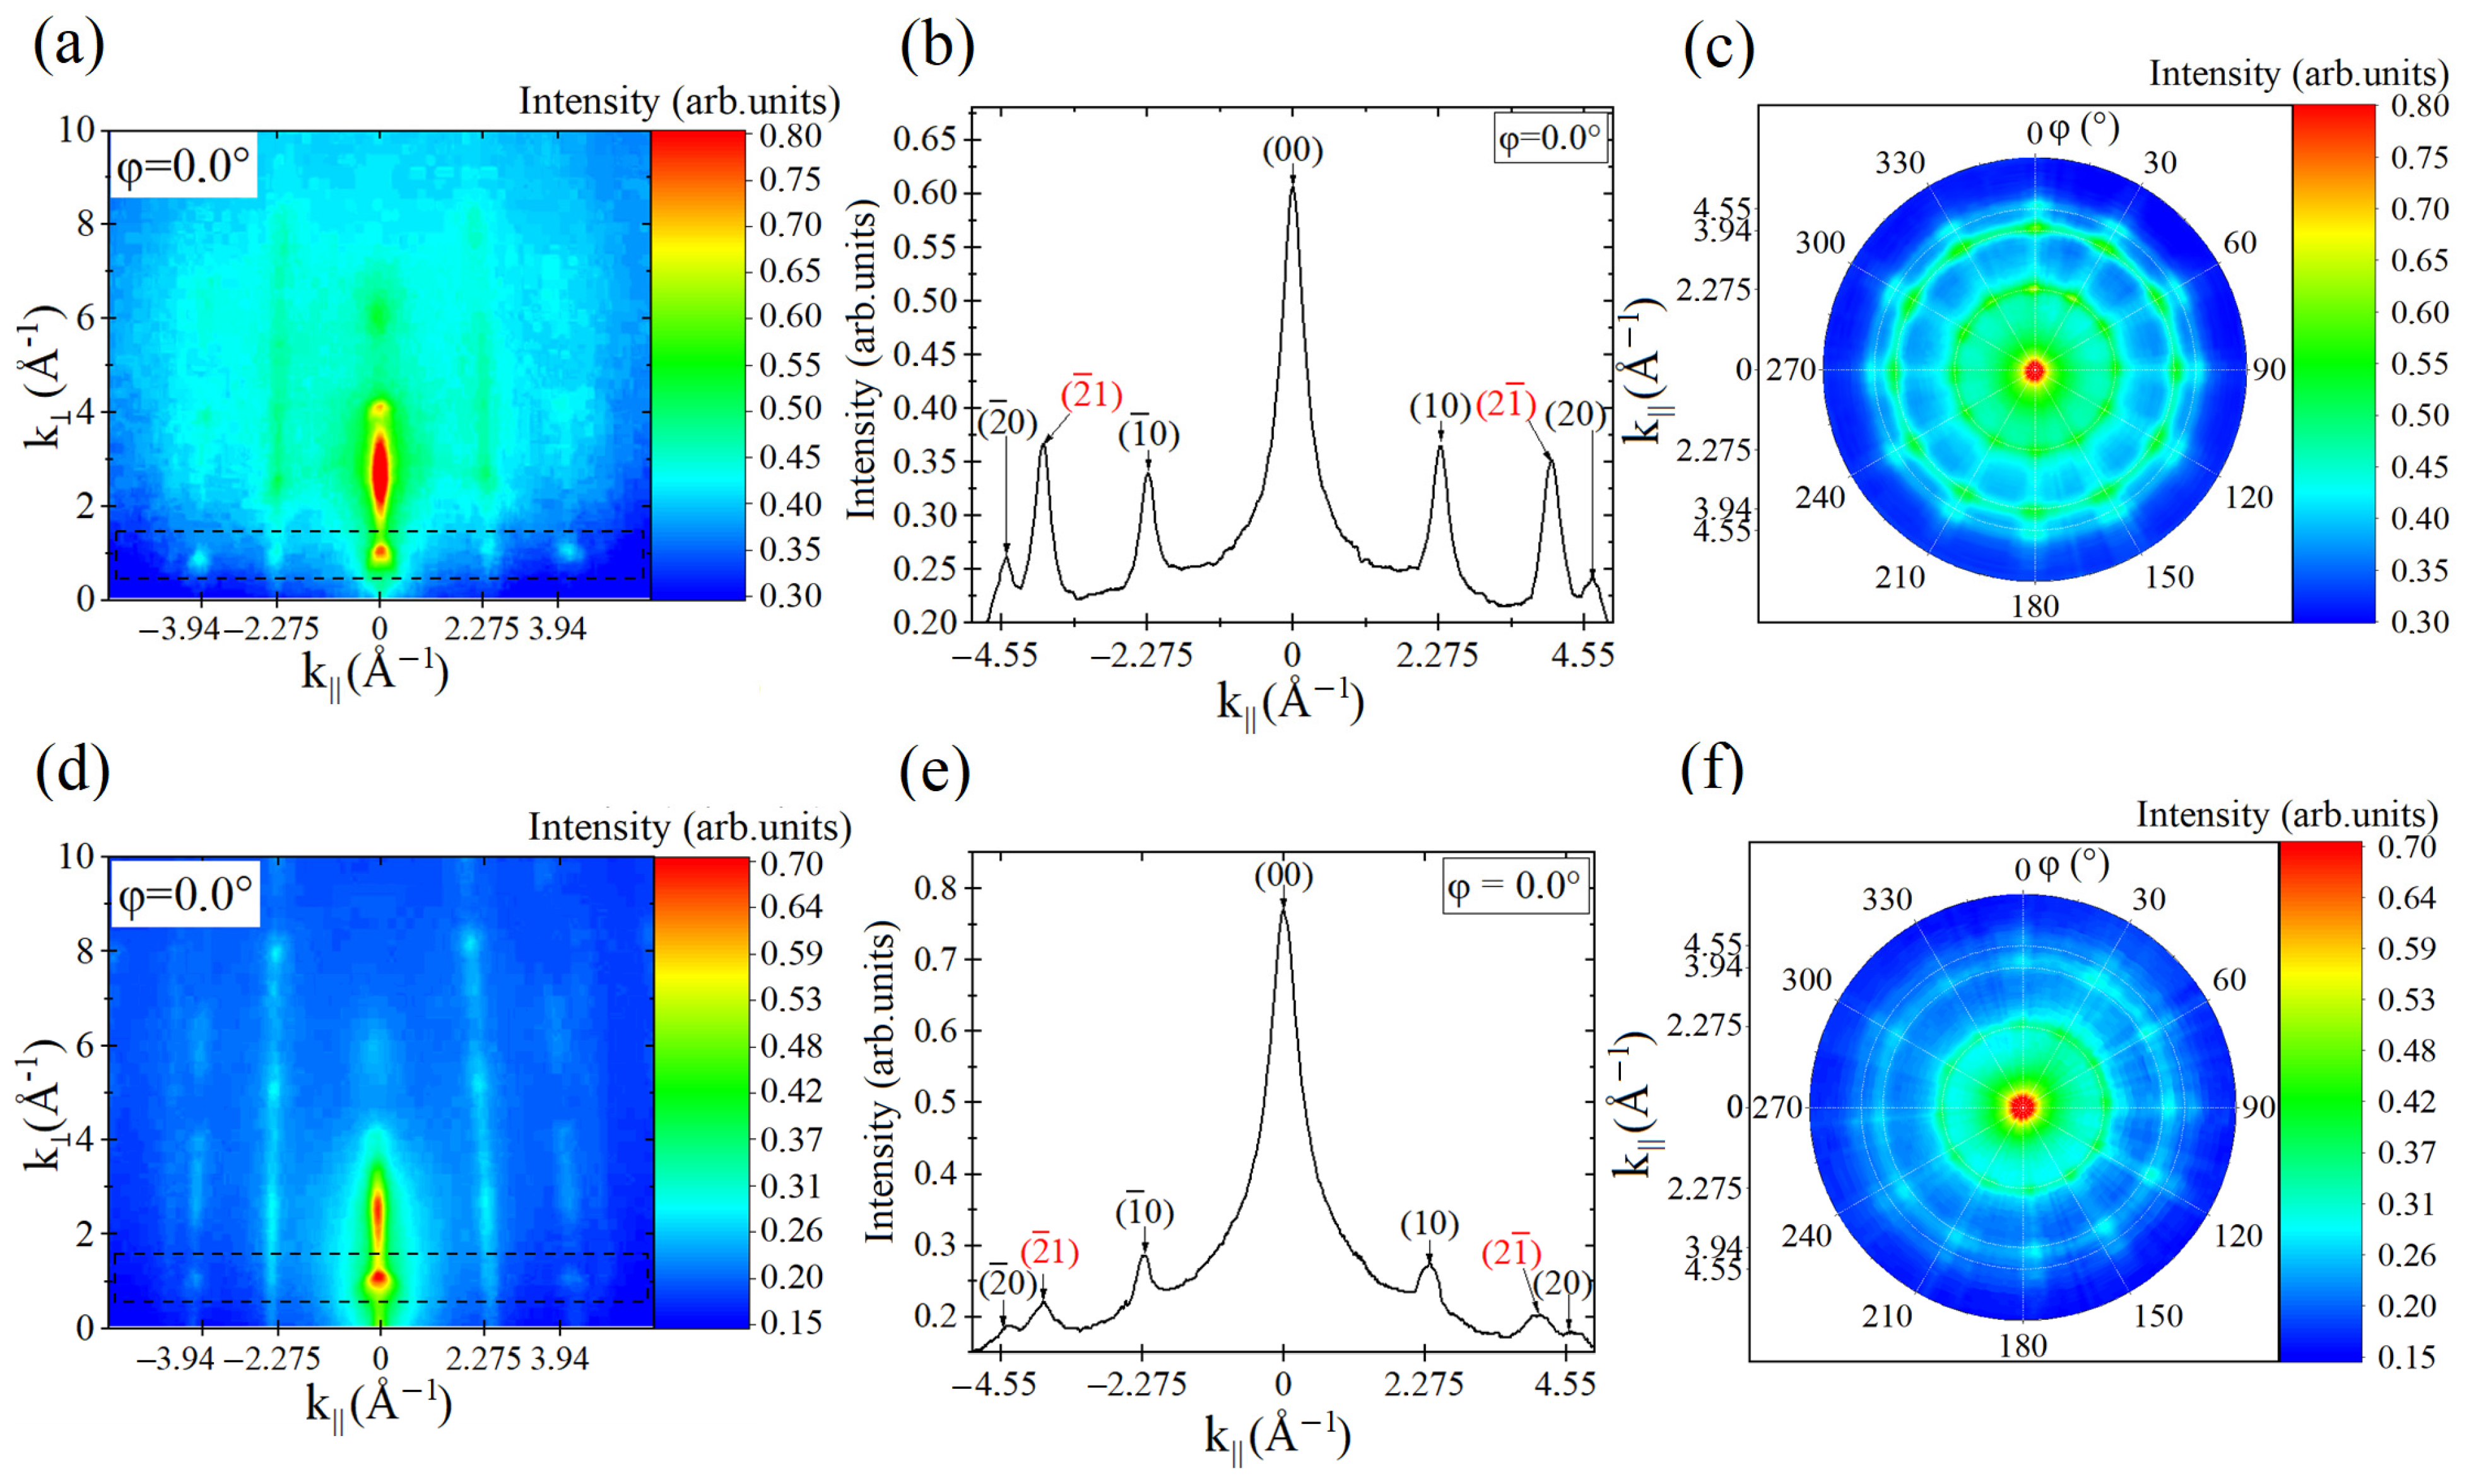
  65. Lu, Z.; Sun, X.; Xiang, Y.; Washington, M.A.; Wang, G.-C.; Lu, T.-M. Revealing the Crystalline Integrity of Wafer-Scale Graphene on SiO2/Si: An Azimuthal RHEED Approach. ACS Appl. Mater. Interf. 2017, 9, 23081–23091. [Google Scholar] [CrossRef] [PubMed]
  66. Ichimiya, A.; Cohen, P.I. Reflection High-Energy Electron Diffraction; Cambridge University Press: Cambridge, UK, 2004. [Google Scholar]
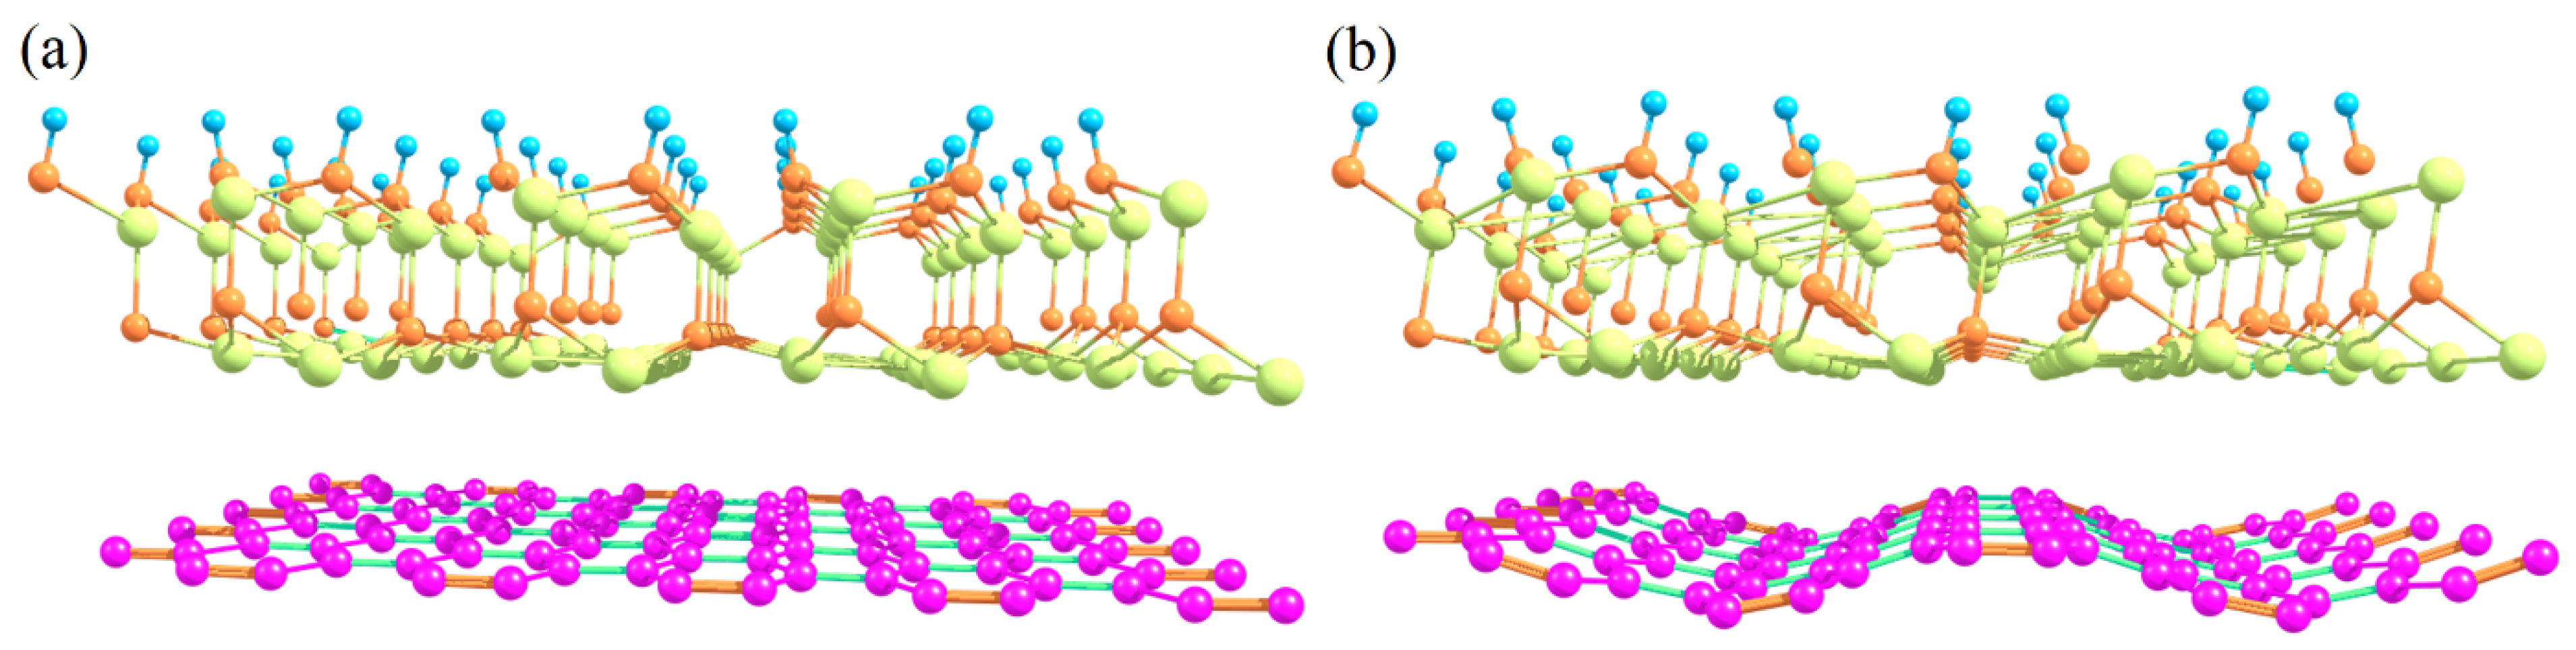
Figure 1. (a) SEM image of the 25 µm Cu foil: (b,c) X-ray diffraction θ-2θ spectrum and pole figure of a Cu (100) sample after graphene growth; the inset shows the rocking curve for the Cu (100) diffraction; (df) EBSD analysis of the Cu foil after graphene growth; (d) the crystallographic orientation mapping in direction normal to the sample surface; (e) The color code for this map is given in the stereographic triangle; (f) The corresponding pole figure in [001]-direction (i.e., normal to the sample surface).
Applsci 12 11516 g001
Figure 2. SEM images of graphene layers obtained on a 3-inch silicon wafer (with amorphous surface due to thermal oxide film) via PA-MBE epitaxial growth (a). Randomly selected regions of FLG (d) and MLG (g). AFM height images and line scan profiles: the oxide surface (b,c), the random regions of FLG (e,f) and MLG (h,i).
Applsci 12 11516 g002
Figure 3. (a) The transmittance coefficient of graphene samples transferred on a SiO2/Si substrate as a function of light wavelength. Raman spectra (b,c), Raman maps of I2D/IG (d,g), ID/IG (e,h) ratios and 2D peak FWHM (f,i) from random areas on the continuous FLG (b,df) and MLG (c,gi) transferred to a SiO2/Si substrate acquired at a laser excitation wavelength of 532 nm.
Applsci 12 11516 g003
Figure 4. Images of RHEED patterns obtained of FLG (a) and MLG (d) at azimuthal angles φ = 0° (a,d). Intensity profiles for azimuthal angles φ = 0° (b,e) for FLG (b) and MLG (e), respectively. (c,f) The RHEED reciprocal space structures for the FLG (c) and MLG (f) samples.
Applsci 12 11516 g004
Figure 5. (a,d) Images of RHEED patterns from the GaN surface during PA-MBE growth on FLG (a) and MLG (d) at azimuthal angles φ = 0°. (b,e) Intensity profiles for azimuthal angles φ = 0° for the GaN layer growing on FLG (b) and MLG (e), respectively. (c,f) Structures of RHEED reciprocal spaces of the GaN layer grown on different graphene buffer layers: FLG (c) and MLG (f).
Applsci 12 11516 g005
Figure 6. SEM and AFM images of the surface of GaN/AlN (0001) film grown on SLG (a,b,d,e) with regions of FLG (c,f) and on MLG (gi) in random regions of the samples.
Applsci 12 11516 g006
Figure 7. Raman analysis: (a,d) Raman mapping of G peak intensity and of the E2(high) peak intensity (b,e) and position (c,f) from random areas on the continuous FLG (ac) and MLG (df) after nitrides PA-MBE growth acquired at a laser excitation wavelength of 532 nm.
Applsci 12 11516 g007
Figure 8. Periodic cell of the AlN–graphene heterostructure (a). Rippling of graphene under compression applied to the system (b). Purple, yellow, orange and blue balls represent C, Al, Ga and H atoms, respectively.
Applsci 12 11516 g008
Figure 9. HR-XRD spectra of the experimental samples: (a,c) 2θ-ω scanning curve and (b,d) ω scanning curve of the GaN/AlN films grown on the FLG (a,b) and MLG (c,d).
Applsci 12 11516 g009
Table 1. Interaction energy of AlN surface with pristine, strained and defected graphene calculated with the density functional theory.
Type of DefectEb, J/m2
No defects0.194
Compression 5%0.215
Stretching 5%0.161
Stone-Wales defect0.196
Vacancy0.463
Nitrogen atom0.187
Publisher’s Note: MDPI stays neutral with regard to jurisdictional claims in published maps and institutional affiliations.

