Article

Geophysical Characterization in the Shallow Water Estuarine Lakes of the Southern Everglades, Florida

by
Michael Eyob Kiflai
1,2,*,
Dean Whitman
2,
René M. Price
2,3,
Thomas A. Frankovich
3 and
Christopher J. Madden
4
1
Division of Water Rights, State Water Resources Control Board, Sacramento, CA 95814, USA
2
Department of Earth and Environment, Florida International University, Miami, FL 33199, USA
3
Institute of Environment, Florida International University, Miami, FL 33199, USA
4
South Florida Water Management District, Everglades Systems Research Division, West Palm Beach, FL 33406, USA
*
Author to whom correspondence should be addressed.
Submission received: 1 November 2021 / Revised: 11 January 2022 / Accepted: 13 January 2022 / Published: 22 January 2022

Abstract

:
Anthropogenic activities have greatly modified freshwater flows through Everglades National Park (ENP) such that saltwater has intruded extensively inland from the coastline, causing coastal lakes and their ecosystems to be exposed to varying salinity conditions. The Comprehensive Everglades Restoration Plan (CERP) makes an effort to restore the quantity, quality, timing, and distribution of freshwater flow in ENP with a goal of reducing salinity conditions within the coastal communities and adjacent estuaries. An understanding of the temporal and spatial variations of surface water and shallow groundwater salinity in the coastal lakes of ENP is needed to evaluate restoration efforts. Geophysical surveys were conducted between 2016 to 2019 using electrical resistivity and electromagnetic (EM) methods in the coastal lakes of ENP. A mean local formation factor of 10.7 ± 1.8 was calculated for the region by comparing the lakes’ bottom formation inverted electrical resistivity soundings with coincident pore water resistivity measured in groundwater wells. The conductivity of surface and groundwater increased during the dry season, reflecting decreased precipitation, increased evapotranspiration, and the increasing influence of saline water from Florida Bay. Spatially, salinity in the lakes increased from west to east in the surface water with an opposite trend observed in the shallow groundwater. Along the south to north inland direction, the salinity of both surface water and groundwater decreased. This study demonstrates that floating electrical resistivity and EM methods can characterize the subsurface formation resistivity and describe temporal and spatial patterns of surface and shallow groundwater conductivity.

1. Introduction

During the past century, Everglades National Park (ENP) has been adversely impacted by past human activities that have altered the flow of freshwater through the system [1]. Moreover, the underlying highly permeable limestone aquifer is susceptible to saltwater intrusion (SWI) along the coastline [2]. In the 1950s, the U.S. Army Corps of Engineers developed canals, levees, and water conservation areas for flood protection. Even though this development plan has succeeded in controlling floods, South Florida does not receive sufficient quantity and distribution of water, which results in ecosystem degradation and extensive saltwater intrusion [1].
In 2000, the U.S. Congress authorized the Comprehensive Everglades Restoration Plan (CERP) to restore, preserve, and protect the South Florida ecosystem. The CERP makes an effort to restore the quantity, quality, timing, and distribution of freshwater in the region [3]. Major activities of the CERP are expected to increase the flow of freshwater and modify the groundwater chemistry in the ENP. Freshwater input to the ENP comes from direct rainfall and inflows from the water conservation area (WCA) reservoirs to the north [4] (Figure 1). The two main flow drainage paths in ENP are the Shark River Slough (SRS) and Taylor Slough (TS) (Figure 1). The two lake regions studied in this project are located between these two main flow pathways. Salinity in Florida Bay varies in time and space and is governed by the influence of precipitation, evapotranspiration, runoff, and mass exchange with the surrounding basins [5]. Evapotranspiration rates are high in this region and affect the freshwater input balance negatively [4]. The author also suggests freshwater inflow is critical to compensate for the net loss.
The degree of saltwater intrusion along the coast varies widely and is affected by the hydroclimate variability, hydrogeological setting, history of groundwater development, and sources of saline water within a particular area [6]. Under natural conditions, the seaward flow of freshwater prevents saltwater from encroaching coastal aquifers. However, in comparison with the historical flow of freshwater, the flow of freshwater through the Everglades has been reduced by approximately 70%. Due to this, water quality has degraded, and nearshore dry-season salinities increased by 20 to 30 PSU [7]. This reduced historical flow of freshwater input to the Florida Bay followed by drought in South Florida between 2014 and 2015 produced a substantial die-off of the seagrass [8].
Most commonly, mapping of saltwater intrusion in coastal aquifers has been conducted by collecting water samples from wells. Even though this approach provides reliable results, it is restricted to the existing and accessible wells. Geophysical methods have been developed to identify and map the lateral and vertical distribution of shallow freshwater and saline water interface. These methods provide powerful tools to identify the position of saline or brackish water in an aquifer [9]. Electrical resistivity and electromagnetics are the most commonly used geophysical methods to study saltwater intrusion. Integrated approaches of electromagnetics (EM) and direct current resistivity were applied in the coastal wetland of Tampa Bay, Florida [10] and Azan Basin, Jordan [11]. Monsoor et al. [12] used EM 31 for rapid characterization of shallow water, the contaminated wetlands of Kearny Marsh, New Jersey. EM methods have been used for imaging saltwater intrusion in coastal aquifers—namely the seaside groundwater basin, California [13]—and for characterizing the chemical properties of soil in Sidrolandia, MS, Brazil [14].
Electrical resistivity has an advantage because the non-uniqueness of the resistivity method is less compared with other geophysical methods such as electromagnetic methods [15]. The electrical resistivity method is superior for imaging the electrical resistivity structure compared to other non-invasive geophysical imaging techniques. DC resistivity offers several advantages over EM methods because the array is in direct galvanic contact with the water or earth and is not affected by external magnetic fields and nearby conducting bodies such as the boat and operator. The EM method provides a faster alternative to DC soundings [16], but it is sensitive to electromagnetic noise produced by metals, pipelines, etc. Therefore, the DC resistivity sounding remains the preferred method, though an integrated approach using both methods is complementary.
The integrated approaches of EM, electrical resistivity, and well data are the most effective technique to estimate a formation factor, which is used to produce a regional map of groundwater salinity. A formation factor is the ratio of the resistivity (conductivity) of a rock filled with water to the resistivity (conductivity) of that water. It can be determined by coincident measurements of groundwater and formation conductivity or from empirical relationships such as Archie’s Law [17]. An effective technique to map pore water conductivities is to compute a formation factor from resistivity surveys and pore water samples. An integrated approach of EM and electrical resistivity was conducted on the wetland of Tampa Bay, Florida [10] and computes a formation factor from resistivity surveys and pore water samples. The study conducted by [18] estimated a formation factor of 5.1 by comparing EM induction logs and water samples from wells in eastern Miami-Dade County. Similarly, in other studies, Ref. [19] estimated a formation factor of 9.65 in Everglades National Park using similar methods and [20] estimated a formation factor of 9.8 for Big Pine Key using ERT and water samples from wells. The formation factor depends on several parameters such as porosity, the degree of saturation, cementation, and pore fluid resistivity and heterogeneity.
A number of geophysical studies have been conducted in the ENP. A study conducted in the southern ENP [19] aimed to assess saltwater intrusion and prepared a subsurface resistivity map using airborne electromagnetic methods (FDEM) and borehole geophysical measurements. The authors established correlations between formation resistivity and water-specific conductance for the region and provided a baseline for further studies. In 2011, a TDEM survey was conducted in Miami-Dade County and delineated the location of the freshwater/saltwater interface, as well as showing the influence of canals and roadbeds on the hydrologic regime [19,21]. Surveys of surface water salinities of the coastal lakes within ENP indicated brackish to hypersaline salinities that varied according to season (higher in the summer following the dry season), and proximity of upstream freshwater sources and exchange with Florida Bay marine waters downstream [22,23].
This paper aims to present the relationship between the freshwater input and hydrochemistry of surface waters and lake-bottom groundwater in shallow (1–2 m) brackish lakes within the southern Everglades known as the Mangrove Lakes (Figure 1). It explores the spatial and temporal changes in groundwater chemistry using electrical resistivity, EM methods, surface water, and groundwater sampling. The EM surveys were conducted from 2016 to 2017 using a GSSI EMP-400 Profiler multi-frequency [24] EM conductivity meter integrated with a GPS receiver deployed in a flat-bottomed plastic kayak towed behind a motorized jon boat. In addition, electrical resistivity soundings were conducted at spot locations in July 2019 using a floating electrode array connected to an Advanced Geosciences, Inc. (AGI) Super Sting resistivity meter [25]. During the survey, at various spot locations, the surface water conductivity, temperature, pH, and salinity were recorded using a YSI water quality data sonde. Water depths were also measured. Groundwater-specific conductivity was continuously monitored at four shallow wells on the shorelines of the lakes and was compared to nearby inverted lake bottom resistivity to calculate a formation factor for the Lakes region. This formation factor was used to convert the inverted formation resistivity to groundwater resistivity and produce a regional map of groundwater salinity. This study investigated the spatial and temporal changes in the surface water and groundwater salinity in the Mangrove Lakes of ENP using electrical resistivity and EM methods. Understanding the hydrochemistry of the aquifer can help to establish sustainable water resources management, and regularly monitoring the hydrological conditions is required for proper water management practice and conservation actions. This study showed that floating electrical resistivity arrays and EM ground conductivity meters can effectively characterize the lake bottom salinity and can be used regularly in monitoring the surface water and groundwater salinity in shallow water bodies.

2. Electrical and Electromagnetic Methods

Geophysical methods such as electrical resistivity and electromagnetics are rapid and noninvasive geophysical methods for measuring groundwater properties and characterizing the spatial and temporal variability of subsurface formations [26]. These methods include electrical resistivity methods such as vertical electrical soundings (VES) and electrical resistivity tomography (ERT), and electromagnetic (EM) methods such as frequency-domain electromagnetic (FDEM) and time-domain electromagnetic (TDEM) soundings and profiling. These methods are commonly used in near-surface geophysics because the subsurface electrical properties are easily correlated to the physical and chemical properties of fluids within the pore space [27]. These methods can produce a high-resolution image of the shallow subsurface formation and have been widely used in hydrogeology and environmental studies.
In electrical resistivity, a current is injected across a pair of electrodes, and the voltage difference between the potential electrodes is measured. The voltage difference is a function of the injected current and the resistivity beneath the electrode array. In the electrical resistivity method, commonly used electrode configurations include the Wenner, Schlumberger, and dipole−dipole arrays. In dipole−dipole arrays, the dipoles are equal in width (a) and separated by a distance n × a, where n is an integer multiplier (Figure 2B). Electromagnetism uses the principles of electromagnetic induction to map variations in electrical conductivity. EM waves from a transmitting coil induce eddy currents in subsurface conductors, resulting in a secondary magnetic field detected in a receiver coil. The electrical resistivity and EM data are modeled to infer the electrical conductivity of the subsurface.
Different regularization optimization techniques have been developed to invert and model these data, including Occam’s inversion [28], layered and laterally constrained inversion [29], and ridge regression [30,31]. For example, Occam’s inversion solution fits the measurement with the smoothest possible model, and the inverted models generally do not show sharp changes [29]. Occam’s inversion trades off the roughness of the model improvement and the least-squares error predicted from the linearized forward problem, whereas the ridge regression trades off the size of the model improvement [30,31]. In the ridge regression, for each iteration, a model correction is calculated using the best damping factor available for that iteration [30]. Equivalency analysis shows the possible range of models that can fit the data. The results obtained from the inverse model need careful interpretation.
In porous media, currents are carried by electrolytic conduction of ions in the pore waters. The pore fluid conductivity, σ G W , and the bulk conductivity of the rock σ r o c k   are related by σ G W = F σ r o c k , where F is the formation factor. The formation factor can be determined by coincident measurements of groundwater and formation conductivity or from empirical relationships such as Archie’s Law [17]. The estimated formation factor can be used to infer the electrical conductivity of the pore fluids. Then, the salinity of the subsurface formation can be calculated using the general equation given by [32,33,34].

3. Data and Methods of Analysis

3.1. Data Collection
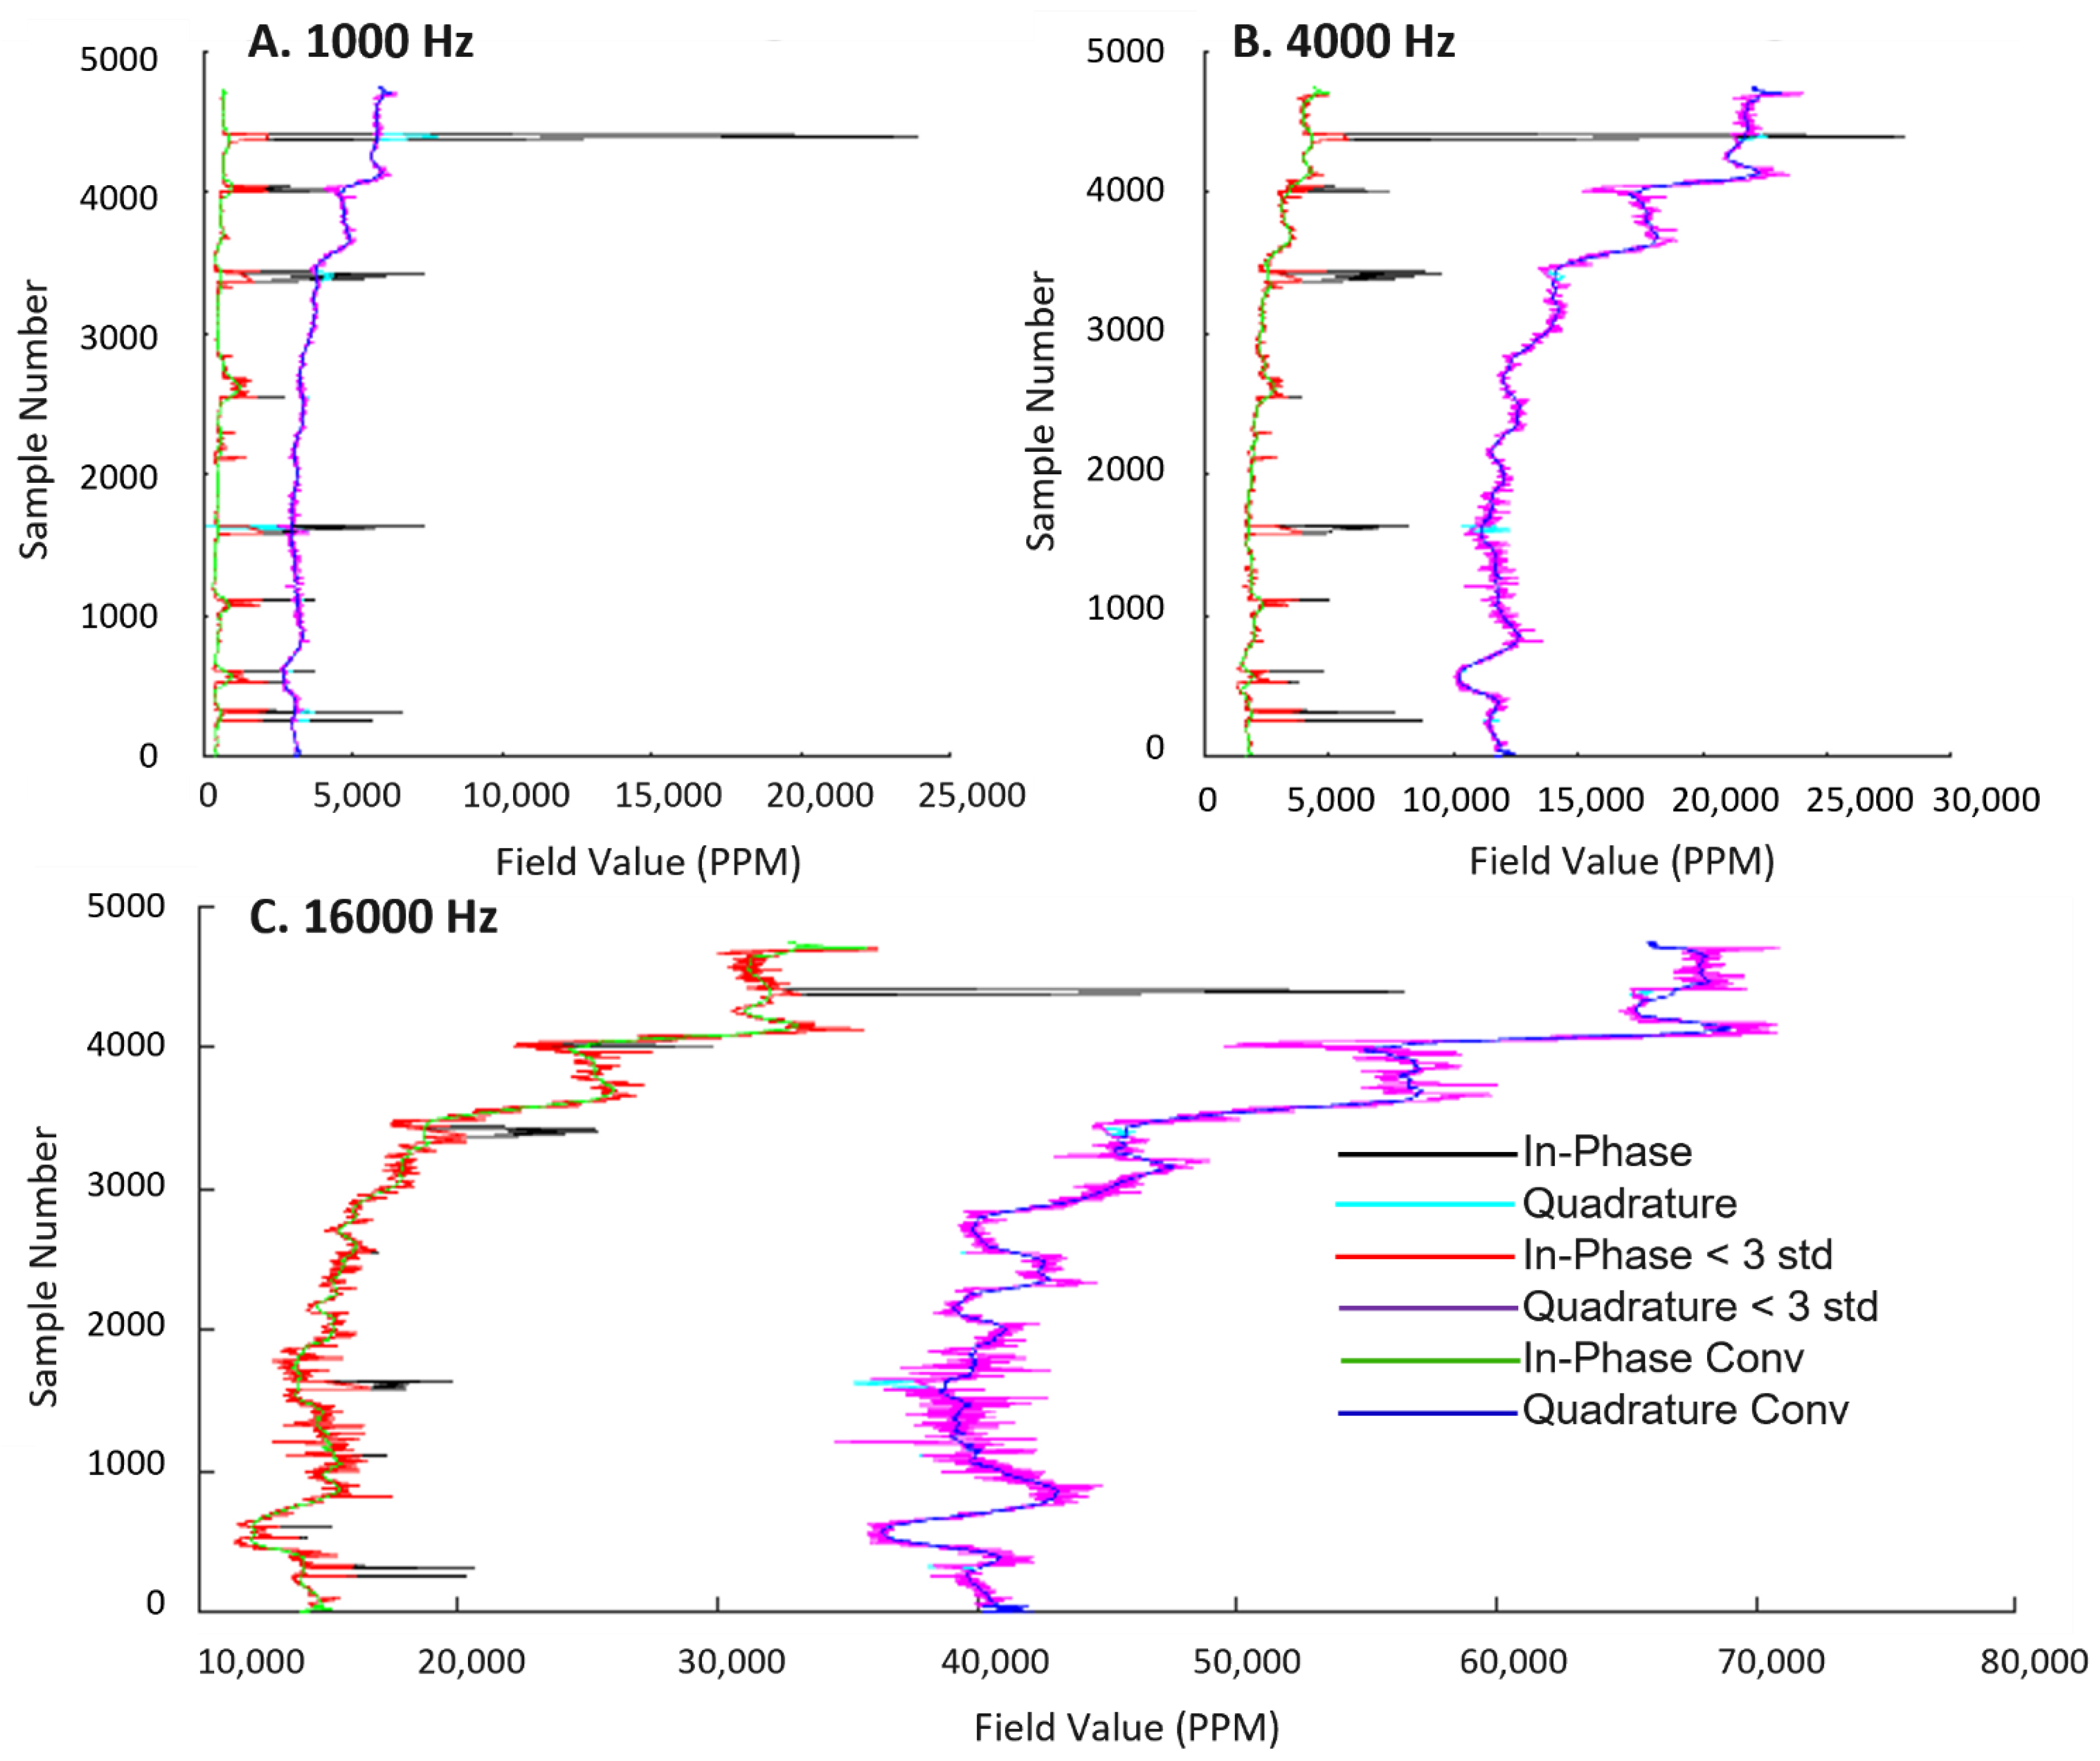
A GSSI Profiler EMP-400 multi-frequency EM conductivity meter integrated with a GPS receiver was deployed in an unmanned, flat-bottomed plastic kayak towed 6 m behind a motorized skiff (Figure 2A). The instrument was initially calibrated at the GSSI factory by suspending it well above the ground and zeroing the field values. Immediately before data acquisition, field calibrations were performed on-site. The field calibration procedure removes any electromagnetic effects of the operator and other equipment in the surrounding area. However, since the kayak contained no conducting materials and was towed 6 m behind the skiff, little if any external effects affected the data. The EM data were recorded in a vertical dipole moment (VDM) at 1, 4, and 16 KHz frequencies. Six electromagnetic surveys were conducted in West Lake and Seven Palm from January 2016 to February 2017 (Table 1, Figure 2A) to assess the seasonal variability in conductivity between wet and dry seasons.
During the EM survey, at different localities and different intervals of time, the surface water conductivity, temperature, pH, and salinity were measured using a YSI water quality data sonde. Water depths were measured continuously using a sonar transducer and at spot locations using a calibrated rod.
VES surveys were conducted at spot locations in the Seven Palm and West Lake systems in July 2019 using a floating 14-electrode cable with a 1 m electrode spacing (Figure 1). The cable was suspended at the water surface using foam floats (noodles) attached in between the electrodes (Figure 2B). Each survey consisted of a set of 48 dipole–dipole measurements recorded with both 1 m and 2 m dipole lengths. The dipoles were spaced at distances ranging from 1 to 11 m (n, Figure 2B). Reciprocal measurements where the current and potential electrode pairs are exchanged were included in each survey. These reciprocal measurements provide redundancy and the ability to estimate measurement uncertainty. The measurements from the evenly spaced electrodes were repeated multiple times. The dipole measurements were averaged from either 2 or 4 measurements. The average value of the measurements and the reciprocal measurements were used. This resulted in a set of 11 dipole–dipole VES measurements at each spot location.
Continuous measurements of water level, temperature, and conductivity were recorded using Aqua troll 200 data sondes in four shallow monitoring wells and at four adjacent locations within the lakes [35] (Figure 1). Coincident conductivity measurements recorded from the wells and resistivity measurements produced using the floating dipole–dipole electrical resistivity array in July 2019 were used to estimate the formation factor. Similar to the EM survey, at different localities and different intervals of time, the surface water conductivity, temperature, pH, and salinity were measured using a YSI water quality data sonde at the electrical resistivity measurement sites. Water depths were measured using a calibrated rod during the electrical resistivity surveys.

3.2. Data Analysis

In frequency domain electromagnetic (FDEM) methods, the EM instrument measures the in-phase (real) and out-of-phase (quadrature) components of the secondary magnetic field ( H s ) to the primary magnetic field ( H p ) . The ratio of the secondary to the primary field of a vertical dipole (horizontal coils) homogenous half-space is expressed as:
H s H p = 2 γ 2 s 2 [ 9 ( 9 + 9 γ s + 4 γ 2 s 2 + γ 3 s 3 ) e γ s ]
where γ = i ω µ 0 σ   is a complex wave number and s is coil spacing (m) [36,37]. The ratio of the secondary to the primary magnetic field (Hs/Hp) is a complex function that depends on inter-coil spacing (s), frequency (f), and conductivity ( σ ) . Apparent conductivity was calculated by inverting the quadrature (imaginary) field ratio for a homogenous half-space [36,37]. The EM data were recorded at frequencies of 1, 4, and 16 KHz. The depth penetration of the data is related to the input frequency. The higher frequencies (e.g., 16 KHz) have shallow penetration and represent the conductivity of the surface water. The lower-frequency (e.g., 4 and 1 KHz) data have deeper penetration and reflect an average of the conductivity of the surface water and groundwater. The calculated apparent conductivity was used to assess the spatial and temporal variability.
EM data often contain noise that must be removed to produce consistent results. Spikes in the data often occur near the beginning and end of the collection segment when the kayak drifts close to the boat. These outliers were removed by eliminating measurements differing by greater than 3 standard deviations from a 100-sample window (Figure 3, Table 2).
High-frequency noise is produced by the roll and pitch of the kayak caused by waves. After outlier removal, this noise was removed with a 100-point moving average convolution filter (Figure 3, Table 2). This random high-frequency noise (estimated standard error of the mean) was on the order of 0.6–10 mS/m, which is less than 1% of the field values. An example of how this technique was applied to data collected in the Seven Palm system is shown in Figure 3, and the descriptive statistical analysis is summarized in Table 2. A similar approach of a data filtering technique called “rolling ball algorithm” was applied to a terrain conductivity measurement, where the problems are anomaly complexity, noise spikes, and background conductivity variation [38].
VES soundings data were inverted to two-layer models (water column and lake bottom resistivity) by constraining the depth of the water column using IX1DV3 software [30]. The VES data were inverted using a ridge regression algorithm [30,31]. In the inversion, the water layer thickness was constrained and fixed using the measured depth by a calibrated rod. In addition, the resistivity measured using a YSI probe was used as a starting model for the surface water resistivity, and the lake bottom resistivity value was assumed to have a five-times-higher water column resistivity. Occam’s inversion with 10 layers was used, with minimum and maximum depths ranging between 0.1 m and 5 m.
In the Seven Palm system, on 10 July 2019, high winds caused considerable chops in the water which introduced noise into the resistivity measurements associated with the larger spacings (n = 10 and 11). Those outlying datapoints were masked from the analyses. The average value of the measurements and reciprocals was used in the inversion. Water depth in the model was constrained to a rod measurement at the array center, but the water layer and lake bottom layer resistivity were left unconstrained in the inversion. Finally, the inverted resistivity was converted to salinity using the general equation defined in the Practical Salinity Scale of 1978 (Sp) [32,33,34]
S p = i = 0 5 a i ( R t ) i / 2 + ( t 68   / 15 ) [ 1 + 0.0162   ( t 68   / 15 )   ]   + i = 0 5 b i   ( R t ) i / 2  
where ( t 68   / )   is the measured temperature, r is the measured conductivity in (µS/cm)/42,914, and R t is the conductivity ratio r/rt. The factor rt is given by
r t = i = 0 4   c i ( t 68   / ) i
and the coefficients a i ,   b i , a n d   c i are provided in Table 3 below. The salinity equation is approximately valid for salinity values that range between 2 to 42 PSU, where the temperature is between −2 to 35 ℃ [32,33,34].
The formation factor for the study area was estimated using the bulk resistivity measured by the floating VES and coincident resistivity (inversely proportional to conductivity) data measured in the groundwater wells. The average daily conductivity (µS/cm) measurement in the groundwater wells was converted to resistivity, where the resistivity (Ω⋅m) = 10,000/Conductivity water (µS/cm). Then, the formation factor was calculated from the average value of the ratio of bulk resistivity modeled from the geophysical data and the pore water resistivity measured in the shallow groundwater wells. This estimated formation factor was used to produce a regional map of groundwater salinity.

4. Results

4.1. Electromagnetism

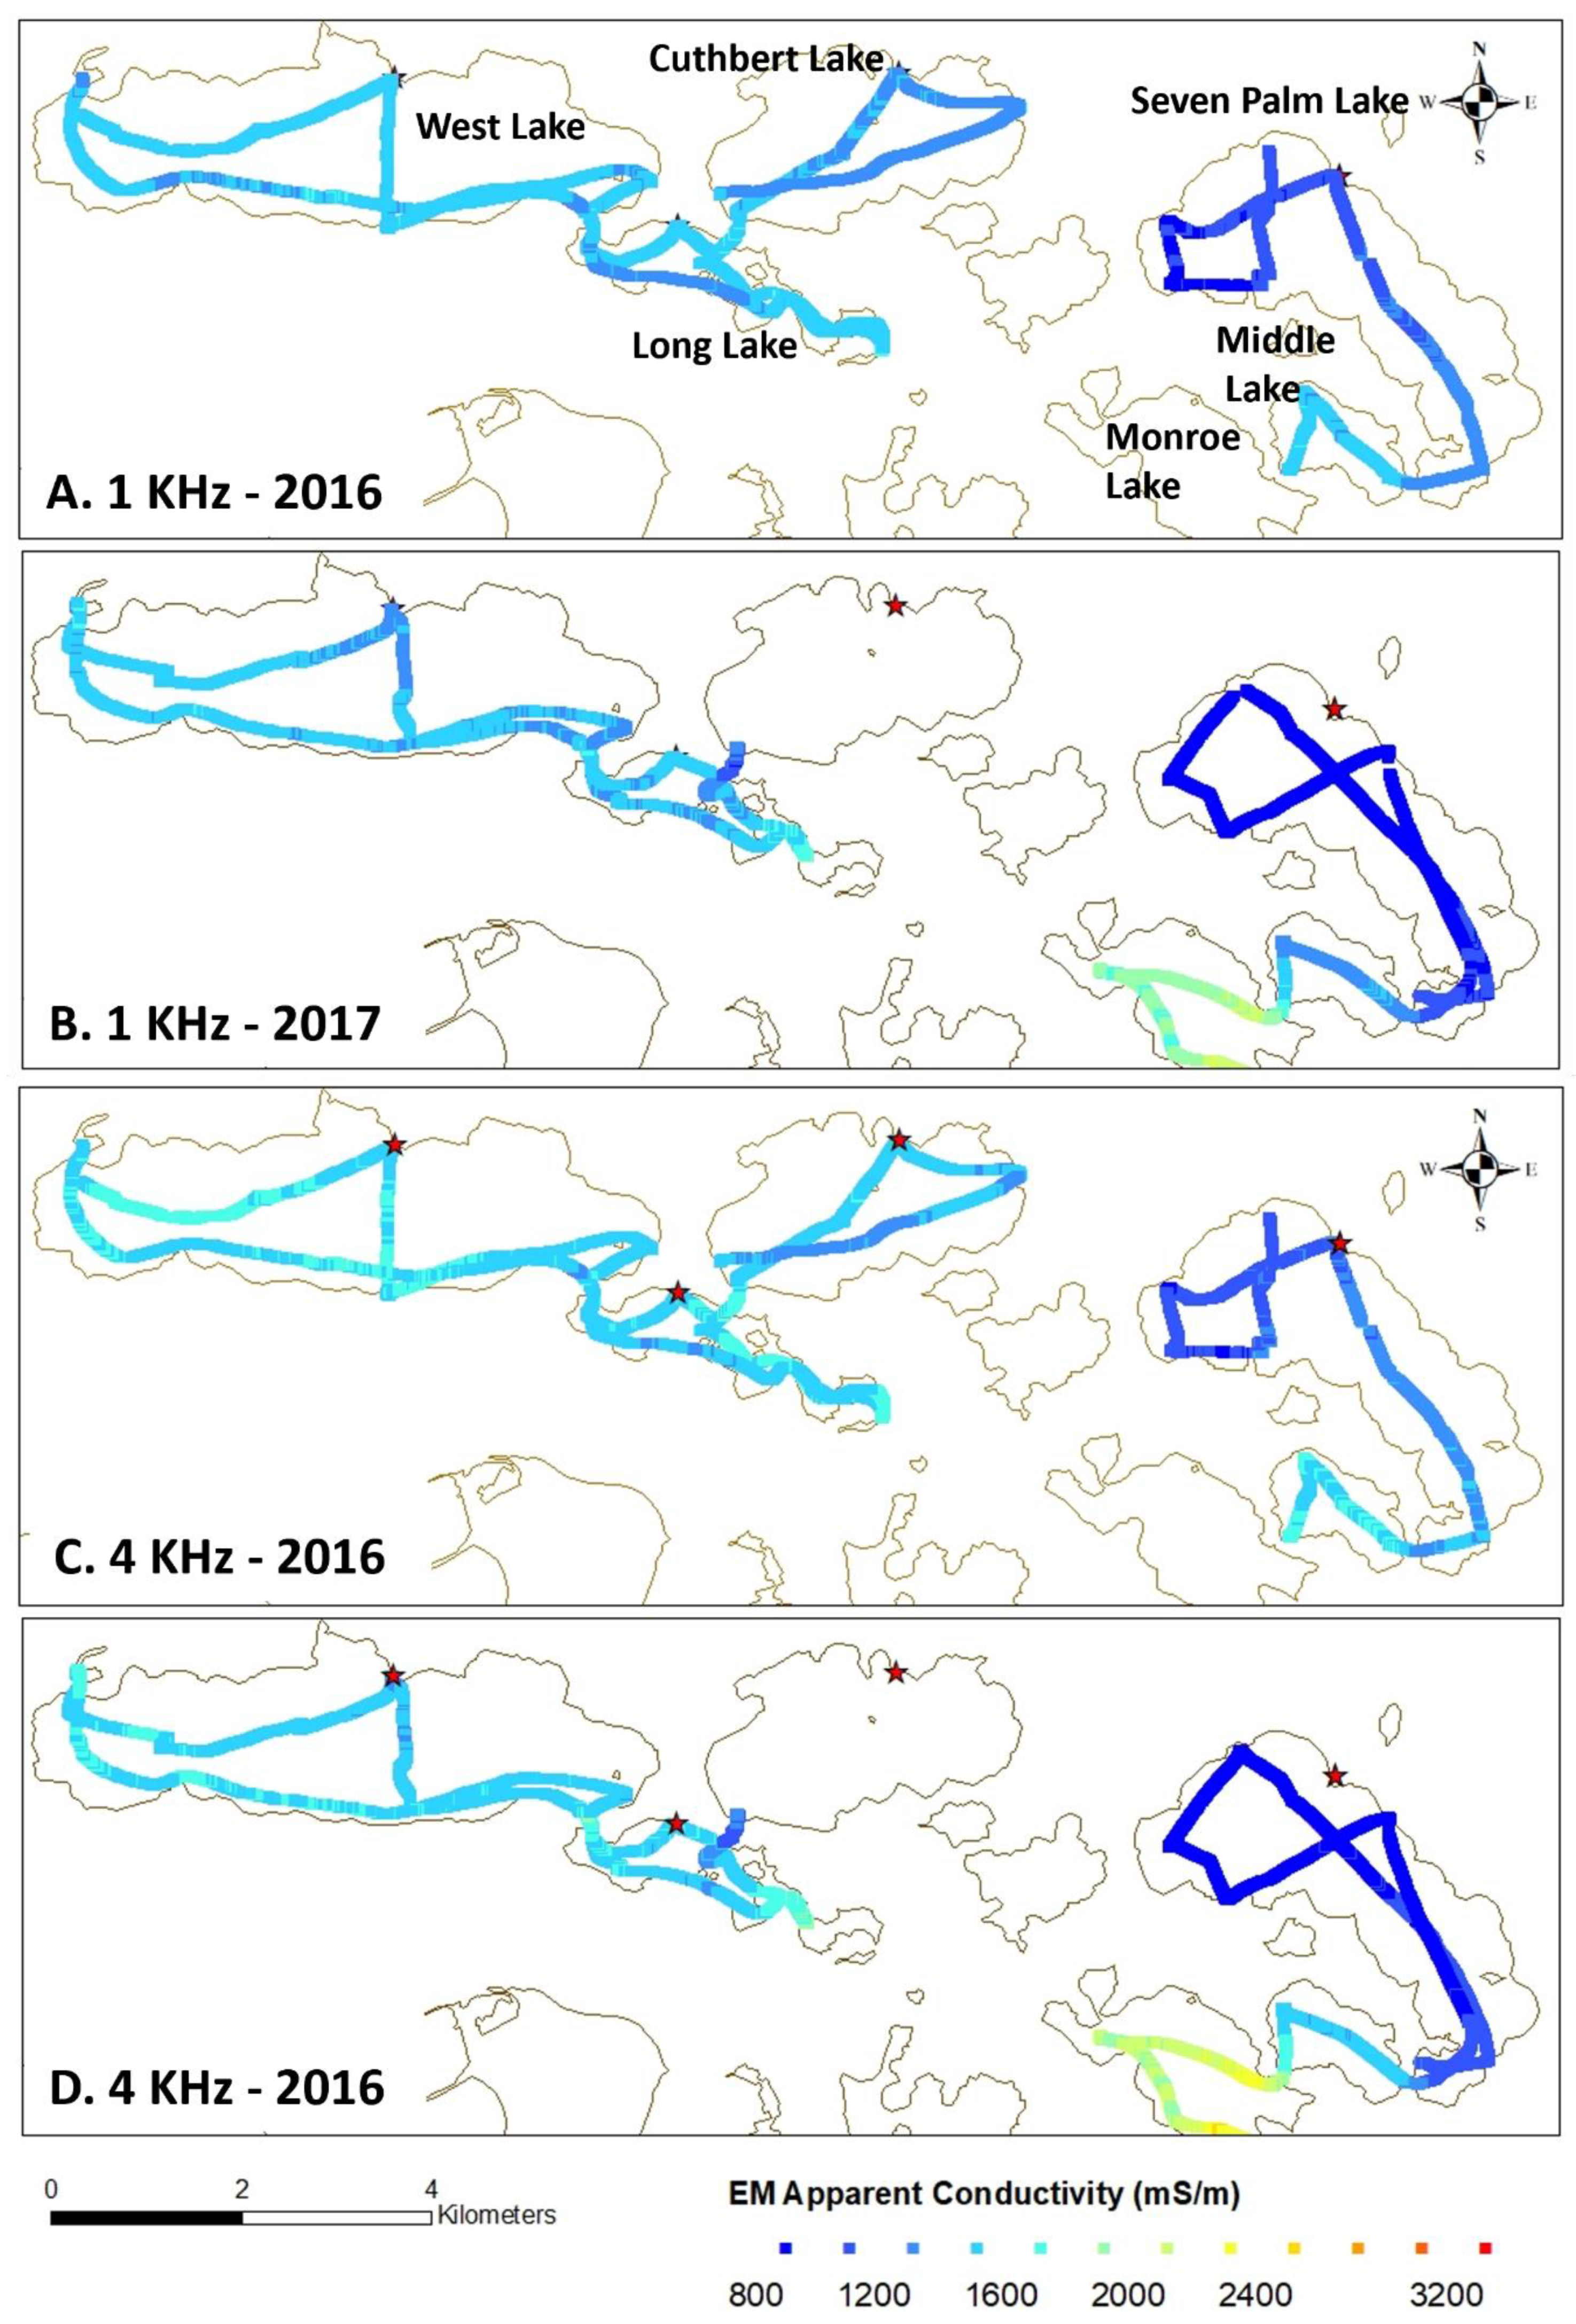
4.1.1. Spatio-Temporal EM Apparent Conductivity Changes during the 2016 Dry Season in the Seven Palm System

In the Seven Palm system at monthly intervals during the 2016 dry season, the apparent conductivity measurements increased from February to April (Figure 4). The 1 KHz apparent conductivity ranged from 800 mS/m at the northern end of Seven Palm Lake to 1400 mS/m at southern end in February 2016, whereas in April 2016, it ranged from 930 to 2150 mS/m. Similarly, the apparent conductivity along 4 KHz ranged from 900 to 1500 mS/m in February 2016 to a range of 1000 to 2800 mS/m in April 2016 (Figure 4). This showed that the apparent conductivities increased from north to south at all frequencies. In addition, for example, in northwest Seven Palm Lake, the 1 KHz apparent conductivities increase from around 800 mS/m in February to around 1070 mS/m in March to over 1100 mS/m in April. In Middle Lake, the apparent conductivities increased from around 1500 mS/m in February to 1700 mS/m in March to over 1800 mS/m in April. In Monroe Lake, it increased from around 2300 mS/m in March to over 2500 in April. This trend is consistent for 4 KHz data as well.
The apparent conductivity of the 16 KHz data varies from 1100 to 2000 mS/m in February 2016 and from 1200 to 2400 mS/m in March 2016 and from 1400 to 3200 mS/m in April 2016 from north to south along the profile line. This is consistent with the increase in conductivity and salinity seen in the surface probe measurements.
In general, during the 2016 dry season, the median apparent conductivity measurements increased from February to April at all frequencies as shown in the boxplot (Figure 5). In the boxplot, the interquartile range (IQR) of the March 2016 data is highly dispersed compared to the other EM data set, because the survey line covered a larger portion of Monroe Lake (Figure 5), which is highly influenced by Florida Bay (Figure 1).

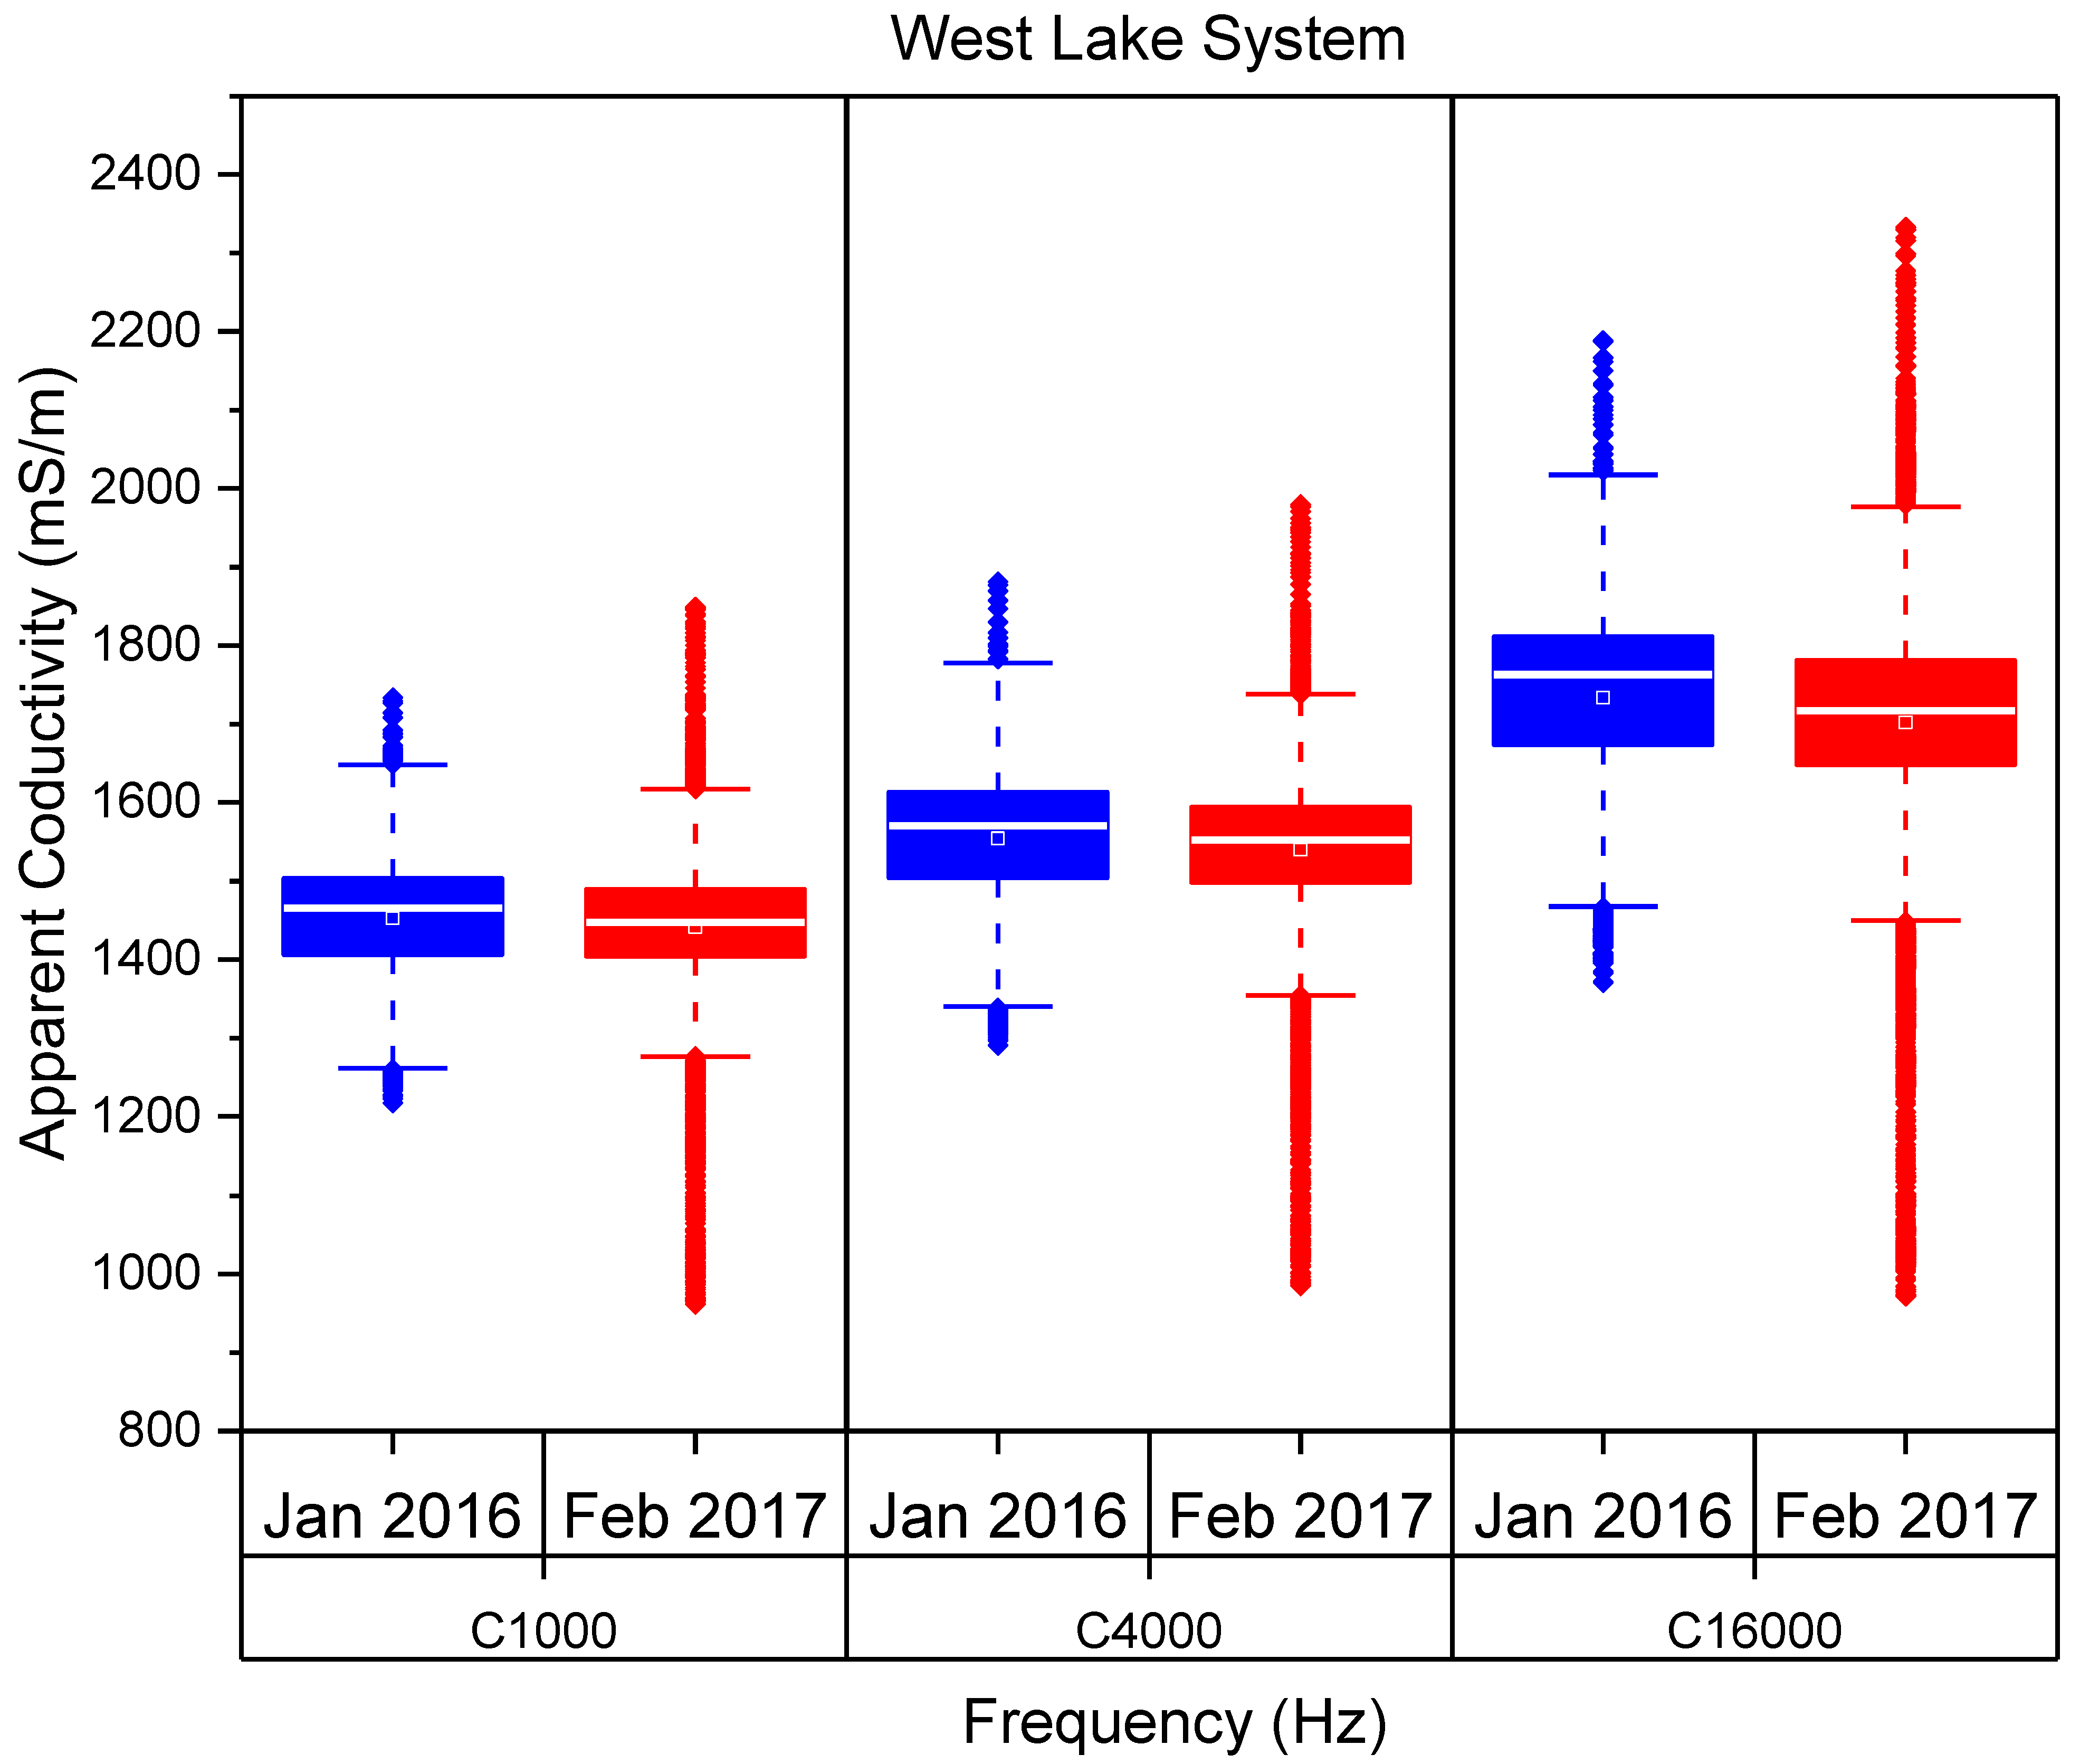
4.1.2. Spatio-Temporal EM Apparent Conductivity Changes between 2016 and 2017 in the Coastal Lakes of ENP

The EM data show a considerable decrease in apparent conductivity between February 2016 and January 2017 in both the Seven Palm and West Lake systems. In the Seven Palm system, the apparent conductivity showed a general decrease of 150 mS/m in the Seven Palm system and 300 mS/m in the Middle Lake (Figure 6A,B). In the Seven Palm system, the 1 KHz apparent conductivity ranged from 800 mS/m at the northern end of Seven Palm Lake to 1400 mS/m at the southern end in February 2016 (Figure 6A), whereas in January 2017, it ranged from 740 to 1200 mS/m (Figure 6B). Similarly, the apparent conductivity along 4 KHz ranged from 870 to 4000 mS/m in 2016 (Figure 6C) to a range of 800 to 2400 mS/m in 2017 (Figure 6D).
The EM results show the same trend in the West Lake system. The apparent conductivity of the 1 KHz data decreases from a range of 1200 to 1700 mS/m in 2016 to 950 to 1850 mS/m in 2017 (Figure 6A,B). In addition, the result along 4 KHz dropped from 1600 mS/m in 2016 to 1500 mS/m in 2017 (Figure 6C,D). Similarly, the result along 16 KHz dropped from 1800 mS/m in 2016 to 1600 mS/ in 2017 (Figure 6E,F). In the West Lake system in January 2016, the highest apparent conductivities (2000 mS/m) were seen at the eastern end of the Long Lake and southern West Lake with the lowest conductivities in northern Cuthbert Lake.
In the West Lake system, the mean, median, and IQR of the apparent conductivity measurements decreased between February 2016 and January 2017 (Figure 7). Similarly, the median apparent conductivity measurements decreased between February 2016 and January 2017 in the Seven Palm system (Figure 5).
The apparent conductivity change between 2016 and 2017 in Seven Palm system is more significant than the West Lake system. The apparent conductivity change between 2017 to 2016, at all frequencies, decreased on average by 30% in Seven Palm system and 10% in West Lake system (Figure 8). At Seven Palm, the apparent conductivity change decreased by 20% at the northern end of Seven Palm Lake near the well and 30% at the southern end and clearly showed the trend from north to south. However, at the northern tip of Seven Palm there was an increase from 30 to 40%. Similarly, in the West Lake system, there was a gradual change from north to south and a significant change of 30% observed on the northern tip of Long Lake. In addition, the apparent conductivity change of the surface water is significant compared to the groundwater. For example, near the well at 1 KHz, 4 KHz, and 16 KHz, the apparent conductivity change decreased by 18%, 21%, and 26%, respectively (Figure 8A–C).

4.2. Electrical Resistivity

The resistivity data collected on 10 July 2019 in Seven Palm Lake and on 15 July 2019 in West Lake were inverted to a two-layer constrained water depth model. In this section, we focus on the spatial−temporal change in groundwater and surface water.
In the constrained water depth inversion, the best fit (red color) and Occam’s inversion (olive color) showed a good agreement in estimating the water column resistivity measured using the YSI probe (Figure 9). In the figures, the equivalence analysis (dashed green line) produced a more tightly constrained result in the West Lake system (Figure 9a–j) compared to the Seven Palm system (Figure 9k–r). In the West Lake system, the surface water resistivity measured using the YSI probe decreased between 0.37 Ω⋅m and 0.28 Ω⋅m from west to east. In the Seven Palm system, the resistivity varies from 0.27 Ω⋅m at the north end to 0.17 Ω⋅m at the south end (Figure 9a–j and Figure 10A). Similarly, the inverted surface water resistivity in the West Lake system decreased between 0.33 Ω⋅m at the west end and 0.26 Ω⋅m at the east end. In the Seven Palm system, the resistivity varies from 0.23 Ω⋅m at the north end to 0.16 Ω⋅m at the south end (Figure 9k–r and Figure 10B). Generally, the data showed west to east and north to south decreases in surface water resistivity.
The lake bottom resistivity in the West Lake system varies between 1.69 Ω⋅m at the west end and 3.74 Ω⋅m at the east end. In the Seven Palm system, the resistivity is 32.85 Ω⋅m in the north and decreases gradually toward the south to 1.5 Ω⋅m (Figure 10C). The lake bottom resistivity generally increased from west to east while it decreased from north to south.
In the inverse model, the minimum and maximum lake bottom resistivity varied between 1.4 Ω⋅m and 3.7 Ω⋅m at West Lake and between 1.4 Ω⋅m and 32.8 Ω⋅m at Seven Palm. Based on equivalency analysis, at West Lake, the model showed a highly constrained model with the lower and upper limit between 1.1 Ω⋅m and 4.9 Ω⋅m (Figure 11), whereas in Seven Palm, the model showed a poorly constrained model with the lower and upper limit between 1.4 Ω⋅m and 362 Ω⋅m (Figure 11). This model is poorly constrained mainly on the upper bound. The lower and upper limits in West Lake are highly constrained compared with the Seven Palm system (Figure 11). This uncertainty on the upper bound could be due to measurement errors induced by wind or wave action.

4.2.1. Formation Factor

One method of estimating the formation factor of the lake bottom formation is by comparing groundwater resistivity ( ρ w ) measured in the shallow groundwater wells with nearby values of lake bottom resistivity ( ρ f ) modeled from the geophysical data. In this study, the West Lake data collected on 15 July 2019, was used to calculate a formation factor for the coastal lakes of ENP. A mean local formation factor of 10.7 ± 1.8 is estimated for the Mangrove Lakes of ENP. This estimated formation factor is calculated from the average formation factor of West Lake, Long Lake, and Cuthbert Lake (Table 4). The formation factor of Seven Palm was not considered in the calculation as the resistivity of the model was poorly constrained due to the noise in the data (Figure 9).

4.2.2. Salinity

The surface water salinity measured using the YSI probe varies from 15 PSU in the west in West Lake to 21 PSU in the east in Seven Palm (Figure 12A). In the Seven Palm system, the surface water salinity measured using the YSI probe varies from 21 PSU in the north to 33 PSU in the south (Figure 12A).
The inverted surface water salinity has the same trend and increased from 19 PSU to 27 PSU from west to east and from 27 PSU to 35 PSU from north to south (Figure 12B). In contrast, the inverted groundwater salinity decreased from 42 PSU in the west in West Lake to 2 PSU in the east in Seven Palm. In the Seven Palm system, the groundwater salinity increased from 2 PSU in the north to 49 PSU in the south (Figure 12C).

5. Discussion

During the 2016 dry season, the apparent conductivity measurements at 1 KHz and 4 KHz increased from February to April (Figure 4 and Figure 5) in the Seven Palm system at monthly intervals. This reflects a general increase in apparent conductivities (salinity) in the groundwater over the dry season. This change is in response to decreased precipitation (Figure 13). Similarly, the apparent conductivity of the 16 KHz data indicates a general increase in apparent conductivities (salinity) in the surface water over the dry season and from north to south along the profile line of the Seven Palm system. This change is due to reduced precipitation and increased potential evapotranspiration, which results in a sharp decrease in the water level as well (Figure 13). The surface water salinities of the coastal lakes of ENP showed brackish to hypersaline salinities with higher salinities in the summer following the dry season [22,23]. Salinity variation in time and space in the Florida Bay is governed by the influence of precipitation [35] evapotranspiration, runoff, mass exchange with the surrounding basins [5], proximity of upstream freshwater sources, and exchange with Florida Bay marine waters downstream [22,23].
Between February 2016 and January 2017, the EM data show a considerable decrease in apparent conductivity in both the Seven Palm and West Lake system. A general decrease of 150 mS/m in Seven Palm system and 300 mS/m in Middle Lake (Figure 6a,b) suggests a freshening of the groundwater and may reflect the effects of increased flow due to restoration efforts. Lower conductivities observed in Cuthbert Lake compared to West Lake and Long Lake may reflect increases in freshwater flows from upstream sources, possibly from increased flows due to restoration efforts.
The apparent conductivity change between 2016 and 2017 in the Seven Palm system is more significant than the West Lake system. The apparent conductivity change decreased on average by 30% in the Seven Palm system and 10% in the West Lake system (Figure 8) at all frequencies. In general, in the coastal lakes of ENP, the decrease in apparent conductivity change is pronounced from west to east at all frequencies. This suggests the restoration efforts may have made a more observable contribution to the Seven Palm system but not yet in the West Lake system. Similarly, other studies conducted by the U.S. Geological Survey to map saltwater intrusion using helicopter electromagnetic (HEM) surveys identified variations in the apparent conductivity that were associated with changes in groundwater quality [39]. The apparent resistivity map (inversely related to conductivity) from the HEM survey showed a transition from low to high resistivity from West Lake to Seven Palm, i.e., high to low conductivity from west to east, which is consistent with the results of this study. The authors concluded the change is due to the influence of freshwater flowing in the Taylor Slough which pushes the transition in a southwesterly direction in the area of maximum flow [40]. A mean local formation factor of 10.7 ± 1.8 is estimated for the Mangrove Lakes of ENP. This estimated formation factor is similar to previously published estimates of formation factor 9.65 for the ENP [19]. We used the estimated formation factor 10.7 in this study to calculate the salinity of the groundwater. This approach has the advantage of forcing the geophysics derived salinities to be consistent with the in situ well measurements.
The surface water salinity increased from west to east, and the groundwater salinity decreased from west to east. In another study conducted by [41], in the Seven Palm system in July 2015, the surface water salinity ranged from 25 PSU in the northern tip of Seven Palm and gradually increased to 45 PSU in Monroe Lake. These hyper-salinity conditions are associated with drought and produced seagrass die-off [8,41]. In July 2019, the surface water salinity ranged from 5 PSU in the northern tip of Seven Palm and gradually increased to 49 PSU in Monroe Lake. Generally, in the West Lake system, the surface water salinity is lower than the groundwater salinity, but in the Seven Palm system, the surface water salinity is higher than the groundwater salinity (Figure 12A). In addition, in both lakes, the salinity of the surface water and groundwater increased from north to south. This result suggests a freshening of the groundwater and may reflect the effects of increased flow due to restoration efforts.
In the Mangrove Lakes of ENP, surface water salinity is driven by seasonally variable winds and evaporation, whereas groundwater salinity is less temporally variable and reflects regional groundwater flow. In the EM data, the apparent conductivity change of the surface water is significant compared to the groundwater (Figure 7). In the VES data, viewed in a west to east profile, less saline surface water in West Lake overlies more saline groundwater (Figure 11). In contrast, in Seven Palm Lake, the vertical salinity profile is inverted with denser, more saline surface water overlying less dense, fresher groundwater. This inverted salinity profile is gravitationally unstable and likely has a profound effect on recharge and discharge mechanisms to and from the aquifer. These results suggest the floating electrical resistivity array can map the resistivity of the subsurface formation effectively.
Some limitations of the estimated formation factor and EM measurements include the following. In the Mangrove Lakes of ENP, the shallow wells only extended to the base of the peat layer and did not penetrate the underlying limestone. This method assumes that the groundwater sampled from the wells is derived from the underlying limestone. Furthermore, repeated measurements would be useful to determine the accuracy of the estimated formation factor value with minimum standard deviation.
In the EM data, the apparent conductivities at certain locations where the EM survey line crosses have different measurements. This difference could be due to instrument drift, the operator changing position during the survey which affects the position of the coils, and calibration problems after Bluetooth connection failure which causes a new calibration in different environmental settings. Furthermore, the EM result is not inverted as the inverted model is not consistently reliable. As a result, the EM data are presented in apparent conductivity. The authors of [42] suggested that discrepancies in inversion for soils having a high surface electrical conductivity relative to deeper depths using EM 38 can be compensated through the vertical or horizontal coil configuration response curve. The EM method provides a faster alternative to DC soundings [16], but it is sensitive to electromagnetic noise produced by metals, pipelines, etc. An integrated approach of electrical resistivity and EM methods can produce the best result [43]. In a saline environment, once areas of high salinity are delineated, alternative methods of salinity measurement can be utilized to provide a detailed description of the study area [42]. Therefore, an integrated approach of using EM, resistivity, and other geological information is necessary to characterize the subsurface formation accurately.

6. Conclusions

Geophysical methods can map the difference in conductivities (salinity) of a subsurface formation effectively. The results of the EM survey show the apparent conductivity measurements systematically increased from February to April 2016 in the Seven Palm system. This demonstrates how the salinity of the surface water and groundwater changes during the dry season. The general increase in the salinity reflects a decreased precipitation, increased evapotranspiration, and the influence of saline water from Florida Bay on the surface water and groundwater. The apparent conductivity showed a considerable decrease between February 2016 and January 2017 in both the West Lake and Seven Palm systems. These changes suggest a freshening of the groundwater and may reflect the effects of increased flow due to restoration efforts. Furthermore, the apparent conductivity change between 2016 and 2017 is more pronounced in the Seven Palm system than in the West Lake system. This suggests the restoration efforts may have made a positive contribution to the Seven Palm system but not yet to the West Lake system.
The floating resistivity survey efficiently characterized the spatial variations in surface water groundwater salinity. In general, both the surface water and the groundwater increased in salinity from north to south. In contrast, the surface water salinity increased from west to east while the groundwater salinity decreased from west to east.
We estimated a mean local formation factor of 10.7 ± 1.8 for the coastal lakes of ENP. This estimated formation factor is slightly higher than the average regional formation factor of 9.65 estimated in another study [18]. The fact that the formation factor is obtained from few measurements may limit the finding of the salinity value in the coastal lakes of ENP. Hence, a further research study is needed to determine the accuracy of the estimated formation factor with minimum standard deviation. Another limitation of this study could be that the groundwater wells are situated approximately 1 m deep and may not represent the deeper groundwater.

Author Contributions

Conceptualization, M.E.K. and D.W.; methodology, M.E.K. and D.W.; software, M.E.K. and D.W.; validation, M.E.K., D.W., R.M.P., T.A.F. and C.J.M.; formal analysis, M.E.K.; investigation, M.E.K. and D.W.; resources, D.W.; data curation, M.E.K., D.W., R.M.P. and T.A.F.; writing—original draft preparation, M.E.K.; writing—review and editing, M.E.K., D.W., R.M.P., T.A.F. and C.J.M.; visualization, M.E.K.; supervision, D.W. and R.M.P.; project administration, D.W.; funding acquisition, R.M.P. All authors have read and agreed to the published version of the manuscript.

Funding

This research was funded by the South Florida Water Management District, Contract numbers PO9500005699 and PO4500093831. This is contribution number 1401 from the Institute of Environment at Florida International University.

Data Availability Statement

Data will be available to readers upon reasonable request.

Acknowledgments

We are grateful to Assefa Melesse, Pete Markowitz, and the anonymous reviewers for reviewing the paper and providing valuable suggestions that improved the manuscript. We are deeply grateful to Josh Allen, who contributed to the data acquisition.

Conflicts of Interest

The authors declare no conflict of interest. The funders had no role in the design of the study; in the collection, analyses, or interpretation of data; in the writing of the manuscript; or in the decision to publish the results.

References

  1. Price, R.; Schwartz, K. Water, Sustainability, and Survival. In The Coastal Everglades: The Dynamics of Social-Ecological Transformation in the South Florida Landscape; Childers, D.L., Gaiser, E.E., Odgen, L.A., Eds.; Oxford University Press: Oxford, UK, 2019; pp. 34–70. [Google Scholar]
  2. Price, R.M.; Top, Z.; Happell, J.D.; Swart, P.K. Use of tritium and helium to define groundwater flow conditions in Everglades National Park. Water Resour. Res. 2003, 39, 1–12. [Google Scholar] [CrossRef]
  3. US Army Corps of Engineers (USACE) and South Florida Water Management District (SFWMD); Central and Southern Florida Comprehensive Review Study. Final Integrated Feasibility Report and Programmatic Environmental Impact Statement. 1999. Available online: https://www.sfwmd.gov/document/central-and-southern-florida-project-comprehensive-review-study-final-integrated (accessed on 21 August 2021).
  4. Dessu, S.B.; Price, R.M.; Troxler, T.G.; Kominoski, J.S. Effects of sea-level rise and freshwater management on long-term water levels and water quality in the Florida Coastal Everglades. J. Environ. Manag. 2018, 211, 164–176. [Google Scholar] [CrossRef] [PubMed]
  5. Kelble, C.R.; Johns, E.M.; Nuttle, W.K.; Lee, T.N.; Smith, R.H.; Ortner, P.B. Salinity patterns of Florida Bay. Estuar. Coast. Shelf Sci. 2007, 71, 318–334. [Google Scholar] [CrossRef]
  6. Barlow, P.M. Groundwater in Freshwater-Saltwater Environments of the Atlantic Coast; United State Geological Survey (USGS): Menlo Park, CA, USA, 2003; Volume 1262. Available online: https://pubs.usgs.gov/circ/2003/circ1262/ (accessed on 23 September 2020).
  7. McIvor, C.C.; Ley, J.A.; Bjork, R.D. Changes in freshwater inflow from the Everglades to Florida Bay including effects on biota and biotic processes: A review. In Everglades: The Ecosystem and Its Restoration; St. Lucie Press: Boca Raton, FL, USA, 1994; pp. 117–146. [Google Scholar]
  8. NPS gov. Florida Bay Seagrass Die-Off National Park Service, U.S. Department of the Interior, South Florida Natural Resources Center Everglades National Park. 2015. Available online: https://www.nps.gov/ever/learn/nature/upload/seagrassDieoff_final_web_hi_res.pdf (accessed on 14 April 2020).
  9. Jansen, J.R. Geophysical Methods to Map Brackish and Saline Water in Aquifers. Proceedings of the 2011 Georgia Water Resources Conference. 2011. Available online: http://smartech.gatech.edu/handle/1853/46031 (accessed on 14 April 2020).
  10. Greenwood, W.J.; Kruse, S.; Swarzenski, P. Extending electromagnetic methods to map coastal pore water salinities. Ground Water 2006, 44, 292–299. [Google Scholar] [CrossRef]
  11. Rajab, J.S.A.; El-Naqa, A.R. Mapping groundwater salinization using transient electromagnetic and direct current resistivity methods in Azraq Basin, Jordan. Geophysics 2014, 78, B89–B101. [Google Scholar] [CrossRef] [Green Version]
  12. Mansoor, N.; Slater, L.; Artigas, F.; Auken, E. High-resolution geophysical characterization of shallow-water wetlands. Geophysics 2006, 71, B101–B109. [Google Scholar] [CrossRef]
  13. Nenna, V.; Herckenrath, D.; Knight, R.; Odlum, N.; Mcphee, D. Application and evaluation of electromagnetic methods for imaging saltwater intrusion in coastal aquifers: Seaside Groundwater Basin, California. Geophysics 2013, 78, B77–B88. [Google Scholar] [CrossRef]
  14. Machado, F.C.; Montanari, R.; Shiratsuchi, L.S.; Lovera, L.H.; Lima, E.D.S. Spatial Dependence of Electrical Conductivity and Chemical Properties of the Soil By Electromagnetic Induction. Rev. Bras. Ciência Do Solo 2015, 39, 1112–1120. [Google Scholar] [CrossRef] [Green Version]
  15. US EPA. Resistivity Methods|Environmental Geophysics. 2021. Available online: https://archive.epa.gov/esd/archive-geophysics/web/html/resistivity_methods.html (accessed on 31 October 2021).
  16. Corriols, M.; Ryom Nielsen, M.; Dahlin, T.; Christensen, N.B. Aquifer investigations in the León-Chinandega plains, Nicaragua, using electromagnetic and electrical methods. Near Surf. Geophys. 2009, 7, 413–426. [Google Scholar] [CrossRef] [Green Version]
  17. Archie, G.E. The Electrical resistivity log as an aid in determining some reservoir characteristics. Trans. AIME 1942, 146, 54–62. [Google Scholar] [CrossRef]
  18. Fitterman, D.V.; Prinos, S.T. Results of Time-Domain Electromagnetic Soundings in Miami-Dade and Southern Broward Counties, Florida: U.S. Geological Survey; Open-File Report; The United States Geological Survey (USGS): Reston, VA, USA, 2011; 289p. Available online: https://pubs.usgs.gov/of/2011/1299/ (accessed on 11 November 2021).
  19. Fitterman, D.V.; Deszcz-Pan, M.; Stoddard, C.E. Results of Time-Domain Electromagnetic Soundings in Everglades National Park, Florida (on CD–ROM): U.S. Geological Survey; Open-File Report; U.S. Geological Survey|U.S. Department of the Interior: Reston, VA, USA, 1999; pp. 99–426. Available online: https://pubs.er.usgs.gov/publication/ofr99426 (accessed on 25 November 2021).
  20. Tucker, N.M. Analyzing Tidal Fluctuations in the Big Pine Key Freshwater Lens with Time-Lapse Resistivity; Florida International University: Miami, FL, USA, 2013. [Google Scholar] [CrossRef]
  21. Fitterman, D.V. Mapping Saltwater Intrusion in the Biscayne Aquifer, Miami-Dade County, Florida using Transient Electromagnetic Sounding. J. Environ. Eng. Geophys. 2014, 19, 33–43. [Google Scholar] [CrossRef]
  22. Frankovich, T.A.; Morrison, D.; Fourqurean, J.W. Benthic macrophyte distribution and abundance in estuarine mangrove lakes: Relationships to water quality. Estuaries Coasts 2011, 34, 20–31. [Google Scholar] [CrossRef]
  23. Frankovich, T.A.; Barr, J.G.; Morrison, D.; Fourqurean, J.W. Differing temporal patterns of Chara hornemannii cover correlate to alternate regimes of phytoplankton and submerged aquatic-vegetation dominance. Mar. Freshw. Res. 2012, 63, 1005–1014. [Google Scholar] [CrossRef] [Green Version]
  24. GSSI. Profiler EMP-400. Available online: https://www.geophysical.com/products/profiler-emp-400 (accessed on 24 July 2021).
  25. AGIUSA. SuperStingTM Wi-Fi. 2019. Available online: https://www.agiusa.com/supersting-wifi (accessed on 17 July 2020).
  26. Binley, A.; Kemna, A. DC Resistivity and Induced Polarization Methods. In Hydrogeophysics; Springer: Berlin/Heidelberg, Germany, 2005; pp. 129–156. [Google Scholar] [CrossRef]
  27. Binley, A. Tools and techniques: Electrical methods. In Treatise on Geophysics, 2nd ed.; Schubert, G., Ed.; Elsevier: Oxford, UK, 2015; pp. 233–259. [Google Scholar] [CrossRef]
  28. Constable, S.C.; Parker, R.L.; Constable, C.G. Occam’s inversion: A practical algorithm for generating smooth models from electromagnetic sounding data. Geophysics 1987, 52, 289–300. [Google Scholar] [CrossRef]
  29. Auken, E.; Christiansen, A.V. Layered and laterally constrained 2D inversion of resistivity data. Geophysics 2004, 69, 752–761. [Google Scholar] [CrossRef]
  30. Stoyer, C. 1D Resistivity, IP, EM Software (Version 3). 2019. Available online: http://www.interpex.com/ix1dv3/ix1dv3.htm (accessed on 17 July 2020).
  31. Inman, J.R. Resistivity Inversion with Ridge Regression. Geophysics 1975, 40, 798. [Google Scholar] [CrossRef]
  32. Unesco. The Practical Salinity Scale 1978 and the International Equation of State of Seawater 1980. Unesco Technical Papers in Marine Science; Unesco: Paris, France, 1981; 25p. [Google Scholar]
  33. Unesco. Algorithms for Computation of Fundamental Properties of Seawater. Unesco Technical Papers in Marine Science; Unesco: Paris, France, 1983; 53p. [Google Scholar]
  34. About Friends of Five Creeks. 2022. Available online: http://www.fivecreeks.org/monitor/sal.html (accessed on 2 January 2022).
  35. Allen, J.M.; Price, R.M. Hydrologic Conditions in West and Seven Palm Lake Drainage Systems in the Florida Everglades. In Proceedings of the 2015 LTER All Scientists Meeting, Estes Park, CO, USA, 30 August–2 September 2015. [Google Scholar]
  36. Keller, G.V.; Frischknecht, F.C. Electrical Methods in Geophysical Prospecting, by G.V. Keller and F.C. Frischknecht; Pergamon Press: Oxford, NY, USA, 1966. [Google Scholar]
  37. McNeill, J.D. Electromagnetic Terrain Conductivity Measurement at Low Induction Numbers. 1980. Available online: http://www.geonics.com/pdfs/technicalnotes/tn6.pdf (accessed on 24 March 2021).
  38. Rashed, M. Rolling ball algorithm as a multitask filter for terrain conductivity measurements. J. Appl. Geophys. 2016, 132, 17–24. [Google Scholar] [CrossRef]
  39. Swart, P.K.; Price, R. Origin of salinity variations in Florida Bay. Limnol. Oceanogr. 2002, 47, 1234–1241. [Google Scholar] [CrossRef]
  40. Stewart, M.A.; Bhatt, T.N.; Fennema, R.J.; Fitterman, D.V. The Road to Flamingo: An Evaluation of Flow Pattern Alterations and Salinity Intrusion in the Lower Glades, Everglades National Park; US Department of the Interior, US Geological Survey: Menlo Park, CA, USA, 2002; p. 38. [Google Scholar] [CrossRef]
  41. Glibert, P.M.; Heil, C.A.; Madden, C.J.; Kelly, S.P. Dissolved organic nutrients at the interface of fresh and marine waters: Flow regime changes, biogeochemical cascades and picocyanobacterial blooms—the example of Florida Bay, USA. Biogeochemistry 2021, 1–27. [Google Scholar] [CrossRef]
  42. Corwin, D.L.; Rhoades, J.D. Measurement of inverted electrical conductivity profiles using electromagnetic induction. Soil Sci. Soc. Am. J. 1984, 48, 288–291. [Google Scholar] [CrossRef]
  43. Lavoué, F.; van der Krak, J.; Rings, J.; André, F.; Moghadas, D.; Huisman, J.A.; Lambot, S.; Weiherrnüller, L.; Vanderborght, J.; Vereecken, H. Electromagnetic induction calibration using apparent electrical conductivity modelling based on electrical resistivity tomography. Near Surf. Geophys. 2010, 8, 553–561. [Google Scholar] [CrossRef]
Figure 1. Map of South Florida showing the location of Everglades National Park (ENP), Everglades Agricultural Areas (EEA), Water Conservation Area (WCA), Shark River Slough (SRS), Taylor Slough (TS), Meteorologic NCL station (Red Pin), well stations, and geophysical survey. The SRS flows from the north to the southwest into the Gulf of Mexico, and the TS flows south into Florida Bay. The geophysical survey includes EM survey denoted by lines and floating array electrical resistivity denoted by letters from a to r. Map coordinates are in UTM, Zone 17N.
Applsci 12 01154 g001
Figure 2. Geophysical experimental set up in West Lake, Everglades National Park, FL. (A) EM experimental set up. (B) Electrical resistivity experimental set up. In the dipole−dipole array, A,B are the current electrodes. M and N are the potential electrodes.
Applsci 12 01154 g002
Figure 3. EM data reduction and smoothing in Seven Palm system on 6 April 2019 at (A). 1 KHz, (B). 4 KHz and (C) 16 KHz. The black and aqua colors indicate the in-phase and quadrature raw EM data. The red and pink colors indicate the In-phase and quadrature raw EM data after outliers were removed. The lime and blue colors indicate the in-phase and quadrature filtered EM data.
Applsci 12 01154 g003
Figure 4. Map of apparent conductivities at 1, 4, and 16 KHz in 2016 in the Seven Palm system, Middle Lake and Monroe Lake. The star shows the location of the monitoring well.
Applsci 12 01154 g004
Figure 5. The box plot shows the mean (white dot), the median (white line), the interquartile range (IQR blue or red box) (i.e., the range between the 25th and 75th percentile), the upper and lower fence (range within 1.5 IQR), and outliers (asterisks). The EM data are not normally distributed, and the outliers (greater than 3 standard deviations of the consequent 100 samples) of the EM data were removed before the exploratory data analysis (boxplot). We considered the outliers marked by asterisks as field values.
Applsci 12 01154 g005
Figure 6. Map of apparent conductivities at West Lake and Seven Palm system: (A) 1 KHz in 2016, (B) 1 KHz in 2017, (C) 4 KHz in 2016, (D) 4 KHz in 2017, (E) 16 KHz in 2016, and (F) 16 KHz in 2017. At West Lake, the data were collected on 25 January 2016 and 10 February 2017. At Seven Palm, the data were collected on 6 February 2016 and 20 January 2017. The star shows the location of the monitoring well.
Applsci 12 01154 g006aApplsci 12 01154 g006b
Figure 7. The box plot shows the mean (white dot), the median (white line), the interquartile range (IQR blue or red box) (i.e., the range between the 25th and 75th percentile), the upper and lower fence (range within 1.5 IQR), and outliers (asterisks).
Applsci 12 01154 g007
Figure 8. Apparent conductivity percent change between 2017 and 2016 in the West Lake and Seven Palm systems. The star shows the location of the monitoring well.
Applsci 12 01154 g008
Figure 9. Constrained resistivity inverse model in West Lake system (aj) and Seven Palm system (kr). The left panel shows the observed and calculated data (lines), and the right panel shows the inverted model. In the left panel, the square dots indicate the observed data, the purple line indicates the best fit calculated data, and the olive color indicates Occam’s inversion. In the right panel, the red line indicates the best fit model, the green dashed lines indicate the equivalency analysis, and the olive line represents Occam’s inversion model. The outlier measurements represented by asterisks were masked during inversion.
Applsci 12 01154 g009aApplsci 12 01154 g009b
Figure 10. Resistivity in West Lake and Seven Palm. (A) Surface water using YSI probe. (B) Surface water from the inverse model. (C) Lake bottom resistivity from the inverse model. The star shows the location of the monitoring well.
Applsci 12 01154 g010
Figure 11. West−east profile showing the inverted lake-bottom resistivity from the VES surveys. Error bars indicate the lower and upper acceptable limits derived from equivalence analysis. West Lake system is located between 515,000 and 525,000 m and the Seven Palm system is located between 525,000 and 530,000 m.
Applsci 12 01154 g011
Figure 12. Salinity in West Lake and Seven Palm. (A) Surface water using YSI probe. (B) Surface water from the inverse model. (C) Groundwater from the inverse model.
Applsci 12 01154 g012
Figure 13. Water level, rainfall, and evapotranspiration data between January 2015 and December 2017 at the NCL station, Everglades National Park. The red rectangle indicates the decrease in rainfall during the EM survey period in 2016 and 2017. The data source is the Everglades Depth Estimation Network (EDEN), USGS website http://sofia.usgs.gov/eden/station.php (accessed on 15 July 2020).
Applsci 12 01154 g013
Table 1. EM survey times (✓).
Year20162017
MonthJanFebMarAprJanFeb
West Lake
Seven Palm
Table 2. Descriptive statistical analysis of data reduction and smoothing: EM data of less than 3 standard deviations were removed and filtered by smoothing 100 consequent samples. The statistical analysis shows the result of 100 consequent samples of EM data from each survey date.
Site DateFrequency (KHz)EM Observed DataEM Data < 3 stdEM Data < 3 std and SmoothingData RemovedN TotalMeanStandard DeviationSE of MeanVarianceSkewnessKurtosisMinimumMedianMaximum
West LakeJanuary 201618923889988725110014896.10.637−0.50−0.26147314901498
West LakeJanuary 201648923889988725110015955.60.632−0.951.03157815961604
West LakeJanuary 2016168923889988725110017857.50.8560.320.06176917841803
West LakeFebruary 20171624861766077171100142075.77.657330.46−1.38133613911565
West LakeFebruary 20174624861766077171100152987.08.775760.41−1.48143214931690
West LakeFebruary 2017166248617660771711001726102.310.210,4590.44−1.48161416871907
Seven PalmFebruary 2016140124010399814100154724.72.56080.880.98149915441624
Seven PalmFebruary 2016440124010399814100163028.62.98190.830.82157116251714
Seven PalmFebruary 20161640124010399814100185639.84.015810.08−0.08177418561955
Seven PalmMarch 2016163806357634634100202750.35.025300.56−0.98195020122126
Seven PalmMarch 2016463806357634634100222657.75.833320.57−0.91213922132342
Seven PalmMarch 20161663806357634634100281590.49.081710.56−0.88267127962997
Seven PalmApril 2016 1471046594555155100117324.52.56020.49−0.28111911711231
Seven PalmApril 2016 4471046594555155100124123.82.45660.890.34120512371309
Seven PalmApril 2016 16471046594555155100138723.82.45680.53−0.19134213831453
Seven PalmJanuary 201715709570957090100112420.12.04041.472.16109311171186
Seven PalmJanuary 201745709570957090100119423.42.35451.672.62116511861268
Seven PalmJanuary 2017165709570957090100128222.22.24911.141.01125812791346
Table 3. The coefficients used to calculate salinity.
i a i b i c i
00.0080.00056.766097 × 10−1
1−0.1692−0.00562.00564 × 10−2
225.3851−0.00661.104259 × 10−4
314.0941−0.0375−6.9698 × 10⁻⁷
4−7.02610.06361.0031 × 10−9
52.7081−0.0144
Table 4. Formation factors in the coastal lakes of ENP.
SiteDateDistance from the Well
(m)
Well DataGeophysical Model F
Surface Water Groundwater   ρ w Surface Water Lake   Bottom   ρ f
West Lake15 July 2019680.320.260.293.2312.6
Long Lake15 July 20198070.190.200.142.1110.6
Cuthbert Lake15 July 2019480.280.310.272.779.0
Seven Palm10 July 2019410.231.120.2232.8529.41
Publisher’s Note: MDPI stays neutral with regard to jurisdictional claims in published maps and institutional affiliations.

