
Characteristic Aroma Compound in Cinnamon Bark Extract Using Soybean Oil and/or Water
by
Wenwen Zhang
1,2,†, 
Chuankang Jia
1,†,
Huimin Yan
1,
Yalin Peng
1,
Enmin Hu
1,
Jun Qi
1,* and
Qing Lin
2 1
Anhui Engineering Laboratory for Agro-Products Processing, College of Tea & Food Science and Technology, Anhui Agricultural University, Hefei 230036, China
2
Anhui Qingsong Food Company Limited, Hefei 230088, China
*
Author to whom correspondence should be addressed.
†
These authors contributed equally to this work.
Appl. Sci. 2022, 12(3), 1284; https://0-doi-org.brum.beds.ac.uk/10.3390/app12031284
Submission received: 25 November 2021
/
Revised: 7 December 2021
/
Accepted: 21 December 2021
/
Published: 26 January 2022
(This article belongs to the Special Issue Quality and Safety Control of Meat Products)
Abstract
:The effects of soybean oil (20%, v/w) and extraction time (30, 60, or 90 min) on volatile compounds in cinnamon bark extract were investigated. The relative content and odor activity values (OAVs) of volatile compounds were measured by Gas Chromatography-Mass Spectrometer (GC-MS). The results showed that a total of 26 and 27 volatile compounds were detected in the water extract and the aqueous phase of the water/oil extraction, respectively. Hexanal, nonanal, cinnamaldehyde, D-limonene, 1-octen-3-ol, linalool, and anethole were the major aroma-active compounds, accounting for 85% of the total substance content. Cinnamaldehyde had the highest contribution rate to the aroma of the water extract (26%), whereas anethole has the highest contribution rate to the aroma of the oil/water extract (30%). Whether or not the extraction medium contained soybean oil, the relative content of aroma-active compounds in the aqueous phase decreased with increased extraction time, and the relative content of these compounds in the aqueous phase further decreased when soybean oil was present. This should be due to the high hydrophobicity of these compounds, which were prone to dissolving in the oil layer during the extraction process, resulting in a decrease in the relative content of aroma-active compounds in the aqueous phase.
1. Introduction
Cinnamomum cassia, known as Chinese Cinnamon, is a member of the Lauraceae family and is widely distributed in the Guangxi, Guangdong, and Yunnan provinces of China [1]. Cinnamaldehyde, the major constituent of cinnamon essential oil, has obvious analgesic and antibacterial effects [2,3], and thus cinnamon has become a popular traditional Chinese medicine substance. In addition, cinnamon is one of the earliest spices used by humans, and its strong aroma makes it popular in Chinese cooking [4].
In China, cinnamon is the most important spice in stewed meat, used to enhance the flavor intensity of meat products and remove the peculiar odor of meat products [5]. The amount of cinnamon added to stewed meat products is approximately 1% of the meat weight [6], and China produces approximately 50 million tons of stewed meat products each year. As a result, approximately 10,000 tons of cinnamon are consumed annually by China’s meat processing industry. At the end of stewing, the cinnamon is discarded, although it always has a cinnamon aroma. Gu et al. [7] reported that 50% of cinnamon essential oil was still present in cinnamon even after 5 h of stewing. In the aroma research on Chinese stewed meat, the water extract of cinnamon is used for evaluating volatile compounds [4,6,7]. In addition, studies on the effect of spices on the flavor of stewed meat products and the identification of the major volatile compounds were performed [7,8], and these studies only focused on the effect of spices on the flavor of meat products and ignored the fact that spices in the stewing system should be extracted into the aqueous phase before being transferred to the meat. Therefore, it is an essential step to reveal the aroma formation of stewed meat by studying the dissolving rule of volatile compounds from spices to the aqueous phase during the long-term heating process, but there is not yet any research.
Steam extraction is a common water extraction method for cinnamon bark, and the main purpose of this method is to obtain essential oils [1,2]. In addition, hot-water extraction of spices is also used to obtain the essential oils via evaporation [9]. The main fields of study of essential oil components in cinnamon include (1) effects of extraction methods on essential oil components [9]; (2) aroma differences in origin, type, and parts of cinnamon [10]; (3) antioxidant properties of cinnamon essential oils [11]; and (4) antibacterial effect of essential oils [12]. Essential oils, in particular, have been widely reported as functional components of edible film in terms of shelf-life extension, increased water retention, or the inhibition of discoloration of meat products [2,11,12]. In addition, there are still few studies on the aroma profile of water extracts of spices. Moreover, the oil/water extraction of spices is a necessary process for the production of braised meat products. The main odorants in spices are hydrophobic, and these substances are easily soluble in oil but hardly soluble in water. For example, cinnamaldehyde, the highest percentage of cinnamon essential oil [1], has a hydrophobicity value of 1.9. As a result, the distribution of characteristic aroma compounds in the cinnamon extract between the oil phase and the aqueous phase is of particular importance in terms of the extraction efficiency of aroma substance; however, it is unknown.
This experiment investigated in detail the dissolving process of aroma compounds from spices into the aqueous phase during the stewing process. Furthermore, in order to simulate the extraction process of spices in the authentic system of Chinese stew meat, cinnamon bark extract using soybean oil and/or water was designed. Soybean oil was chosen because it is a low-cost, odorless matrix with the largest market share. The obtained information can not only reveal the dissolution rule of hydrophobic volatile compounds from spices to the aqueous phase in the presence of soybean oil but also provide a reference for the manipulation of aroma of spices in the manufacturing of stewed meat.
2. Materials and Methods
2.1. Chemicals and Reagents
Cyclohexanone (≥98%) and n-alkane standards (C7–C30, ≥97%) were of high-performance liquid chromatography and were purchased from Sigma Aldrich Ltd. (Saint Louis, MO, USA).
2.2. Cinnamon Bark Extract Preparation
Cinnamon bark (Cinnamomum cassia Presl.) was acquired at a local market in Hefei, Anhui province of China. For the water extract of cinnamon bark, the extract containing 5 g of cinnamon bark and 500 mL of distilled water was packaged in vacuum plastic bags (nylon/polyethylene pouches; Tongxiang Enter Packaging Co. Ltd., Jiaxing, China) and then stewed at 95 °C for 30, 60, or 90 min in a controlled-temperature water bath (HH-42; Lihua, China). Immediately after stewing, the extract was cooled to room temperature in an ice bath, and the aqueous phase of the extract was collected by centrifugation and used for evaluating changes in the profile of volatile compounds. For the oil/water extract of cinnamon bark, the extract containing 5 g of cinnamon bark, 100 mL of soybean oil, and 400 mL distilled water was packaged in vacuum plastic bags, and the subsequent heating, cooling, and sample collection procedures were the same as described previously. Three independent extractions were performed, and a total of 18 samples were analyzed.
2.3. Volatile Compound Analyses
Volatile compounds in cinnamon bark extract were analyzed according to Qi et al. [13]. An aliquot of the extract (7 g) was placed into a 20-mL vial (Supelco Co., Ltd., Bellefonte, PA, USA) with 2 μL of cyclohexanone (1.11 μg/μL in absolute alcohol, an internal standard), and then tightly capped. The odorants were subsequently collected using a TRIPLUS autosampler equipped with an HS-SPME fiber (75 μm, carboxen/polydimethylsiloxane; Supelco Co., Ltd., Bellefonte, PA, USA). After incubating for 30 min at 50 °C, the fiber was then inserted into the GC injector port and desorbed for 3 min at 250 °C. Separation was performed immediately on a GC-Trace Ultra gas chromatograph equipped with an HP-WAX capillary column (30 m length × 0.25 mm i.d. × 0.25 μm film thickness). The oven temperature was held at 40 °C for 3 min, ramped to 70 °C at 3 °C/min, then to 180 °C at 5 °C/min, then to 280 °C at 10 °C/min, and finally held at 280 °C for 5 min. The carrier gas was helium at a constant flow rate of 1 mL/min. Identification was carried out on a DSQ II mass-selective detector, and the detector was operated in the electron impact mode at 70 eV. Full scan (50–550 m/z) mode was applied and the ion source temperature was set to 230 °C. The LRI (linear retention index) for each odorant was calculated based on the retention time of n-alkane standards [14].
The compounds were first matched according to their mass spectra, and then further identified by comparing the LRI values with those in the online databases (https://webbook.nist.gov/chemistry/, accessed on 18 November 2021). The relative concentration of each volatile compound was calculated by dividing the peak area of the compound by the peak area of the internal standard according to Qi et al. [15], based on the semiquantitative determinations.
2.4. Odor Activity Value (OAV) and Its Contribution Rate
OAV was calculated by dividing a volatile compound’s concentration by its threshold value reported in the aqueous phase. The threshold values of aroma compounds identified in the cinnamon extract were derived from previous studies [4,16,17,18,19,20,21,22,23,24,25,26,27,28,29]. A compound with OAV greater than 1 was defined as a direct contributor to aroma quality.
The contribution rate was calculated as a ratio between a volatile compound’s OAV and the total OAV of all odorants. The contribution rate directly reflected the importance of aroma-active compounds in the overall aroma profile.
2.5. Statistical Analysis
The relative concentrations of volatile compounds and their OAVs were presented as the mean ± SD (standard deviation) values of three independent replicates. The variances between the means were determined by one-way analysis of variance, followed by Duncan’s multiple range test using SAS software (SAS Inst. Inc., Cary, NC, USA). The level of p < 0.05 was considered significant. The different cinnamon bark extracts and volatile compounds were also conducted with partial least squares-discriminant analysis (PLS-DA) using SIMCA-P (version 14.0, Umetrics, Umea, Sweden).
3. Results and Discussion
3.1. Changes in the Relative Concentrations of Volatile Compounds in the Water Extract
Table 1 shows changes in the relative content of volatile compounds in the water extract of cinnamon bark. A total of 26 volatile compounds were identified, including 7 aldehydes, 4 alkenes, 7 alcohols, 2 ethers, 3 ketones, and 3 esters. Aldehydes accounted for more than 90% of the total volatile compound content, which was consistent with a previous finding of cinnamon essential oil [1]. Cinnamaldehyde was the most abundant compound in aldehydes, followed by benzaldehyde. With the increased stewing time, the relative content of furfural and cinnamaldehyde decreased significantly, whereas the contents of hexanal, nonanal, benzaldehyde, benzenepropanal, and p-anisaldehyde increased significantly. The decrease in the total aldehyde content was attributed to the decrease in the cinnamaldehyde content, which accounted for more than 90% of the total aldehyde content (Table 1). A previous study has reported that increasing extraction intensity can significantly increase the relative content of aroma compounds in the water extract of spices [30]. Therefore, the increase in the relative content of the five aldehydes noted above can be attributed to the extension of extraction time. The decreased relative content of furfural and cinnamaldehyde may be related with their antioxidant properties. It has previously been demonstrated that furfural and cinnamaldehyde have the ability to scavenge free radicals [31,32], and heating is a vigorous oxidation process. An antioxidant can react with free radicals to generate a variety of products, resulting in a decrease in its relative content. For example, α-tocopherol can react with peroxynitrite to form tocopherylquinone, and it can also react with peroxyl radicals to generate epoxytocopherolquinone. In addition, two α-tocopherol can react to produce tocopherol dimers via a radical coupling reaction [33]. Therefore, the decrease in the relative content of furfural and cinnamaldehyde could be due to the structural transformation in the process of scavenging free radicals.
Among alkenes, the levels of camphene, D-limonene, and cyclooctatetraene increased with the increased heating time, which was attributed to the improved extraction efficiency [30]. In addition, the 4-methoxystyrene content decreased, which may be due to the substance’s catalytic activity [34].
The relative content of eucalyptol and linalool increased with the increased heating time, whereas the relative content of 1-octen-3-ol, isopulegol, and α-terpineol decreased significantly. Isopulegol and α-terpineol share the general structure of monoterpenoids, which have a remarkable ability to scavenge free radicals [35]. Lee and Shibamoto [36] reported that 1-octen-3-ol showed potent antioxidative activities. As a result, the antioxidant properties of 1-octen-3-ol, isopulegol, and α-terpineol caused a decrease in their relative content, as did the decrease in furfural and cinnamaldehyde.
With the increased heating time, the relative content of anethole increased significantly, but the relative content of all ketones and esters decreased significantly, except ethyl cinnamate. The lower levels of these compounds may be related to their vapor pressure (Table 1), as compounds with high vapor pressure tend to migrate into the air phase during heating, resulting in a decrease in their concentrations in the cinnamon extract.
3.2. Changes in the Relative Concentrations of Volatile Compounds in the Oil/Water Extract
Changes in the relative content of volatile compounds in the oil/water extract of cinnamon bark are shown in Table 2. A total of 26 volatile compounds were identified, including 7 aldehydes, 4 alkenes, 7 alcohols, 2 ethers, 3 ketones, and 3 esters. Compared with the water extract, only 1-pentanol was found in the aqueous phase of the oil/water extract. Aldehydes accounted for more than 70–93% of the total volatile compound content, which was in agreement with an earlier report [1]. Cinnamaldehyde and benzaldehyde were the most predominant in aldehydes.
When stewing time increased from 30 min to 60 min, the relative content of all aldehydes increased except cinnamaldehyde, which remained constant; the relative content of all akenes increased except 4-methoxystyrene, which decreased significantly. Among alcohols, the relative content of 1-pentanol, linalool, and benzyl alcohol increased significantly, whereas the relative content of eucalyptol and borneol decreased. In addition, the relative content of the ethers and the esters increased, whereas the relative content of all ketones decreased. An increase in the relative concentrations of these compounds could be explained by increased extraction efficiency [30]. A decrease in the levels of all ketones may be due to the accelerated release of ketones, and Wang [37] reported that aldehydes could promote the release of ketones. The decreased levels of eucalyptol, borneol, and 4-methoxystyrene could be related to the hydrophobicity and density. The density of these three compounds (Table 2) is greater than that of soybean oil (0.92 g/mL), and their hydrophobicity is greater than 2.5. As a result, these compounds could have the advantage of passing through the oil layer into the air phase.
In the next 30 min of stewing time, the relative content of all compounds decreased significantly except 1-pentanol, benzyl alcohol, and 2-cyclohexen-1-one. A decrease in the relative content of almost all compounds was due to their high hydrophobicity, which caused a decrease in the relative content in the aqueous phase because these compounds are more soluble in oil layers. A previous report had shown that the presence of oil resulted in the transfer of a large number of flavor compounds into the oil droplets [38]. The higher relative content of 1-pentanol, benzyl alcohol, and 2-cyclohexen-1-one might be due to their hydrophilicity, which made them less susceptible to the flavor-absorption ability of oils.
3.3. Comparing the Odorant Levels of the Water Extract with Those of the Oil/Water Extract
As stewing time increased from 60 to 90 min, the relative content of odorants in the aqueous phase of the oil/water extract greatly decreased because of the presence of the oil layer. Therefore, the relative concentrations of odorants in the water extract were compared with those in the aqueous phase of the oil/water extract during the first 60 min of stewing. The relative concentrations of all compounds in the aqueous phase of the oil/water extract were significantly lower than those in the aqueous extract except hexanal and camphene. Because hexanal and camphene have high vapor pressure (Table 2), a large number of these compounds should be released into the air phase; however, in the presence of an oil layer, the relative concentrations of these compounds in the aqueous phase increased, resulting from the physical barrier effect of the oil layer and the flavor-adsorption of oil droplets because of their high hydrophobicity [38].
When soybean oil was added into the extraction, the relative content of the aldehydes in the aqueous phase decreased significantly, and nonanal, p-anisaldehyde, and cinnamaldehyde, which have the highest hydrophobicity, decreased by more than 70%; the relative content of all alcohols in the aqueous phase decreased significantly, except eucalyptol in the 30-min extraction group. This difference in eucalyptol may be related to its high vapor pressure and the role of the oil layer, and the degree of decrease in the alcohols with hydrophobicity greater than 2 was significantly higher than that of benzyl alcohol with hydrophobicity of only 1.1. In addition, all alkenes, ethers, ketones, and esters have high hydrophobicity, and their relative concentrations in the aqueous phase decreased by at least 50% in the presence of the oil layer. In general, when the cinnamon extract contained soybean oil, these compounds were prone to dissolving in the oil phase, resulting in a decreased level of these compounds in the aqueous phase [39]. In addition, the relative content of aroma compounds with vapor pressure greater than 2.5 mmHg in the water phase increased, which could be caused by the physical barrier of the oil layer and flavor-adsorption of oil droplets, such as hexanal and camphene.
3.4. Changes in the OAVs and Their Contribution Rate of Volatile Compounds
Changes in OAVs of aromatic compounds in the water extract of cinnamon bark are presented in Table 3. A total of 17 odorants showed aroma activity, including 5 aldehydes, 1 alkene, 5 alcohols, 2 ethers, 2 ketones, and 2 esters. Among these compounds, the OAVs of cinnamaldehyde, nonanal, 1-octen-3-ol, linalool, and anethole exceeded 100, whereas the OAVs of hexanal, benzaldehyde, p-anisaldehyde, D-limonene, eucalyptol, and estragole exceeded 20. In terms of the contribution rate of OAVs, aldehydes contributed more than 50%, followed by alcohols and ethers, and the remaining aroma-active compounds contributed less than 5%.
Changes in OAVs of aromatic compounds in the oil/water extract of cinnamon bark are shown in Table 3. A total of 15 odorants presented aroma activity, including 5 aldehydes, 1 alkene, 5 alcohols, 2 ethers, 1 ketone, and 1 ester. Among these aroma-active compounds, the OAVs of hexanal, nonanal, cinnamaldehyde, 1-octen-3-ol, and anethole were greater than 20, and the OAVs of benzaldehyde, eucalyptol, 1-pentanol, and linalool were greater than 10. Cinnamaldehyde and anethole in the aqueous phase of the oil/water extract were the most important flavor contributors in terms of the contribution rate of OAVs of aroma compounds.
Compared with the water extract, the contribution rate of cinnamaldehyde in the aqueous phase of the oil/water extract to the overall aroma decreased, whereas the contribution of hexanal and D-limonene to the overall aroma increased. Cinnamon, as we all know, has a characteristic “cinnamon” olfactory odor, which is mostly produced by cinnamaldehyde [22]. The relative content of aroma-active compounds in the aqueous phase decreased significantly in the presence of the oil layer, resulting in alterations in the overall aroma profile created by the major aroma-active compounds.
3.5. Changes in the Overall Flavor Profile
PLS-DA was carried out to evaluate the relationships between the OAVs of aroma-active compounds and the water extract samples (Figure 1a), and the first two principal components explained 88% of the total variation (68.1% and 19.9%, respectively). Figure 1b shows the relationships between the contribution rate of OAVs of aroma-active compounds and the water extract samples, and the first two principal components explained 94% of the total variation (65.7% and 28.7%, respectively). The score plots (colored spots) in Figure 1a,b suggested that the water extract of different stewing times was separated from one another. Cinnamaldehyde and 1-octen-3-ol, which present “cinnamon” and “mushroom” odors, respectively, had a close correlation with the 30-min extraction group, and their relative concentrations in the 30-min extraction group were higher than those in the other groups. Therefore, the water extract of cinnamon for 30 min was a better alternative for conserving extraction time and improving aroma intensity.
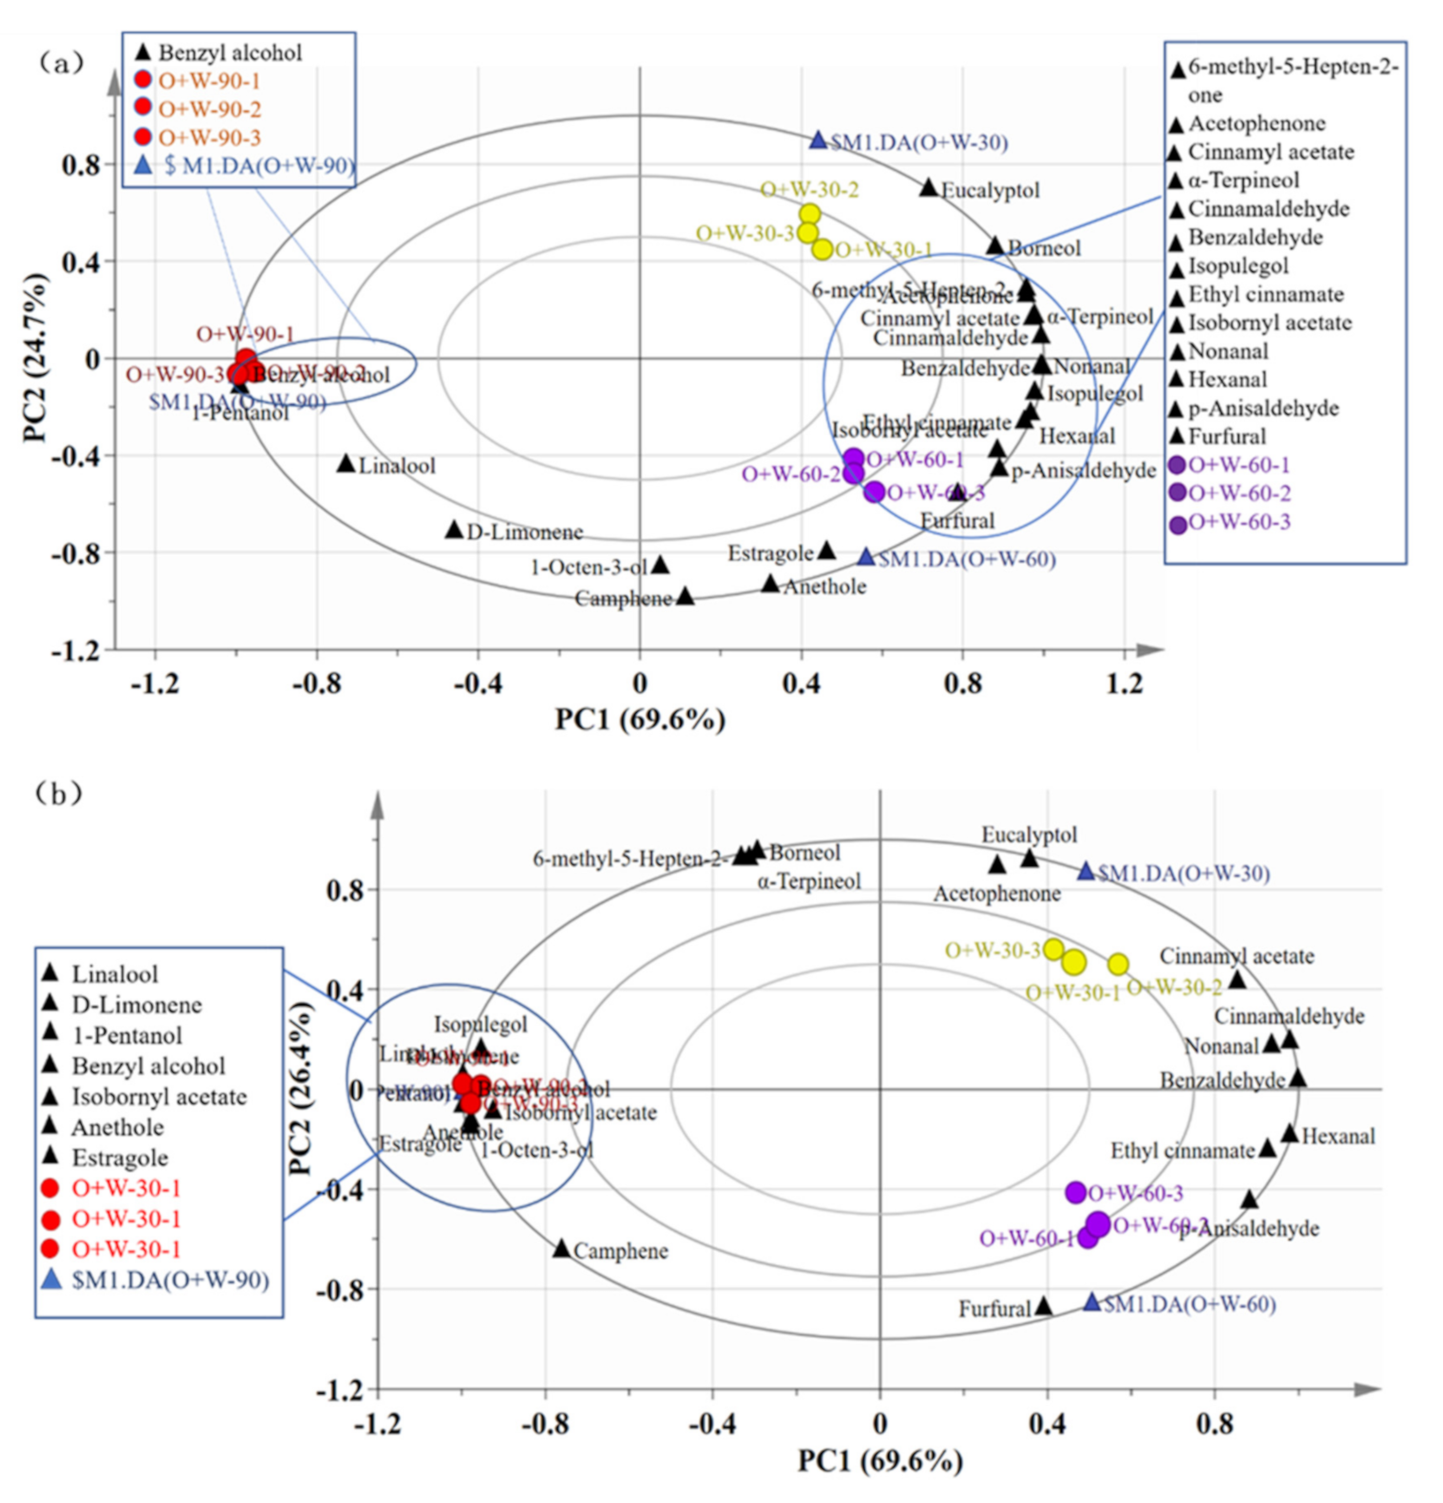
Biplot of PLS-DA for the OAVs of aroma-active compounds with the oil/water extract samples was performed (Figure 2a), and the first two principal components explained 93% of the total variation (69.6% and 24.7%, respectively). The correlations between the contribution rate of OAVs of aroma-active chemicals and the oil/water extract samples are shown in Figure 2b, and the first two principal components explained 94% of the total variation (69.6% and 26.4%, respectively). The score plots (colored spots) in Figure 2a,b suggested that the 30- and 60-min extract groups were distinguished from the 90-min extract group in the PC1 dimension and that the 30- and 60-min extract groups were distinctly separated in the PC2 dimension.
Cinnamaldehyde and eucalyptol, which show “cinnamon” and “minty, eucalyptus” odors [22,23], respectively, had a high correlation with the 30-min extraction group, and eucalyptol might enhance the aroma of the cinnamon extract. Furthermore, the relative concentrations of these two compounds in the aqueous phase of the 30-min extraction group were higher than the relative concentrations in the other groups. As a result, 30 min of stewing is a reasonable duration for oil/water extraction of cinnamon bark.
According to the information acquired, whether it is oil/water extraction or water extraction, 30 min of extraction was advised based on economic cost, efficiency, and aroma intensity. However, it was also found that the relative concentrations of aroma-active compounds in the aqueous phase of the oil/water extraction were significantly lower than those in the water extraction. Furthermore, stewing meat with oil, water, and spices was more common and representative [6]. The oil layer in the oil/water extraction had the potential to bind volatile compounds and shield the phase migration of odorants with high vapor pressure [40], according to the previous analysis results. As a result, the aroma secrets of traditional Chinese meat products made by stewing meat with oil, water, and spices should be dependent on the oil layer, which was also the next step we would carry out.
4. Conclusions
The presence of soybean oil and the extraction times significantly affected the relative content of aroma-active compounds in the cinnamon bark extracts. Because of the high hydrophobicity of these compounds, the total amount of volatile compounds in the water extract of cinnamon bark was 3–20 times that in the aqueous phase of the oil/water extract of cinnamon bark. The aroma-active compounds included hexanal, nonanal, benzaldehyde, p-anisaldehyde, cinnamaldehyde, D-limonene, eucalyptol, linalool, 1-octen-3-ol, α-terpineol, borneol, estragole, anethole, 6-methyl-5-hepten-2-one, acetophenone, ethyl cinnamate, and cinnamyl acetate. Whether soybean oil was present or not during the extraction of cinnamon bark, cinnamaldehyde and anethole were the most important flavor contributors. An increase in the anethole level could be attributed to the improved extraction effect, whereas a decrease in the cinnamaldehyde level might be due to its antioxidant properties. These findings also indicated that the water phase was not the key factor affecting the spice flavor of the oil/water extract. The next step will be to study the change in the content of flavor substances in the oil phase of the oil/water extract of cinnamon bark to clarify the role of the oil phase.
Author Contributions
W.Z.: conceptualization, experiment implementation, writing; C.J.: investigation, formal analysis, writing—original draft; H.Y.: methodology, data curation, writing—review and editing; Y.P.: software, writing—review and editing; E.H.: data analysis; J.Q.: writing—review and editing, supervision; Q.L.: visualization. All authors have read and agreed to the published version of the manuscript.
Funding
This work was supported by the Natural Science Foundation of the Education Department of Anhui Province (KJ2019A0198), Natural Science Foundation of the Science and Technology Department of Anhui Province (2008085QC141), and Key Research and Development Project of Anhui Province (202004f06020035).
Institutional Review Board Statement
Not applicable.
Informed Consent Statement
Not applicable.
Data Availability Statement
The data presented in this study are available on request from the corresponding author. The data are not publicly available due to privacy restrictions.
Conflicts of Interest
The authors declare no conflict of interest.
References
- Li, Y.; Kong, D.; Wu, H. Analysis and evaluation of essential oil components of cinnamon barks using GC–MS and FTIR spectroscopy. Ind. Crops Prod. 2013, 41, 269–278. [Google Scholar] [CrossRef]
- Falleh, H.; Ben Jemaa, M.; Saada, M.; Ksouri, R. Essential oils: A promising eco-friendly food preservative. Food Chem. 2020, 330, 127268. [Google Scholar] [CrossRef] [PubMed]
- Churihar, R.; Solanki, P.; Vyas, S.; Tanwani, H.; Atal, S. Analgesic activity of cinnamaldehyde per se and it’s interaction with diclofenac sodium and pentazocine in swiss albino mice. Int. J. Pharm. 2016, 3, 97–102. [Google Scholar]
- Han, D.; Zhang, C.; Fauconnier, M.L. Effect of seasoning addition on volatile composition and sensory properties of stewed pork. Foods 2021, 10, 83. [Google Scholar] [CrossRef] [PubMed]
- Li, Y.; Fan, D.; Zhao, Y.; Wang, M. Effects of quercetin and cinnamaldehyde on the nutrient release from beef into soup during stewing process. LWT 2020, 131, 109712. [Google Scholar] [CrossRef]
- Sun, L.; Chen, J.; Li, M.; Liu, Y.; Zhao, G. Effect of star anise (Illicium verum) on the volatile compounds of stewed chicken. J. Food Process Eng. 2014, 37, 131–145. [Google Scholar] [CrossRef]
- Gu, M.; Gai, S.; Cui, X.; Wang, H.; Wu, J.; Zhao, Z.; Zhang, Q.; Liu, D. Effect of circulating cooking on volatile flavor compounds in Dezhou braised chicken spices packets. J. Food Qual. Saf. 2019, 10, 4906–4913. (In Chinese) [Google Scholar]
- Yin, H.; Xiao, H.; Deng, G.; Liu, Y.; Jiang, L.; Li, P.; Wang, J. Based on gc-ims technology to analyze the difference in flavor composition of different spice boiling liquids. Sci. Technol. Food Ind. 2021, 42, 278–284. (In Chinese) [Google Scholar]
- Modi, P.I.; Parikh, J.K.; Desai, M.A. Sonohydrodistillation: Innovative approach for isolation of essential oil from the bark of cinnamon. Ind. Crops Prod. 2019, 142, 111838. [Google Scholar] [CrossRef]
- Kaul, P.N.; Bhattacharya, A.K.; Rajeswara Rao, B.R.; Syamasundar, K.V.; Ramesh, S. Volatile constituents of essential oils isolated from different parts of cinnamon (Cinnamomum zeylanicum Blume). J. Sci. Food Agric. 2003, 83, 53–55. [Google Scholar] [CrossRef]
- Xu, T.; Gao, C.; Feng, X.; Yang, Y.; Shen, X.; Tang, X. Structure, physical and antioxidant properties of chitosan-gum arabic edible films incorporated with cinnamon essential oil. Int. J. Biol. Macromol. 2019, 134, 230–236. [Google Scholar] [CrossRef] [PubMed]
- Fasihi, H.; Noshirvani, N.; Hashemi, M.; Fazilati, M.; Salavati, H.; Coma, V. Antioxidant and antimicrobial properties of carbohydrate-based films enriched with cinnamon essential oil by Pickering emulsion method. Food Packag. Shelf Life 2019, 19, 147–154. [Google Scholar] [CrossRef]
- Qi, J.; Liu, D.; Zhou, G.; Xu, X. Characteristic flavor of traditional soup made by stewing Chinese yellow-feather chickens. J. Food Sci. 2017, 82, 2031–2040. [Google Scholar] [CrossRef]
- Qi, J.; Xu, Y.; Zhang, W.; Xie, X.; Xiong, G.; Xu, X. Short-term frozen storage of raw chicken meat improves its flavor traits upon stewing. LWT 2021, 142, 111029. [Google Scholar] [CrossRef]
- Qi, J.; Zhang, W.; Xu, Y.; Xie, X.; Xiong, G.; Xu, X.; Zhou, G.; Ye, M. Enhanced flavor strength of broth prepared from chicken following short-term frozen storage. Food Chem. 2021, 356, 129678. [Google Scholar] [CrossRef] [PubMed]
- Ni, H.; Jiang, Q.; Zhang, T.; Huang, G.; Li, L.; Chen, F. Characterization of the Aroma of an Instant White Tea Dried by Freeze Drying. Molecules 2020, 25, 3628. [Google Scholar] [CrossRef] [PubMed]
- Wang, Z.; Xiao, Q.; Zhuang, J.; Feng, T.; Ho, C.-T.; Song, S. Characterization of aroma-active compounds in four yeast extracts using instrumental and sensory techniques. J. Agric. Food Chem. 2020, 68, 267–278. [Google Scholar] [CrossRef] [PubMed]
- Niu, Y.; Wang, P.; Xiao, Q.; Xiao, Z.; Mao, H.; Zhang, J. Characterization of odor-active volatiles and odor contribution based on binary interaction effects in mango and vodka cocktail. Molecules 2020, 25, 1083. [Google Scholar] [CrossRef] [PubMed] [Green Version]
- Steinhaus, M.; Sinuco, D.; Polster, J.; Osorio, C.; Schieberle, P. Determination of potent flavor compounds in burgundy pinot noir wines using a stable isotope dilution assay. J. Agric. Food Chem. 2009, 57, 2882–2888. [Google Scholar] [CrossRef]
- Aubry, V.; Etiévant, P.X.; Giniès, C.; Henry, R. Quantitative determination of potent flavor compounds in burgundy pinot noir wines using a stable isotope dilution assay. J. Agric. Food Chem. 1997, 45, 2120–2123. [Google Scholar] [CrossRef]
- Yu, A.; Yang, Y.; Yang, Y.; Liang, M.; Zheng, F.; Sun, B. Free and bound aroma compounds of turnjujube (Hovenia acerba lindl.) during low temperature storage. Foods 2020, 9, 488. [Google Scholar] [CrossRef] [Green Version]
- Ma, L.; Gao, W.; Chen, F.; Meng, Q. HS-SPME and SDE combined with GC–MS and GC-O for characterization of flavor compounds in Zhizhonghe Wujiapi medicinal liquor. Food Res. Int. 2020, 137, 109590. [Google Scholar] [CrossRef] [PubMed]
- Yang, C.; Zhao, Z.; Zou, Y.; Ma, S.; Qi, J.; Liu, D. Comparative analysis of flavor differences of six Chinese commercial smoked chicken. CyTA-J. Food 2021, 19, 163–173. [Google Scholar] [CrossRef]
- Liu, H.; Wang, Z.; Zhang, D.; Shen, Q.W.; Pan, T.; Hui, T.; Ma, J. Characterization of key aroma compounds in Beijing roasted duck by gas chromatography-olfactometry-mass spectrometry, odor activity values and aroma recombination experiments. J. Agric. Food Chem. 2019, 67, 5847–5856. [Google Scholar] [CrossRef]
- Feng, Y.; Cai, Y.; Fu, X.; Zheng, L.; Xiao, Z.; Zhao, M. Comparison of aroma-active compounds in broiler broth and native chicken broth by aroma extract dilution analysis (AEDA), odor activity value (OAV) and omission experiment. Food Chem. 2018, 265, 274–280. [Google Scholar] [CrossRef] [PubMed]
- Takemitsu, H.; Amako, M.; Sako, Y.; Shibakusa, K.; Kita, K.; Kitamura, S.; Inui, H. Analysis of volatile odor components of superheated steam-cooked rice with a less stale flavor. Food Sci. Technol. Res. 2016, 22, 771–778. [Google Scholar] [CrossRef] [Green Version]
- Pino, J.A.; Quijano, C.E. Study of the volatile compounds from plum (Prunus domestica L. cv. Horvin) and estimation of their contribution to the fruit aroma. Food Sci. Technol. 2012, 32, 76–83. [Google Scholar] [CrossRef] [Green Version]
- Leffingwell, J.C.; Leffingwell, D. GRAS flavor chemicals-detection thresholds. Perfum. Flavor. 1991, 16, 1–19. [Google Scholar]
- Burdock, G.A. Fenaroli’s Handbook of Flavor Ingredients; Taylor & Francis Group: Abingdon, UK, 2009; pp. 1–2162. [Google Scholar]
- Ratseewo, J.; Tangkhawanit, E.; Meeso, N.; Kaewseejan, N.; Siriamornpun, S. Changes in antioxidant properties and volatile compounds of kaffir lime leaf as affected by cooking processes. Int. Food Res. J. 2016, 23, 188–196. [Google Scholar]
- Singh, G.; Maurya, S.; de Lampasona, M.P.; Catalan, C.A.N. A comparison of chemical, antioxidant and antimicrobial studies of cinnamon leaf and bark volatile oils, oleoresins and their constituents. Food Chem. Toxicol. 2007, 45, 1650–1661. [Google Scholar] [CrossRef] [PubMed]
- Yi, B.H.; Kim, D.H. Antioxidant Activity of Maltol, Kojic Acid, Levulinic Acid, Furfural, 5-Hydroxymethyl Furfural, and Pyrazine. Korean J. Food Sci. Technol. 1982, 14, 265–270. [Google Scholar]
- Pazos, M.; Andersen, M.L.; Medina, I.; Skibsted, L.H. Efficiency of natural phenolic compounds regenerating α-tocopherol from α-tocopheroxyl radical. J. Agric. Food Chem. 2007, 55, 3661–3666. [Google Scholar] [CrossRef] [PubMed]
- Xia, L.; Idhayadhulla, A.; Lee, Y.R.; Kim, S.H.; Wee, Y.-J. Antioxidant and antibacterial evaluation of synthetic furomollugin and its diverse analogs. Med. Chem. Res. 2014, 23, 3528–3538. [Google Scholar] [CrossRef]
- Singh, H.P.; Mittal, S.; Kaur, S.; Batish, D.R.; Kohli, R.K. Chemical composition and antioxidant activity of essential oil from residues of Artemisia scoparia. Food Chem. 2009, 114, 642–645. [Google Scholar] [CrossRef]
- Lee, K.-G.; Shibamoto, T. Antioxidant properties of aroma compounds isolated from soybeans and mung beans. J. Agric. Food Chem. 2000, 48, 4290–4293. [Google Scholar] [CrossRef] [PubMed]
- Wang, K.A.; Susan, D. Binding of selected volatile flavour mixture to salt-extracted canola and pea proteins and effect of heat treatment on flavour binding. Food Hydrocoll. 2015, 43, 410–417. [Google Scholar] [CrossRef]
- Qi, J.; Xu, Y.; Xie, X.; Zhang, W.; Wang, H.; Xu, X.; Xiong, G. Gelatin enhances the flavor of chicken broth: A perspective on the ability of emulsions to bind volatile compounds. Food Chem. 2020, 333, 127463. [Google Scholar] [CrossRef]
- van Ruth, S.M.; Grossmann, I.; Geary, M.; Delahunty, C.M. Interactions between artificial saliva and 20 aroma compounds in water and oil model systems. J. Agric. Food Chem. 2001, 49, 2409–2413. [Google Scholar] [CrossRef]
- Gorle, B.S.K.; Smirnova, I.; McHugh, M.A. Adsorption and thermal release of highly volatile compounds in silica aerogels. J. Supercrit. Fluids 2009, 48, 85–92. [Google Scholar] [CrossRef]
Figure 1.
Biplot of partial least-squares discriminant analysis for water extract samples with OAVs (a) of contribution rates of OAVs (b) of aroma-active compounds. Spots in color (W−i−j): sample numbers, where w is the water extract, i is the number of stewing times, and j is the number of test replicates.

Figure 2.
Biplot of partial least-squares discriminant analysis for oil/water extract samples with OAVs (a) of contribution rates of OAVs (b) of aroma-active compounds. Spots in color (O−W−i−j): sample numbers, where o−w is the oil/water extract, i is the number of stewing times, and j is the number of test replicates.


Table 1.
Changes in relative concentrations of aroma substance in the water extract of cinnamon bark.
Table 1.
Changes in relative concentrations of aroma substance in the water extract of cinnamon bark.
| RT | Compound | LRI | Density (g/mL) | log Kow | Vapor Pressure (mmHg) | Identification | Relative Concentrations (ng/g Extract) | ||
|---|---|---|---|---|---|---|---|---|---|
| 30 min | 60 min | 90 min | |||||||
| Aldehydes | |||||||||
| 7.39 | Hexanal | 1079 | 0.83 | 1.8 | 11.26 | MS + LRI | 136.47 ± 12.09c | 171.05 ± 6.31b | 274.93 ± 18.60a |
| 18.70 | Nonanal | 1396 | 0.83 | 3.3 | 0.37 | MS + LRI | 117.27 ± 1.70b | 142.80 ± 5.25a | 149.10 ± 6.67a |
| 20.61 | Furfural | 1468 | 1.16 | 0.4 | 2.21 | MS + LRI | 67.16 ± 2.92a | 44.35 ± 2.55b | 37.69 ± 4.91b |
| 22.16 | Benzaldehyde | 1508 | 1.05 | 1.5 | 1.27 | MS + LRI | 8.41e3 ± 0.06e3b | 11.03e3 ± 0.15e3a | 10.78e3 ± 0.42e3a |
| 28.32 | Benzenepropanal | 1745 | 1.01 | 1.3 | N.A. | MS + LRI | 1.19e3 ± 0.04e3b | 1.53e3 ± 0.04 e3a | 1.46e3 ± 0.07 e3a |
| 33.41 | p-Anisaldehyde | 2006 | 1.12 | 1.8 | 0.03 | MS + LRI | 564.81 ± 27.84c | 794.41 ± 25.07b | 870.28 ± 31.05a |
| 33.84 | Cinnamaldehyde | 2037 | 1.05 | 1.9 | 0.03 | MS + LRI | 81.92e3 ± 3.03e3a | 64.20e3 ± 2.27e3b | 42.79e3 ± 0.49e3c |
| Subtotal | 92.40e3 ± 2.99e3a | 77.91e3 ± 2.33e3b | 56.36e3 ± 0.99e3c | ||||||
| Alkenes | |||||||||
| 6.74 | Camphene | 1057 | 0.84 | 3.3 | 2.50 | MS + LRI | 13.38 ± 1.39b | 11.47 ± 1.03b | 57.87 ± 3.43a |
| 11.28 | D-Limonene | 1185 | 0.84 | 3.4 | 1.64 | MS + LRI | 187.86 ± 19.96b | 178.61 ± 10.10b | 268.35 ± 17.69a |
| 13.83 | Cyclooctatetraene | 1264 | 3.08 | 3.1 | 7.80 | MS + LRI | 90.58 ± 4.23c | 127.83 ± 0.88b | 224.91 ± 8.30a |
| 26.04 | 4-Methoxystyrene | 1670 | 0.99 | 3.1 | N.A. | MS + LRI | 240.72 ± 19.06a | 117.25 ± 5.96b | 78.78 ± 1.72c |
| Subtotal | 532.55 ± 20.76b | 435.25 ± 16.14c | 629.91 ± 23.15a | ||||||
| Alcohols | |||||||||
| 11.85 | Eucalyptol | 1209 | 0.93 | 2.5 | 1.90 | MS + LRI | 154.73 ± 9.05c | 243.54 ± 15.58b | 345.90 ± 18.09a |
| 20.51 | 1-Octen-3-ol | 1456 | 0.84 | 2.6 | N.A. | MS + LRI | 127.31 ± 4.34a | 38.70 ± 1.11b | 36.23 ± 1.76b |
| 23.07 | Linalool | 1552 | 0.87 | 2.7 | 0.16 | MS + LRI | 473.30 ± 14.13b | 473.10 ± 18.37b | 683.91 ± 31.20a |
| 24.36 | Isopulegol | 1617 | 0.90 | 3 | N.A. | MS + LRI | 834.35 ± 31.34a | 485.51 ± 21.57b | 466.64 ± 16.60b |
| 26.65 | α-Terpineol | 1680 | 0.93 | 1.8 | 0.04 | MS + LRI | 690.93 ± 13.96a | 507.52 ± 14.96b | 508.01 ± 38.52b |
| 26.77 | Borneol | 1690 | 1.10 | 2.7 | 0.05 | MS + LRI | 997.79 ± 40.01 | 973.50 ± 30.48 | 935.43 ± 35.49 |
| 30.54 | Benzyl alcohol | 1861 | 1.05 | 1.1 | 0.09 | MS + LRI | 23.55 ± 1.72 | 23.31 ± 0.54 | 20.87 ± 2.82 |
| Subtotal | 3.30e3 ± 0.06e3a | 2.75e3 ± 0.05e3c | 3.00e3 ± 0.13e3b | ||||||
| Ethers | |||||||||
| 25.89 | Estragole | 1661 | 0.96 | 3.4 | 0.165 | MS + LRI | 243.84 ± 34.84a | 132.02 ± 4.81b | 225.98 ± 14.28a |
| 29.40 | Anethole | 1815 | 0.99 | 3.3 | 0.07 | MS + LRI | 1.65e3 ± 0.05e3c | 2.40e3 ± 0.06e3b | 5.91e3 ± 0.39e3a |
| Subtotal | 1.90e3 ± 0.03e3c | 2.53e3 ± 0.07e3b | 6.14e3 ± 0.40e3a | ||||||
| Ketones | |||||||||
| 16.87 | 6-methyl-5-Hepten-2-one | 1341 | 0.85 | 1.9 | N.A. | MS + LRI | 129.37 ± 2.25a | 118.04 ± 1.35b | 104.82 ± 4.67c |
| 19.67 | 2-Cyclohexen-1-one | 1412 | 0.98 | 0.6 | N.A. | MS + LRI | 77.22 ± 3.69a | 67.14 ± 2.44b | 52.76 ± 5.06c |
| 25.37 | Acetophenone | 1645 | 1.03 | 1.6 | 0.4 | MS + LRI | 339.27 ± 29.74a | 290.24 ± 6.71b | 232.62 ± 15.08c |
| Subtotal | 545.86 ± 19.83a | 475.42 ± 3.93b | 390.20 ± 12.10c | ||||||
| Esters | |||||||||
| 23.75 | Isobornyl acetate | 1583 | 0.98 | 3.3 | 0.107 | MS + LRI | 220.23 ± 10.06a | 106.39 ± 3.16c | 197.40 ± 4.51b |
| 35.45 | Ethyl cinnamate | 2106 | 1.05 | 3 | 0.00 | MS + LRI | 128.16 ± 0.91 | 135.01 ± 11.88 | 128.69 ± 14.89 |
| 35.79 | Cinnamyl acetate | 2150 | 1.05 | 2.3 | N.A. | MS + LRI | 1708.64 ± 14.92a | 781.35 ± 14.34b | 602.13 ± 47.93c |
| Subtotal | 2.06e3 ± 0.02e3a | 1.02e3 ± 0.02e3b | 0.93e3 ± 0.06e3c | ||||||
| Total | 100.73e3 ± 3.01e3a | 85.12e3 ± 2.49e3b | 67.45e3 ± 1.59e3c | ||||||
Means with different letters within a row are significantly different (p < 0.05). Each value is expressed as mean ± SD (n = 3). LRI: Linear retention index on HP-WAX column. LogKow, density, and vapor pressure were obtained from https://pubchem.ncbi.nlm.nih.gov, accessed on 18 November 2021. N.A.: not acquired. Definitions: MS, mass spectrum (identified with the mass spectra of database); LRI, linear retention index (compared with the LRI in the online database, http://webbook.nist.gov, accessed on 18 November 2021). This information also applies to Table 2.
Table 2.
Changes in relative concentrations of aroma substance in the aqueous phase of the oil/water extract of cinnamon bark.
Table 2.
Changes in relative concentrations of aroma substance in the aqueous phase of the oil/water extract of cinnamon bark.
| RT | Compound | LRI | Density (g/mL) | log Kow | Vapo Pressure (mmHg) | Identification | Relative Concentrations (ng/g Extract) | ||
|---|---|---|---|---|---|---|---|---|---|
| 30 min | 60 min | 90 min | |||||||
| Aldehyde | |||||||||
| 7.39 | Hexanal | 1079 | 0.83 | 1.8 | 11.26 | MS + RI | 223.14 ± 7.49b | 316.24 ± 14.57a | 12.78 ± 0.50c |
| 18.70 | Nonanal | 1396 | 0.83 | 3.3 | 0.37 | MS + RI | 30.73 ± 1.89a | 33.17 ± 0.94a | 9.74 ± 1.83b |
| 20.61 | Furfural | 1468 | 1.16 | 0.4 | 2.21 | MS + RI | 19.11 ± 0.60b | 35.88 ± 4.37a | 10.32 ± 0.65c |
| 22.16 | Benzaldehyde | 1508 | 1.05 | 1.5 | 1.27 | MS + RI | 3115.85 ± 101.70b | 3504.35 ± 170.50a | 69.45 ± 5.41c |
| 28.32 | Benzenepropanal | 1745 | 1.01 | 1.3 | N.A. | MS + RI | 306.43 ± 6.69b | 404.53 ± 8.21a | 15.22 ± 3.14c |
| 33.41 | p-Anisaldehyde | 2006 | 1.12 | 1.8 | 0.03 | MS + RI | 91.19 ± 4.83b | 176.85 ± 8.97a | 10.85 ± 1.99c |
| 33.84 | Cinnamaldehyde | 2037 | 1.05 | 1.9 | 0.03 | MS + RI | 21.60e3 ± 0.41e3a | 21.07e3 ± 1.33e3a | 1.80e3 ± 0.06e3b |
| Subtotal | 25.38e3 ± 0.51e3a | 25.54e3 ± 1.47e3a | 1.93e3 ± 0.06e3b | ||||||
| Alkenes | |||||||||
| 6.74 | Camphene | 1057 | 0.84 | 3.3 | 2.50 | MS + RI | 53.85 ± 7.02c | 208.84 ± 13.01a | 125.43 ± 6.46b |
| 11.28 | D-Limonene | 1185 | 0.84 | 3.4 | 1.64 | MS + RI | 156.12 ± 7.46b | 170.56 ± 7.42a | 173.78 ± 6.21a |
| 13.83 | Cyclooctatetraene | 1264 | 3.08 | 3.1 | 7.80 | MS + RI | 49.12 ± 4.13b | 100.99 ± 5.40a | 23.48 ± 1.34c |
| 26.04 | 4-Methoxystyrene | 1670 | 0.99 | 3.1 | N.A. | MS + RI | 21.03 ± 3.40a | 16.59 ± 1.45b | 6.49 ± 0.10c |
| Subtotal | 280.12 ± 15.73c | 496.98 ± 20.33a | 329.19 ± 12.16b | ||||||
| Alcohols | |||||||||
| 11.85 | Eucalyptol | 1209 | 0.93 | 2.5 | 1.90 | MS + RI | 149.53 ± 4.10a | 77.91 ± 5.94b | 40.52 ± 3.49c |
| 14.16 | 1-Pentanol | 1275 | 0.82 | 1.6 | 3.04 | MS + RI | 12.07 ± 2.08b | 13.87 ± 1.49b | 55.70 ± 1.57a |
| 20.51 | 1-Octen-3-ol | 1456 | 0.84 | 2.6 | N.A. | MS + RI | 22.14 ± 1.97c | 30.61 ± 2.82a | 26.45 ± 0.77b |
| 23.07 | Linalool | 1552 | 0.87 | 2.7 | 0.16 | MS + RI | 55.28 ± 1.25b | 58.10 ± 3.27ab | 61.84 ± 0.98a |
| 24.36 | Isopulegol | 1617 | 0.90 | 3 | N.A. | MS + RI | 60.48 ± 2.98b | 66.83 ± 3.05a | 37.76 ± 0.87c |
| 26.65 | α-Terpineol | 1680 | 0.93 | 1.8 | 0.04 | MS + RI | 104.69 ± 1.81a | 97.51 ± 5.82a | 50.59 ± 1.36b |
| 26.77 | Borneol | 1690 | 1.10 | 2.7 | 0.05 | MS + RI | 310.14 ± 6.95a | 241.82 ± 8.39b | 144.20 ± 3.00c |
| 30.54 | Benzyl alcohol | 1861 | 1.05 | 1.1 | 0.09 | MS + RI | 9.73 ± 2.04b | 9.11 ± 1.47b | 77.02 ± 6.79a |
| Subtotal | 724.05 ± 7.88a | 595.77 ± 18.80b | 494.08 ± 12.84c | ||||||
| Ethers | |||||||||
| 25.89 | Estragole | 1661 | 0.96 | 3.4 | 0.165 | MS + RI | 21.03 ± 2.60b | 27.80 ± 2.22a | 21.43 ± 1.05b |
| 29.40 | Anethole | 1815 | 0.99 | 3.3 | 0.07 | MS + RI | 607.54 ± 12.89c | 747.43 ± 13.68a | 644.98 ± 10.36b |
| Subtotal | 628.57 ± 13.90c | 775.23 ± 15.83a | 666.41 ± 9.35b | ||||||
| Ketones | |||||||||
| 16.87 | 6-methyl-5-Hepten-2-one | 1341 | 0.85 | 1.9 | N.A. | MS + RI | 60.78 ± 1.34a | 53.34 ± 1.64b | 29.21 ± 1.17c |
| 19.67 | 2-Cyclohexen-1-one | 1412 | 0.98 | 0.6 | N.A. | MS + RI | N.D. | N.D. | 15.36 ± 0.38 |
| 25.37 | Acetophenone | 1645 | 1.03 | 1.6 | 0.4 | MS + RI | 65.94 ± 0.18a | 57.60 ± 3.49b | 26.93 ± 2.38c |
| Subtotal | 126.72 ± 1.21a | 110.95 ± 5.11b | 71.50 ± 1.35c | ||||||
| Esters | |||||||||
| 23.75 | Isobornyl acetate | 1583 | 0.98 | 3.3 | 0.107 | MS + RI | 14.88 ± 1.65b | 18.07 ± 0.62a | 10.79 ± 1.08c |
| 35.45 | Ethyl cinnamate | 2106 | 1.05 | 3 | 0.00 | MS + RI | 18.75 ± 2.08b | 25.92 ± 1.93a | 5.01 ± 0.62c |
| 35.79 | Cinnamyl acetate | 2150 | 1.05 | 2.3 | N.A. | MS + RI | 69.65 ± 6.54a | 64.07 ± 4.55a | 19.31 ± 3.37b |
| Subtotal | 103.28 ± 5.54a | 108.06 ± 6.37a | 35.11 ± 4.83b | ||||||
| Total | 26.52e3 ± 0.52e3a | 27.03e3 ± 1.51e3a | 3.03e3 ± 0.07e3b | ||||||
Means with different letters within a row are significantly different (p < 0.05). Each value is expressed as mean ± SD (n = 3). N.D.: not detected.
Table 3.
Changes in OAVs and contribution rates of aroma substance in the water extract and in the aqueous phase of the oil/water extract.
Table 3.
Changes in OAVs and contribution rates of aroma substance in the water extract and in the aqueous phase of the oil/water extract.
| Compound | Odor Descriptors | Odor Thresholdn (ng/g) | Water Extract | Oil/Water Extract | Reference | ||
|---|---|---|---|---|---|---|---|
| OAVs | Contribution Rates (%) | OAVs | Contribution Rates (%) | ||||
| Aldehyde | |||||||
| Hexanal | grass, green | 5 | 27–55 | 3–5 | 2–63 | 2–21 | [24] |
| Nonanal | green, fatty | 1 | 117–149 | 14–18 | 10–33 | 8–12 | [30] |
| Furfural | almond, bread, sweet | 10,000 | <1 | <1 | <1 | <1 | [17] |
| Benzaldehyde | almond, burnt sugar | 350 | 24–32 | 3–4 | 0–10 | 0–3 | [23] |
| p-Anisaldehyde | fennel, hawthorn | 21 | 27–41 | 3–5 | 1–8 | 0–3 | [22] |
| Cinnamaldehyde | cinnamon | 385 | 111–213 | 11–26 | 5–56 | 4–12 | [22] |
| Alkene | |||||||
| Camphene | green, camphoreous | 450 | <1 | <1 | <1 | <1 | [16] |
| D-Limonene | citrus, mint | 10 | 19–27 | 2–3 | 16–17 | 6–14 | [4] |
| Alcohols | |||||||
| Eucalyptol | minty, eucalyptus | 12 | 13–29 | 2–3 | 3–12 | 2–5 | [23] |
| 1-Pentanol | rubber, phenolic | 3 | N.D. | N.D. | 4–19 | 2–13 | |
| 1-Octen-3-ol | mushroom | 1 | 36–127 | 3–15 | 22–31 | 9–18 | [30] |
| Linalool | flower, lavender | 6 | 79–114 | 9–11 | 9–10 | 3–7 | [4] |
| Isopulegol | minty | 1000 | 0–1 | <1 | <1 | <1 | [29] |
| α-Terpineol | green | 330 | 2 | <1 | <1 | <1 | [27] |
| Borneol | camphor | 140 | 7 | 1 | 1–2 | 1 | [21] |
| Benzyl alcohol | popcorn, sweet | 900 | <1 | <1 | <1 | <1 | [26] |
| Ether | |||||||
| Estragole | licorice, anise | 6 | 22–41 | 3–5 | 4–5 | 1–2 | [4] |
| Anethole | anissed-like | 15 | 110–394 | 13–37 | 41–50 | 16–30 | [4] |
| Ketones | |||||||
| 6-methyl-5-Hepten-2-one | green, nutty | 50 | 2–3 | <1 | <1 | 0.85 | [28] |
| Acetophenone | floral, almond | 65 | 4–5 | 0–1 | <1 | 1.03 | [23] |
| Ester | |||||||
| Isobornyl acetate | woody, camphor | 1800 | <1 | <1 | <1 | 0.98 | [18] |
| Ethyl cinnamate | honey | 16 | 8 | 1 | 0–1 | 1.05 | [20] |
| Cinnamyl acetate | floral | 150 | 4–11 | 0–1 | <1 | 1.05 | [19] |
Each value is expressed as mean ± SD (n = 3). Means in the same row with no common superscript differed significantly. Odor thresholds were obtained with water applied as the matrix.
Publisher’s Note: MDPI stays neutral with regard to jurisdictional claims in published maps and institutional affiliations. |
© 2022 by the authors. Licensee MDPI, Basel, Switzerland. This article is an open access article distributed under the terms and conditions of the Creative Commons Attribution (CC BY) license (https://creativecommons.org/licenses/by/4.0/).
Share and Cite
MDPI and ACS Style
Zhang, W.; Jia, C.; Yan, H.; Peng, Y.; Hu, E.; Qi, J.; Lin, Q. Characteristic Aroma Compound in Cinnamon Bark Extract Using Soybean Oil and/or Water. Appl. Sci. 2022, 12, 1284. https://0-doi-org.brum.beds.ac.uk/10.3390/app12031284
AMA Style
Zhang W, Jia C, Yan H, Peng Y, Hu E, Qi J, Lin Q. Characteristic Aroma Compound in Cinnamon Bark Extract Using Soybean Oil and/or Water. Applied Sciences. 2022; 12(3):1284. https://0-doi-org.brum.beds.ac.uk/10.3390/app12031284
Chicago/Turabian StyleZhang, Wenwen, Chuankang Jia, Huimin Yan, Yalin Peng, Enmin Hu, Jun Qi, and Qing Lin. 2022. "Characteristic Aroma Compound in Cinnamon Bark Extract Using Soybean Oil and/or Water" Applied Sciences 12, no. 3: 1284. https://0-doi-org.brum.beds.ac.uk/10.3390/app12031284
Note that from the first issue of 2016, this journal uses article numbers instead of page numbers. See further details here.