1. Introduction
Recently, multicomponent seismology has gained considerable attention due to providing more seismic wavefield information for imaging complex structures and predicting reservoirs [
1]. Generally, three-component (3C) geophones simultaneously record two horizontal components and one vertical component of the incident seismic wave. Ground roll is coherent noise with characteristics of strong energy, low frequency, low velocity and elliptical polarization, which shield the seismic reflection wave from the middle-deep layer in near offset. Ground roll attenuation is a key step in seismic data processing. An adaptive matched filter is conventionally used to process each component separately for attenuating ground roll. This method consists of a prediction step and a robust subtraction step. Ground roll is predicted by data-driven interferometry method [
2] or model-driven semi-analytic modeling [
3] methods. Then, an optimization subtraction operation is used to adaptively separate the ground roll [
2]. Filter methods in transform domain are also commonly used, such as the frequency-wavenumber (F-K) filter, Radon transform [
4], Curvelet-domain filter [
5] and time-frequency-domain filter [
6], to attenuate the ground roll based on the different characteristics of frequency, velocity and polarization between the ground roll and seismic reflection waves. However, when the acquisition geometry is under sampled in space, the aliasing problem can decrease the effect of these methods. In land multicomponent seismic exploration, 3C seismic data are recorded and processed as a vector, which provides not only a robust analysis of each individual component but also valuable information about the coherency components [
7,
8].
Empirical mode decomposition (EMD) proposed by Huang et al. [
9] decomposes a signal into a series of intrinsic mode functions (IMFs). Each IMF has a relatively local constant frequency ranging from high frequency to low frequency. The EMD method does not require predetermined base functions and can adaptively separate nonlinear and non-stationary signals. EMD and its extensions have good performance on random and ground roll attenuation [
10,
11,
12]. Chen et al. [
13] used complete ensemble empirical mode decomposition (CEEMD) to improve the standard EMD method and obtained better results when they were applied to attenuate the ground roll.
The standard EMD method is conventionally conducted on each component separately, which results in misaligned IMFs for multicomponent data. The ground roll attenuation based on the standard EMD method damages the vector coherence of seismic data. Combining multiple components with a higher-dimensional signal could circumvent the mode alignment problem caused by the standard EMD method [
14]. Rehman and Mandic [
15] proposed a multivariate empirical mode decomposition (MEMD) method to process multicomponent signals and obtained the IMFs of aligned frequency range. These IMFs match well in the frequency scale and number properties for each component of the multicomponent data. In order to solve the mode mixing effect in standard EMD, extended EMD methods [
13,
16] have been proposed. Rehman and Mandic [
17] proposed noise-assisted MEMD (NA-MEMD) to improve MEMD by adding extra components containing independent white noise to the original multivariate signal. This method helps overcome the mode-mixing problem existing in the extracted IMFs.
In this paper, we propose an alternative ground roll attenuation method for multicomponent seismic data in time domain. First, we start this article with a description of the MEMD and NA-MEMD methods. Then, we demonstrate the principle of the proposed method for ground roll attenuation of multicomponent seismic data. Finally, the synthetic and field seismic data tests demonstrate that the NA-MEMD method can effectively attenuate the ground roll. Compared to the F-K filter method, the proposed method preserves more low-frequency content of the seismic reflection wave and coherency information between components.
2. MEMD Method
The EMD adaptively decomposes the original signal into a finite set of signals, called intrinsic mode functions, abbreviated IMFs [
9]. Each IMF represents different vibrational modes embedded in the data, and also has a localized frequency content by preventing frequency spreading because of asymmetric waveforms. Obtaining the IMFs with a frequency range from high to low frequency is an iterative sifting procedure, as follows:
Compute the mean envelope , where and are the upper and lower envelopes that pass through the maxima and minima of the input signal , respectively;
Set the residue as the new input and repeat step 1.
This two-step iterative process is repeated until the stopping criterion is satisfied. The resulting residue of this iteration can be regarded as the first IMF with the lowest frequency content. In standard EMD, the local mean is computed by taking an average of the upper and lower envelopes, and IMFs in turn are obtained between the local maxima and minima. For multicomponent signals, the local maximum and minimum values are not directly defined by the EMD. Rehman and Mandic [
15] proposed to generate multiple
n-dimensional envelopes by taking signal projections along different directions in
n-dimensional spaces. Cubic spline interpolations in different directions are adopted to form multiple local envelops, and then these values are averaged. Later, the MEMD proposed was used to process the nonlinear
n-dimensional time-series signals. Let the sequence
represent a multivariate signal with
n components, and
denote a set of direction vectors along the directions given by angles
on an (
n − 1)-dimensional sphere. The main steps of the MEMD method are as follows,
Take advantage of Hammersley sequence sampling method, choose a suitable pointset for sampling on an (n − 1)-dimensional sphere;
Calculate a projection set, denoted by , of the input signal along the direction vector , for all k, which is the whole set of direction vectors, giving as the set of projections;
Find the time instants corresponding to the maxima of the set of projected signals ;
Interpolate to perform multiple spline interpolation and obtain multivariate envelope curves ;
For a set of direction vectors, the mean value of the envelope curves is calculated as ;
Extract the ‘detail’ using . If the ‘detail’ fulfills the stopping criterion for a multivariate IMF, apply the above procedure to , otherwise apply the above procedure to .
Through a series of MEMD processes, like the EMD decomposition algorithm, the n-dimensional multi-signal is decomposed into a series of IMF components and a residue , where q denotes the number of IMF components.
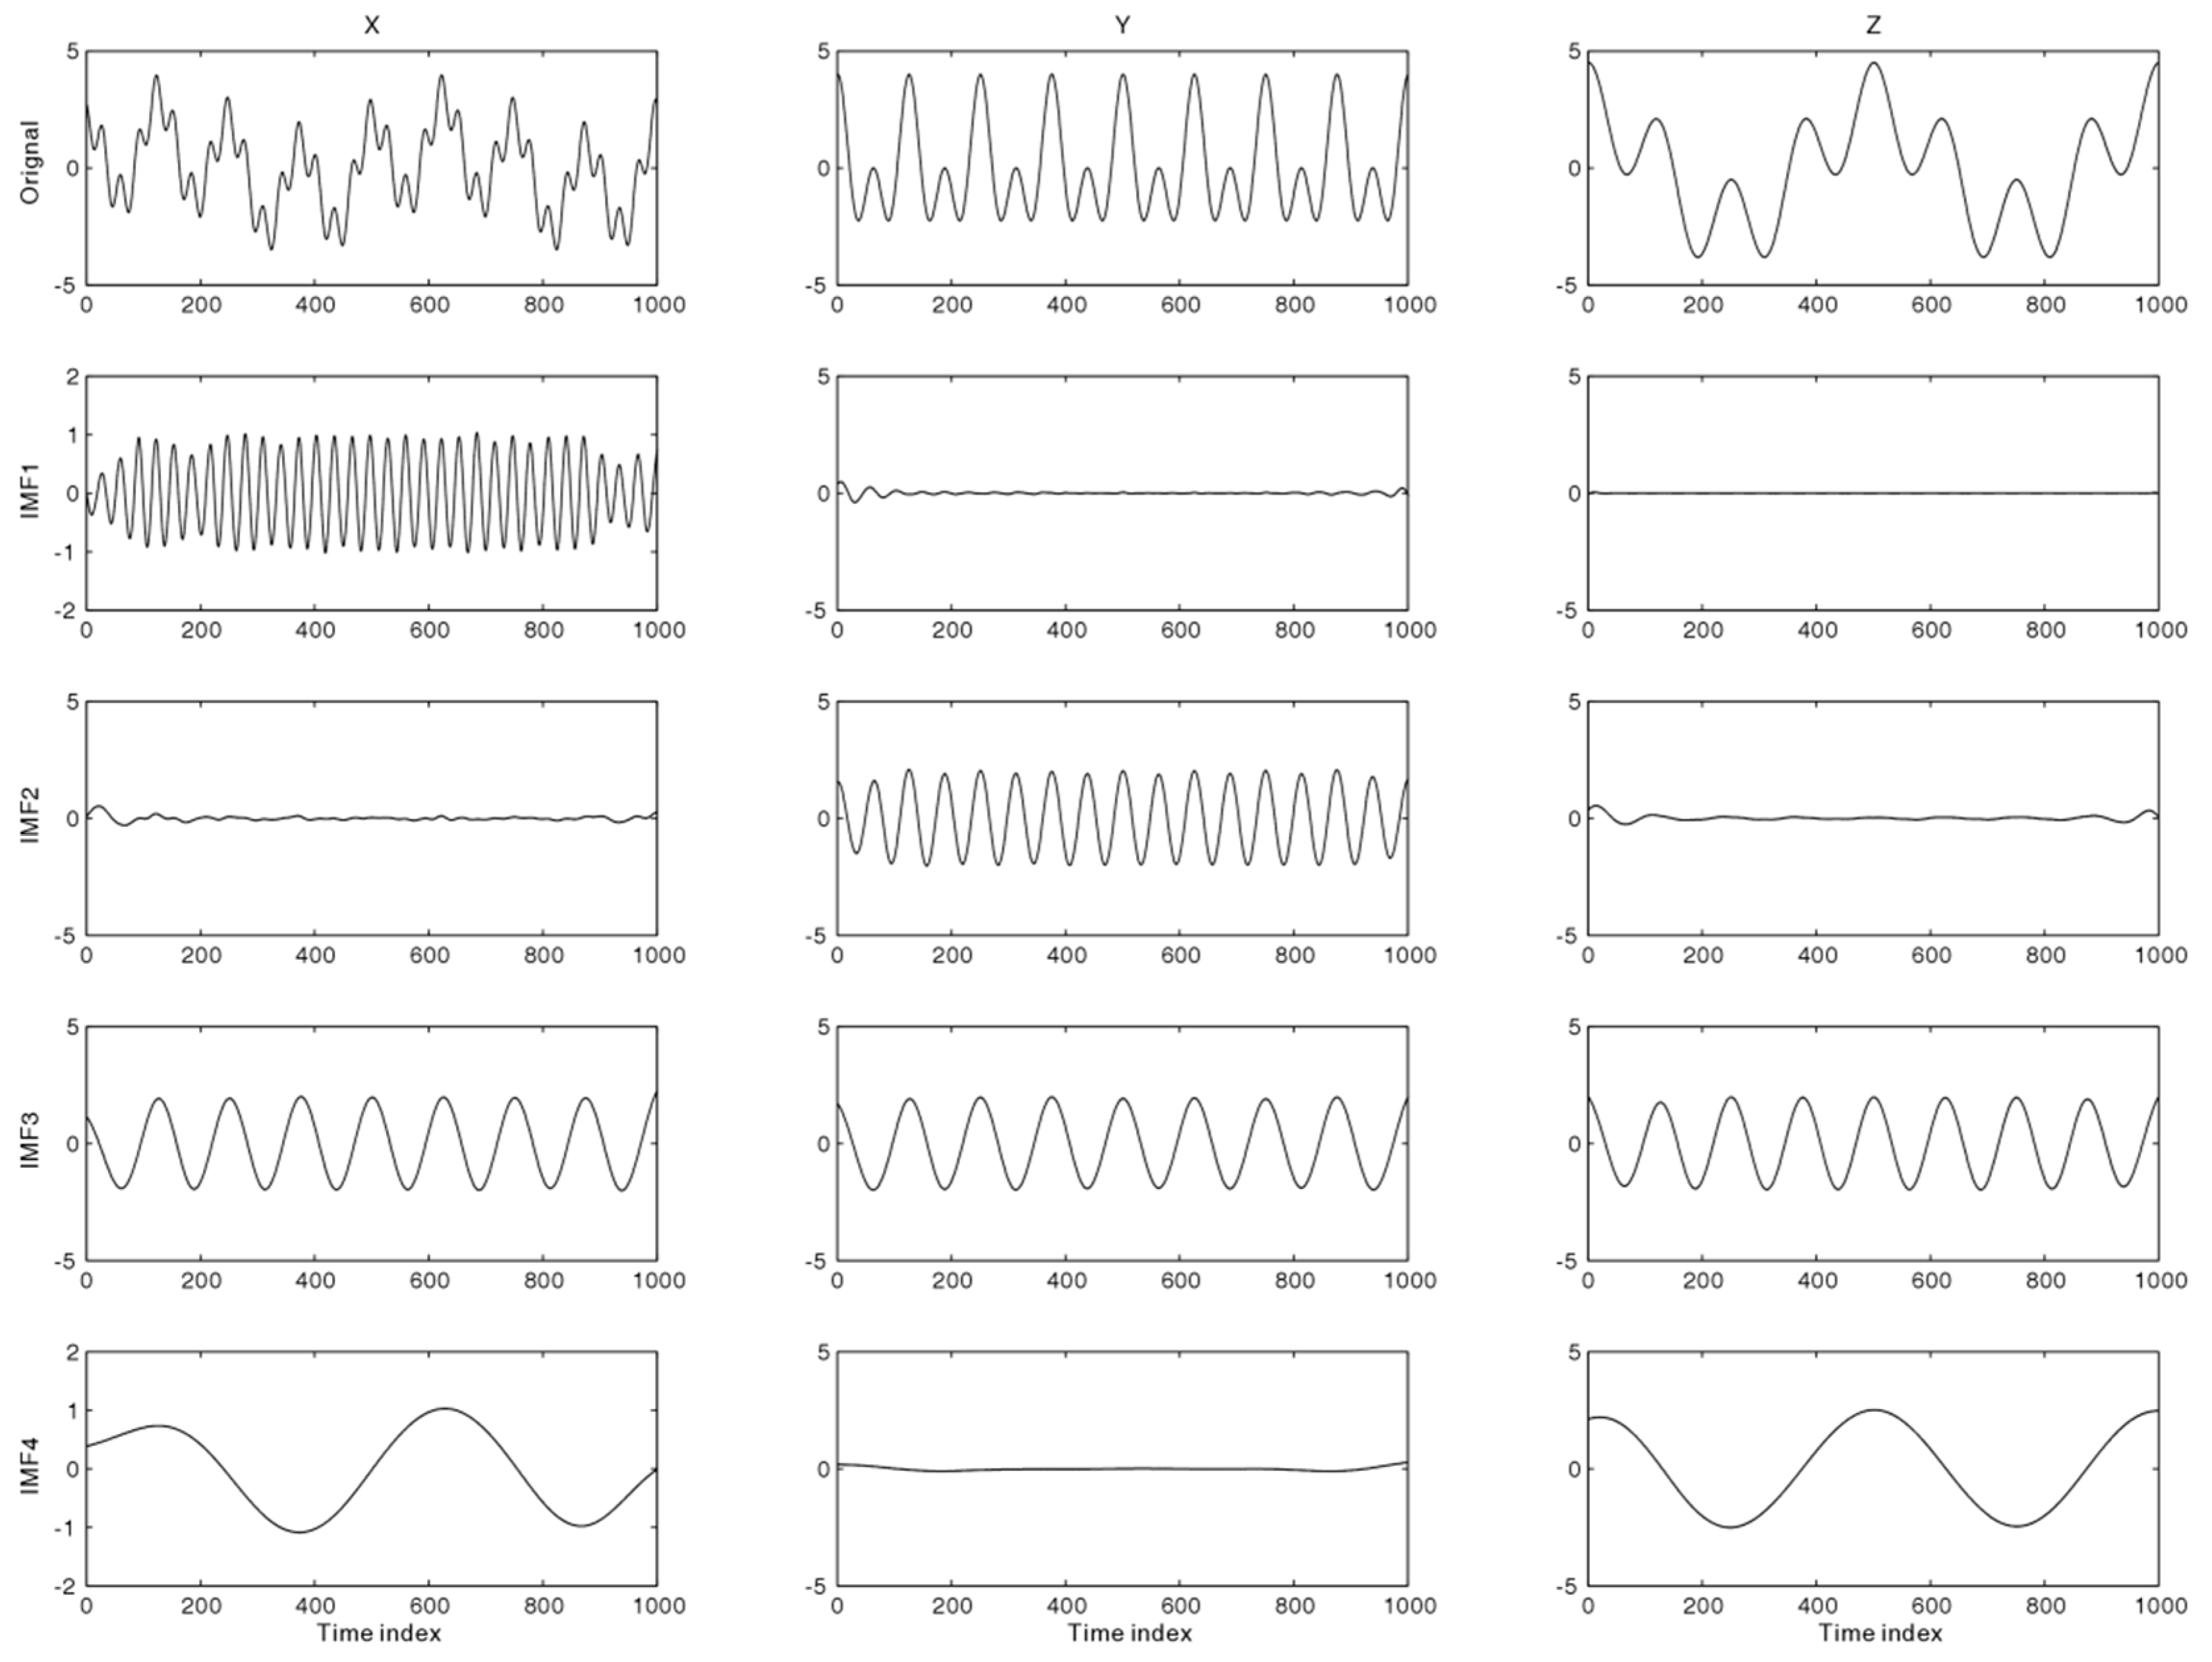
The ability of MEMD which aligns to the intrinsic mode functions is demonstrated in
Figure 1. We tested the MEMD method on synthetic data using a three-component signal s = [X, Y, Z] whose components are mixtures of a 16 Hz sinusoid common to all data channels, a 64 Hz and 4 Hz tone in the X component, a 32 Hz tone in the Y component and a 4 Hz tone in the Z components. We observed that all IMFs are three-dimensional and scale-aligned; the 16 Hz tone present in all data channels is localized in a single IMF3, while the 64 Hz, 32 Hz, and 4 Hz tones are localized in IMF1, IMF3, and IMF4, respectively. Such a strict mode alignment cannot be achieved when applying the standard EMD channel wise.
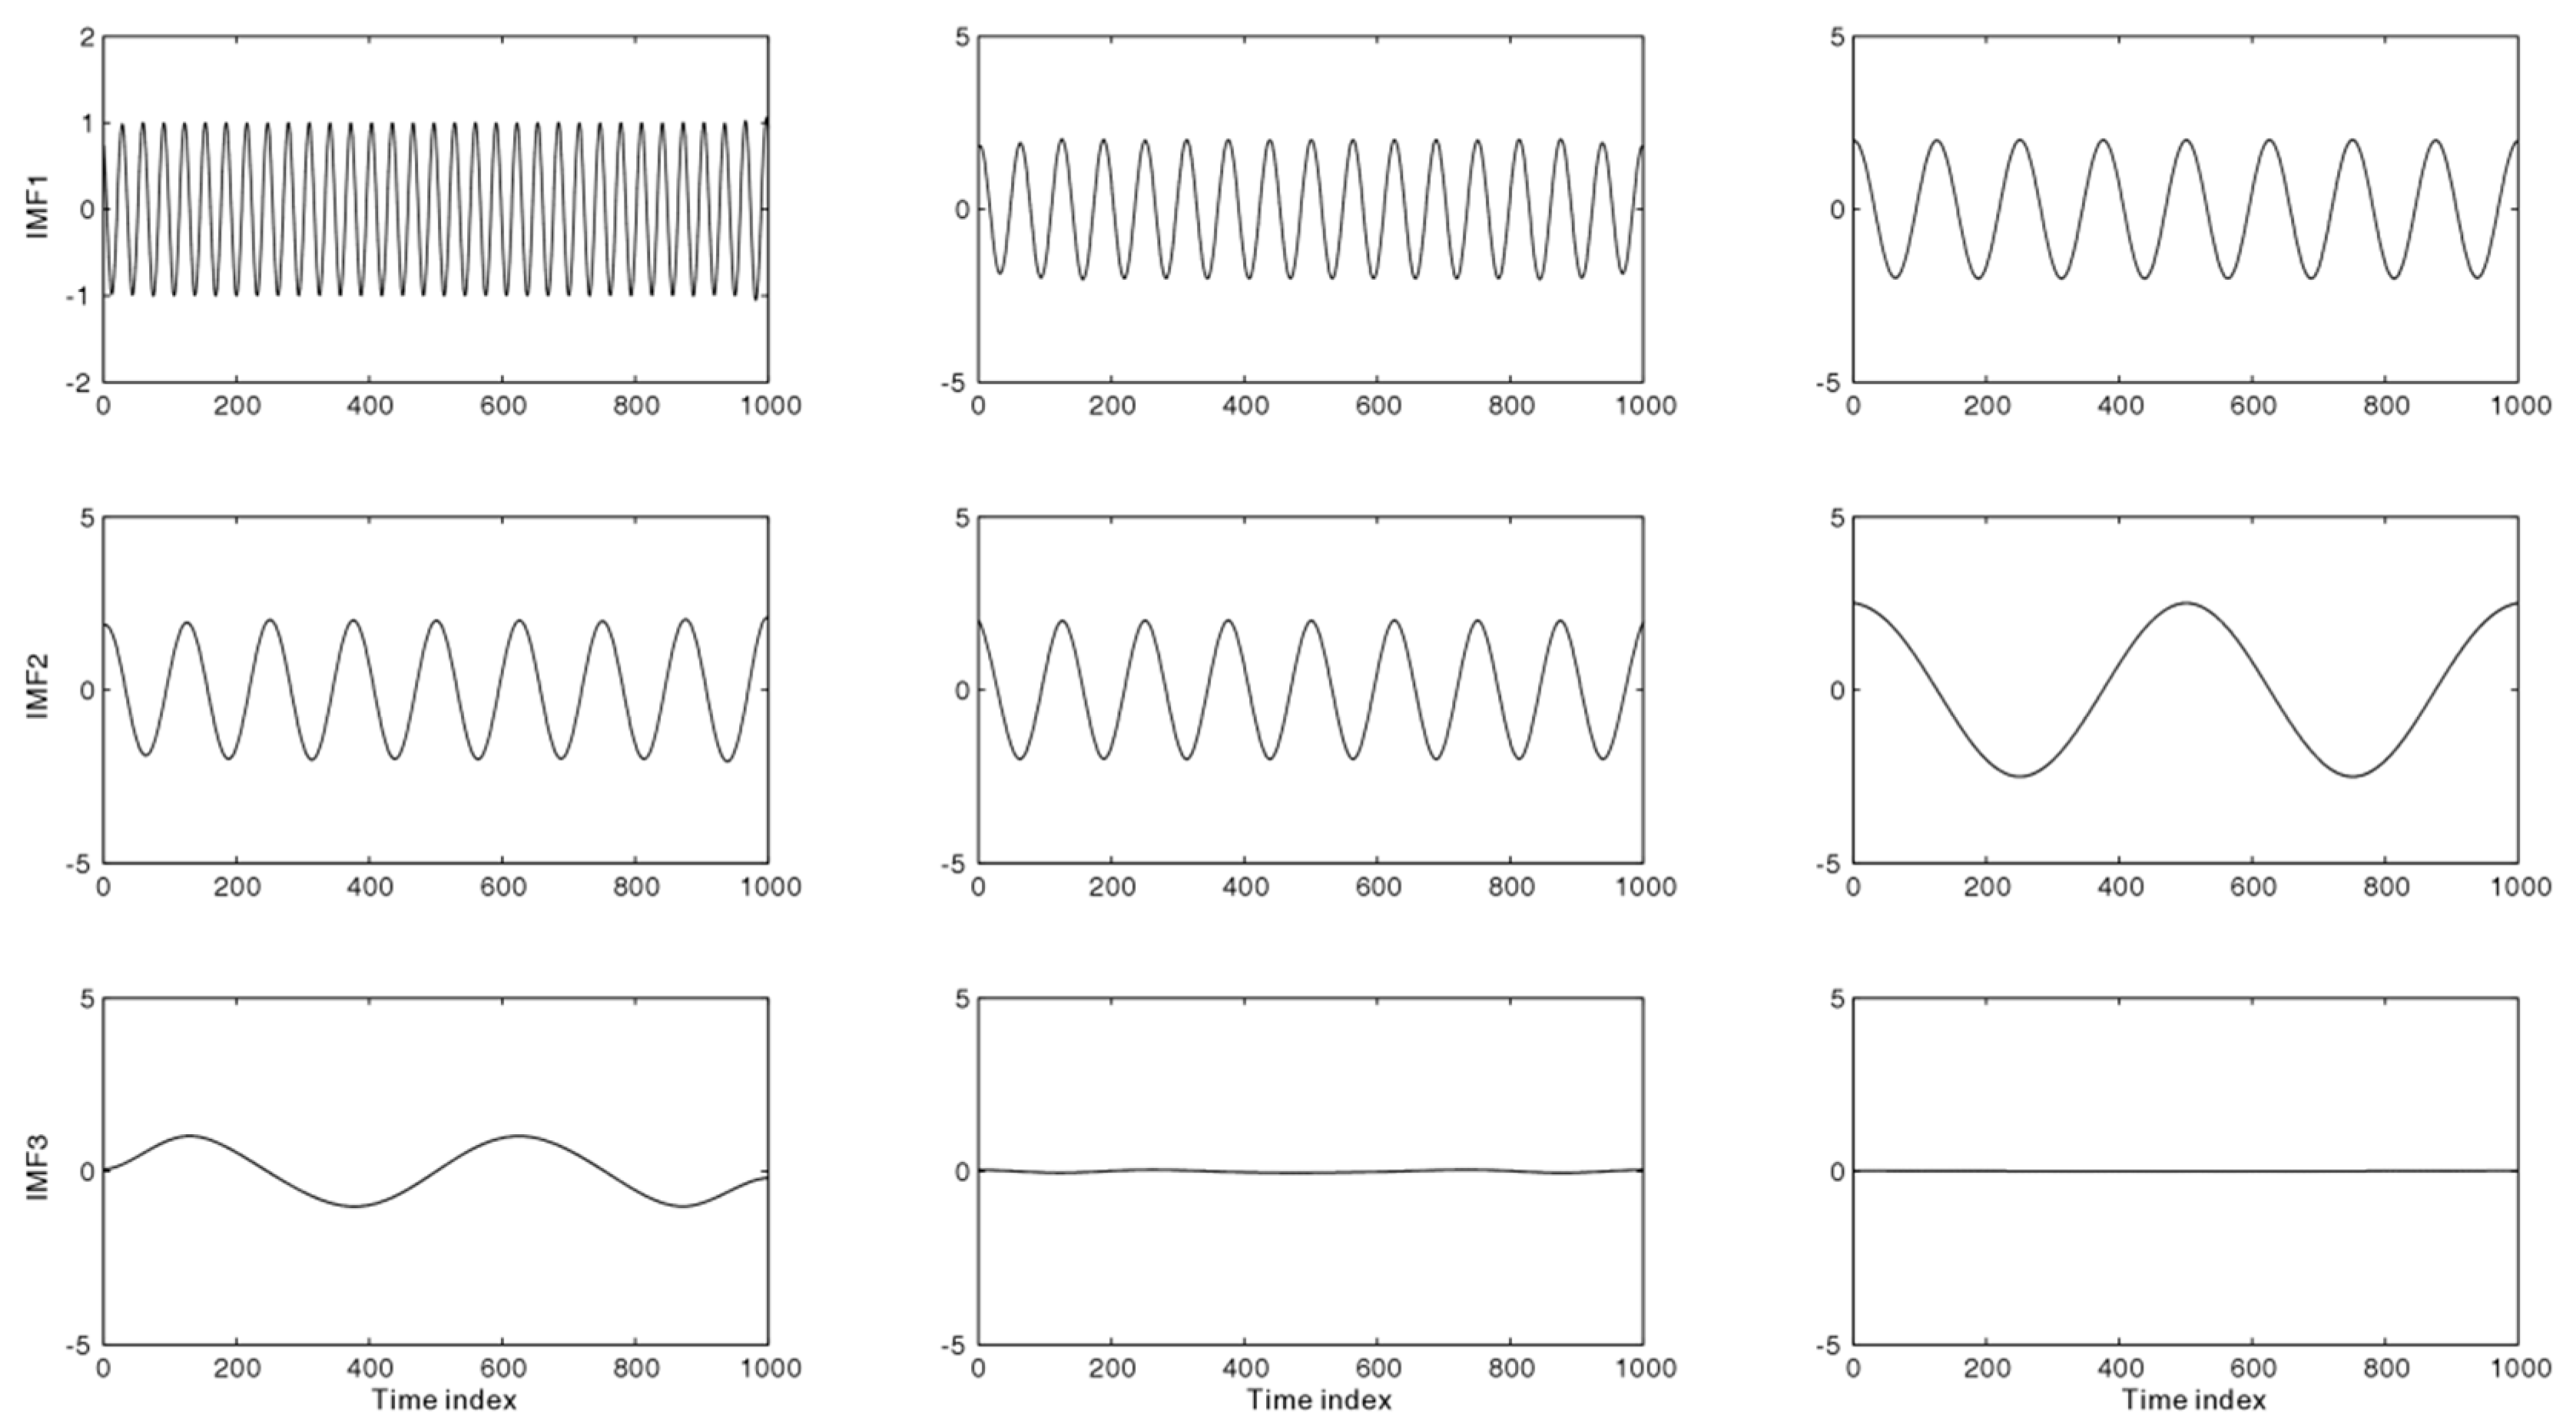
Figure 2 shows that the different frequency scale modes exhibit the same IMF.
3. NA-MEMD Method
To further reduce the mode-mixing effect in an MEMD, a noise-assisted MEMD method, named NA-MEMD, was introduced by adding white noise. The method is different from the ensemble EMD method in that multiple realizations of white noise are added to the input signal before being decomposed via EMD [
13]. The NA-MEMD method adds extra multivariate channels, such as
l dimensional independent white noise to the original
n dimensional multivariate signal, and then processes such an
n + l dimensional composite signal via MEMD. The NA-MEMD algorithm is described as follows:
Create an l-dimensional independent Gaussian white noise series with the same length as that of the input signal;
Generate an n + l-dimensional signal by adding the noise series created in Step 1 to the n-dimensional input multivariate;
Process the resulting n + l-dimensional multivariate signal via the MEMD algorithm, to obtain the multivariate IMFs;
Discard the l-dimensional IMFs corresponding to the noise and obtain a set of n-dimensional IMFs corresponding to the original signal from the resulting (n + l)-variate IMFs.
For adding Gaussian white noise, the NA-MEMD method has better binary filtering characteristics than the MEMD method. Both the mode mixing and misalignment problems were significantly reduced.
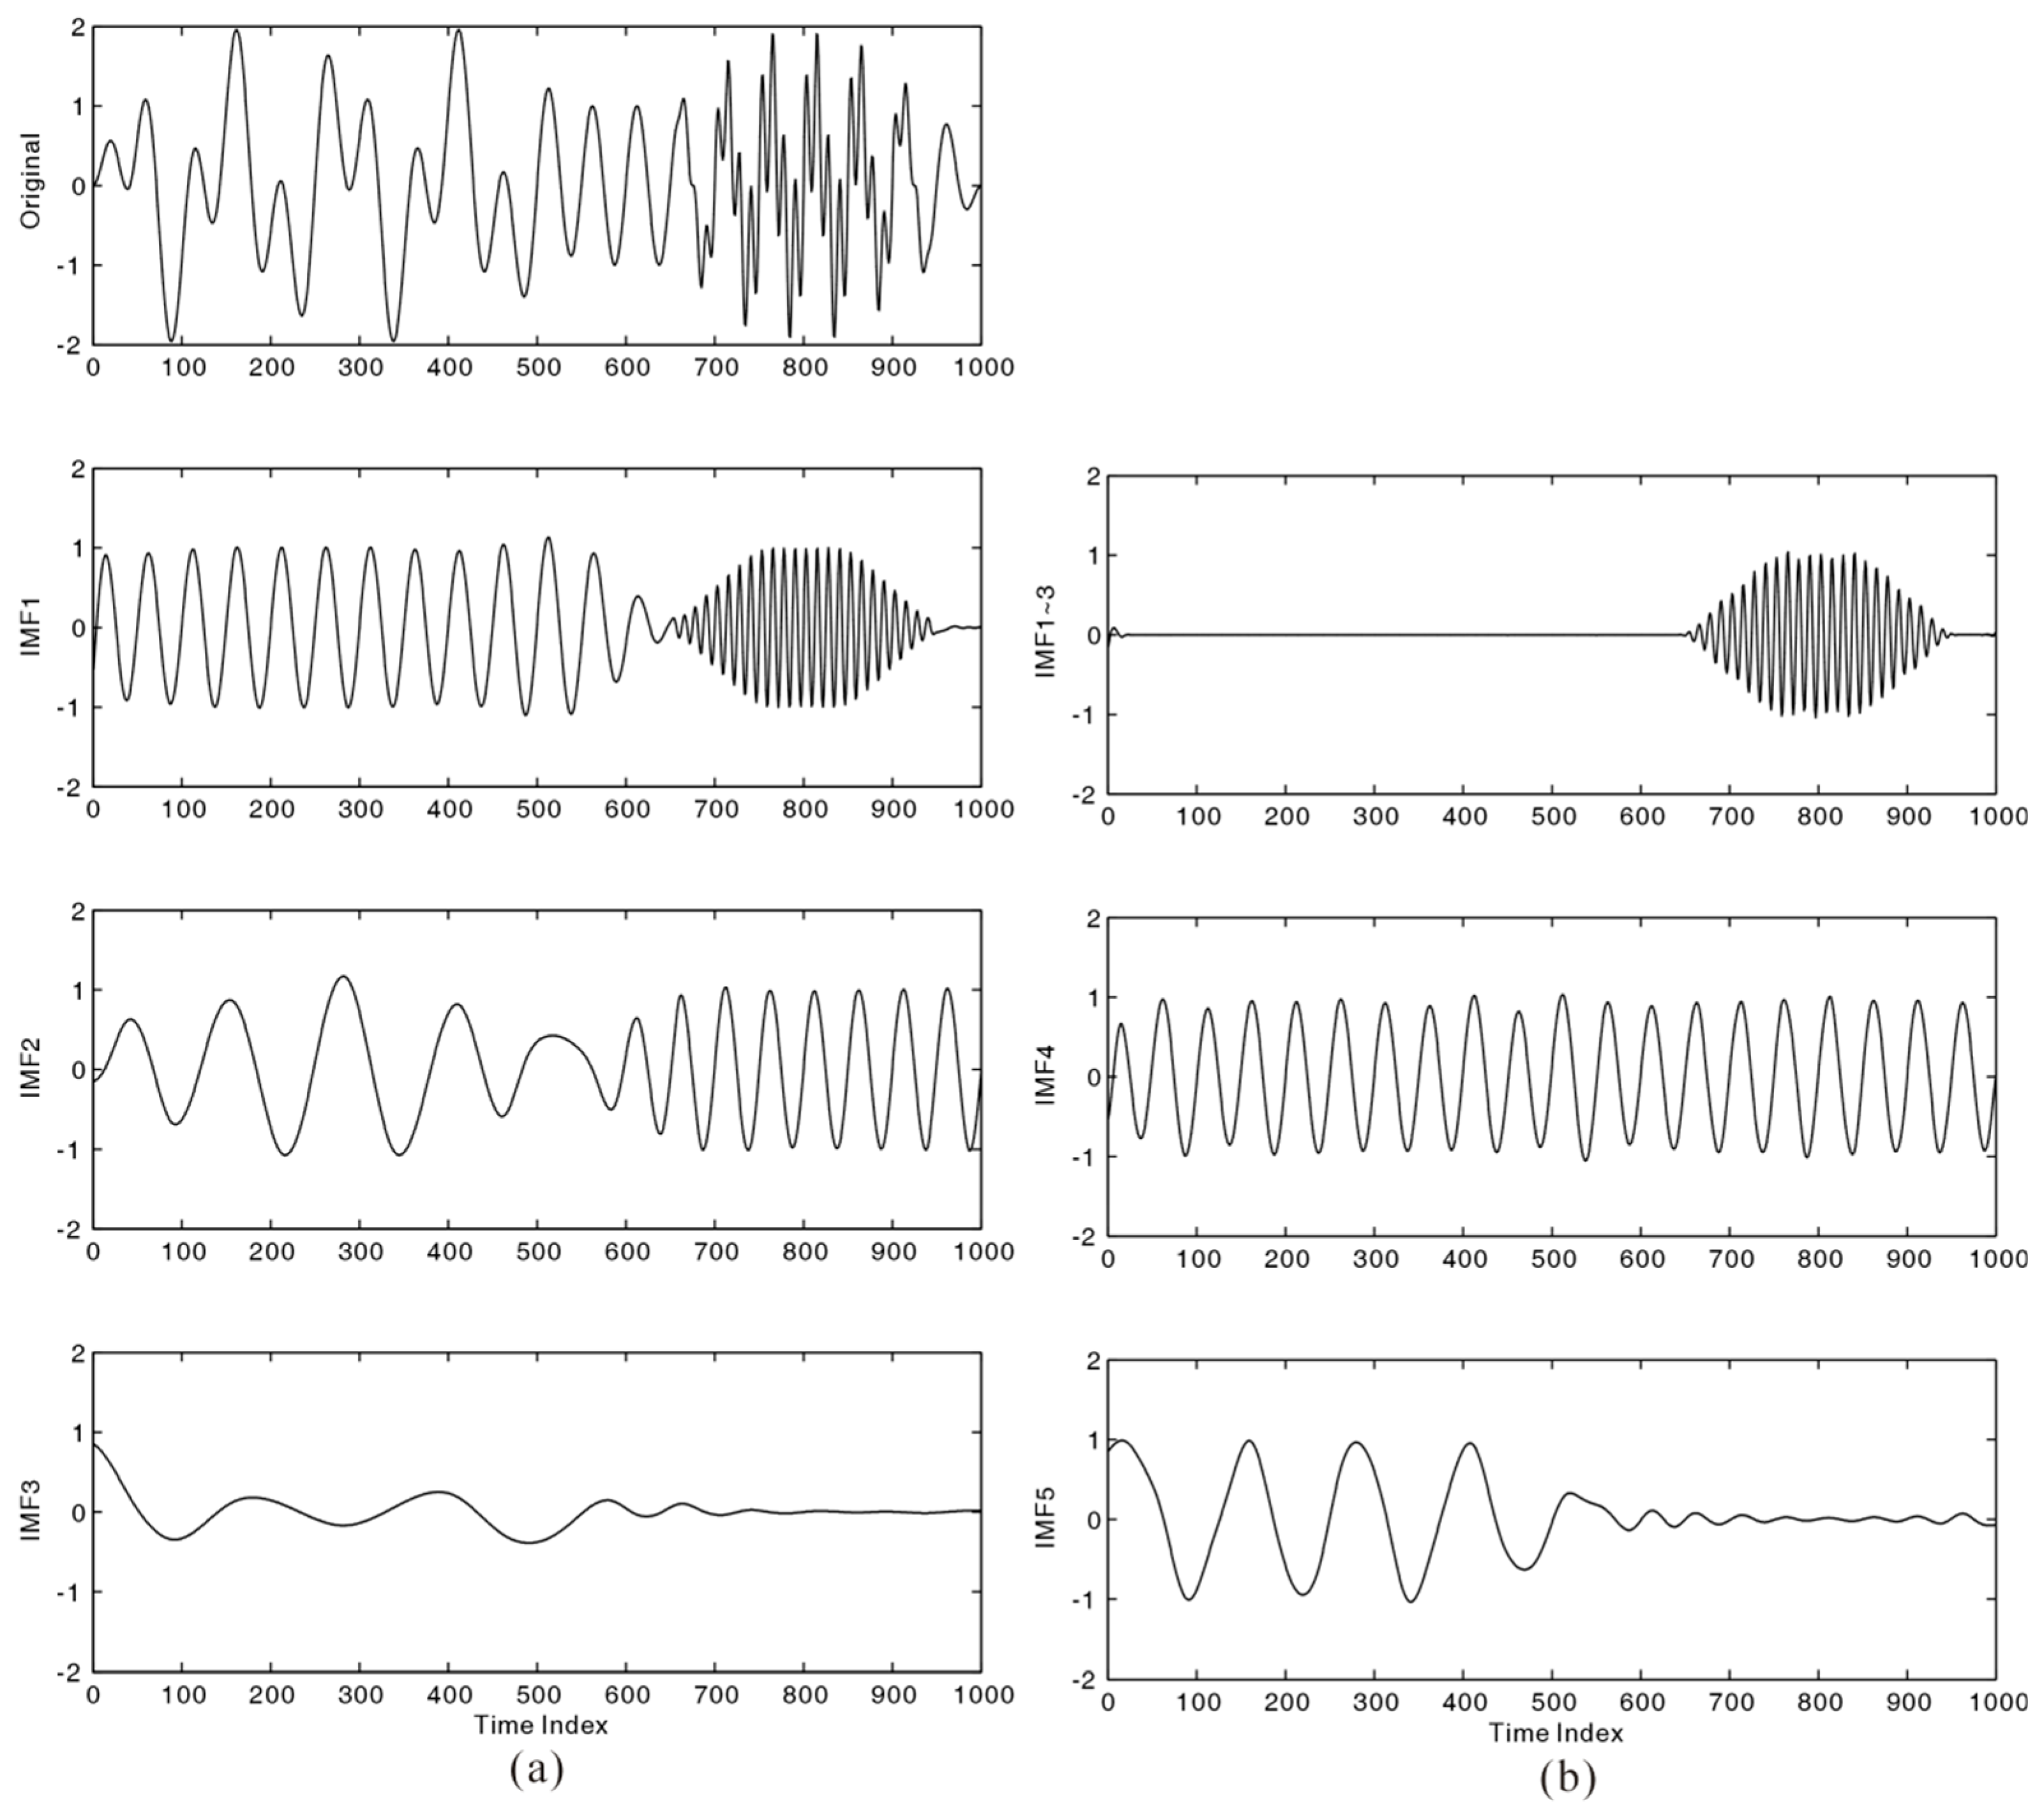
Figure 3 illustrates the benefits of noise-assisted MEMD algorithms for reducing mode mixing via a bivariate signal example. The Z component signal contains a 20 Hz sinusoid and two intermittent signals with frequencies 8 Hz and 80 Hz. The X component was generated by rotating the Z component 90 degrees on the vertical direction. For convenience, we plotted only the IMFs of the Z component. We can see that mode mixing in a single channel is obvious for the standard EMD in
Figure 3a. A single-frequency scale mode exists in both IMFs. In addition, different frequency modes can also be seen in the same IMF. With two extra channels of white noise, the decomposition of the same bivariate signal by the proposed NA-MEMD method is shown in
Figure 3b. This demonstrates that mode mixing is significantly reduced, and each IMF only contains a single frequency mode.
4. Ground Roll Attenuation via NA-MEMD
This three-component geophones record two horizontal components and one vertical component of the incident seismic data, which are an oscillation stack of different frequency sub-bands. The ground roll, which is located in the low-frequency range, is different from the reflection wave. The alignment of frequency sub-bands can be obtained from different channels of the multivariate signal by inserting them into noisy channels via the NA-MEMD method. As a result, the IMFs were aligned according to their frequency content. Then, we can utilize the low oscillation property to separate the ground roll from the reflection wave.
Attenuating the ground roll based on the NA-MEMD method includes two steps: The first step is to use NA-MEMD to decompose multicomponent seismic data into a set of IMFs. The IMFs of ground roll are present in high-index IMFs, and their amplitude spectra are computed. A complete estimate of IMFs is reduced to identify these high-index IMFs in that the ground roll is dominant. In the second step, we remove these high-index IMFs and reconstruct the remaining low-index IMFs to obtain the seismic data without ground roll. In this workflow, the key parameter is the number of IMFs of the high-index ground roll. The number choice is a trade-off between less damage to the reflection waves and more ground roll suppression.
4.1. Synthetic Data
In this section, we first test the proposed method on synthetic seismic data. The dataset contains a sweep signal with a 2–20 Hz frequency band to represent the ground roll and seismic wave simulated by finite difference for a three-layer model as shown in
Table 1 [
3,
18]. According to the polarization property of ground roll, the phase of the horizontal component has a 90 degree lag compared to the vertical component. A 50 Hz Ricker wavelet was used for the body wave with a time sample interval of 1ms. The number of samples for each trace was 1001, and the number of traces for one shoot was 200. The model parameters are presented in
Table 1.
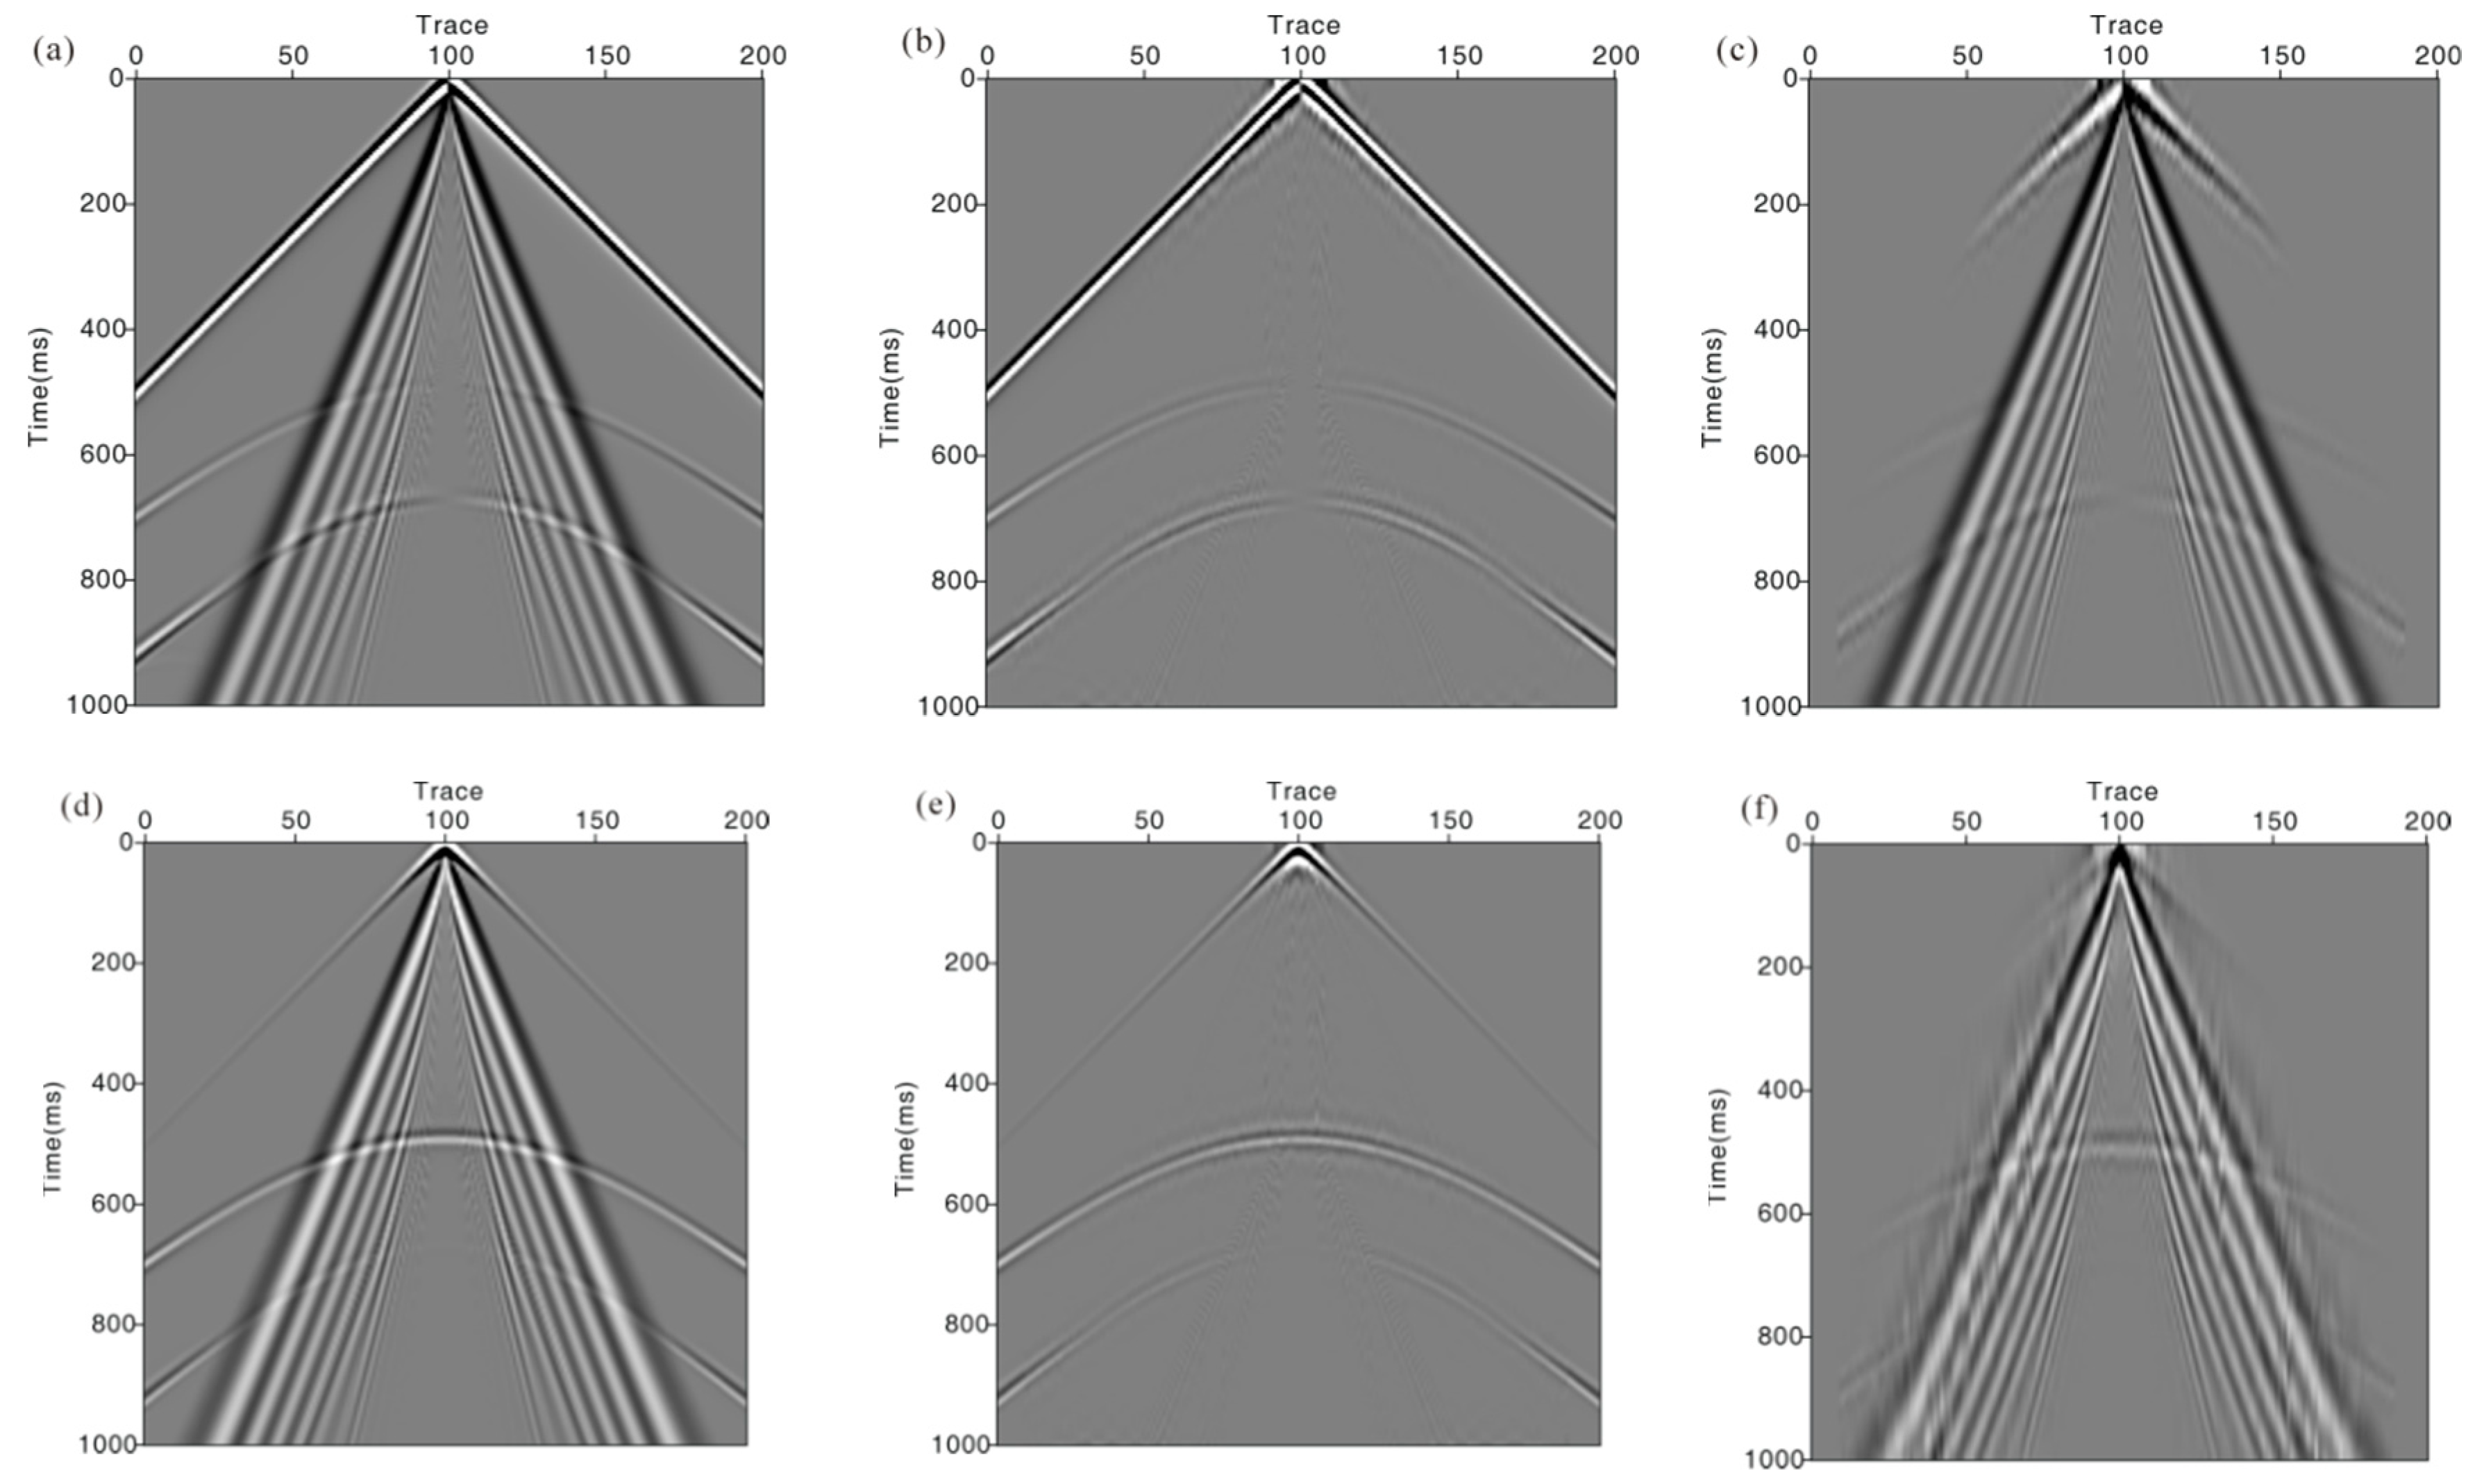
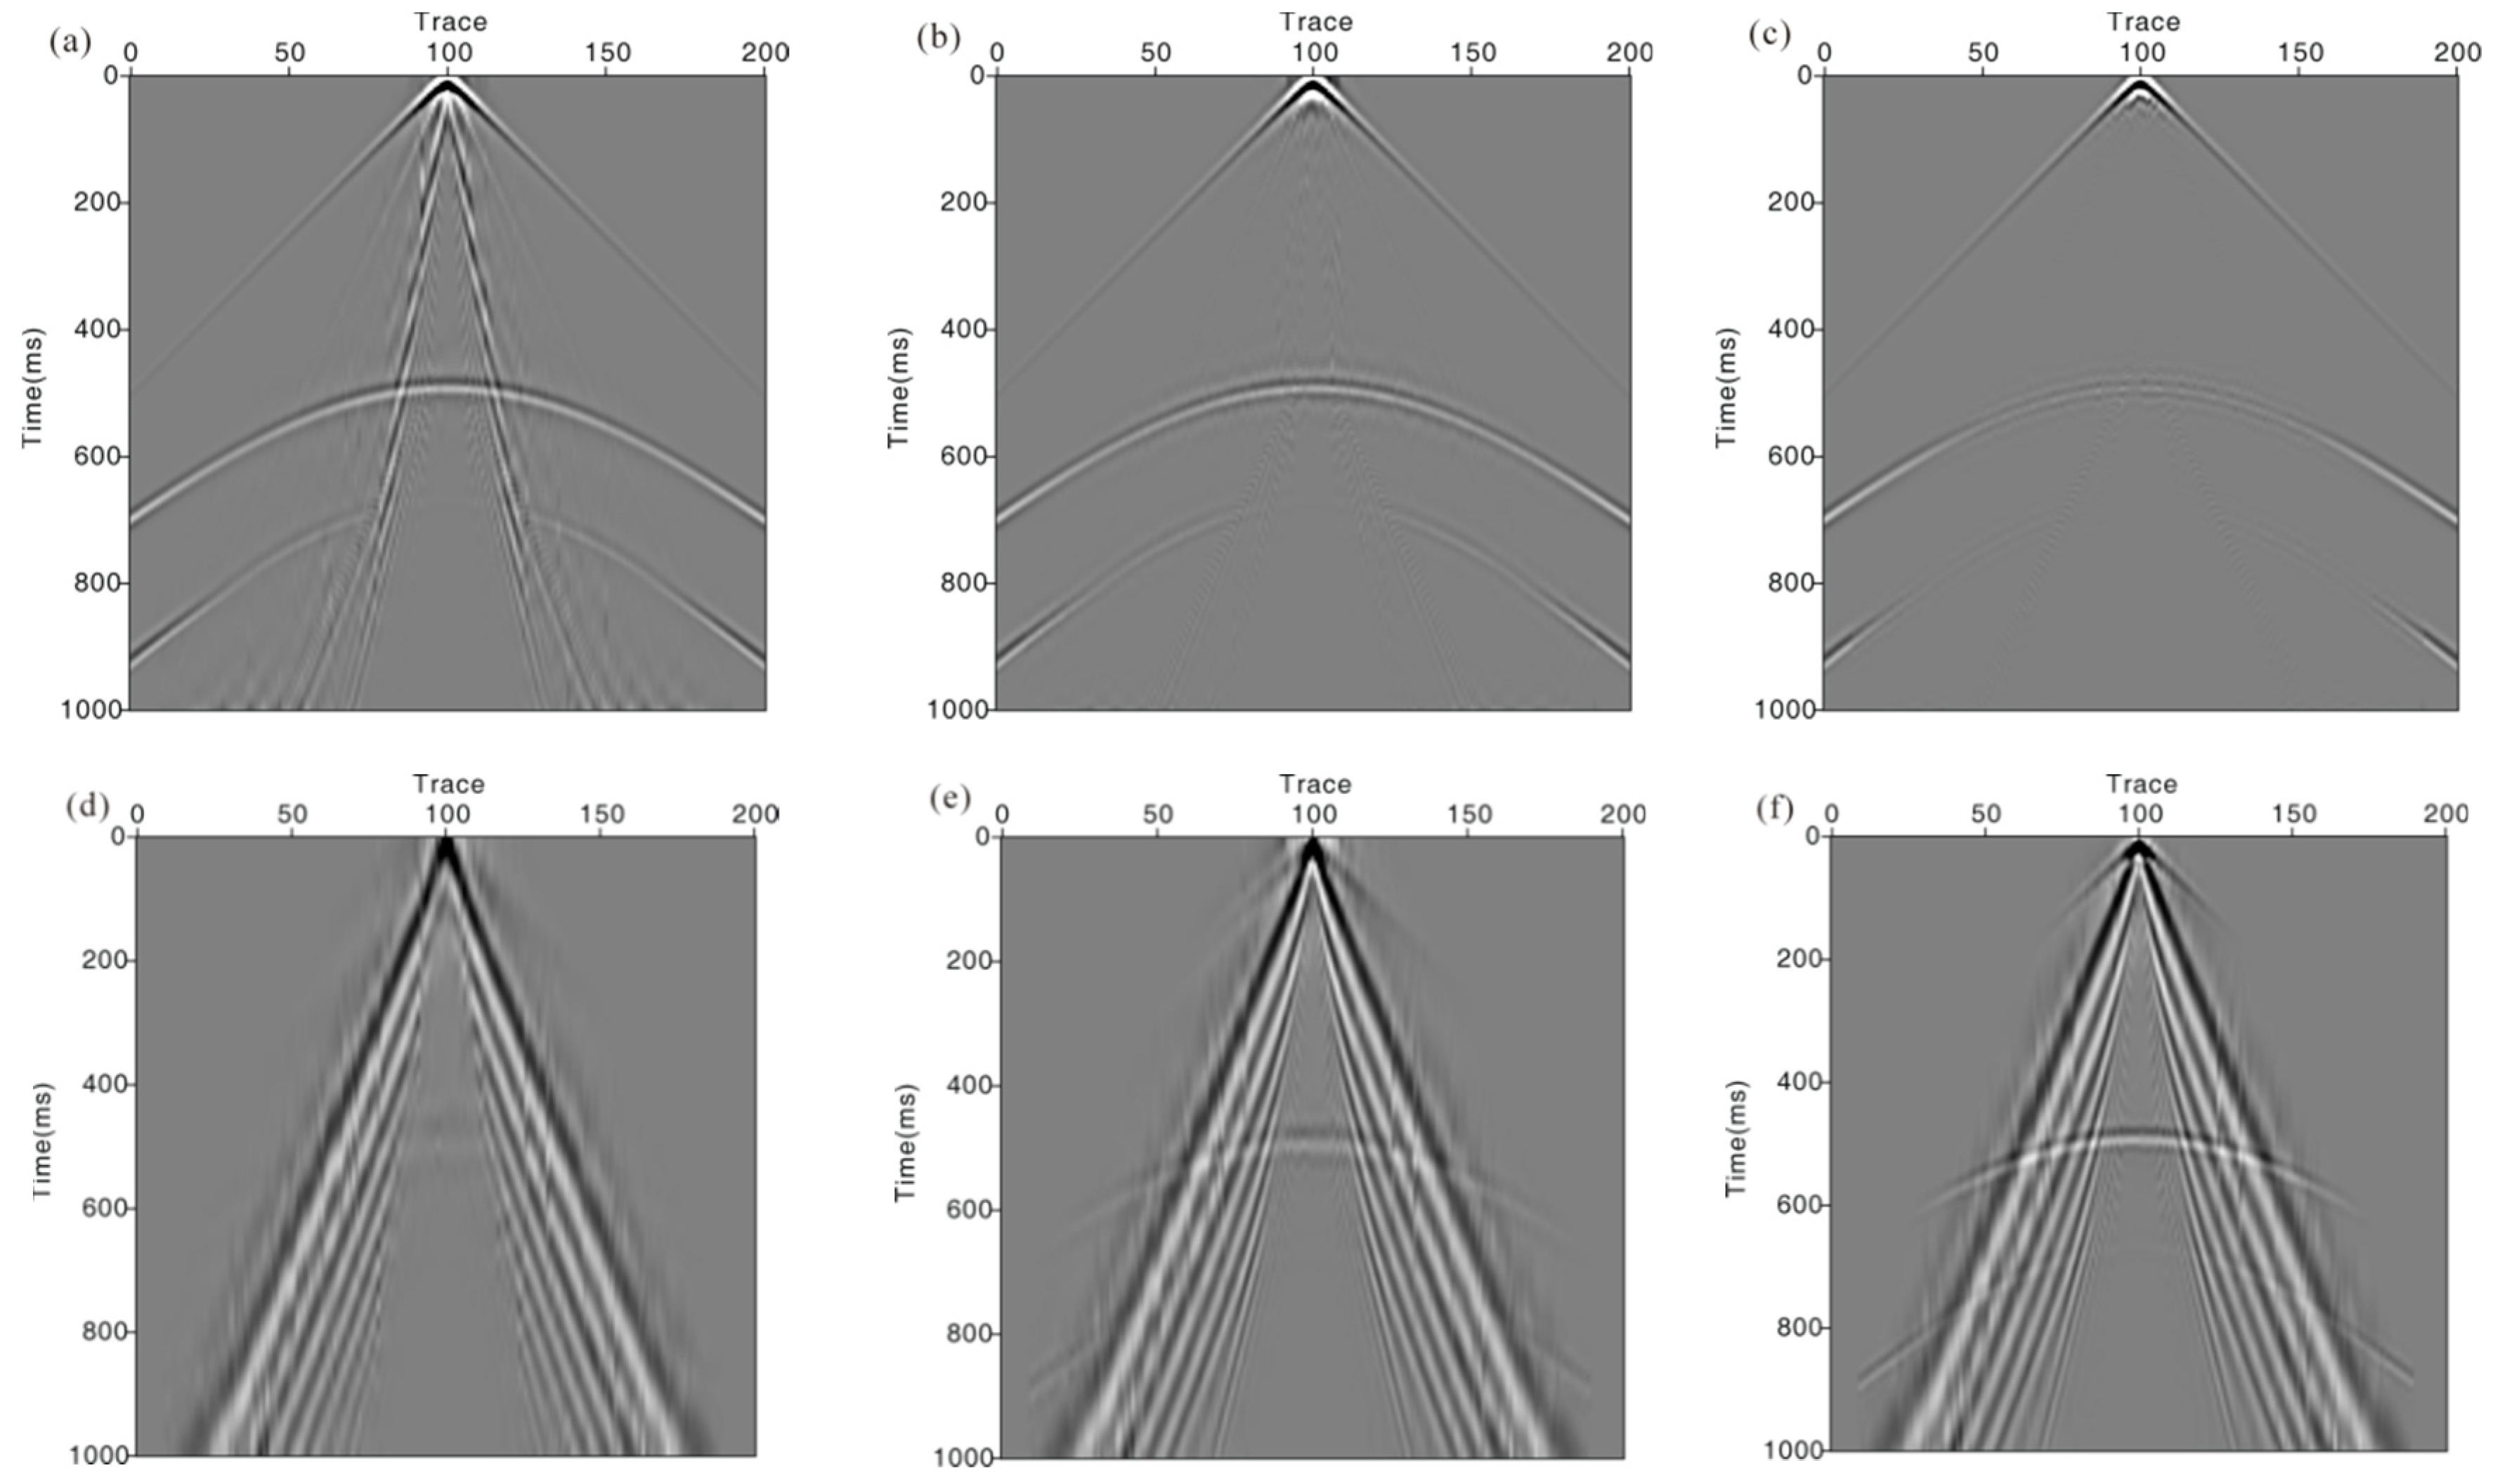
Figure 4 shows the ground roll attenuation results of the synthetic data obtained using the NA-MEMD method.
Figure 4a,d represents the horizontal and vertical components of the synthetic data, respectively. Two noise-assisted signals are embedded into the synthetic data to help overcome mode mixing when using the MEMD method. We decomposed the model data into eight IMFs. According to the NA-MEMD principle, the first two IMFs are related to noises; therefore, they are discarded. Owing to the low-frequency characteristic of ground roll, the seventh and eighth IMFs dominated by the ground roll are directly subtracted from the decomposition. We reconstructed the low-index IMFs and obtained the final data with ground roll attenuation.
Figure 4b,e displays the data after removing the ground roll of the horizontal component in
Figure 4a and the vertical component in
Figure 4d. It can be seen that the ground roll is well suppressed. From the ground roll separated in
Figure 4c,f, we can see that the residual energy of the reflection wave is weak. During the removal of ground roll using the NA-MEMD method, the number of removed IMFs is a key parameter for the suppression effect.
Figure 5 shows the sensitivity for the seismic wave separation with different numbers of subtracted IMFs. We find that the more high-index IMFs are removed, the better ground roll suppression is achieved. Meanwhile, more damage occurs to the reflected wave. The parameter choice of removed IMFs is a trade-off between less damage to the reflection energy and more suppression for the ground roll.
4.2. Field Data
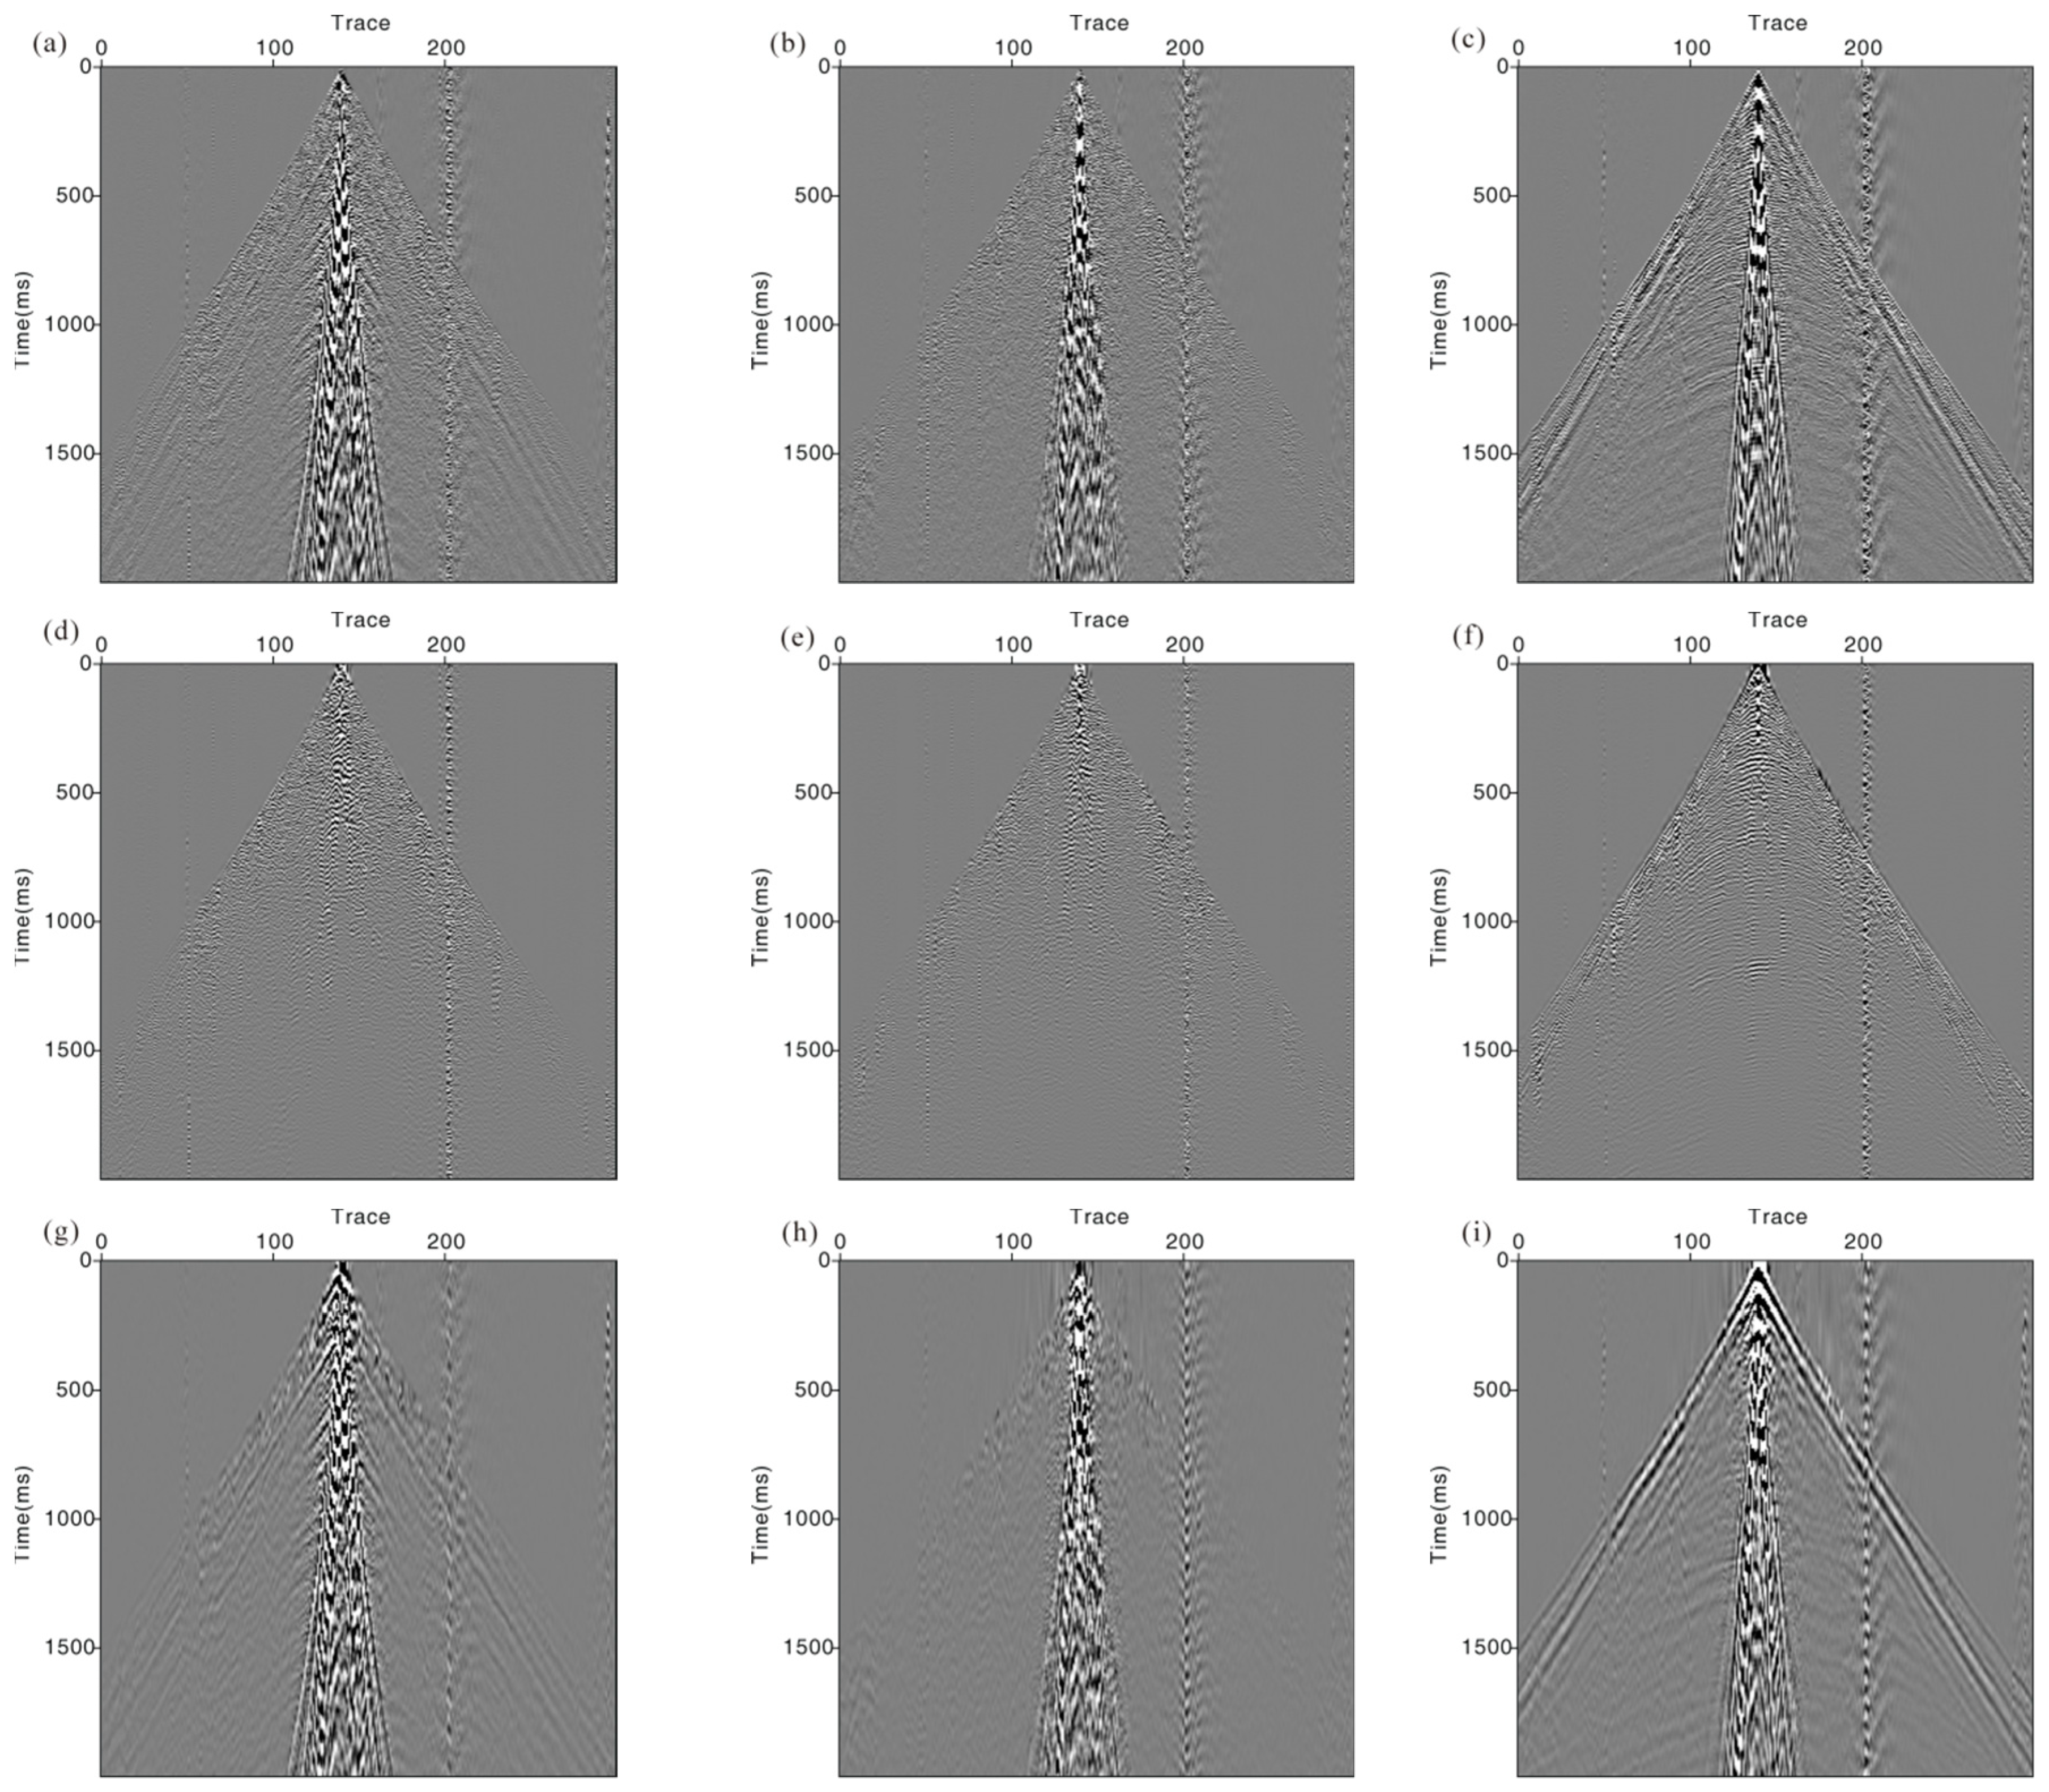
To further examine the ground roll attenuation performance of the NA-MEMD method, we processed multicomponent seismic data from land seismic acquisition. The data included two horizontal components and one vertical component.
Figure 6a–c shows the raw seismic data that are recorded X, Y, and Z components from left to right, respectively. It can be seen that seismic data in the near offset are contaminated by strong ground roll. We added three noise-assisted signals and decomposed data into eight IMFs. The ground roll with low velocity exists from the 112th to the 170th trace. Linear events with low frequency also ruin reflection waves. For each trace, we removed different numbers of IMFs. For the traces with ground rolls, we removed the first three highest index IMFs. For the rest, we removed only the first two highest index IMFs.
Figure 6d–f displays the ground roll attenuation results via the NA-MEMD method for the raw three-component data, respectively.
Figure 6g–i shows the ground roll and linear events separated with a low-frequency scale. From
Figure 6d–f, we can see that the ground roll is successfully suppressed from the original data in
Figure 6a–c.
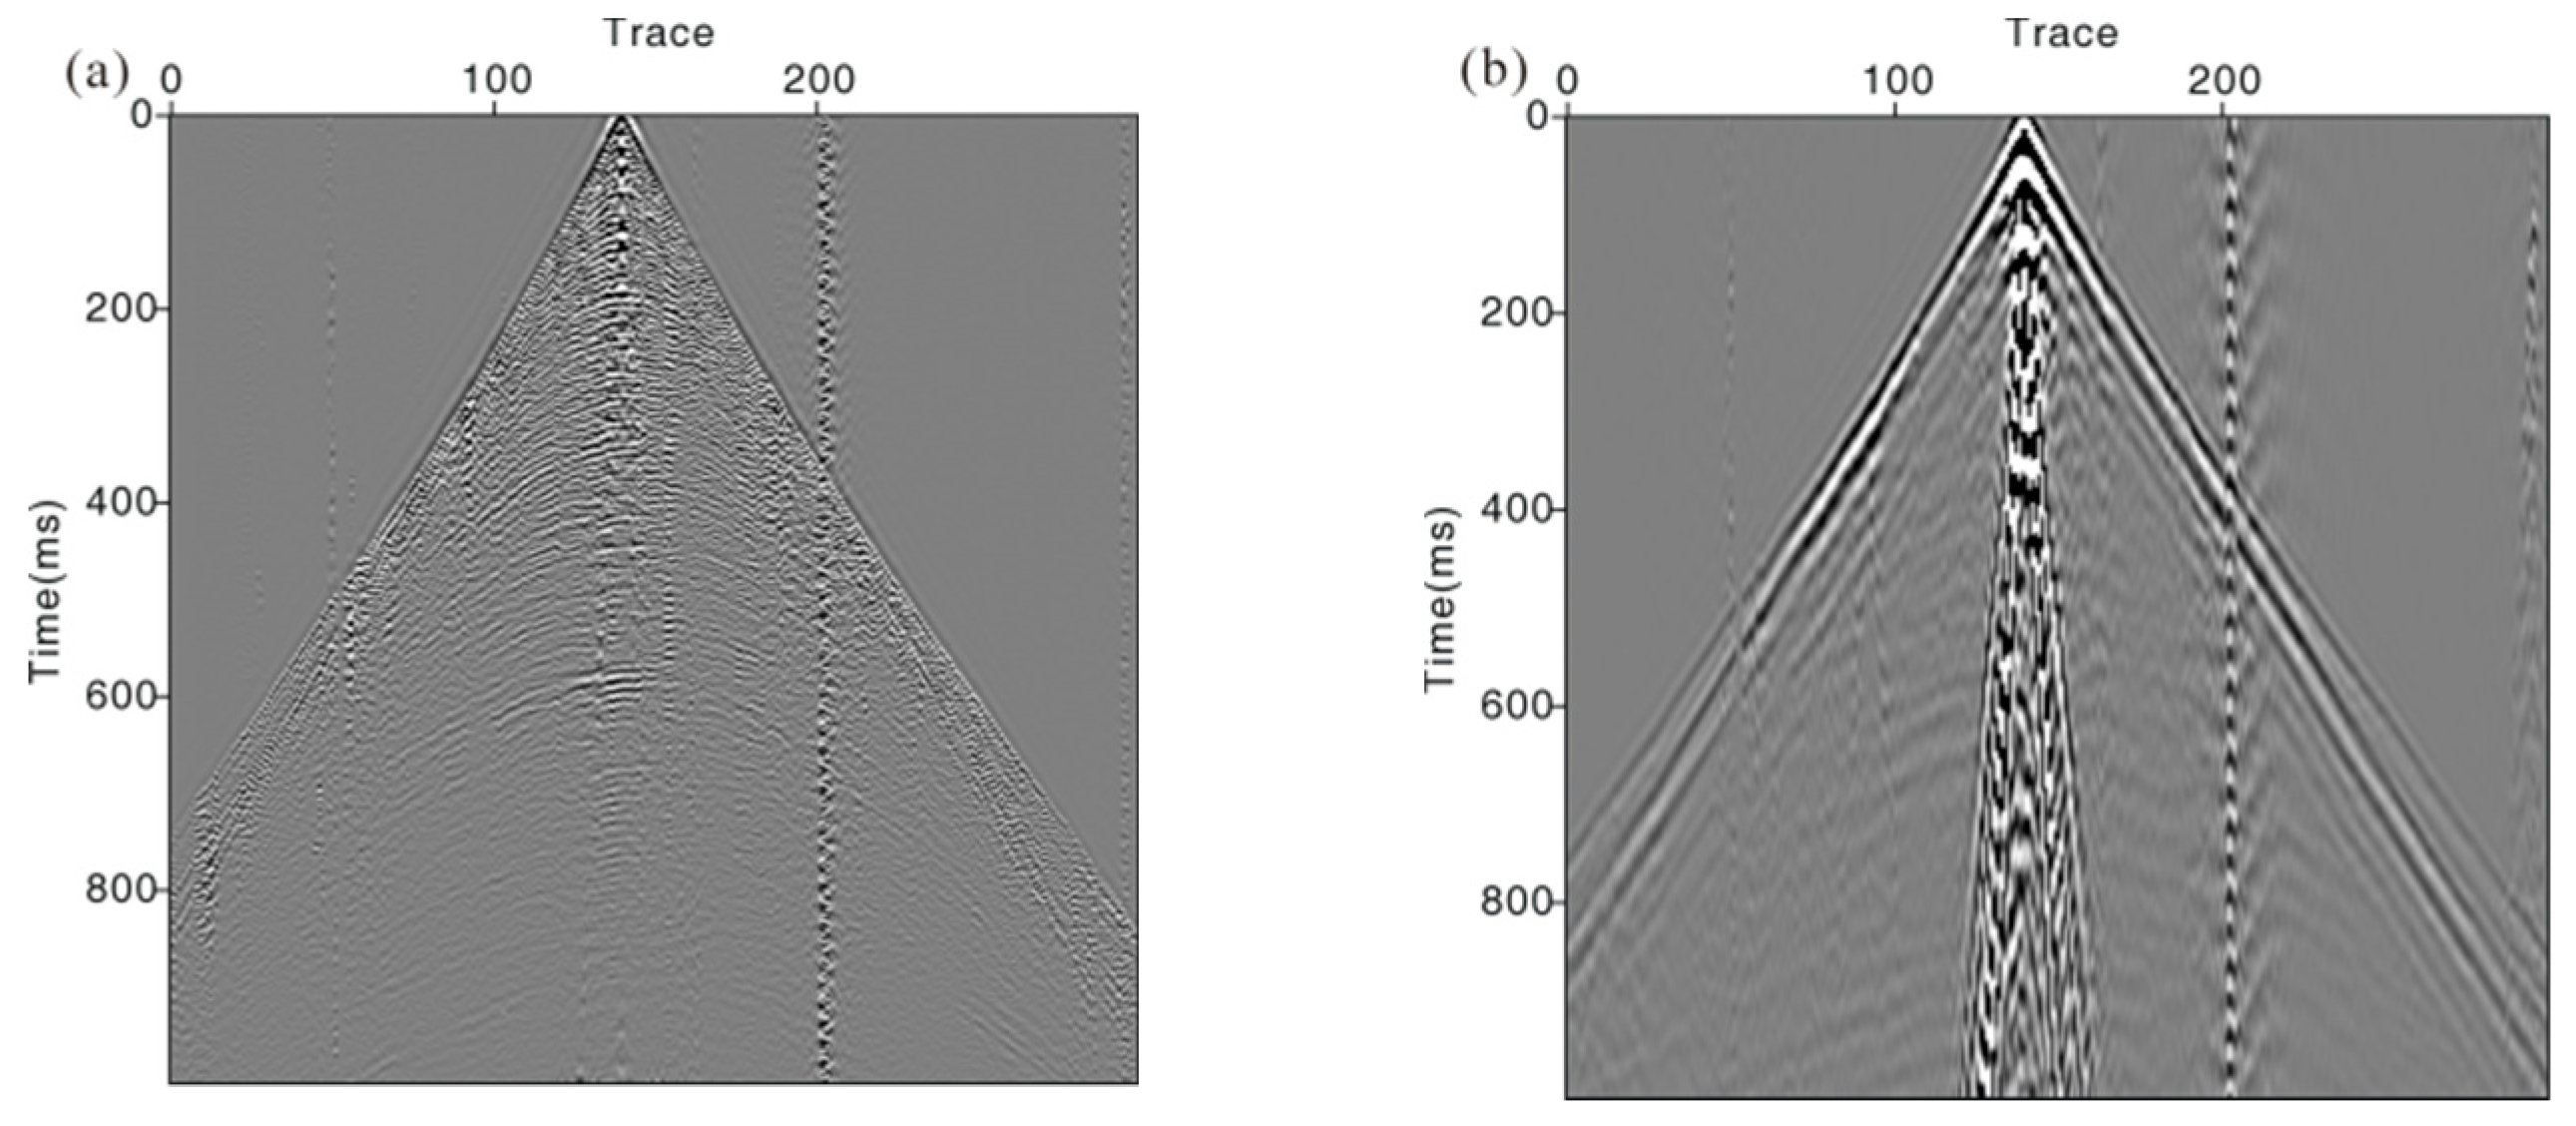
To further analyze the ground roll attenuation performance of the NA-MEMD method on field data, we compared it with the F-K filter method.
Figure 7a,b displays the attenuation results and differences using F-K attenuation method for the vertical component, respectively. In
Figure 6f,i, we can see that the ground roll is well attenuated by the NA-MEMD method. However, the F-K method suppresses the ground roll by cutting operation in the frequency-wavenumber domain, resulting in deletion of the low-frequency content of the reflection wave. Therefore, some weak reflection event energy remains in the difference section, as shown in
Figure 7b.
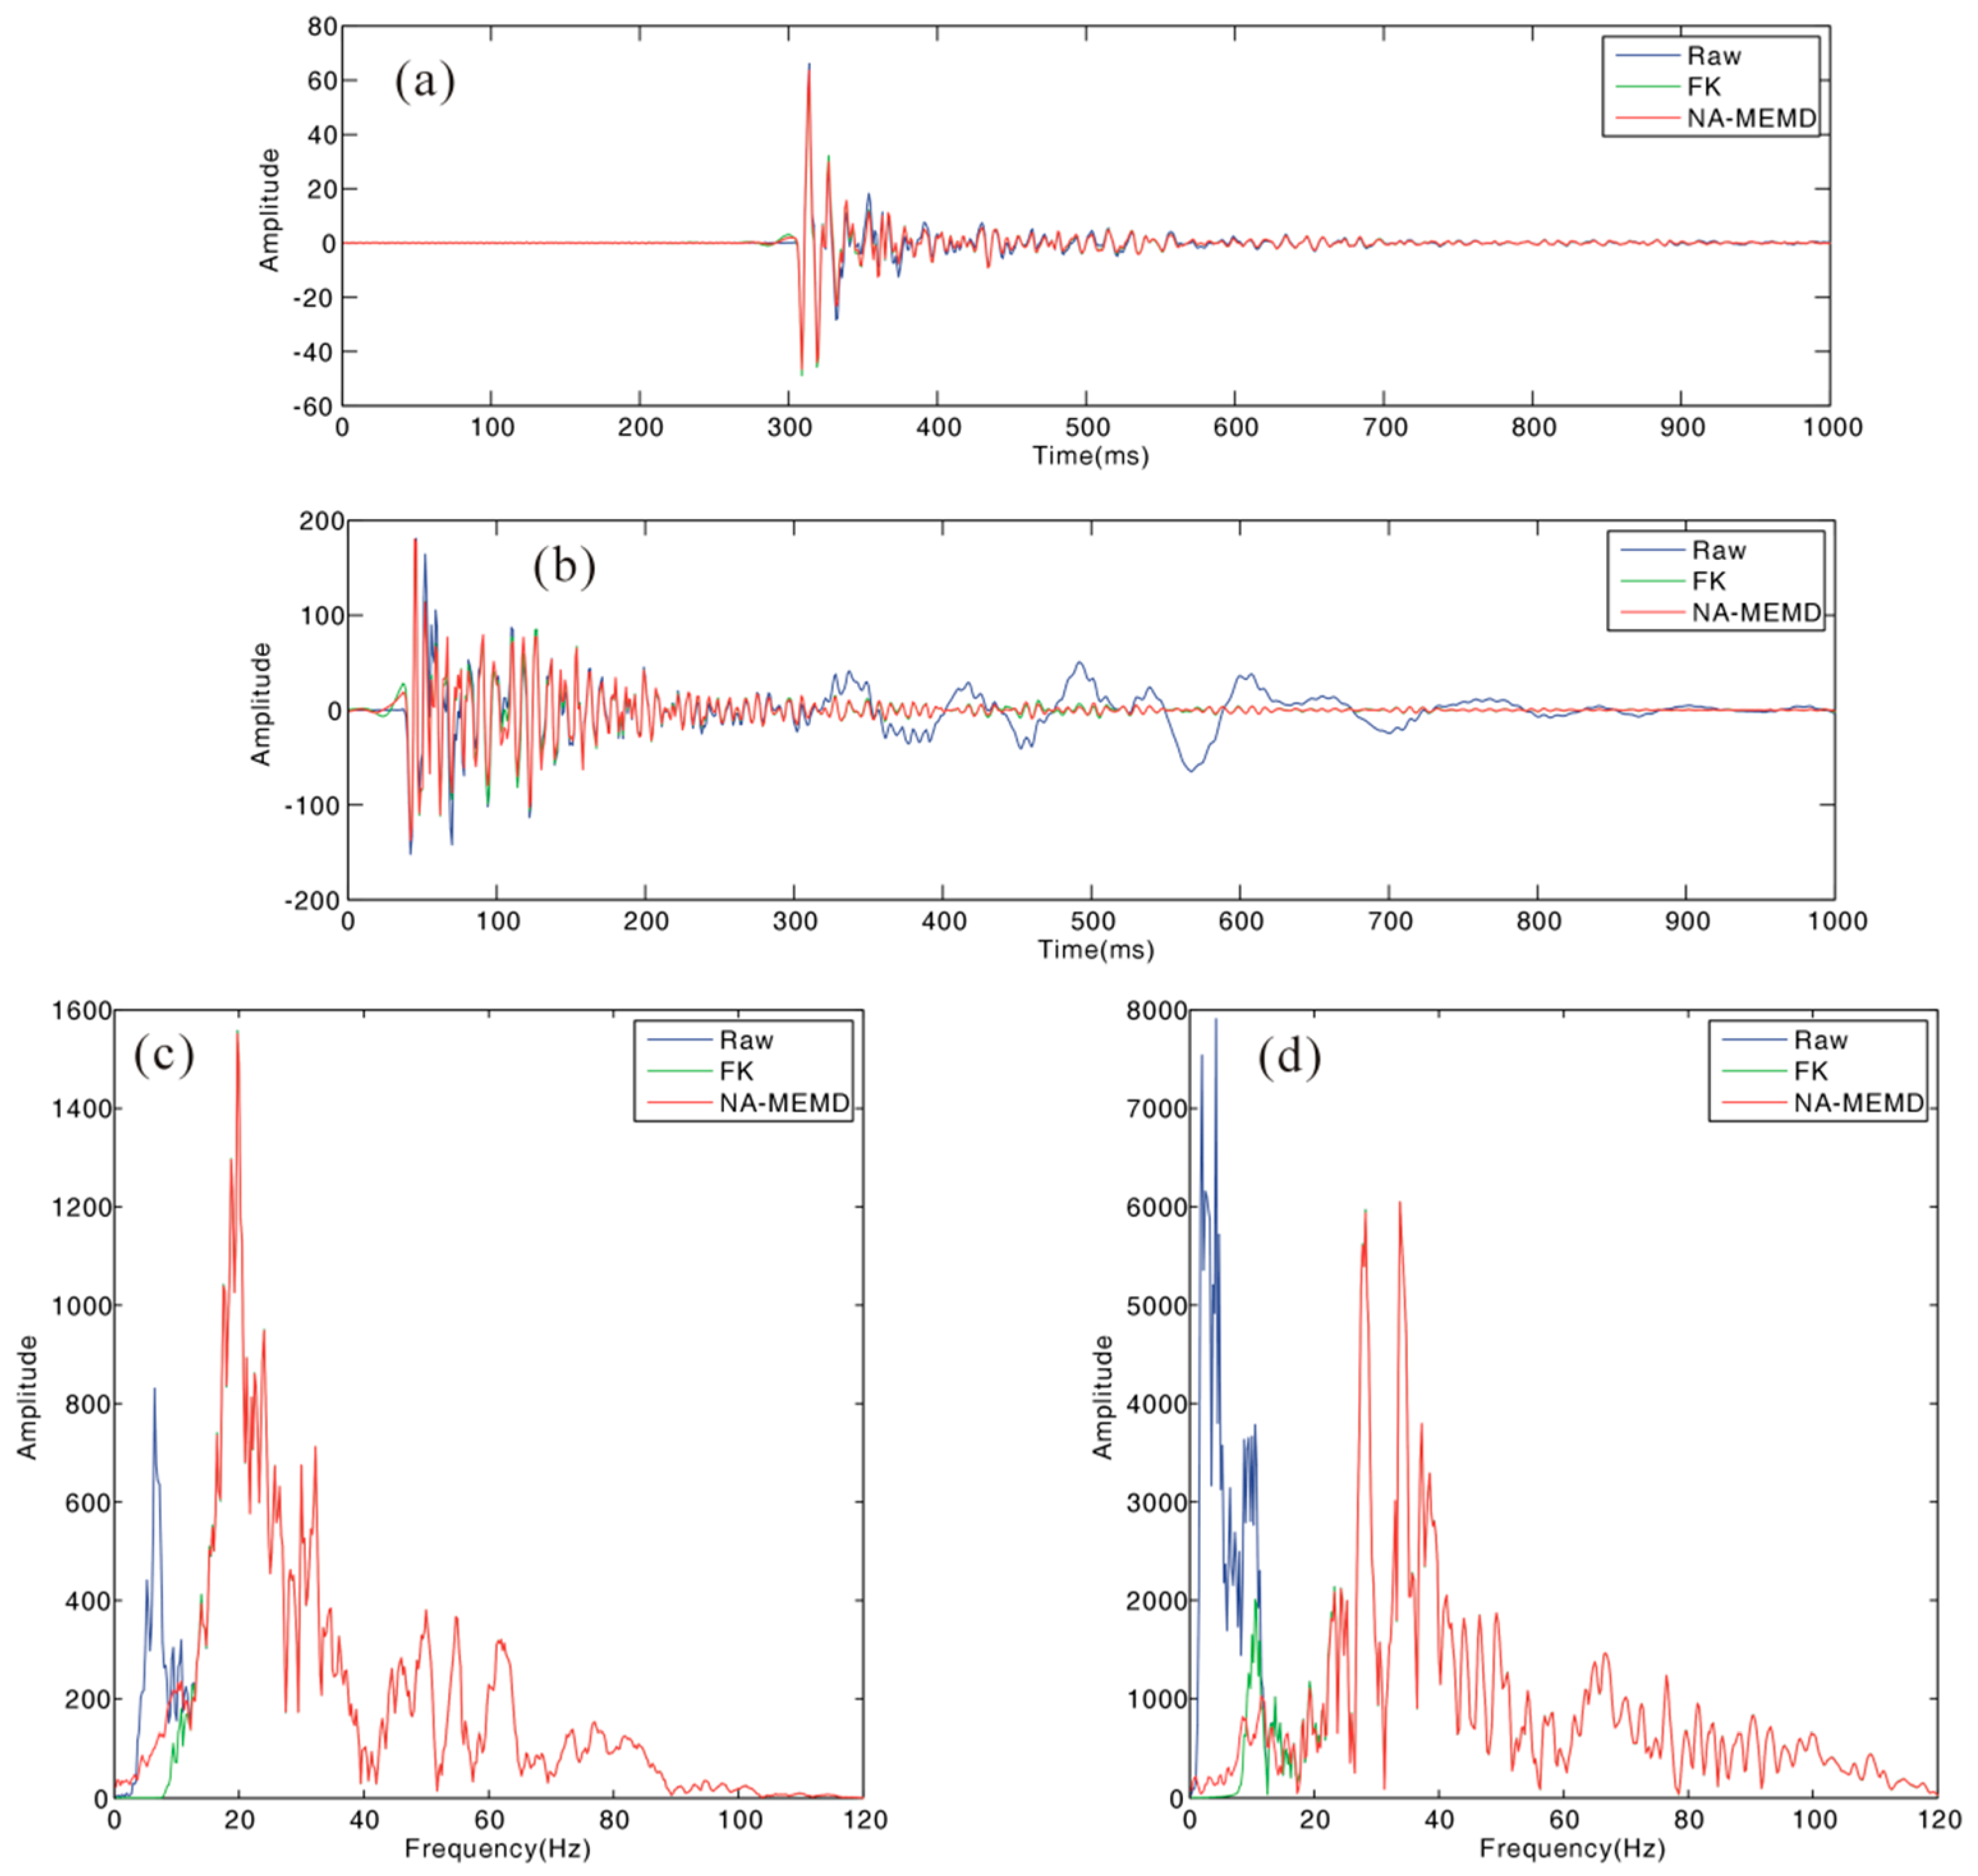
Figure 8a,d displays the waveform and amplitude spectra from the 90th and 135th traces, respectively. Although both methods successfully suppress the ground roll and linear interference, the NA-MEMD method preserves the reflection wave better in the low-frequency range (<10 Hz), which is important for later high-resolution imaging.
5. Conclusions
We applied the NA-MEMD method to attenuate ground roll for multicomponent seismic data. The tests of the simulated multicomponent signal show that the NA-MEMD aligns similar modes present across multiple components and reduces the effect of mode mixing by introducing extra channels of multivariate noise. The performance of the NA-MEMD was analyzed for ground roll attenuation of multicomponent seismic data. We demonstrate that the NA-MEMD method can suppress ground roll and interference if low-frequency waves are present in different components of seismic data in the time domain. Compared to the F-K method, the NA-MEMD method can preserve the reflection wave better in low-frequency range. Synthetic and field seismic data examples show the effectiveness of the proposed NA-MEMD method for ground roll attenuation.
Author Contributions
Conceptualization, L.X. and Z.Z.; methodology, Z.Z.; software, L.X.; validation, L.X., Z.Z. and J.G.; formal analysis, L.X. and Z.Z.; investigation, Z.Z. and J.G.; writing—original draft preparation, L.X.; writing—review and editing, Z.Z. and J.G.; visualization, L.X.; supervision, Z.Z. and J.G.; project administration, Z.Z.; funding acquisition, Z.Z. and J.G. All authors have read and agreed to the published version of the manuscript.
Funding
This research was funded by the National Natural Science Foundation of China (grant numbers 41874165 and 41530321), and partly funded by the National Key R&D Program of China (grant number 2019YFC0312004).
Institutional Review Board Statement
Not applicable.
Informed Consent Statement
Not applicable.
Data Availability Statement
Not applicable.
Conflicts of Interest
The authors declare no conflict of interest.
References
- Farfour, M.; Yoon, W.J. A review on multicomponent seismology: A potential seismic application for reservoir characterization. J. Adv. Res. 2016, 7, 515–524. [Google Scholar] [CrossRef] [PubMed] [Green Version]
- Halliday, D.F.; Curtis, A.; Vermeer, P.; Strobbia, C.; Glushchenko, A.; van Manen, D.J.; Robertsson, J.O.A. Interferometric ground-roll removal: Attenuation of scattered surface waves in single-sensor data. Geophysics 2010, 75, Sa15–Sa25. [Google Scholar] [CrossRef]
- Gazdova, R.; Vilhelm, J. DISECA—A Matlab code for dispersive waveform calculations. Comput. Geotech. 2011, 38, 526–531. [Google Scholar] [CrossRef]
- Wang, Y.H. Antialiasing conditions in the delay-time Radon transform. Geophys. Prospect. 2002, 50, 665–672. [Google Scholar] [CrossRef]
- Liu, Z.; Chen, Y.K.; Ma, J.W. Ground roll attenuation by synchrosqueezed curvelet transform. J. Appl. Geophys. 2018, 151, 246–262. [Google Scholar] [CrossRef]
- Askari, R.; Siahkoohi, H.R. Ground roll attenuation using the S and x-f-k transforms. Geophys. Prospect. 2008, 56, 105–114. [Google Scholar] [CrossRef]
- Naghizadeh, M.; Sacchi, M. Multicomponent f-x seismic random noise attenuation via vector autoregressive operators. Geophysics 2012, 77, V91–V99. [Google Scholar] [CrossRef]
- Pinnegar, C.R. Polarization analysis and polarization filtering of three-component signals with the time-frequency S transform. Geophys. J. Int. 2006, 165, 596–606. [Google Scholar] [CrossRef] [Green Version]
- Huang, N.E.; Shen, Z.; Long, S.R.; Wu, M.L.C.; Shih, H.H.; Zheng, Q.N.; Yen, N.C.; Tung, C.C.; Liu, H.H. The empirical mode decomposition and the Hilbert spectrum for nonlinear and non-stationary time series analysis. Proc. R. Soc. A Math. Phys. 1998, 454, 903–995. [Google Scholar] [CrossRef]
- Gomez, J.L.; Velis, D.R. A simple method inspired by empirical mode decomposition for denoising seismic data. Geophysics 2016, 81, V403–V413. [Google Scholar] [CrossRef] [Green Version]
- Bekara, M.; van der Baan, M. Random and coherent noise attenuation by empirical mode decomposition. Geophysics 2009, 74, V89–V98. [Google Scholar] [CrossRef]
- Chen, Y.K.; Ma, J.T. Random noise attenuation by f-x empirical-mode decomposition predictive filtering. Geophysics 2014, 79, V81–V91. [Google Scholar] [CrossRef]
- Chen, W.; Chen, Y.K.; Liu, W. Ground Roll Attenuation Using Improved Complete Ensemble Empirical Mode Decomposition. J. Seism. Explor. 2016, 25, 485–495. [Google Scholar]
- Looney, D.; Mandic, D.P. Multiscale Image Fusion Using Complex Extensions of EMD. IEEE Trans. Signal Process. 2009, 57, 1626–1630. [Google Scholar] [CrossRef]
- Rehman, N.; Mandic, D.P. Multivariate empirical mode decomposition. Proc. R. Soc. A Math. Phys. 2010, 466, 1291–1302. [Google Scholar] [CrossRef]
- Mandic, D.P.; Rehman, N.U.; Wu, Z.H.; Huang, N.E. Empirical Mode Decomposition-Based Time-Frequency Analysis of Multivariate Signals. IEEE Signal Process. Mag. 2013, 30, 74–86. [Google Scholar] [CrossRef]
- Rehman, N.U.; Mandic, D.P. Filter Bank Property of Multivariate Empirical Mode Decomposition. IEEE Trans. Signal Process. 2011, 59, 2421–2426. [Google Scholar] [CrossRef]
- Graves, R.W. Simulating seismic wave propagation in 3D elastic media using staggered-grid finite differences. Bull. Seismol. Soc. Am. 1996, 86, 1091–1106. [Google Scholar]
| Publisher’s Note: MDPI stays neutral with regard to jurisdictional claims in published maps and institutional affiliations. |
© 2022 by the authors. Licensee MDPI, Basel, Switzerland. This article is an open access article distributed under the terms and conditions of the Creative Commons Attribution (CC BY) license (https://creativecommons.org/licenses/by/4.0/).


