The Effect of Compactness on Laser Cutting of Cathode for Lithium-Ion Batteries Using Continuous Fiber Laser


1
Department of Mechanical and Automotive Engineering, Kongju National University, Cheonan 31080, Korea
2
Energy Materials Research Center, Advanced Materials Division, KRICT, 141 Gajeong-ro, Yuseong-gu, Daejeon 305-600, Korea
*
Author to whom correspondence should be addressed.
Appl. Sci. 2019, 9(1), 205; https://0-doi-org.brum.beds.ac.uk/10.3390/app9010205
Submission received: 1 December 2018
/
Revised: 21 December 2018
/
Accepted: 24 December 2018
/
Published: 8 January 2019
(This article belongs to the Special Issue High Capacity Electrode Materials for Advanced Lithium Ion Batteries)
Abstract
:Lithium-Ion Batteries (LIB) are growing in popularity for many applications. Much research has been focusing on battery performance improvement. However, few studies have overcome the disadvantages of the conventional LIB manufacturing processes. Laser cutting of electrodes has been applied. However, the effect of electrodes’ chemical, physical, and geometrical characteristics on the laser cutting has not been considered. This study proposes the effect of compression of cathode on laser cutting for lithium-ion batteries. The kerf width and top width of the specimens with laser irradiation are measured and the material removal energy is obtained. Observations of SEM photographs and absorptivity measurements are conducted. Increasing volume energies causes logarithmic increases in the kerf and top width. It is observed that the compressed cathode forms a wider kerf width than the uncompressed cathode under the same laser parameters. The top width of the uncompressed cathode is wider than the uncompressed cathode. The compression has a favorable effect on uniform cutting and selective removal of an active electrode.
1. Introduction
Lithium-ion batteries (LIBs) has been used actively due to their advantages such as a high energy density and low self-discharge compared to nickel-cadmium and lead-acid batteries. LIBs are also growing in popularity for aerospace, electric vehicle, and military applications. Thus, much research focusing on performance improvement has been actively carried out [1,2,3,4,5,6,7,8,9,10]. However, few studies have overcome the disadvantages of the conventional LIB manufacturing processes. Among the many manufacturing technologies, laser cutting is actively and successfully replacing the conventional cutting processes due to its advantages [11,12,13,14,15,16,17,18,19,20,21,22,23,24,25,26,27,28,29,30,31,32,33,34,35,36,37,38]. Lee et al. [16,17,18] applied the mathematical model to understand multi-physical phenomena in the laser cutting process for lithium-ion batteries. Furthermore, experimental studies were conducted to investigate the physical phenomena and interaction characteristics during laser cutting of electrode for lithium-ion batteries [11,13,14,15,18]. Lutey et al. [30,39] used both a continuous (CW) and pulsed laser to cut electrodes for lithium iron phosphate battery electrodes. The process efficiency and quality were characterized and found that the cutting efficiency increases with shorter pulses, higher velocity, and shorter wavelength [30,39]. Luetke et al. [40] compared a CW and pulsed laser to evaluate the cut quality by defining frazzling and clearance widths. The influences of pulse overlap on cut quality for the laser cutting of electrodes for lithium-ion batteries were studied by Reincke et al. [41] They evaluated the heat affected zone and delamination width. Jansen et al. [42] applied laser cutting on pure lithium metal foils since the lithium metal anodes are hardly separated by die cutting for mass production. Thus, they presented the remote laser cutting to show the potential to separate anodes with high quality. Demir et al. [34] compared the cut quality of laser cutting of lithium-ion electrodes with green and infrared pulsed lasers and found that the green laser provided a clearance width below 20 μm and the infrared laser provided the high-productivity criterion.
The electrodes’ chemical, physical, and geometrical characteristics are important and most critical parameters during laser cutting. However, no such factors have been considered. Therefore, this study proposes the effect of compression of cathode on laser cutting for lithium-ion batteries. First, materials, experiments, and measurement methods are described. Second, the laser cutting characteristics using compressed and uncompressed cathodes are analyzed and compared. Finally, the conclusions are presented.
2. Material, Experiment, and Measurement
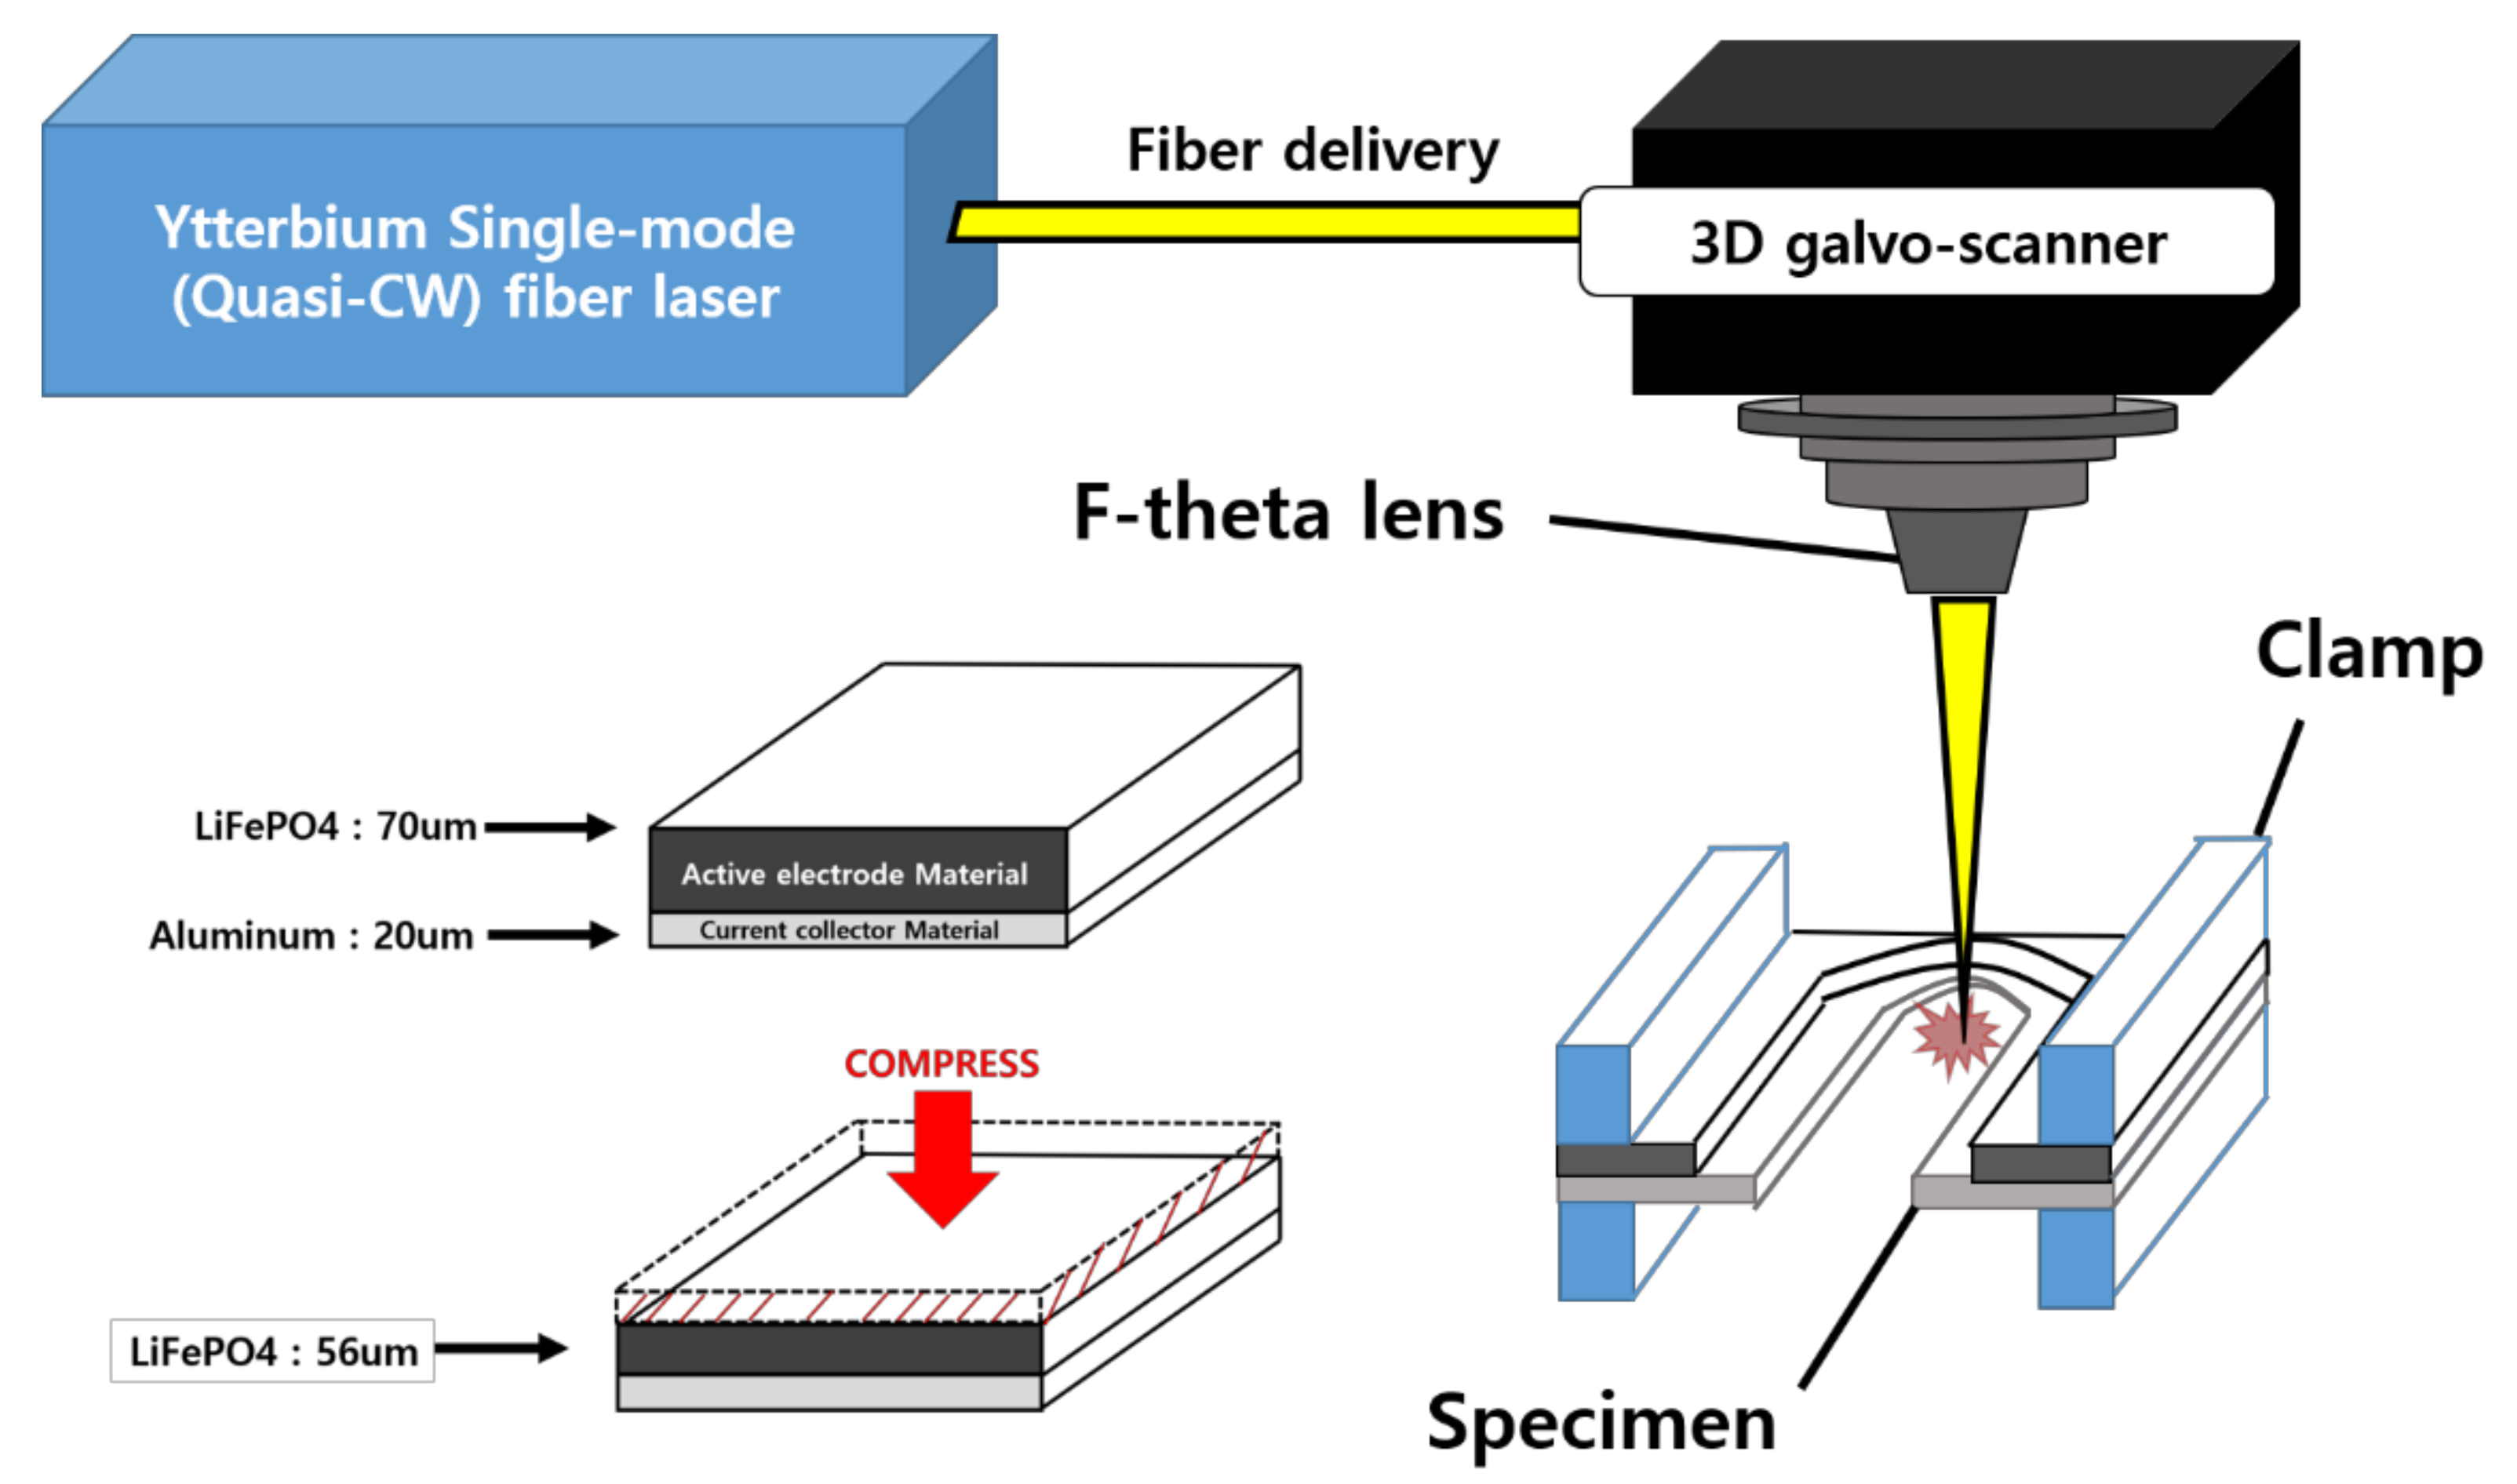
Single-mode Quasi-CW Ytterbium Fiber Laser (IPG YLM-200/2000-QCW) was used with CW mode. The value was 1.05. The wavelength was 1070 nm and the maximum average output power was 250 W. The vertical distance from the F-theta lens to the surface was set to be 100 mm. The laser spot size at focus was 23 μm. The width of the cathode sample was 30 mm, and the cutting distance was 20 mm horizontally so that even though the laser cut sample was completely separated, the rest of the sample remains attached. Both ends of the specimen were held by clamps so that the space was formed between the specimen and the table to prevent any possible effects such as heat conduction and material attachment from the table, as shown in Figure 1. The laser output power used for the experiments were varied from 50 W to 250 W at intervals of 50 W and the laser scanning speed was varied from 500 mm/s to 5000 mm/s at an interval of 500 mm/s. These are shown in Table 1. The volume energy depending on the output power and scanning speed is shown in Figure 1.
Compressed and uncompressed cathode samples were used. The compressed cathode was coated with a 76 μm-thick active electrode material on a 20 μm-thick current collector and then was compressed from 76 μm to 56 μm, as shown in Figure 1. The uncompressed sample was coated with a 70 μm-thick active electrode material on a 20 μm-thick current collector. The detailed information of the materials was summarized in Table 2. It should be noted that the total thickness of this cathode was relatively thin for high power applications. The active electrode material consists of 90% of LiFePO4, 5% SuperC65 (Conducting agent), and 5% of polyvinylidene fluoride (binder). The current collector is aluminum. The working electrode was formulated by the mixing of active materials, conductive carbon materials and PVDF binder with a controlled amount of NMP solvent. After slurry coating on Al current collector, the electrode was dried at 120 °C in a convection oven for 6h and then dried at 90 °C in a vacuum oven for 24 h before use.
A Scanning Electron Microscope (SEM, VEGA3, TESCAN, Brno, Czech Republic) was utilized to observe the cut surface and cross-section of the laser cut sample. After the laser cutting, the sample is cut into 2 × 2 cm size for SEM analysis. Energy-dispersive X-ray spectroscopy (EDX) analysis was conducted to measure the composition variation. Furthermore, the absorption rates were measured by UV-VIS spectroscopy (SolidSpec-3700, Shimadzu, Kyoto, Japan).
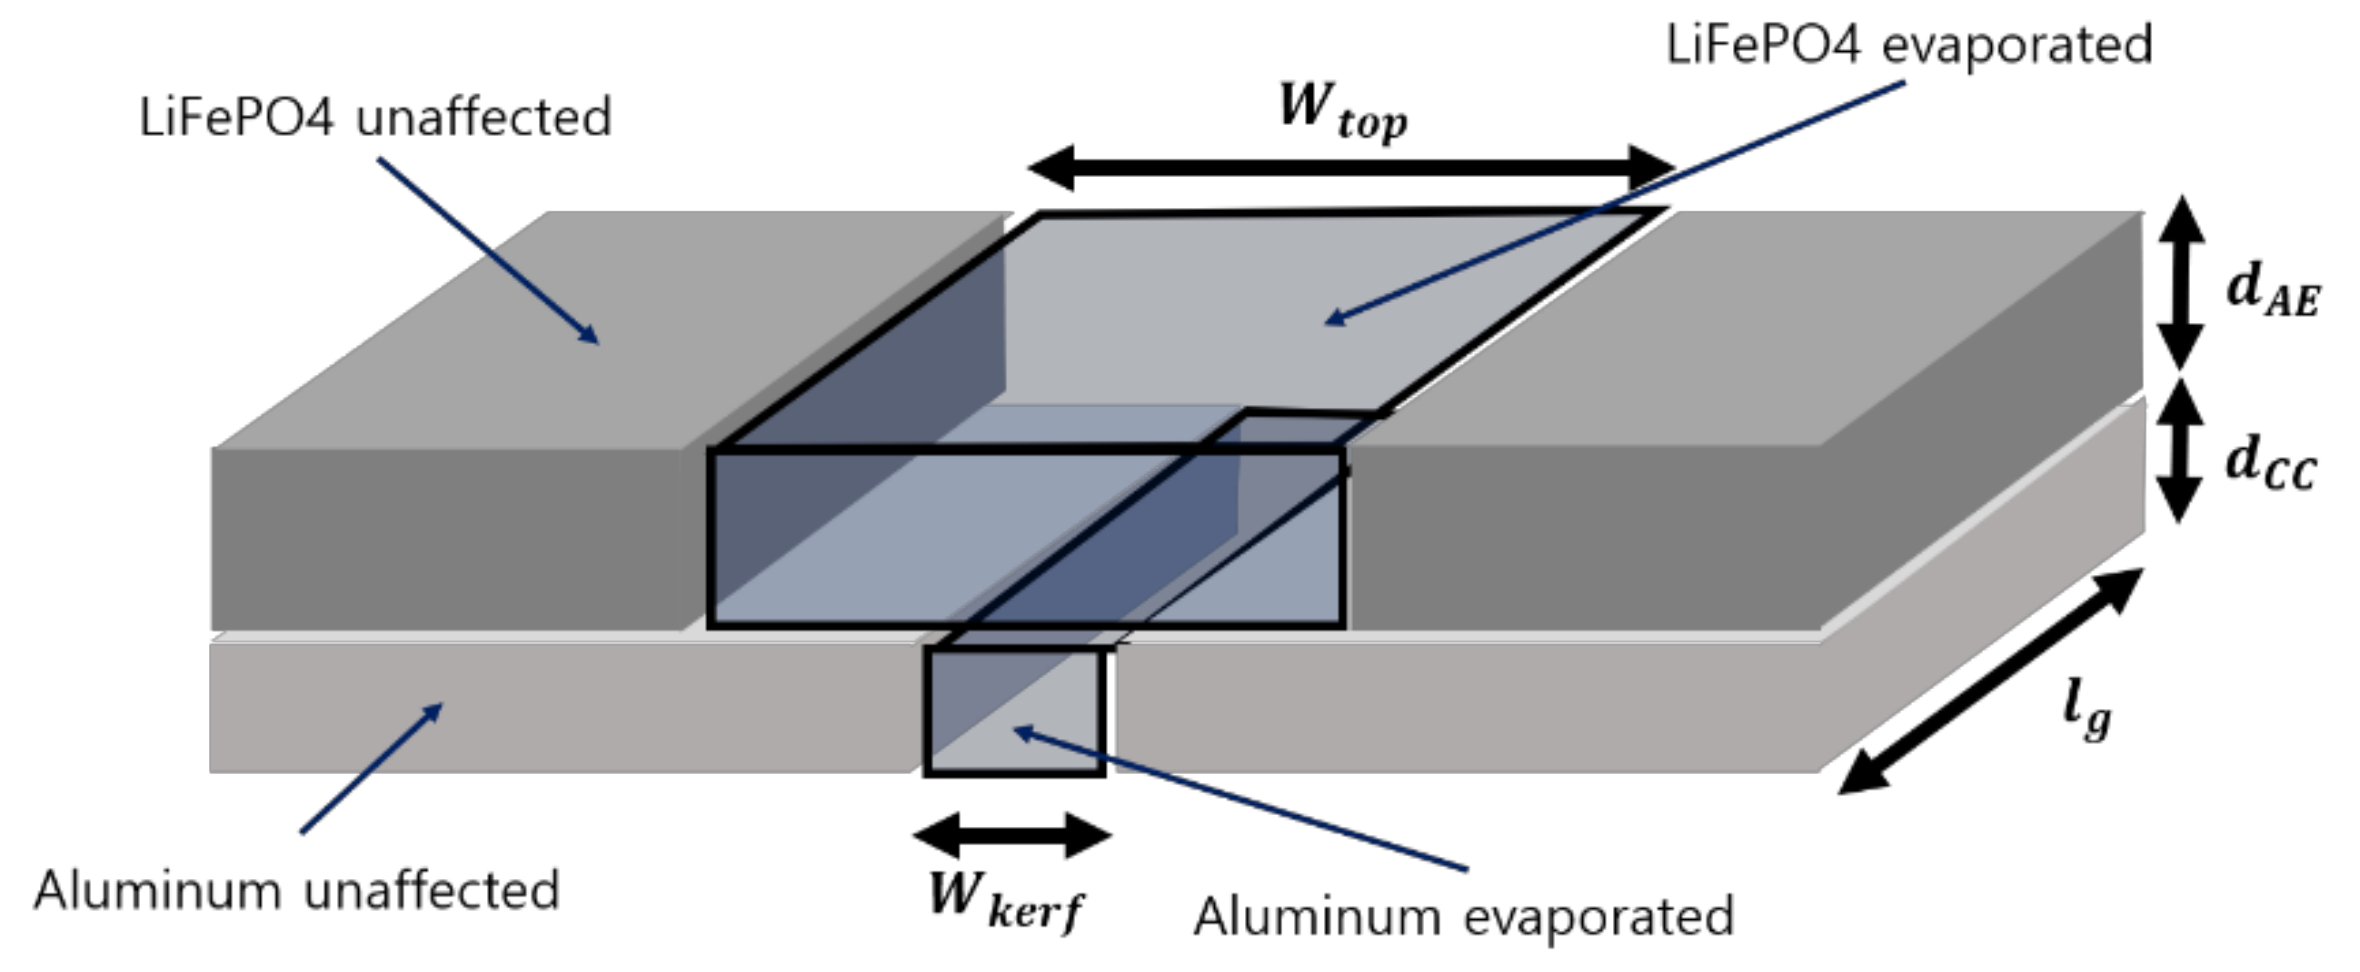
The kerf, top, and melting widths were measured based on the previously published papers [12,13,14]. The energy used in cutting to melt and evaporate the cathode can be derived from the measured widths and shown in Figure 2. Since the melting width rarely occurred, the melting width is set equal to the kerf width. The volume removed by melting and evaporation are expressed by
where is the thickness of an active electrode (AE) material, and is the thickness of a current collector (CC). The energy required to evaporate the given volume is expressed by
where m is the mass, c is the specific heat, ρ is the density, is the melting temperature, is the evaporation temperature, is the ambient temperature, is the latent heat of melting, and is the latent heat of evaporation. In addition, subscription and indicates solid and liquid, respectively. Subscription can be a current collector (CC) or active electrode materials (AE). The total energy (E) used to remove a cathode is obtained as follows:
If we rewrite the equation with measurable kerfs, then it can be written as
3. Results and Discussion
First, the cut characteristics of compressed and uncompressed cathodes are investigated individually. The kerf and top widths are observed and analyzed in terms of scanning speed and volume energy. The melting widths are uncommonly observed so the analyses only considered with the kerf and top widths. Moreover, the cut surface of the sample and removal energy are observed. Second, the two types of cathodes were compared in terms of cutting configuration, cutting region, absorption rate, and composition changes.
3.1. Width, Removal Energy, and Cut Surface of the Compressed Cathode
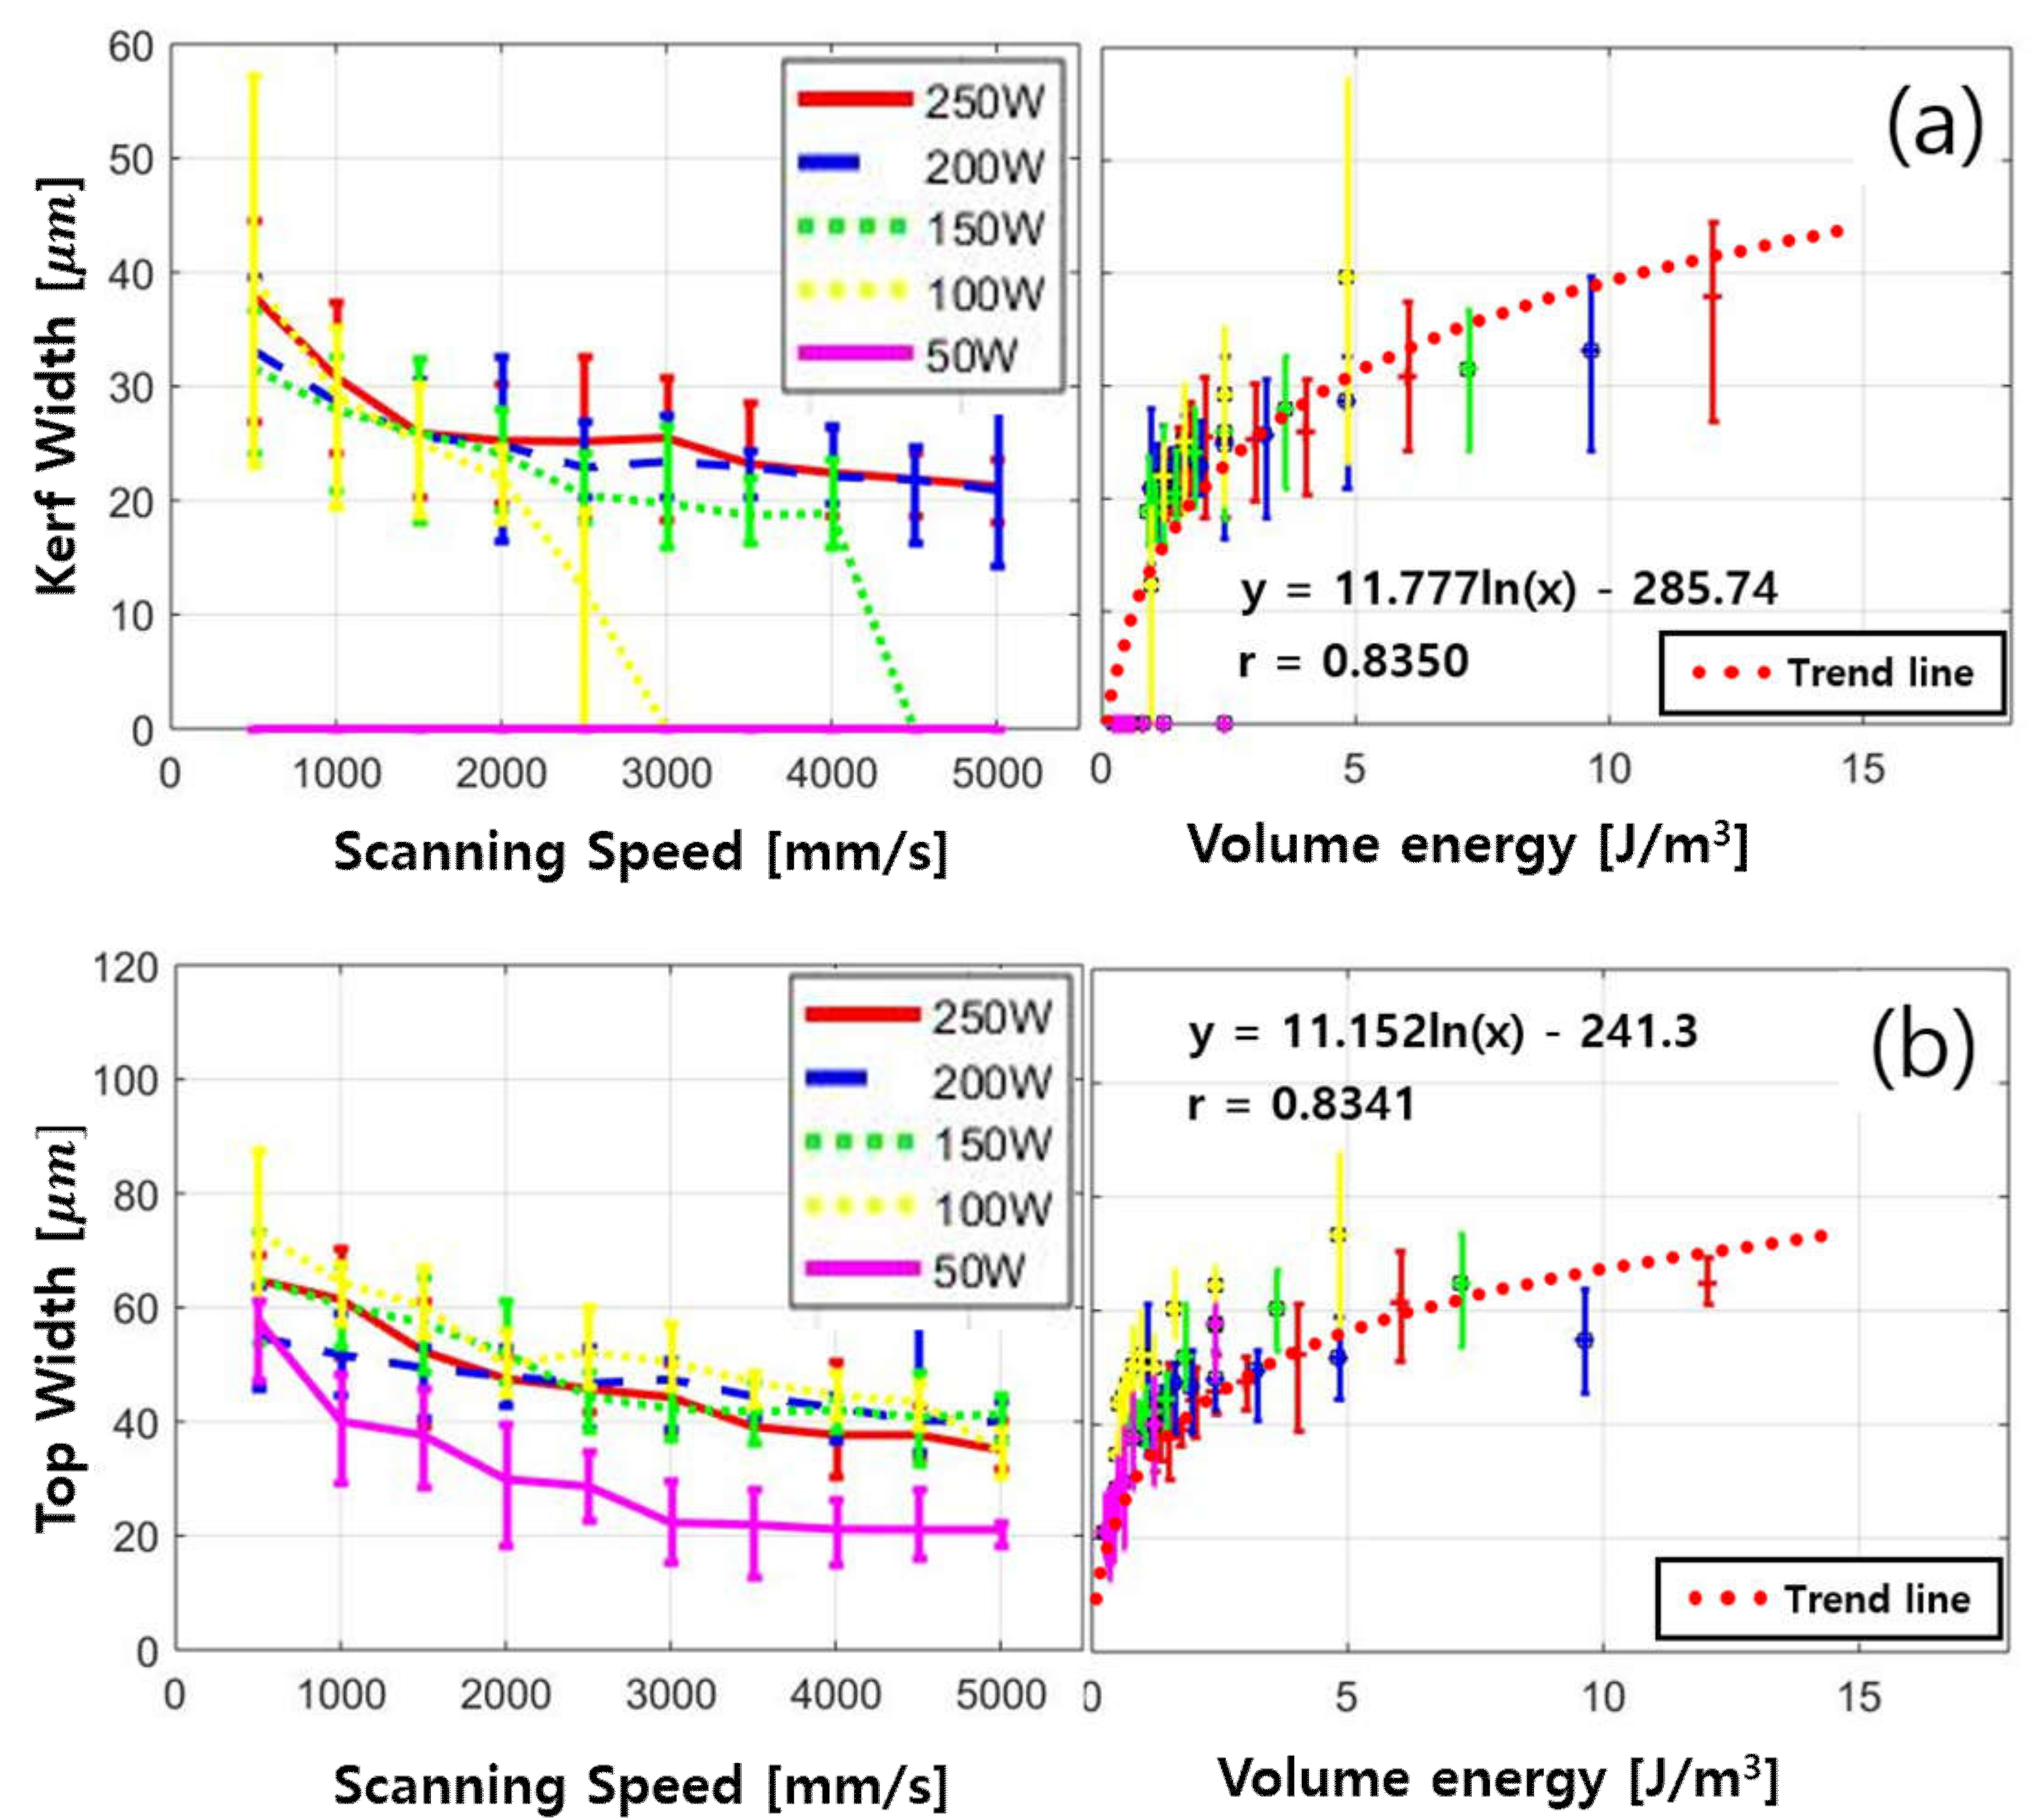
Figure 3a shows the kerf width with respect to scanning speed (left) and volume energy (right). The kerf width is not formed with the laser power of 50 W. When the scanning speed is faster than 2500 mm/s, the kerf width is not formed with the laser power of 100 W. Increasing scanning speed from 500 mm/s to 2500 mm/s decreases the kerf width with the laser power of 100 W. According to volume energy, volume energy greater than 9.628 J/ is required to form the kerf width with the laser power of 100 W. The kerf width is not formed with the laser power of 150 W when the scanning speed is faster than 4000 mm/s so that it is noted that the volume energy greater than 9.026 J/ is required to form the kerf width. For the laser power of 150 W, 200 W and 250 W, the average kerf widths are bounded between 19 m and 37 m whenever the kerf width is observed. For the laser power of 200 W and 250 W, the kerf width can be observed for all scanning speeds used in this study. The kerf width decreases almost linearly and two slopes are observed. One slope is observed from the scanning speed of 500 mm/s to 1500 mm/s and the other slope is observed from the scanning speed of 1500 mm/s to 5000 mm/s.
Figure 3b shows the top width. Increasing scanning speed decreases the top width almost linearly with the laser power of 100 W, 150 W, 200 W, and 250 W, as well as the average top widths are bounded between 35 m and . The top widths with the laser power of 50 W are slightly lower than top widths obtained at other laser powers. In addition, increasing the scanning speed from 500 mm/s to 5000 mm/s exponentially decreases the top width at the laser power of 50 W.
Figure 3 also shows trend lines of volume energy (right). The trend line is obtained by regression analysis, which shows the relationship between the volume energy and the kerf width as well as the volume energy and the top width. The kerf width and the top width are dependent on the volume energies. Furthermore, increasing volume energy causes a logarithmic increase of the kerf width and the top width. The correlation coefficient of the kerf width and top width is 0.8350 and 0.8341, respectively. Since it is rather close to 1, it indicates that the variables are positively logarithmically related.
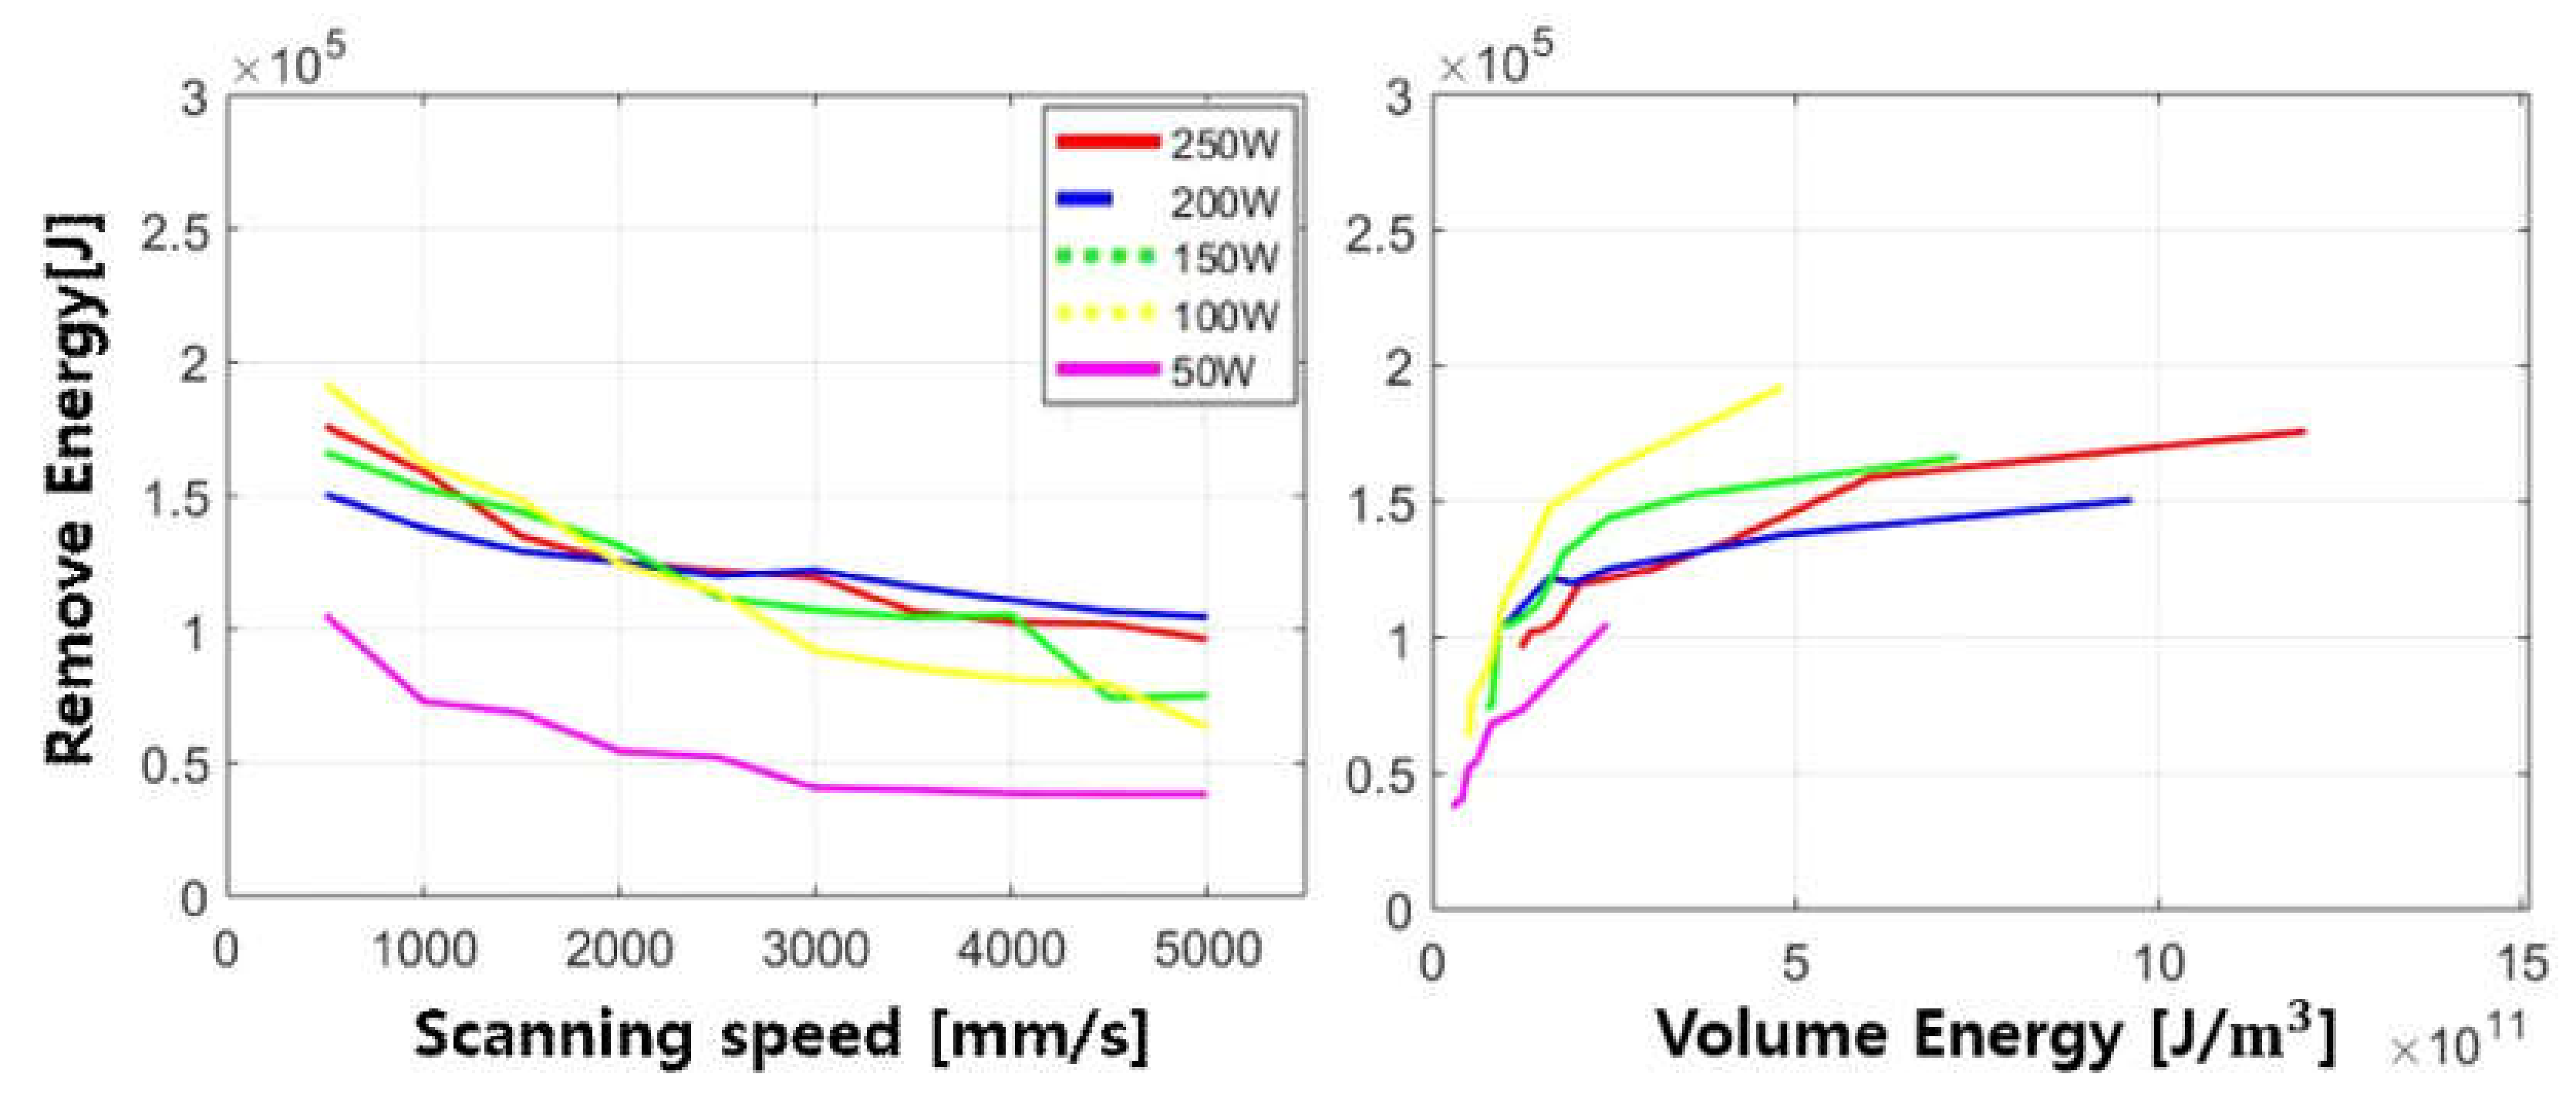
Figure 4 shows the average values of energy required to remove materials. This remove energy is obtained by Equation (5). Remove energy decreases exponentially as scanning speed is increasing for all laser powers. From the laser power of 100 W to 250 W, the remove energy is similar to each other because the remove energy is measured based on the removed volume, as shown in Figure 2. One the other hand, the remove energy with the laser power of 50 W is significantly less than other cases. In this case, only the top width is measurable since only active electrode material is ablated. It is noted that required remove energy depends on interaction time when full cutting occurs.
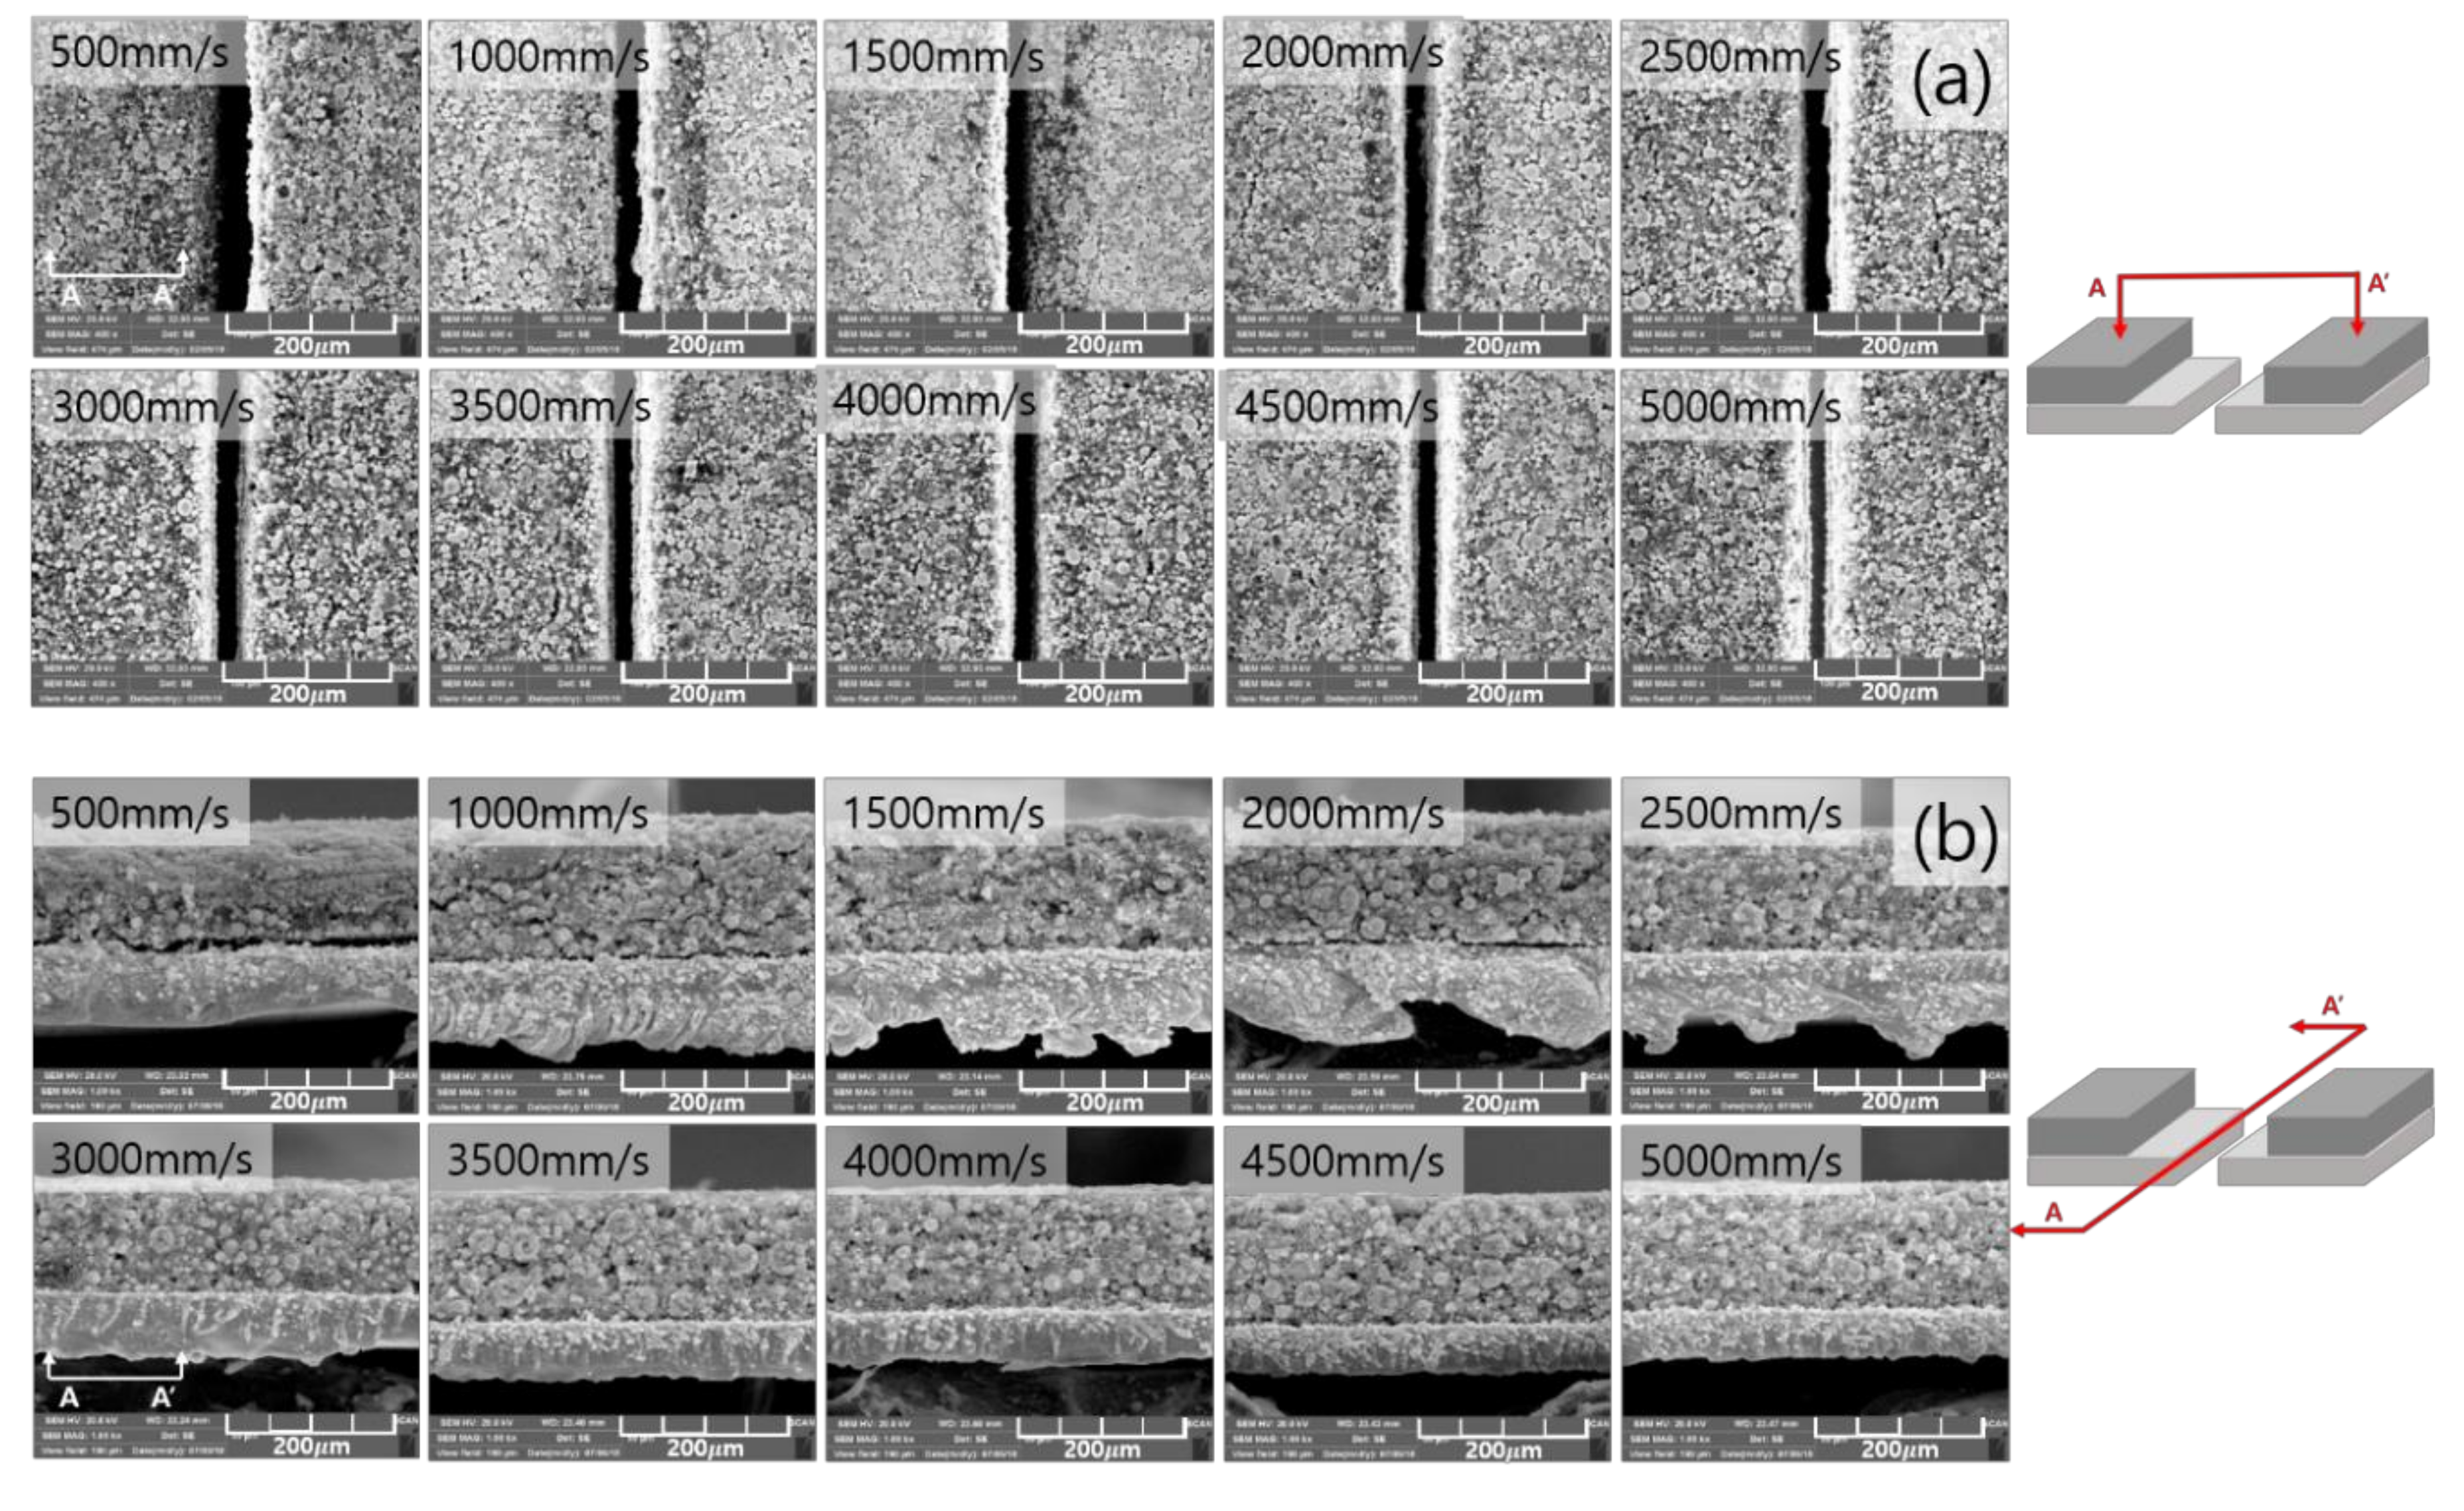
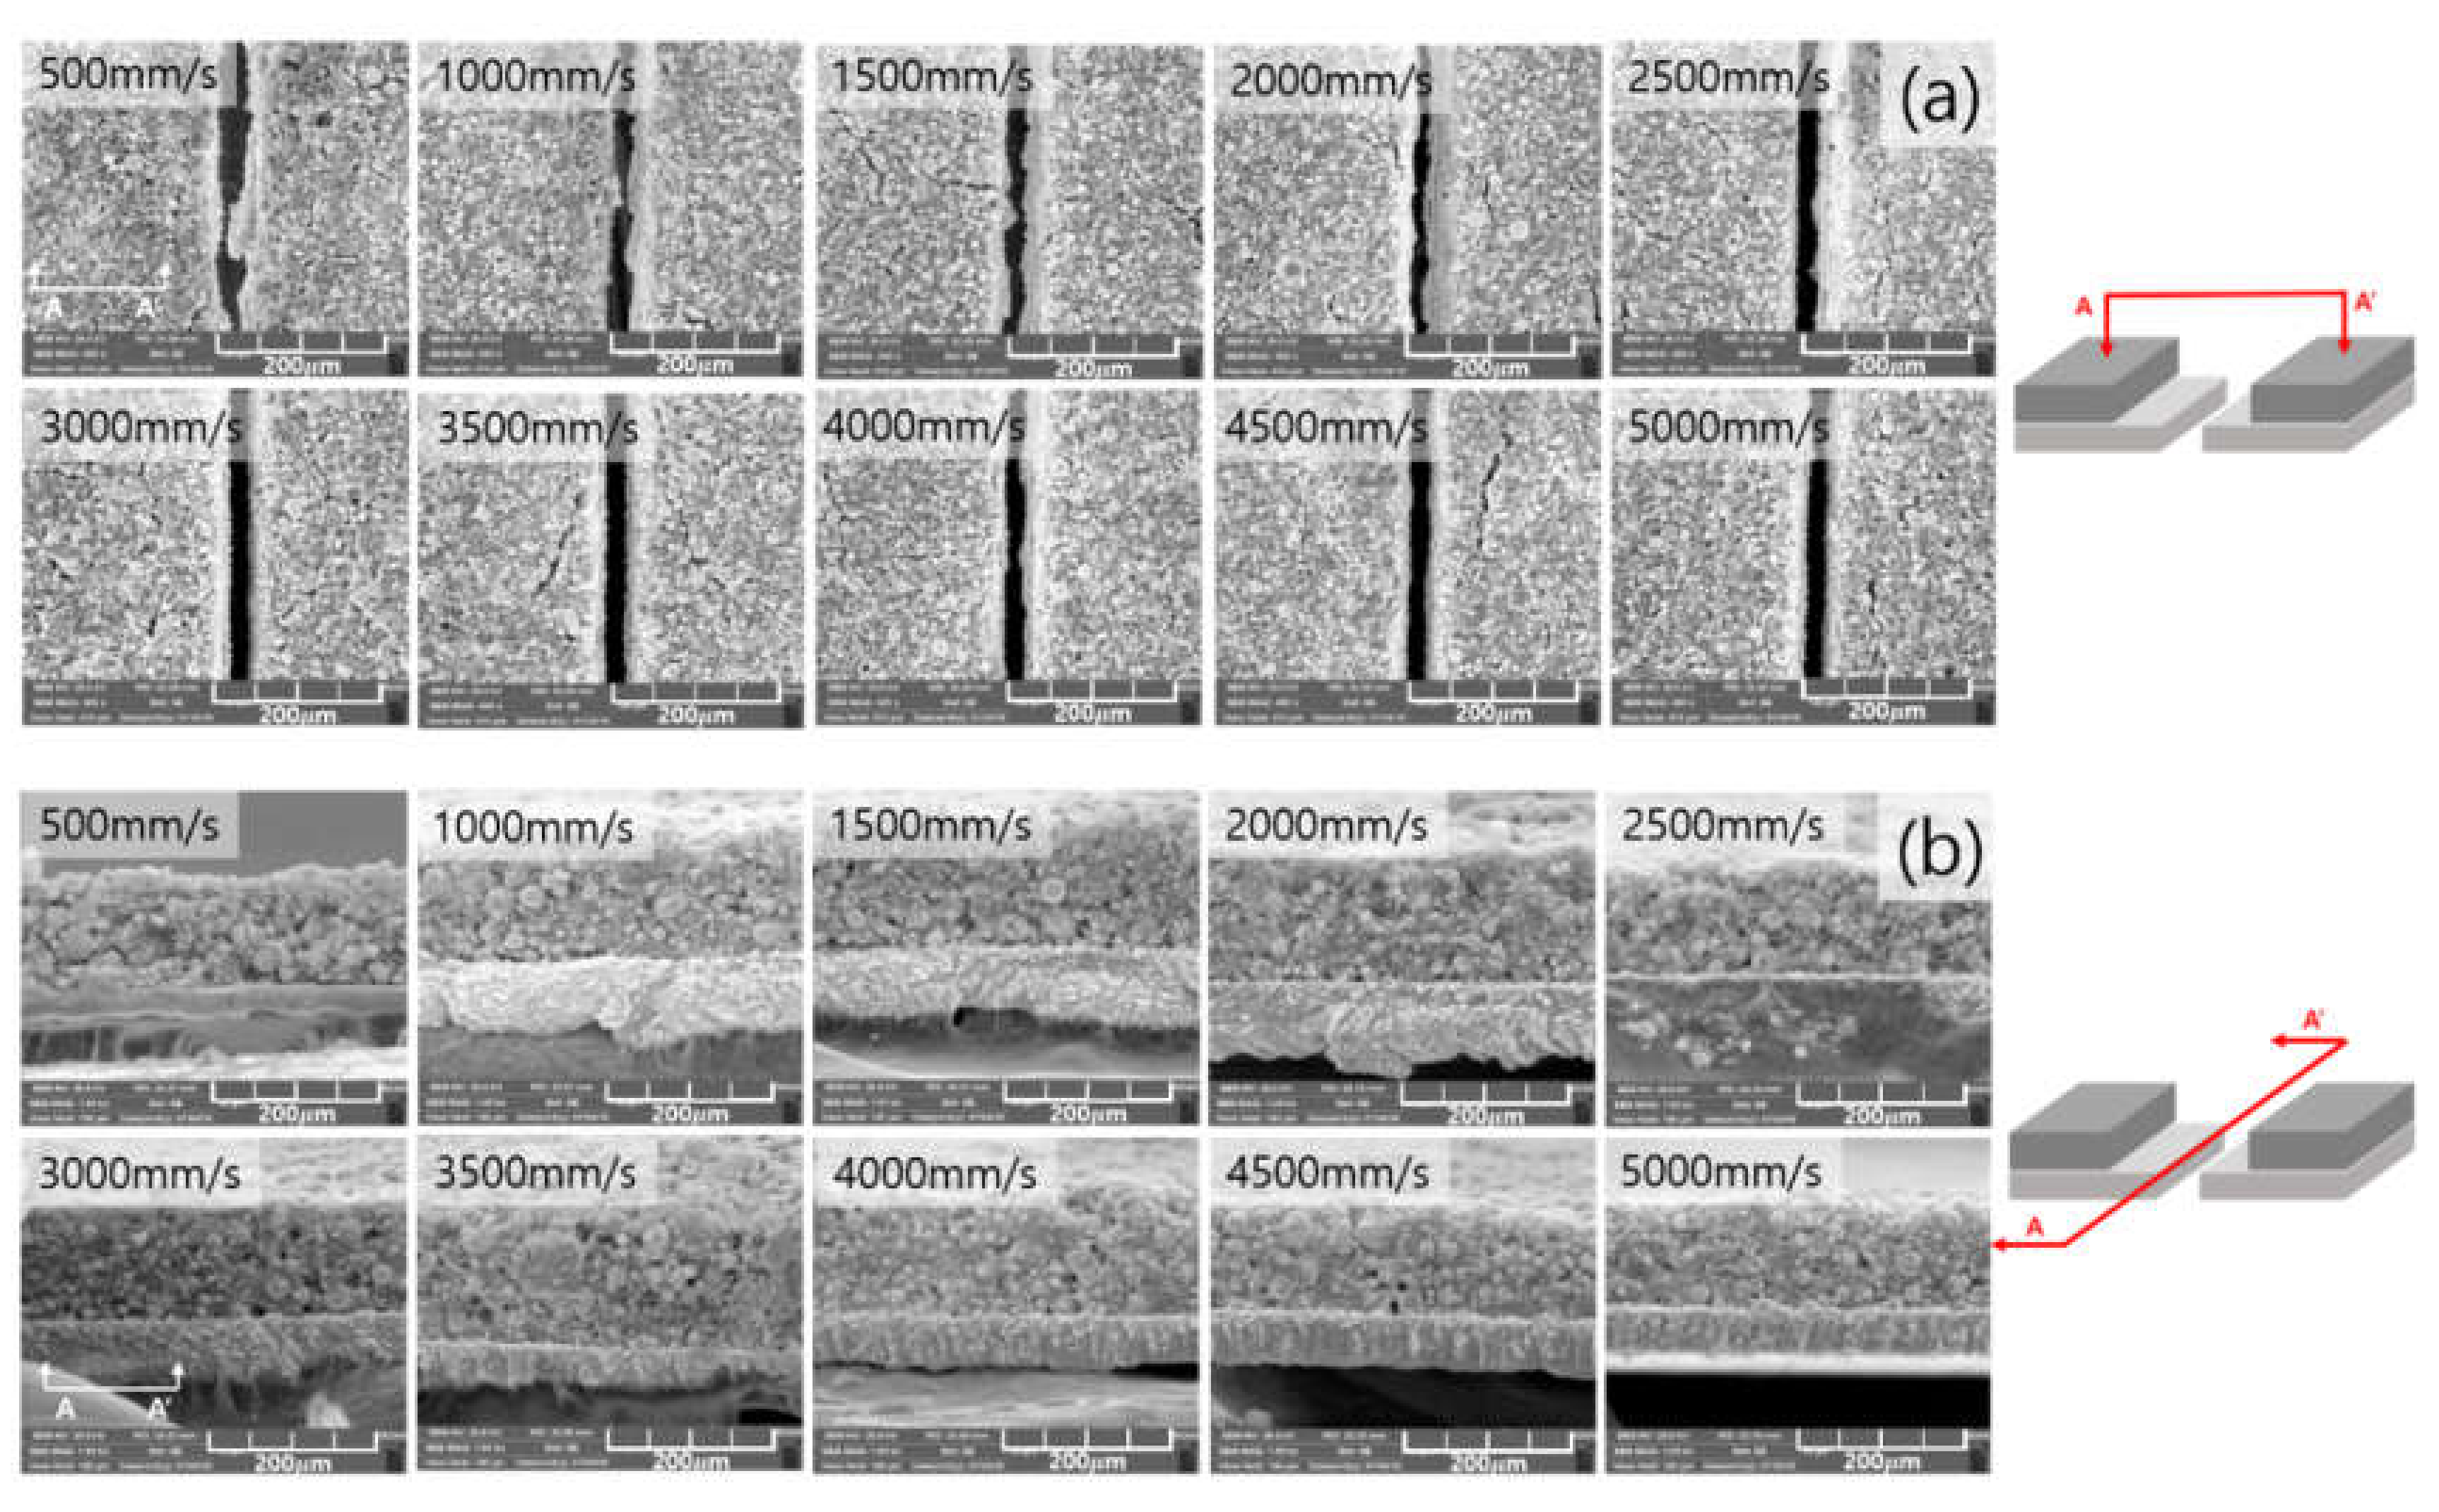
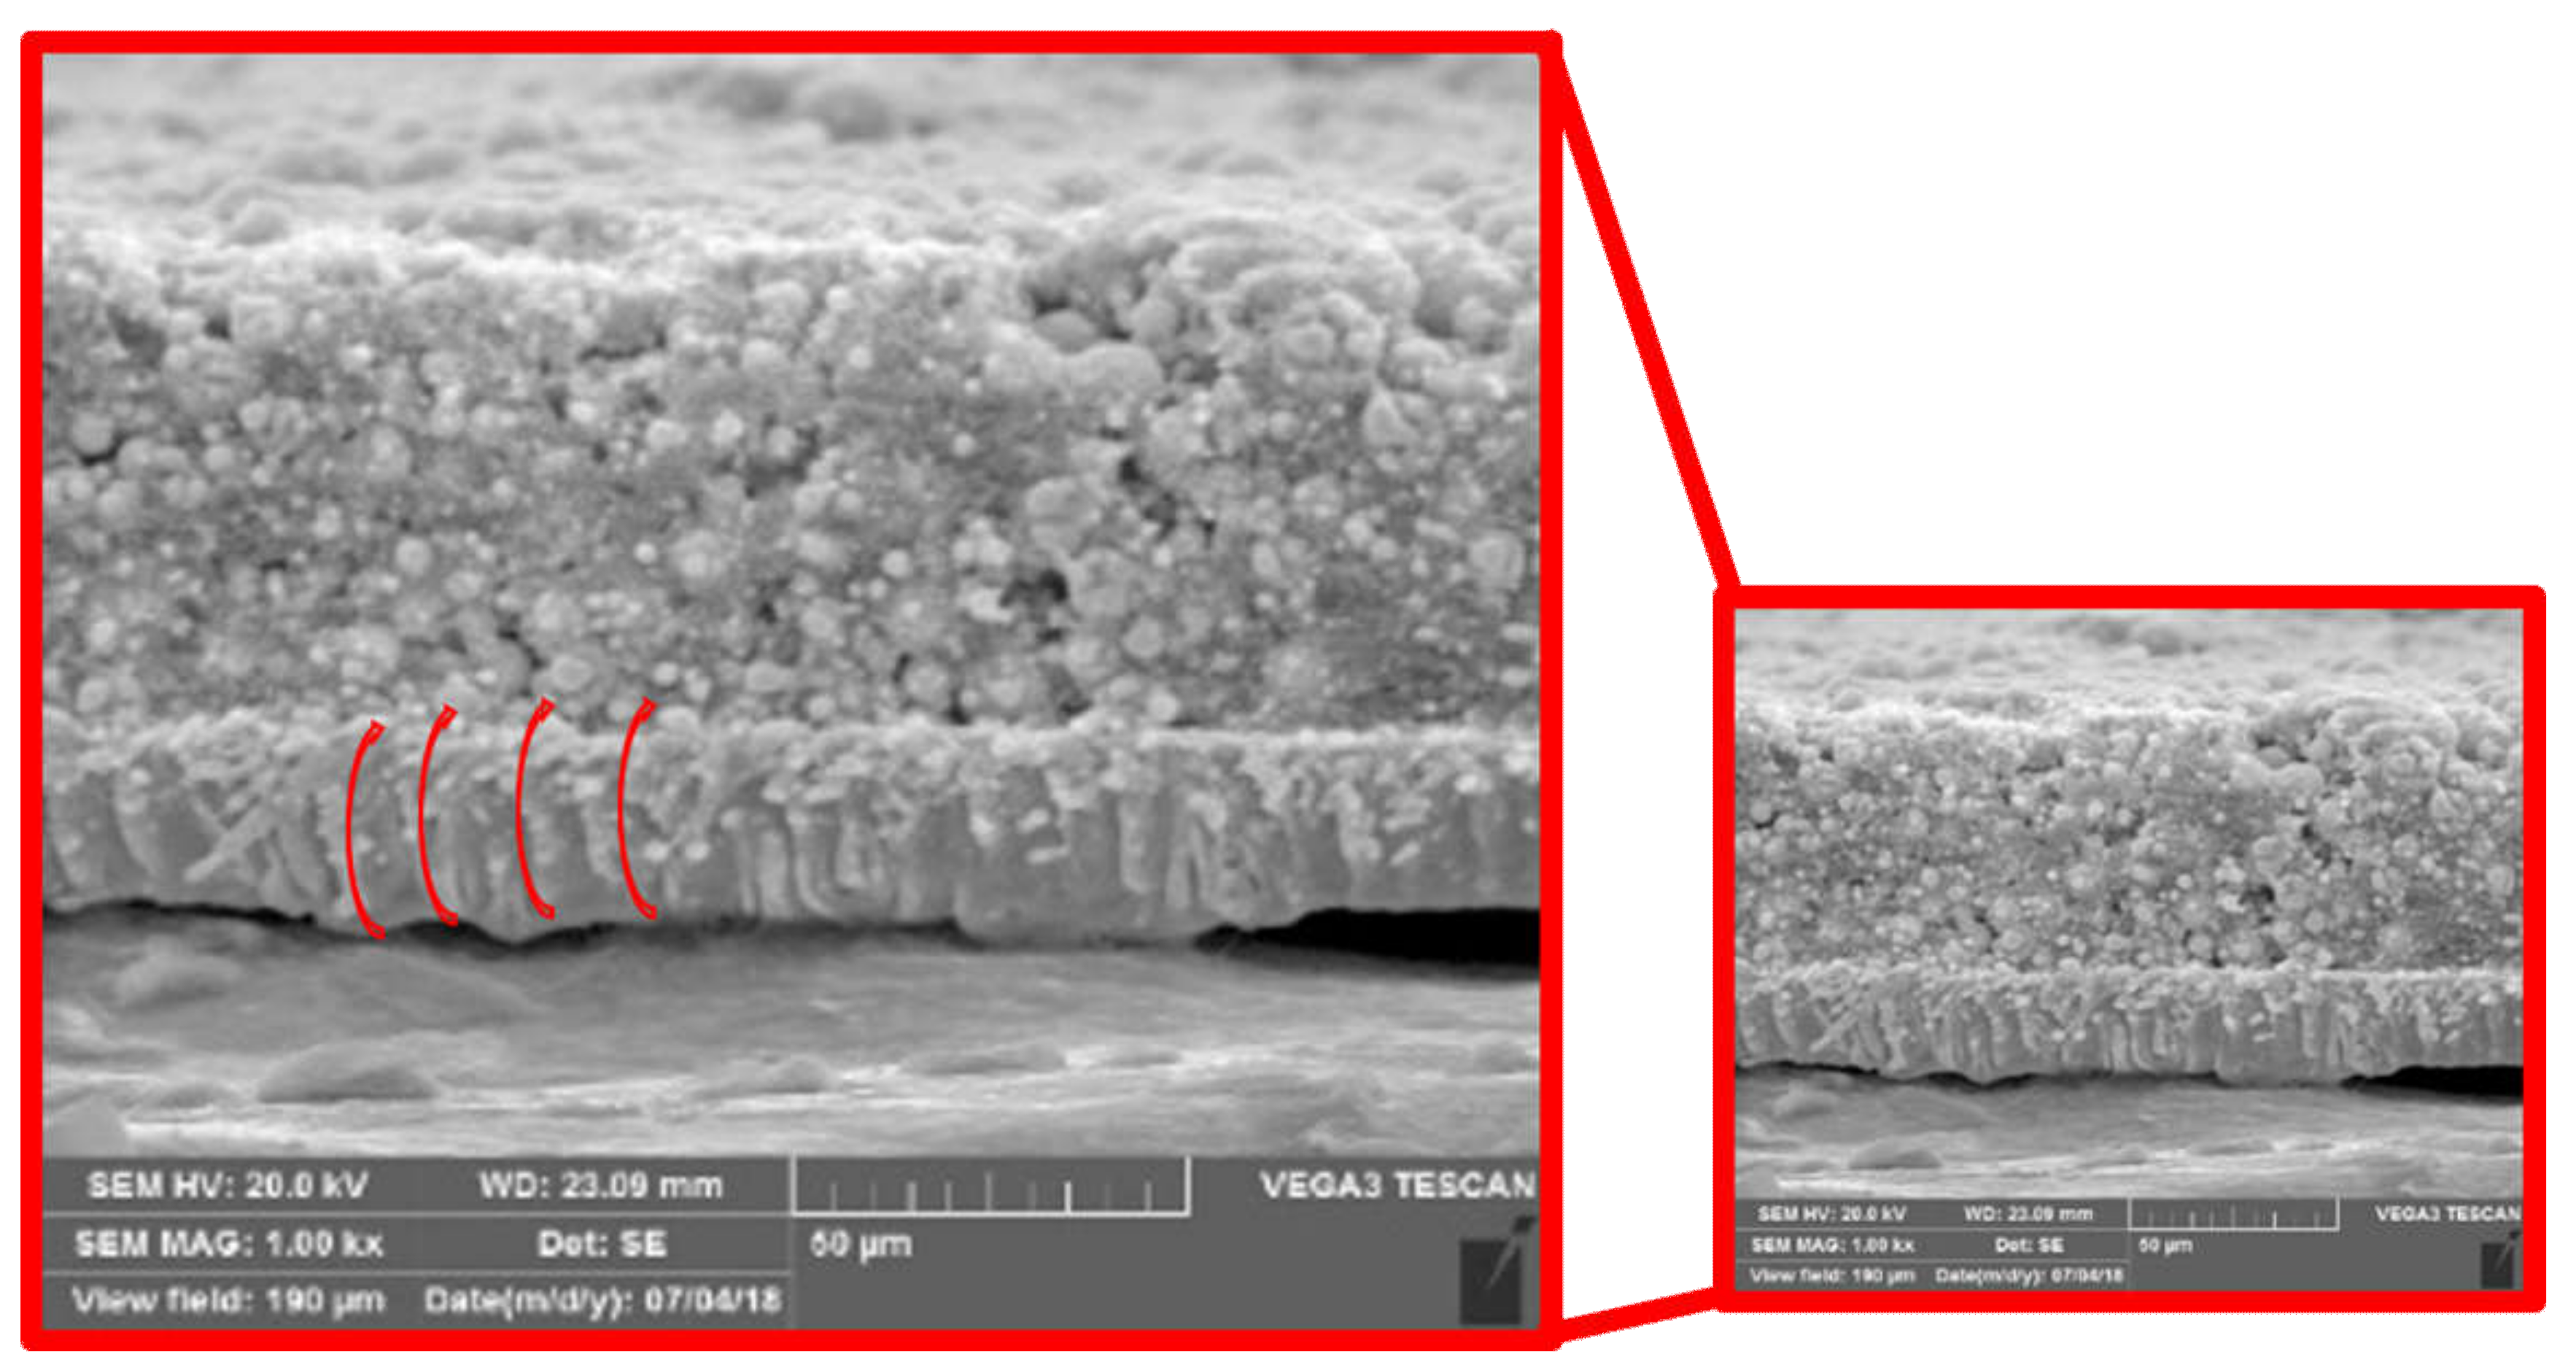
Figure 5 shows SEM images of the compressed cathode cut at the laser power of 250 W. Figure 5a,b show the cathode top view and a cathode cross-section view, respectively. The melting width is not formed as shown in Figure 5a and it is invisible to all cut samples used in this study. Thus, no clearance width can be seen. More interesting characteristics can be observed in Figure 5b. At the scanning speed of 500 mm/s, a gap between the active electrode material and the current collector, which is delamination, is shown. It is inferred that the excessive heat induces a high recoil pressure so that the pressure pushes the active electrode material up and the amount of pressure generated is stronger than the peel strength between the active electrode material and the current collector.
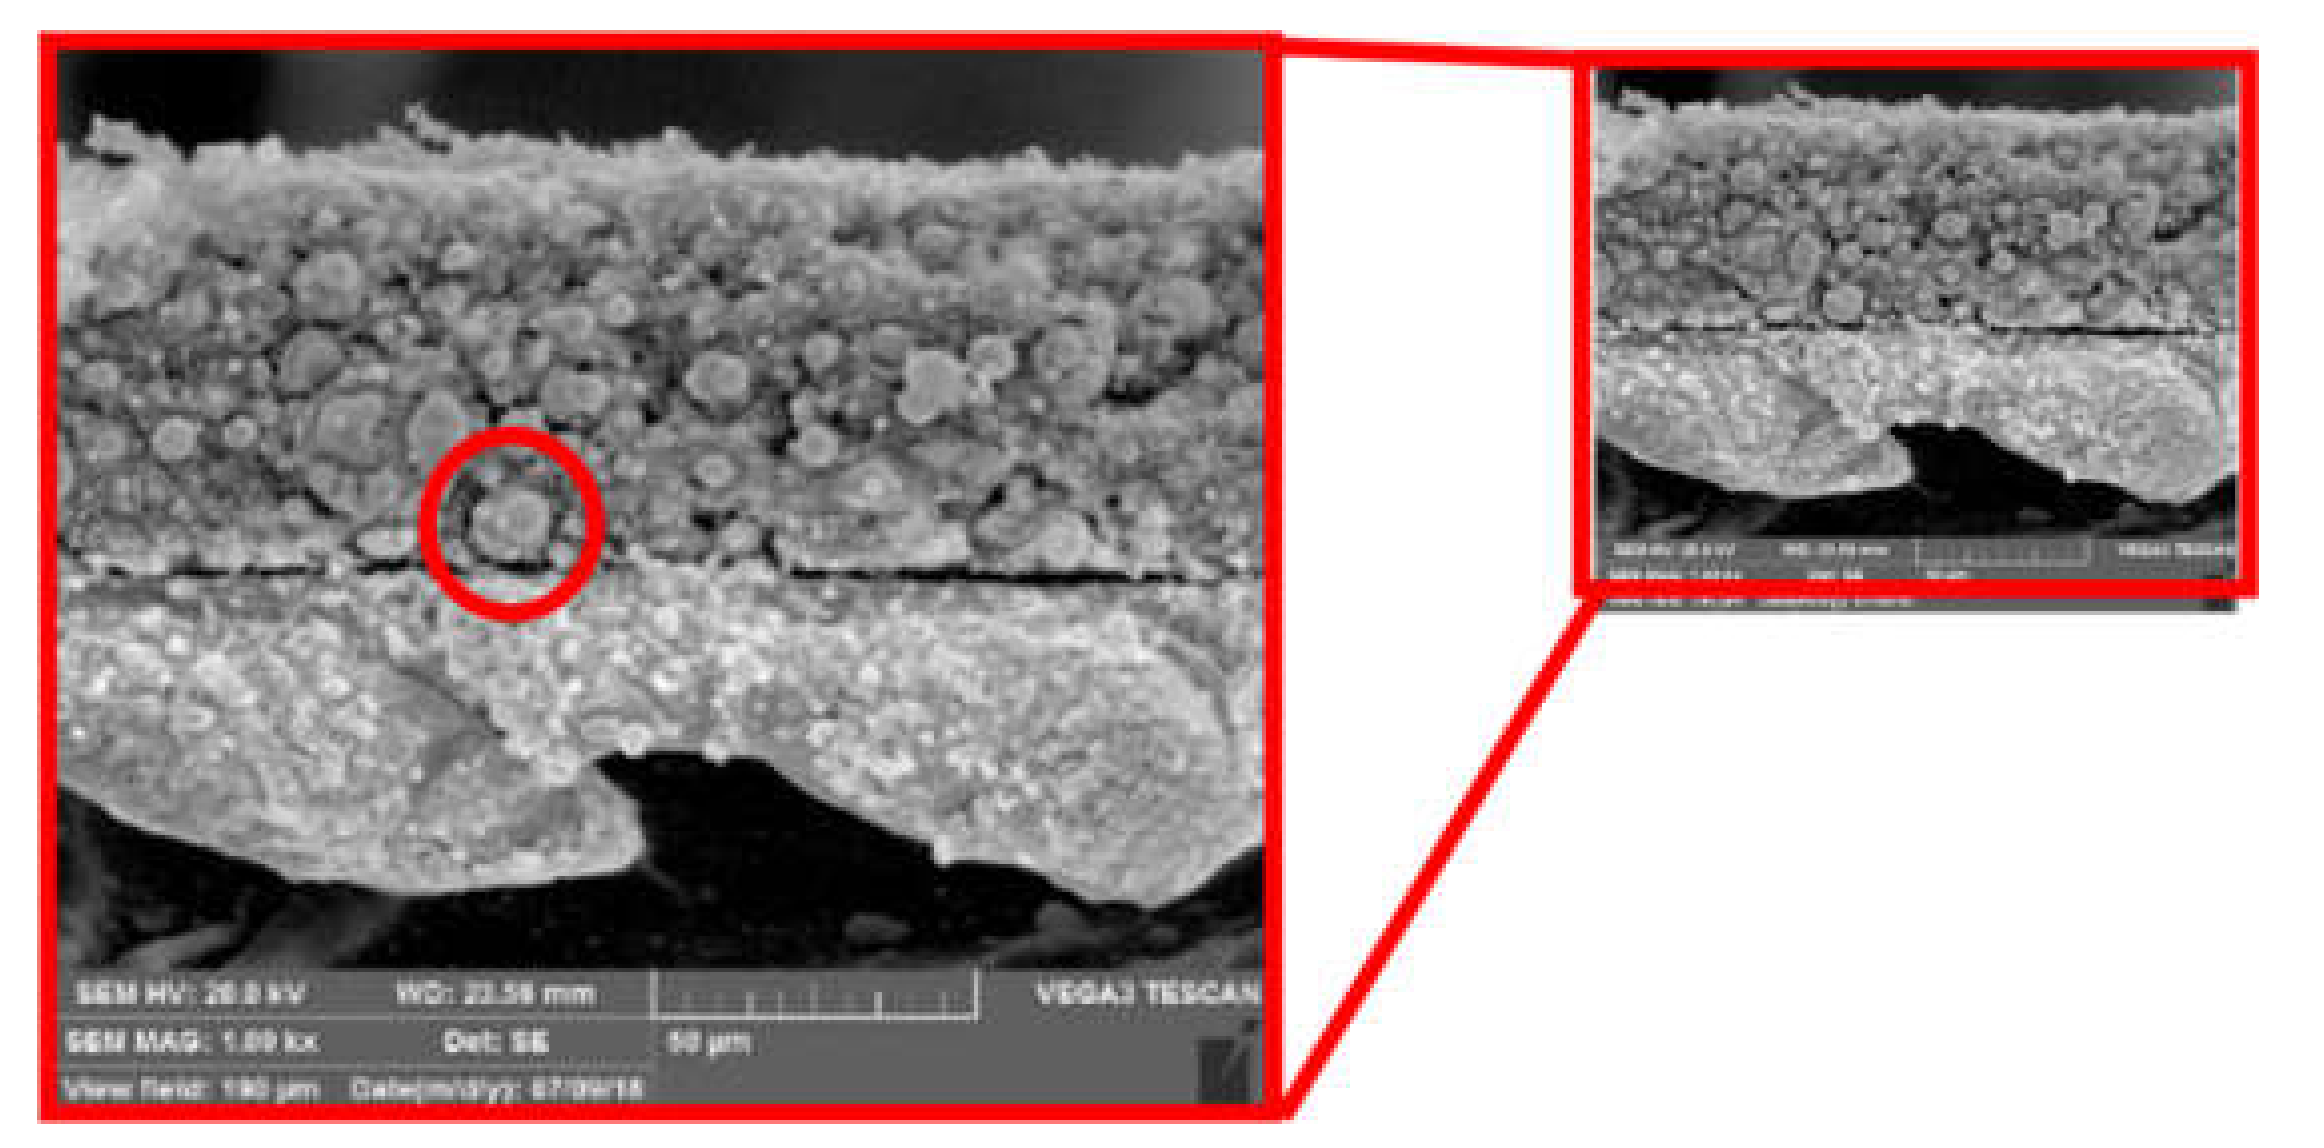
From the scanning speed of 1000 mm/s to 2500 mm/s, the thickness of aluminum increases due to the re-solidified aluminum at the bottom of the specimen. The original thickness was 20 m but the thickness became about 23.5 m after the cutting. This may be caused by the aluminum melting and re-solidification so that the aluminum bead is formed. The melted aluminum is not fully removed during the cutting process, but flowed downward and solidified after the cutting process. Moreover, striation is clearly seen in the scanning speed of 1000 mm/s. This is an indication of flow fluctuation during the cutting process and sudden solidification. From all cut samples, the LiFePO4 in the form of spherical particles are found in the aluminum region. It may be because the LiFePO4, detached from the active electrode region due to the high pressure and high temperature, is formed during the cutting process. In addition, the detached LiFePO4 particles are embedded into the molten pool of aluminum. With the laser scanning speed of 500 mm/s to 2500 mm/s, excessively high pressure and high temperature may lead to unstable laser cutting, or excessive cutting, characterized as delamination, re-solidified aluminum beads, striation, and embedded LiFePO4 particles. The characteristics observed above are clearly seen in Figure 6.
At the scanning speed of 3000 mm/s, no delamination and aluminum beads were observed while striation marks and embedded spherical particles of LiFePO4 are still observed. At the scanning speeds between 3500 mm/s and 5000 mm/s, high cut quality, or proper cutting, can be observed. No delamination, no striation, and no aluminum beads were formed while the LiFePO4 in the form of spherical particles are still observed.
3.2. Width, Removal Energy, and Cut Surface of the Uncompressed Cathode
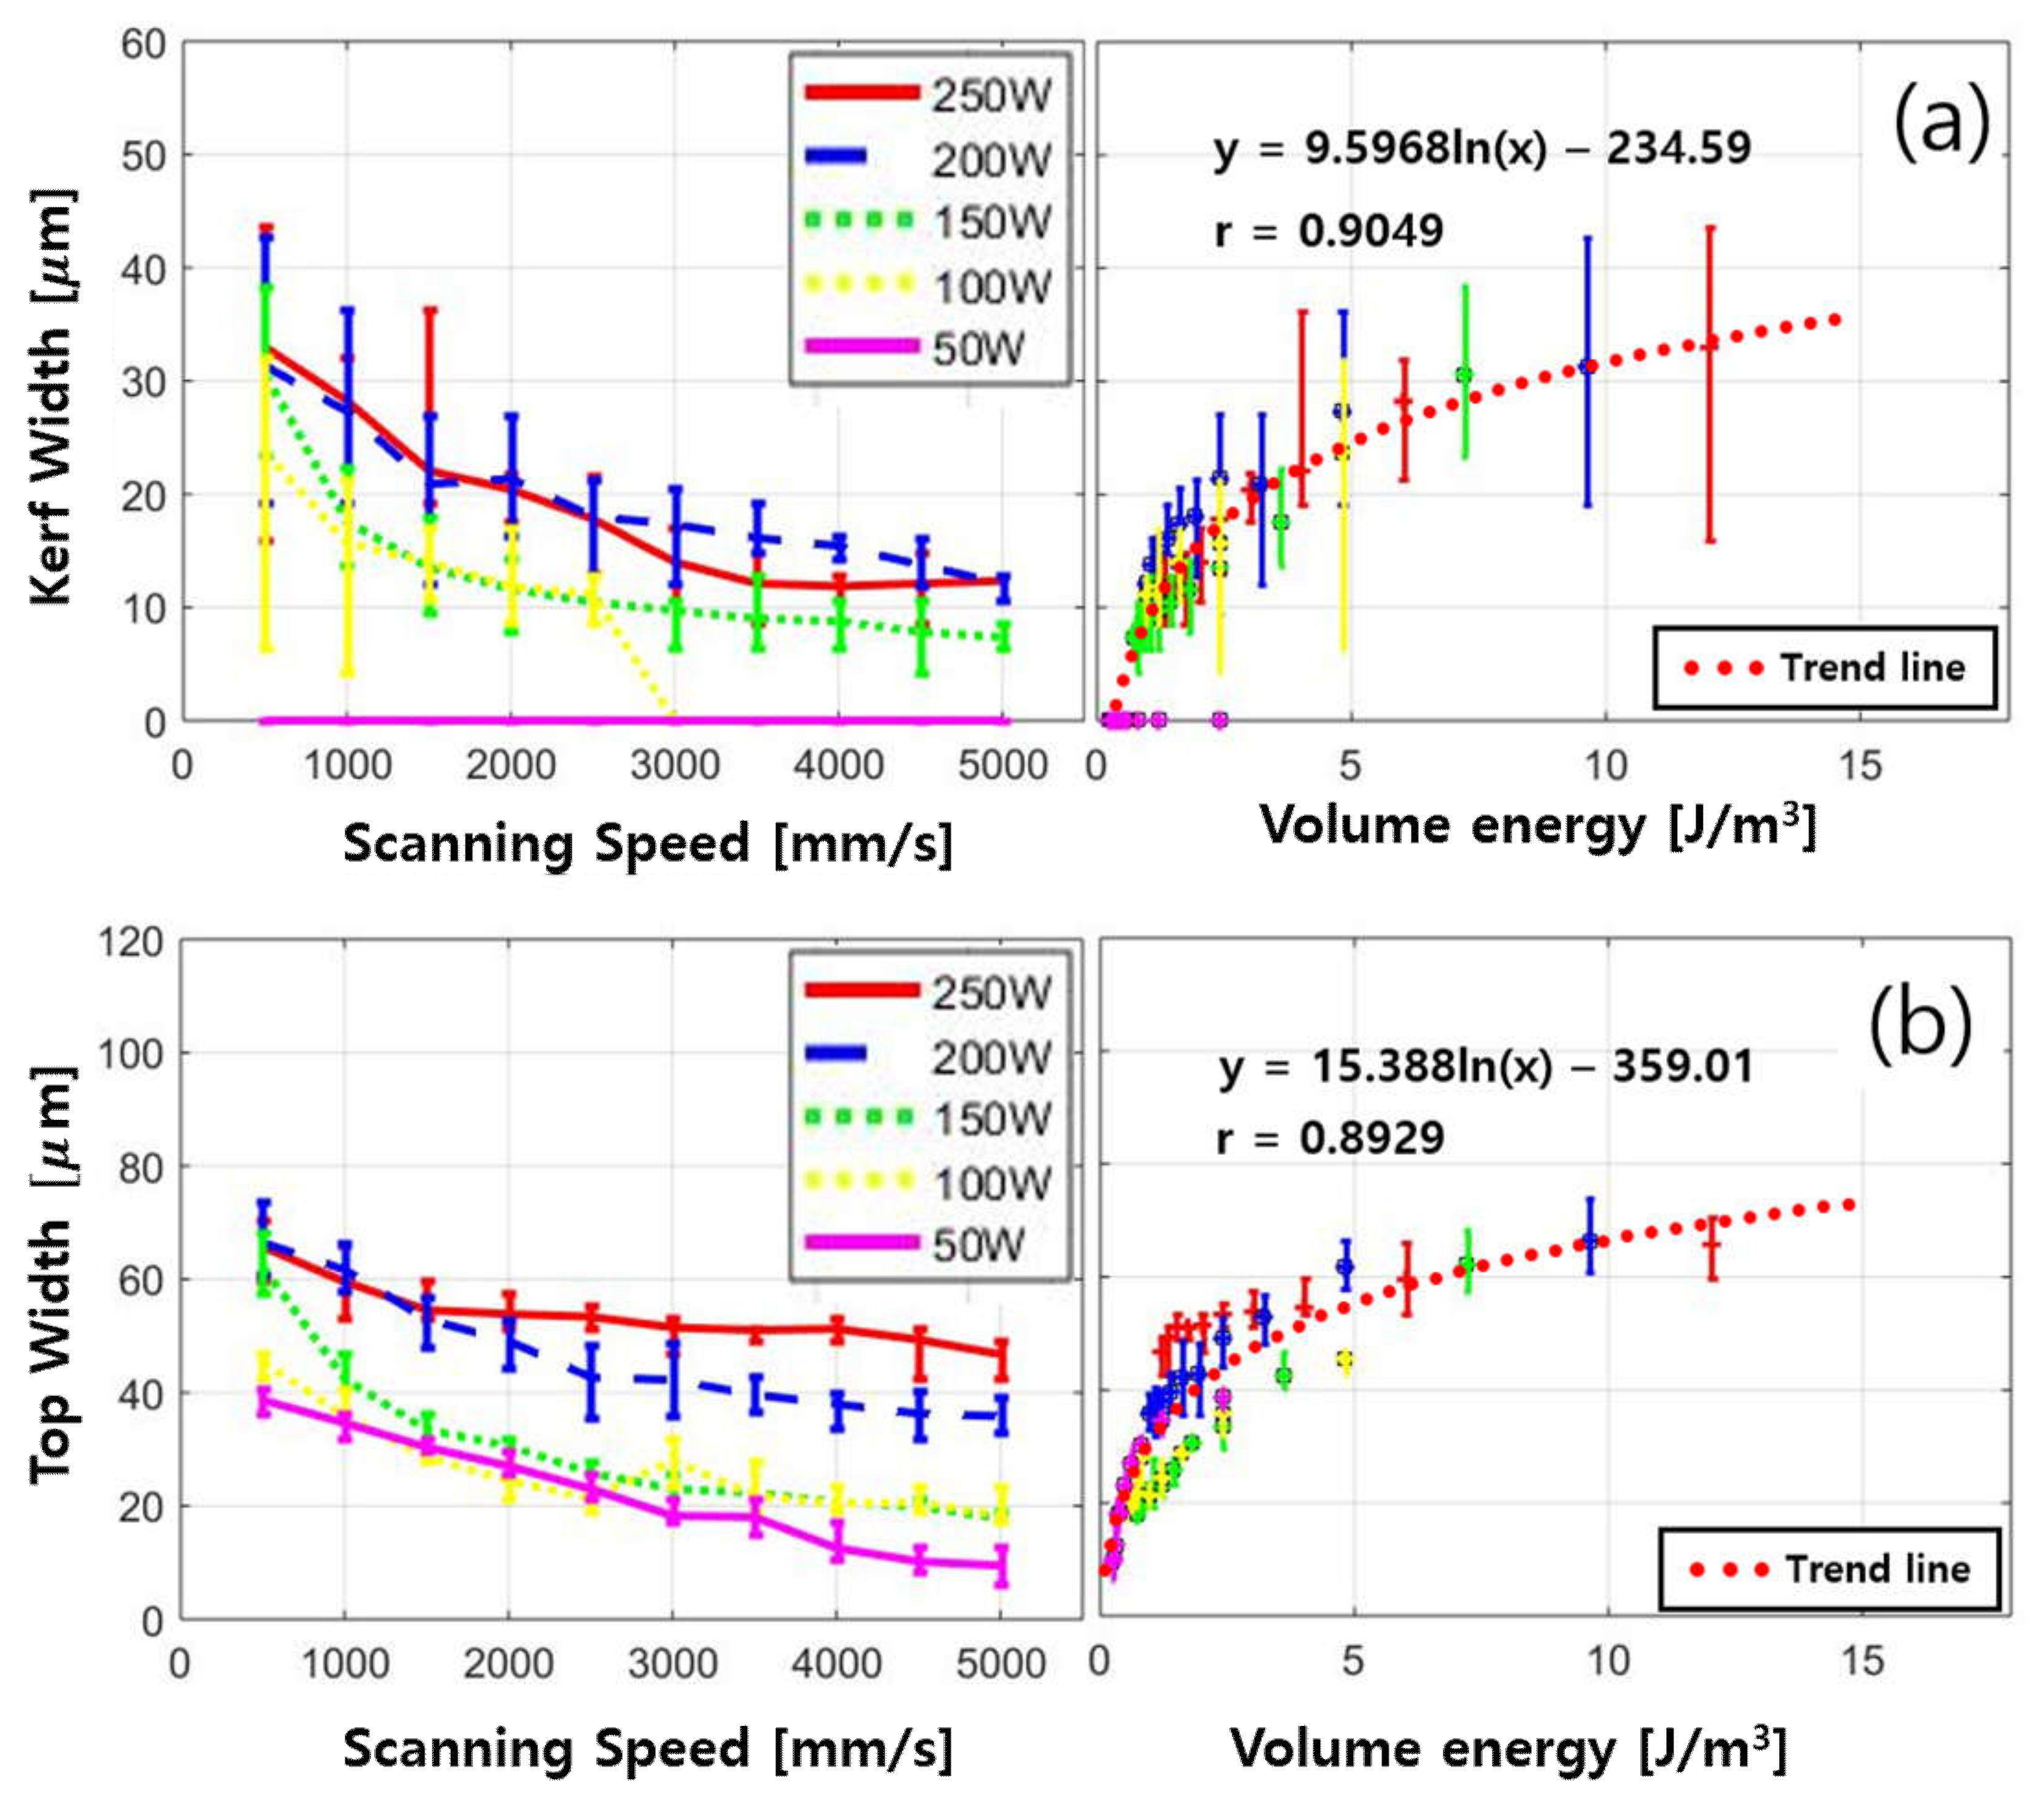
Figure 7a shows the kerf width of the uncompressed cathode. Uncompressed cathodes have a narrower kerf width than compressed cathodes at the equal volume energy. The kerf width is not formed with the laser power of 50 W. When the scanning speed is faster than 2500 mm/s, the kerf width is not formed at the laser power of 100 W. Increasing the scanning speed from 500 mm/s to 2500 mm/s exponentially decreases the kerf width at the laser power of 100 W. According to volume energy, the volume energy greater than 9.628 J/ is required to form the kerf width with the laser power of 100 W. When the laser power is the 150 W, the kerf width is formed from the scanning speed of 500 mm/s to 5000 mm/s. The kerf width exponentially decreases as the scanning speed increases from 500 mm/s to 2500 mm/s and then linearly decreases. When the kerf width decreases exponentially, kerf width shows a relatively greater variation. However, when the kerf width decreases linearly, its value is around 10 with relatively little variation. When the laser power is the 200 W and 250 W, a similar trend as observed from the kerf width with the laser power of 150 W is observed.
Figure 7b shows the top width. Overall, the top widths decrease as the scanning speed increases. The top width with the laser power of 250 W and 200 W linearly decreases from the scanning speed of 500 mm/s to 5000 mm/s. When the scanning speed is between 500 mm/s and 1500 mm/s, almost similar values are observed. When the scanning speed is faster than 1500 mm/s, the variation of the top width is smaller than the variation of the top width from 500 mm/s to 1500 mm/s. On the other hand, the top widths at the laser power of 200 W and 50 W linearly decrease from 500 mm/s to 5000 mm/s. More interesting characteristics can be observed at the laser power of 150 W. Increasing the scanning speed from 500 mm/s to 1500 mm/s decreases the top width exponentially. Also, increasing the scanning speed from 2000 mm/s to 5000 mm/s linearly decreases the top width.
The relationship between the volume energy and the kerf width as well as the volume energy and the top width are shown in Figure 7 (right) with trend lines. The kerf width and the top width are dependent on the volume energies. Furthermore, an increase in volume energy causes a logarithmic increase in the kerf width and the top width. The correlation coefficient of the kerf width is 0.9049 and the correlation coefficient of the top width is 0.8929. Since it is rather close to 1, it was indicated that the variables are positively logarithmically related.
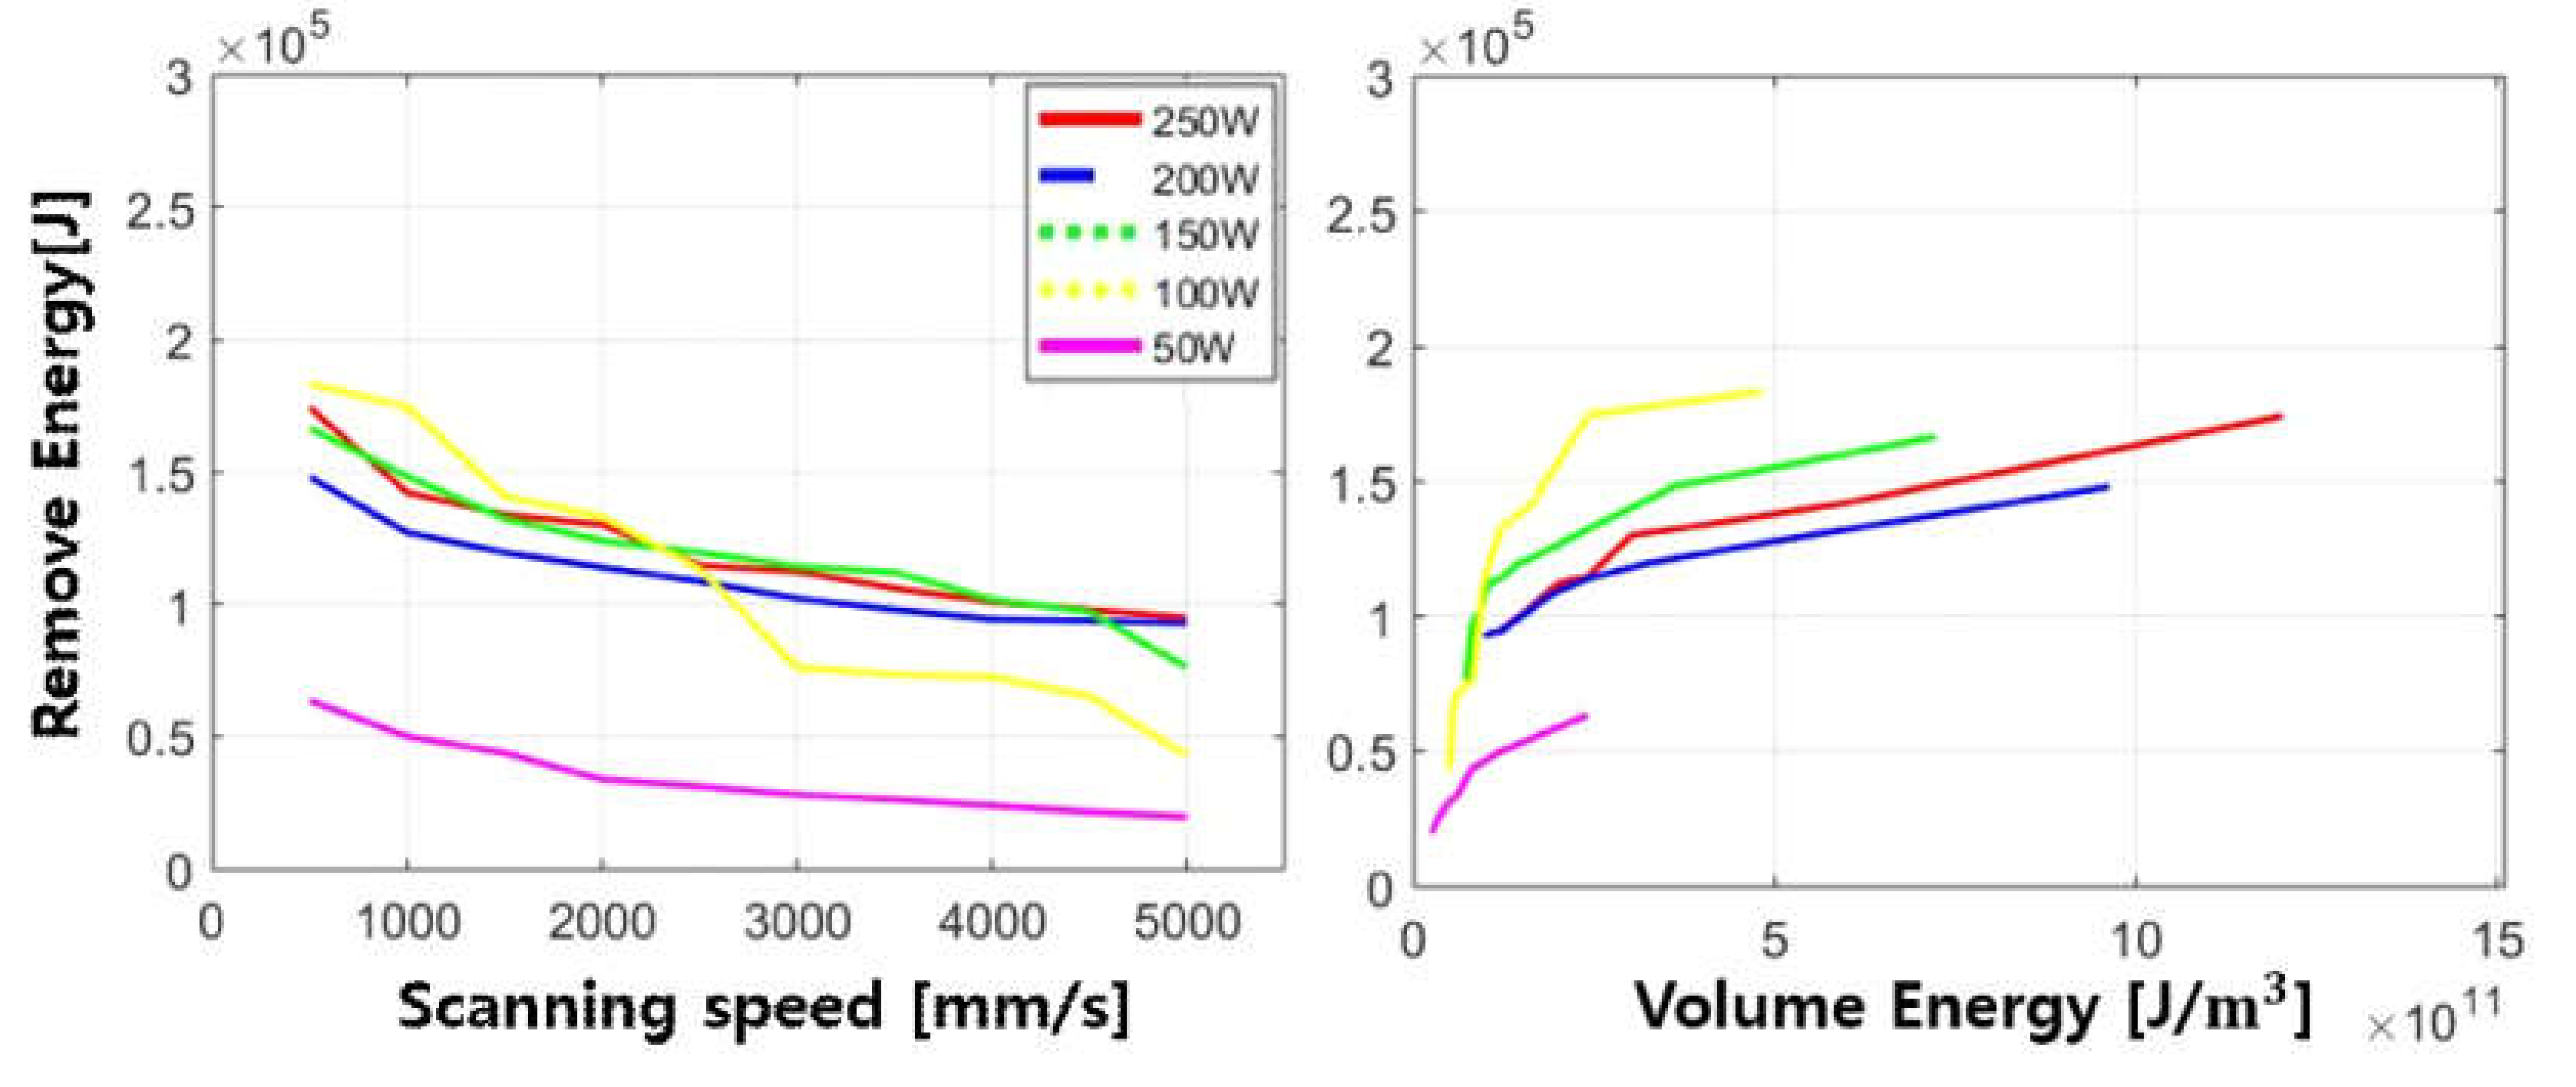
Figure 8 shows the average values of energy required to remove cathodes. This is obtained by Equation (5). Remove energy decreases exponentially as increasing scanning speed for all laser powers. Remove energy also decreases when the laser power decreases. In addition, remove energy logarithmically increases as the volume energy increases. Unlike the compressed cathode, the remove energy required for the uncompressed cathode depends on laser intensity and interaction time.
Figure 9 shows SEM images with the laser power of 250 W. Figure 9a is the top view and Figure 9b is the cross-section view. The melting width is not formed as shown in Figure 9a and it is invisible to all cut samples used in this study. Thus, no clearance width can be seen.
For the cathodes cut at the scanning speed of 500 mm/s to 2000 mm/s, the kerf width is not uniform as shown in Figure 9a. Likewise, from the scanning speed 500 mm/s to 2000 mm/s, the cross-section of the current collector was not a clean surface, because the current collector was re-solidified. Thus, excessive cutting is observed with the laser cutting of 500 mm/s to 2500 mm/s. At the scanning speed of 2500 mm/s, no delamination or aluminum beads were observed while the striation marks and spherical particles are observed. From the scanning speed of 3500 mm/s to 5000 mm/s, high-quality cut, or proper cutting, can be observed as shown in Figure 10. No delamination, no striation, and no aluminum beads were formed while the LiFePO4 in the formed of the spherical particle is still observed. This is similar to the results seen in the compressed cathode.
3.3. Comparison of Compressed and Uncompressed Cathode: Cutting Configuration, Cutting Region, Absorption Rate, Composition Change
To compare the compressed and uncompressed cathodes, we presented cutting configuration, cutting region, absorption rate, and composition change. Cutting configuration is obtained by observing the kerf and top widths. The cutting region is classified based on previous studies [13,14]. Absorption rate is measured from the wavelength of 200 nm to 2400 nm. Composition change is measured by SEM and EDX along with cross-section.
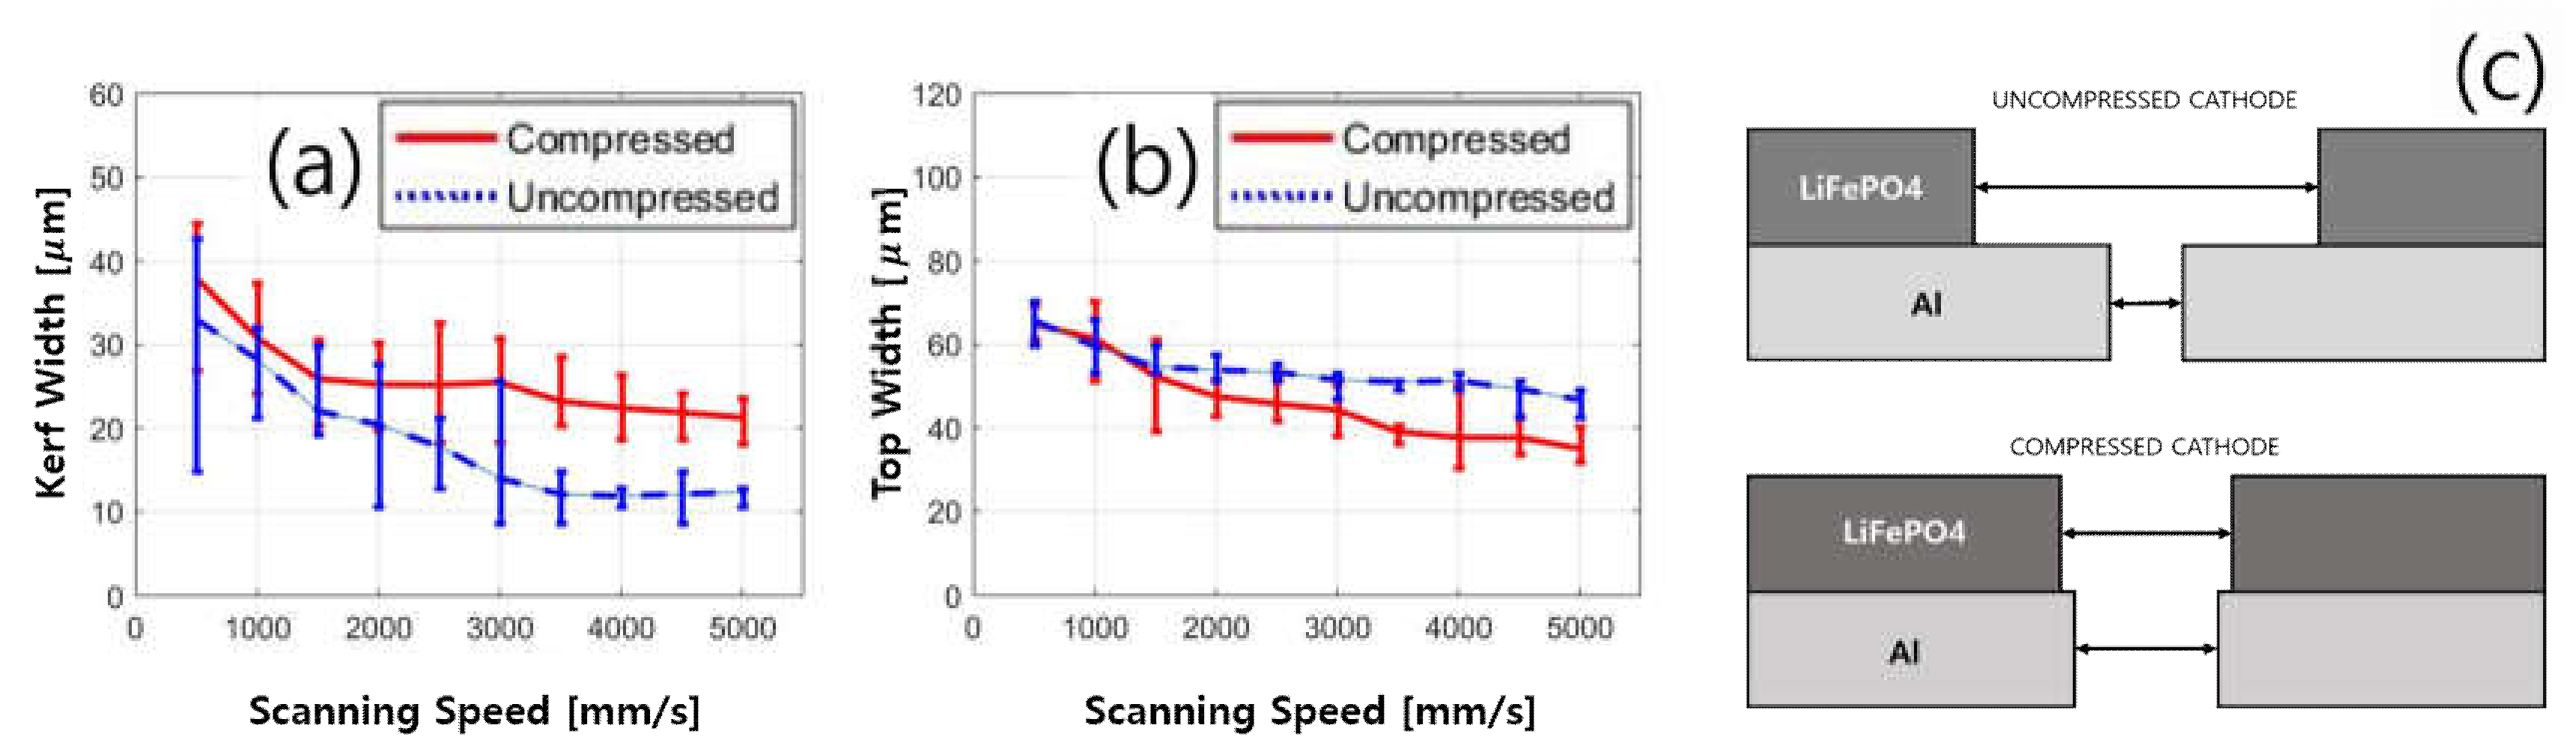
Figure 11a shows the comparison of kerf width between compressed and uncompressed cathodes with respect to scanning speed with the laser power of 250 W. The width of the laser power of 250 W is chosen because it clearly shows differences between compressed and uncompressed cathodes.
The kerf widths of the uncompressed cathode (blue) are narrower than those of compressed cathode. Figure 11b shows the comparison of the top widths with respect to the scanning speed. It is observed that the top widths of the compressed cathode (red) are narrower than the top widths of the uncompressed cathode. According to measured data of the kerf width and top width, a configuration of the cutting is shown in Figure 11c. The difference between the kerf width and top width of the compressed cathode is smaller than the difference between the kerf width and top width of the uncompressed cathode. When compressed, cathodes suffer deformation caused by the change in the average relative position of its atoms and molecules. LiFePO4 is contracted in volume by compression, and the total volume of the compressed LiFePO4 is decreased. Therefore, the density per unit volume of the compressed LiFePO4 is increased. Increasing density increases the energy required for material removal, as described in Equation (5). As a result, compressed cathodes require a higher volume of energy to remove the unit volume. Since higher energy is required for the compressed cathode to fully remove the LiFePO4 and higher density, the ratio of longitudinal heat transfer to transverse heat transfer for the compressed cathode is higher than the ratio for the uncompressed cathode. Therefore, a narrower top width and wider kerf width of the compressed cathode can be obtained. From the manufacturing perspective, the compressed cathode may provide more efficient laser cutting compared to the uncompressed cathode. From the battery performance perspective, the thickness and loading level of the cathode are the key factors to increase the energy of the battery. However, high loading level and increasing thickness can lead to power limitations and poor rate capability. To balance the performance, it is necessary to modify the formulation of slurry. For example to change the ratio of active materials, binder and conductive carbon materials help to improve the lithium-ion diffusion kinetics. Phase change during thermal driven laser cutting may lead to battery performance deterioration. The thermal driven laser cutting may melt the polymer binder. However, LiFePO4 and conductive carbon powder in the electrode do not undergo chemical modifications or phase change during laser cutting.
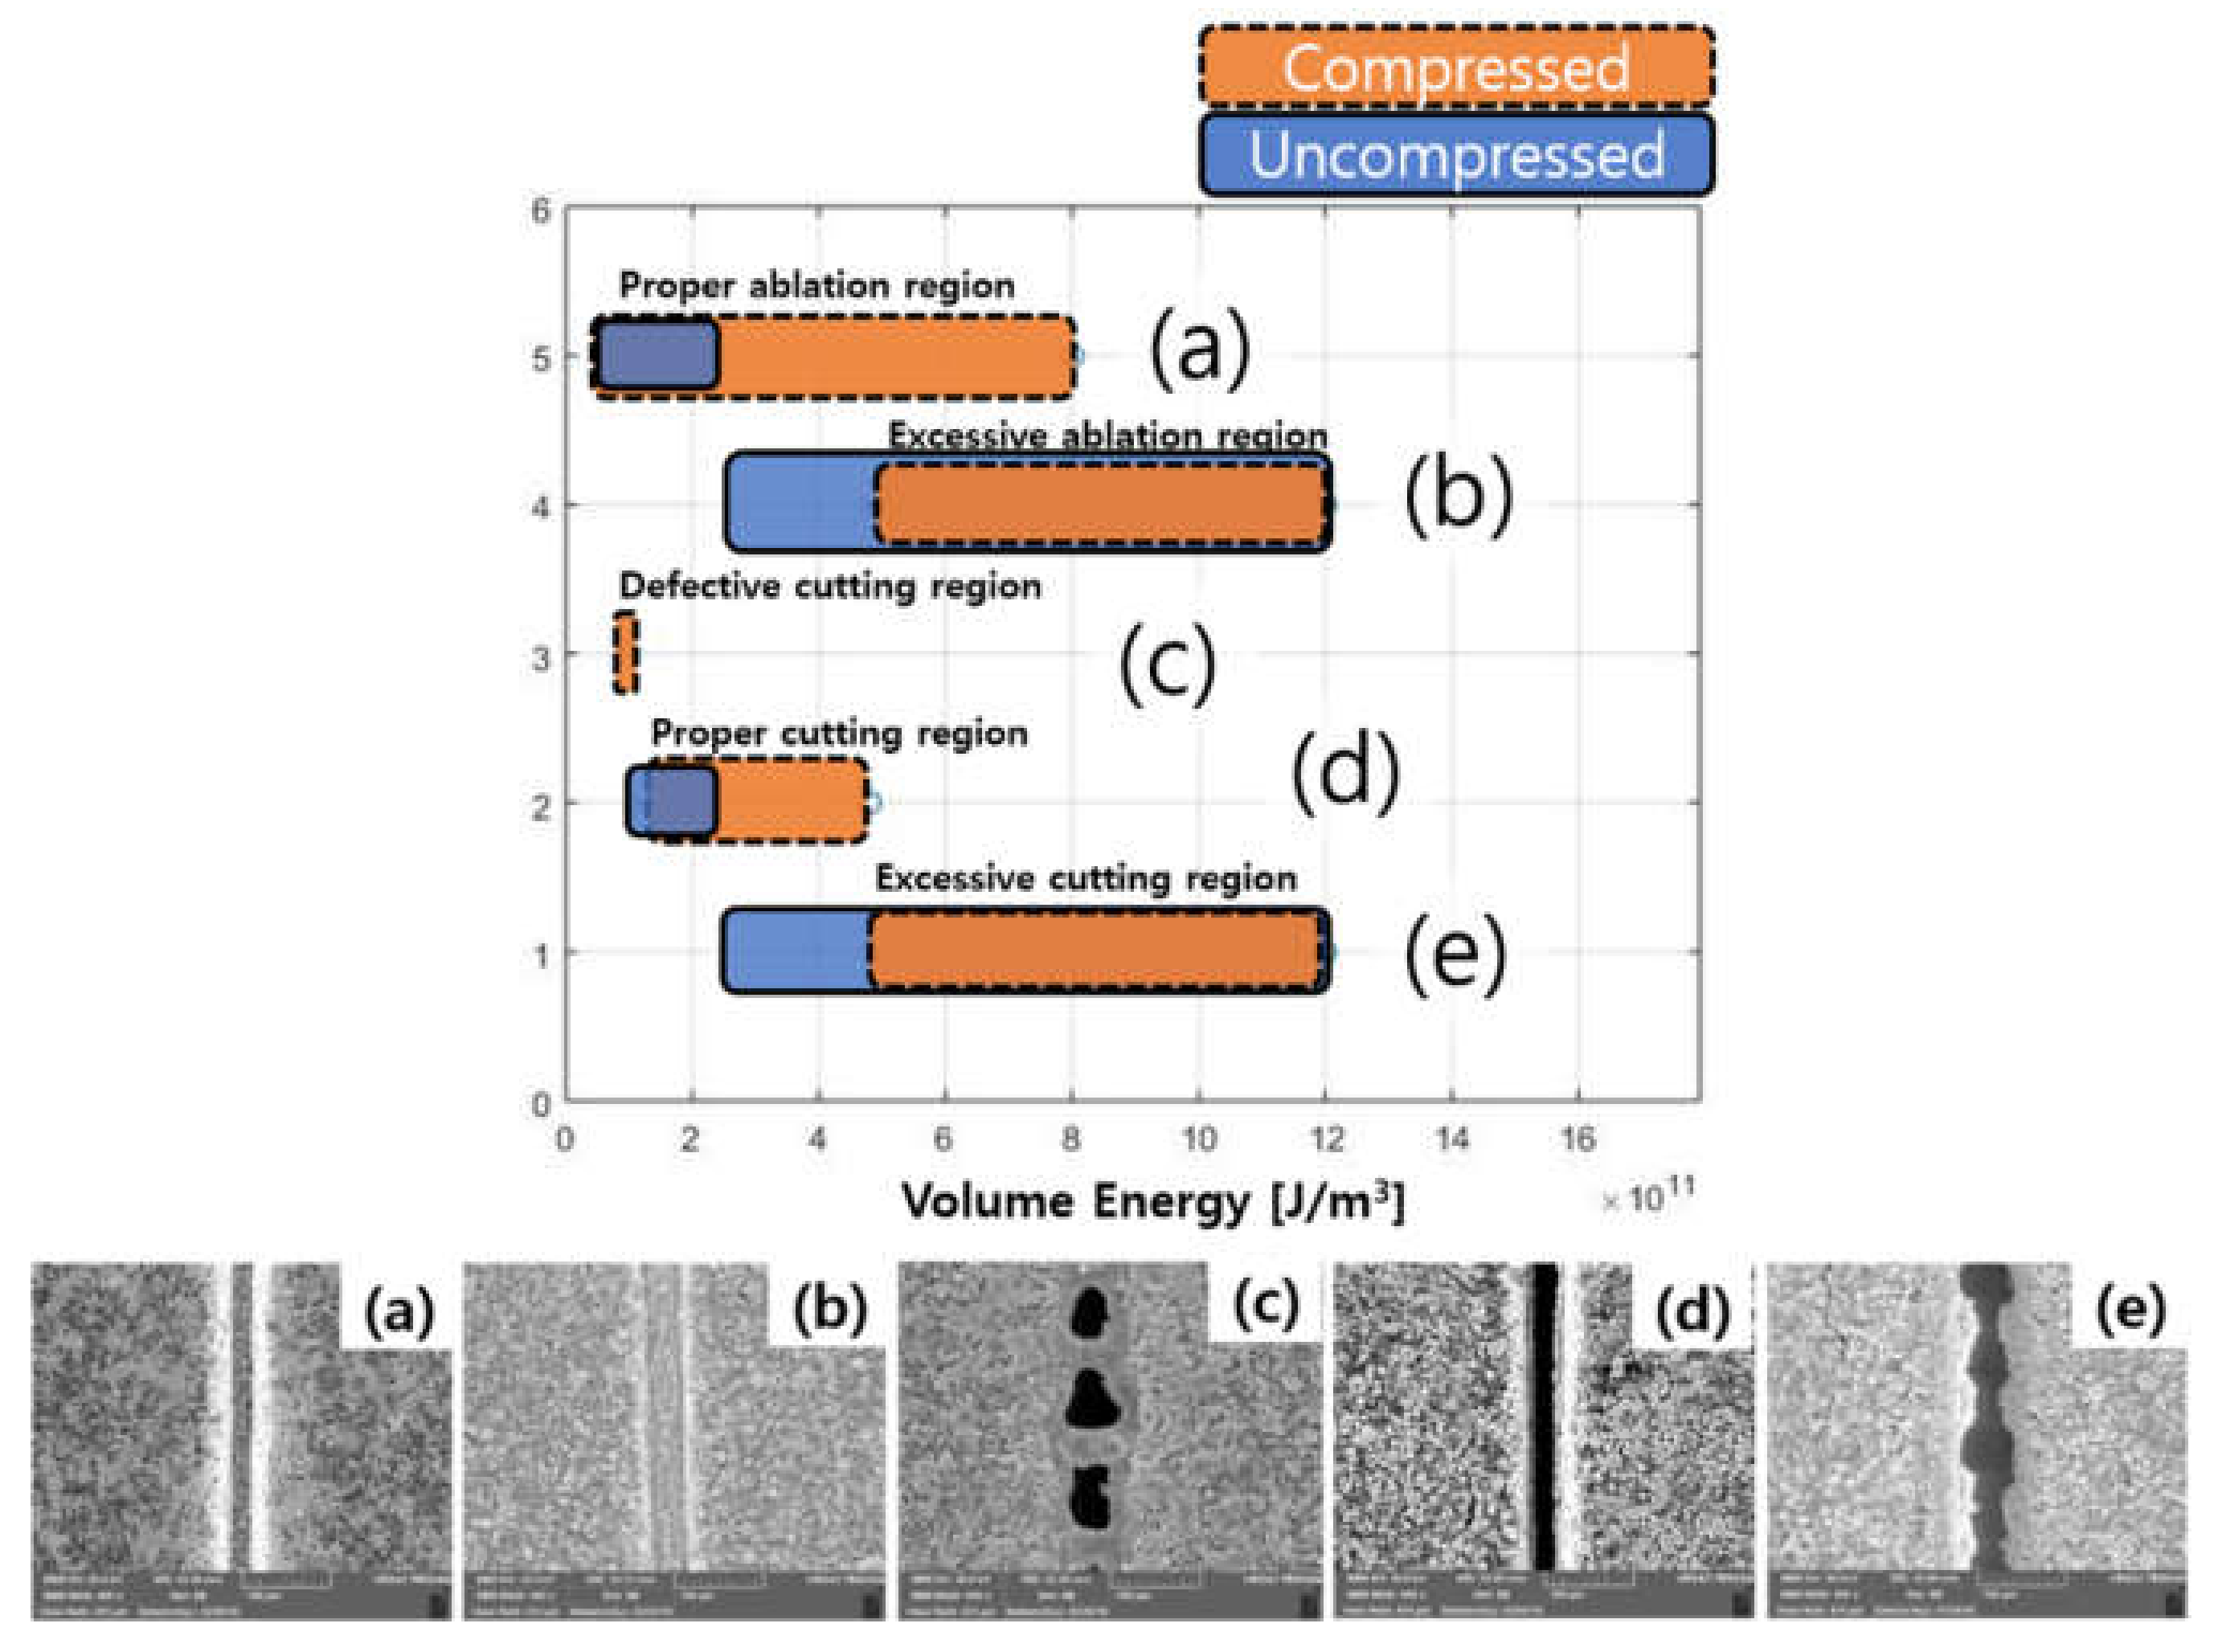
Cutting regions with the SEM images are shown in Figure 12. The observed SEM images are classified by five regions: (1) Proper ablation region, (2) Excessive ablation region, (3) Defective cutting region, (4) Proper cutting region, (5) Excessive cutting region. First, the proper ablation region (Figure 12a) is assigned when the active electrode material is completely removed from the target region without melting the current collector. Second, the excessive ablation region (Figure 12b) is assigned when the active electrode material is removed and the melting of the current collector is observed. Third, the defective cutting region (Figure 12c) is assigned when the active electrode material is completely removed and the current collector is partially penetrated or cut in the target region. Forth, the proper cutting region (Figure 12d) is assigned when the active electrode material and the current collector are uniformly removed. Finally, the excessive cutting region (Figure 12e) is assigned when the current collector is melted and re-solidified, so that the kerf width is not uniform. Moreover, delamination can be observed due to the high recoil pressure.
The classification and comparison in terms of the volume energy are shown in Figure 12 (top). The proper ablation region and the proper cutting region of the compressed cathode are wider than the uncompressed cathode. However, the excessive ablation region and the excessive cutting region of the uncompressed cathodes is wider than the compressed cathodes. According to this comparison, we can insist that the proper laser cutting of the compressed cathode can be obtained with wider volume energy. In addition, since the compressed cathode provides a wider range of volume energy for the proper ablation, the laser ablation of the compressed cathode is more easily applicable for the mass production to selectively remove or pattern [43,44] the active electrodes.
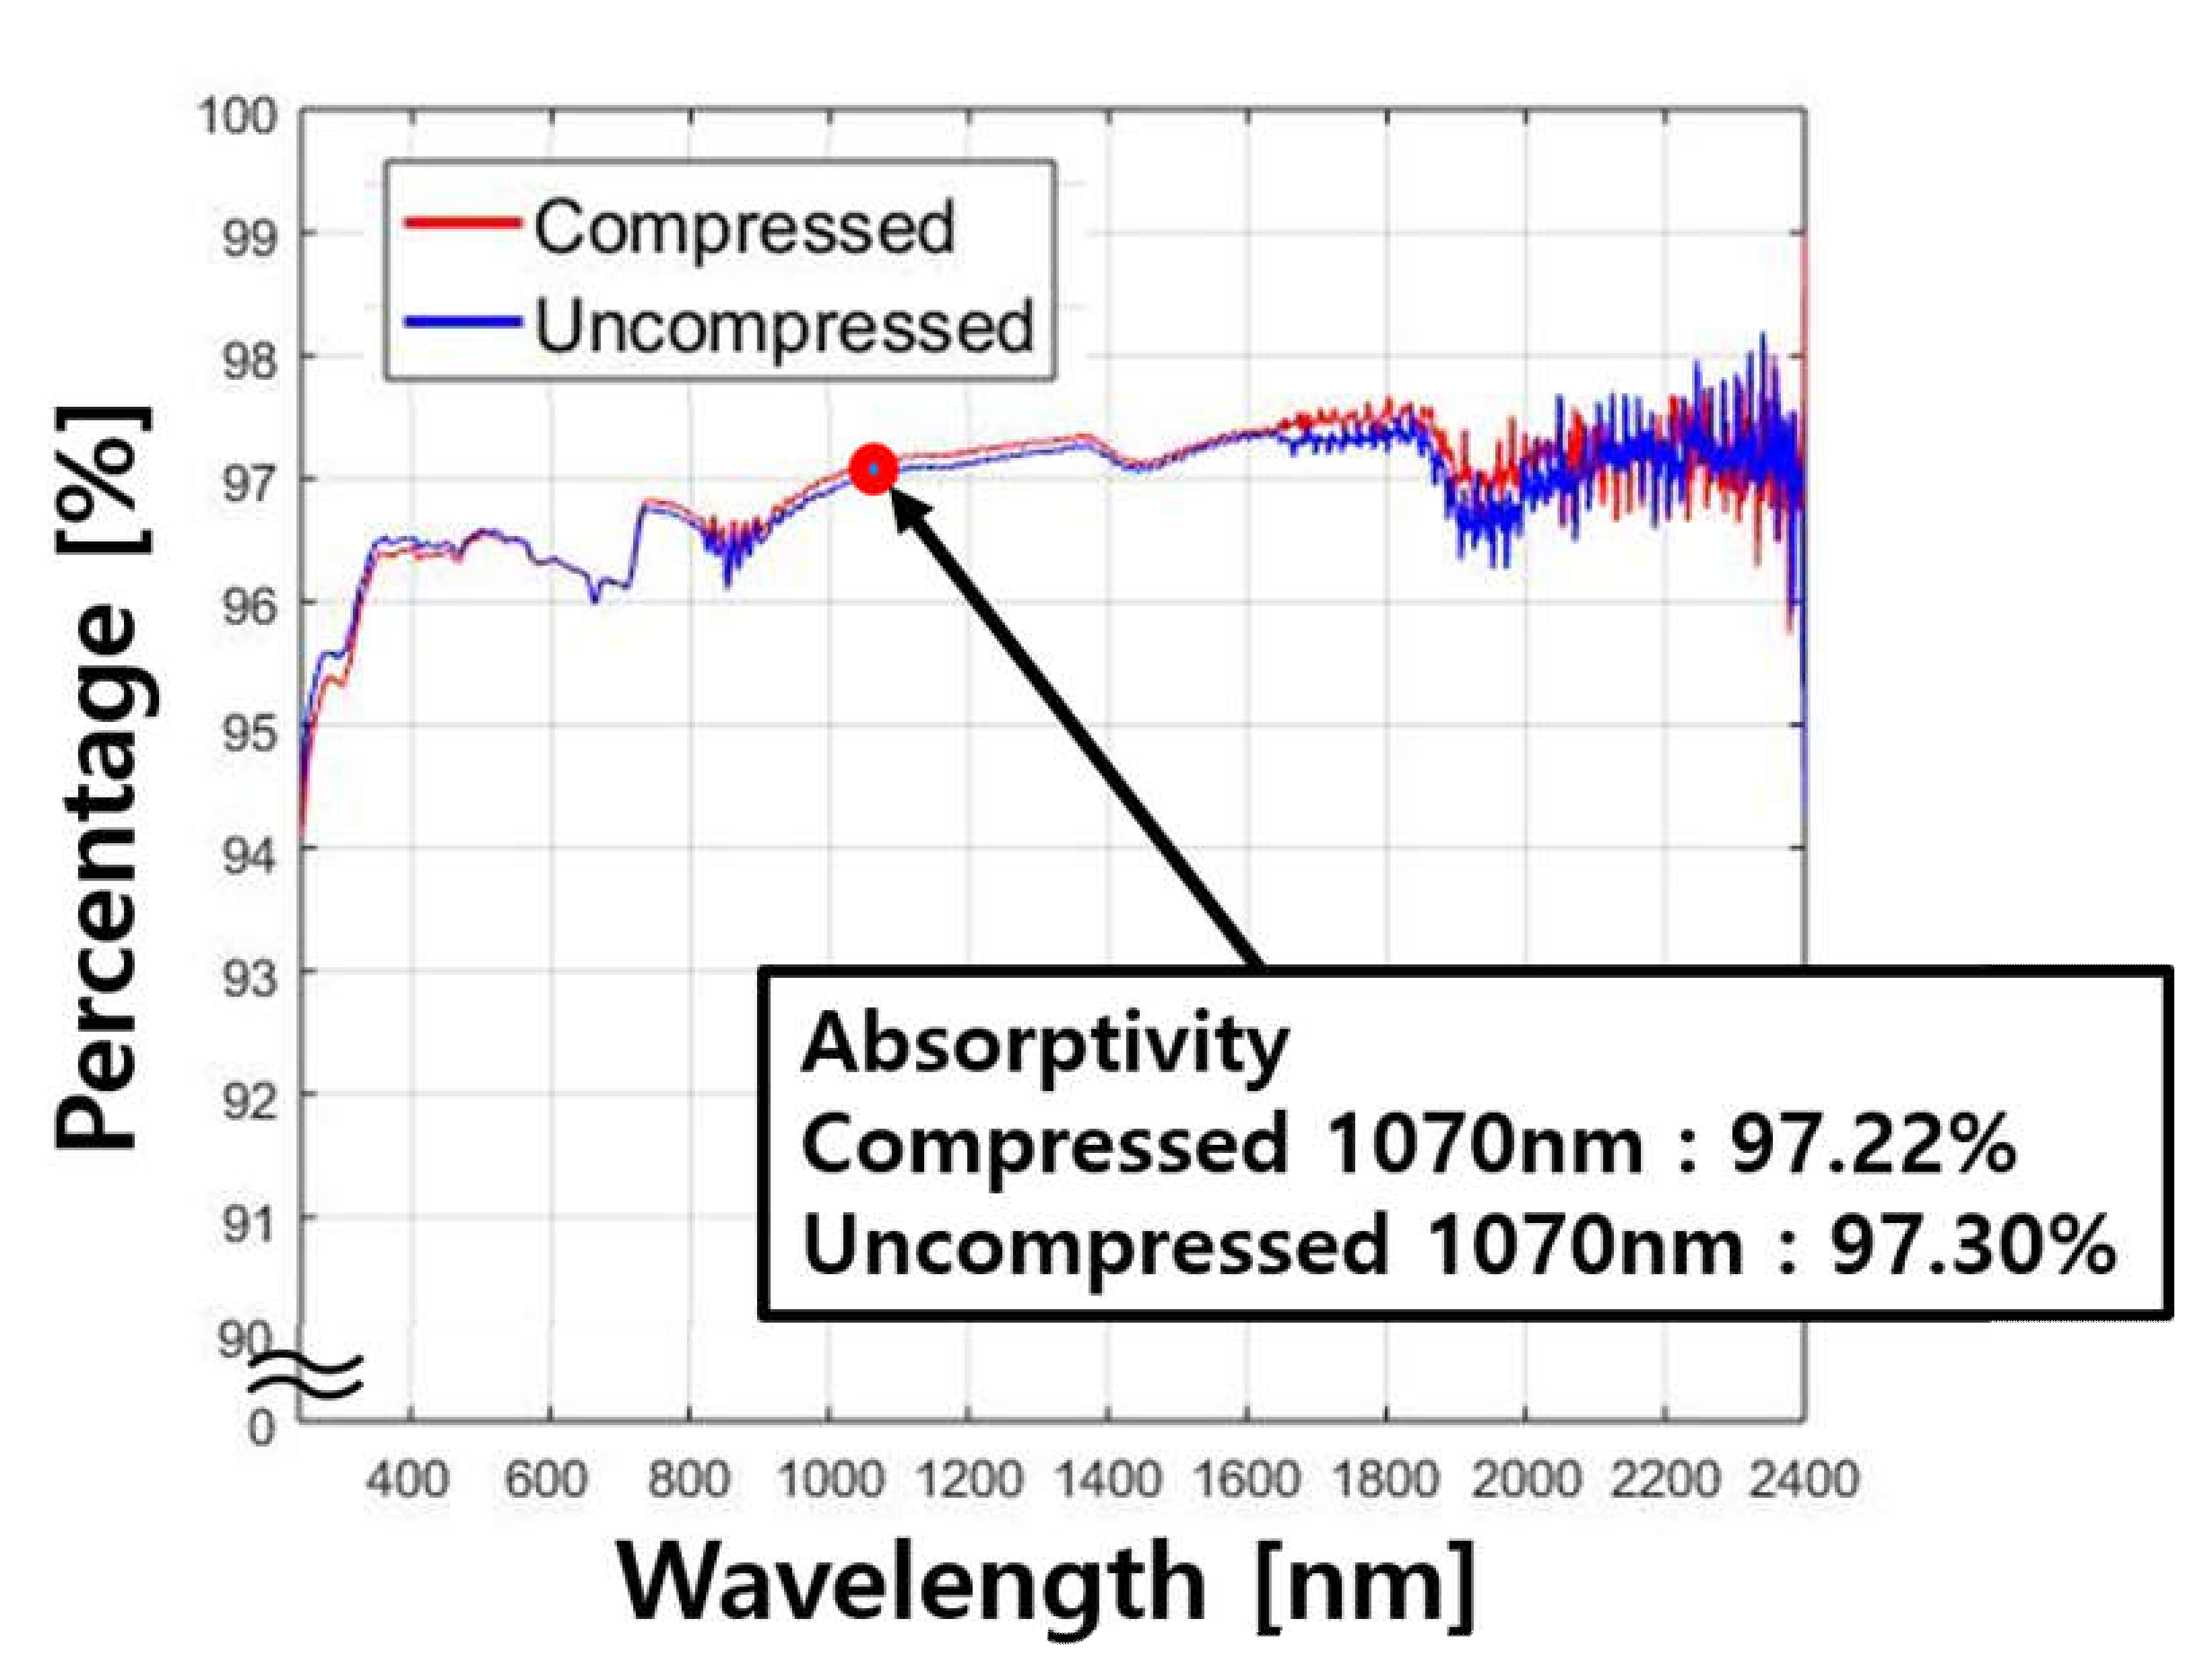
Figure 13 shows the comparison of absorption rate of the compressed and uncompressed cathodes. If the compressed and uncompressed cathodes had a difference in absorption, interaction characteristics and material removal mechanism may be affected by this and the difference should be considered for the analysis. Hence, the absorptivity of compressed and uncompressed cathodes is compared with the wavelength of 1070 nm. The compressed cathode has an absorptivity of 97.22% while the uncompressed cathode has an absorptivity of 97.30%. As a result, the difference of the absorption rate between compressed and uncompressed cathodes is 0.08%. The compression of cathode does not significantly affect the absorptivity of the cathode. Therefore, we can verify that the compression, or density change, of the active electrode material is the only factor to affect laser cutting characteristics.
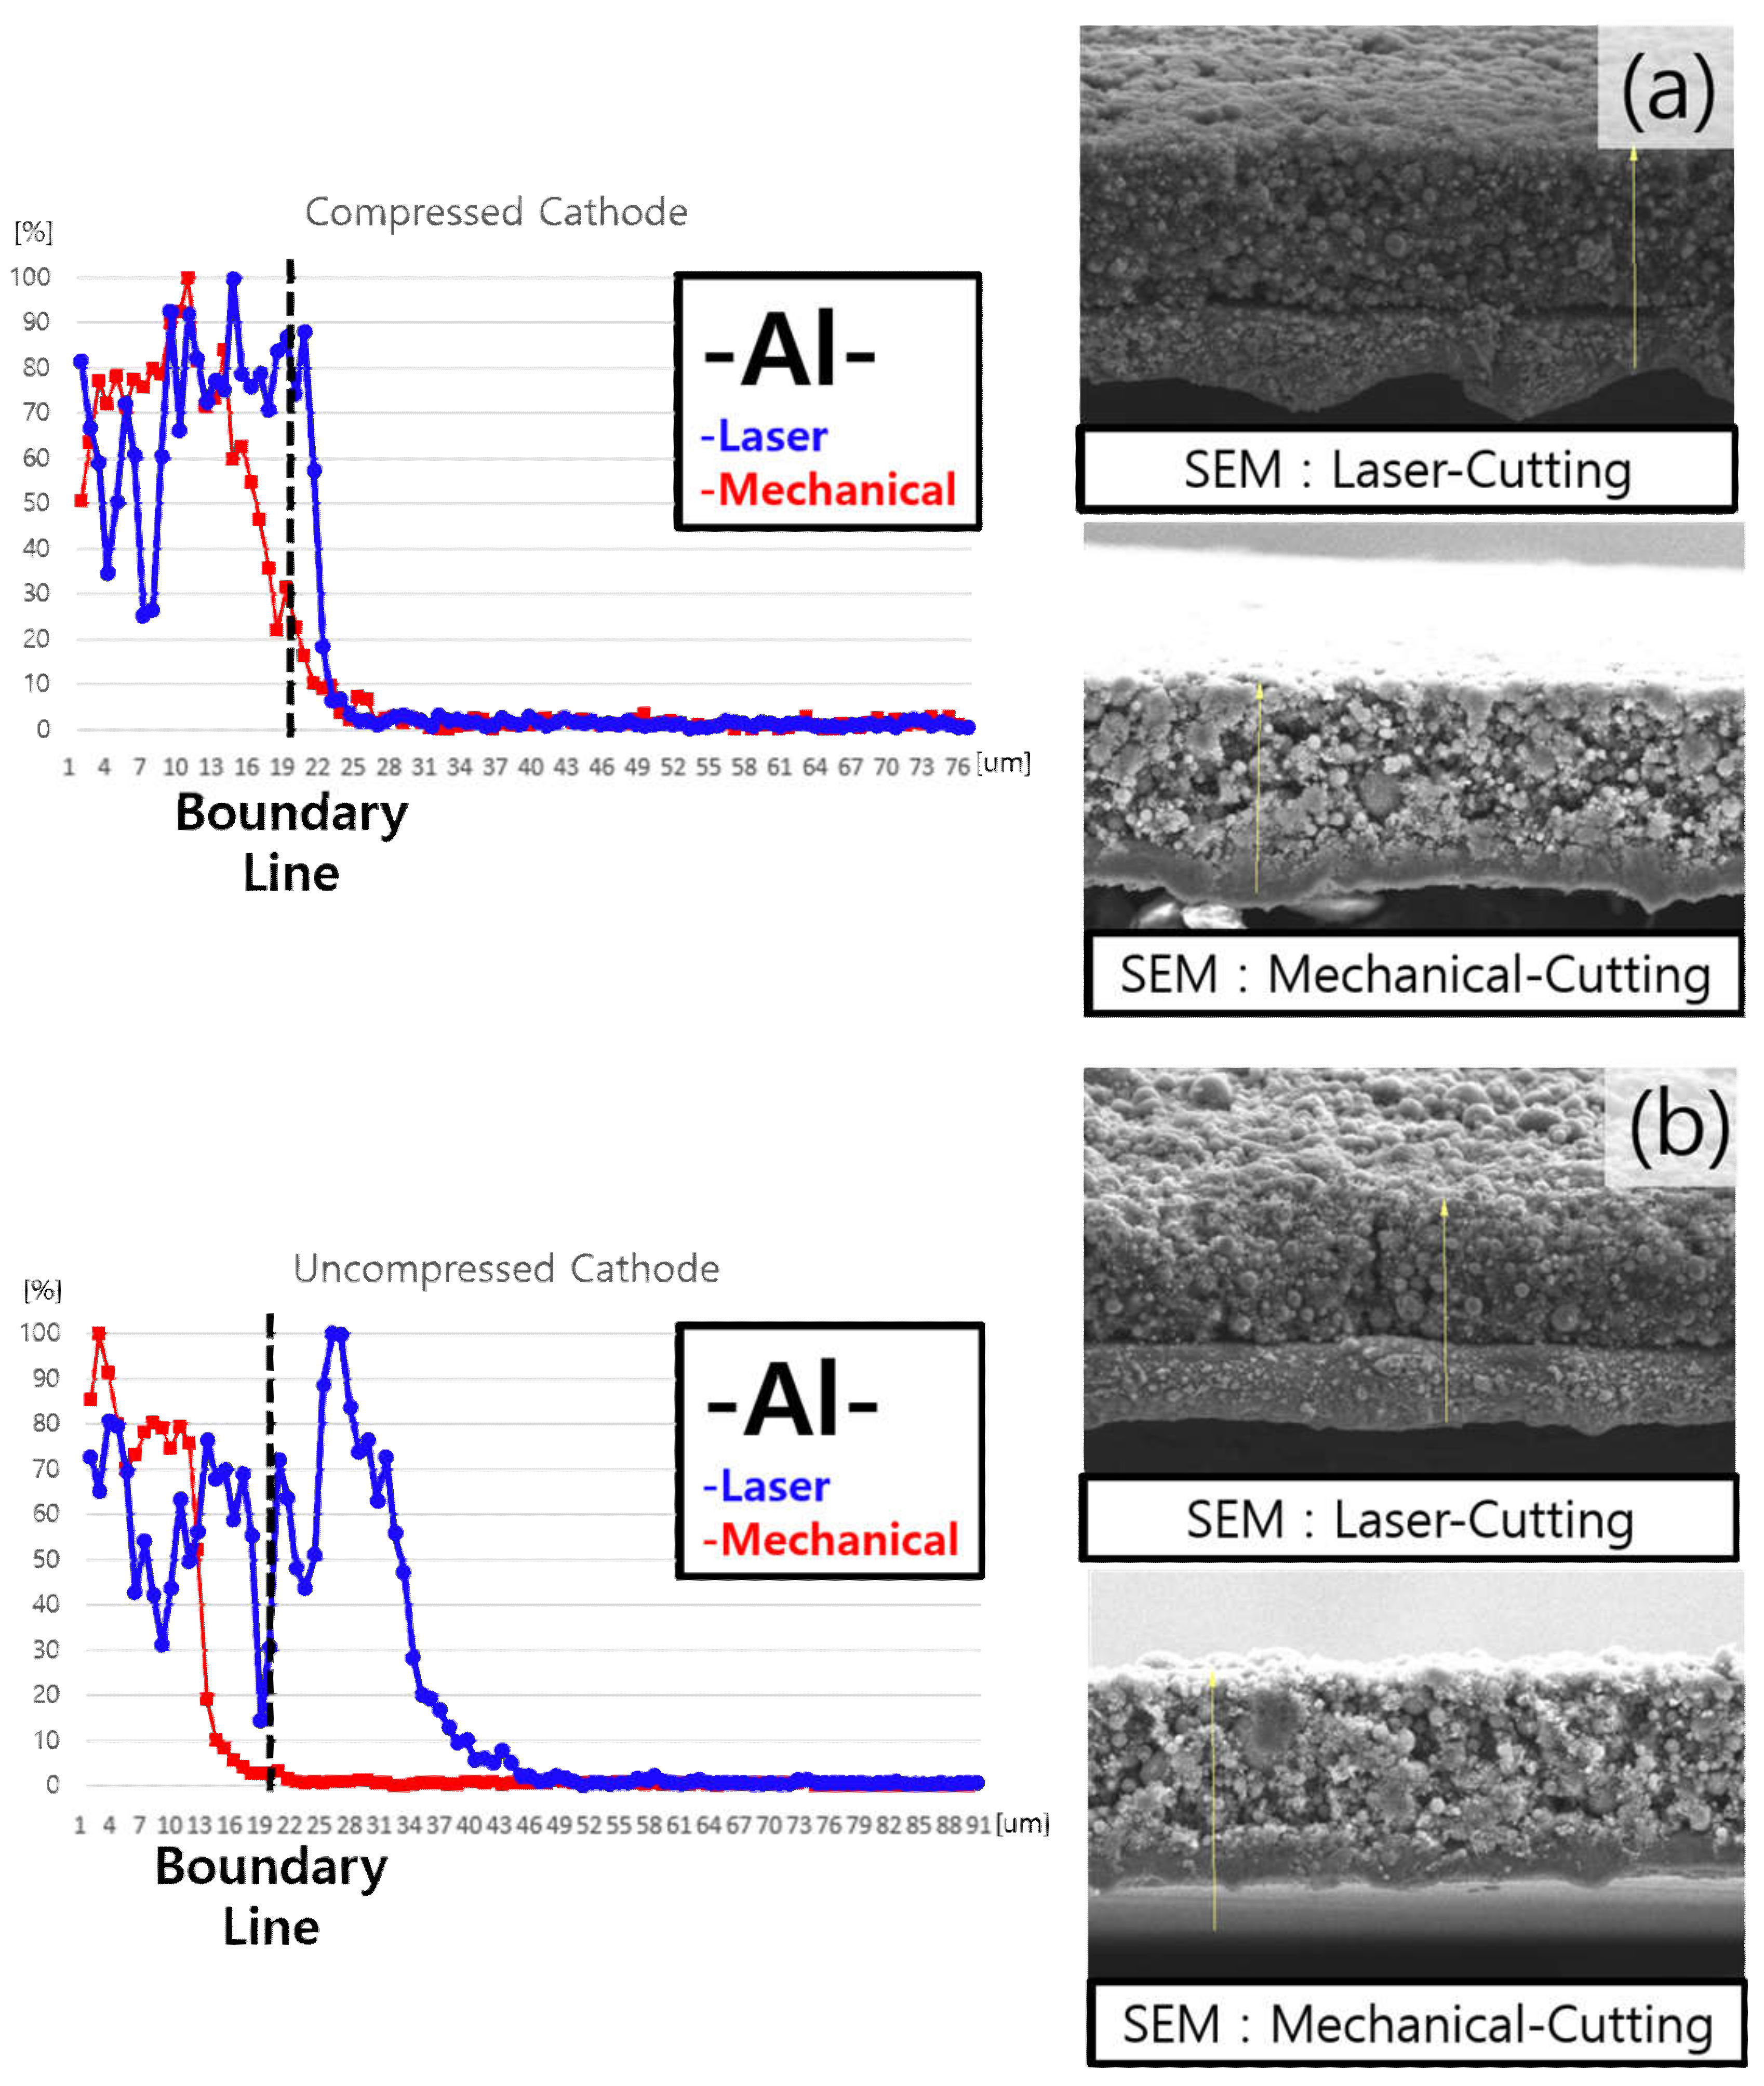
The EDX analysis of the cathode material is shown in Figure 14. Figure 14 clearly shows the aluminum composition in the cathode cross-section. The boundary line refers to the thickness (20 m) of the current collector. The composition is measured from the bottom of the current collector to the top of active electrode material. Figure 14a shows the cross-section of compressed cathodes. The cathodes are cut by laser (top) and by mechanical cutting (bottom). It is cut by two methods, or laser and mechanical cutting, not only to investigate the effect of compression, but also to compare traditional mechanical cutting. For the compressed cathodes, the mechanically cut cathode gradually decreases its aluminum content from the current collector area, but the aluminum content decreases dramatically at the boundary line in the laser-cut cathode. The laser cut of the uncompressed cathode shows a gradual decrease in the aluminum content, as shown in Figure 14b. The aluminum content of the laser-cut cathode starts to decrease with 10 m offset from the boundary line to the surface of the active electrode material. In the mechanical cutting, the aluminum content is gradually reduced before the boundary line, as is the case with the compressed cathode specimen.
The SEM images, as shown in Figure 14, also verify the EDX analysis that the cross-section of the mechanical cut is vague in the boundaries, while the laser cut cathode has a clearly defined current collector layer. From this observation, the active electrode material is crushed by the mechanical cutting. However, laser cutting shows a clear boundary between the active electrode material and current collector. In addition, the active electrode material is less contaminated by the current collector for compressed cathode.
4. Conclusions
While Lithium-Ion Batteries (LIB) are growing in popularity for many applications, research considering the effects of electrodes’ chemical, physical, and geometrical characteristics on the laser cutting remains rare. Hence, this study proposes the effect of compression of cathode on laser cutting for lithium-ion batteries and subsequently derives four main conclusions. First, increasing volume energy causes logarithmic increases in the kerf and top width for both compressed and uncompressed cathodes. Second, the differences between compressed and uncompressed cathodes after laser cutting are clear. The compressed cathode forms a wider kerf width than the uncompressed cathode under the same laser parameters. In addition, the top width of the uncompressed cathode is wider than the uncompressed cathode. Third, the compression has a favorable effect on uniform cutting and selective removal of active electrode materials, as well as widening the process window of the proper cutting and proper ablation. Finally, the compressed cathode shows a clear boundary between the active electrode and current collector. However, the active electrode region is contaminated by aluminum when the uncompressed cathode is used. In addition, the active electrode materials of both the compressed and uncompressed cathodes are crushed by mechanical cutting.
Author Contributions
D.L. and J.S. conceived and designed the experiments; D.L. and J.S. performed the experiments; D.L. and B.O. analyzed the data; D.L. and J.S. contributed reagents/materials/analysis tools; D.L., B.O., and J.S. wrote the paper.
Funding
The research described herein was sponsored by the National Research Foundation of Korea (NRF) grant funded by the Korean government (MSIP; Ministry of Science, ICT & Future Planning) (No. 2017R1C1B5017916). This work is also supported by the Government-funded Research Program (KK1702). The opinions expressed in this paper are those of the authors and do not necessarily reflect the views of the sponsors.
Conflicts of Interest
The authors declare no conflicts of interest.
References
- Giuli, G.; Eisenmann, T.; Bresser, D.; Trapananti, A.; Asenbauer, J.; Mueller, F.; Passerini, S. Structural and Electrochemical Characterization of Zn1−xFexO—Effect of Aliovalent Doping on the Li+ Storage Mechanism. Materials 2018, 11, 49. [Google Scholar] [CrossRef] [PubMed]
- Wang, Z.; Zhang, X.; Zhang, Y.; Li, M.; Qin, C.; Bakenov, Z. Chemical Dealloying Synthesis of CuS Nanowire-on-Nanoplate Network as Anode Materials for Li-Ion Batteries. Metals 2018, 8, 252. [Google Scholar] [CrossRef]
- Yuan, G.; Xiang, J.; Jin, H.; Wu, L.; Jin, Y.; Zhao, Y. Anchoring ZnO Nanoparticles in Nitrogen-Doped Graphene Sheets as a High-Performance Anode Material for Lithium-Ion Batteries. Materials 2018, 11, 96. [Google Scholar] [CrossRef] [PubMed]
- Suk, J.; Lee, Y.H.; Kim, D.Y.; Kim, D.W.; Cho, S.Y.; Kim, J.M.; Kang, Y. Semi-interpenetrating solid polymer electrolyte based on thiol-ene cross-linker for all-solid-state lithium batteries. J. Power Sources 2016, 334, 154–161. [Google Scholar] [CrossRef]
- Ding, Y.-L.; Wen, Y.; Wu, C.; van Aken, P.A.; Maier, J.; Yu, Y. 3D V6O13 Nanotextiles Assembled from Interconnected Nanogrooves as Cathode Materials for High-Energy Lithium Ion Batteries. Nano Lett. 2015, 15, 1388–1394. [Google Scholar] [CrossRef] [PubMed]
- Nitta, N.; Wu, F.; Lee, J.T.; Yushin, G. Li-ion battery materials: Present and future. Mater. Today 2015, 18, 252–264. [Google Scholar] [CrossRef]
- Suk, J.; Kim, D.Y.; Kim, D.W.; Kang, Y. Electrodeposited 3D porous silicon/copper films with excellent stability and high rate performance for lithium-ion batteries. J. Mater. Chem. A 2014, 2, 2478–2481. [Google Scholar] [CrossRef]
- Chen, J. Recent Progress in Advanced Materials for Lithium Ion Batteries. Materials 2013, 6, 156–183. [Google Scholar] [CrossRef] [PubMed] [Green Version]
- Ogihara, T.; Kodera, T. Synthesis of Li2Ti3O7 Anode Materials by Ultrasonic Spray Pyrolysis and Their Electrochemical Properties. Materials 2013, 6, 2285–2294. [Google Scholar] [CrossRef] [PubMed]
- Jo, M.; Yoo, H.; Jung, Y.S.; Cho, J. Carbon-coated nanoclustered LiMn0.71Fe0.29PO4 cathode for lithium-ion batteries. J. Power Sources 2012, 216, 162–168. [Google Scholar] [CrossRef]
- Lee, D.; Mazumder, J. Dataset demonstrating effects of momentum transfer on sizing of current collector for lithium-ion batteries during laser cutting. Data Brief 2018, 17, 6–14. [Google Scholar] [CrossRef] [PubMed]
- Lee, D.; Mazumder, J. Effects of momentum transfer on sizing of current collectors for lithium-ion batteries during laser cutting. Opt. Laser Technol. 2018, 99, 315–325. [Google Scholar] [CrossRef]
- Lee, D. Investigation of Physical Phenomena and Cutting Efficiency for Laser Cutting on Anode for Li-Ion Batteries. Appl. Sci. 2018, 8, 266. [Google Scholar] [CrossRef]
- Lee, D.; Ahn, S. Investigation of Laser Cutting Width of LiCoO2 Coated Aluminum for Lithium-Ion Batteries. Appl. Sci. 2017, 7, 914. [Google Scholar] [CrossRef]
- Lee, D.; Patwa, R.; Herfurth, H.; Mazumder, J. Parameter optimization for high speed remote laser cutting of electrodes for lithium-ion batteries. J. Laser Appl. 2016, 28, 022006. [Google Scholar] [CrossRef]
- Lee, D.; Patwa, R.; Herfurth, H.; Mazumder, J. Three dimensional simulation of high speed remote laser cutting of cathode for lithium-ion batteries. J. Laser Appl. 2016, 28, 032010. [Google Scholar] [CrossRef]
- Lee, D.; Patwa, R.; Herfurth, H.; Mazumder, J. High speed remote laser cutting of electrodes for lithium-ion batteries: Anode. J. Power Sources 2013, 240, 368–380. [Google Scholar] [CrossRef]
- Lee, D.; Patwa, R.; Herfurth, H.; Mazumder, J. Computational and experimental studies of laser cutting of the current collectors for lithium-ion batteries. J. Power Sources 2012, 210, 327–338. [Google Scholar] [CrossRef]
- Kronthaler, M.R.; Schloegl, F.; Kurfer, J.; Wiedenmann, R.; Zaeh, M.F.; Reinhart, G. Laser Cutting in the Production of Lithium Ion Cells. Phys. Procedia 2012, 39, 213–224. [Google Scholar] [CrossRef] [Green Version]
- Lee, D.; Seo, Y.; Pyo, S. Effect of Laser Speed on Cutting Characteristics of Cement-Based Materials. Materials 2018, 11, 1055. [Google Scholar] [CrossRef]
- Lee, D. Experimental Investigation of Laser Ablation Characteristics on Nickel-Coated Beryllium Copper. Metals 2018, 8, 211. [Google Scholar] [CrossRef]
- Lee, D.; Pyo, S. Experimental Investigation of Multi-mode Fiber Laser Cutting of Cement Mortar. Materials 2018, 11, 278. [Google Scholar] [CrossRef] [PubMed]
- Lee, D. Investigation of Laser Ablation on Acrylonitrile Butadiene Styrene Plastic Used for 3D Printing. J. KWJS 2018, 36, 50–56. [Google Scholar]
- Lee, D. Picosecond IR Pulsed Laser Drilling of Copper-Coated Glass/Epoxy Composite. IEEE Trans. Compon. Packag. Manuf. Technol. 2017, 7, 2066–2072. [Google Scholar] [CrossRef]
- Lee, D.; Cho, J.; Kim, C.H.; Lee, S.H. Application of laser spot cutting on spring contact probe for semiconductor package inspection. Opt. Laser Technol. 2017, 97, 90–96. [Google Scholar] [CrossRef]
- Lee, D. Experimental Investigation of Laser Spot Welding of Ni and Au-Sn-Ni Alloy. J. Weld. Join. 2017, 35, 1–5. [Google Scholar] [CrossRef]
- Lee, D.; Mazumder, J. Effects of laser beam spatial distribution on laser-material interaction. J. Laser Appl. 2016, 28, 032003. [Google Scholar] [CrossRef]
- Lee, D. Modeling of High Speed Remote Laser Cutting for Lithium-Ion Batteries; Scholar’s Press: Riga, Latvia, 2016. [Google Scholar]
- Lee, D.; Bae, K.M.; Suk, J. Experimental Study of Laser Cutting on Uncompressed 40 μm-thick Anode for Lithium-Ion Batteries. Opt. Laser Technol. 2018. under review. [Google Scholar]
- Lutey, A.H.A.; Fortunato, A.; Carmignato, S.; Fiorini, M. High speed pulsed laser cutting of LiCoO2 Li-ion battery electrodes. Opt. Laser Technol. 2017, 94, 90–96. [Google Scholar] [CrossRef]
- Spena, P.R. CO2 Laser Cutting of Hot Stamping Boron Steel Sheets. Metals 2017, 7, 456. [Google Scholar] [CrossRef]
- Rodrigues, G.C.; Duflou, J.R. Into polarization control in laser cutting with direct diode lasers. J. Laser Appl. 2016, 28, 022207. [Google Scholar] [CrossRef]
- Daniel, C.; Ostendorf, S.; Hallmann, S.; Emmelmann, C. Picosecond laser processing of polycrystalline cubic boron nitride—A method to examine the ablation behavior of a high cubic boron nitride content grade material. J. Laser Appl. 2016, 28, 012001. [Google Scholar] [CrossRef]
- Demir, A.G.; Previtali, B. Dross-free submerged laser cutting of AZ31 Mg alloy for biodegradable stents. J. Laser Appl. 2016, 28, 032001. [Google Scholar] [CrossRef]
- Herzog, D.; Schmidt-Lehr, M.; Oberlander, M.; Canisius, M.; Radek, M.; Emmelmann, C. Laser cutting of carbon fibre reinforced plastics of high thickness. Mater. Des. 2016, 92, 742–749. [Google Scholar] [CrossRef]
- Hilton, P.A.; Lloyd, D.; Tyrer, J.R. Use of a diffractive optic for high power laser cutting. J. Laser Appl. 2016, 28, 012014. [Google Scholar] [CrossRef] [Green Version]
- Ghavidel, A.K.; Navidfar, A.; Shabgard, M.; Azdast, T. Role of CO2 laser cutting conditions on anisotropic properties of nanocomposite contain carbon nanotubes. J. Laser Appl. 2016, 28, 032006. [Google Scholar] [CrossRef]
- Kim, D.-H.; Lee, C.-M. A study on the laser-assisted ball-end milling of difficult-to-cut materials using a new back-and-forth preheating method. Int. J. Adv. Manuf. Technol. 2016, 85, 1825–1834. [Google Scholar] [CrossRef]
- Lutey, A.H.A.; Fortunato, A.; Ascari, A.; Carmignato, S.; Leone, C. Laser cutting of lithium iron phosphate battery electrodes: Characterization of process efficiency and quality. Opt. Laser Technol. 2015, 65, 164–174. [Google Scholar] [CrossRef]
- Luetke, M.; Franke, V.; Techel, A.; Himmer, T.; Klotzbach, U.; Wetzig, A.; Beyer, E. A Comparative Study on Cutting Electrodes for Batteries with Lasers. Phys. Procedia 2011, 12 Pt 2, 286–291. [Google Scholar] [CrossRef] [Green Version]
- Reincke, T.; Kreling, S.; Dilger, K. The influences of pulse overlap on cut quality during fiber laser cutting of electrodes for Lithium-ion batteries. In Proceedings of the Lasers in Manufacturing Conference, Berlin, Germany, 22–25 June 2015; pp. 22–25. [Google Scholar]
- Jansen, T.; Blass, D.; Hartwig, S.; Dilger, K. Processing of Advanced Battery Materials—Laser Cutting of Pure Lithium Metal Foils. Batteries 2018, 4, 37. [Google Scholar] [CrossRef]
- Hirokazu, M.; Kazuomi, Y.; Kiyoshi, K. Fabrication of 3D patterned electrodes for micro lithium-ion batteries. IOP Conf. Ser. 2011, 18, 122007. [Google Scholar] [Green Version]
- Choi, S.; Lee, J.-I.; Park, S. Patterning of electrodes for mechanically robust and bendable lithium-ion batteries. J. Mater. Chem. 2012, 22, 22366–22369. [Google Scholar] [CrossRef]
Figure 1.
Cathode sample and Experimental set-up.

Figure 2.
Definition of areas for cutting efficiency.

Figure 3.
Comparison of (a) kerf width and (b) top width of the compressed cathode.

Figure 4.
Comparison of removal energy for the compressed cathode.

Figure 5.
SEM images of compressed cathode with the laser power of 250 W: (a) Top view, (b) Cross-section.
Figure 5.
SEM images of compressed cathode with the laser power of 250 W: (a) Top view, (b) Cross-section.

Figure 6.
The cross-section of the compressed cathode with the scanning speed of 2000 mm/s.

Figure 7.
Comparison of (a) kerf width and (b) top width of the uncompressed cathode.

Figure 8.
Comparison of removal energy for the uncompressed cathode.

Figure 9.
SEM images of uncompressed cathode with the laser power of 250 W, (a) Top view (b) Cross-section.
Figure 9.
SEM images of uncompressed cathode with the laser power of 250 W, (a) Top view (b) Cross-section.

Figure 10.
The cross-section of the uncompressed cathode with the scanning speed of 4000 mm/s.

Figure 11.
Comparison of (a) Kerf width, (b) Top width, and (c) Cutting configuration with the laser power of 250 W.
Figure 11.
Comparison of (a) Kerf width, (b) Top width, and (c) Cutting configuration with the laser power of 250 W.

Figure 12.
Category and volume energy of cutting region depending on five physical phenomena. (a) Proper ablation region; (b) Excessive ablation region; (c) Defective cutting region; (d) Proper cutting region; (e) Excessive cutting region.
Figure 12.
Category and volume energy of cutting region depending on five physical phenomena. (a) Proper ablation region; (b) Excessive ablation region; (c) Defective cutting region; (d) Proper cutting region; (e) Excessive cutting region.

Figure 13.
Compressed and Uncompressed cathodes’ absorption rate.

Figure 14.
Comparison of composition changes for laser and mechanical cut of (a) compressed cathodes (P = 250 W, v = 1000 mm/s) and (b) uncompressed cathodes (P = 250 W, v = 1000 mm/s).
Figure 14.
Comparison of composition changes for laser and mechanical cut of (a) compressed cathodes (P = 250 W, v = 1000 mm/s) and (b) uncompressed cathodes (P = 250 W, v = 1000 mm/s).


Table 1.
Laser power, speed, and volume energy used for the experiments.
| # | Power (W) | Speed (mm/s) | Volume Energy (J/m3) |
|---|---|---|---|
| 50, 100, 150, 200, 250 | 500, 1000, 1500, 2000, 2500, 3000, 3500, 4000, 4500, 5000 | 4.348 × 10⁵~2.174 × 10⁷ |
Table 2.
Material information of cathode.
| Category | Cathode Information |
|---|---|
| Structure | One-side sandwich |
| Active electrode Material | LiFePO4 |
| Active electrode Thickness (Uncompressed) | 70 [m] |
| Active electrode Thickness (Compressed) | 70 [m] → 56 [m] |
| Binder | Polyvinylidene fluoride |
| Conducting agent | SuperC65 |
| Solution | N-Menthy-2pyrrolidone |
| Current Collector Material | Aluminum |
| Current Collector Thickness | 20 [m] |
Table 3.
Material Properties of Fe, P, Li, O, and LiFePO4.
| Property | Fe | P | Li | O | LiFePO4 |
|---|---|---|---|---|---|
| Melting temperature | 1809.15 (K) | 317.3 (K) | 453.85 (K) | 54.36 (K) | 744.745 (K) |
| Normal boiling temperature | 3134.15 (K) | 553.65 (K) | 1609.15 (K) | 90.20 (K) | 1325.56 (K) |
| Critical point temperature | 8500 (K) | 994(K) | 3223 (K) | 154.59 (K) | 3408.62 (K) |
| Liquid density | 2986.5 (kg/m3) | 740 (kg/m3) | 512.5 (kg/m3) | 1141 (kg/m3) | 1687.91 (kg/m3) |
| Solid density | 7800 (kg/m3) | 1820 (kg/m3) | 533.4 (kg/m3) | 1535 (kg/m3) | 3764.65 (kg/m3) |
| Latent heat of vaporization | 247,000 (J/kg) | 21,200 (J/kg) | 22.73 × 10⁶ (J/kg) | 0.2131 × 10⁶ (J/kg) | 3.379 × 10⁶ (J/kg) |
| Latent heat of fusion | 6,260,000 (J/kg) | 392,000 (J/kg) | 0.4339 × 10⁶ (J/kg) | 13.88 × 10³ (J/kg) | 116,362 (J/kg) |
| Liquid constant-pressure specific heat | 1642.35 (J/kgK) | 2542.41 (J/kgK) | 4225.8 (J/kgK) | 1675.062 (J/kgK) | 1946 (J/kgK) |
| Solid constant-pressure specific heat | 460.548 (J/kgK) | 770 (J/kgK) | 3514.6 (J/kgK) | 125.0046 (J/kgK) | 519.56 (J/kgK) |
| Atomic weight | 55.845 (g/mol) | 30.97(g/mol) | 6.941 (g/mol) | 31.9988 (g/mol) | 157.757 (g/mol) |
© 2019 by the authors. Licensee MDPI, Basel, Switzerland. This article is an open access article distributed under the terms and conditions of the Creative Commons Attribution (CC BY) license (http://creativecommons.org/licenses/by/4.0/).
Share and Cite
MDPI and ACS Style
Lee, D.; Oh, B.; Suk, J. The Effect of Compactness on Laser Cutting of Cathode for Lithium-Ion Batteries Using Continuous Fiber Laser. Appl. Sci. 2019, 9, 205. https://0-doi-org.brum.beds.ac.uk/10.3390/app9010205
AMA Style
Lee D, Oh B, Suk J. The Effect of Compactness on Laser Cutting of Cathode for Lithium-Ion Batteries Using Continuous Fiber Laser. Applied Sciences. 2019; 9(1):205. https://0-doi-org.brum.beds.ac.uk/10.3390/app9010205
Chicago/Turabian StyleLee, Dongkyoung, Byungmoon Oh, and Jungdon Suk. 2019. "The Effect of Compactness on Laser Cutting of Cathode for Lithium-Ion Batteries Using Continuous Fiber Laser" Applied Sciences 9, no. 1: 205. https://0-doi-org.brum.beds.ac.uk/10.3390/app9010205
Note that from the first issue of 2016, this journal uses article numbers instead of page numbers. See further details here.