Article

Identification of Risk Factors for Lameness Detection with Help of Biosensors

by
Ramūnas Antanaitis
1,*,
Vida Juozaitienė
2,*,
Gediminas Urbonavičius
3,
Dovilė Malašauskienė
1,
Mindaugas Televičius
1,
Mingaudas Urbutis
1,
Karina Džermeikaitė
1 and
Walter Baumgartner
4
1
Large Animal Clinic, Veterinary Academy, Lithuanian University of Health Sciences, Tilžės Street 18, LT-47181 Kaunas, Lithuania
2
Department of Biology, Faculty of Natural Sciences, Vytautas Magnus University, K. Donelaičio 58, LT-44248 Kaunas, Lithuania
3
Department of Animal Breeding, Veterinary Academy, Lithuanian University of Health Sciences, Tilžės Street 18, LT-47181 Kaunas, Lithuania
4
University Clinic for Ruminants, University of Veterinary Medicine, Veterinaerplatz 1, A-1210 Vienna, Austria
*
Authors to whom correspondence should be addressed.
Submission received: 17 May 2021 / Revised: 26 June 2021 / Accepted: 27 June 2021 / Published: 29 June 2021
(This article belongs to the Special Issue Digital Innovations in Agriculture)

Abstract

:
In this study we hypothesized that the lameness of early lactation dairy cows would have an impact on inline biomarkers, such as rumination time (RT), milk fat (%), milk protein (%), milk fat/protein ratio (F/P), milk lactose (L, %), milk electrical conductivity of all udder quarters, body weight (BW), temperature of reticulorumen content (TRR), pH of reticulorumen content (pH), and walking activity (activity). All 30 lame cows (LCs) used in this experiment had a score of 3–4, identified according to the standard procedure of Sprecher et al. The 30 healthy cows (HC) showed a lameness score of one. RT, milk fat, MY, milk protein, F/P, L, milk electrical conductivity of all udder quarters, and BW were registered using Lely Astronaut® A3 milking robots each time the cow was being milked. The TRR, cow activity, and pH of the contents of each cow’s reticulorumen were registered using specific smaXtec boluses. The study lasted a total of 28 days. Days “−14” to “−1” denote the days of the experimental period before the onset of clinical signs of lameness (day “0”), and days “1” to “13” indicate the period after the start of treatment. We found that from the ninth day before the diagnosis of laminitis until the end of our study, LCs had higher milk electrical conductivity in all udder quarters, and higher milk fat to protein ratios. On the 3rd day before the onset of clinical signs of the disease until the day of diagnosis, the milk fat of the LC group was reduced. The activity of the LCs decreased sharply from the second day to the first day after treatment. RT in the HC group tended to decrease during the experiment. pH in LCs also increased on the day of the appearance of clinical signs.

1. Introduction

Lameness is an important health and welfare concern in dairy farming. Producers are aware of how painful this condition is to the animal. They are more than willing to put effort into controlling lameness, even if these control measures seem inconvenient; however, the prevalence of lameness in the herd remains underestimated [1]. Many cases go untreated for several weeks, and those that are treated often develop repeated cases, requiring further treatment [2]. In any herd, lameness has negative implications on productivity and behavior [3], and this may be heightened in farms where milking robots are used. In problematic herds with a high incidence of lameness, there is a huge economic loss due to the reduction in milk yield and weight loss [4,5,6]. Lame cows have lower milk yields, shorter rumination times, lower milk temperatures, and a lower intake of supplements, and exhibit greater refusal to go to milking [7]. These changes in milk composition can be used to determine lameness of infectious and non-infectious origins; this observation is supported by Bonfatti et al. (2020) [8]. Bramley et al. (2013) [9] found that herds that are at higher risk for lameness were also at much higher risk for acidosis. Acidosis systematically impacts the physiology of animals, including laminitis and a diffuse aseptic inflammation of the laminae [10,11]. Vasoactive substances (histamine and endotoxins) are released during a decline in ruminal pH and as the result of bacteriolysis and tissue degradation. These substances cause vasoconstriction and dilation, which ultimately destroy the microvasculature of the corium. The effects of rumen acidosis in fresh dairy cows are mainly manifested by decreased milk fat content, decreased fiber digestibility, and diarrhea [11]. AlZahal (2008) [12] also observed a decrease in pH below 5.6 and a rumen temperature exceeding 40 °C. According to AlZahal et al. (2008) [12], rumen temperature negatively correlates with rumen pH. Therefore, changes in rumen temperature can be used to determine acidosis, and this can potentially be achieved using radio-telemetric devices [13]. According to Zhang et al. (2015) [14], lameness also decreases milk yield and days in milk (DIM) as well as the milk fat and fat-to-protein ratio. Milk fat depression has been associated with a decreased acetate-to-propionate ratio [15]. Analyzing the fluctuations in the ratio of milk fat to protein and their relationship to the pH value of the rumen content, it was found that the ratio of milk fat to protein, showing sub-acute ruminal acidosis (SARA), is <1 [15]. Miekley et al. (2012) [16] investigated the use of milk electrical conductivity and cow activity for the early diagnosis of mastitis and laminitis. Lukas et al. (2009) [17] reported that the milk electrical conductivity is a reliable indicator of mastitis, but Khatun et al. (2019) [18] argue that the electrical conductivity of milk is not a very sensitive indicator for the detection of mastitis, even if is the most widely used method for the early diagnosis of mastitis recorded by automatic milking systems. However, Lukas et al. (2009) [17] described that other metabolic and digestive problems such as ketosis, left displaced abomasum, a retained placenta, and lameness were also associated with a clear increase in milk electrical conductivity. Walker et al. (2008) [19] observed that lame cows spend more time lying down, less time standing, and less time walking. Mazrier et al. (2006) [20] confirmed that the use of electronic devices to record walking time of cows can detect lameness 7–10 days before the onset of clinical signs, which is associated with decreased activity in cows. Cows with lameness have also been found to spend less time eating and to be less active compared with non-lame cows [21,22].
Demonstrating the negative changes associated with lameness, especially when accounting for other factors, would help dairy producers to better evaluate the negative effects of even simple cases of lameness and would likely lead to more improved lameness monitoring and treatment methods. The expanding use of automatic milking systems (AMSs) provides many challenges and opportunities to dairy producers. The use of AMSs also has the advantage of monitoring cow-level milking frequency and quarter-level production and milk quality, which can support illness detection tools [23]. King et al. (2018) [23] also found that some of the markers registered by automatic milking systems change in association with lameness in cows. Nonetheless, not all health disorders can be detected electronically, and producers must still physically assess and fetch cows for milking if their milking interval is too long [24,25,26].
Based on the information in the literature, we hypothesized that the lameness of fresh dairy cows would have an impact on inline biomarkers, such as rumination time (RT), milk yield (MY), milk fat (%), milk protein (%), milk fat/protein ratio (F/P), milk lactose (L, %), milk electrical conductivity of all udder quarters, body weight (BW), temperature of reticulorumen content (TRR), pH of reticulorumen content (pH), and walking activity (activity). With this study we aimed to investigate the identification of risk factors for the detection of lameness with the help of biosensors.

2. Materials and Methods

2.1. Location and Animals

The investigation was conducted at the Lithuanian University of Health Sciences, and at one farm containing dairy cows (54.9754° N, 23.7684° E) in the period from 1 July 2020 to 15 December 2020.
All animal experimental procedures were approved; the approval number is PK016965. Sixty Lithuanian black and white breed cows (on average 5 years old) were selected from a herd of 500 dairy cows, which were being kept in a loose system. A lameness diagnosis was performed by trained staff (by the same one person) according to the standard procedure described by Sprecher et al. [26]: 1 = normal, 2 = presence of a slightly asymmetric gait, 3 = the cow clearly protects one or more limbs (moderately lame), 4 = severely lame, and 5 = extremely lame (non-weight-bearing lame). Visual locomotion scoring was conducted once weekly for four consecutive weeks by the same observer. Based on Warnick et al., [27], the causes of lameness were categorized as sole ulcer, abscess, and foot rot. Sole ulcer (pododermatitis circumscripta) included degenerative or necrotic defects in the sole near the sole heel junction. Abscess (white line abscess, sole abscess) was defined as a pus-filled cavity of the white line or sole of the foot. Foot rot (interdigital phlegmon) was swelling of the soft tissues of the foot, resulting in symmetrical swelling above the coronary band and spreading of the toes, in some cases with necrosis of the tissue between the claws.
All 30 LCs used in this experiment had a score of 3–4, presenting severe lameness with pronounced arching of the back, they were reluctant to move, and were unwilling to complete weight transfer off the affected limb. The 30 HCs had a lameness score of 1. The study lasted for a total of 28 days. Days “−14” to “−1” denote the days of the experimental period before the onset of clinical signs of lameness (day “0”), and days “1” to “13” indicate the period after the start of treatment. Average DIM was 60 (±10) days. Treatment was repeated at 24-h intervals for a total of three days. Rimadyl Cattle® (50 mg/mL) s.c. injection (Zoetis, Belgium) at a dose of 1.4 mg/kg body weight was performed once as well.
Cows were provided with a total mixed ration (TMR) consisting of 20% corn silage, 20% grass silage, 50% flaked grain concentrate, 5% grass hay, and 5% of mineral mixture. The ration was composed as to exceed or meet the requirements of a 550-kg Holstein cow producing 40 kg of milk per day. Composition of ration: dry matter (DM) (%) 49.00; neutral detergent fiber (% of DM) 28.00; acid detergent fiber (% of DM) 20.00; crude protein (% of DM) 16.00; non-fiber carbohydrates (% of DM) 39.00; net energy for lactation (Mcal/kg). Feeding was carried out every day at 05:00 and 17:00. The milking process was done with five Lely Astronaut® A3 milking robots with free traffic.

2.2. Measurements

Lely Astronaut® A3 milking robots with free traffic were used to milk the cows and they collected information about the cows: MY, BW, RT, L, F/P, milk fat, and milk protein milk electrical conductivity (mS/cm) of all quarters of the udders (front left (MCFL), front right (MCFR), rear left (MCBL), rear right (MCBR)).
With the help of smaXtec boluses (smaXtec animal care technology®), the parameters pH, TRR, and cow activity were monitored in real-time and were registered every 10 min each day. Data were measured with the help of specific antennas (smaXtec animal care technology®). For the monitoring of pH, TRR, and activity an indwelling and wireless data transmitting system (smaXtec animal care GmbH, Graz, Austria) was used. The system was controlled by a microprocessor. Data (pH, TRR) were collected using an analogue-to-digital converter (A/D converter) and stored in an external memory chip. Calibration of the pH-probes was performed using pH 4 and pH 7 buffer solutions at the beginning of the experiment. All data were obtained using smaXtec messenger® computer software.

2.3. Data Analysis and Statistics

Data were analyzed with the SPSS 26.0 (SPSS Inc., Chicago, IL, USA) program package. The normal distribution of variables was assessed using the Kolmogorov–Smirnov test (inline variables were not normally distributed). To assess the differences between the compared LC and HC groups over a 28-day period, we used the general linear model repeated measures and Fisher’s standard deviation (SD) criterion. Differences were considered statistically significant at p ≤ 0.05. Linear regression was also used to analyze changes in the studied inline biomarkers.

3. Results

The average weight of the cows was 700 kg. Average milk yield during 2020 was 12,000 kg per cow and year.

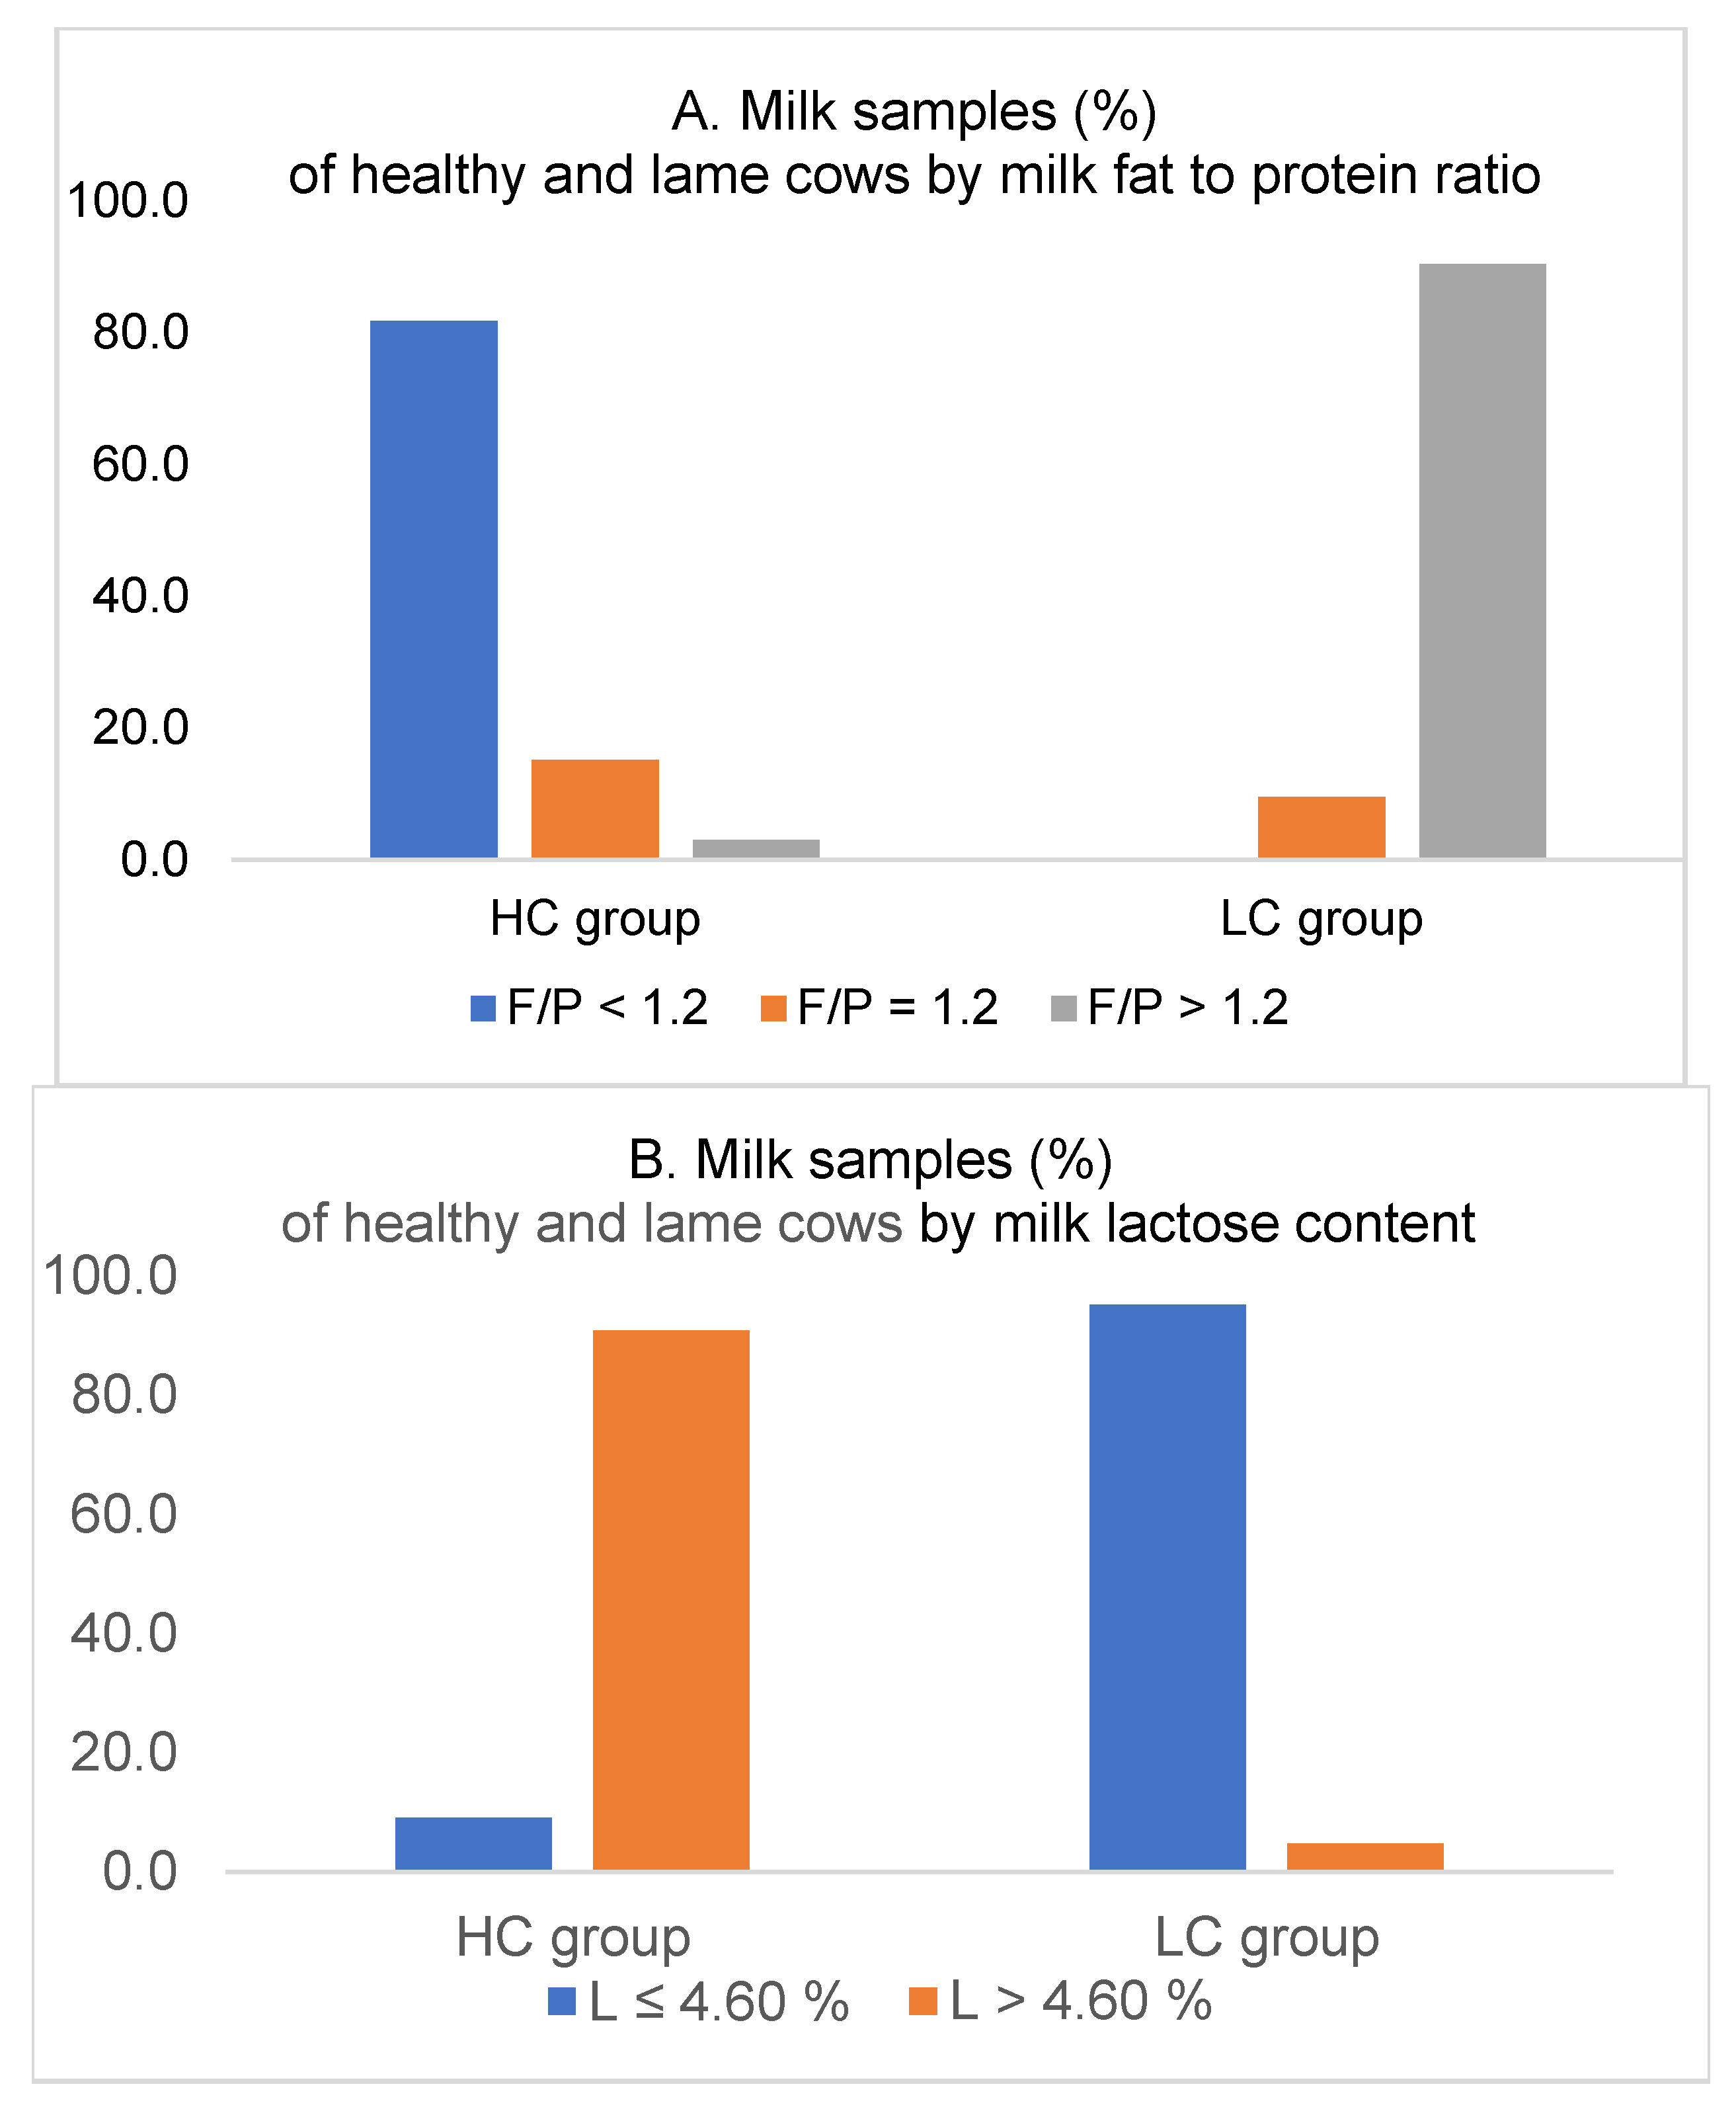
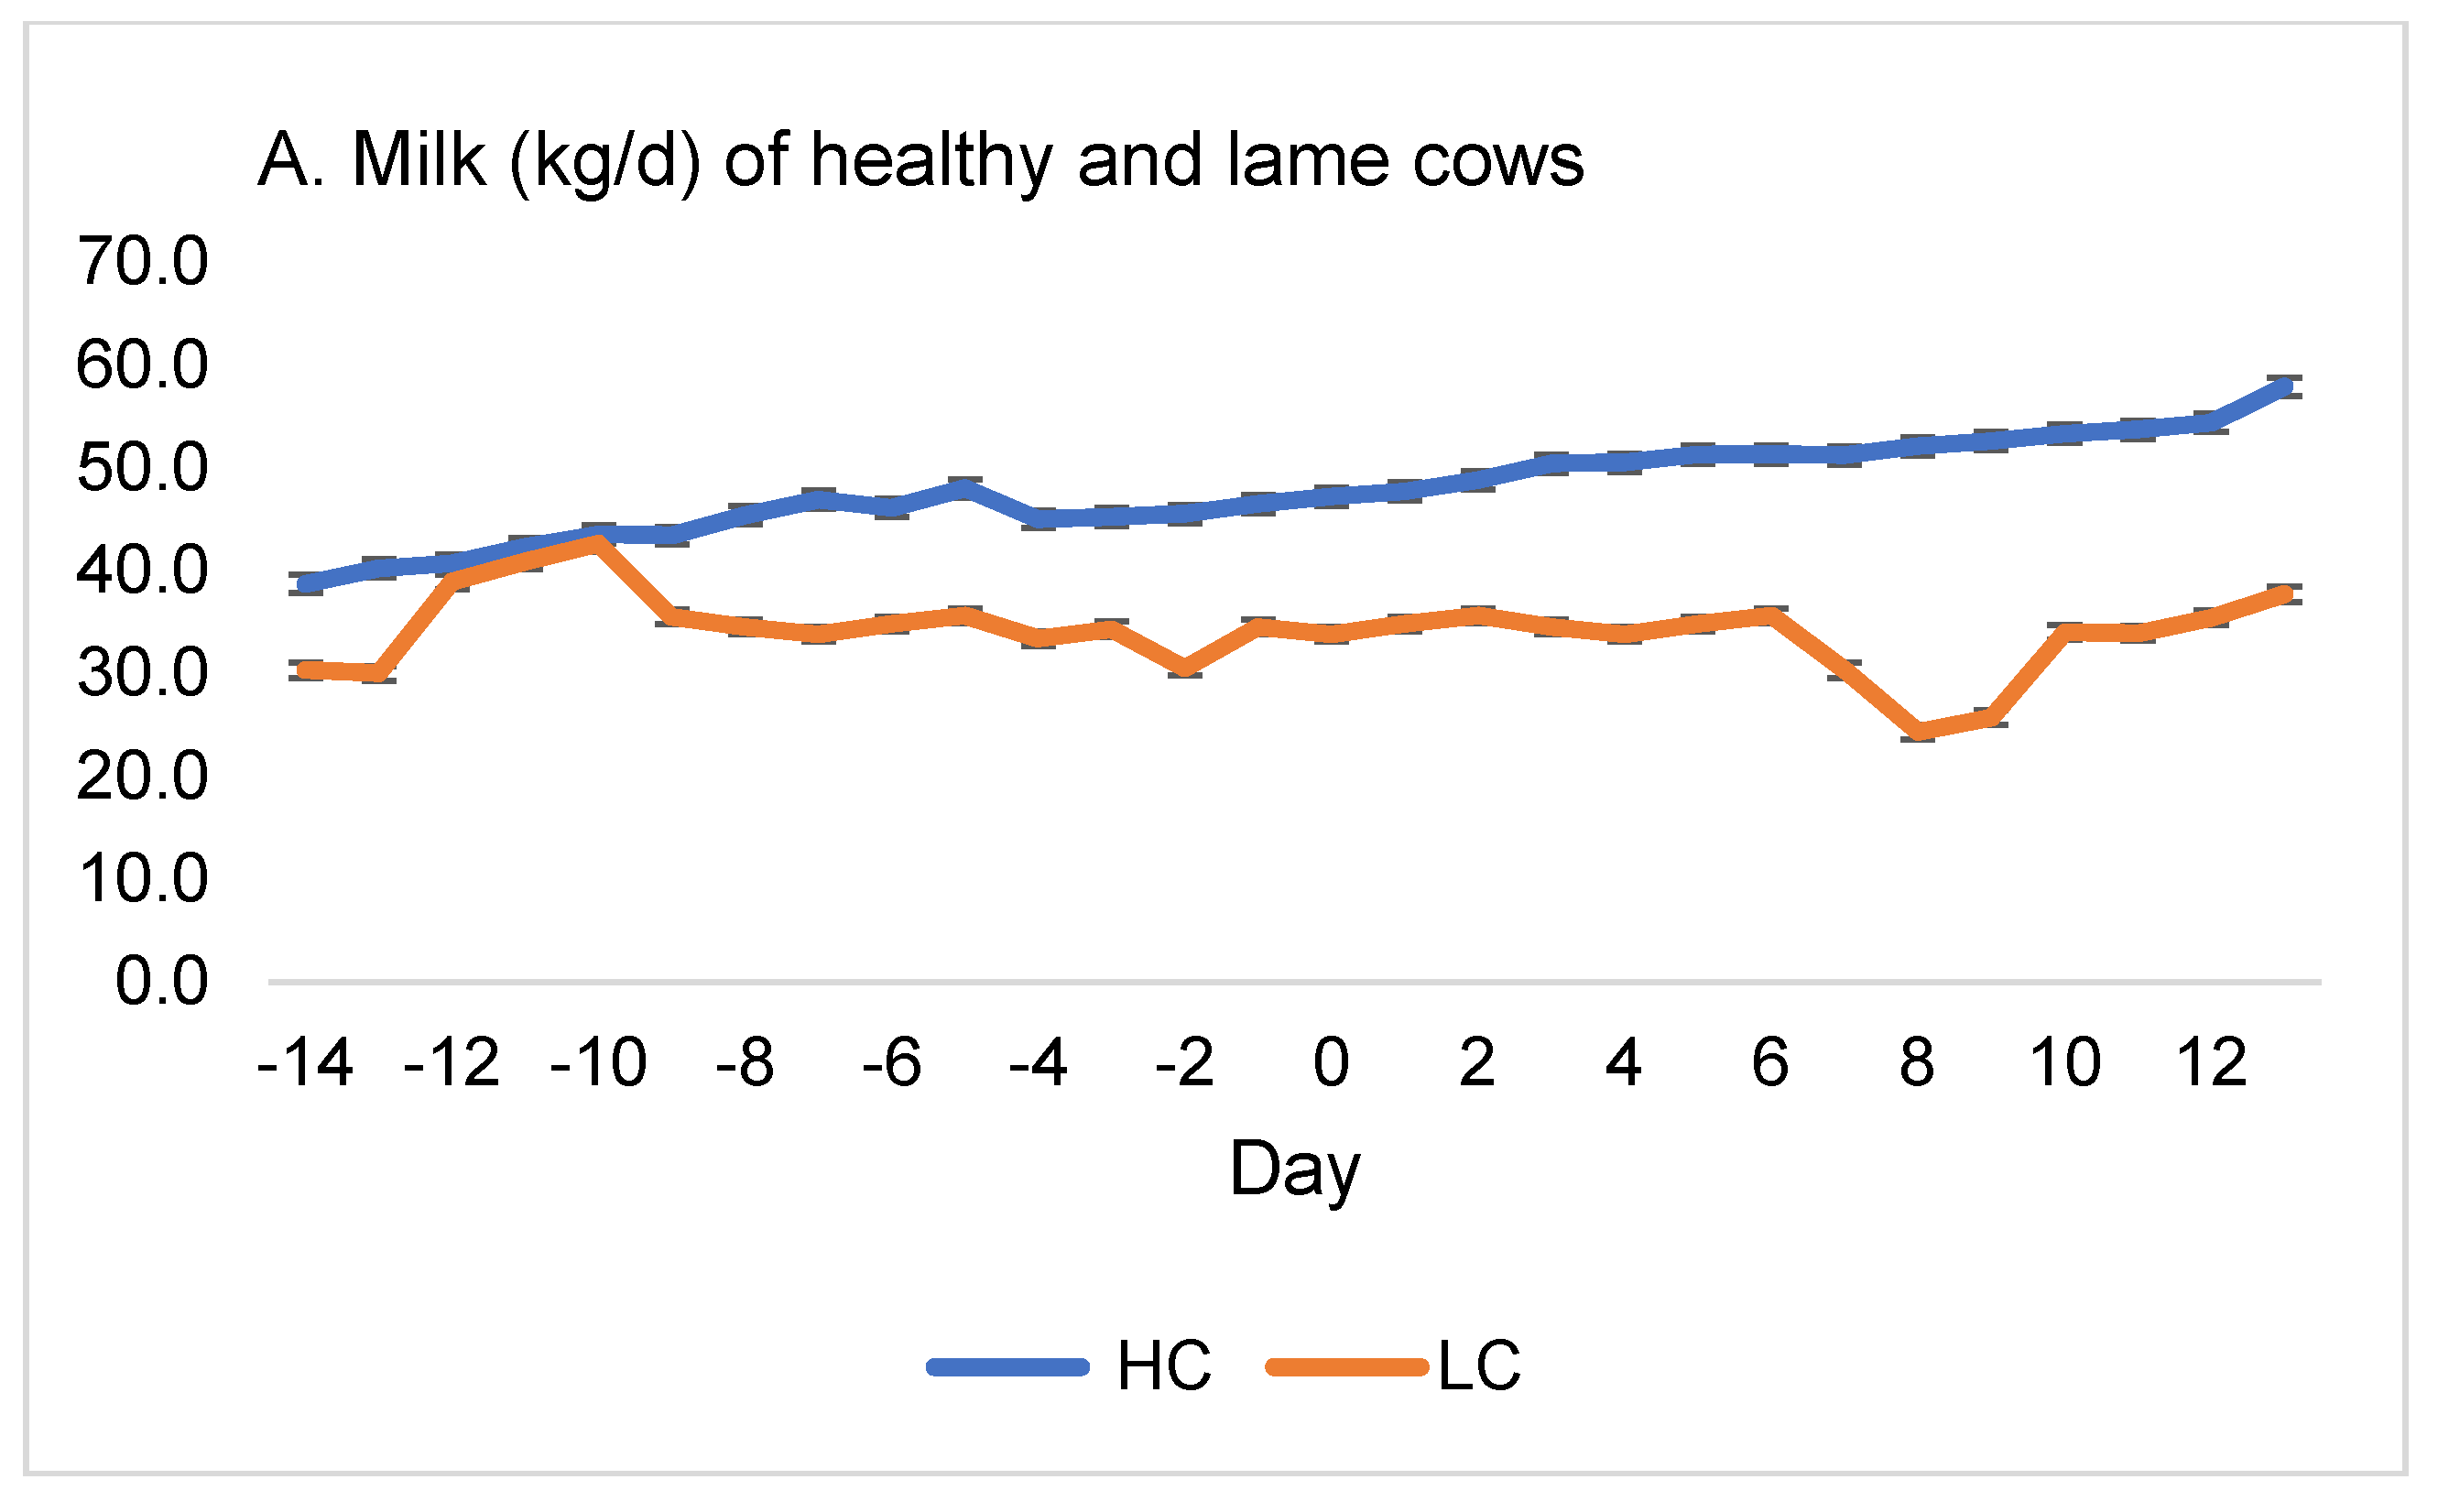
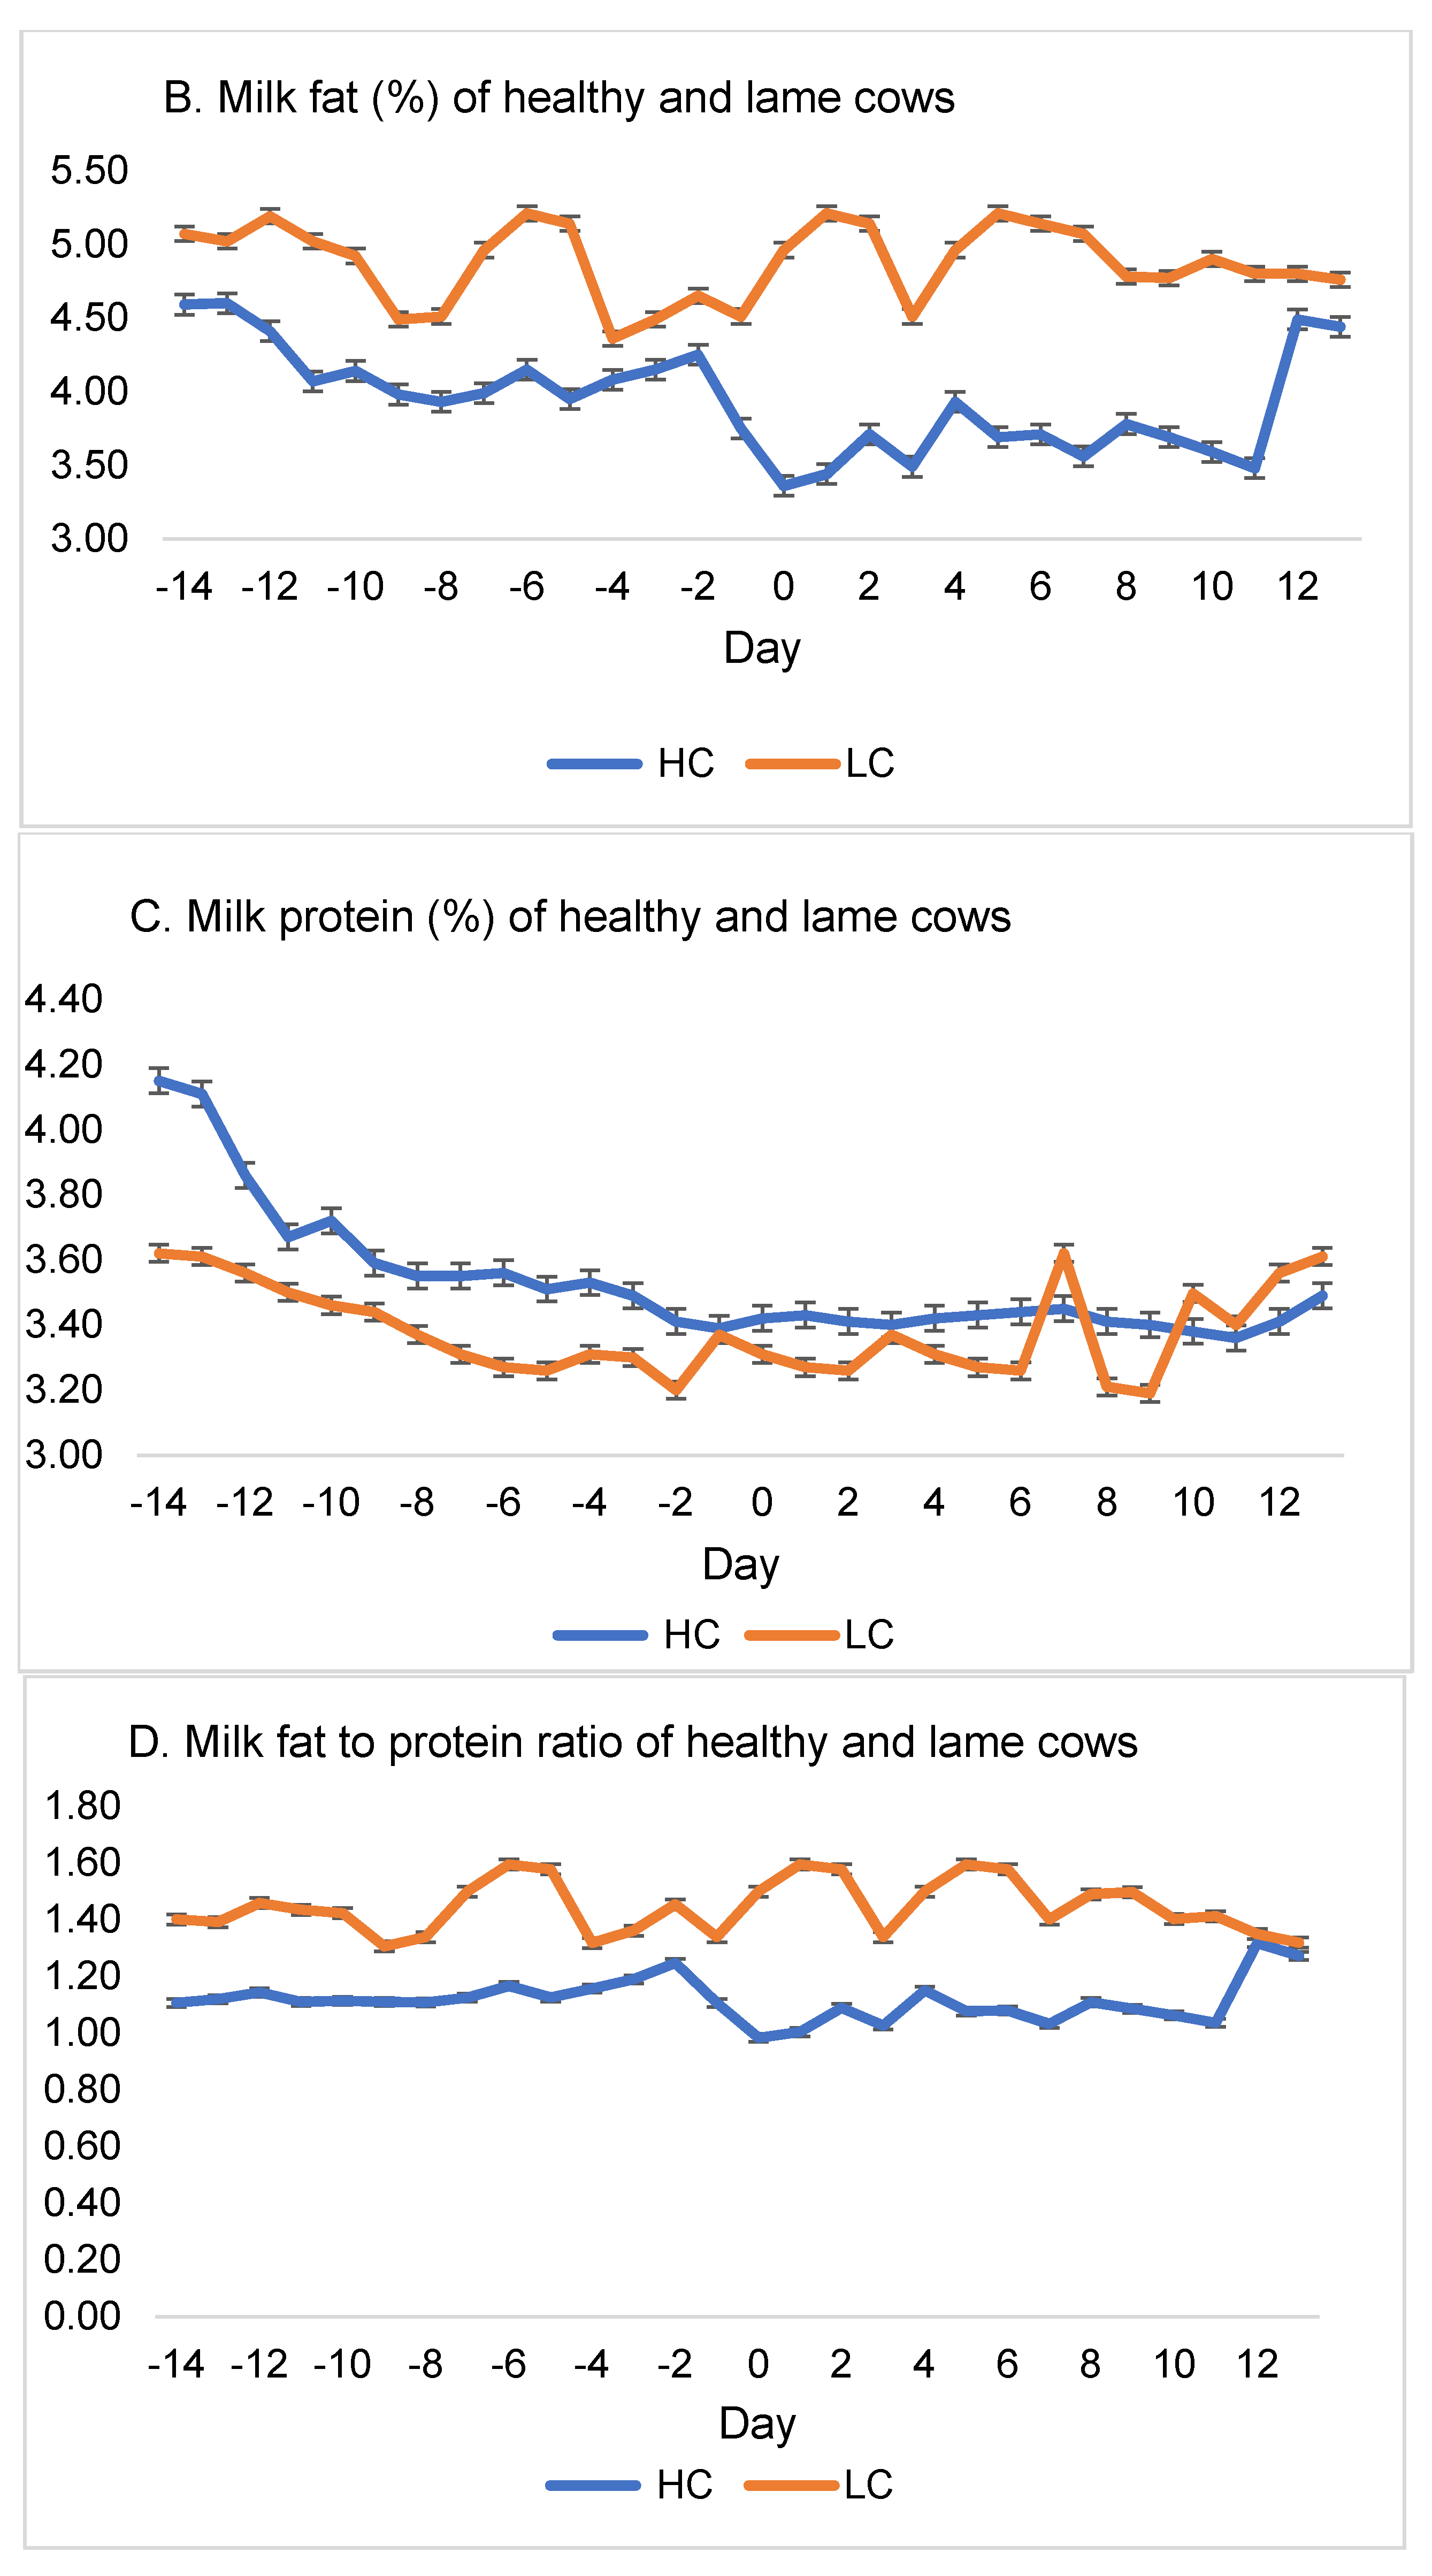
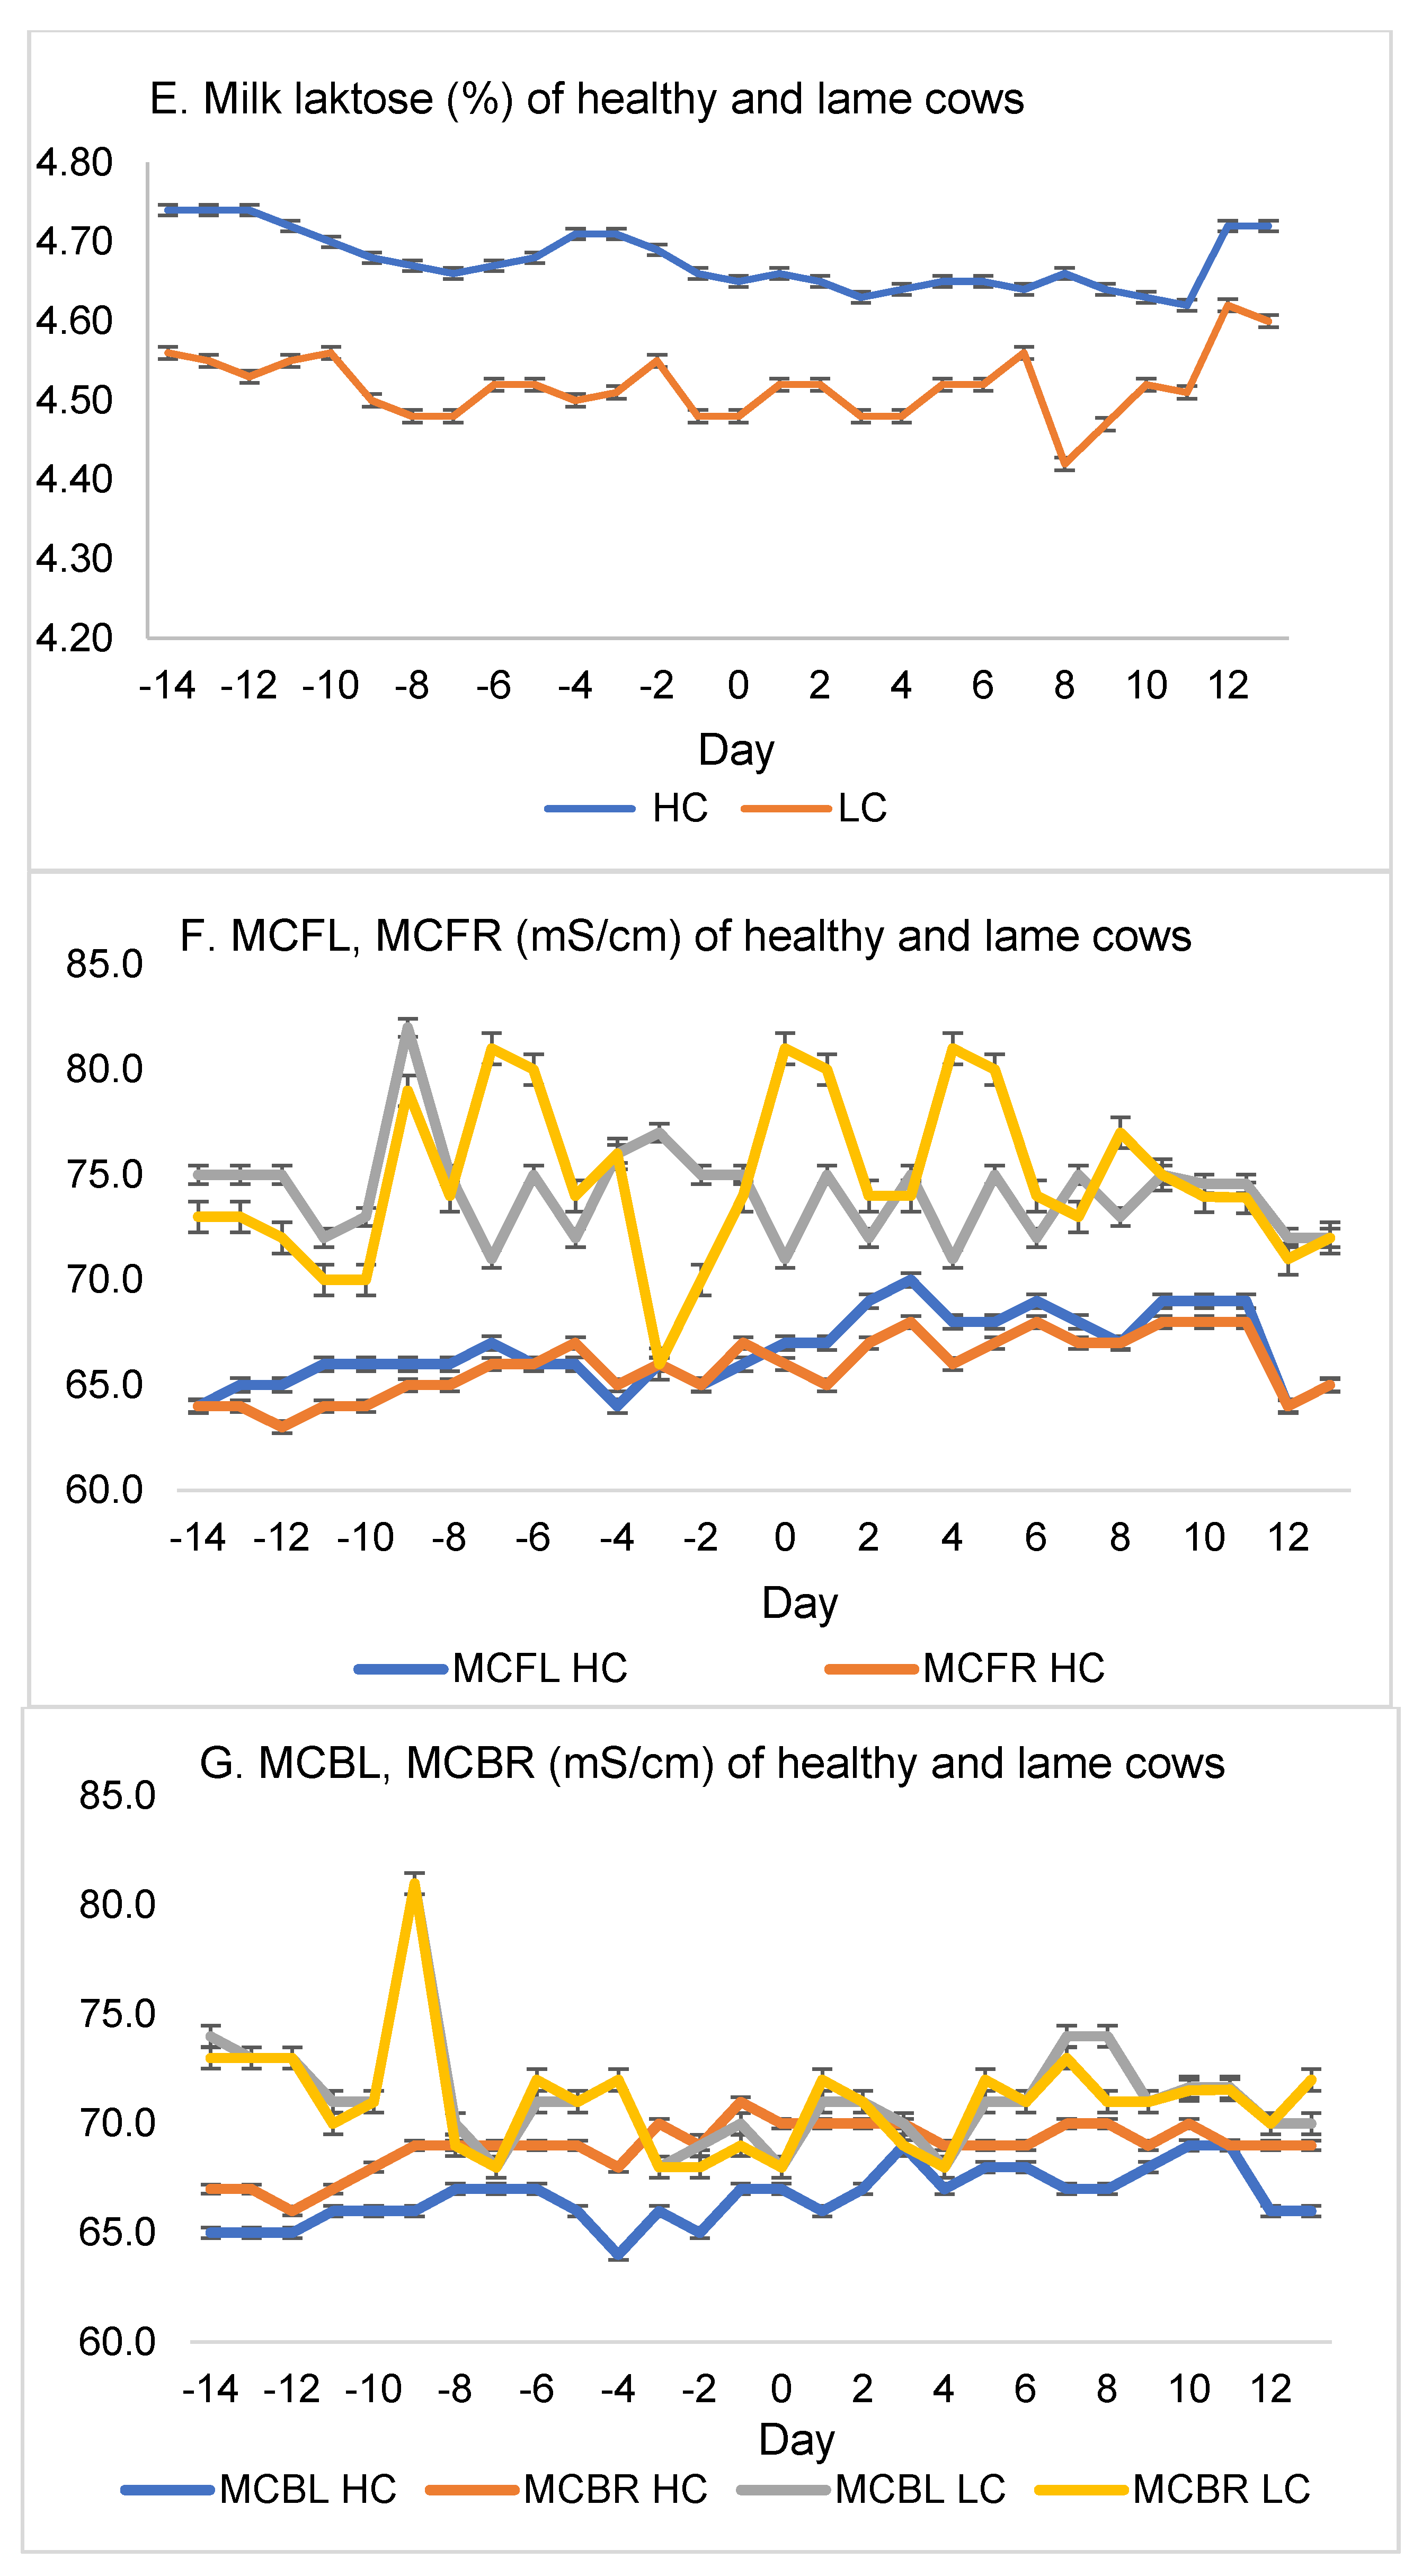
3.1. Relationship of Lameness in Fresh Dairy Cows with Milk Traits

The lame cows were less productive (on average—9.4 kg/d; p < 0.001 of milk yield), had a higher milk fat concentration (on average 0.74 percentage points p < 0.001), lower milk protein content (on average—0.243 percentage points; p = 0.031), and had a higher milk fat/protein ratio (on average—0.297; p < 0.001), compared to healthy cows. Lame cows’ milk was found to have a lower lactose content (on average–0.141 percentage points; p < 0.001) and all udder quarters had higher milk electrical conductivity (on average—2.1–7.6 mS/cm; p < 0.001) (Table 1).
In 90.48% of the milk samples of the LC group (Figure 1A), the F/P ratio exceeded 1.2, and only 9.52% of the samples met the reference norm (p < 0.001). The lactose level in milk exceeded 4.6% in 90.91% of milk samples from HC cows and only 4.76% in milk samples from LC cows (p < 0.001). Results are presented in Figure 1B.
Milk productivity of HC increased linearly from 38.7 ± 0.15 kg to 57.90 ± 0.18 kg (p < y = 0.5504x + 39.869; R² = 0.9322, p < 0.001). From the ninth day before the diagnosis of laminitis until the end of the experiment, the milk production of the LC group of cows was statistically significantly lower compared to the group of healthy cows (p < 0.05); and only on the eighth day after the start of treatment did the milk yield of LC cows begin to increase slightly (Figure 2A).
Milk fat (y = −0.0202x + 4.2357, R² = 0.2156, p = 0.013) and protein content in HC decreased during the experiment (y = −0.0187x + 3.8052, R² = 0.5748, p < 0.001). On the 3rd day before the onset of clinical signs of the disease until the day of diagnosis, the milk fat of LC was significantly reduced (p < 0.001). In these cows, milk fat (Figure 2B) began to stabilize at day 8 and milk protein began to increase at day 9 after treatment (Figure 2C).
The milk fat-to-protein ratio in LC was higher compared to healthy cows during the first 25 days of the experiment (p < 0.001). The average value of this indicator in both groups of cows at the end of the experiment was the same (Figure 2D).
Milk lactose in HC tended to decrease during the experimental period (y = −0.0025x + 4.7129, R² = 0.3256, p = 0.002) and was higher than in LC (p < 0.001). A steady increase in this indicator in LC was observed from the 8th day from the beginning of treatment to the end of the experiment (Figure 2E).
The electrical conductivity of HC tended to increase according to linear regression analysis (R2 = 0.26–0.40, p = 0.005, and p < 0.001). In LC this indicator was higher compared to HC and fluctuated during the experiment (Figure 2F,G).

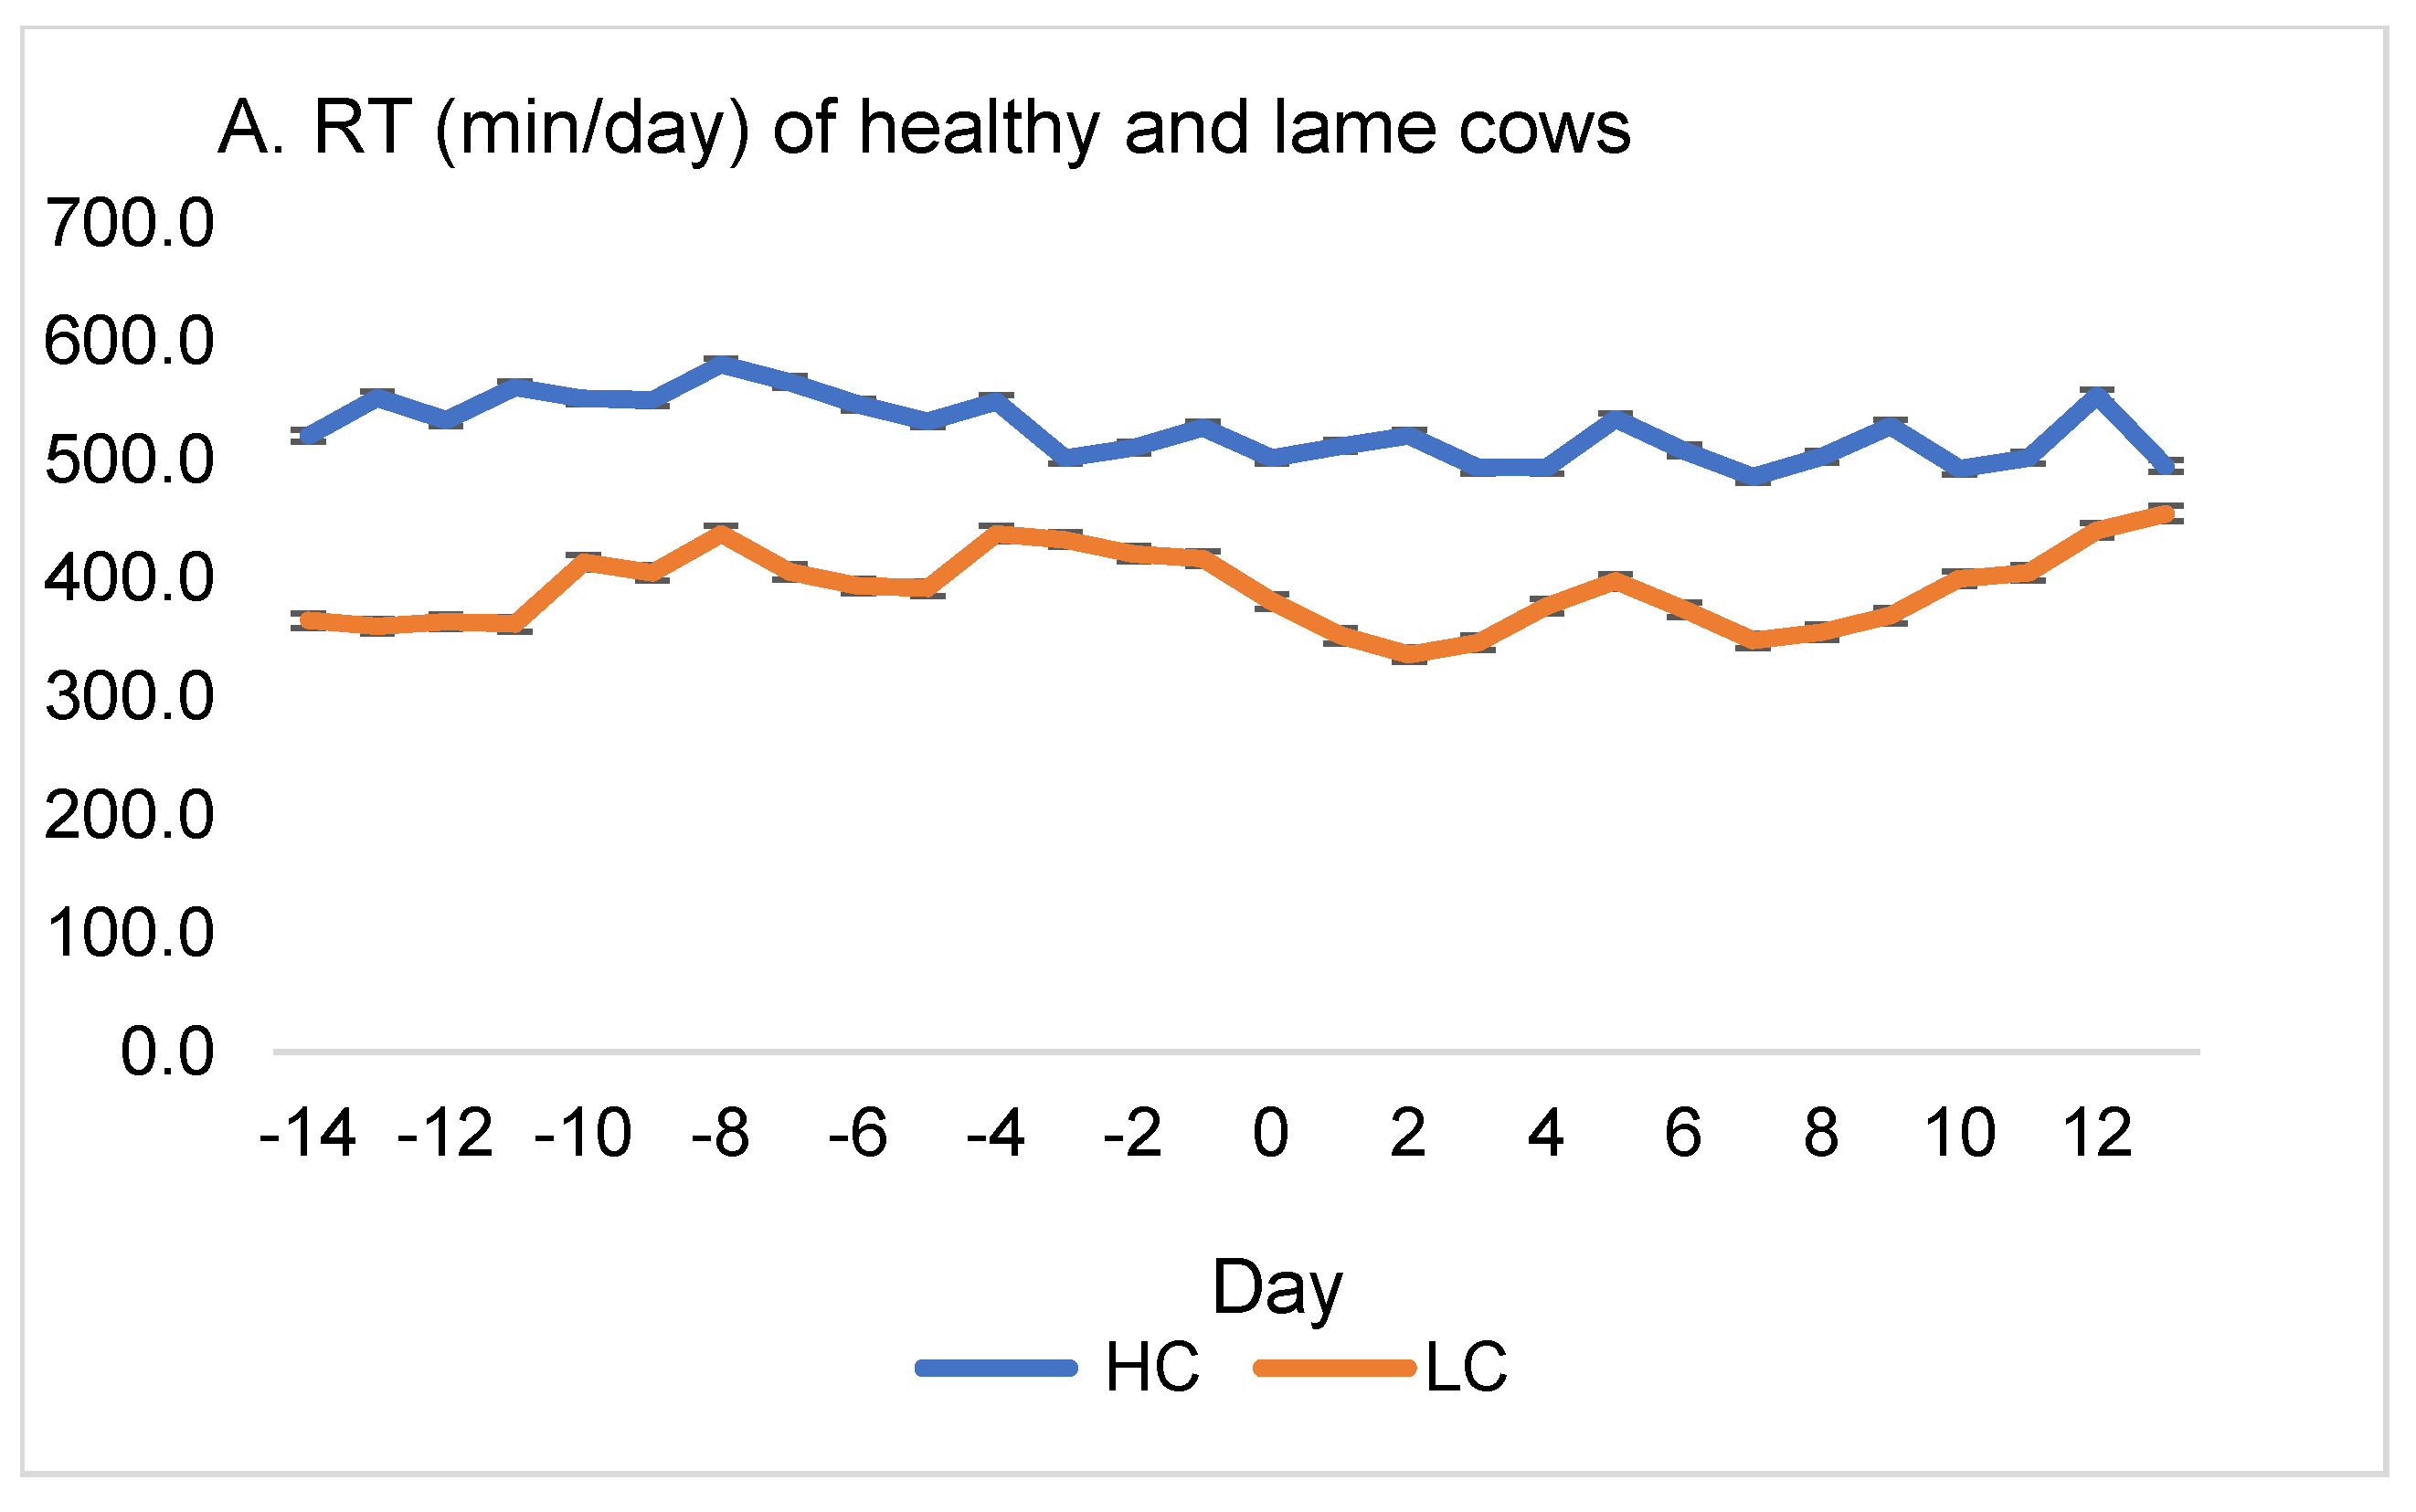
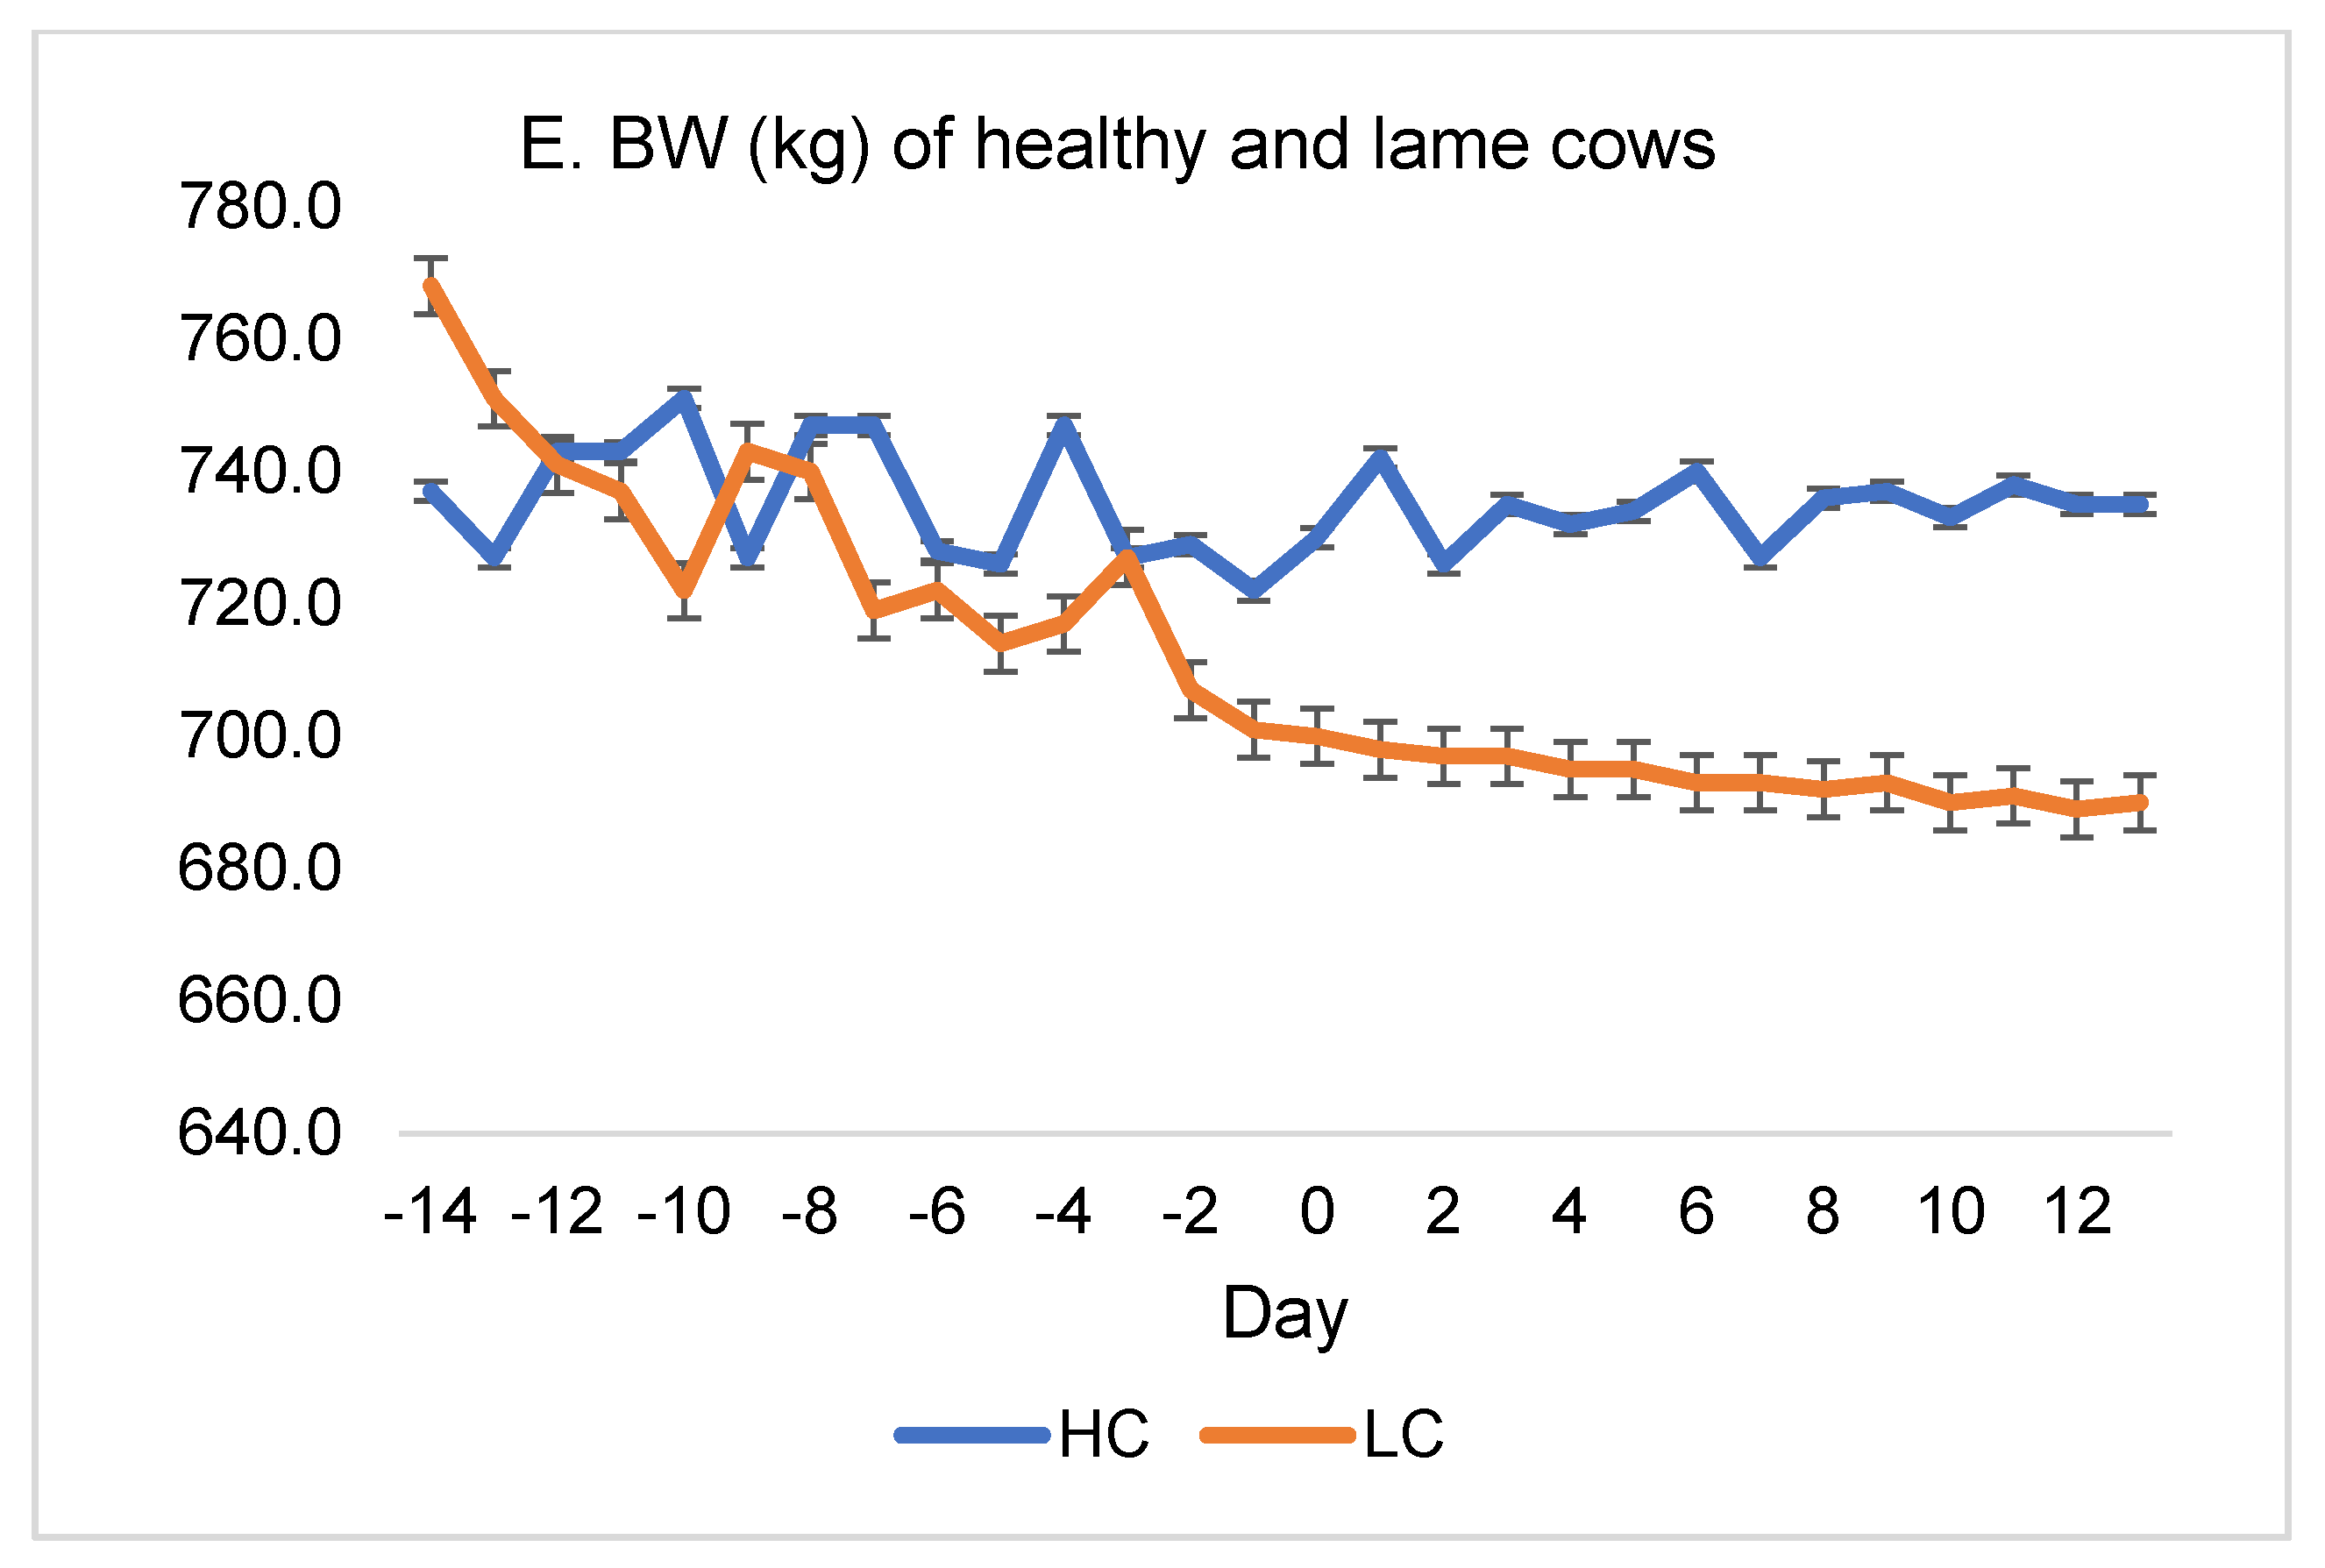
3.2. Relationship of Lameness in Cows with Reticulorumen Indicators, Activity, and Body Weight

In the LC group, we found lower mean RT values (−133.42 min/d, p < 0.001) and higher activity values (+1.38 steps/h, p = 0.027) and body weight (+5.69 kg, p < 0.001) compared to the HC group (Table 2).
The RT in HC tended to decrease during the experiment (y = −1.9354x + 553.78. R² = 0.3647, p < 0.001) and was significantly higher than in LCs from the start of the experiment until the 11th day after treatment (p < 0.001). For LCs we could not apply linear regression in the analysis of their RT change (Figure 3A).
As seen in Figure 3B, the pH in LC cows increased significantly from day −2 to day 0 (p < 0.001), then decreased until the 3rd day after treatment (p < 0.001), and increased until the end of the experiment. The pH of the reticulorumen in HCs was more stable throughout the observation period.
The activity of cows in the LC group decreased sharply from day “−2” to the first day after treatment, then increased, but began to decrease again at 10 days after the start of treatment. In HC this indicator changed less throughout the experiment (Figure 3C).
The highest TRR (Figure 3D) in cows of the LC group was recorded from “−3” to “0” days (40.00 °C–40.16 °C). At the end of the experiment, the TRR of this group of cows dropped to 39.32 °C ± 0.229 °C (p < 0.001).
The BW of LC decreased throughout the experimental period (y = −2.474x + 747.37, R² = 0.8409, p < 0.001), whereas in HC it was more stable (Figure 3E).

4. Discussion

According to the results of our study, we found that lame cows were less productive; the milk production of lame cows was lower than in healthy cows. Huxley et al. (2013) reported milk yield losses per case of lameness, with most losses ranging from 270 to 574 kg/lactation [3]. Cow-level studies of lameness in AMS herds have reported reduced milk yield, reduced total and voluntary milking frequency, and greater daily lying time for lame cows [28,29,30]. Lameness had a detrimental effect on most outcome variables analyzed, especially to parameters related to milk production and AMS visits. Lame cows produced 1.6 kg/d less milk during the 6-d data collection period in some studies. Furthermore, a higher milking order index was registered for moderately lame cows [31].
We found that lame cows in all udder quarters had higher milk electrical conductivity. The monitoring of affected milk electrical conductivity has promise as an indirect and rapid method for the detection of subclinical mastitis [32]. The technology is based on measuring potassium, sodium, and other free ions, especially chloride, which is directly proportional to electrical conductivity. In normal milk, the concentration of Cl is around 75–130 mg/100 mL; however, due to inflammation, the amount of free Cl can increase up to 111–198 mg/100 mL. These changes can appear rapidly and sporadically, depending on the type of mastitis developing [32]. Lameness, as a problem affecting crossbred dairy cattle herds, has tremendous effects on animal health, production, welfare, and reproduction [33]. Severe pain in lame cows modifies the normal rising and lying behavior of cattle. The chances of mastitis increased the longer the cows remained lying down [33]. A positive relationship was observed between poor claw health and an increased incidence of clinical mastitis [34].
Our study shows that lame cows had a lower milk protein content and a higher milk fat-to-protein ratio. On the 3rd day before the onset of clinical signs of the disease until the day of diagnosis, the milk fat of lame cows was significantly reduced. In the milk of lame cows, lower concentrations of milk lactose were registered. Lameness in crossbred dairy cattle may affect the milk composition. Olechnowicz and Jacekowski (2010) detected a significant decrease in the average milk yield and in milk components of fat, protein, and lactose content in cows with clinical lameness, as compared to non-lame cows [35]; due to lameness, the cows exhibited poor absorption and assimilation of nutrients, since they were under more stress and pain and had increased oxidative agents, which in turn resulted in significantly lower average monthly protein, fat, and lactose contents and production compared to non-lame cows. In their subsequent trial, Olechnowicz and Jacekowski (2012) [36] observed that clinical lame cows had significantly lower milk protein content than healthy cows.
The activity of cows in the LC group decreased sharply from day “−2” to the first day after treatment, then increased but began to decrease again at the end of the experiment. According to literature, alterations in limb movements develop due to pain from claw disorders [36]. In multiple studies, however, it has become evident that it is difficult for farmers to reliably detect lameness. For this reason, a number of attempts have been made to incorporate technical equipment into gait analysis and to develop automatic detection systems to warn farmers about lameness incidences in their herds [31,37,38]. Currently, two main types of systems are used on farms [38,39,40,41]: permanently installed in the animal’s environment (e.g., weighing platforms, 3-dimensional cameras, video analysis), or systems attached to the cow (e.g., pedometer). However, according to Rutten et al. (2013) [38], the aforementioned systems are mainly used to detect severe lameness, which is already easily detected visually. Lameness leads to several changes for cows, both in their gait and behavior. However, in most studies the cows with different lameness scores have been grouped together, whereas little is known about lameness-induced behavioral changes in moderately lame cows specifically.
Moderately lame cows, compared with non-lame cows, demonstrated a lower average locomotor activity, which can be explained by the reduced time of being elevated on their feet [19] and is in agreement with observations in cows with lameness of differing severity [22,41]. Furthermore, the locomotory activity registered during the first hour after feed delivery or push-ups was lower in moderately lame cows than in non-lame cows. This result suggests that non-lame cows are quicker to react to the feed push-ups or delivery [42,43,44] and provides proof for the hypothesis that lame cows have trouble getting up and walking to the feed alley for freshly delivered feed. Furthermore, a greater difference in locomotion activity 1 h after milking has been suspected between lame and non-lame cows. Juarez et al. (2003) [45] found that the percentage of cows lying down after returning from the milking parlor increased with the growing severity of lameness. This presumably occurs due to a painful weight-bearing process (while waiting for and during milking), which increases with the severity of lameness. The average locomotor activity and the locomotor activity during the hour after feed delivery or push-ups were lower in moderately lame cows compared to non-lame cows. The daily lying duration of moderately lame cows in the present study ranged between that of non-lame and previously observed severely lame cows, which points to a positive relationship between lying duration and the degree of lameness. The prolonged lying duration in combination with an increased number of lying bouts in moderately lame cows resulted in a longer average lying duration than in non-lame cows. The changes in lying behavior are associated with the reduced time that lame cows spend on their feet [19], possibly as a way to avoid bearing weight on damaged limbs [45]. Furthermore, moderately lame cows also showed a lower average level of neck locomotion than non-lame cows [29].
During our study, RT in healthy cows tended to decrease during the experiment and was higher than in lame cows from the start of the experiment until the 11th day after treatment. According to Weigele et al. (2018) [30], the number of eating chews and eating time per 24 h were shorter in moderately lame than in non-lame cows. Moreover, no effect of moderate lameness was evident on the number of ruminating chews, ruminating time, number of boluses, average ruminating speed, and the average number of ruminating chews per bolus [30]. Moderately lame cows also displayed less frequent visits to the concentrate feeder than non-lame cows. In contrast, both lame and non-lame cows showed a similar probability of concentrate leftovers [30]. A reduced number of eating chews and eating time were found in moderately lame cows, which was also found by Beer et al. (2016) [46]. In accordance with Palmer et al. (2012) [47], due to painful limbs or feet, lame cows spent less time standing and eating. Bareille et al. (2003) [48] observed a lower total feed intake in lame cows compared to non-lame cows, which could be related to their poorer BCS [19,49]. On the other hand, several studies have reported a higher feeding rate (feed intake per min) in lame cows and thus came to a conclusion that they eat faster than their non-lame counterparts [21,50,51]. Taking these results (no difference in average mastication speed but reduced eating time and number of eating chews) into account, Weigele et al. (2018) [30] assumed that moderately lame cows had a poorer breakdown of feed. Moderate lameness did not affect rumination duration, number of ruminating chews, number of boluses, or the average ruminating speed. Although cows can ruminate while standing, the greater part of rumination usually takes place while lying down [52,53], whereas eating is performed while standing. Therefore, the effect of lameness on rumination might not be as significant as its effect on eating. This notion is supported by Thorup et al. (2016) [51], who also observed reduced eating behavior but similar rumination behavior when comparing lame and non-lame cows.
We found that pH in lame cows increased on the day of the appearance of clinical signs, then decreased until the 3rd day after treatment, and increased until the end of the experiment. Changes in the rumen initiate several systemic changes. Increased organic acid, particularly lactic acid, and thus a reduced pH value, result in decreased ruminal motility, predisposing cows to ruminitis and hyperkeratosis [54]. In many dairy operations, the biggest concern is not acute acidosis but subclinical acidosis, whereby a minute accumulation of lactic acid is detectable in the rumen; however, pH still decreases. Daily episodes of pH < 5.5 for given periods ultimately lead cattle to low-grade, subclinical acidosis. Symptoms include an erratic appetite, bodyweight loss, diarrhea, and lameness [55]. Laminitis occurs in acute, chronic, and subclinical forms [56]. Acidosis and laminitis are linked with alterations in the hemodynamics of the peripheral microvasculature [57]. Various theories have been developed to explain the pathogenesis of laminitis. Vasoactive substances such as histamine and endotoxins are released during ruminal acidosis and as the end-products of bacteriolysis and tissue degradation. These substances influence vasodilation and vasoconstriction, ultimately destroying the corium’s microvasculature [58]. Ischemia results in reduced oxygen and nutrient availability for the extremities of the corium. This degrades the junctions between tissues that are critical for locomotion [57]. The insidious rotation of the distal phalanx (pedal bone) often results in permanent damage. Signs of subclinical laminitis are yellowish discolorations and hemorrhages of the sole [56]. Other clinical manifestations include dorsal wall concavity, double soles, heel erosion, and ridging of the dorsal wall [59]. Pododermatitis aseptica diffusa is the scientific name for laminitis, an aseptic inflammation of the foot’s dermal layers. Studies have concluded that body condition score, body weight, rear lateral digital variations, non-tarsal rear limb superficial swelling, abnormal hoof overgrowth, and limb laceration were risk factors for clinical lameness.

5. Conclusions

The risk factors identified for lameness with the help of sensors were lower milk yield, milk protein and lactose contents, bodyweight, activity, and rumination time, and higher milk electrical conductivity and milk fat-to-protein ratio.
From the ninth day before the diagnosis of laminitis until the end of our experiment, the milk production of lame cows was lower than that of healthy cows. LCs exhibited a higher milk electrical conductivity in all udder quarters, lower milk protein and lactose contents, as well as a higher milk fat-to-protein ratio. On the 9th day before the onset of clinical signs of the disease until the day of diagnosis, the milk fat of the lame cows was reduced. The bodyweight of LCs decreased throughout our experimental period. The activity of lame cows decreased sharply from the first day to the second day after treatment. RT in healthy cows tended to decrease during the experiment and was higher than in lame cows from the start of the experiment until the 11th day after treatment. The reticulorumen pH in lame cows also increased on the day of the appearance of clinical signs.
From a practical point of view, we recommend the use of the following biomarkers for the early diagnosis of lameness in fresh dairy cows: milk yield, milk electrical conductivity, milk composition (protein, lactose, and fat), walking activity, rumination time, and reticulorumen pH. In future studies, we recommend extending the study period to 30 days or more before the onset of clinical signs of lameness.

Author Contributions

R.A.: supervision of the whole study; V.J.: software and algorithm development, design, and setup of field experiments; G.U.: data collection and analysis; D.M.: setup of the field experiment and data collection, selection, and management of the experimental group of animals; M.T.: research consultancy; M.U.: design of field experiment and data collection and analysis; and W.B.: intensive support in processing of data in the manuscript. The manuscript was written by R.A. and revised by all co-authors. All authors have read and agreed to the published version of the manuscript.

Funding

This research received no external funding.

Institutional Review Board Statement

The study was conducted according to the guidelines of the Declaration of Helsinki, and approved by Ethics Committee (The study approval number is PK016965, 2017.06.06).

Informed Consent Statement

Not applicable.

Data Availability Statement

The data presented in this study are available within the article.

Conflicts of Interest

The authors declare no conflict of interest.

References

  1. Bennett, R.; Barker, Z.; Main, D.; Whay, H.; Leach, K. Investigating the value dairy farmers place on a reduction of lameness in their herds using a willingness to pay approach. Vet. J. 2014, 199, 72–75. [Google Scholar] [CrossRef] [PubMed]
  2. Green, L.; Huxley, J.; Banks, C.; Green, M. Temporal associations between low body condition, lameness and milk yield in a UK dairy herd. Prev. Vet. Med. 2014, 113, 63–71. [Google Scholar] [CrossRef] [PubMed]
  3. Huxley, J. Impact of lameness and claw lesions in cows on health and production. Livest. Sci. 2013, 156, 64–70. [Google Scholar] [CrossRef]
  4. Zhang, X.; Ding, J.; Li, Y.; Song, Q.; Li, S.; Hayat, M.A.; Zhang, J.; Wang, H. The changes of inflammatory mediators and vasoactive substances in dairy cows’ plasma with pasture-associated laminitis. BMC Vet. Res. 2020, 16, 119. [Google Scholar] [CrossRef]
  5. Donovan, G.A.; Risco, C.A.; Temple, G.D.; Tran, T.Q.; Van Horn, H.H. Influence of transition diets on occurrence of sub-clinical laminitis in Holstein dairy cows. J. Dairy Sci. 2004, 87, 73–84. [Google Scholar] [CrossRef] [Green Version]
  6. Shearer, J.K. Lameness of Dairy Cattle: Consequences and Causes; Department of Large Animal Clinical Sciences College of Veterinary Medicine University of Florida Gainesville: Gainesville, FL, USA, 1997; pp. 38–50. [Google Scholar]
  7. King, M.; Leblanc, S.; Pajor, E.; Devries, T. Cow-level associations of lameness, behavior, and milk yield of cows milked in automated systems. J. Dairy Sci. 2017, 100, 4818–4828. [Google Scholar] [CrossRef] [PubMed] [Green Version]
  8. Bonfatti, V.; Ho, P.; Pryce, J. Usefulness of milk mid-infrared spectroscopy for predicting lameness score in dairy cows. J. Dairy Sci. 2020, 103, 2534–2544. [Google Scholar] [CrossRef] [PubMed] [Green Version]
  9. Bramley, E.; Costa, N.; Fulkerson, W.; Lean, I. Associations between body condition, rumen fill, diarrhoea and lameness and ruminal acidosis in Australian dairy herds. N. Z. Vet. J. 2013, 61, 323–329. [Google Scholar] [CrossRef]
  10. Nocek, J.E. Bovine Acidosis: Implications on Laminitis. J. Dairy Sci. 1997, 80, 1005–1028. [Google Scholar] [CrossRef]
  11. Plaizier, J.; Krause, D.; Gozho, G.; McBride, B. Subacute ruminal acidosis in dairy cows: The physiological causes, incidence and consequences. Vet. J. 2008, 176, 21–31. [Google Scholar] [CrossRef]
  12. AlZahal, O.; Kebreab, E.; France, J.; Froetschel, M.; McBride, B. Ruminal Temperature May Aid in the Detection of Subacute Ruminal Acidosis. J. Dairy Sci. 2008, 91, 202–207. [Google Scholar] [CrossRef] [PubMed]
  13. AlZahal, O.; Steele, M.; Van Schaik, M.; Kyriazakis, I.; Duffield, T.; McBride, B.; AlZahal, H. The use of a radiotelemetric ruminal bolus to detect body temperature changes in lactating dairy cattle. J. Dairy Sci. 2011, 94, 3568–3574. [Google Scholar] [CrossRef] [PubMed]
  14. Zhang, G.; Hailemariam, D.; Dervishi, E.; Deng, Q.; Goldansaz, S.A.; Dunn, S.M.; Ametaj, B.N. Alterations of Innate Immunity Reactants in Transition Dairy Cows before Clinical Signs of Lameness. Animals 2015, 5, 717–747. [Google Scholar] [CrossRef] [PubMed]
  15. Enemark, D.J.M.; Jørgensen, R.J.; Enemark, S.S. Rumen acidosis with special emphasis on diagnostic aspects of subclinical rumen acidosis: A review. Vet. Zootech. 2002, 20, 42. [Google Scholar]
  16. Miekley, B.; Traulsen, I.; Krieter, J. Detection of mastitis and lameness in dairy cows using wavelet analysis. Livest. Sci. 2012, 148, 227–236. [Google Scholar] [CrossRef]
  17. Lukas, J.; Reneau, J.; Wallace, R.; Hawkins, D.; Munoz-Zanzi, C. A novel method of analyzing daily milk production and electrical conductivity to predict disease onset. J. Dairy Sci. 2009, 92, 5964–5976. [Google Scholar] [CrossRef] [PubMed]
  18. Khatun, M. Data-Based Approaches to Improve Accuracy and Timing of Mastitis Detection in Automatic Milking Systems. Ph.D. Thesis, The University of Sydney, Sydney, Australia, 2019. [Google Scholar]
  19. Walker, S.L.; Smith, R.; Routly, J.E.; Jones, D.N.; Morris, M.J.; Dobson, H. Lameness, Activity Time-Budgets, and Estrus Expression in Dairy Cattle. J. Dairy Sci. 2008, 91, 4552–4559. [Google Scholar] [CrossRef]
  20. Mazrier, H.; Tal, S.; Aizinbud, E.; Bargai, U. A field investigation of the use of the pedometer for the early detection of lameness in cattle. Can. Vet. J. 2006, 47, 883–886. [Google Scholar]
  21. Gonzalez, L.A.; Tolkamp, B.J.; Coffey, M.; Ferret, A.; Kyriazakis, I. Changes in Feeding Behavior as Possible Indicators for the Automatic Monitoring of Health Disorders in Dairy Cows. J. Dairy Sci. 2008, 91, 1017–1028. [Google Scholar] [CrossRef] [Green Version]
  22. O’Callaghan, K.A.; Cripps, P.J.; Downham, D.Y.; Murray, R.D. Subjective and objective assessment of pain and discomfort due to lameness in dairy cattle. Anim. Welf. 2003, 12, 605–610. [Google Scholar]
  23. King, M.; Pajor, E.; Leblanc, S.; Devries, T. Associations of herd-level housing, management, and lameness prevalence with productivity and cow behavior in herds with automated milking systems. J. Dairy Sci. 2016, 99, 9069–9079. [Google Scholar] [CrossRef] [PubMed]
  24. Jacobs, J.A.; Siegford, J.M. Invited review: The impact of automatic milking systems on dairy cow management, behavior, health, and welfare. J. Dairy Sci. 2012, 95, 2227–2247. [Google Scholar] [CrossRef] [PubMed]
  25. King, M.; Leblanc, S.; Pajor, E.; Wright, T.; Devries, T. Behavior and productivity of cows milked in automated systems before diagnosis of health disorders in early lactation. J. Dairy Sci. 2018, 101, 4343–4356. [Google Scholar] [CrossRef] [PubMed] [Green Version]
  26. Sprecher, D.; Hostetler, D.; Kaneene, J. A lameness scoring system that uses posture and gait to predict dairy cattle reproductive performance. Theriogenology 1997, 47, 1179–1187. [Google Scholar] [CrossRef]
  27. Warnick, L.; Janssen, D.; Guard, C.; Gröhn, Y. The Effect of Lameness on Milk Production in Dairy Cows. J. Dairy Sci. 2001, 84, 1988–1997. [Google Scholar] [CrossRef]
  28. Bach, A.; Dinarés, M.; Devant, M.; Carré, X. Associations between lameness and production, feeding and milking attendance of Holstein cows milked with an automatic milking system. J. Dairy Res. 2006, 74, 40–46. [Google Scholar] [CrossRef]
  29. Deming, J.A.; Bergeron, R.; Leslie, K.E.; Devries, T.J. Associations of cow-level factors, frequency of feed delivery, and standing and lying behaviour of dairy cows milked in an automatic system. Can. J. Anim. Sci. 2013, 93, 427–433. [Google Scholar] [CrossRef]
  30. Weigele, H.C.; Gygax, L.; Steiner, A.; Wechsler, B.; Burla, J.B. Moderate lameness leads to marked behavioral changes in dairy cows. J. Dairy Sci. 2018, 101, 2370–2382. [Google Scholar] [CrossRef] [Green Version]
  31. Gáspárdy, A.; Ismach, G.; Bajcsy, Á.C.; Veress, G.; Márkus, S.; Komlósi, I. Evaluation of the on-line electrical conductivity of milk in mastitic dairy cows. Acta Vet. Hung. 2012, 60, 145–155. [Google Scholar] [CrossRef] [PubMed]
  32. Ito, K.; von Keyserlingk, M.; Leblanc, S.; Weary, D. Lying behavior as an indicator of lameness in dairy cows. J. Dairy Sci. 2010, 93, 3553–3560. [Google Scholar] [CrossRef] [PubMed] [Green Version]
  33. Singh, A.; Singh, S.; Gupta, D.K.; Bansal, B.K. Relationship of lameness to body condition score, udder health and milk quality in crossbred dairy cattle. Vet. Arh. 2018, 88, 179–190. [Google Scholar] [CrossRef]
  34. Olechnowicz, J.; Jaskowski, J.M. Impact of clinical lameness, calving season, parity, and month of lactation on milk, fat, protein, and lactose yields during early lactation of dairy cows. Bull. Vet. Inst. Pulawy 2010, 54, 605–610. [Google Scholar]
  35. Olechnowicz, J.; Jaskowski, M.J. Relationship between clinical lameness and somatic cell counts, and fat and protein contents in the milk of dairy cows. Med. Weter 2012, 68, 12. [Google Scholar]
  36. Randall, L.; Green, M.; Chagunda, M.; Mason, C.; Archer, S.; Green, L.; Huxley, J. Low body condition predisposes cattle to lameness: An 8-year study of one dairy herd. J. Dairy Sci. 2015, 98, 3766–3777. [Google Scholar] [CrossRef]
  37. Dyer, R.; Neerchal, N.; Tasch, U.; Wu, Y.; Dyer, P.; Rajkondawar, P. Objective Determination of Claw Pain and Its Relationship to Limb Locomotion Score in Dairy Cattle. J. Dairy Sci. 2007, 90, 4592–4602. [Google Scholar] [CrossRef] [PubMed] [Green Version]
  38. Rutten, C.; Velthuis, A.; Steeneveld, W.; Hogeveen, H. Invited review: Sensors to support health management on dairy farms. J. Dairy Sci. 2013, 96, 1928–1952. [Google Scholar] [CrossRef]
  39. Nechanitzky, K.; Starke, A.; Vidondo, B.; Müller, H.; Reckardt, M.; Friedli, K.; Steiner, A. Analysis of behavioral changes in dairy cows associated with claw horn lesions. J. Dairy Sci. 2016, 99, 2904–2914. [Google Scholar] [CrossRef] [PubMed] [Green Version]
  40. Jabbar, K.A.; Hansen, M.F.; Smith, M.L.; Smith, L. Early and non-intrusive lameness detection in dairy cows using 3-dimensional video. Biosyst. Eng. 2017, 153, 63–69. [Google Scholar] [CrossRef]
  41. Thorup, V.; Munksgaard, L.; Robert, P.-E.; Erhard, H.; Thomsen, P.T.; Friggens, N. Lameness detection via leg-mounted accelerometers on dairy cows on four commercial farms. Animals 2015, 9, 1704–1712. [Google Scholar] [CrossRef] [Green Version]
  42. Solano, L.; Barkema, H.; Pajor, E.; Mason, S.; Leblanc, S.; Nash, C.; Haley, D.; Pellerin, D.; Rushen, J.; De Passillé, A.; et al. Associations between lying behavior and lameness in Canadian Holstein-Friesian cows housed in freestall barns. J. Dairy Sci. 2016, 99, 2086–2101. [Google Scholar] [CrossRef] [PubMed] [Green Version]
  43. Mandel, R.; Harazy, H.; Gygax, L.; Nicol, C.; Ben-David, A.; Whay, H.; Klement, E. Short communication: Detection of lameness in dairy cows using a grooming device. J. Dairy Sci. 2018, 101, 1511–1517. [Google Scholar] [CrossRef]
  44. Blackie, N.; Amory, J.; Bleach, E.; Scaife, J. The effect of lameness on lying behaviour of zero grazed Holstein dairy cattle. Appl. Anim. Behav. Sci. 2011, 134, 85–91. [Google Scholar] [CrossRef]
  45. Juarez, S.T.; Robinson, P.H.; DePeters, E.J.; Price, E.O. Impact of lameness on behavior and productivity of lactating Holstein cows. Appl. Anim. Behav. Sci. 2003, 83, 1–14. [Google Scholar] [CrossRef]
  46. Beer, G.; Alsaaod, M.; Starke, A.; Schüpbach-Regula, G.; Müller, H.; Kohler, P.; Steiner, A. Use of Extended Characteristics of Locomotion and Feeding Behavior for Automated Identification of Lame Dairy Cows. PLoS ONE 2016, 11, e0155796. [Google Scholar] [CrossRef] [Green Version]
  47. Palmer, M.A.; Law, R.; O’Connell, N. Relationships between lameness and feeding behaviour in cubicle-housed Holstein–Friesian dairy cows. Appl. Anim. Behav. Sci. 2012, 140, 121–127. [Google Scholar] [CrossRef]
  48. Bareille, N.; Beaudeau, F.; Billon, S.; Robert, A.; Faverdin, P. Effects of health disorders on feed intake and milk production in dairy cows. Livest. Prod. Sci. 2003, 83, 53–62. [Google Scholar] [CrossRef]
  49. Bicalho, R.; Machado, V.; Caixeta, L. Lameness in dairy cattle: A debilitating disease or a disease of debilitated cattle? A cross-sectional study of lameness prevalence and thickness of the digital cushion. J. Dairy Sci. 2009, 92, 3175–3184. [Google Scholar] [CrossRef] [PubMed] [Green Version]
  50. Norring, M.; Haggman, J.; Simojoki, H.; Tamminen, P.; Winckler, C.; Pastell, M. Short communication: Lameness impairs feeding behavior of dairy cows. J. Dairy Sci. 2014, 97, 4317–4321. [Google Scholar] [CrossRef]
  51. Thorup, V.M.; Nielsen, B.L.; Robert, P.-E.; Giger-Reverdin, S.; Konka, J.; Michie, W.; Friggens, N.C. Lameness Affects Cow Feeding but Not Rumination Behavior as Characterized from Sensor Data. Front. Vet. Sci. 2016, 3, 37. [Google Scholar] [CrossRef] [PubMed] [Green Version]
  52. Kilgour, R.J. In pursuit of “normal”: A review of the behaviour of cattle at pasture. Appl. Anim. Behav. Sci. 2012, 138, 1–11. [Google Scholar] [CrossRef]
  53. Schirmann, K.; Chapinal, N.; Weary, D.; Heuwieser, W.; von Keyserlingk, M. Rumination and its relationship to feeding and lying behavior in Holstein dairy cows. J. Dairy Sci. 2012, 95, 3212–3217. [Google Scholar] [CrossRef] [PubMed] [Green Version]
  54. Dirksen, G. Rumen Function and Disorders Related to Production Disease. In Proceedings of the VII International Conference Distance Farm Animal; Cornell University: Ithaca, NY, USA, 1989; p. 350. [Google Scholar]
  55. Gentile, G.; Cinotti, S.; Ferri, G.; Famigli-Bergamini, P. Nutritional acidosis and technological characteristics of milk in high producing dairy cows. In Proceedings of the XIV World Congress on Diseases of Cattle, Dublin, Ireland, 26–29 August 1986; pp. 823–829. [Google Scholar]
  56. Bergsten, C. Hemorrhages of the sole horn of dairy cows as a retrospective indicator of laminitis: An epidemiological study. Acta Vet. Scand. 1994, 35, 55. [Google Scholar] [CrossRef] [PubMed]
  57. Boosman, R.; Németh, F.; Gruys, E.; Klarenbeek, A. Arteriographical and pathological changes in chronic laminitis in dairy cattle. Vet. Q. 1989, 11, 144–155. [Google Scholar] [CrossRef] [PubMed] [Green Version]
  58. Brent, B.E. Relationship of Acidosis to Other Feedlot Ailments. J. Anim. Sci. 1976, 43, 930–935. [Google Scholar] [CrossRef] [PubMed] [Green Version]
  59. Ossent, P.; Lischer, C.J. Theories on the pathogenesis of bovine laminitis. In Proceedings of the 8th International Symposium Disorder Ruminant Digit International Conference; Greenough, P.R., Ed.; Bovine Lameness: Saskatoon, SK, Canada; Banff, AB, Canada, 1994; p. 207. [Google Scholar]
Figure 1. Relation of laminitis with milk fat-to-protein ratio (A) and lactose level (B). F/P—milk fat to protein ratio; L—milk lactose (%); HC—healthy cow group; LC—lame cow group.
Agriculture 11 00610 g001
Figure 2. Changes in milk milk yield (A), fat (B), protein (C), fat to protein ratio (D), lactose (E), milk electrical conductivity of front left and right udder quarter (F), milk electrical conductivity of rear left and right udder quarter (G). MCFL—milk electrical conductivity of front left udder quarter; MCFR—milk electrical conductivity of front right udder quarter; MCBL—milk electrical conductivity of rear left udder quarter; MCBR—milk electrical conductivity of rear right udder quarter; HC—healthy cow group; LC—lame cow group.
Agriculture 11 00610 g002aAgriculture 11 00610 g002bAgriculture 11 00610 g002c
Figure 3. Change in rumination time (A), reticulorumen pH (B), activity (C), reticulorumen temperature (D), and body weight (E) of cows by group during the experiment. RT—rumination time; Activity—cow activity; TRR—reticulorumen temperature; BW—body weight; HC—healthy cow group; LC—lame cow group.
Agriculture 11 00610 g003aAgriculture 11 00610 g003bAgriculture 11 00610 g003c
Table 1. Milk traits by group of cows (LSM ± SD).
VariableHCLCp
MY (kg)43.39 ± 7.6534.00 ± 9.59<0.001
Fat (%)4.15 ± 0.544.89 ± 0.67<0.001
Protein (%)3.74 ± 0.353.50 ± 0.440.031
F/P1.11 ± 0.091.41 ± 0.11<0.001
Lactose (%)4.66 ± 0.054.52 ± 0.07<0.001
MCFL (mS/cm)67.1 ± 2.2474.6 ± 2.81<0.001
MCFR (mS/cm)66.3 ± 2.9873.9 ± 3.74<0.001
MCBL (mS/cm)67.5 ± 2.6171.7 ± 3.27<0.001
MCBR (mS/cm)69.5 ± 1.9671.5 ± 0.05<0.001
MY—milk yield; Fat—milk fat; Protein—milk protein; F/P—milk fat to protein ratio; Lactose—milk lactose; MCFL—milk electrical conductivity of front left udder quarter; MCFR—milk electrical conductivity of front right udder quarter; MCRL—milk electrical conductivity of rear left udder quarter; MCRR—milk electrical conductivity of rear right udder quarter; HC—healthy cow group; LC—lame cow group; data are presented as least square means (LSM), standard deviation (SD); p ≤ 0.05—means in the row differed significantly.
Table 2. Reticulorumen indicators, activity, and body weight by group of cows (LSM ± SD).
VariableHCLCp
RT (min/day)517.6 ± 21.80384.2 ± 52.41<0.001
pH6.43 ± 0.176.46 ± 0.220.231
TRR °C39.16 ± 0.8739.33 ± 1.170.059
Activity (steps/h)8.55 ± 0.459.93 ± 0.370.027
Body weight (kg)734.5 ± 15.44728.8 ± 20.89<0.001
RT—rumination time; pH—reticulorumen pH; HC—healthy cow group; LC—lame cow group; data are presented as least square means (LSM), standard deviation (SD); p ≤ 0.05—means in the row differed significantly.
Publisher’s Note: MDPI stays neutral with regard to jurisdictional claims in published maps and institutional affiliations.

