Article

Crack Identification in Cantilever Beam under Moving Load Using Change in Curvature Shapes

by
Nutthapong Kunla
1,
Thira Jearsiripongkul
1,*,
Suraparb Keawsawasvong
2 and
Chanachai Thongchom
2
1
Department of Mechanical Engineering, Faculty of Engineering, Thammasat School of Engineering, Thammasat University, Pathum Thani 12120, Thailand
2
Department of Civil Engineering, Faculty of Engineering, Thammasat School of Engineering, Thammasat University, Pathum Thani 12120, Thailand
*
Author to whom correspondence should be addressed.
Submission received: 18 May 2022 / Revised: 9 June 2022 / Accepted: 16 June 2022 / Published: 19 June 2022

Abstract

:
Cracks in structural components may ultimately lead to failure of the structure if not identified sufficiently early. This paper presents a crack-identification method based on time-domain. Captured time-domain data are processed into central difference approximation of displacement of each node (point) in the structure. Abnormally high central difference approximation of displacement of a node relative to those of its neighborhood points indicates a crack at that point. A suite of simulation experiments and numerical calculations was conducted to find out whether the proposed identification method could accurately identify the location of a crack in a cantilever beam under moving load compared to the location found by an exact solution method, and the outcomes indicated that it was as able as the analytical method. The proposed method is an FEA analysis, an approach familiar to virtually every engineer. Therefore, the relative amount of time and effort spent on developing the proposed method for a specific application is much less than those spent on developing an analytical method. The saved time and effort should enable more engineering personnel to perform routine checks on structural elements of their interest more simply and frequently.

1. Introduction

Methods for identifying damage in structures, such as aircrafts, bridges, ships, and buildings is an important area of research and development that has a great potential for cost-saving and safety improvement to those structures [1,2,3]. The presence of cracks in a structure brings about local variations in the stiffness of the structure. The extent of such variations mainly depends on the depth and location of the cracks, which affects the dynamical behavior of the whole cracked structure. Vibration-based damage-detection methods based on change in physical properties of a structure have attracted the attention of many developers over the past few decades. Originally, Dimarogonas developed a theory of vibration of cracked shafts and wrote it up in a textbook [4]. Nevertheless, the crack-identification method based on this theory could indicate whether there was a crack or not but could not specify the crack location. Later, a new technique was developed to achieve both, based on a new parameter of change in displacement mode shape of a beam called “Curvature Mode Shape”. Pandey et al. [5] was the first to develop a version of it. Their version successfully identified typical crack locations. The study by Pandey et al. [5] was adapted by Sahin and Shenoi [6] to obtain a damage-detection algorithm based on the combined method of global (changes in natural frequencies) and local (curvature mode shape) analysis. A gapped smoothing damage-detection method was also carried out by Ratcliffe and Bagaria [7] for evaluating a damage index of composite beams. A modal curvature-based method was also employed by Hamey et al. [8] to determine cracks in carbon/epoxy composite beams. In addition, Qiao et al. [9] demonstrated the use of dynamic-based damage detection techniques to identify cracks in composite laminated plate. However, those previous studies were not able to identify a crack at some node—a node is a point at which no motion occurs—exists in a beam. Later, to counter the issue of crack identification at the node existing on the beam, two development teams, Chandrashekhar et al. [10] and Frans et al. [11], each proposed a similar method but based on additional pre-selected vibrational modes of a beam. The method was demonstrated to be effective as intended. However, it was not practical for on-site analysis of various structures because not all factories were equipped with sophisticated tools to measure those extra vibrational parameters.
This paper attempted to develop a curvature mode shape method that did not rely on difficult-to-obtain vibrational parameters. The developed method would also be based on moving load because we learned that moving load or moving mass on a bridge produced larger deflections and higher stresses compared to the case when an equivalent load was applied statically, and hence the deflections would be easier to measure precisely [12,13,14,15,16]. This idea of easier detection by using a variety of moving loads in the analysis was inspired by the results of a study by Chouiyakha et al. [17] as well as the results of a study by Roveri and Carcaterra [18] that demonstrated that their proposed methods based on moving load were truly able to identify the locations of the cracks precisely. The approaches based on moving load for damage detection in structures were widely used by several researchers in the past [19,20,21,22]. In contrast, our proposed method would be based on vibrational data in time domain instead of vibrational data in frequency domain (used in most of the studies mentioned above) to counter a common problem for many engineers that is responsible for crack identification of their facilities: complex and time-consuming tasks encoding unnecessarily complex mathematical calculation steps into a functioning and precise crack-identification app for their intended structure. The complexity of the mathematical calculation steps for finding a solution based on frequency domain data was higher than that based on time domain, as stated by Asnaashari et al. [23].
In addition, the developed method from the present study should work right out of the box—engineer users would not have to derive any exact analytical expression for the dynamics of the structural components under investigation to use the method; only readily available on-site data would be needed for the method to make accurate predictions.
The rest of the paper is organized as follows. Section 2 describes our methodology of crack-identification scheme. Section 3 reports numerical results and discusses them. Section 4 concludes the paper. Finally, Section 5 suggests future work and limitations of the proposed method.

2. Methods

2.1. A Previous Crack Identification Method

When a crack occurs in the structure of a beam, some structural properties will change. A crack in a beam can be identified by the curvature mode shape of the beam, as presented by Pandey et al. [2]. The authors now introduce a verified relationship between the flexural stiffness and amplitude of curvature of natural modes of vibration at a point in or on a common beam, which could be used to identify a crack effectively.
The curvature of a beam is related to the flexural stiffness of the beam. The curvature at a point in or on the beam is given by Equation (1),
κ = M E I
where κ is the curvature at that point; M is the bending moment at the section; E is the modulus of elasticity; and I is the second moment of the cross-sectional area. If a crack occurs in a structure, it reduces the EI of the structure at the cracked point, which makes the magnitude of the curvature higher at that point. The change in the curvature is local in nature, and hence it can be used to locate a crack in a small, suspected region.
Pandey et al. [5] used the displacement (or magnitude) of mode shape to calculate the curvature mode shape by central difference approximation as in Equation (2) below,
y = ( y i + 1 y i + y i 1 ) / h 2
where y = the central difference approximation at node or point i; h = the length between node i and i + 1; y = the magnitude (or displacement in the original paper) of mode shape at node i; i = node number, i = 1, 2…m; and m = Total number of nodes.
A crack at node i is identified by the absolute difference in the central difference approximation at that node.
Δ y i = | y c i y u c i |
Δ y i = the absolute difference in the central difference approximation at node i; y c i = the central difference approximation of the cracked beam at node i; y u c i = the central difference approximation of an uncracked beam at node i.

2.2. Proposed Identification Method

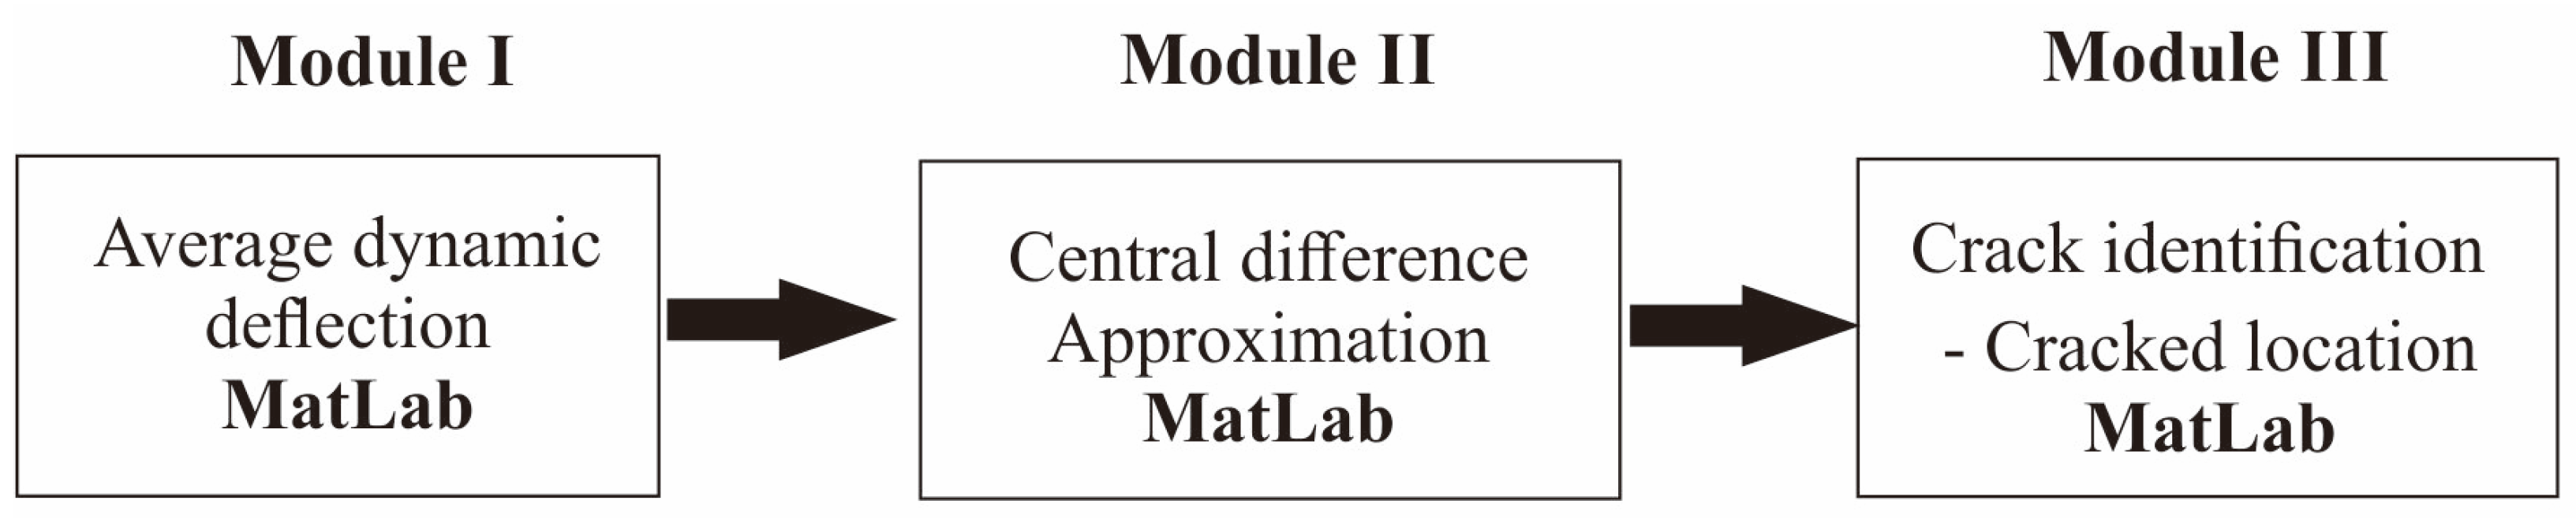
2.2.1. Main Modules in the Proposed Method

The proposed crack-identification method consists of three main modules: dynamic deflection module, central difference approximation calculation module, and crack-identification module. The first module determines the average dynamic deflection (vertical displacement) of every point (node) on the beam. The second module takes this set of deflection values as input and processes them into a set of central difference approximation values of every point on the beam. Finally, this set of central difference approximation values is inputted into the crack-identification module and processed, the output of which will be a graph of magnitude of central difference approximation at every point (node) of the beam. A sharp peak at any point in this graph indicates a crack at that point. All three modules were manually MATLAB-coded by the author. The flow diagram of the operations of these main modules is illustrated in Figure 1 below.

2.2.2. Rationale behind the Proposed Method

The rationale behind the proposed method is that time and effort is hugely saved in composing simulation experiments in an all-familiar FEA framework than composing a physical experiment or manually coding analytical methods to solve a particular problem.
Early on in this research project, the authors attempted to apply the magnitude of mode shape method [4] to identify a cracked beam by themselves, but we encountered two unexpected issues that might also deter other engineers from effectively applying the method to their research work.
Firstly, the frequencies of several natural vibrational modes of an investigated beam had to be obtained from a costly and time-consuming measurement setup using sophisticated and specialized instruments.
Secondly, the operational steps of the curvature mode shape crack-identification method consist of determining the vertical displacement of points (nodes) in and on the beam and using those displacement values to construct curvature mode shapes, then identifying the crack location from the relationship between the flexural stiffness of points in and on the beam and the constructed curvature mode shapes. These operational steps were lengthy and time-consuming, both in program coding effort and computational time. Since the only necessary data point for identifying a crack is the flexural stiffness at that point, and since that point can be determined directly by a basic beam displacement measurement setup without any need for theoretical or experimental determination of natural vibrational modes, it will be simpler, easier and more efficient for engineers to use the proposed method.
In the operations of the proposed method, the authors observe the local peak of the absolute difference in the central difference approximation of the cracked beam and the uncracked beam at a point in or on the beam, obtained from the vertical displacement value of the beam at that point (the vertical displacement was a result of a load moving along the beam). This local peak is then the indicator of a crack. To summarize, a crack is observed as a positive peak at a point on or in a beam of the graph of vertical central difference approximation from vibration due to moving load versus position coordinates.
A moving load or mass induces vibration of the structural element along which it travels. It produces a larger deflection and a higher stress compared than an equivalent static load. The deflection is a function of both time and speed of the moving load.
Getting back to the practical disadvantage of the mode shape method, it is not easy to obtain an accurate magnitude of central difference approximation through differentiation of mode shape. Moreover, differentiation may further amplify measurement error. In contrast, since vertical displacement at a point in and on a beam is easy to obtain by a basic displacement sensor, the central difference approximation in or on every point of a beam can be readily determined by using central difference approximation. When central difference approximation values of displacement of all points are plotted on a graph, it will show a crack at a point (node) where a peak is located.

2.2.3. Detailed Operations in Each Main Module

As shown in Sub Section 2.2.1, the proposed system has three main modules. The operational procedure of each module is described in this subsection.
The first module is the dynamic deflection module, consisting of two steps. In the first step, from a specified velocity of the moving load parameter, external force acting on each specified node —1, 2, 3, …, m—as shown in Figure 2, this module determines the time step and the total number of time steps for average displacement calculation.
The time of contact T on a beam depends on the speed of the moving load on the beam contact surface. One-time step ΔT is calculated as below,
Δ T = T p n
where p is a specified number of intervals, and for each interval, n is the number of sub-intervals. the total number of time steps, N, for a specified speed of moving load is evaluated as below,
N = p n .
In the second step, the first module calculates the average displacement values of every node. Then, the displacement values at every point for each time step are summed, and the average displacement values at every point for the whole time T is calculated as a sum below,
w i = 1 N j = 1 N y i , j
where w i = the average displacement value at point i for the whole time T; y i , j = the displacement value at point i at time step j. i = Node label, 1, 2…, m; j = Number of time steps along which the load moves from one fixed end to the other open-end of the beam, 1, 2…, N.
The second module calculates the magnitude of central difference approximation of the average displacement value output obtained from the first module. This magnitude of central difference approximation of average displacement under moving load is calculated with central difference approximation as follows,
w i = | 1 N j = 1 N y i + 1 , j 2 1 N j = 1 N y i , j + 1 N j = 1 N y i 1 , j | / h 2
where w = the central difference approximation of average displacement of each node; y i , j = Displacement at node i at time step j; h = Length between two nodes.
This central difference approximation procedure was coded in MATLAB.
The third module calculates the absolute difference in the magnitude of central difference approximation of displacement between each node, which are parallel to one another on the uncracked beam and cracked beam (Section 2.1). It was also coded in MATLAB.

2.3. Finite Element Analysis of Beam Vibration under Moving Load

FEA analysis was run to evaluate the efficiency of the proposed method, as described in Section 2.2. Displacement results obtained from the FEA approach could be substituted into Equation (7) to obtain a graph of central difference approximation of displacement versus position, in which the location of an abnormal peak would be identified as the crack location. In this subsection, the background of this kind of finite element analysis is described.
Finite Element Analysis (FEA) is a simulation of physical phenomenon with a numerical technique called Finite Element Method. In our proposed method, vibration in or on every point (node) of the beam under moving load needs to be simulated with this numerical technique in combination with the parameters of the static beam. Therefore, the simulation needs to include a moving load to induce vibration.
The governing equation and boundary conditions of a beam vibrating under the influence of a moving load are Equations (8)–(12) below,
E I 4 y ( x , t ) x 4 + ρ A 2 y ( x , t ) t 2 = F δ ( x v t )
where E is the young’s modulus of elasticity of the beam; I is the second moment of inertia of the beam cross section; ρ is the material density of the beam; A is the area of cross section of the beam; x is the point of interest on the beam; v is the speed of load moving along the beam; t is time from the start. A simple beam model labelled with these variables is illustrated in Figure 3 below.
One end of the beam is fixed to a location (x = 0), while the other end (x = l) can move freely when a force is acting on it, hence
y ( 0 , t ) = 0
y ( 0 , t ) x = 0
2 y ( l , t ) x 2 = 0
3 y ( l , t ) x 3 = 0
In an FEA simulation, those equations above are represented by the matrix equation below, Equation (13), reported by Lee [24],
[ M ] { D ¨ } + [ K ] { D } = { F }
where [ M ] is the n × n mass matrix of the discrete system; [ K ] Is the n × n stiffness matrix of the discrete system; { D } Is the n × 1 vector of displacement magnitude of every node in the discrete system; { F } Is the n × 1 vector of external forces on every node in the discrete system.
These matrix equations are selectable in the transient structure analysis module of a popular FEA software named ANSYS, and are familiar to every engineer.
The FE settings for the dimensions and material properties of the beam for every simulation run are tabulated in Table 1 below, following exactly those values for the beam in an analytical work of Lin and Chang [25]. The input of the beam was a 3D model of the beam, created by SolidWork software. The dimensions of the beam were already specified in the creation of the 3D model, but the material property settings were specified in the Ansys FEA software [26]. The outputs were values of vertical displacement of every node in a Microsoft Excel file.
In detail, a number of FE simulation runs were carried out on a 3D model of a cantilever beam hosting a transverse notch (representing a physical crack). A three-dimensional geometrical model of solid cantilever beam, constructed with SolidWorks software and saved as an IGES file, was imported into the ANSYS software.

2.4. Evaluation of the Finite Analysis Model and Transient Simulation

To ensure the suitability of the FE model and the transient simulation of the cracked cantilever beam, we verified them against the results of a study by Lin and Chang [25] of a cantilever beam with the same dimensions and mechanical properties. The verification process against the analytical solution of their investigated beam was done in two approaches: (i) verifying by using natural transverse frequency with Fourier analysis and (ii) verifying by using forced deflection responses at the free end of the cracked cantilever beam under moving load.
The first approach used a model of cracked cantilever beam with a modeled crack at x1/l = 0.3 and a notch depth of 30% of the beam thickness. An impulse load was applied on the free end. The magnitude of this load was 100 N applied for 0.001 s on one node at the free end of the cantilever, as shown in Figure 4. A transient analysis of the beam was conducted in ANSYS to simulate the free vibration response of the beam due to the impulse load. The length of the beam, L, was 580 mm. A Newmark’s integration scheme was employed as the solver, and the time increment was kept fixed at 0.000025 s. After the impulse load was applied, the free vibration of the beam was calculated up to 0.1 s. The first three natural frequencies of the beam, calculated by applying fast Fourier transform of acceleration at the mid-span of the beam, were then compared with the analytical values obtained from the closed form solution reported in [25]. As listed in Table 2, the FE results were less than 3% different from the analytical results, indicating that the FE model and the transient analysis were reasonably accurate in simulating the dynamic behavior of the beam.
The second approach compared the forced deflection responses at the free end of the cracked cantilever beam under moving load (from the proposed method) and those from the analytical method. The speed of the moving load was 0.6 time of the critical speed ( V c r i t ). This speed was 0.6 time critical speed V c r i t , where V c r i t was defined as V c r i t = 1.8751 / L ( E I / ρ A ) by Lin and Chang [25]. A speed higher than this critical speed would cause insignificant deflection, while a speed lower than this speed will make the deflection more clearly observable. The forced displacement responses from this model’s FE analysis at the free end of the cracked cantilever beam under moving load was plotted against the analytical results in the paper by Lin and Chang [25], and it can be clearly seen that the two curves trace one another closely almost everywhere, shown in Figure 5, indicating the accuracy of the proposed model in this experimental range.

2.5. Evaluation of the Proposed Method

The location of a crack found by the proposed method was evaluated against that detected by the mode shape curvature method in the paper by Pendy et al. [5]. In the evaluation of the proposed method, calculation of displacement at each point in and on the beam in response to moving load was performed by ANSYS. The displacement calculation method, selected from a menu in ANSYS, was the Newmark’s integration scheme, with a fixed time increment of 0.00001 s.
The assigned 3D model and FEA settings were the following.
  • Element type Selection: SOLID 186 Hex 20 node brick elements.
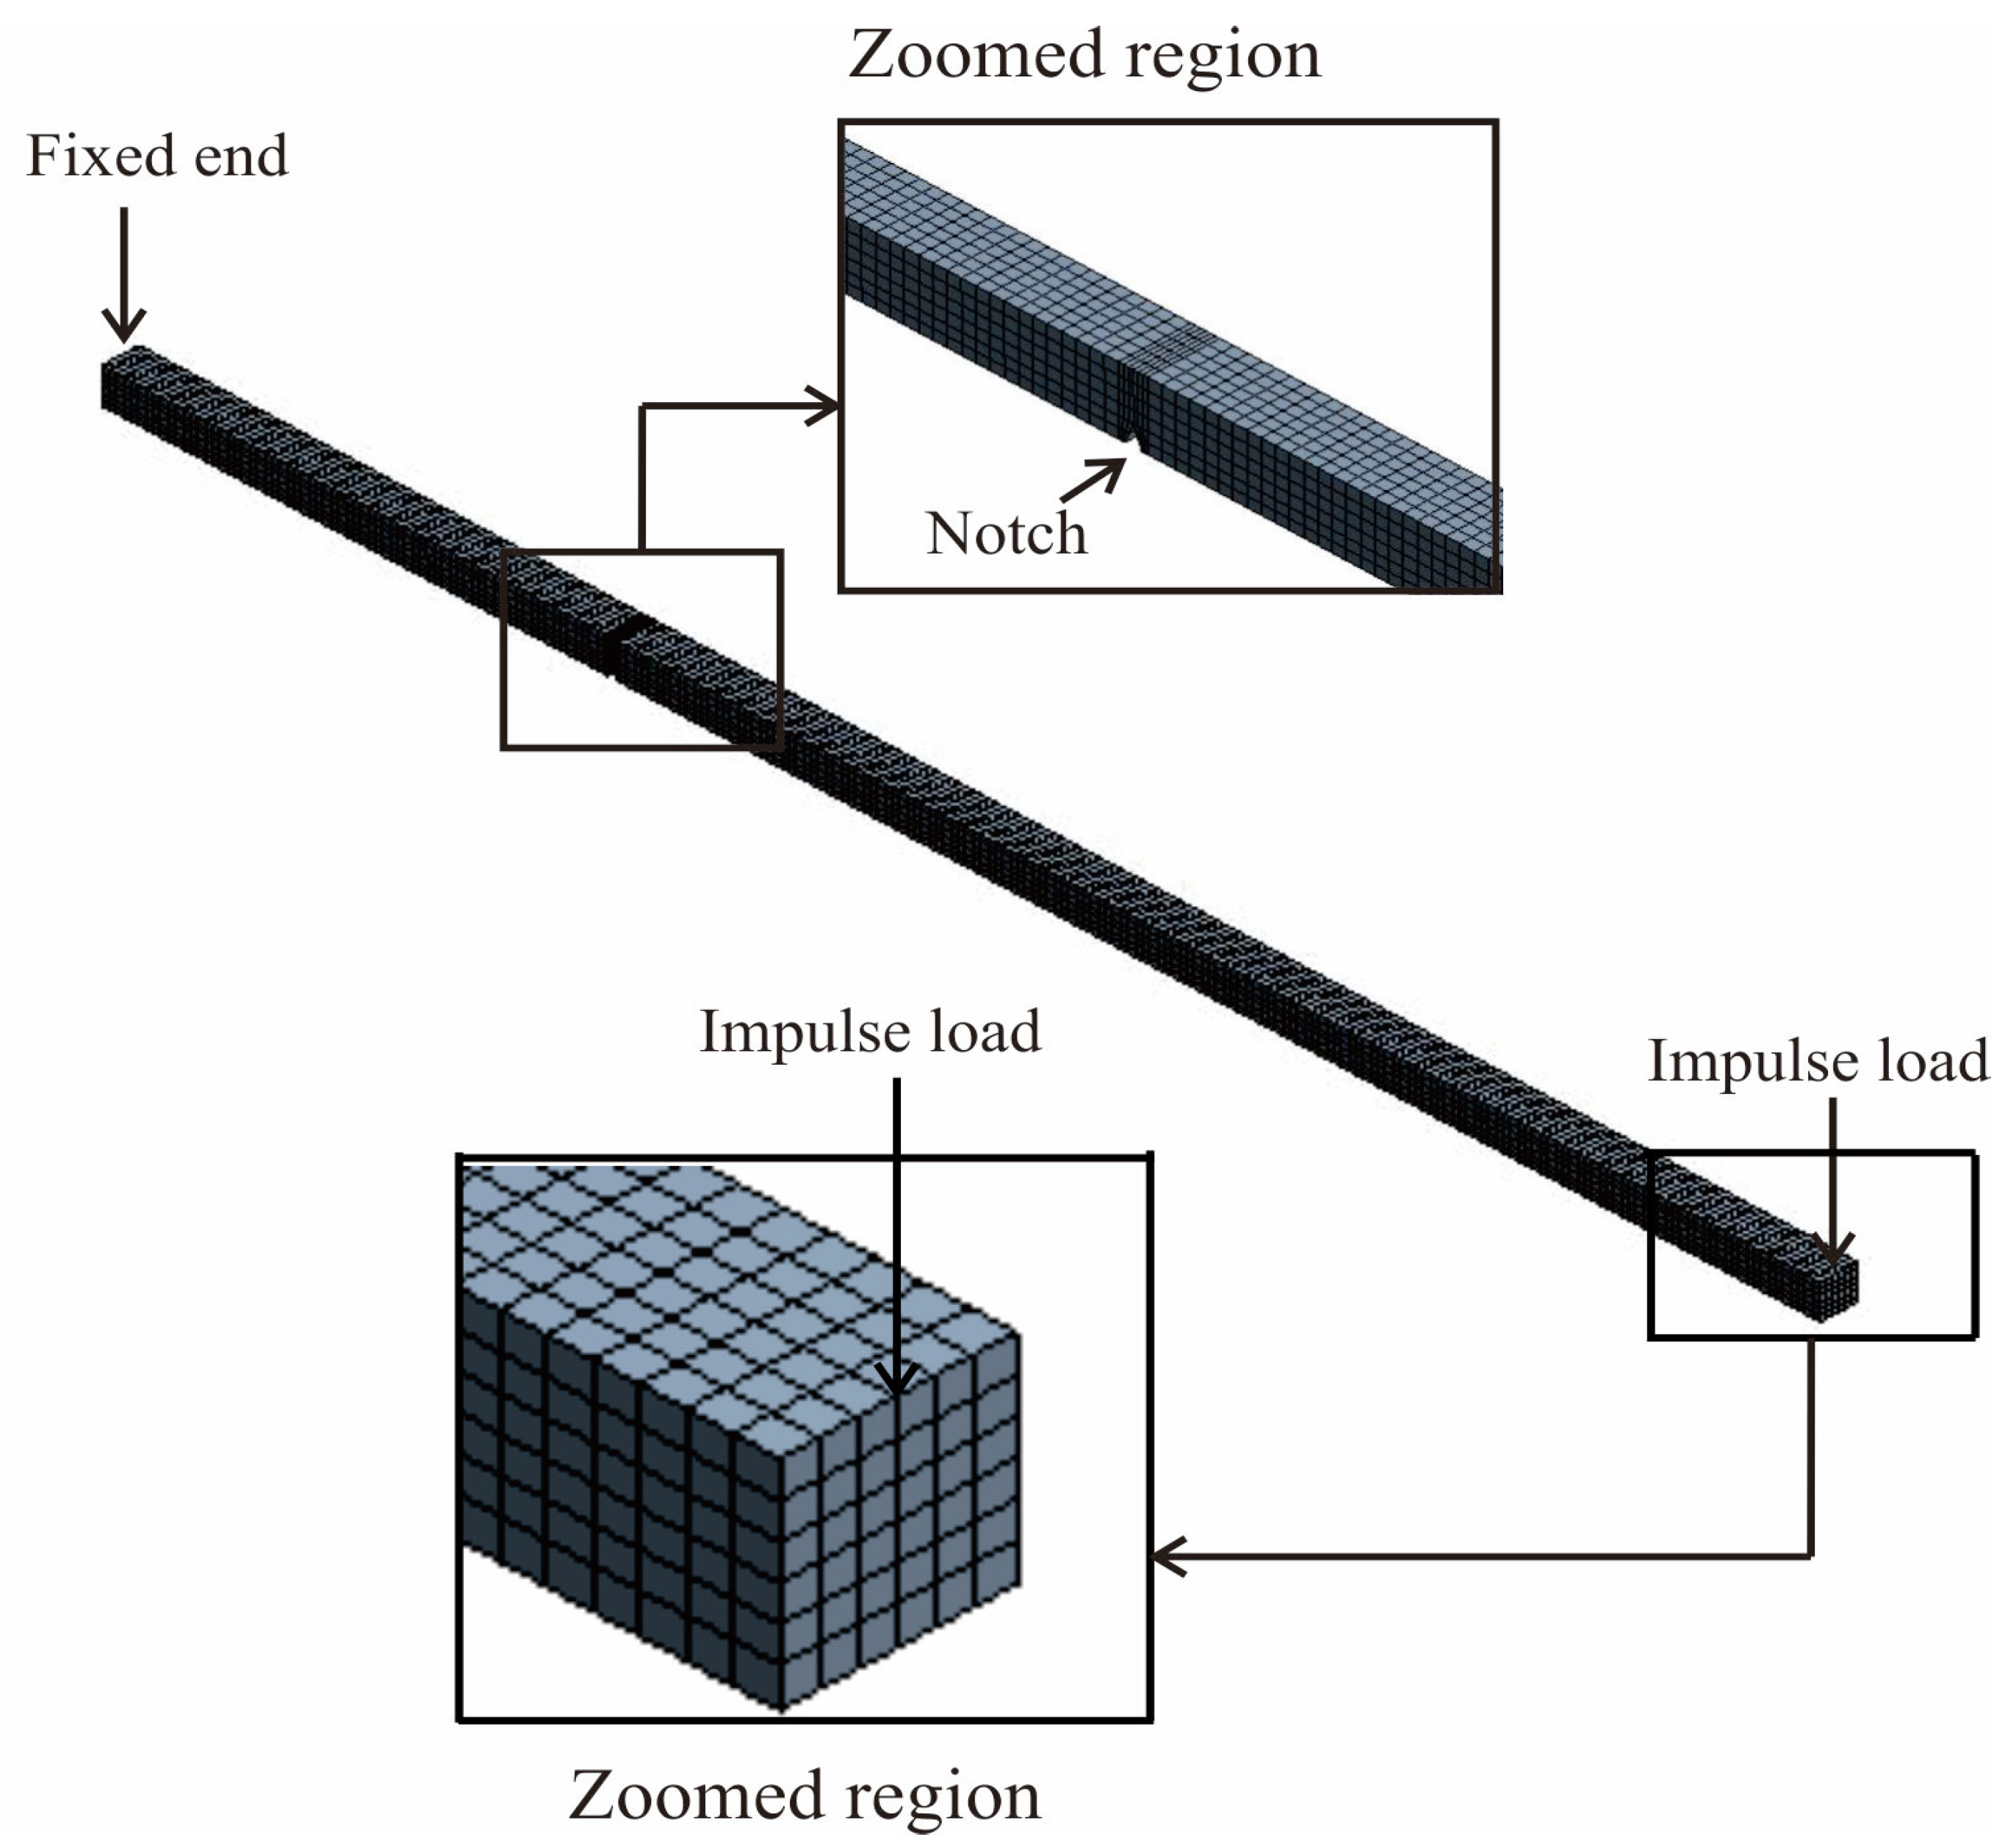
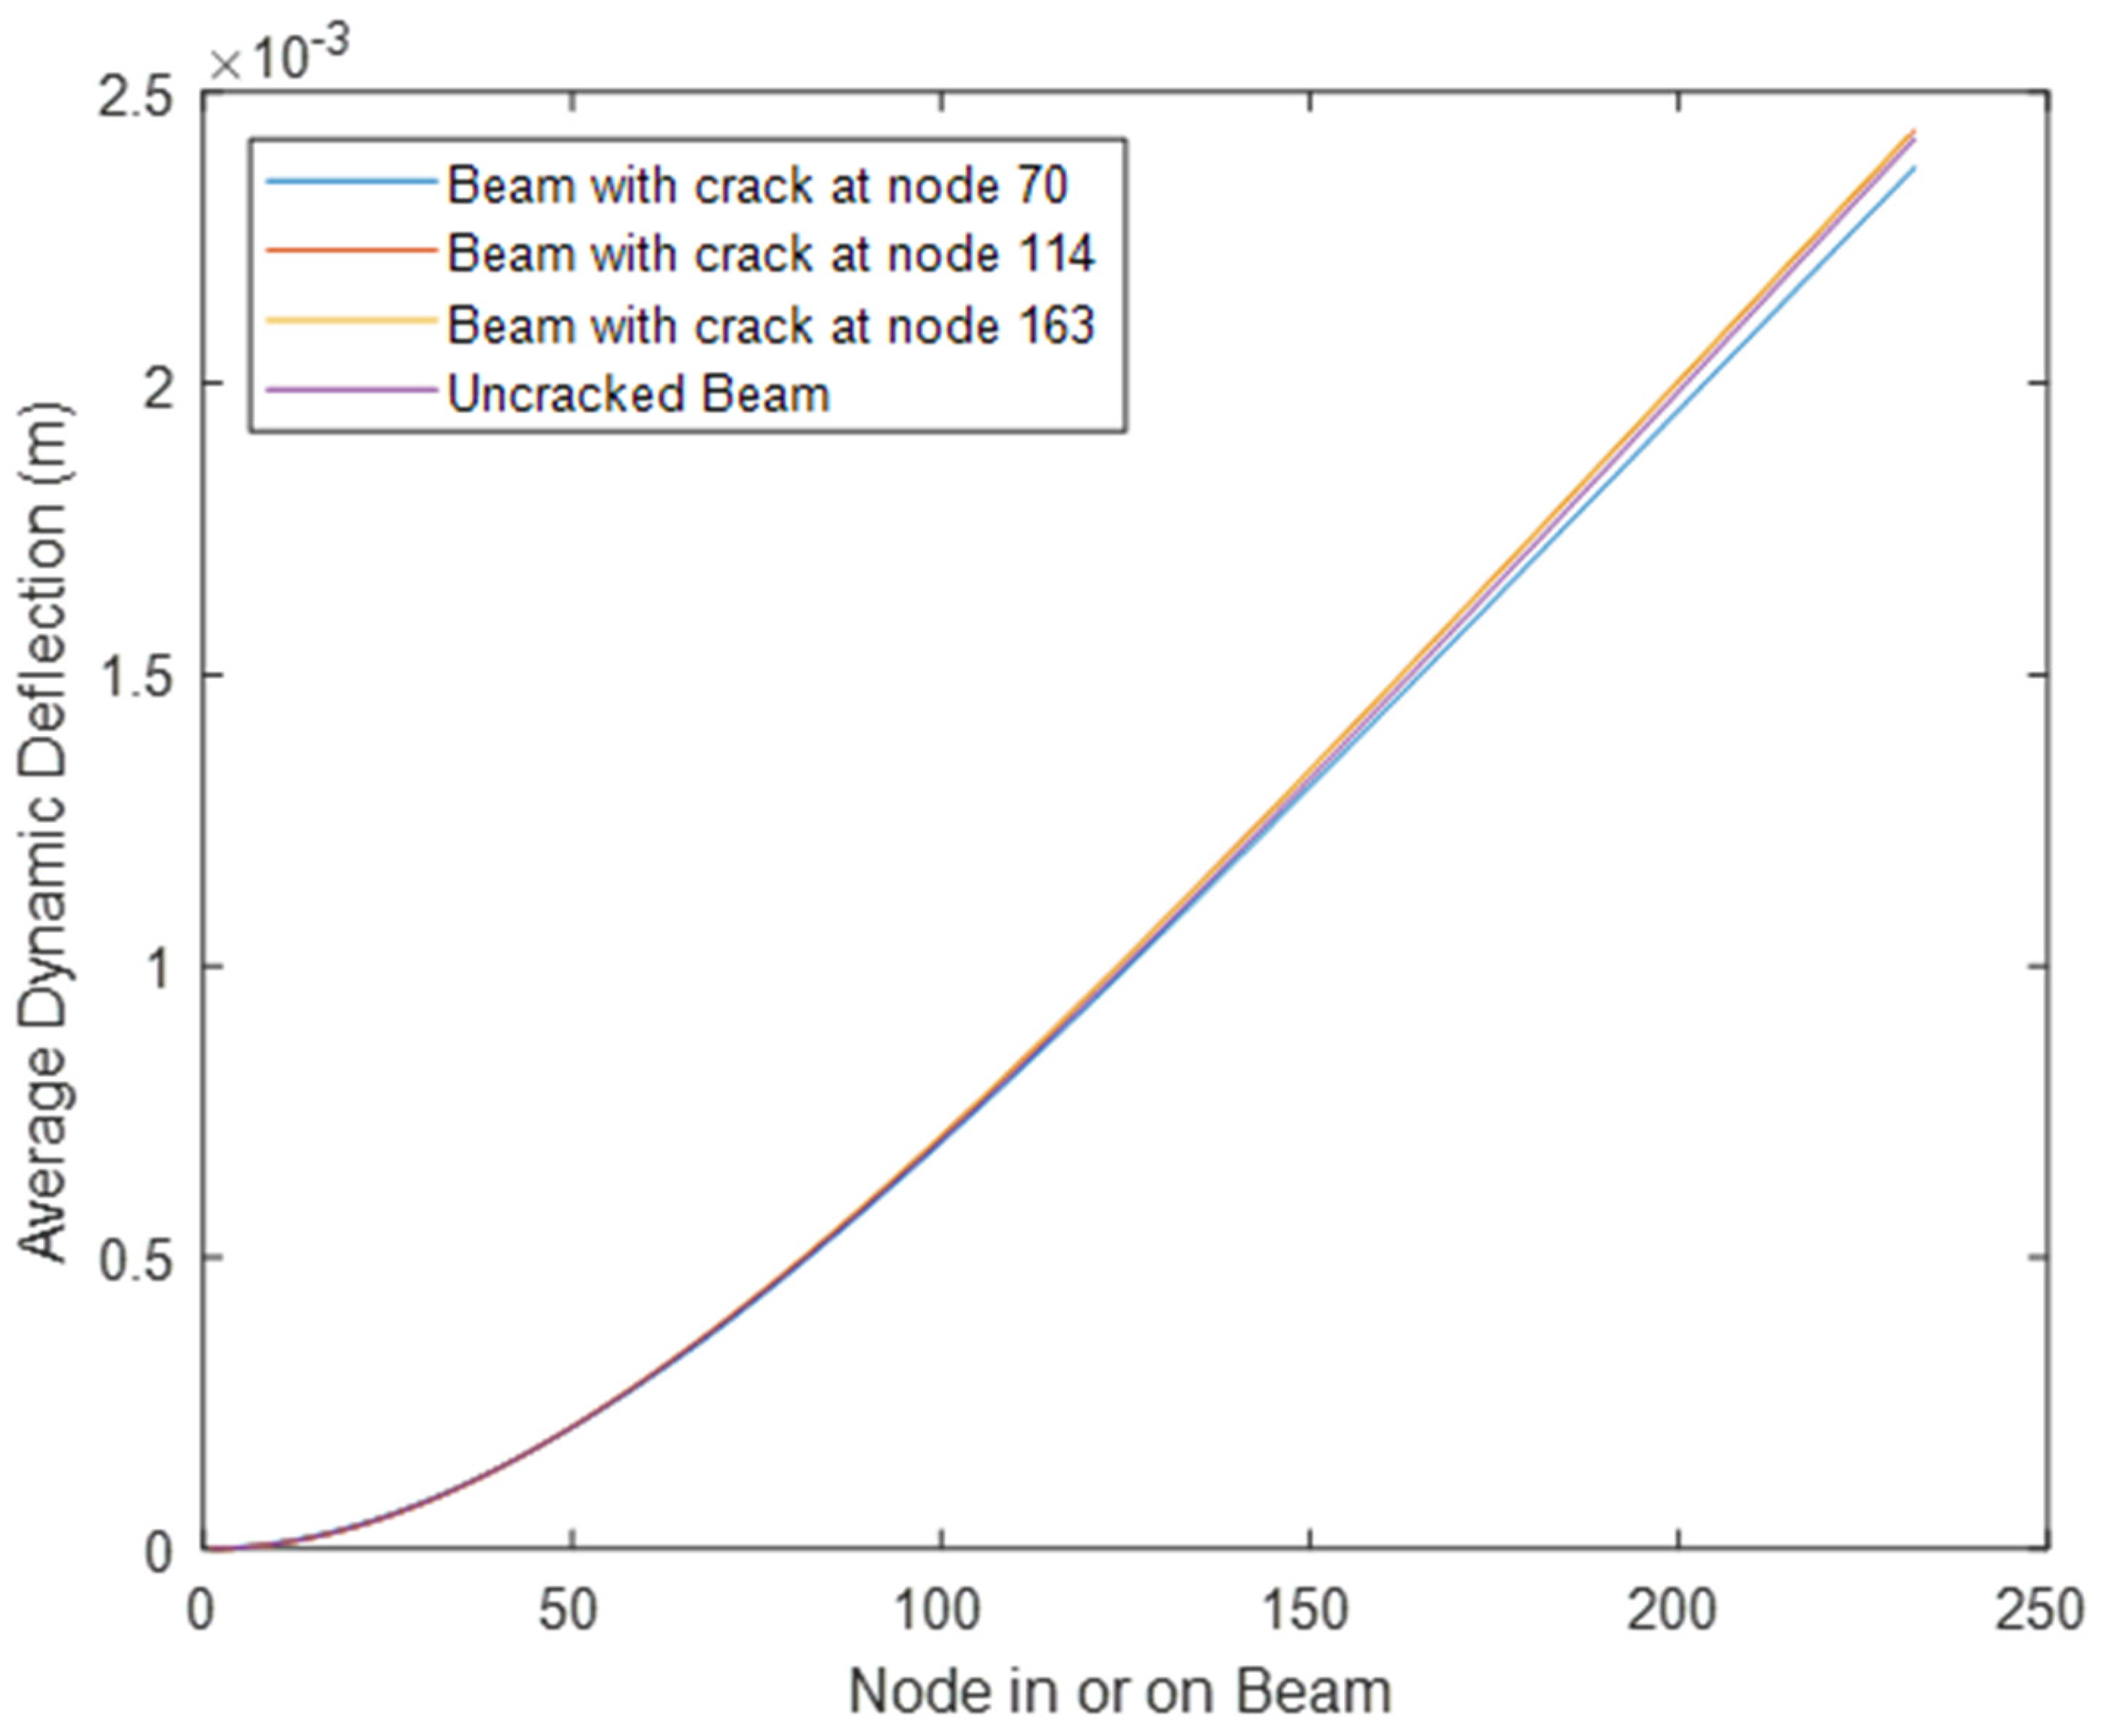
  • FE Model Creation (Meshing): Mesh generation is a process of dividing the structure continuum into a number of discrete parts or finite elements. In this study, the uncracked beam was assigned a total number of FE elements of 4620 and the total number of nodes of 24,768. For the cracked beam, the total number of elements was the same, at 4620, but the number of nodes were higher, at 2.4803, because a higher number of meshes were assigned at the crack region to model it more precisely. The meshes were constructed using 232 rows of elements along the length of the beam, six rows of elements across the width, and four rows of elements through its depth or thickness. The maximum size of a mesh was 0.25 mm. The boundary condition for one end of the beam was that it was fixed to a location in the environment, while the boundary condition for the other end was that it could move freely in response to various forces acting on it. The illustration of the meshed FE model of the cracked beam is shown in Figure 4.
  • Assigned material properties: assigned Young’s modulus and Poisson’s ratio are listed in Table 1.
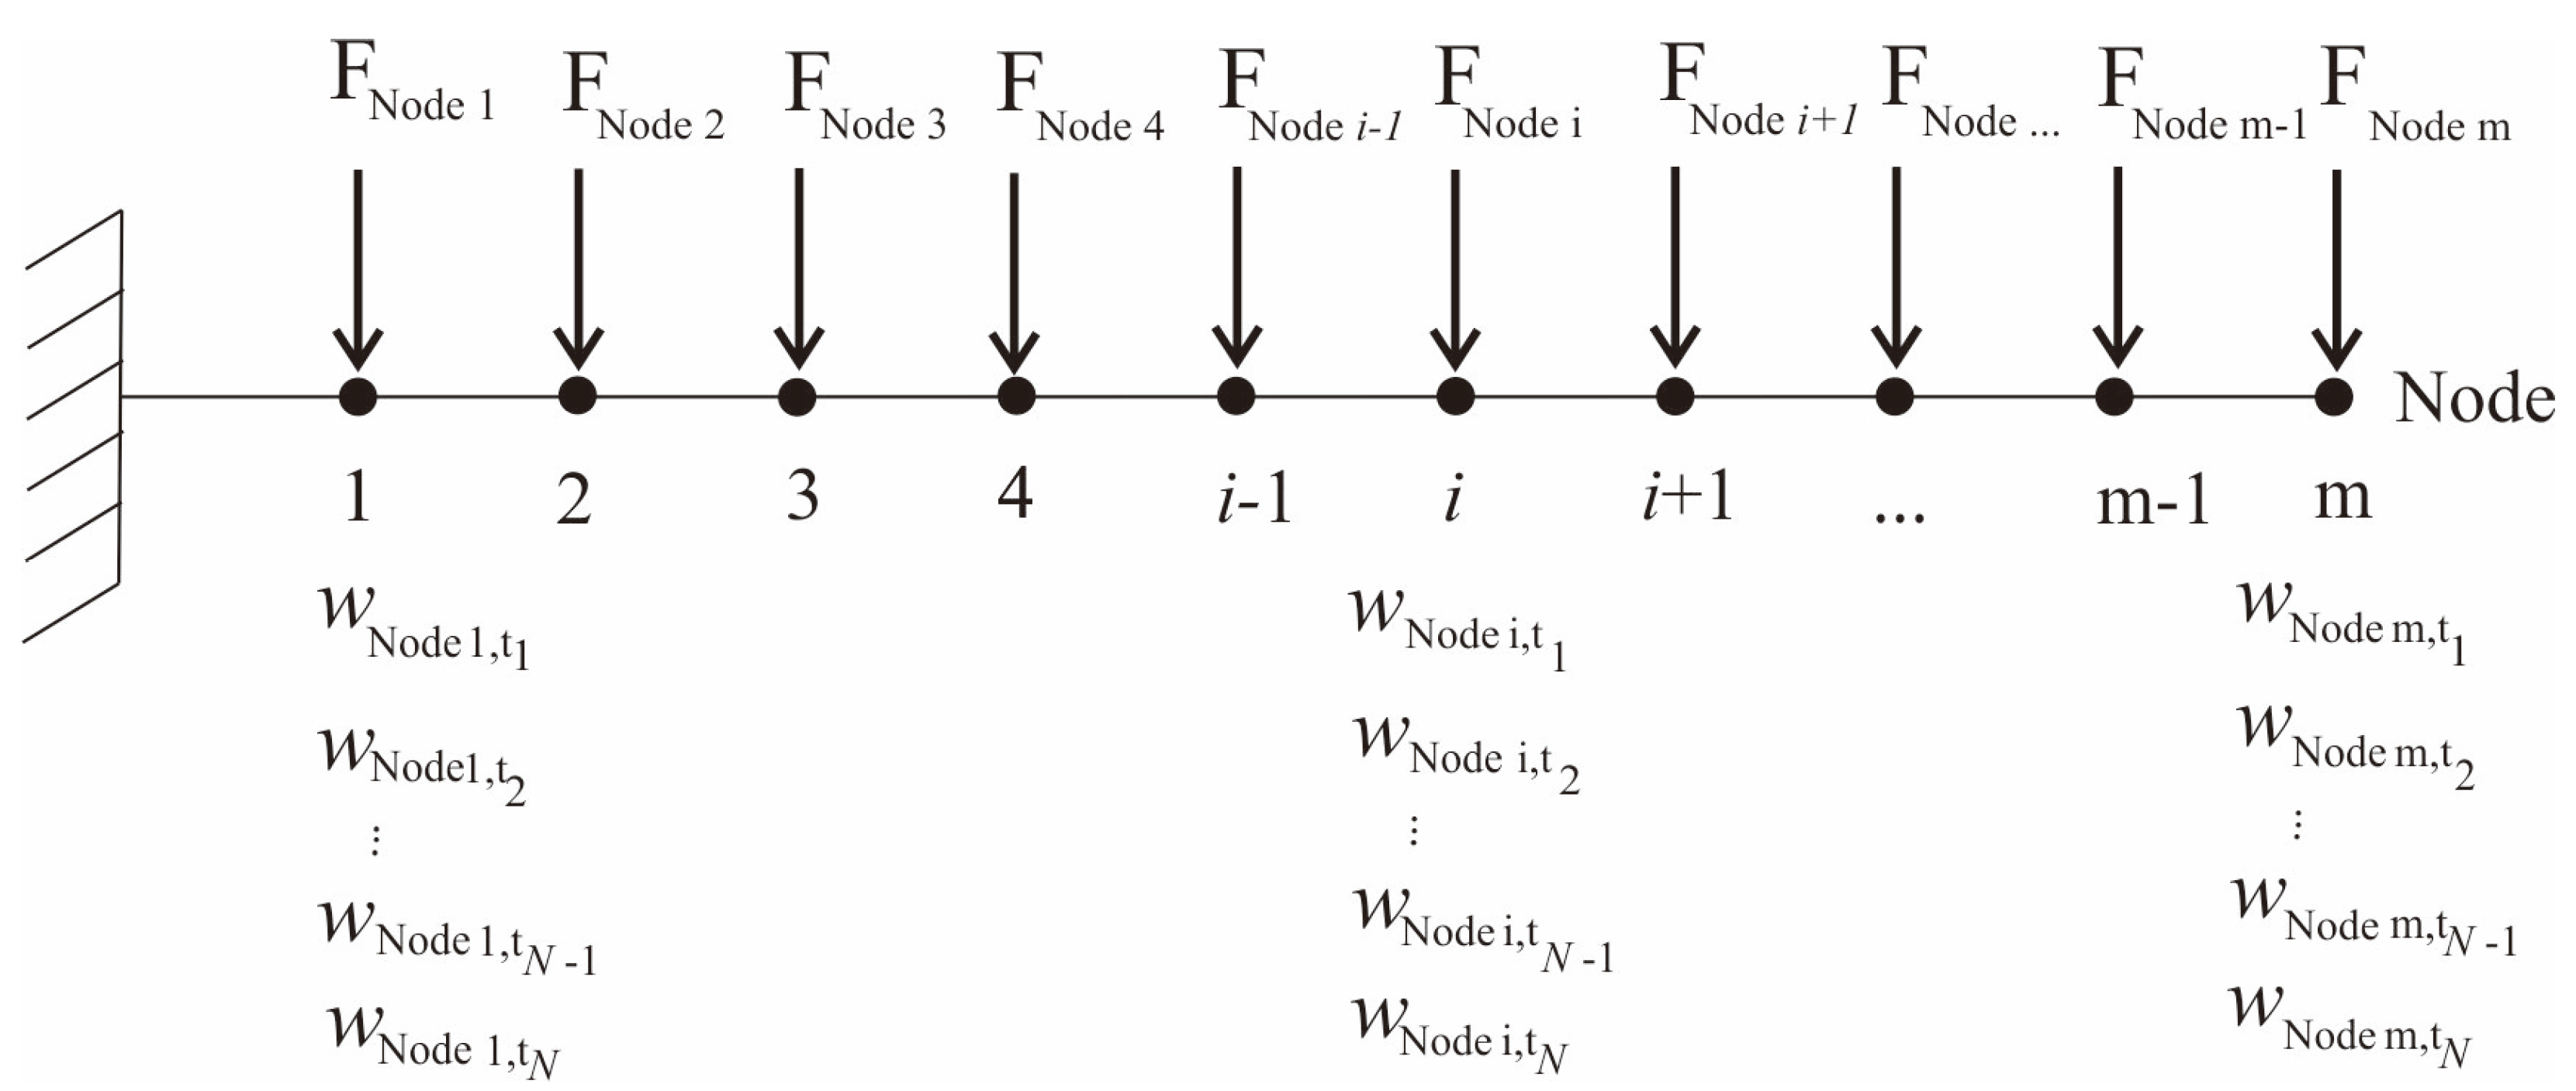
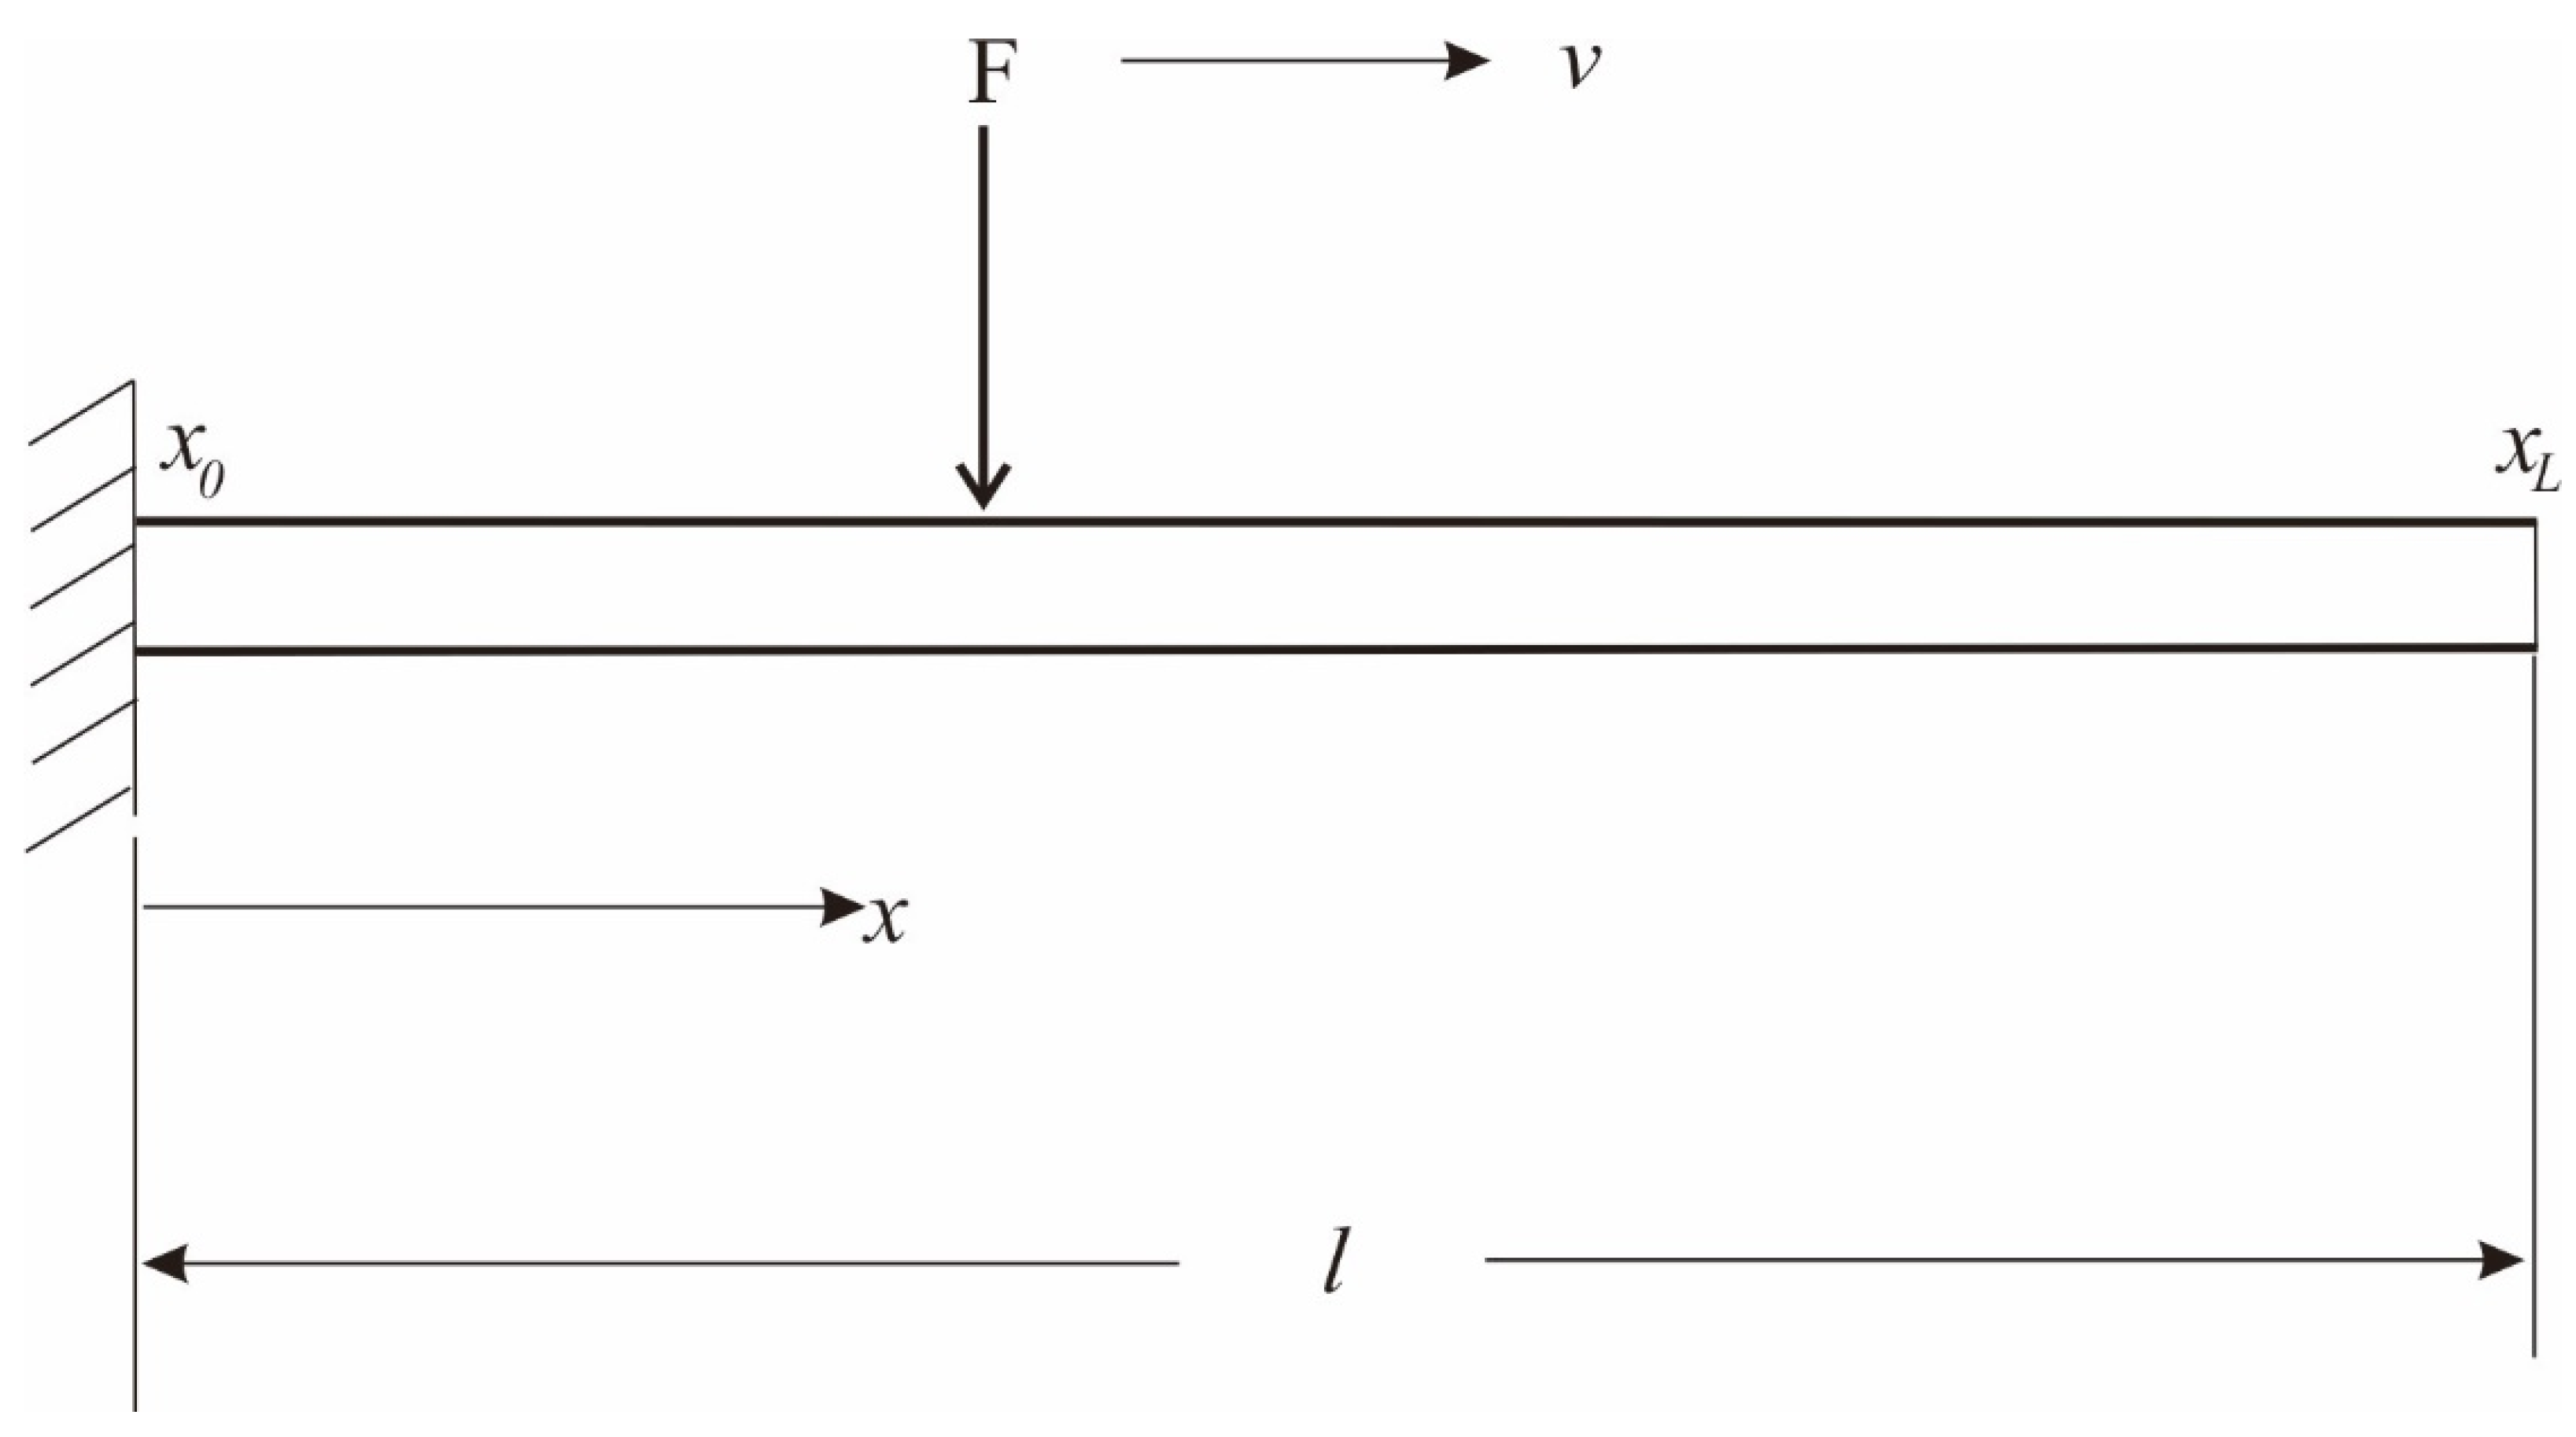
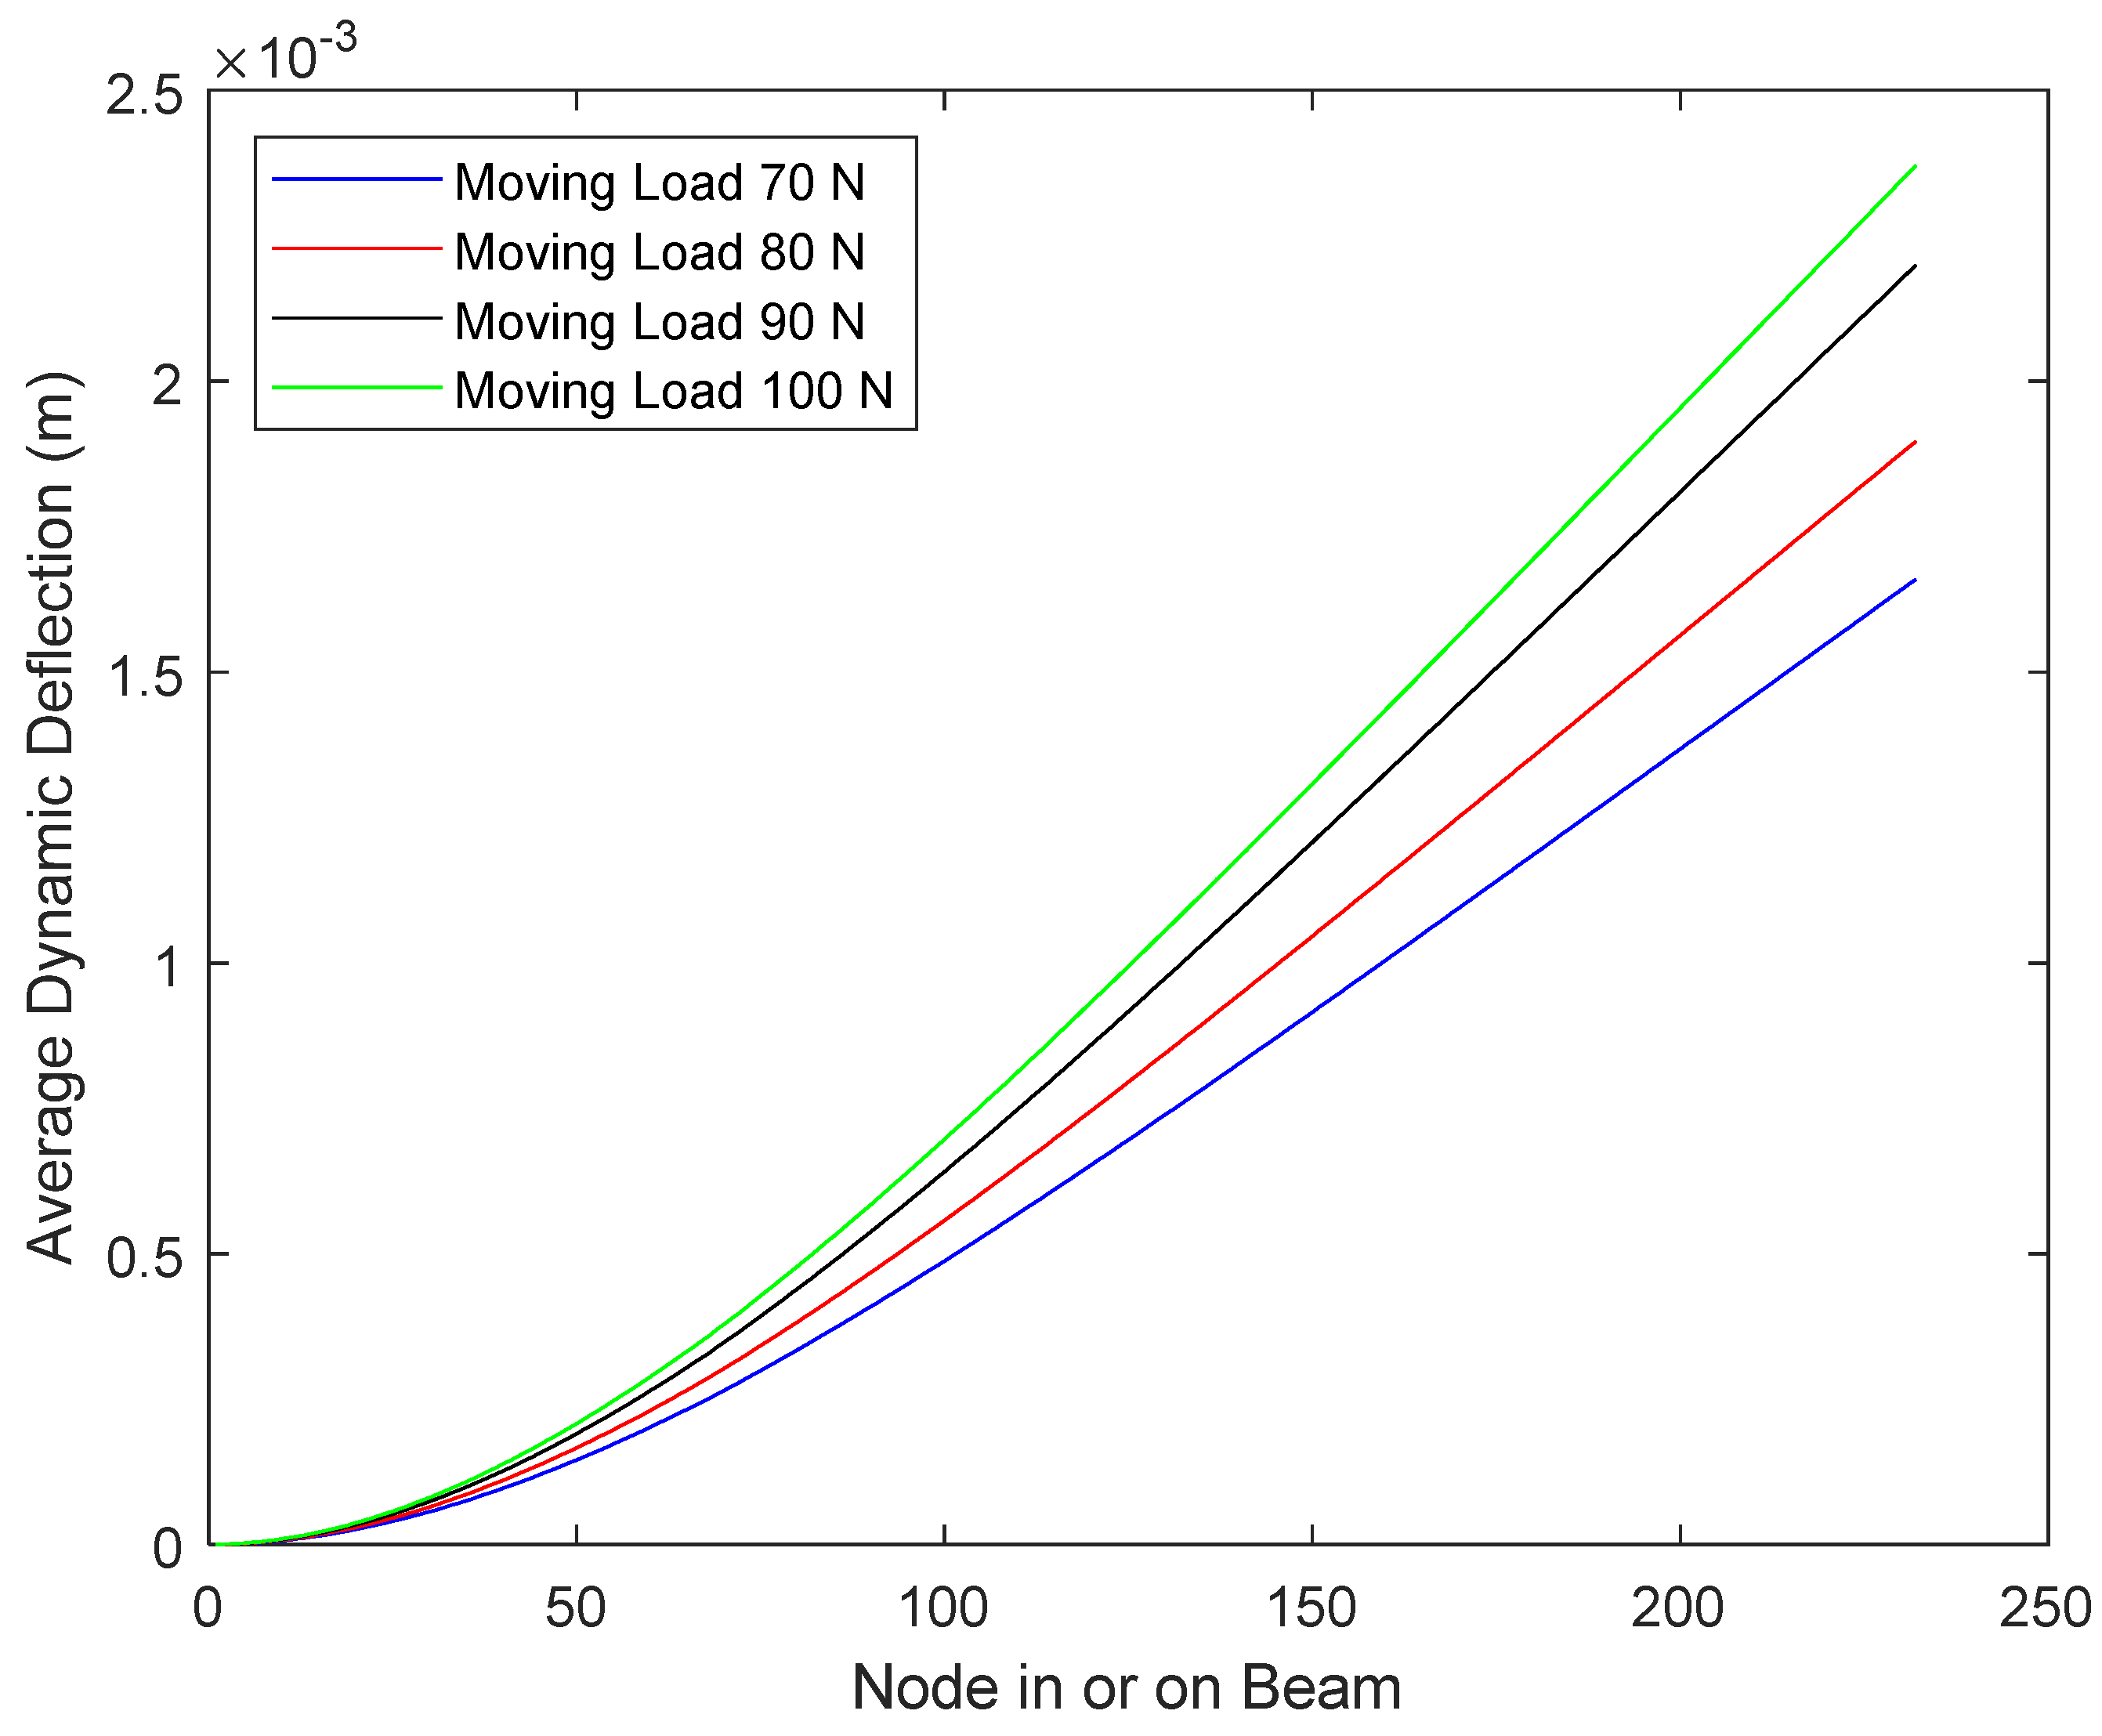
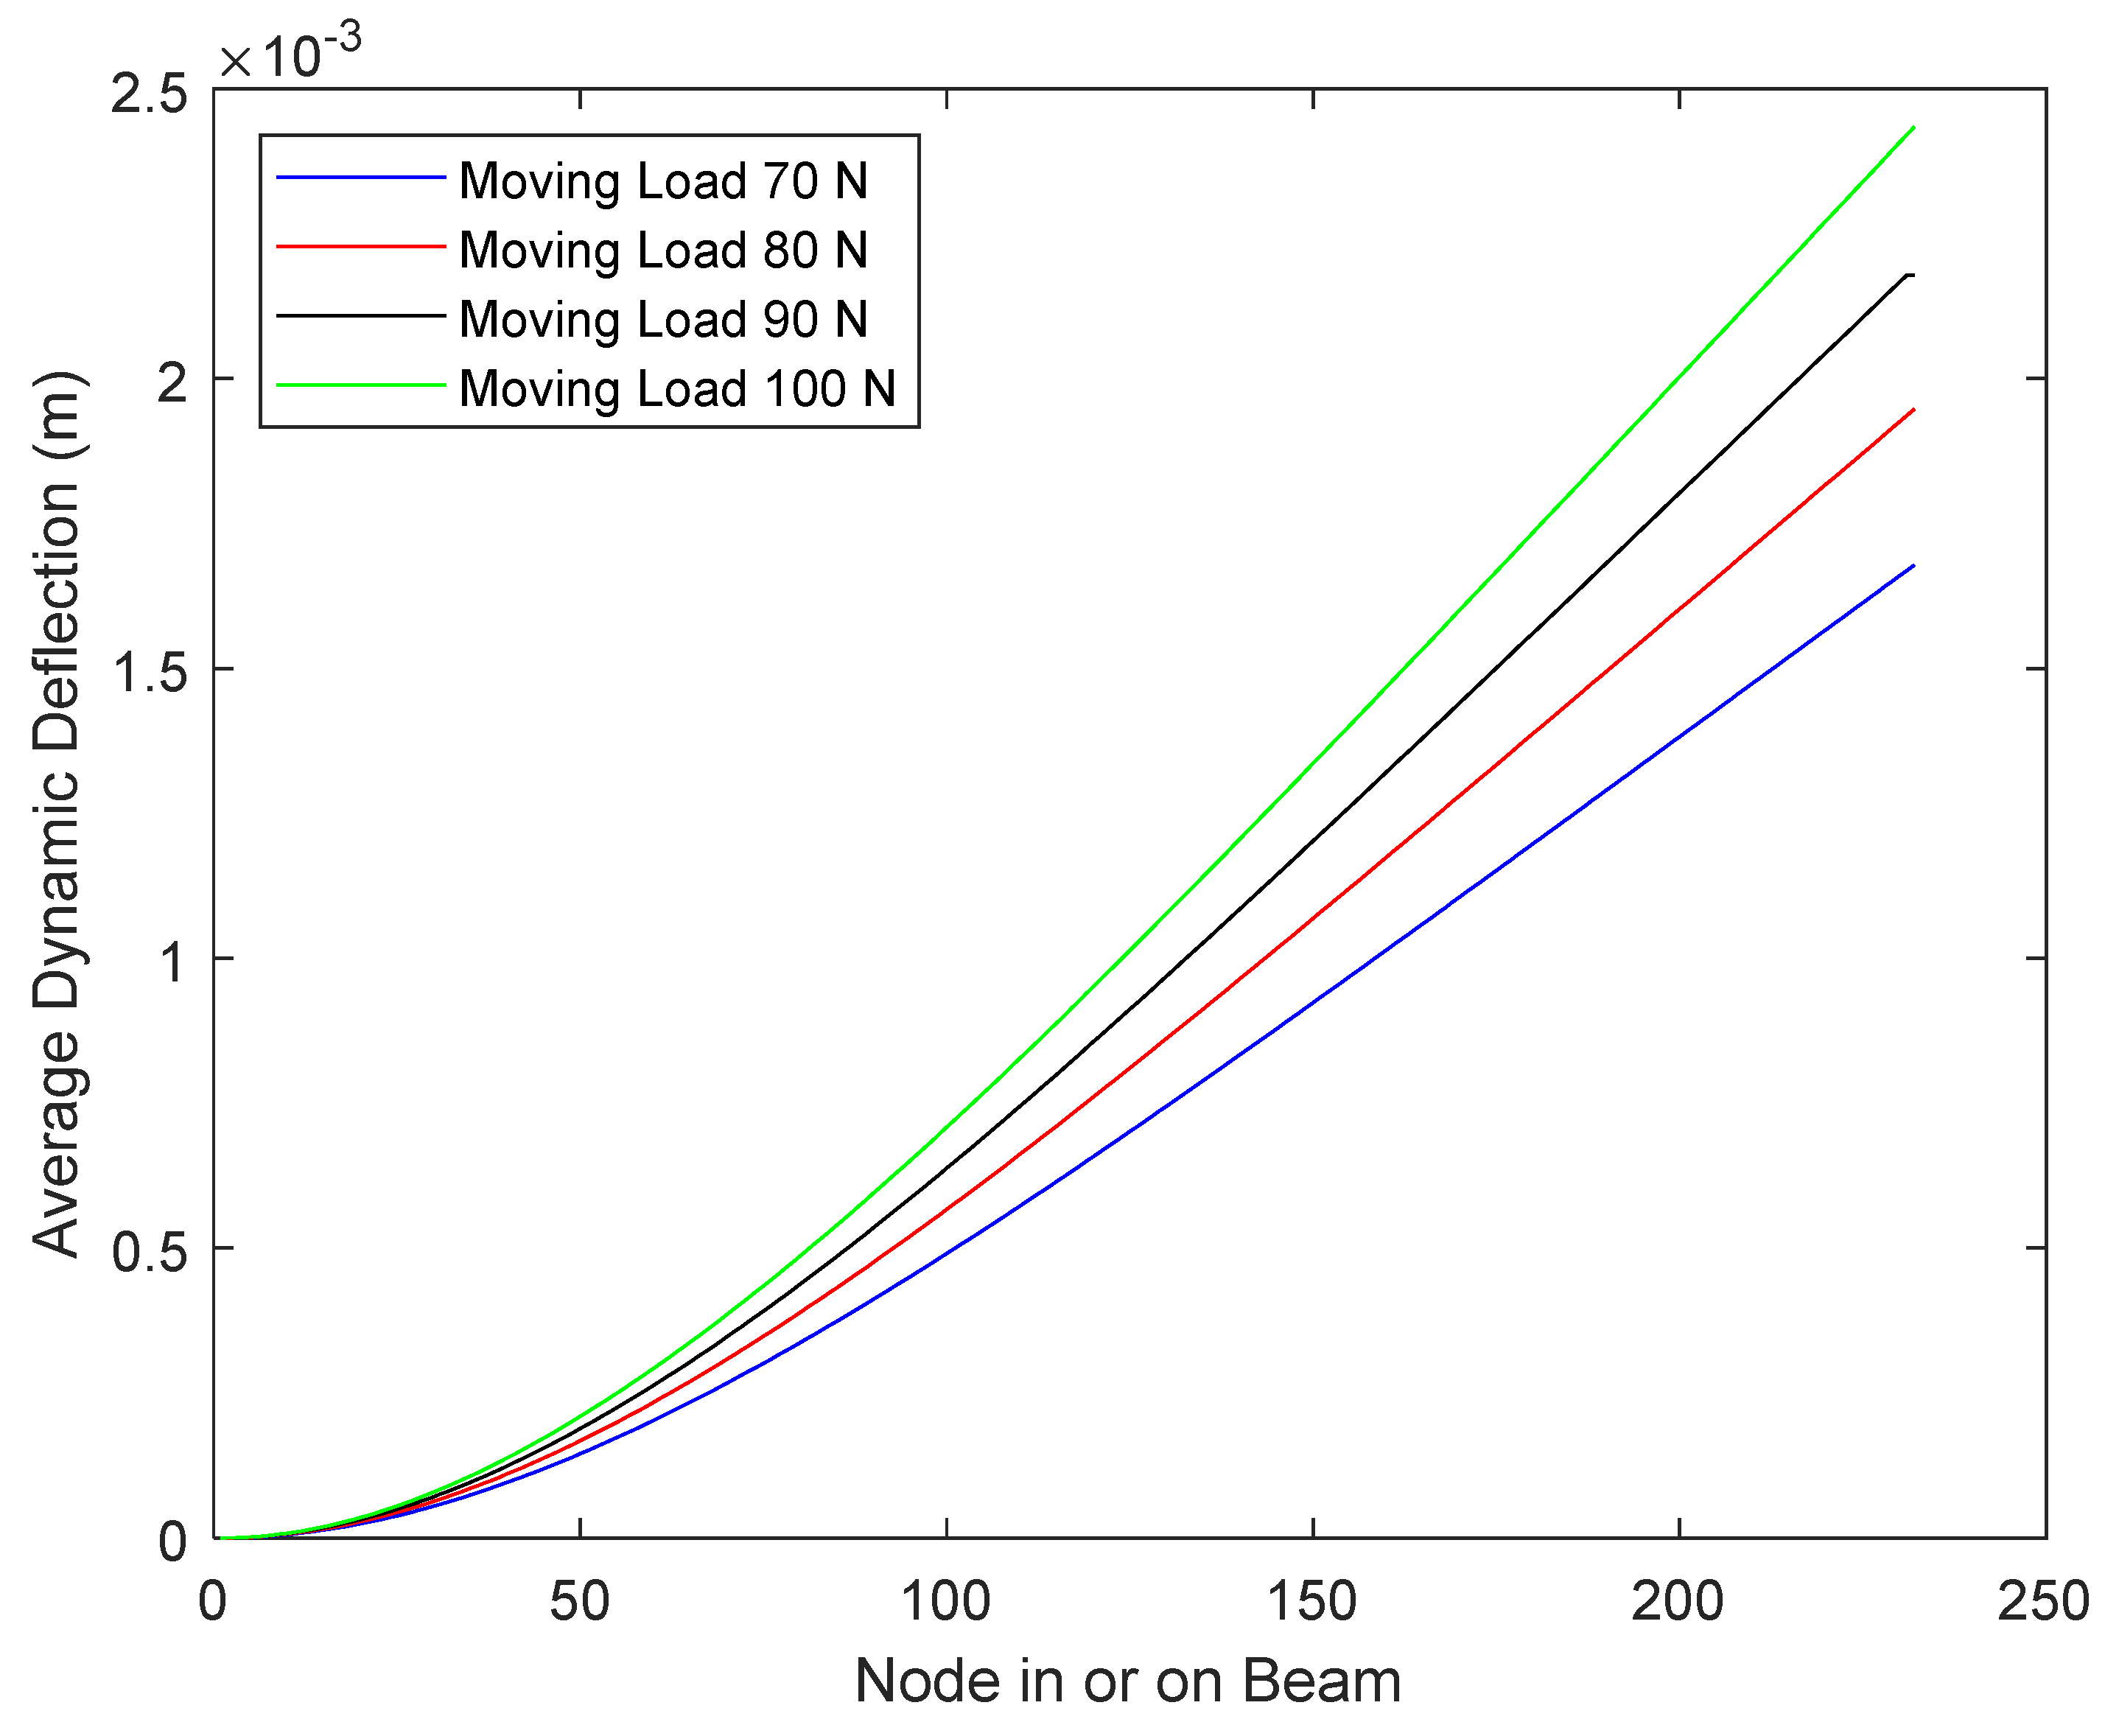
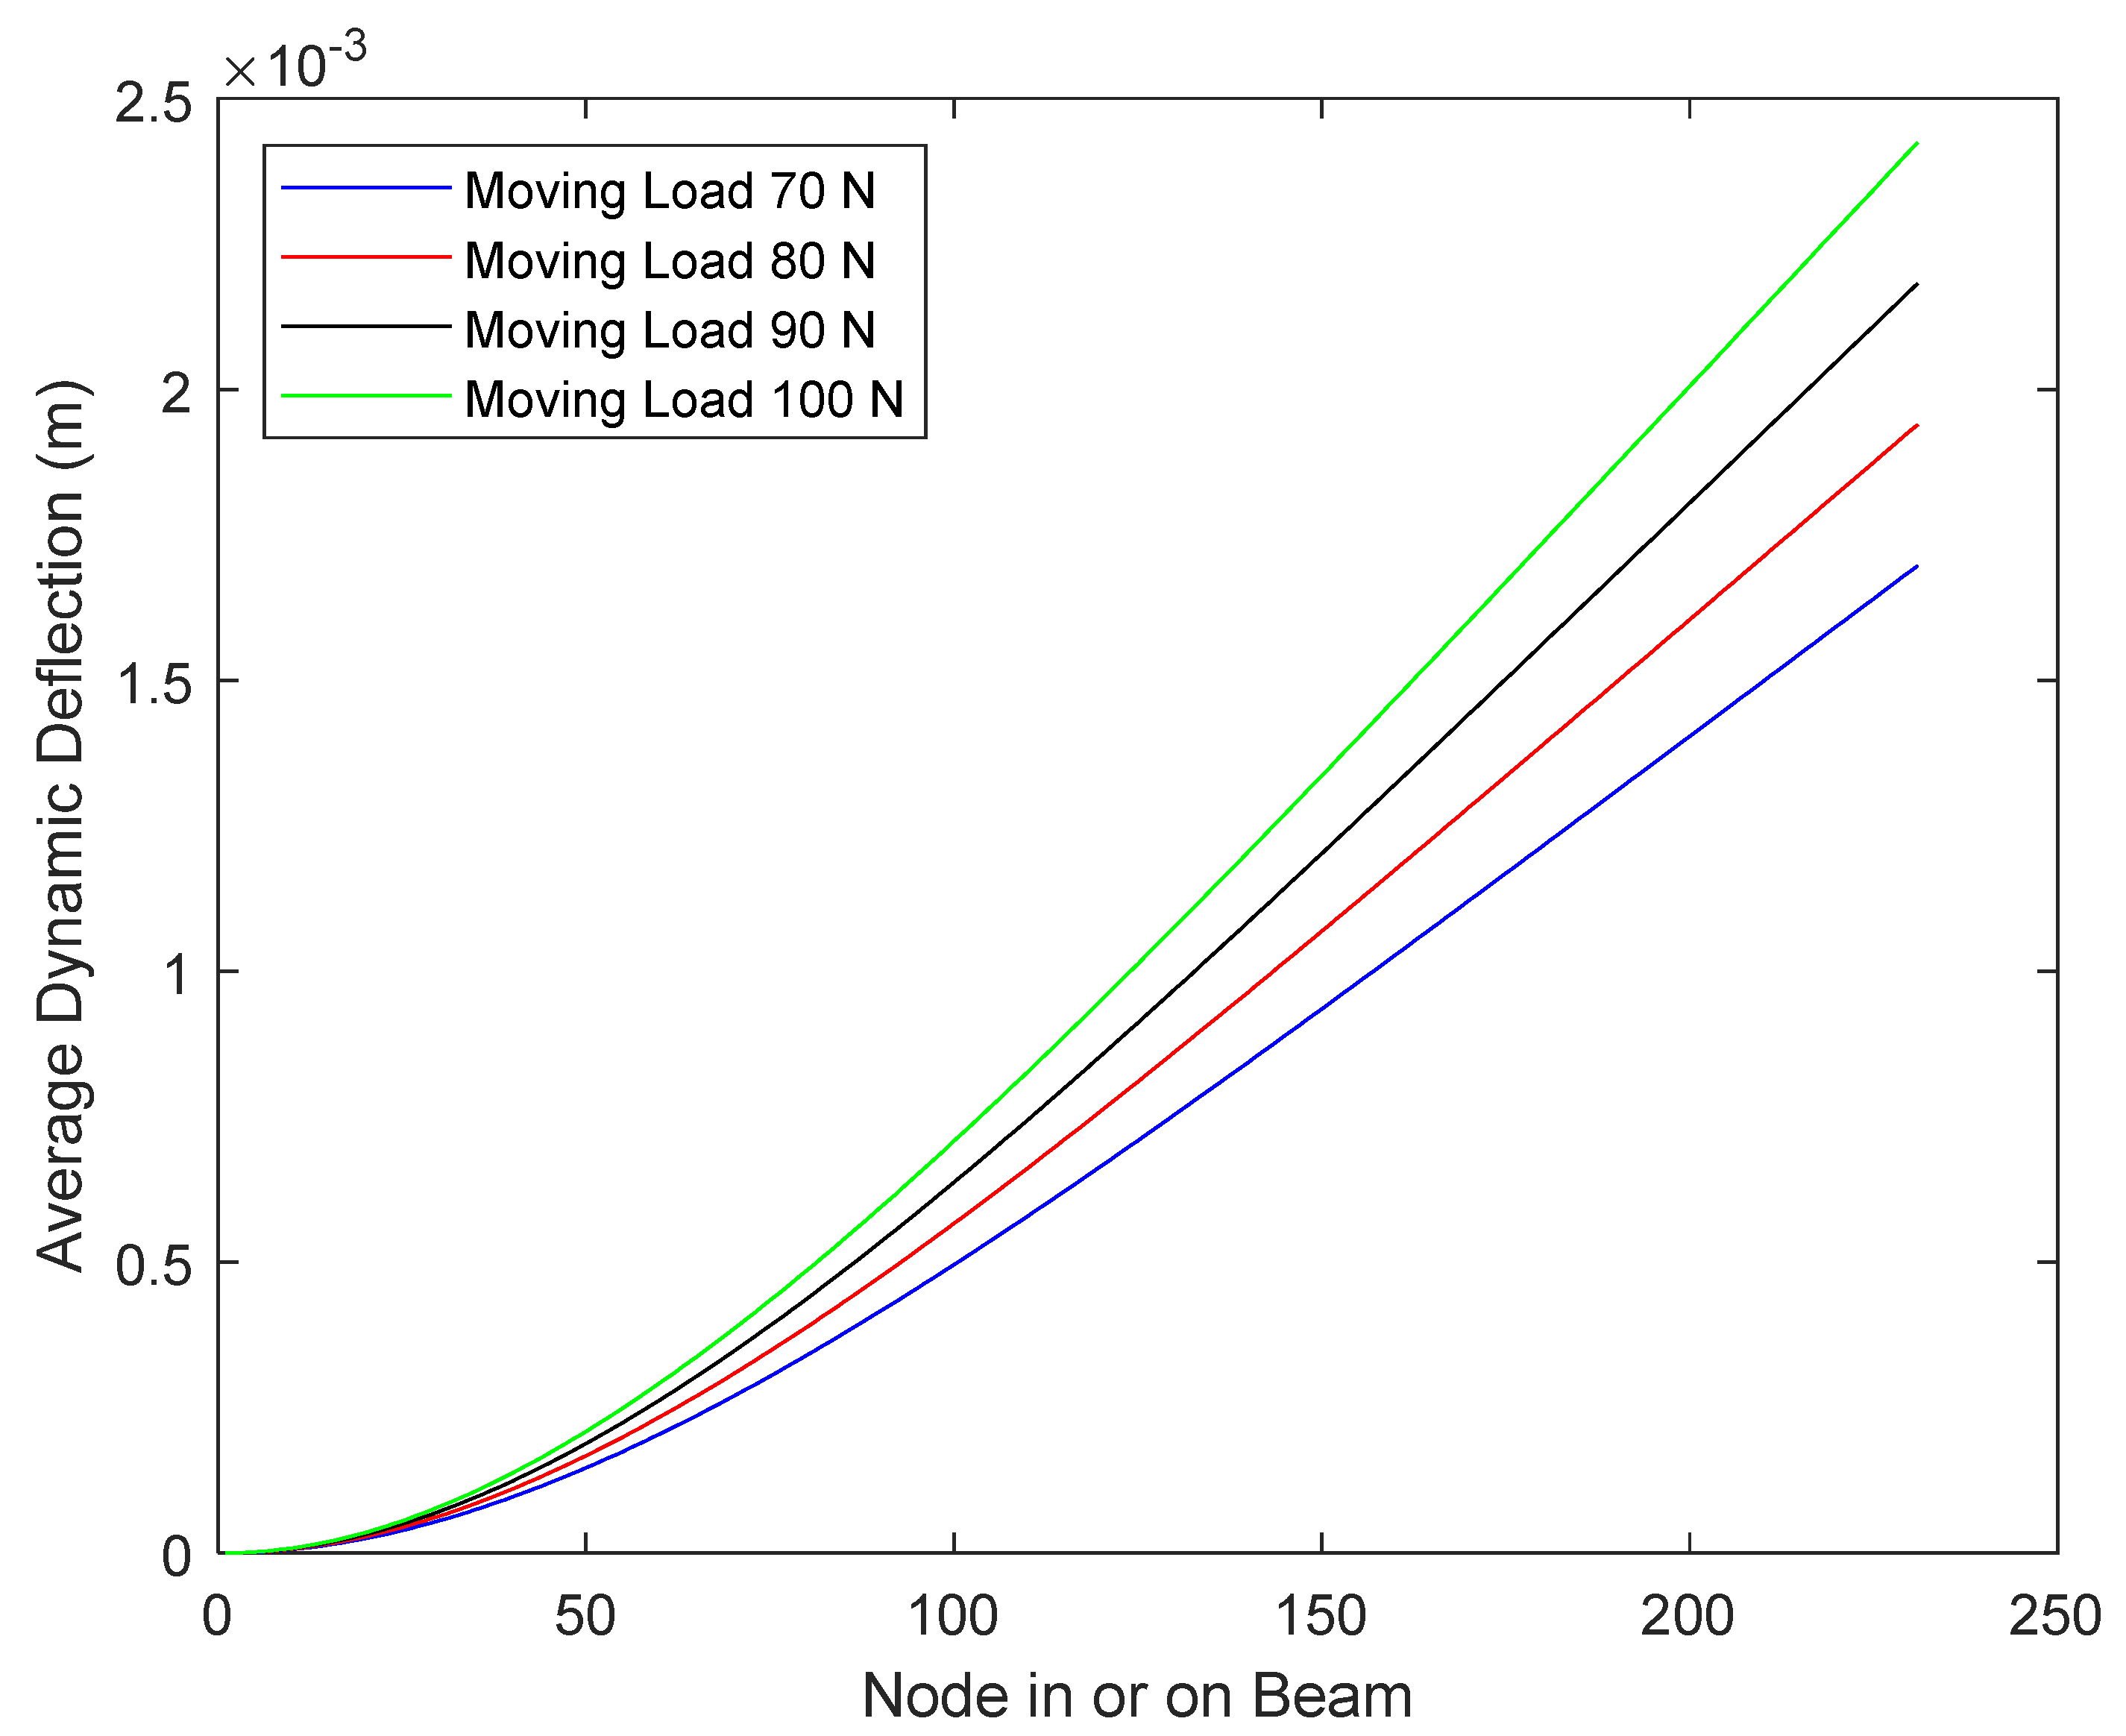
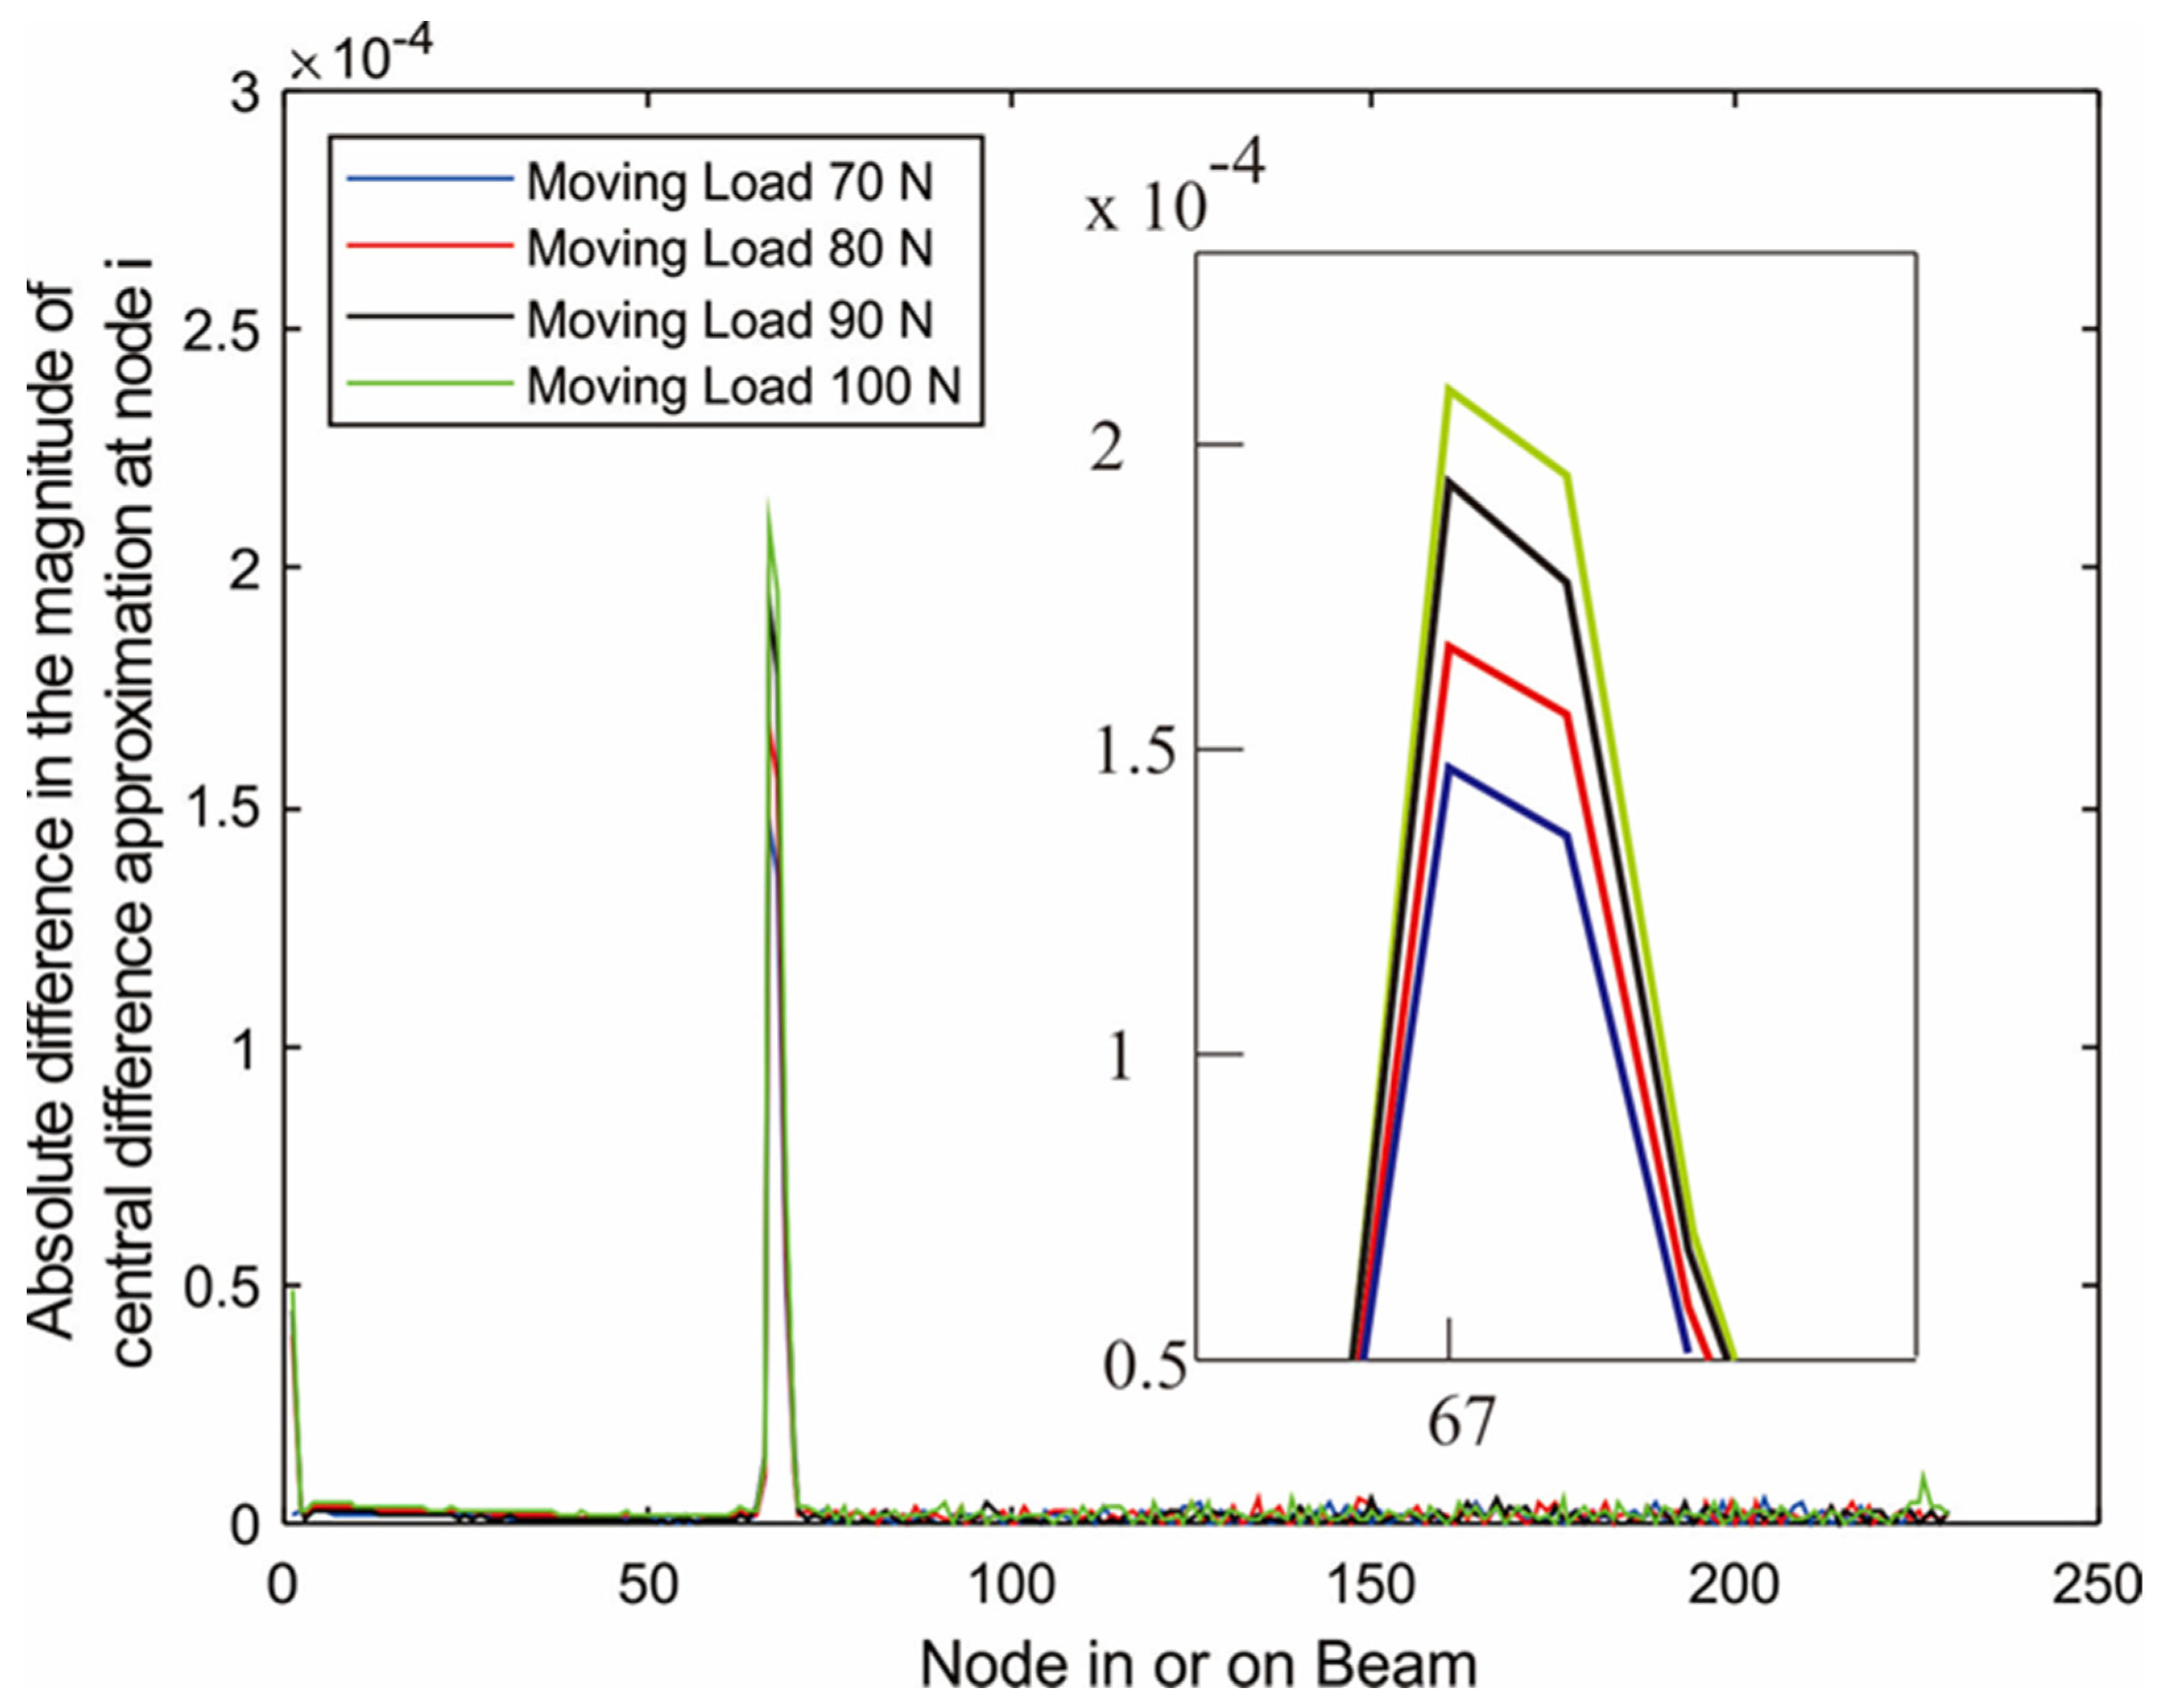
  • Applied loads: concentrated load (F) acting on a point of contact on the surface of the cantilever beam, moving from the left end to the right end of the beam at a speed of 30.9 m/s. This speed was 0.6 time critical speed V c r i t as defined by Lin and Chang [25]. The tested magnitudes of the moving load were 70 N, 80 N, 90 N, and 100 N. Five replications were conducted for each magnitude. The goal was to determine which moving load magnitude would provide the most distinguishable peak in a graph of central difference approximation of displacement versus location coordinates (detailed in Section 2.1). The way that this proposed method calculated the displacement of a point in and on a beam depended only on the concentrated load, F, exerting itself on the numbered nodes—1, 2, 3, …, m—as shown in Figure 1.
For the curvature mode shape method, the magnitude of the first displacement mode shape was used to calculate the curvature mode shape with the Modal Module in ANSYS. The assigned settings for the beam were the same as in the evaluation of the proposed method.
We assigned a crack to be at one-third, the middle, and two-thirds of beam length and identified their locations. Then, we did the same but using the proposed method and compared the results. Figure 6, Figure 7 and Figure 8 show plots (with 10−4 scaling) of three crack locations identified by the proposed method (for which a moving load of 70 N was applied) overlayed on plots of the three crack locations identified by Pendy’s curvature mode shape method.

3. Numerical Results and Discussions

This section discusses five main points: Verification of forced vibration behavior of a cracked beam calculated by FEA against that of Hai-Ping Lin and Shun-Chang Chang’s exact method [25]; Inability of average dynamic deflections of cantilever beam under moving load to detect a crack by themselves; Dependence of difference in central difference approximation of displacement of cracked beam and uncracked beam on the magnitude of moving load; Comparison of crack locations identified by the proposed method and the mode shape method of Pendy et al., [5]; and Advantage of FEA in comparison with Lin and Chang’s analytical method.

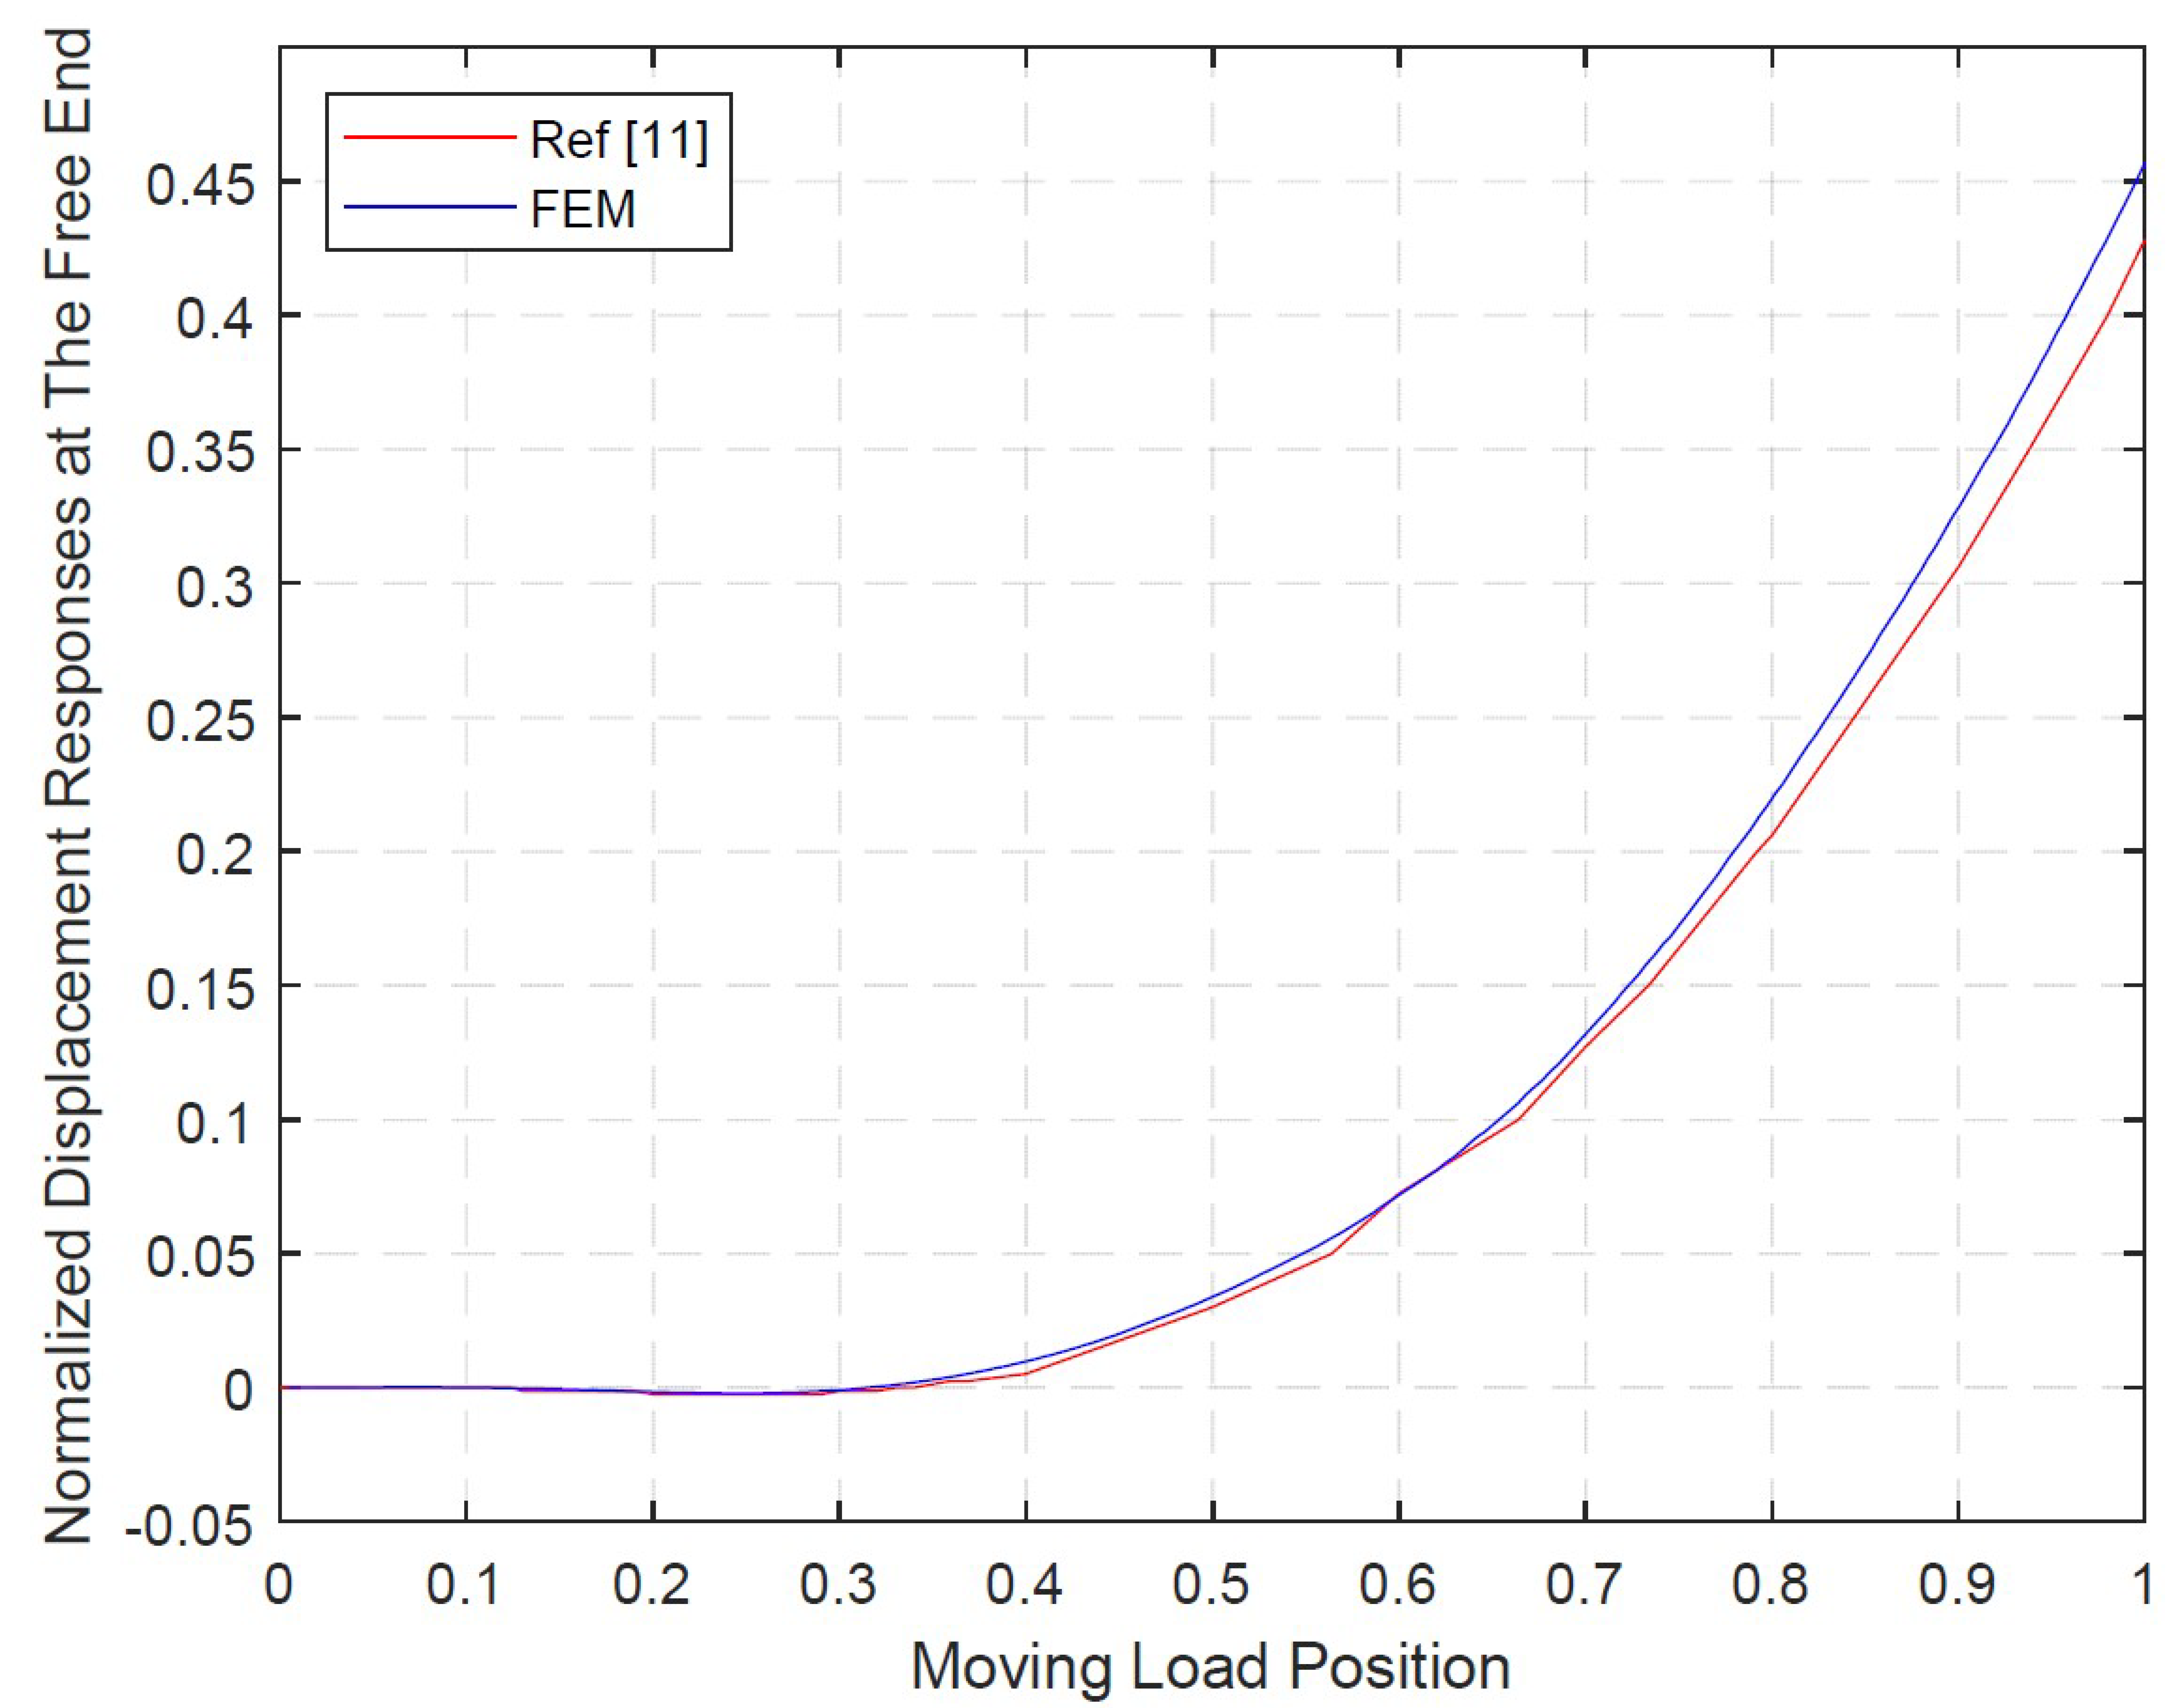
3.1. Verification of Forced Vibrational Behavior Using FEA

To check the validity of the forced vibration behavior of a cracked cantilever beam under moving load calculated by FEA, the results from FEA analysis were verified against such behavior calculated by Hai-Ping Lin and Shun-Chang Chang’s exact method. The graphs of the results from both methods were overlayed on top of the other in Figure 8. It can be clearly observed that in the range of position from 0–0.7 beam length, the two graphs almost coincided, while they did not deviate more than 5% in the range of position from 0.7–0.9 beam length. Therefore, it can be concluded that the beam vibrational behavior was modeled sufficiently precisely for crack identification by the proposed crack-identification method.

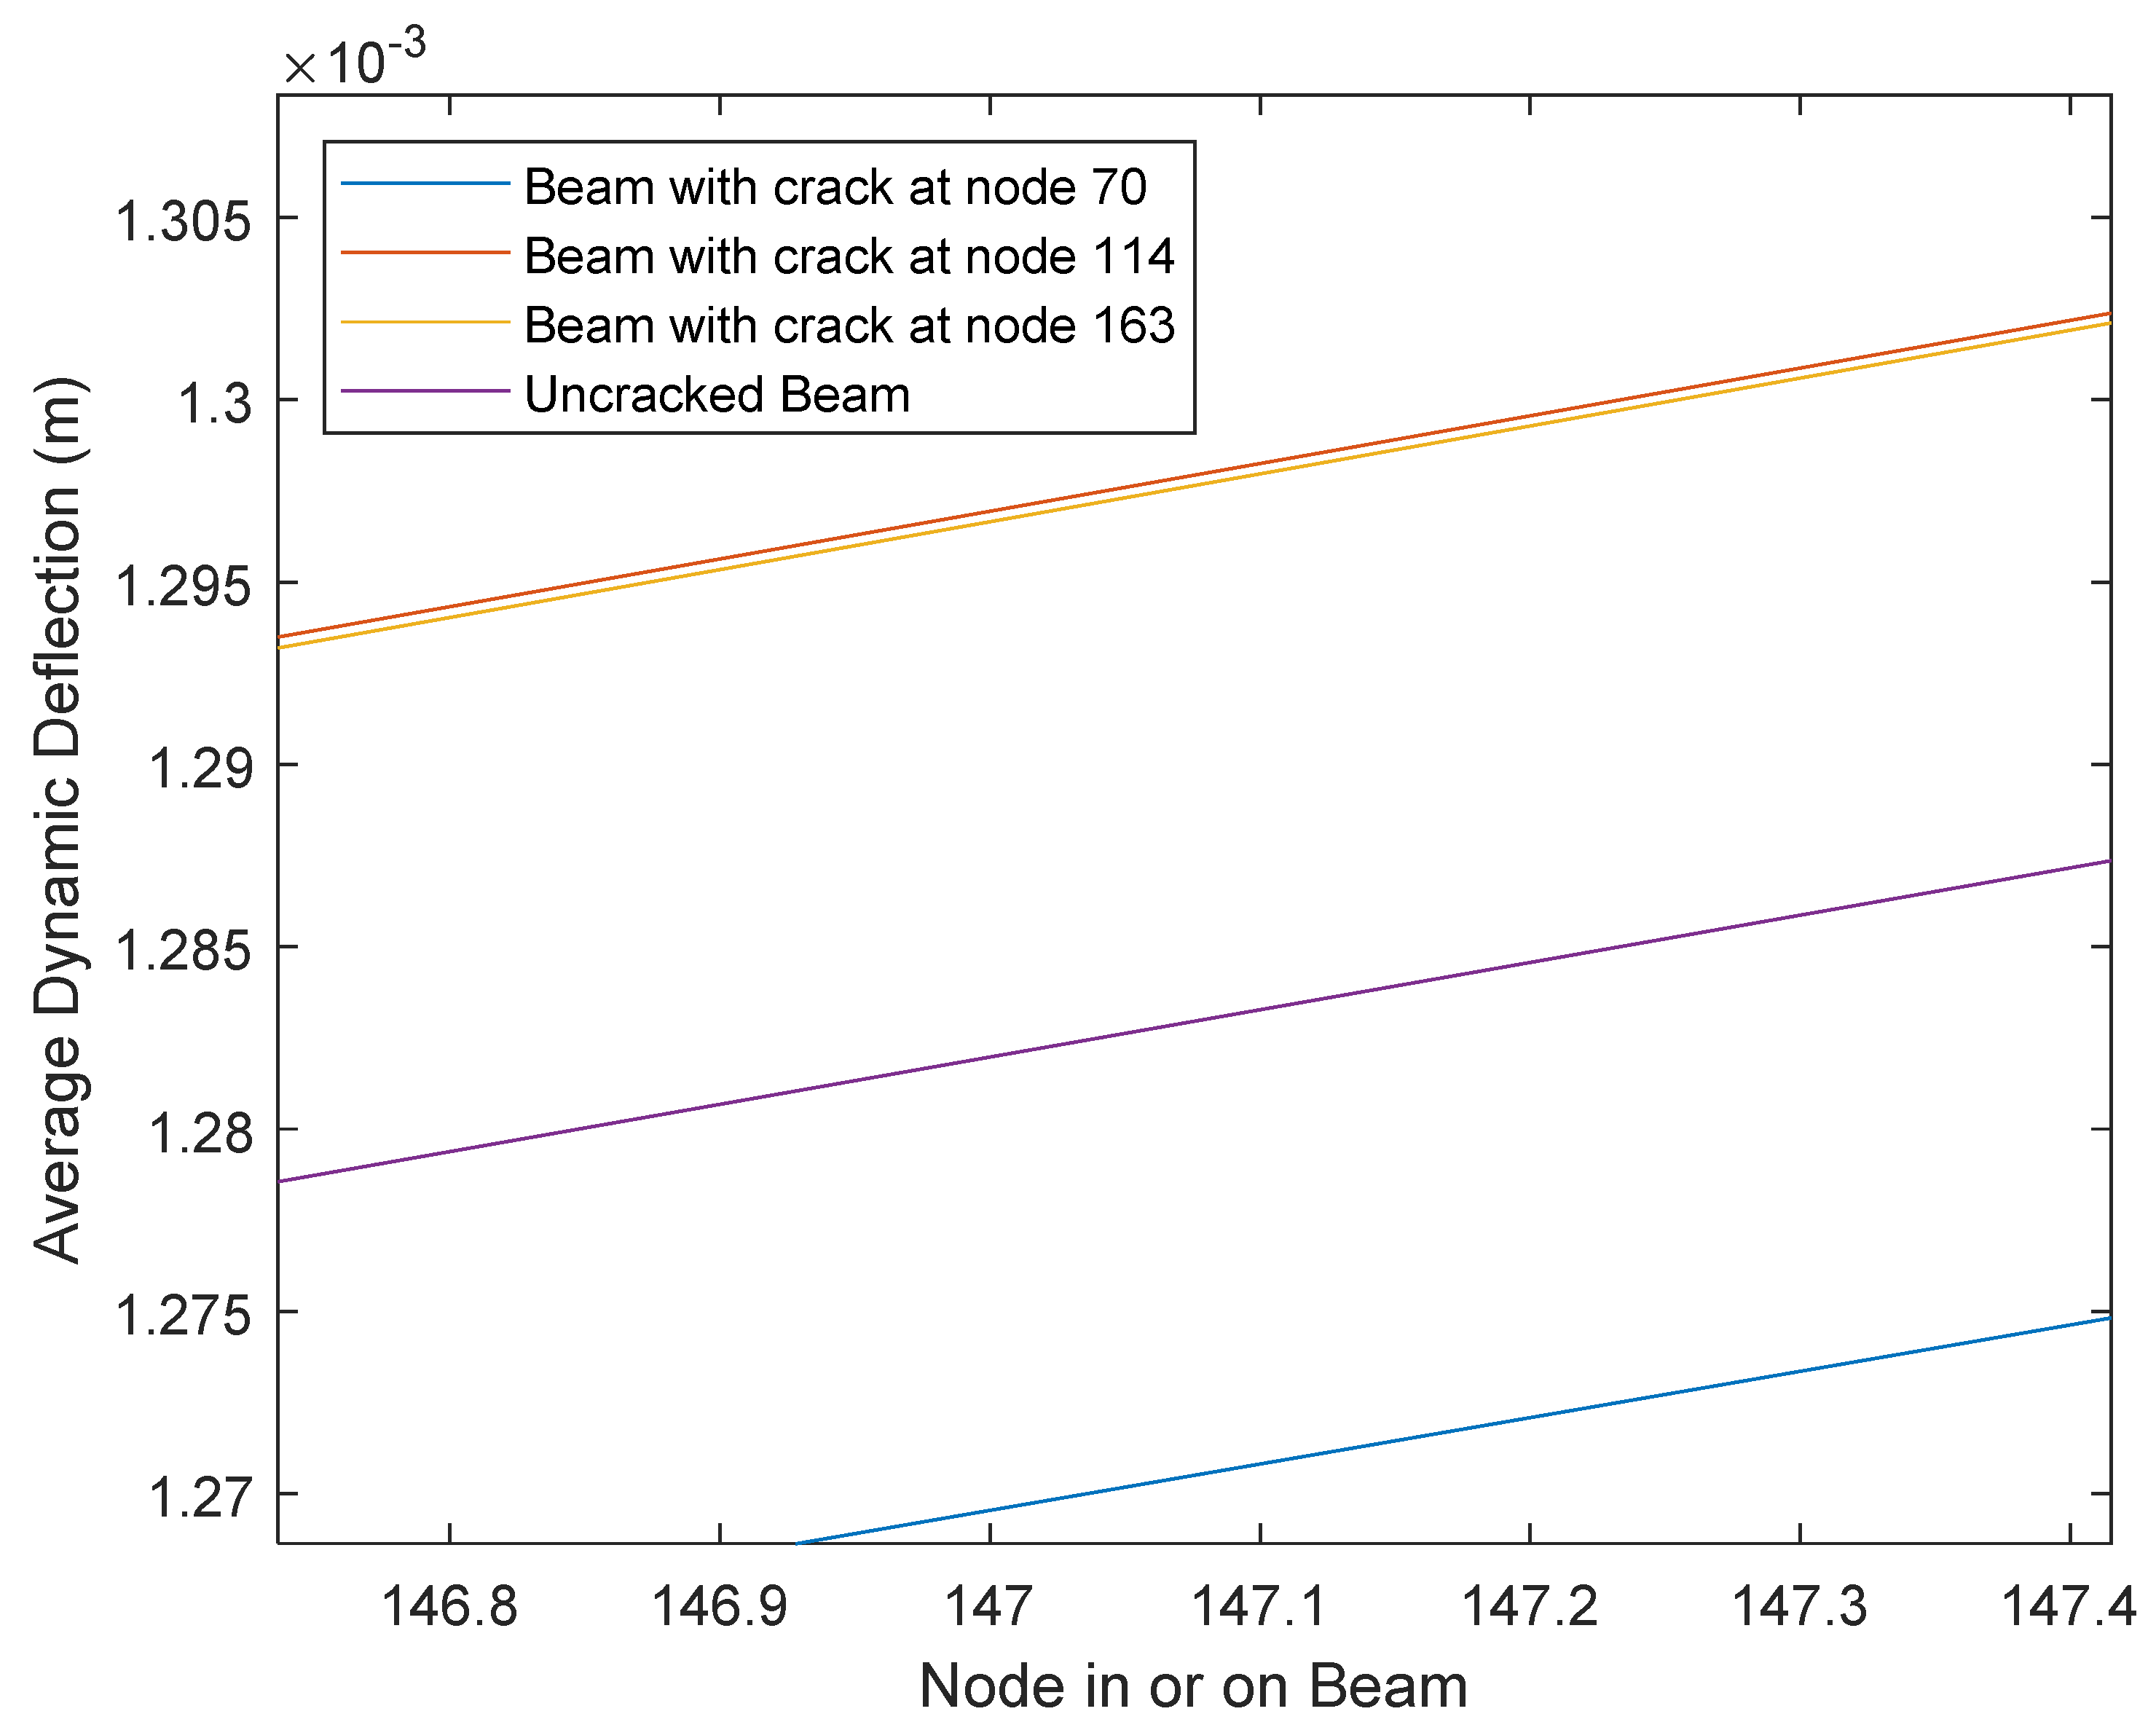
3.2. Average Dynamic Deflection Results

Average dynamic deflection was evaluated by Equation (6). The calculated results are plotted against the position of the beam under four magnitudes of moving load in Figure 9, Figure 10 and Figure 11, where a crack was positioned at x/l = 0.3, 0.5, and 0.7, respectively. It can be observed that all four curves in each figure are smooth curves that do not show a peak or trough at any position, i.e., a crack cannot be identified directly from these curves under any magnitudes of moving load. To conclude, average dynamic deflection data alone cannot be used to identify a crack. However, the higher the moving load, the higher the magnitude of average deflection or average displacement.
It can be observed in Figure 12 and Figure 13 that the average dynamic deflection of the uncracked beam was the lowest. However, it cannot be used to indicate the crack position in a cracked beam.

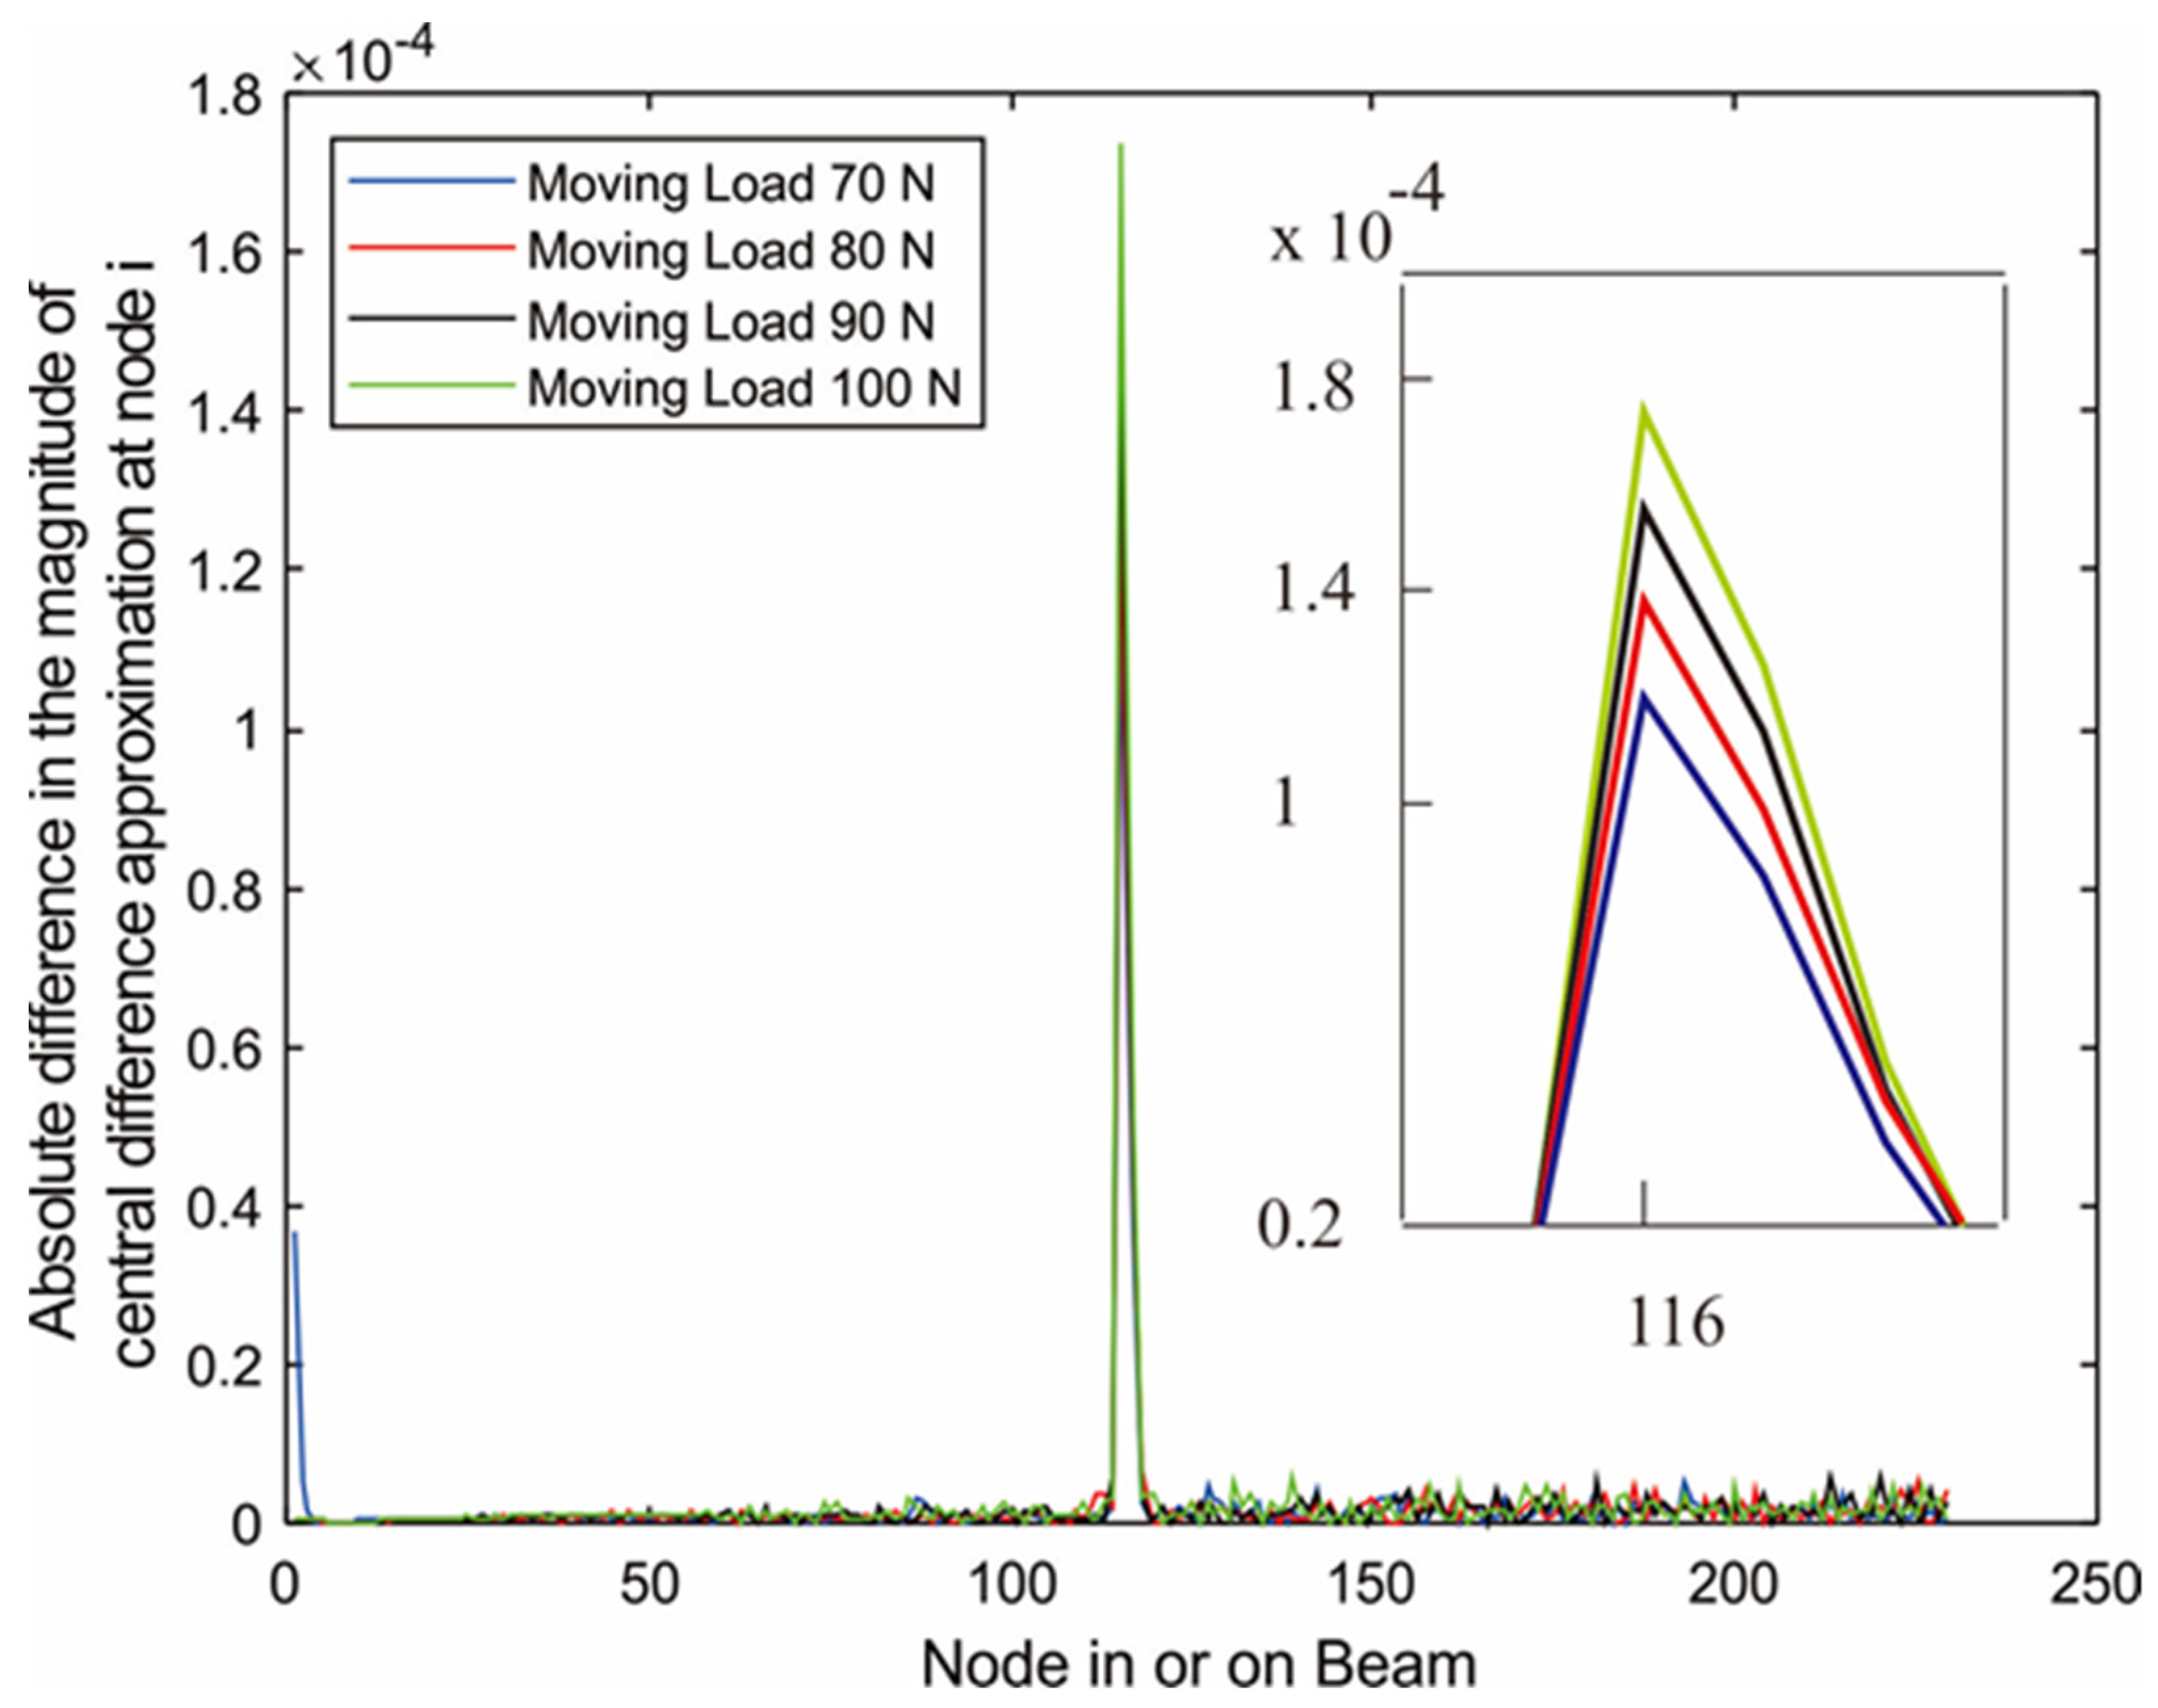
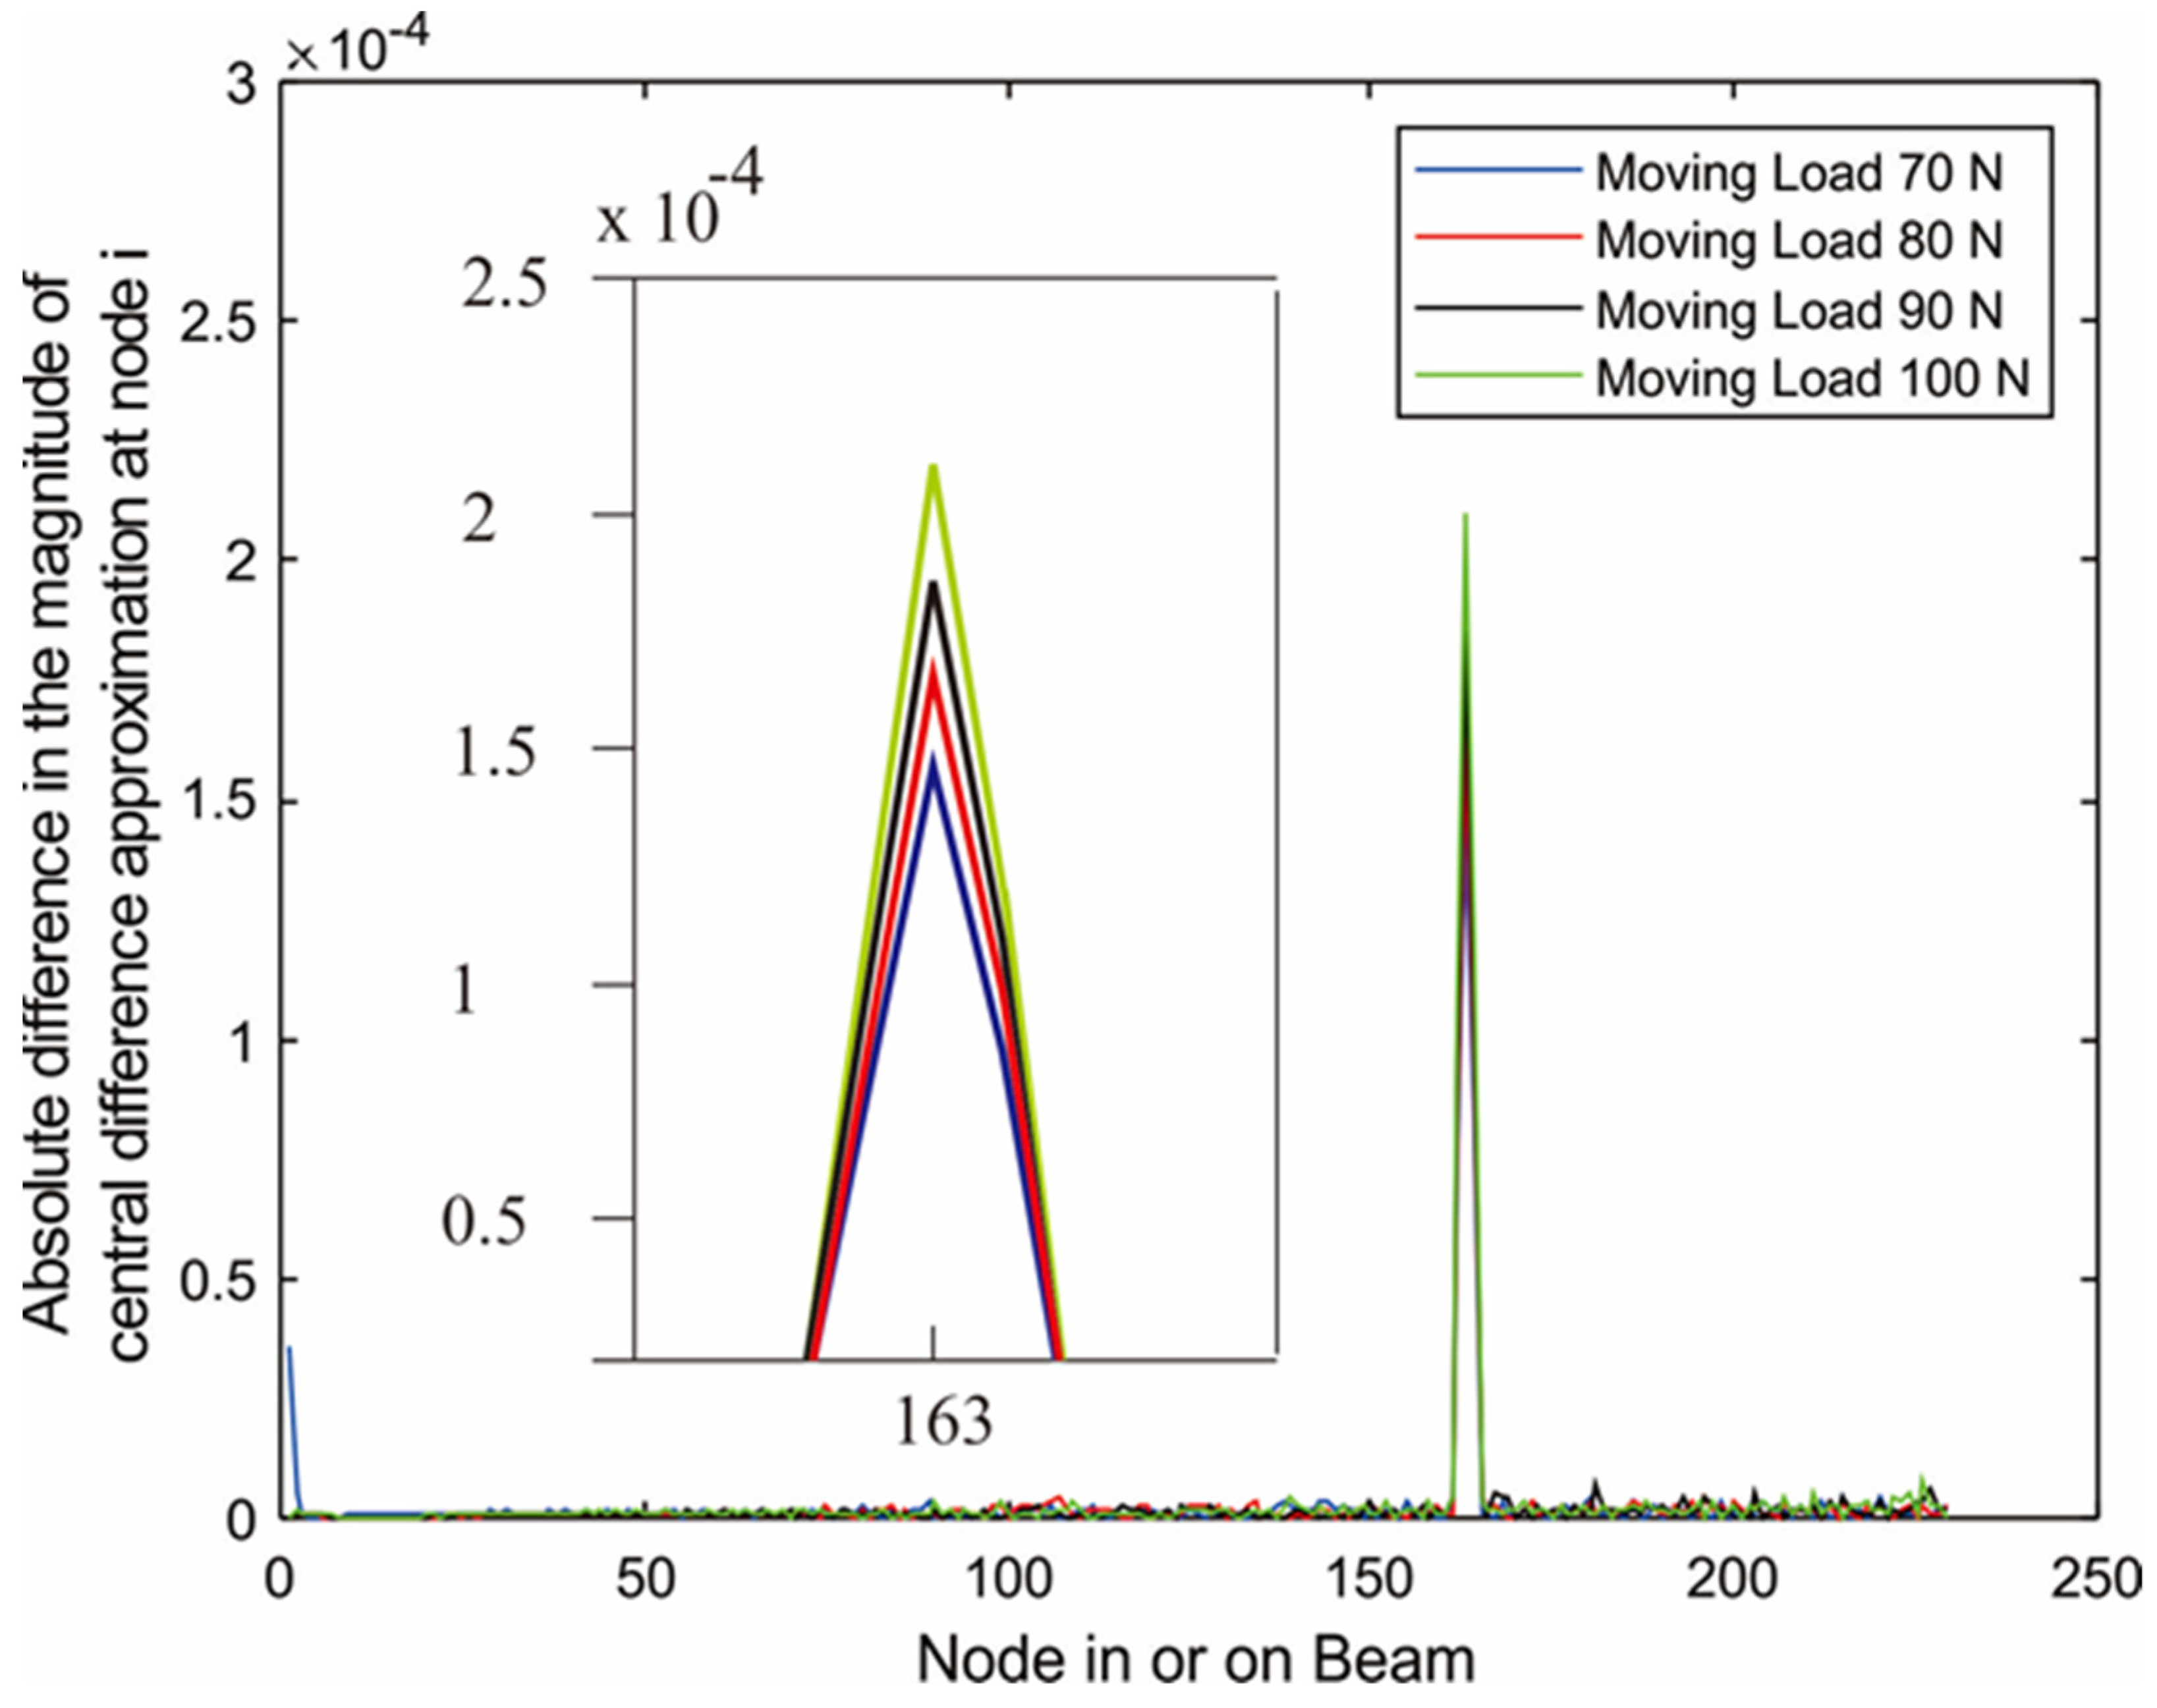
3.3. Dependence of Difference in Central Difference Approximation on the Magnitude of Moving Load

Even though the graph of average dynamic deflection or average vertical displacement of a vibrational cracked beam under moving load could not show the location of a crack, a plot of the difference in central difference approximation of displacement of the cracked beam and an uncracked beam under moving mass did show a sharp peak at the crack location on the cantilever beam due to the change in stiffness of the beam at the crack.
Figure 14, Figure 15 and Figure 16 illustrate the results obtained from the absolute difference in the central difference approximation of displacement at a node of a cracked beam and an uncracked beam, evaluated by Equation (3), at each of three wedge-shaped notch locations: a notch (or a crack) at x1/l = 0.3; a notch at mid-span of the beam; and a notch at x1/l = 0.75. The notch depth was 30% of the beam thickness. It can be observed that for all notch locations, varying the moving load from 70 N to 100 N still provided clearly distinguishable peaks at the same notch location, though a load of 100 N provided the highest peak because it caused more deflection or displacement.

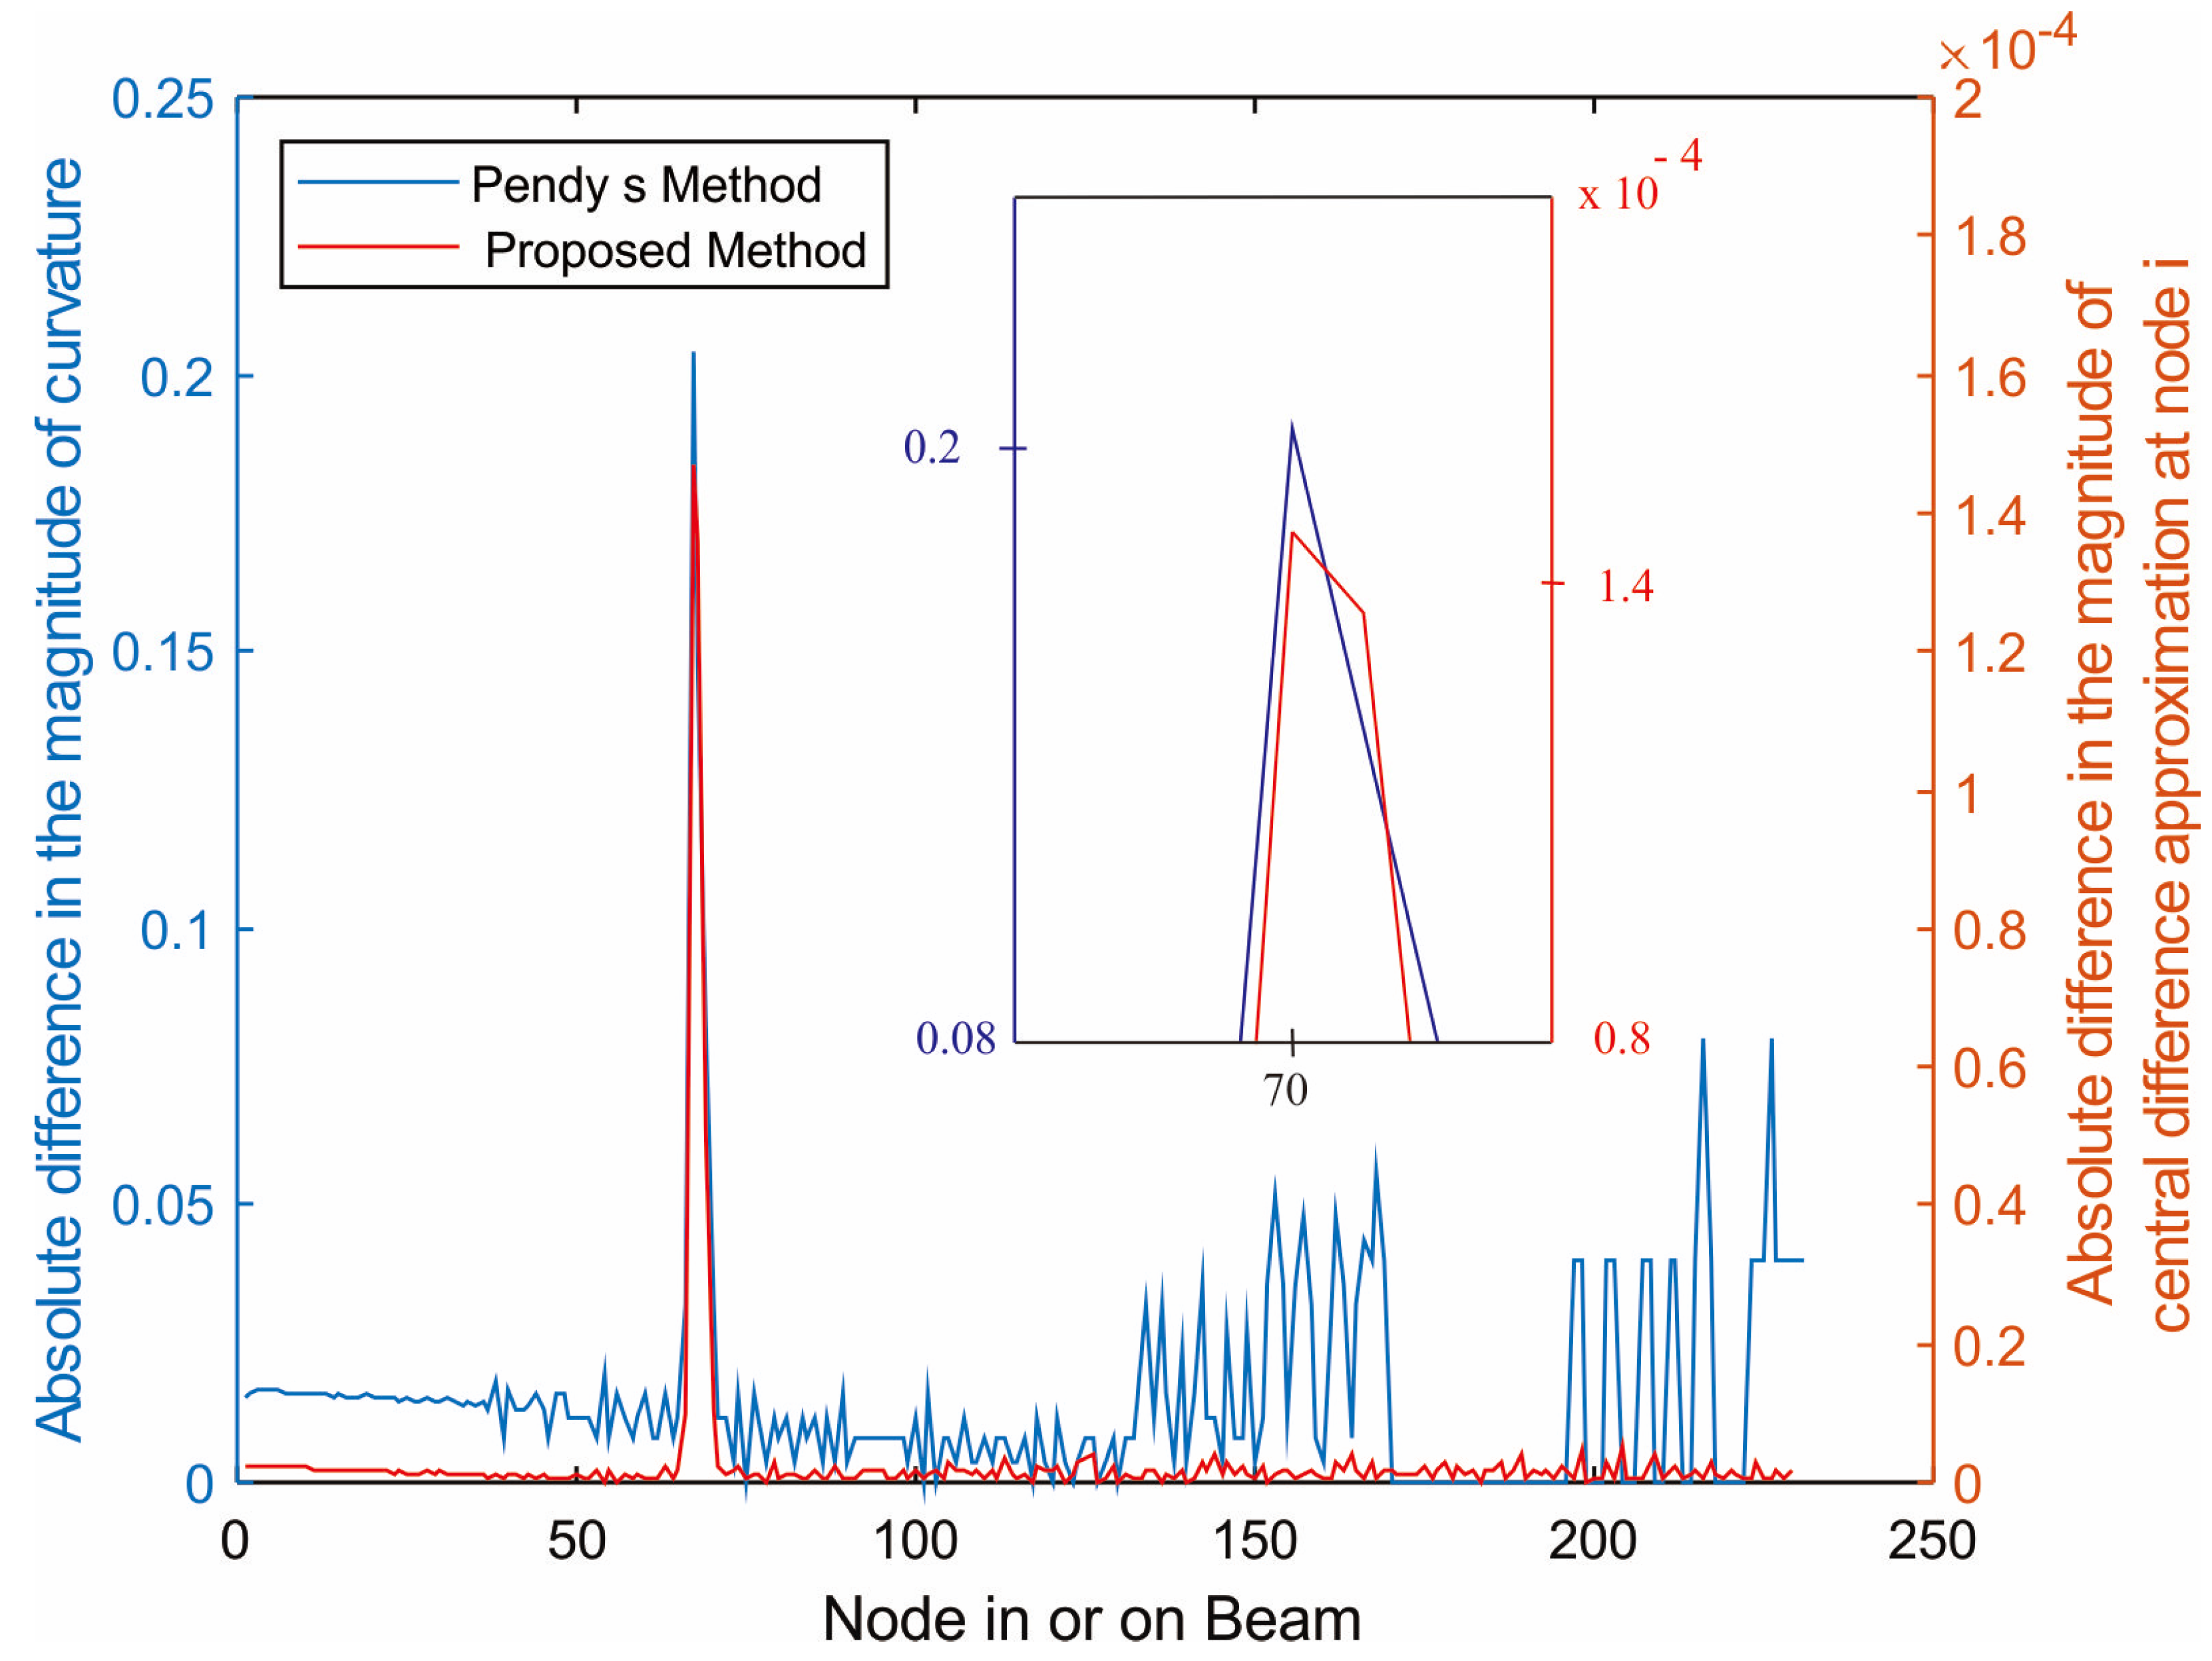
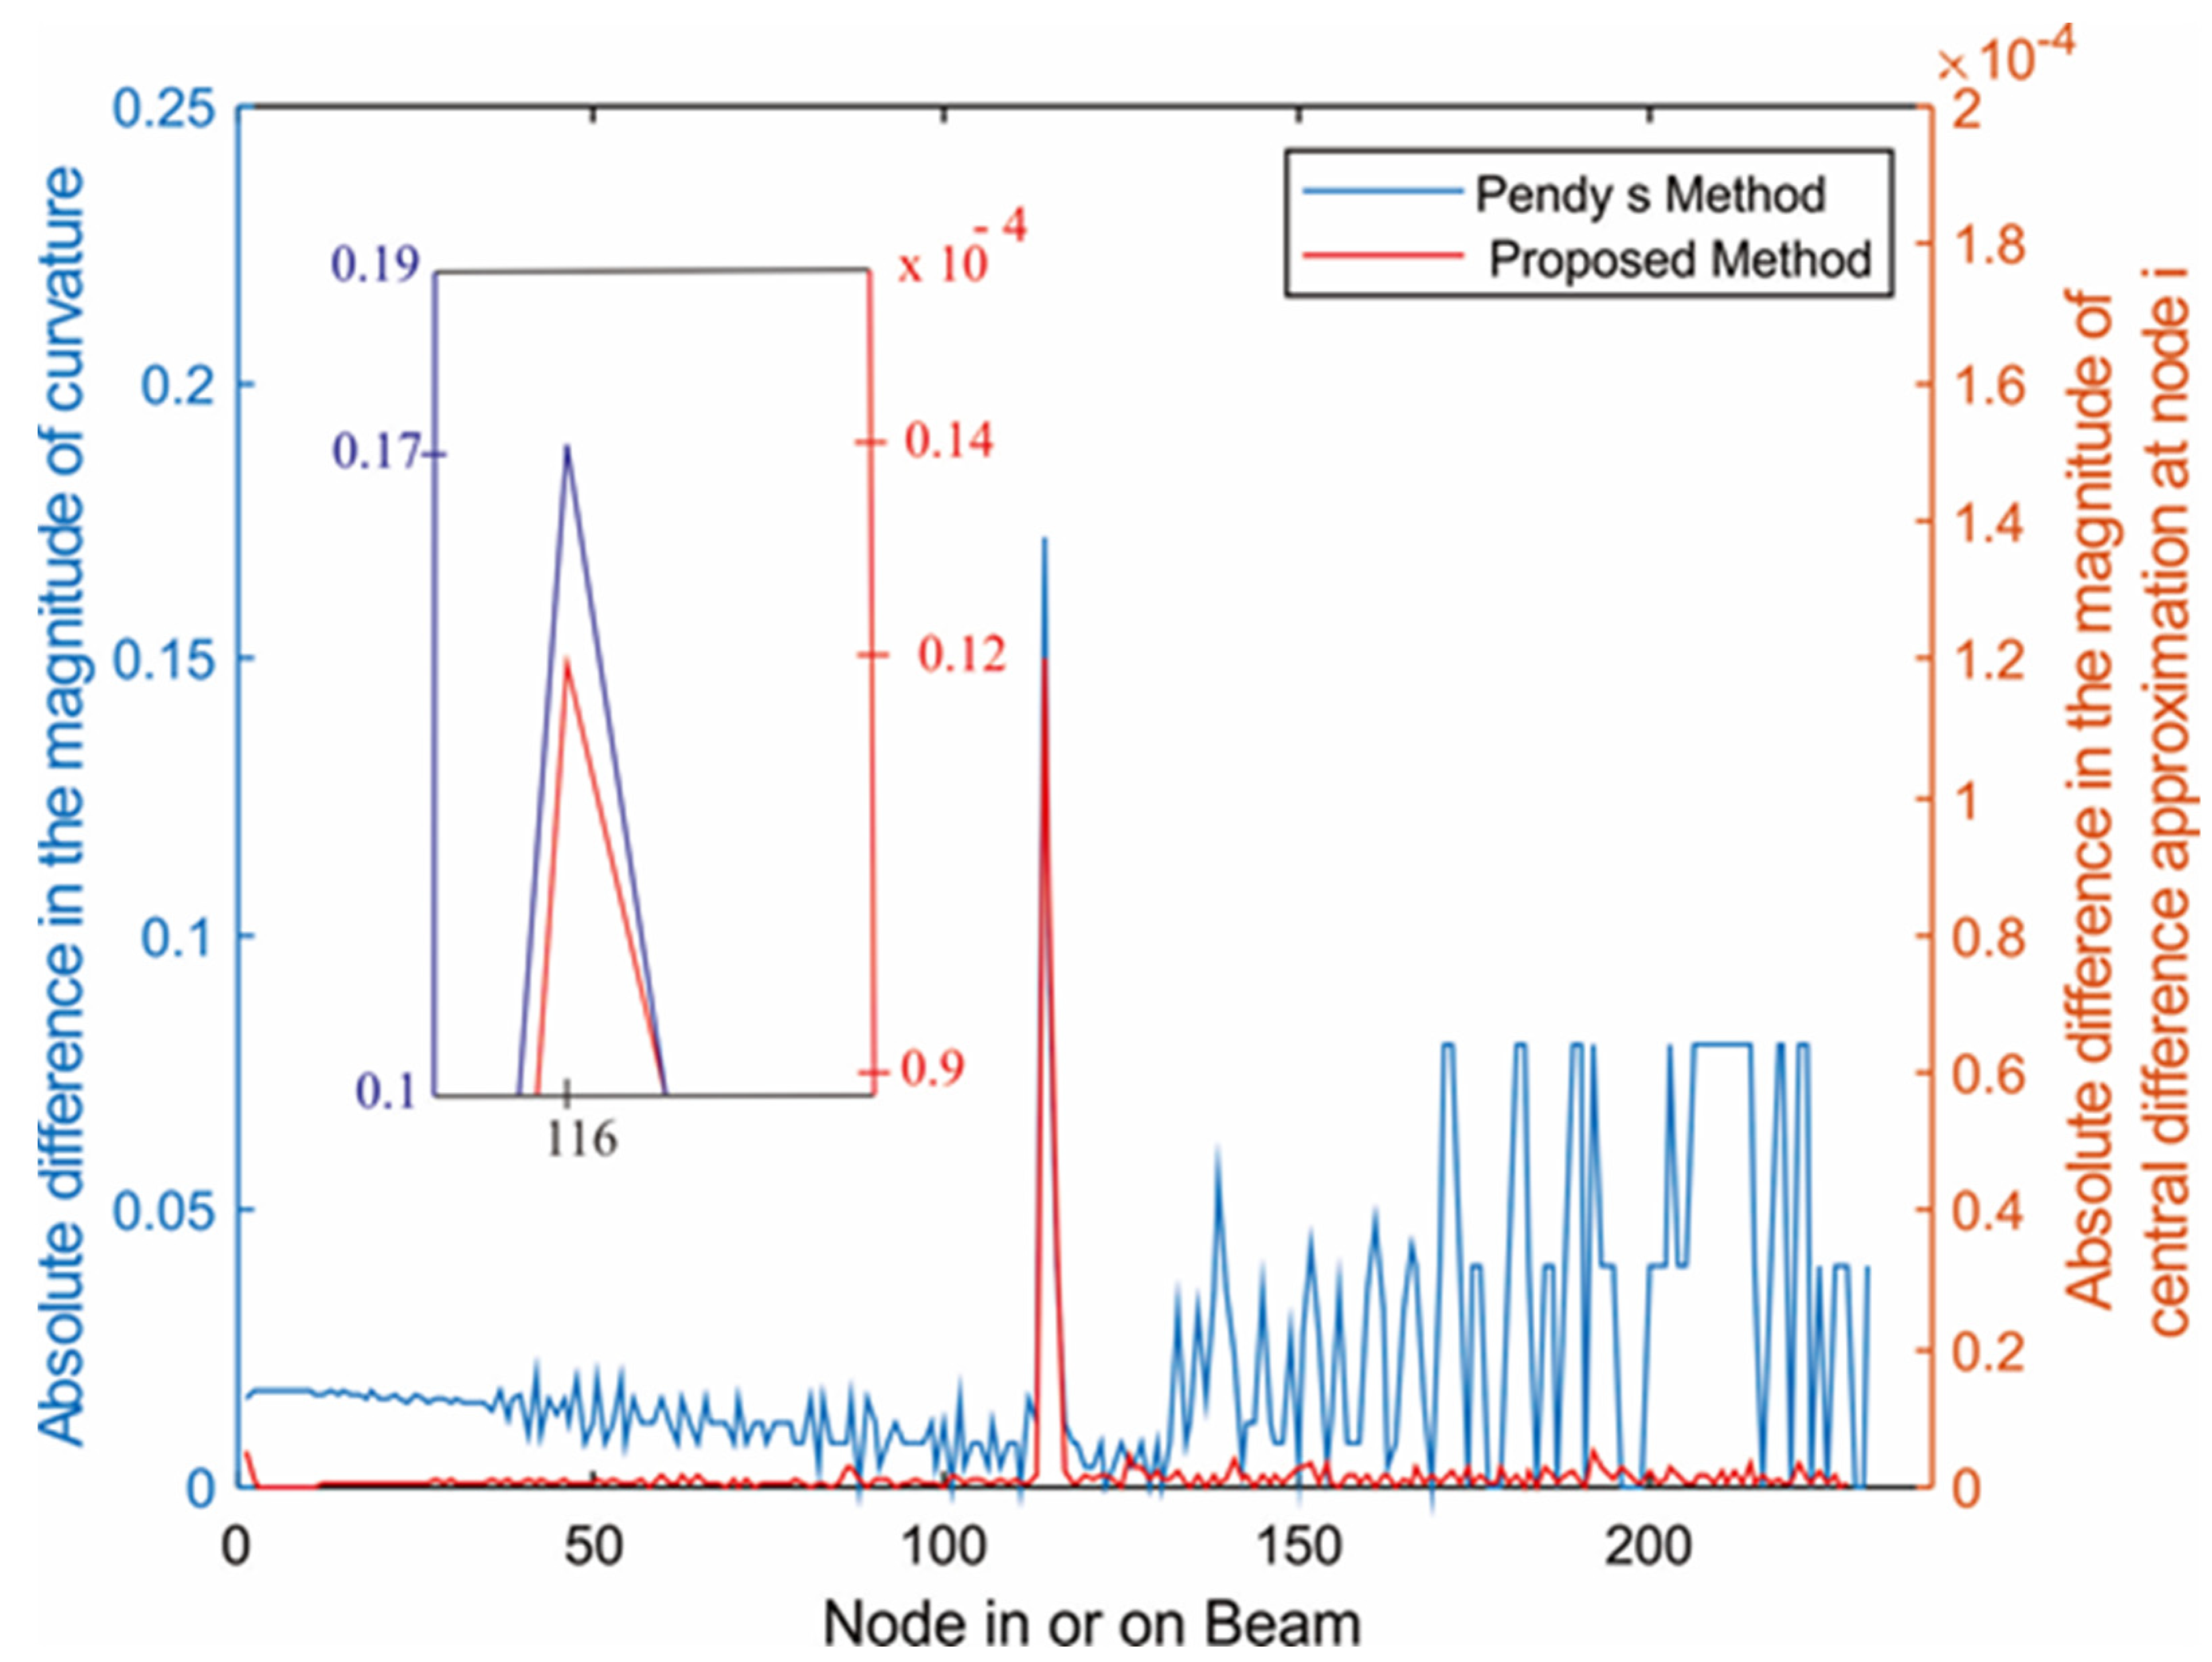
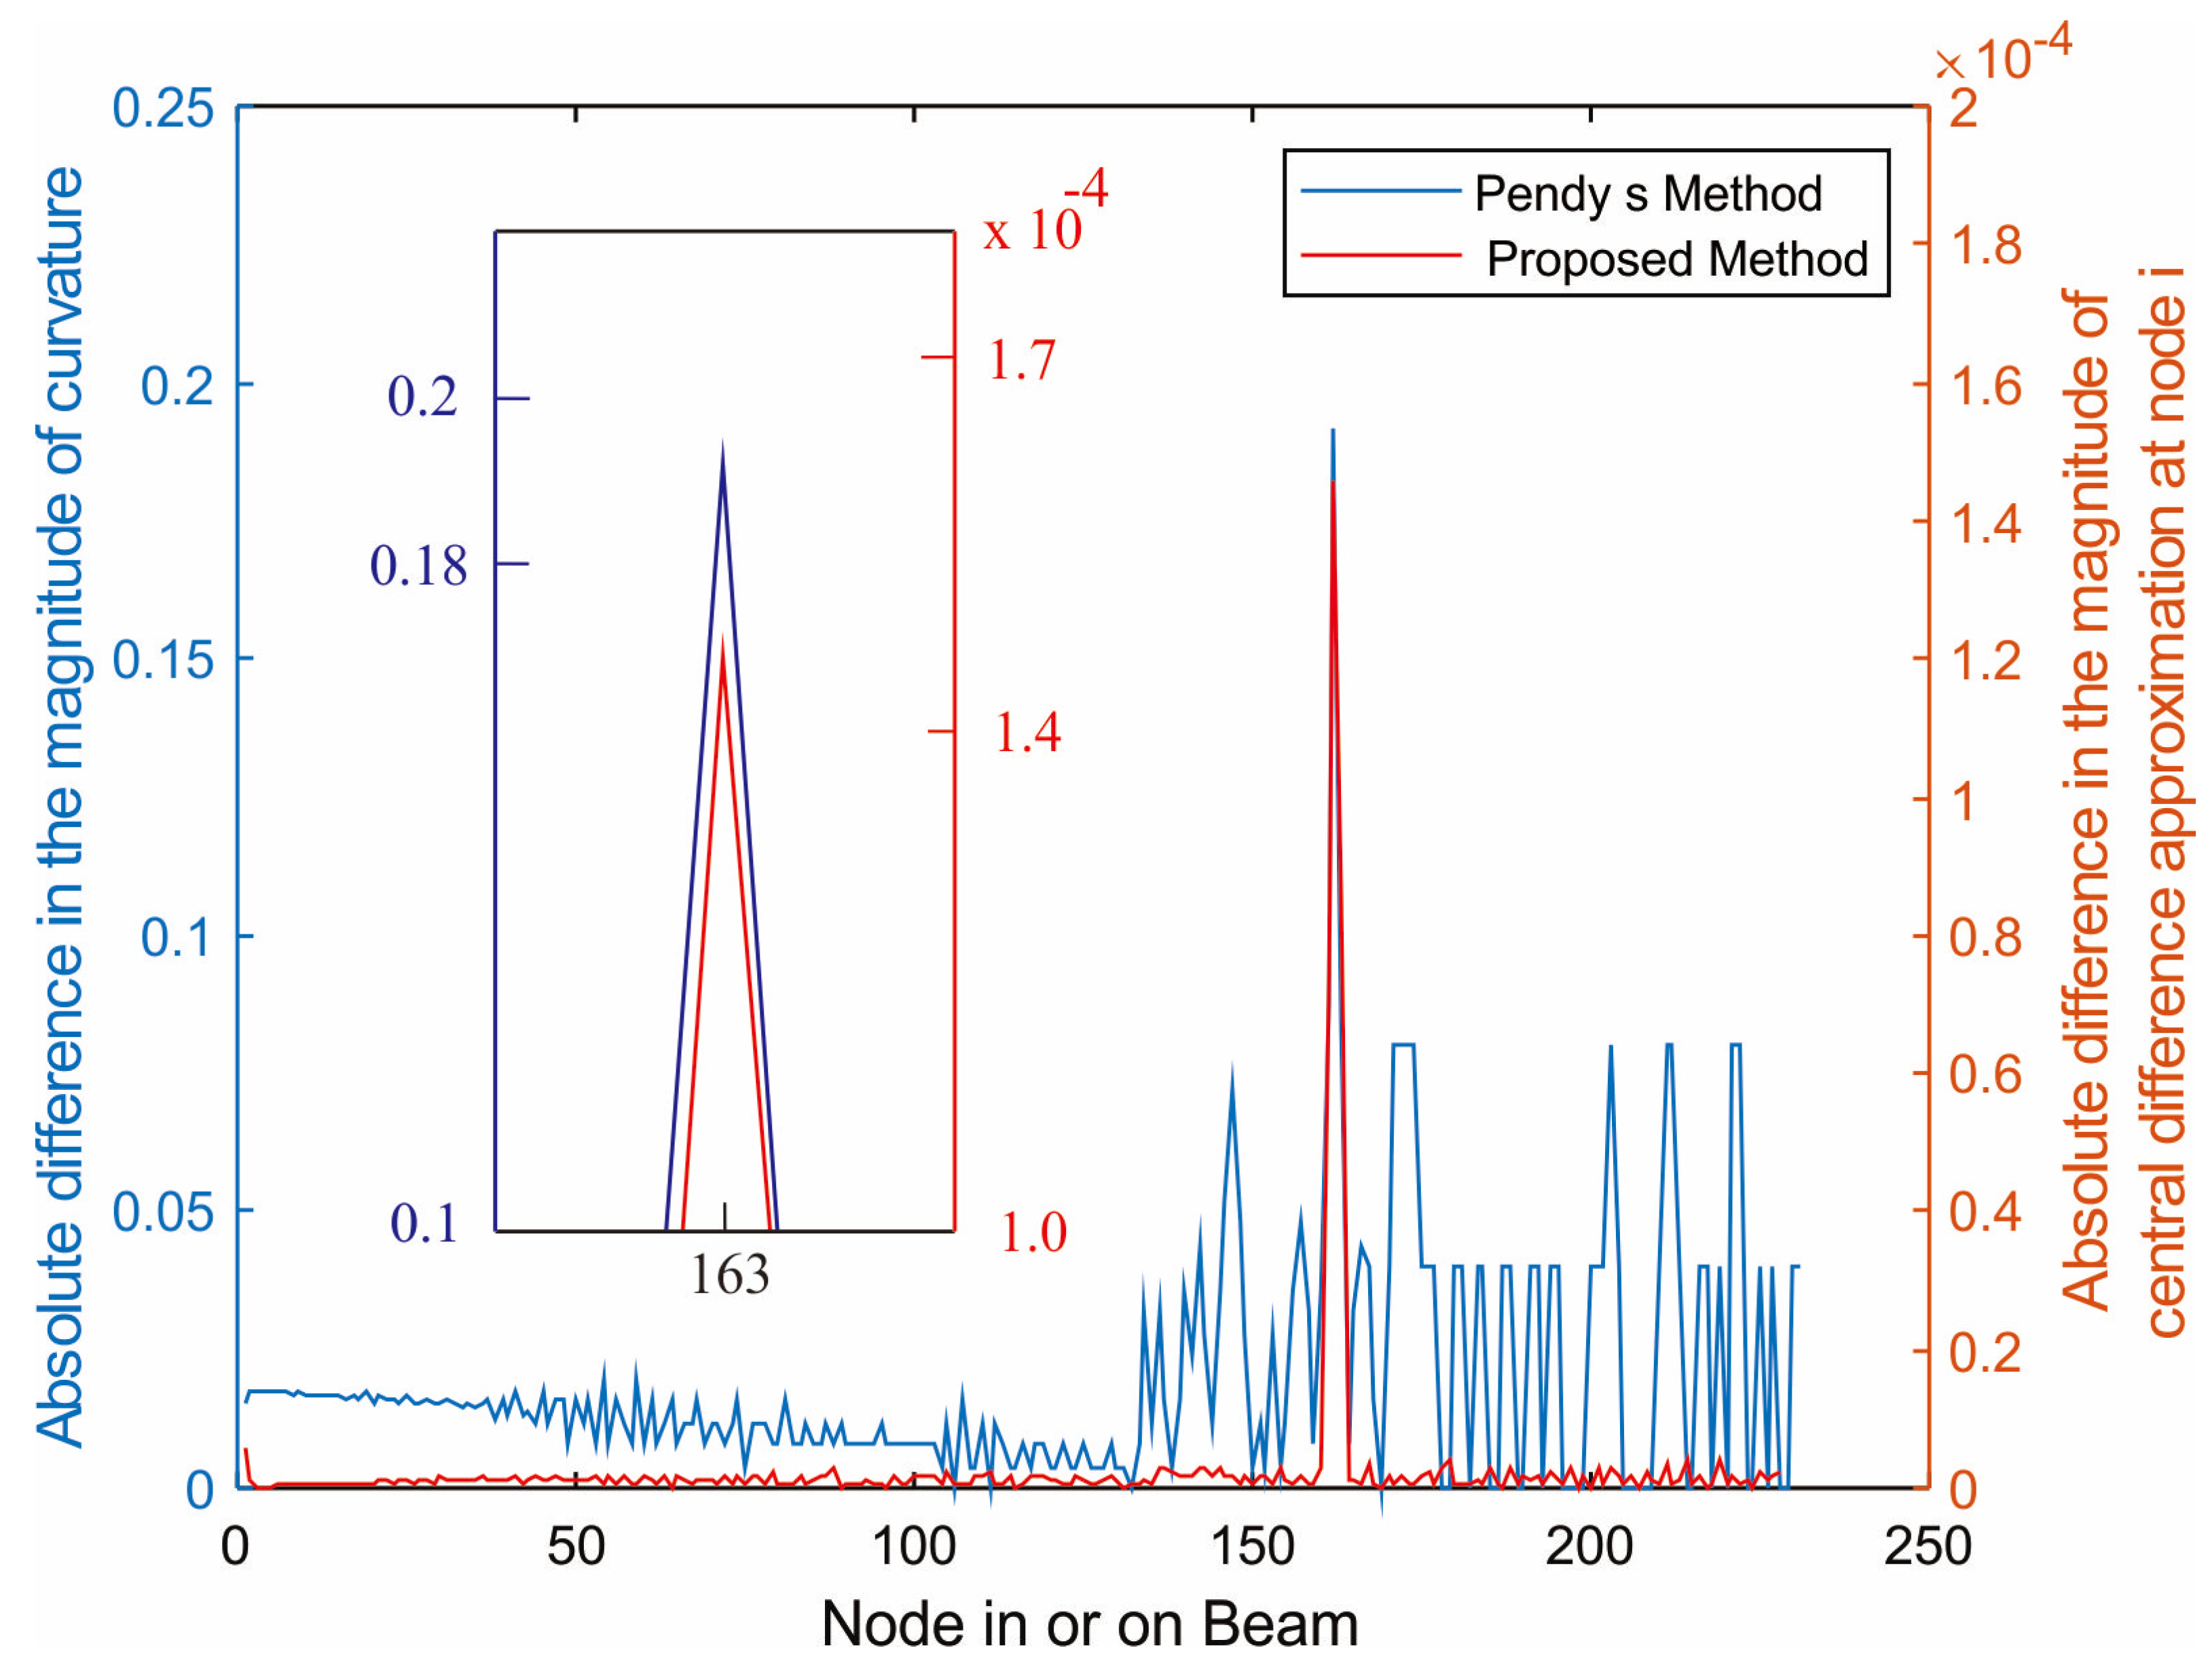
3.4. Comparison of Crack Locations Identified by the Proposed Method and Pendy’s Mode Shape Method

Figure 6, Figure 7 and Figure 8 show plots (with 10−4 scaling) of three crack locations identified by the proposed method (for which a moving load of 70 N was applied) overlayed on plots of the three crack locations identified by Pendy’s curvature mode shape method. It can be clearly seen that the locations were all corresponding to the exact same locations, showing that the proposed method could be used as an alternative to Pendy’s analytical method without any significant errors for identifying a crack in or on a cantilever beam.

3.5. Advantage of FEA in Comparison with Hai-Ping Lin and Shun-Chang Chang’s Analytical Method

The operation of FEA was performed to evaluate the efficiency of the proposed method, as an alternative to conducting an experiment or using an analytical method to simulate vibration of the cracked beam and the uncracked beam.
At present, some kinds of vibration simulation of a cracked beam can be conducted by analytical method [25], mostly analyzed with Fourier series. However, analytical solutions to different sets of governing equation and boundary conditions may be too complex to solve or even unsolvable for some specific applications. Engineers, however, want a fast and familiar way to tackle a problem, instead of trying to find an analytical solution to the problem and spend a lot of time and effort to code it in an efficient computational programming language that they are not familiar with in order to finish a project in a sufficiently short time. The bread-and-butter ready-made application program—SolidWorks, Ansys FEA, and Matlab—that all engineers are familiar with are the tools that they can use to develop a project much faster and easier than finding and coding an analytical solution of the same problem. For instance, engineers only need to construct a 3D model of the object and input it directly into Ansys without having to write a procedure to import a 3D file into a manually coded program; then, they only need to assign boundary conditions, there is no need to write code for them, and they can assign the moving load from a menu and run the simulation, all with a few clicks of a mouse. The amount of time to complete a project, most likely, approximates the amount of time for finding an analytical solution and manually coding a program to run the simulation (for engineers that are quite comfortable with the programming language). As shown in our work, the result for crack identification was virtually identical, and the economy in time and effort was real.

4. Conclusions

In the present work, a crack-identification method by FEA is presented based on an assumption of a transverse surface crack, extending uniformly along the width of a cantilever beam. In a numerical study, forced responses of an uncracked and a cracked cantilever beam under a moving load were simulated by transient analysis using the Ansys FEA software. Various notch locations for a crack were investigated. A time domain procedure relying on measured time response was presented. Displacement at each point on the beam was obtained from probe deformation menu for transient analysis in Ansys software.
For forced responses of cantilever beams under a moving load, a numerical procedure based on curvature mode shape was developed. Forced responses of cracked beams were investigated with varying moving load. Locations of cracks were indicated by peaks of absolute changes in central difference approximation of displacement plot. The effectiveness of the proposed damage-identification scheme was positively verified by, first, its ability to find the exact same location of the simulated crack as the exact solution method has found, and second, by its simpler one-vibrational-mode procedure than the multi-vibrational-mode that the curvature mode shape method of Pendy [5], quite often, required. Therefore, it has a great application potential with the following advantage: only the deflection parameters of the beam are needed to perform damage localization, and the height of curvature peaks can be varied by adjusting the weight of the moving load. The method can be regarded as a relatively simple, low cost, and effective tool for nondestructive testing (NDT) that does not require sophisticated equipment.
Since virtually every engineer is familiar with Ansys FEA but much less familiar with coding an exact solution (when derivable) in a programming language, the advantage of this method is that it can provide the location of a crack as accurately as an actual experiment or an analytical method can, while taking much less time and effort to develop and implement. With very little amount of trial and error, it can be expected that this method will also accurately identify crack location in a more complex structure with difficult-to-code boundary conditions.

5. Future Work and Limitations of the Proposed Method

This study was a first exploration and development of a crack-identification method, so it is not extensive: (i) Only Euler beam type cantilever was investigated; (ii) the method assumes a single damage location; and (iii) No noise was introduced to the simulated data to test its robustness.
In the near future, we will test the method on various practical structures as case studies. The method is a promising step towards establishing a practical and reliable piping health monitoring procedure, where the location of a potential crack (such as a weld line) is known beforehand.

Author Contributions

Conceptualization, N.K. and T.J.; methodology, N.K. and T.J.; software, N.K. and T.J.; validation, N.K. and T.J.; formal analysis, N.K. and T.J.; investigation, N.K., T.J., S.K. and C.T.; data curation, N.K. and T.J.; writing—original draft preparation, N.K., T.J. and S.K.; writing—review and editing N.K., T.J. and S.K.; visualization, N.K., T.J., S.K. and C.T.; supervision, T.J.; project administration, T.J.; funding acquisition, T.J.; All authors have read and agreed to the published version of the manuscript.

Funding

This research received no external funding.

Institutional Review Board Statement

Not applicable.

Informed Consent Statement

Not applicable.

Data Availability Statement

The data and materials in this paper are available.

Acknowledgments

This work was supported by Thammasat University Research Unit in Structural and Foundation Engineering.

Conflicts of Interest

The authors declare no conflict of interest.

References

  1. Concli, F.; Kolios, A. Preliminary Evaluation of the Influence of Surface and Tooth Root Damage on the Stress and Strain State of a Planetary Gearbox: An Innovative Hybrid Numerical—Analytical Approach for Further Development of Structural Health Monitoring Models. Computation 2021, 9, 38. [Google Scholar] [CrossRef]
  2. Cheng, Q.; Ruan, X.; Wang, Y.; Chen, Z. Serious damage localization of continuous girder bridge by support reaction influence lines. Buildings 2022, 12, 182. [Google Scholar] [CrossRef]
  3. Duvnjak, I.; Klepo, I.; Serdar, M.; Damjanović, D. Damage Assessment of reinforced concrete elements due to corrosion effect using dynamic parameters: A review. Buildings 2021, 11, 425. [Google Scholar] [CrossRef]
  4. Dimarogonas, A.D. Vibration for Engineers, 2nd ed.; Prentice Hall: Hoboken, NJ, USA, 1996. [Google Scholar]
  5. Pandey, A.; Biswas, M.; Samman, M. Damage detection from changes in curvature mode shapes. J. Sound Vib. 1991, 145, 321–332. [Google Scholar] [CrossRef]
  6. Sahin, M.; Shenoi, R.A. Quantification and localisation of damage in beam-like structures by using artificial neural networks with experimental validation. Eng. Struct. 2003, 25, 1785–1802. [Google Scholar] [CrossRef]
  7. Ratcliffe, C.P.; Bagaria, W.J. Vibration technique for locating delamination in a composite beam. AIAA J. 1998, 36, 1074–1077. [Google Scholar] [CrossRef]
  8. Hamey, C.S.; Lestari, W.; Qiao, P.; Song, G. Experimental damage identification of carbon/epoxy composite beams using curvature mode shapes. Struct. Health Monit. 2004, 3, 333–353. [Google Scholar] [CrossRef]
  9. Qiao, P.H.; Lu, K.; Lestari, W.; Wang, J. Curvature mode shape-based damage detection in composite laminated plates. Compos. Struct. 2007, 80, 409–428. [Google Scholar] [CrossRef]
  10. Chandrashekhar, M.; Ganguli, R. Damage assessment of structures with uncertainty by using mode-shape curvatures and fuzzy logic. J. Sound Vib. 2009, 326, 939–957. [Google Scholar] [CrossRef]
  11. Frans, R.; Arfiadi, Y.; Parung, H. Comparative study of mode shapes curvature and damage locating vector methods for damage detection of structures. Procedia Eng. 2017, 171, 1263–1271. [Google Scholar] [CrossRef]
  12. Lin, Y.Z.; Zhao, Z.; Nie, Z.H.; Ma, H.W. Data-driven damage detection for beam-like structures under moving loads using quasi-static responses. Front. Artif. Intell. Appl. 2016, 281, 403–411. [Google Scholar]
  13. Kordestani, H.; Xiang, Y.Q.; Ye, X.W. Output-only damage detection of steel beam using moving average filter. Shock. Vib. 2018, 2018, 2067680. [Google Scholar] [CrossRef] [Green Version]
  14. Kordestani, H.; Xiang, Y.Q.; Ye, X.W.; Jia, Y.K. Application of the random decrement technique in damage detection under moving load. Appl. Sci. 2018, 8, 753. [Google Scholar] [CrossRef] [Green Version]
  15. Senjuntichai, T.; Keawsawasvong, S.; Yooyao, B. Exact stiffness method for multi-layered saturated soils under moving dynamic loads. J. GeoEng. 2020, 15, 159–171. [Google Scholar]
  16. Liu, Y.Z.; Yi, T.H.; Yang, D.H.; Li, H.N. Damage location of beam railway bridges using rotation responses under moving train loads. J. Perform. Constr. Facil. 2021, 35, 04021096. [Google Scholar] [CrossRef]
  17. Chouiyakh, H.; Azrar, L.; Alnefaie, K.; Akourri, O. Vibration and multi-crack identification of Timoshenko beams under moving mass using the differential quadrature method. Int. J. Mech. Sci. 2017, 120, 1–11. [Google Scholar] [CrossRef]
  18. Roveri, N.; Carcaterra, A. Damage detection in structures under traveling loads by Hilbert-Huang transform. Mech. Syst. Signal Process. 2012, 28, 128–144. [Google Scholar] [CrossRef]
  19. Ghannadiasl, A.; Khodapanah Ajirlou, S. Dynamic analysis of multiple cracked Timoshenko beam under moving load—Analytical method. J. Vib. Control 2022, 28, 379–395. [Google Scholar] [CrossRef]
  20. Kourehli, S.S.; Ghadimi, S.; Ghadimi, R. Vibration analysis and identification of breathing cracks in beams subjected to single or multiple moving mass using online sequential extreme learning machine. Inverse Probl. Sci. Eng. 2019, 27, 1057–1080. [Google Scholar] [CrossRef]
  21. Zhu, X.; Cao, M.; Ostachowicz, W.; Xu, W. Damage identification in bridges by processing dynamic responses to moving loads: Features and evaluation. Sensors 2019, 19, 463. [Google Scholar] [CrossRef] [Green Version]
  22. Qiao, G.; Rahmatalla, S. Dynamics of Euler-Bernoulli beams with unknown viscoelastic boundary conditions under a moving load. J. Sound Vib. 2021, 491, 115771. [Google Scholar] [CrossRef]
  23. Asnaashari, E.; Sinha, J.K. Crack detection in structures using deviation from normal distribution of measured vibration responses. J. Sound Vib. 2014, 333, 4139–4151. [Google Scholar] [CrossRef]
  24. Lee, H.-H. Finite Element Simulations with ANSYS Workbench 18; SDC Publications: Mission, KS, USA, 2018. [Google Scholar]
  25. Lin, H.-P.; Chang, S.-C. Forced responses of cracked cantilever beams subjected to a concentrated moving load. Int. J. Mech. Sci. 2006, 48, 1456–1463. [Google Scholar] [CrossRef]
  26. Ansys. Finite Element Computer Software for Nonlinear Structural Analysis, Version 15.0; Ansys Inc.: Canonsburg, PA, USA, 2013. [Google Scholar]
Figure 1. Flow diagram of the operations.
Computation 10 00101 g001
Figure 2. The magnitude of displacement and external force acting on each specified node.
Computation 10 00101 g002
Figure 3. Cantilever beam subjected to a load.
Computation 10 00101 g003
Figure 4. Beam with meshes assigned for FEA analysis.
Computation 10 00101 g004
Figure 5. Force deflection response of the modeled cracked beam against analytical response.
Computation 10 00101 g005
Figure 6. Crack at node 70 (at one-third of beam length).
Computation 10 00101 g006
Figure 7. Crack at node 116 (at the middle of the beam).
Computation 10 00101 g007
Figure 8. Crack at node 163 (at two-thirds of beam length).
Computation 10 00101 g008
Figure 9. Average Dynamic Deflection of Cracked Beam (crack at x/l = 0.30) under moving load.
Computation 10 00101 g009
Figure 10. Average Dynamic Deflection of Cracked Beam (crack at x/l = 0.50) under moving load.
Computation 10 00101 g010
Figure 11. Average Dynamic Deflection of Cracked Beam (crack at x/l = 0.70) under moving load.
Computation 10 00101 g011
Figure 12. Average dynamic deflection of cracked and uncracked beam under a 100 N moving load.
Computation 10 00101 g012
Figure 13. Blown-up view showing clearly the non-overlapping nature of the curves in Figure 12.
Computation 10 00101 g013
Figure 14. Absolute difference between the central difference approximation of displacement of the uncracked and the cracked (Node 70) cantilever beam subjected to moving load.
Computation 10 00101 g014
Figure 15. Absolute difference between the central difference approximation of displacement of the uncracked and the cracked (Node 116) cantilever beam subjected moving load.
Computation 10 00101 g015
Figure 16. Absolute difference between the central difference approximation of displacement of the uncracked and the cracked (Node 163) cantilever beam subjected moving load.
Computation 10 00101 g016
Table 1. FE Settings for Dimensions and material properties of the beam.
Material PropertiesValueUnit
Dimension580 × 20 × 20mm
Density7800kg/m3
Young’s Modulus206GPa
Poisson Ratio0.3
Table 2. Comparison of natural frequencies calculated from FE model and analytical solution.
ModeNatural Frequency (Hz)
Analytical [25]FE ModelPercentage Error
130.88302.85
2195.602002.24
3540.485400.09
Publisher’s Note: MDPI stays neutral with regard to jurisdictional claims in published maps and institutional affiliations.

