
Color Variability Constrains Detection of Geometrically Perfect Mirror Symmetry


UMR 7357 CNRS, ICube Research Department, Strasbourg University, 67085 Strasbourg, France
Computation 2022, 10(6), 99; https://0-doi-org.brum.beds.ac.uk/10.3390/computation10060099
Submission received: 11 May 2022
/
Revised: 6 June 2022
/
Accepted: 10 June 2022
/
Published: 16 June 2022
Abstract
:Symmetry in nature is a result of biological self-organization, driven by evolutionary processes. Detected by the visual systems of various species, from invertebrates to primates, symmetry determines survival relevant choice behaviors and supports adaptive function by reducing stimulus uncertainty. Symmetry also provides a major structural key to bio-inspired artificial vision and shape or movement simulations. In this psychophysical study, local variations in color covering the whole spectrum of visible wavelengths are compared to local variations in luminance contrast across an axis of geometrically perfect vertical mirror symmetry. The chromatic variations are found to delay response time to shape symmetry to a significantly larger extent than achromatic variations. This effect depends on the degree of variability, i.e., stimulus complexity. In both cases, we observe linear increase in response time as a function of local color variations across the vertical axis of symmetry. These results are directly explained by the difference in computational complexity between the two major (magnocellular vs. parvocellular) visual pathways involved in filtering the contrast (luminance vs. luminance and color) of the shapes. It is concluded that color variability across an axis of symmetry proves detrimental to the rapid detection of symmetry, and, presumably, other structural shape regularities. The results have implications for vision-inspired artificial intelligence and robotics exploiting functional principles of human vision for gesture and movement detection, or geometric shape simulation for recognition systems, where symmetry is often a critical property.
1. Introduction
Symmetry in biological and physical systems is a product of self-organizing evolutionary processes [1]. It conveys a salient feature to living objects, from molecules, cellular structures [2,3,4,5,6] and animal bodies [7,8,9,10,11,12] to man-made constructs and visual graphics [13,14,15]. The shapes of various species and their pattern colors often display close-to-perfect vertical mirror symmetry, yet, imperfections are also common. Localized “holes” [7] are sometimes observed in the bilateral symmetry of animal bodies or their ornamental coloration, and such “holes” were reported to affect sexual selection by mate choice in fish species [7]. This may explain other observations from the animal kingdom, showing that individuals with imperfections in ornamental symmetry statistically resort to showing “their best side” to stand a better chance of getting chosen [8]. Geometric symmetry describes regularities in a pattern the two halves of which are mirror images of each other (Figure 1). In visually perceived patterns assembling many local shape elements of variable color, perfect geometric and perceptual mirror symmetry has also been referred to as “symmetry of things in a thing” [6]. The visual perceptual systems of various species in the animal kingdom are capable of detecting colored patterns, and the symmetry thereof, in the ornamental displays of conspecific individuals [7,8]. Perceptual qualities of animal ornaments include pattern symmetry as an indicator of individual mate fitness [9,10,11], and a signal that facilitates conspecific recognition [12]. Symmetry is adaptively exploited by the human brain from an early age [16,17]. In the context of information processing [18,19,20], symmetry is a carrier of information because it reduces physical or perceptual complexity and, thereby, facilitates the detection [18], and the further analytical processing [19], of structural regularities in complex environments. In human vision, symmetry detection [20,21] involves brain processes from lower to higher levels of functional system organization. Vertical mirror, or bilateral, symmetry is a particularly salient form of structural regularity [16,22], and the reliability with which it is detected depends on local display features and their image context [23,24,25]. As a shape property, bilateral symmetry attracts attention [26] and enhances the perceptual salience [27] of objects in the visual field. Aesthetic judgments and preferences [28] are strongly influenced by object symmetry, and the ability to exploit it for behavioral choice is not only found in vertebrates, but also in invertebrate species, such as insects [29,30]. Whether there may be color-selective symmetry channels in the visual brain, is unclear. As suggested previously [31,32], symmetry perception is sensitive to color-correlations across the symmetry axis. Also, symmetry detection may benefit from color-driven attention [33,34], although visual sensitivity to symmetry does not appear to be color selective [32]. Variations in color saturation, hue, or luminance across the axis of symmetry affect the time a perceptual system takes to detect and respond to patterns [35,36,37,38]. The neural networks of the magnocellular pathway (m-channel) of the visual brain are mainly devoted to achromatic contrast coding for perception, whereas the neural networks of the parvocellular pathway (p-channel) mainly subserve chromatic spatial vision [36,37,38]. Transcranial magnetic stimulation (TMS) over the visual cortex produces inhibition of magnocellular (achromatic) stimuli faster, compared with parvocellular (color) stimuli, and the inhibition is measurably stronger for magnocellular (achromatic) patterns [36]. This particular vulnerability of achromatic contrast vision to TMS is correlated with distinct physiological properties of this pathway, such as faster conduction velocity of the neural networks producing shorter response times in behavior [37,38]. Simple reaction times measured in response to chromatic and achromatic stimuli have led to suggestions that the chromatic system involves slower, sustained neural processing, while the achromatic luminance system processes input faster in a so-called transient functional regime [38,39]. The underlying visual pathways display fundamental differences in temporal mechanisms, with distinguished functional properties measurable in the millisecond domain in the human brain by fMRI [39]. These results open perspectives for modeling brain responses with millisecond precision to better understand the temporal dynamics of neural computations in vivo and to breathe functional realism into biologically inspired robotic vision. Artificial vision systems based on neural interactions have great difficulty to process spatial relations between symmetric objects with the same accuracy as human perception without resorting to augmenting the artificial neural network with planar/reflection symmetry scores along multiple axes to produce improvements in classification accuracy across categories [40,41]. Artificial vision thus benefits from insight into spatiotemporal mechanisms that determine human visual perception. The latter uses self-organizing biological learning [42] to adapt to steadily changing external environments of the physical world. Neural network models based on self-organizing visual mapping [43,44] have proven sensitive to mirror symmetry uncertainty in visual color patterns [45,46] in a similar way as the human perceptual system [45]. The emerging consensus under the light of current state of the art biological vision converges towards the assumption that symmetry detection is accounted for by a multiple-channel model, where the response of each channel represents a combination of the output of early symmetry detectors (mechanisms) and the output of additional processing resources required to deal with external and/or intrinsic sources of noise [22,47]. Bilateral symmetry across the vertical axis represents one of the most important cue features for the rapid detection of symmetry in biological vision [47].
Here, we vary perceptual symmetry uncertainty by giving local shape elements variable parameters for hue, saturation, or achromatic luminance contrast across the vertical axis of symmetry. The shape pairs and all local elements always display perfect geometric mirror symmetry. Yet, geometrically perfect symmetry neither reflects the true state of nature and the universe [48], nor does it entail faithful receptor encoding and representation by the perceptual system. Factors such as contextual noise [22,47], viewing angle or perspective [49], rotation [50], and differences in luminance or non-matching contrast polarities across the axis of symmetry [51] affect the perceptual salience of geometrically perfect mirror symmetry. Moreover, vision includes a system of low-level neural networks that filter luminance contrast and color information through receptive fields on the retina by way of two parallel processing streams [35,36,37,38,39] prior to processing shape and stimulus geometry at higher (cortical) levels of brain integration. The antagonistic functional organization of receptive fields of the magnocellular (m-channel contrast vision) pathway is selective to luminance contrast, and colorblindness, and generates fast transient signals (Figure 1, left). The receptive fields of neurons of the parvocellular (p-channel color vision) pathway, which generates slow, sustained signals, have the same antagonistic functional organization, but are selective to the spectral wavelengths of color, while preserving sensitivity to the luminance contrast of these colors (Figure 1, right). How many different wavelengths of the visible spectrum are filtered selectively by the neural networks of the retina is not known. However, there is little doubt that the additional coding spectrum of p-channel vision requires additional computational complexity at the earliest levels of processing, and entails further network complexities at higher (cortical) stages of shape analysis. The properties of the stimuli in this experiment were designed to directly tap the properties of m and p channels [35,36,37,38,39], with the goal of probing how local variations in contrast or color across an axis of bilateral symmetry differentially affects the time course of symmetry detection under conditions where it is geometrically perfect. How many colors of the visible spectrum need to be processed in the stimulus is presumed relevant for human detection and for biologically inspired robot vision and for symmetry detection models based on positional RGB coding [52].
2. Materials and Methods
Choice response times of human observers were measured as the psychophysical consequence of stimulus uncertainty [53,54] in a task-design with minimized symmetry detection error and no speed–accuracy trade-off [55,56]. This was ensured by the fact that shape pairs with vertical mirror symmetry were presented in optimal planar view and in the absence of contextual visual noise. The systematic variations in the symmetry of things in a thing within the shape pairs were made operational experimentally by giving the local shape elements in the two-dimensional patterns (Figure 2) variable appearance and luminance contrast (Table 1 and Table 2). All the shape pairs and elements therein had geometrically perfect vertical mirror symmetry. Symmetry uncertainty was introduced only through physical color and/or intensity variations across the axis of symmetry between shapes on either side in a pair.
2.1. Images and Display Calibration
The images displaying the mirror symmetric shape pairs (Figure 2) were designed to be displayed on a medium grey (R = 130, G = 130, B = 130) computer screen background with a photometric luminance of 40 candela per square meter (cd/m2 covering a surface of 2560 × 1361 pixels. The image displays were generated in Photoshop 12 using a high-resolution professional computer screen for color design (EIZO COLOR EDGE CG 275W, 2560 × 1440 pixels resolution) connected to a DELL computer equipped with a high-performance graphics card (NVIDIA 385.73, WDDM user mode, with a total memory capacity of 10180 MB, and a memory clock capacity of 1504 MHz).
Color and luminance calibration of the RGB channels of the monitor was performed using Color Navigator self-calibration software, which was delivered with the screen and ran under Windows. The photometric luminance values of RGB combinations were given here in cd/m2 (Table 1) and were all cross-checked with a CAMBRIDGE RESEARCH SYSTEMS photometer. Variable appearance in terms of hue, saturation, and luminance of local shape elements was obtained by selectively manipulating local color parameters in Adobe RGB color space. The local color variations (chromatic displays) for the complexity levels (4) and (5) explained in Figure 2 included all wavelengths of the spectrum visible to the human eye. The corresponding physical parameters and photometric luminance values are given in Table 1.
The resulting variations in local luminance produced variable shape pattern contrast intensities. These were calculated in terms of Michelson [57] pattern contrast ratios (C), which vary between 0 and 1 and refer to the contrast of patterns, relative to the average contrast value of the whole visual image. When C = 0, then the pattern has no luminance contrast, and when C = 1, it has maximum contrast. C was computed on the basis of
C = (Lmax − Lmin)/(Lmax + Lmin)
2.2. Choice Response Time Experiment
The response time experiments were run between September and December 2019. Human decision uncertainty was quantified in a choice response time experiment where an individual had to decide as quickly as possible whether the two shapes in a given pair were symmetrical or not (yes or no) using a classical psychophysical forced-choice procedure.
2.2.1. Participants
Fifteen healthy young individuals, all undergraduate volunteers (mostly law students) and/or young professionals with normal or corrected-to-normal visual acuity participated in the test phase. The Ishihara plates [58] were used prior to individual testing to ensure that all participants had normal color vision. The experiments were run under conditions in full conformity with the Helsinki Declaration for scientific experiments on humans. All individuals signed an informed consent to participate; their identities were not revealed. The consent form used to that effect is made available in Figure S1 of the Supplementary Materials Section. The procedure adheres to the rules and regulations formulated by the ethics board of the corresponding author’s host institution (CNRS) for response data collection from healthy human individuals in non-invasive psychophysical tasks. Examination of the experimental protocol by a specific ethics committee is not mandatory for this kind of psychophysics.
2.2.2. Procedure
The tests were run on a portable PC workstation (HP Zenbook) equipped with a high- performance graphics card (NVIDIA 385.73, WDDM user mode, with a total memory capacity of 10180 MB, and a memory clock capacity of 1504 MHz). Individual participants were seated in front of the screen of the workstation, with their eyes at a distance of about 80 cm from the center of the screen, as measured with a tape. The floor was marked for positioning the chair, and the height of the seat was adjusted to individual head height with respect to the screen. Experiments were run in a semi-dark office room with all stores down to filter daylight, and with no other light source in the room apart from the computer screen. Subjects’ eyes were adapted to the lighting conditions for about five minutes. The adaptation luminance was 2.5 cd/m2, which corresponds to mesopic viewing conditions. Prior to testing, each individual participant was shown a geometrically perfect mirror symmetric shape pair (two dark shapes on a light background with no local variations in hue or luminance contrast) as an image example of a mirror symmetric display. In the test sessions, images were displayed in random order. Each image was preceded by a brief alert sound (a 1000 Hz frequency pure sound). The ten test images corresponding to the different hue variability conditions were presented twice to each participant in each of two successively repeated sessions to allow for a counterbalanced order of locus of hue variability in left and right shapes of a pair within, and between, the experimental sessions. Participants received instructions stating that images with two abstract patterns, one on the left and one on the right, would be shown to them and that their task was to “decide as quickly as possible and as soon as an image comes up on the screen whether or not the two patterns in the given image are mirror symmetric or not”. A keyboard response had to be issued by pressing ‘1′ for ‘yes’ or ‘2’ for ‘no’.
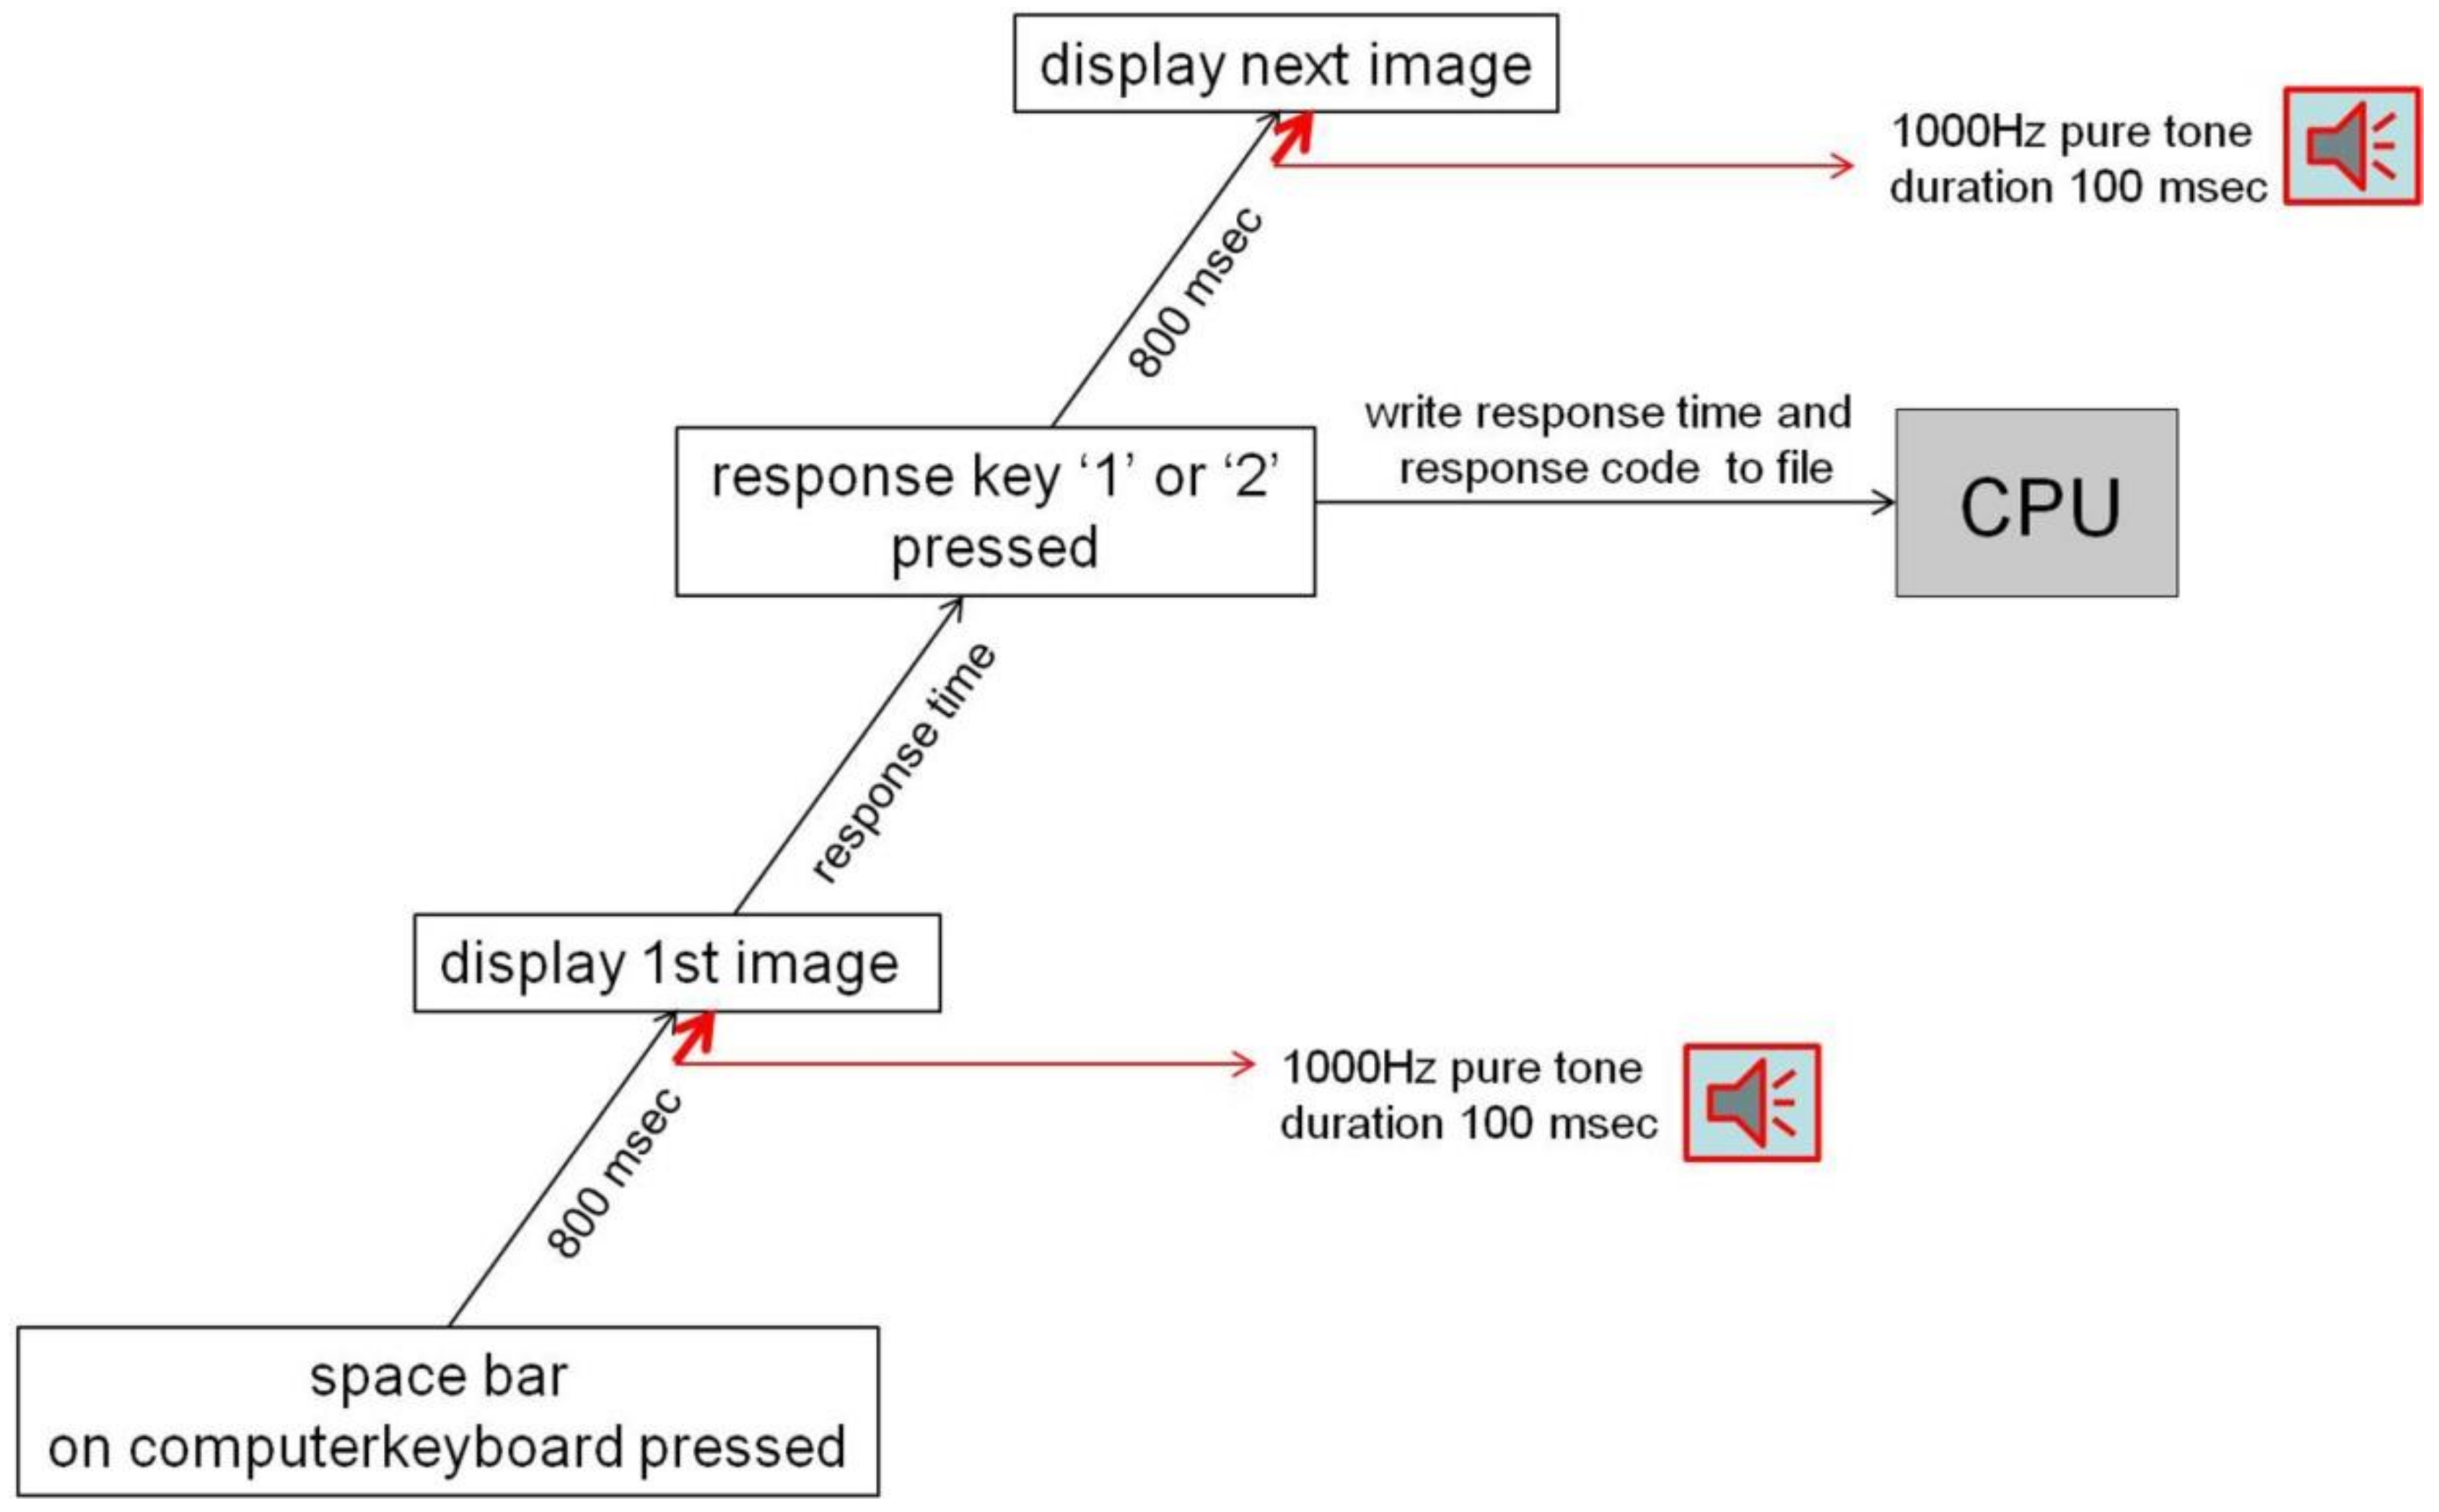
The flowchart of a trial sequence for a given individual session is shown in Figure 3. Prior to testing, individuals were given a few practice trials with black and white example images to ensure that they all had understood the instructions and maintained index and middle fingers of their dominant hands hovering over the critical numbers on the keyboard to press a key without any motor response delay. A choice response time corresponded to the time between image onset and the moment an adequate response key (1 or 2) was pressed. The number corresponding to a response choice was recorded and stored in a labeled data column of an Excel file in the Central Processing Unit (CPU). The response time code associated with a ‘yes’ or ‘no’ decision was stored in another labeled data column of the same Excel file. As soon as a response was given, the current image disappeared from the screen, and 800 milliseconds later the next image was delivered. Image presentation and response data encoding were, as in our previous work [45,59], controlled by a program written in Python 2.7 for Windows using the Spyder 2.0 environment. The Python codepages relative to image presentation and experimental session control are provided in the Figures S2 and S3 of the Supplementary Materials Section.
3. Results
With 10 image configurations presented twice (2 × 10) in a random order in an individual session, two successive sessions per participant, and 15 participants, a total of 600 choice response time (RT) data were recorded in the test sessions. Since all shape pairs in the images were mirror-symmetric, ‘no’ responses were rare (20 of the 600 recorded choice responses gave ‘2′ for ‘no’, which corresponded to less than four percent of the total number of observations), as could be expected. In these rare cases, response times giving ‘1′ for ‘yes’ only among the four recorded were used for computing the average individual RT for the given image configuration. The individual RT data, averaged over repeated trials for each factor level (image) and participant, were submitted to a 2-Way Analysis of Variance (ANOVA) using the Sigmaplot 11 statistics modules developed by SYSTAT. The individual data fed into the analysis are included in Table S1 in the Supplementary Materials. The full ANOVA report is provided in Table S2 of the Supplementary Materials.
3.1. Two-Way ANOVA
The statistical analysis corresponded to a Cartesian Design plan H5 x C2 x 15, with two levels (chromatic, achromatic) of the ‘Hue’ factor and five levels (1,2,3,4,5 as shown in Figure 2) of the ‘Variability’ factor, and with 15 individual response times (RT) per factor level, averaged over four repeated presentations for each of the ten images. This analysis plan yielded a total number of N = 150 data with N-1 = 149 degrees of freedom (DF). The means and standard errors for the different factor levels and their interactions are given in Table 3. The ANOVA exploited the standard errors as inferential measure of the statistical strength of a given mean. The results from the ANOVA, with the F statistics and their corresponding probability limits, are shown in Table 4.
The means for the two levels of the hue factor (Table 3) signal longer RT for chromatic displays by comparison with achromatic displays, with a difference of 1122.8 − 1031.8 = 93 milliseconds (msec). This effect of the hue factor was statistically significant, as shown in the ANOVA results displayed in Table 4. The means for the five levels of the variability factor (Table 3) signal a systematic increase of RT, from 589.6 to 1489.1 for factor levels 1 to 5, with increasing variability across the axis of symmetry. This effect of the variability factor was statistically significant, as shown in the ANOVA results displayed in Table 4. Mean RT as a function of the combinations of levels of the two factors, shown under Interactions at the bottom of Table 3, reflected a significant interaction, as shown in Table 4, between the hue and variability factors. This led to the conclusion that the effect of one factor depended on the effect of the other. A graphic illustration of these effects, and their interaction, is provided in the plot showing the individual RT data, averaged over repeated stimuli, of the 15 subjects for color and achromatic conditions in Figure 4 below.
3.2. Linear Regression Analysis
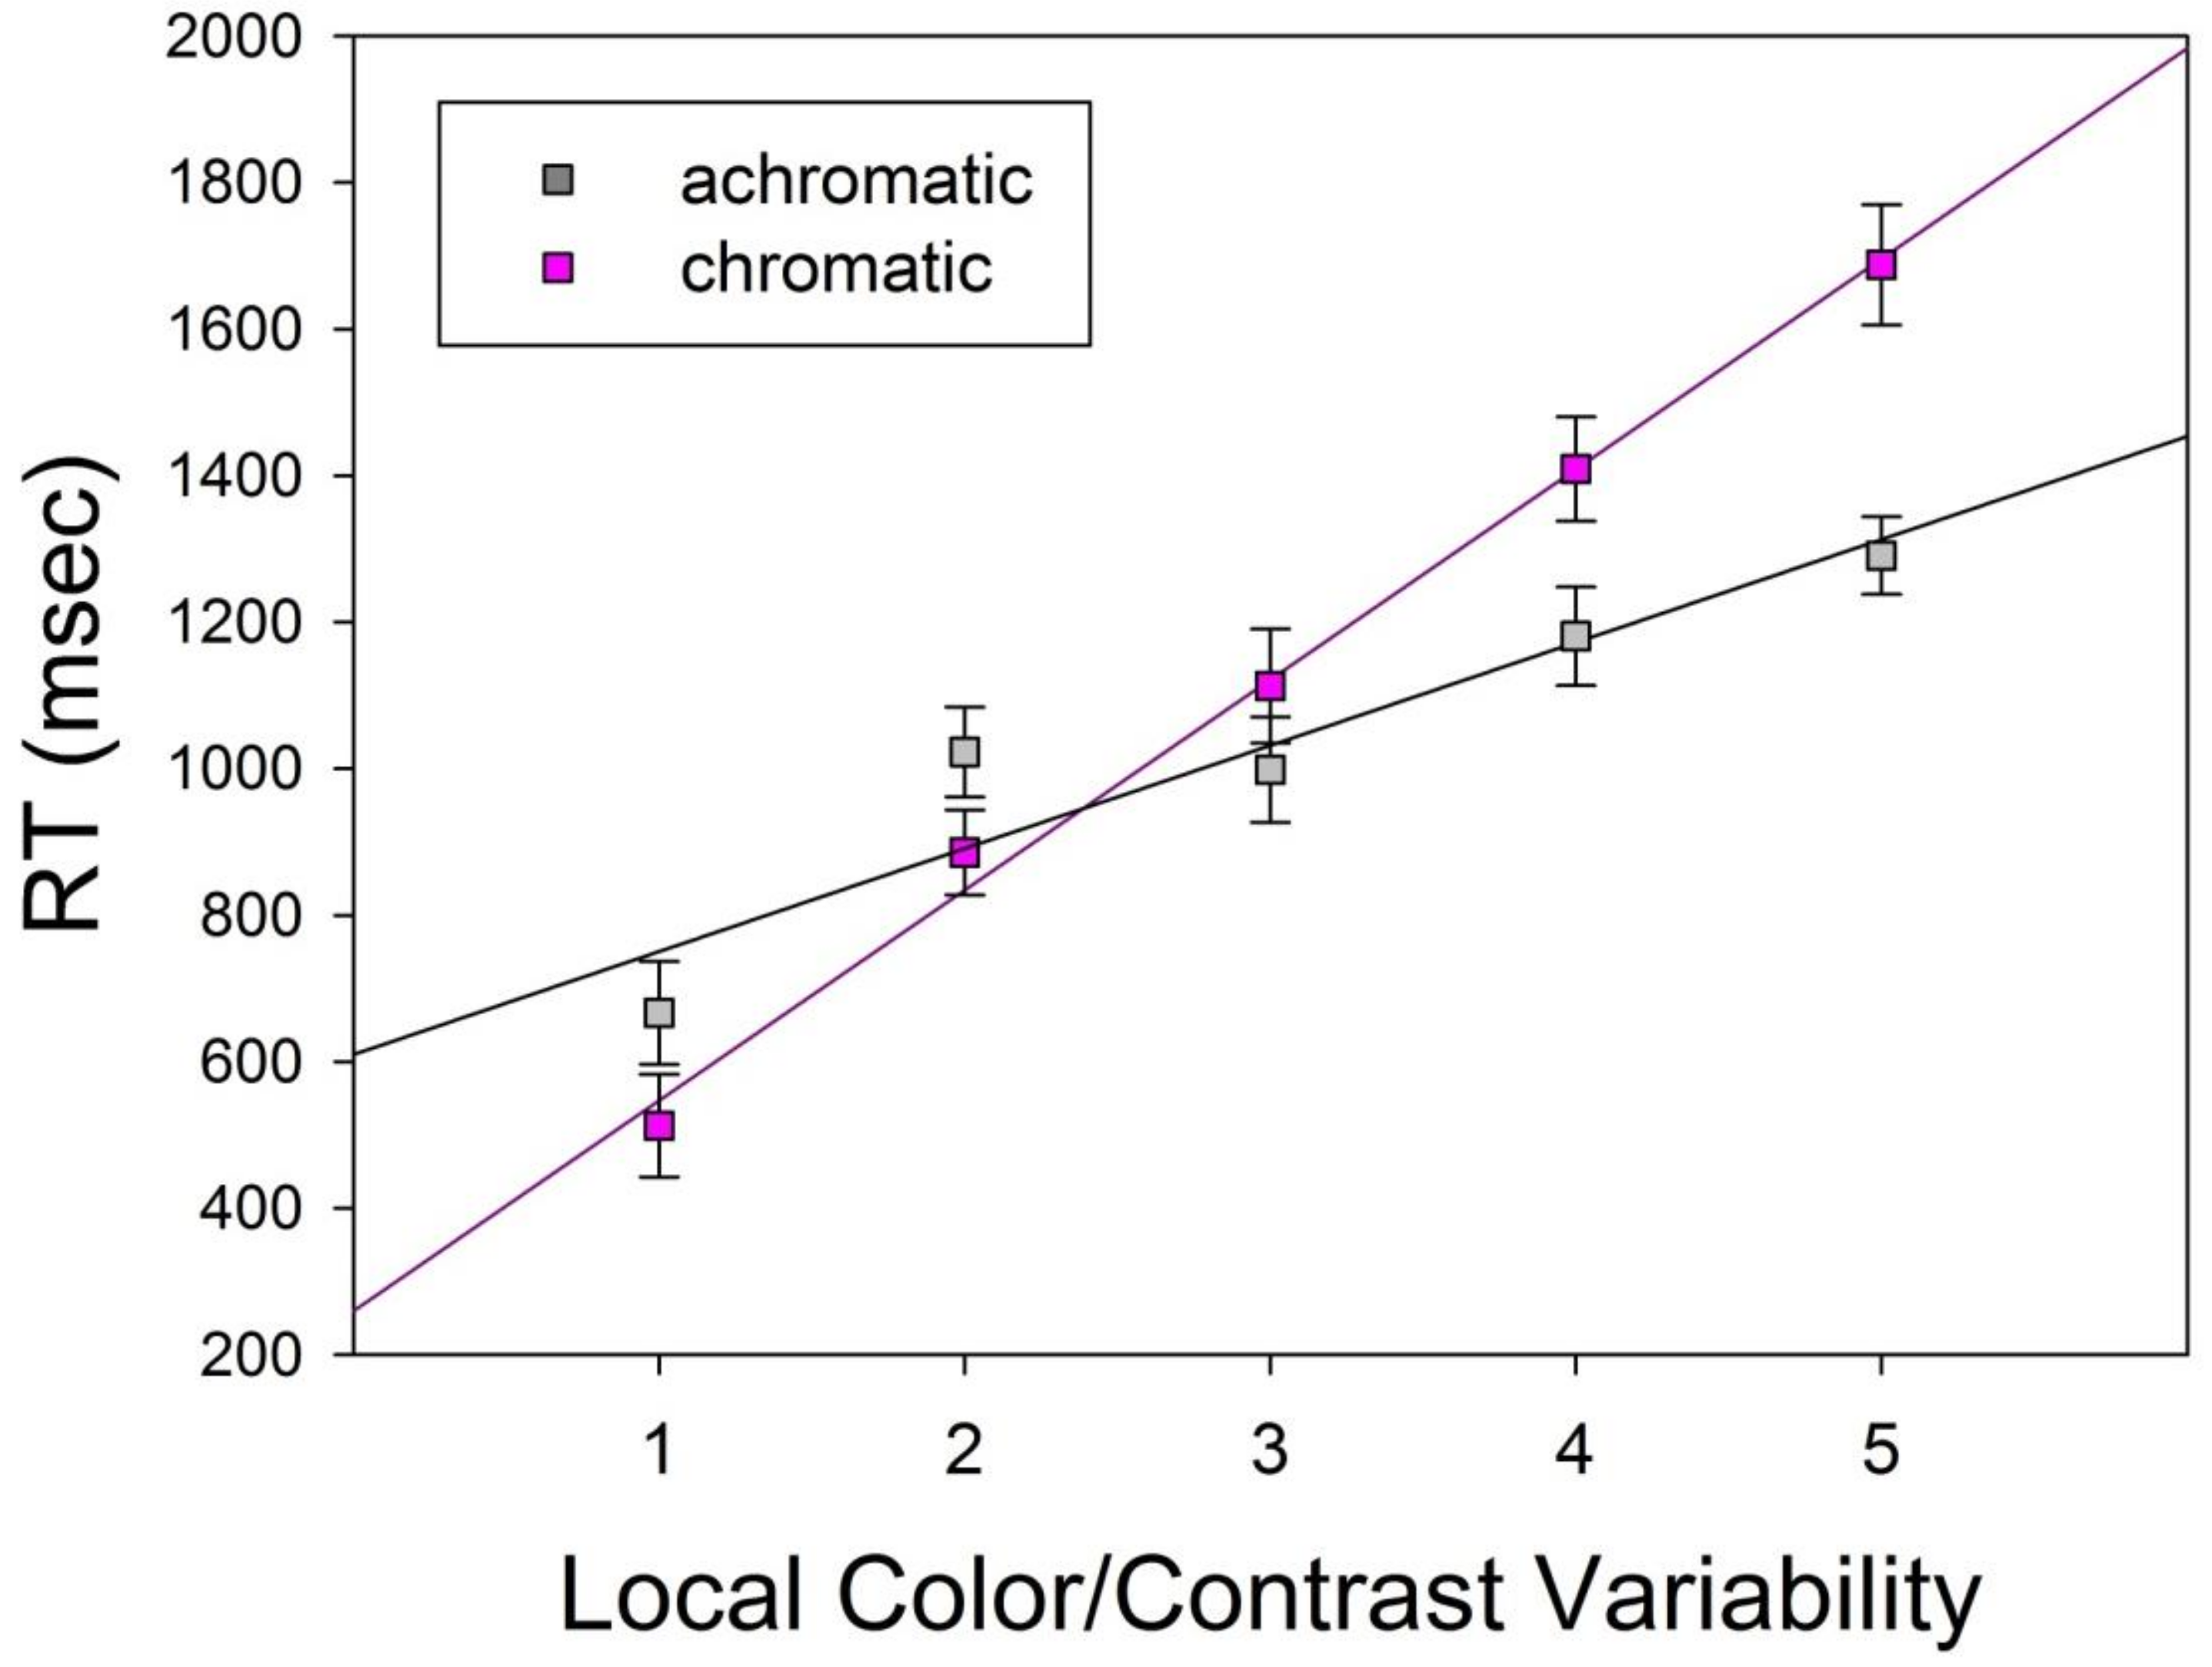
The average data from each of the two levels of the hue factor, as a function of the five levels of the variability factor, displayed a systematic increase in RT with increasing color/contrast variability (levels 1 to 5) for chromatic as well as achromatic displays, as shown under Interactions in Table 3, plotted graphically in Figure 5. The error bars in the graphs indicate the standard deviations of the means, which is a descriptive measure of dispersion of the observed data from their means, while Table 3 displays the standard errors of the means, which reflect the standard deviation divided by the square root of the number of observations. The standard error was used as a statistical decision criterion by the ANOVA. To further quantify these effects and their interactions, the corresponding average RT data were submitted to linear regression analyses. The results from these analyses are shown in Table 5 in terms of linear model functions, intercepts (a), slopes (b), and regression coefficients (R2). The standard errors for intercept and slope estimates were 38.15 and 11.50, respectively, for ‘color’, and 97.62 and 29.43, respectively, for ‘achromatic’.
RT to both colored and achromatic image displays was shown to increase linearly with the level of local color or contrast variability (complexity) across the principal axis of vertical mirror symmetry between two shapes of a pair. The results plotted in Figure 5 show a steeper slope (b) of the linear model function for color by comparison with the linear model function for achromatic; the intercept (a) of the model for color was smaller by comparison with that of the model for achromatic. The linear model here reflected the homoscedastic distribution of the data in each condition (color and achromatic). The individual datapoints were, in both cases, about the same distance away from the regression line for each level of the x-axis. The error bars in Figure 5 are consistent with homoscedastic distributions. The descriptive plot of the individual data provided in Figure 4 further illustrates the homoscedasticity of the distributions for color and achromatic. The goodness of the linear fits on the means (Table 3), reflected by the regression coefficient R2, was satisfactory for both model functions, but signaled a better linear fit for color (R2 = 0.99) by comparison with achromatic (R2 = 0.88). Figure 5 graphically displays the means and the linear model fits for these two experimental conditions (color versus achromatic).
4. Discussion
Symmetry detection is an interesting case of pattern and shape analysis because it requires the matching of novel patterns without the benefit of prior recognition. A vertical axis of bilateral symmetry is an important image feature in this regard. Here, it was shown that shape pairs with geometrically perfect vertical mirror symmetry, but a non-homogenous appearance, produced by local variations in hue, saturation, or luminance contrast across the vertical axis of symmetry between shapes in a given pair produced longer times to respond to detected symmetry. The fact that local variations in visual parameters increased human symmetry uncertainty, by delaying conscious choice response time, is an ecologically relevant [50,51] observation, consistent with theoretical frameworks explaining the perceptual integration of complex shapes and their local characteristics on the basis of interactions between low-level (sensorial) and high level (cognitive) mechanisms [60]. The linear increase in RT as a function of the increase in local color or contrast variability is a direct consequence of processing (system) complexity and consistent with the Hick-Hyman Laws [54,55] in psychophysics. The significantly longer RT observed with the colored displays by comparison with the achromatic shape displays directly reflects the functional properties of the color (p-channel) and contrast (m-channel) processing networks of the brain [35,36,37,38]. Color may either facilitate or inhibit the emergence of pattern saliency, as previous work has shown [61,62,63,64]. Quantifying the effects of varying amounts and types of noise on detection time and error rates represents a worthwhile effort for further experiments with speed-accuracy trade-offs in symmetry detection comparing m-channel to p-channel mediated contextual modulations. The findings and their discussion here apply to mirror symmetric patterns without signal-to-noise ratio. When pattern noise is added (Figure 6), the saliency of any bilateral symmetry pattern, with or without variability in color or contrast or across the axis of symmetry, will be more or less severely affected by contextual modulation [22,47].
Variability in color across an axis of symmetry implies greater complexity of the underlying brain networks at all stages of processing, as further illustrated in Figure 7. The results make a case for color-blind contrast-only vision models in shape computation for action. In related fields at the intersection of artificial intelligence and robotics, such relevance matters in current developments in bionics and AI technology for devices that mimic human vision properties, for gesture detection and recognition based on time-harmonic electromagnetic wave point signals [65,66], or 2D and 3D geometric shape simulation, by prescribing a set of relevant characteristics of a specific object [67].
Algorithmic approaches that resort to computing shapes as wholes may not always deliver the best solution. Brain inspired neural architectures with the properties of spiking-based feed-forward networks [68] enable mirror symmetry representation by strictly local, coincidence-detection-based computations and delay-specific spike inhibition [69]. These models rely on hierarchically organized processing cascades akin to those found in the visual brain and are capable of effective shape analysis between many sets of variable data with varying complexity [69].
5. Conclusions
Bilateral shape symmetry is an abundant feature in nature and physics, and sometimes close to geometrically perfect. Perception, however, filters geometrically perfect stimulus geometry depending on the processing channels stimulated by a given configuration. Color and luminance contrast may either facilitate or inhibit the perceptual saliency of mirror symmetry, depending on spatial configuration. The delay with which this saliency is processed by the brain depends on the processing characteristics of M-system and P-system neural networks in the visual brain (Figure 1). The P-system, because it is selective to spectral wavelength in addition to being contrast sensitive, requires additional network resources for shape computations, including the detection of symmetry, as shown here quite clearly. This difference in computational complexity, and the ways in which it affects visual processing, has direct implications for bioinspired robot vision and for symmetry detection algorithms, based on RGB coordinates of local shape pixels and their mirror positions across an axis of symmetry. In the case of medical image processing [70,71], the results invite the employment of color-contrast-based augmented reality cogently and with caution across any axis of clinically relevant symmetry.
Supplementary Materials
The following are available online at www.mdpi.com/article/10.3390/computation10060099/s1, Figure S1: Informed consent form signed by all the participants, Figure S2: Python code relative to image presentation control, Figure S3: Python code relative to experimental session control, Table S1: Excel file with the individual RT data subjected to two-way anova, Table S2: 2-Way ANOVA output report.
Funding
This research received no external funding.
Institutional Review Board Statement
The study was conducted according to the guidelines of the Declaration of Helsinki. All the individuals provided informed consent to participate. Their identity is not revealed. The test procedure fully adheres to rules and regulations set by the ethics board of the corresponding author’s host institution (CNRS) for response data collection from healthy human individuals in non-invasive psychophysical choice response tasks, for which examination of the experimental protocol by a specific ethics committee is not mandatory. Ethical review and approval were, as a consequence, waived for this study.
Informed Consent Statement
Informed consent was obtained from all subjects involved in the study. The form used to that effect is provided in the Supplementary Materials Section and can be downloaded as a word document.
Data Availability Statement
All data are made available in this publication.
Conflicts of Interest
The author declares no conflict of interest.
References
- Schweisguth, F.; Corson, F. Self-Organization in Pattern Formation. Dev. Cell 2019, 49, 659–677. [Google Scholar] [CrossRef] [PubMed]
- Carroll, S.B. Chance and necessity: The evolution of morphological complexity and diversity. Nature 2001, 409, 1102–1109. [Google Scholar] [CrossRef]
- García-Bellido, A. Symmetries throughout organic evolution. Proc. Natl. Acad. Sci. USA 1996, 93, 14229–14232. [Google Scholar] [CrossRef] [PubMed] [Green Version]
- Groves, J.T. The physical chemistry of membrane curvature. Nat. Chem. Biol. 2009, 5, 783–784. [Google Scholar] [CrossRef] [PubMed]
- Dongen, S.V. Fluctuating asymmetry and developmental instability in evolutionary biology: Past, present and future. J. Evol. Biol. 2006, 19, 1727–1743. [Google Scholar] [CrossRef] [PubMed]
- Dresp-Langley, B. Affine Geometry, Visual Sensation, and Preference for Symmetry of Things in a Thing. Symmetry 2016, 8, 127. [Google Scholar] [CrossRef] [Green Version]
- Levy, K.; Lerner, A.; Shashar, N. Mate choice and body pattern variations in the Crown Butterfly fish Chaetodon paucifasciatus (Chaetodontidae). Biol. Open 2014, 3, 1245–1251. [Google Scholar] [CrossRef] [Green Version]
- Gross, M.R.; Suk, H.Y.; Robertson, C.T. Courtship and genetic quality: Asymmetric males show their best side. Proc. R. Soc. B Boil. Sci. 2007, 274, 2115–2122. [Google Scholar] [CrossRef] [Green Version]
- Dresp, B.; Jouventin, P.; Langley, K. Ultraviolet reflecting photonic microstructures in the King Penguin beak horn. Biol. Lett. 2005, 1, 310–313. [Google Scholar] [CrossRef] [Green Version]
- Nolan, P.M.; Dobson, F.S.; Dresp, B.; Jouventin, P. Immunocompetence is signalled by ornamental color in King Penguins, Aptenodytes Patagonicus. Evol. Ecol. Res. 2006, 8, 1332–1335. [Google Scholar]
- Dresp, B.; Langley, K. Fine structural dependence of ultraviolet reflections in the King Penguin beak horn. Anat. Rec. A 2006, 288, 213–222. [Google Scholar] [CrossRef] [PubMed]
- Johnstone, R.A. Female preference for symmetrical males as a by-product of selection for mate recognition. Nature 1994, 372, 172–175. [Google Scholar] [CrossRef] [PubMed]
- Deregowski, J.B. Symmetry, Gestalt and information theory. Q. J. Exp. Psychol. 1971, 23, 381–385. [Google Scholar] [CrossRef] [PubMed]
- Eisenman, R. Complexity–simplicity: I. Preference for symmetry and rejection of complexity. Psychon. Sci. 1967, 8, 169–170. [Google Scholar] [CrossRef]
- Eisenman, R.; Rappaport, J. Complexity preference and semantic differential ratings of complexity-simplicity and symmetry-asymmetry. Psychon. Sci. 1967, 7, 147–148. [Google Scholar] [CrossRef]
- Deregowski, J.B. The Role of Symmetry in Pattern Reproduction by Zambian Children. J. Cross-Cult. Psychol. 1972, 3, 303–307. [Google Scholar] [CrossRef]
- Amir, O.; Biederman, I.; Hayworth, K.J. Sensitivity to non-accidental properties across various shape dimensions. Vis. Res. 2012, 62, 35–43. [Google Scholar] [CrossRef] [Green Version]
- Mach, E. On Symmetry. In Popular Scientific Lectures; Open Court Publishing: LaSalle, IL, USA, 1893. [Google Scholar]
- Arnheim, R. Visual Thinking; University of California Press: Berkeley, CA, USA, 1969. [Google Scholar]
- Bahnsen, P. Eine Untersuchung über Symmetrie und Asymmetrie bei visuellen Wahrnehmungen. Zeitschrift Psychol. 1928, 108, 129–154. [Google Scholar]
- Wagemans, J. Characteristics and models of human symmetry detection. Trends Cogn. Sci. 1997, 1, 346–352. [Google Scholar] [CrossRef]
- Cohen, E.H.; Zaidi, Q. Symmetry in context: Salience of mirror symmetry in natural patterns. J. Vis. 2013, 13, e22. [Google Scholar] [CrossRef] [Green Version]
- Barlow, H.B.; Reeves, B.C. The versatility and absolute efficiency of detecting mirror symmetry in random dot displays. Vis. Res. 1979, 19, 783–793. [Google Scholar] [CrossRef]
- Barrett, B.; Whitaker, D.; McGraw, P.; Herbert, A. Discriminating mirror symmetry in foveal and extra-foveal vision. Vis. Res. 1999, 39, 3737–3744. [Google Scholar] [CrossRef] [Green Version]
- Machilsen, B.; Pauwels, M.; Wagemans, J. The role of vertical mirror symmetry in visual shape perception. J. Vis. 2009, 9, 11. [Google Scholar] [CrossRef] [PubMed] [Green Version]
- Baylis, G.C.; Driver, J. Perception of symmetry and repetition within and across visual shapes: Part-descriptions and object-based attention. Vis. Cognit. 2001, 8, 163–196. [Google Scholar] [CrossRef]
- Dresp-Langley, B. Bilateral Symmetry Strengthens the Perceptual Salience of Figure against Ground. Symmetry 2019, 11, 225. [Google Scholar] [CrossRef] [Green Version]
- Sabatelli, H.; Lawandow, A.; Kopra, A.R. Asymmetry, symmetry and beauty. Symmetry 2010, 2, 1591–1624. [Google Scholar] [CrossRef] [Green Version]
- Giurfa, M.; Eichmann, B.; Menzel, R. Symmetry perception in an insect. Nature 1996, 382, 458–461. [Google Scholar] [CrossRef]
- Plowright, C.M.S.; Bridger, J.J.M.; Xu, V.; Herlehy, R.A.; Collin, C.A. Floral guidance of learning a preference for symmetry by bumblebees. Anim. Cogn. 2017, 20, 1115–1127. [Google Scholar] [CrossRef]
- Gheorghiu, E.; Kingdom, F.A.A.; Remkes, A.; Li, H.-C.O.; Rainville, S. The role of color and attention-to-color in mirror-symmetry perception. Sci. Rep. 2016, 6, 29287. [Google Scholar] [CrossRef] [Green Version]
- Martinovic, J.; Jennings, B.J.; Makin, A.D.J.; Bertamini, M.; Angelescu, I. Symmetry perception for patterns defined by color and luminance. J. Vis. 2018, 18, 4. [Google Scholar] [CrossRef] [Green Version]
- Turatto, M.; Galfano, G. Attentional capture by color without any relevant attentional set. Percept. Psychophys. 2001, 63, 286–297. [Google Scholar] [CrossRef] [PubMed] [Green Version]
- Heidemann, G. Focus-of-attention from local color symmetries. IEEE Trans. Pattern Anal. Mach. Intell. 2004, 26, 817–830. [Google Scholar] [CrossRef] [PubMed]
- Liu, C.-S.; Bryan, R.; Miki, A.; Woo, J.; Liu, G.; Elliott, M. Magnocellular and Parvocellular Visual Pathways Have Different Blood Oxygen Level–Dependent Signal Time Courses in Human Primary Visual Cortex. AJNR Am. J. Neuroradiol. 2006, 27, 1628–1634. [Google Scholar] [PubMed]
- Paulus, W.; Korinth, S.; Wischer, S.; Tergau, F. Differential inhibition of chromatic and achromatic perception by transcranial magnetic stimulation of the human visual cortex. NeuroReport 1999, 10, 1245–1248. [Google Scholar] [CrossRef] [Green Version]
- Maunsell, J.H.; Ghose, G.M.; Assad, J.A.; McADAMS, C.J.; Boudreau, C.E.; Noerager, B.D. Visual response latencies of magnocellular and parvocellular LGN neurons in macaque monkeys. Vis. Neurosci. 1999, 16, 1–14. [Google Scholar] [CrossRef] [Green Version]
- Ueno, T. Sustained and transient properties of chromatic and luminance systems. Vis. Res. 1992, 32, 1055–1065. [Google Scholar] [CrossRef]
- Stigliani, A.; Jeska, B.; Grill-Spector, K. Differential sustained and transient temporal processing across visual streams. PLoS Comput. Biol. 2019, 15, e1007011. [Google Scholar] [CrossRef] [Green Version]
- Pramod, R.T.; Arun, S.P. Symmetric Objects Become Special in Perception Because of Generic Computations in Neurons. Psychol. Sci. 2017, 29, 95–109. [Google Scholar] [CrossRef]
- Pramod, R.T.; Arun, S. Improving Machine Vision Using Human Perceptual Representations: The Case of Planar Reflection Symmetry for Object Classification. IEEE Trans. Pattern Anal. Mach. Intell. 2020, 44, 228–241. [Google Scholar] [CrossRef]
- Dresp-Langley, B. Seven Properties of Self-Organization in the Human Brain. Big Data Cogn. Comput. 2020, 4, 10. [Google Scholar] [CrossRef]
- Kohonen, T. Self-Organizing Maps. 2001. Available online: http://0-link-springer-com.brum.beds.ac.uk/10.1007/978-3-642-56927-2 (accessed on 8 January 2021).
- Kohonen, T. MATLAB Implementations and Applications of the Self-Organizing Map; Unigrafia Oy: Helsinki, Finland, 2014. [Google Scholar]
- Dresp-Langley, B.; Wandeto, J. Human Symmetry Uncertainty Detected by a Self-Organizing Neural Network Map. Symmetry 2021, 13, 299. [Google Scholar] [CrossRef]
- Wandeto, J.M.; Dresp-Langley, B. The quantization error in a Self-Organizing Map as a contrast and colour specific indicator of single-pixel change in large random patterns. Neural Netw. 2019, 119, 273–285. [Google Scholar] [CrossRef] [PubMed]
- Chen, C.C.; Tyler, C.W. Symmetry: Modeling the effects of masking noise, axial cueing and salience. PLoS ONE 2010, 5, e9840. [Google Scholar] [CrossRef]
- Close, F. Lucifer’s Legacy: The Meaning of Asymmetry; Oxford University Press: Oxford, UK, 2000. [Google Scholar]
- Bertamini, M.; Tyson-Carr, J.; Makin, A.D.J. Perspective Slant Makes Symmetry Harder to Detect and Less Aesthetically Appealing. Symmetry 2022, 14, 475. [Google Scholar] [CrossRef]
- van Zoest, W.; Giesbrecht, B.; Enns, J.T.; Kingstone, A. New reflections on visual search: Interitem symmetry matters! Psychol. Sci. 2006, 17, 535–542. [Google Scholar] [CrossRef]
- Wenderoth, P. The Effects of the Contrast Polarity of Dot-Pair Partners on the Detection of Bilateral Symmetry. Perception 1996, 25, 757–771. [Google Scholar] [CrossRef]
- Hogeweg, L.; Sánchez, C.I.; Maduskar, P.; Philipsen, R.H.; Van Ginneken, B. Fast and effective quantification of symmetry in medical images for pathology detection: Application to chest radiography. Med. Phys. 2017, 44, 2242–2256. [Google Scholar] [CrossRef]
- Bonnet, C.; Fauquet, A.J.; Estaún Ferrer, S. Reaction times as a measure of uncertainty. Psicothema 2008, 20, 43–48. [Google Scholar]
- Brown, S.D.; Marley, A.A.J.; Donkin, C.; Heathcote, A. An integrated model of choices and response times in absolute identification. Psychol. Rev. 2008, 115, 396–425. [Google Scholar] [CrossRef] [Green Version]
- Proctor, R.W.; Schneider, D.W. Hick’s law for choice reaction time: A review. Q. J. Exp. Psychol. 2018, 71, 1281–1299. [Google Scholar] [CrossRef]
- Kvålseth, T.O. Hick’s law equivalent for reaction time to individual stimuli. Br. J. Math. Stat. Psychol. 2021, 74 (Suppl. S1), 275–293. [Google Scholar] [CrossRef] [PubMed]
- Kukkonen, H.; Rovamo, J.; Tiippana, K.; Näsänen, R. Michelson contrast, RMS contrast and energy of various spatial stimuli at threshold. Vis. Res. 1993, 33, 1431–1436. [Google Scholar] [CrossRef]
- Ishihara, S. Tests for Color-Blindness; Handaya: Tokyo, Japan, 1917. [Google Scholar]
- Dresp-Langley, B.; Monfouga, M. Combining Visual Contrast Information with Sound Can Produce Faster Decisions. Information 2019, 10, 346. [Google Scholar] [CrossRef] [Green Version]
- Treder, M.S. Behind the Looking-Glass: A Review on Human Symmetry Perception. Symmetry 2010, 2, 1510–1543. [Google Scholar] [CrossRef]
- Dresp-Langley, B.; Reeves, A. Simultaneous Brightness and Apparent Depth from True Colors on Grey: Chevreul Revisited. Seeing Perceiving 2012, 25, 597–618. [Google Scholar] [CrossRef] [PubMed] [Green Version]
- Dresp-Langley, B.; Reeves, A. Color and figure-ground: From signals to qualia. In Perception beyond Gestalt: Progress in Vision Research; Magnussen, S., Greenlee, M., Werner, J., Geremek, A., Eds.; Psychology Press: Abingdon, UK, 2014; pp. 159–171. [Google Scholar]
- Dresp-Langley, B.; Reeves, A. Effects of saturation and contrast polarity on the figure-ground organization of color on gray. Front. Psychol. 2014, 5, 1136. [Google Scholar] [CrossRef] [PubMed] [Green Version]
- Dresp-Langley, B.; Reeves, A. Color for the perceptual organization of the pictorial plane: Victor Vasarely’s legacy to Gestalt psychology. Heliyon 2020, 6, e04375. [Google Scholar] [CrossRef]
- Li, J.; Liu, H.; Sun, H. On a gesture-computing technique using electromagnetic waves. Inverse Probl. Imaging 2018, 12, 677–696. [Google Scholar] [CrossRef] [Green Version]
- Liu, H.; Wang, Y.; Yang, C. Mathematical Design of a Novel Gesture-Based Instruction/Input Device Using Wave Detection. SIAM J. Imaging Sci. 2016, 9, 822–841. [Google Scholar] [CrossRef] [Green Version]
- Li, J.; Liu, H.; Tsui, W.-Y.; Wang, X. An inverse scattering approach for geometric body generation: A machine learning perspective. Math. Eng. 2019, 1, 800–823. [Google Scholar] [CrossRef]
- George, J.K.; Soci, C.; Miscuglio, M.; Sorger, V.J. Symmetry perception with spiking neural networks. Sci. Rep. 2021, 11, 5776. [Google Scholar] [CrossRef] [PubMed]
- Sharman, R.J.; Gheorghiu, E. The role of motion and number of element locations in mirror symmetry perception. Sci. Rep. 2017, 7, 45679. [Google Scholar] [CrossRef] [PubMed] [Green Version]
- Dresp-Langley, B.; Wandeto, J.M. Unsupervised classification of cell imaging data using the quantization error in a Self Organizing Map. In Transactions on Computational Science and Computational Intelligence; Arabnia, H.R., Ferens, K., de la Fuente, D., Kozerenko, E.B., Olivas Varela, J.A., Tinetti, F.G., Eds.; Springer-Nature: Berlin/Heidelberg, Germany, 2021; pp. 201–210. [Google Scholar]
- Kim, A.S.; Cheng, W.-C.; Beams, R.; Badano, A. Color Rendering in Medical Extended-Reality Applications. J. Digit. Imaging 2020, 34, 16–26. [Google Scholar] [CrossRef] [PubMed]
Figure 1.
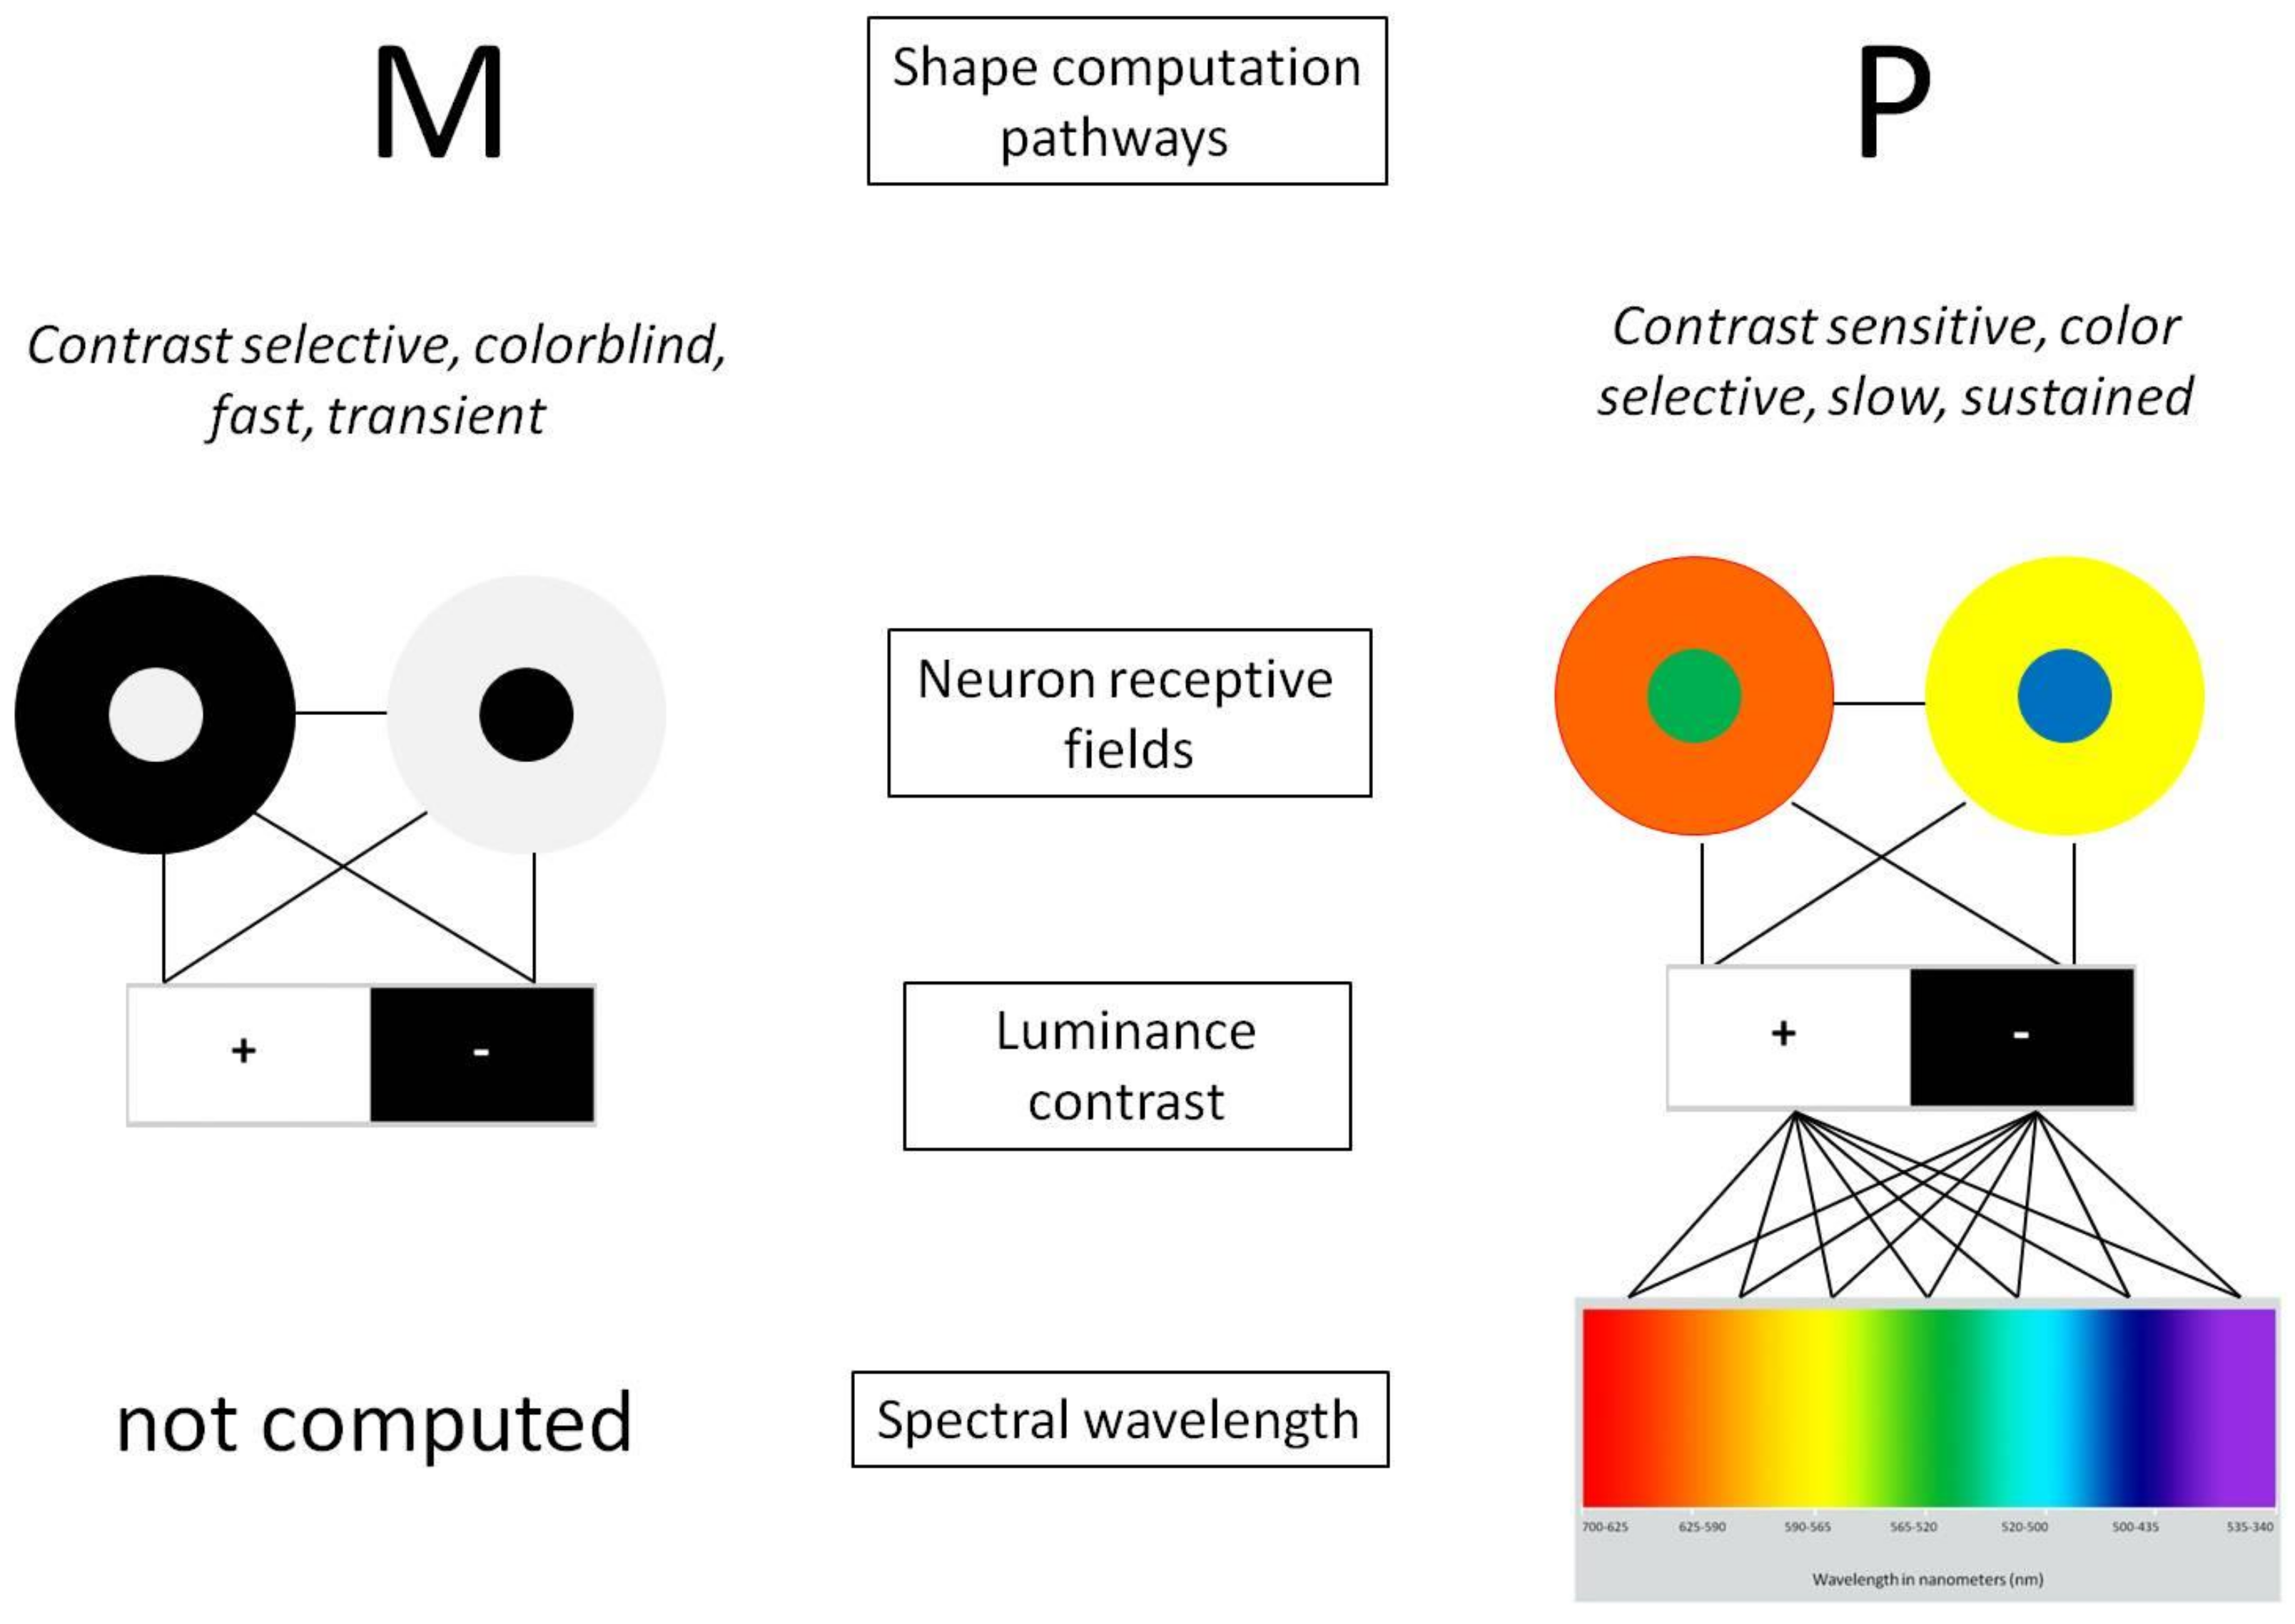
The antagonistic functional organization of receptive fields of the magnocellular (M-system) pathway is selective to luminance contrast, and colorblindness, and generates fast transient signals (left). The receptive fields of neurons of the parvocellular (P-system) pathway have the same antagonistic functional organization, but are selective to the spectral wavelengths of color, while preserving full sensitivity to the luminance contrast of the colors (right). How many different wavelengths of the visible spectrum are filtered selectively by the neural networks of the retina is not known. The additional coding spectrum of the P-system inevitably implies a higher degree of computational complexity, by comparison with the M-system.
Figure 1.
The antagonistic functional organization of receptive fields of the magnocellular (M-system) pathway is selective to luminance contrast, and colorblindness, and generates fast transient signals (left). The receptive fields of neurons of the parvocellular (P-system) pathway have the same antagonistic functional organization, but are selective to the spectral wavelengths of color, while preserving full sensitivity to the luminance contrast of the colors (right). How many different wavelengths of the visible spectrum are filtered selectively by the neural networks of the retina is not known. The additional coding spectrum of the P-system inevitably implies a higher degree of computational complexity, by comparison with the M-system.

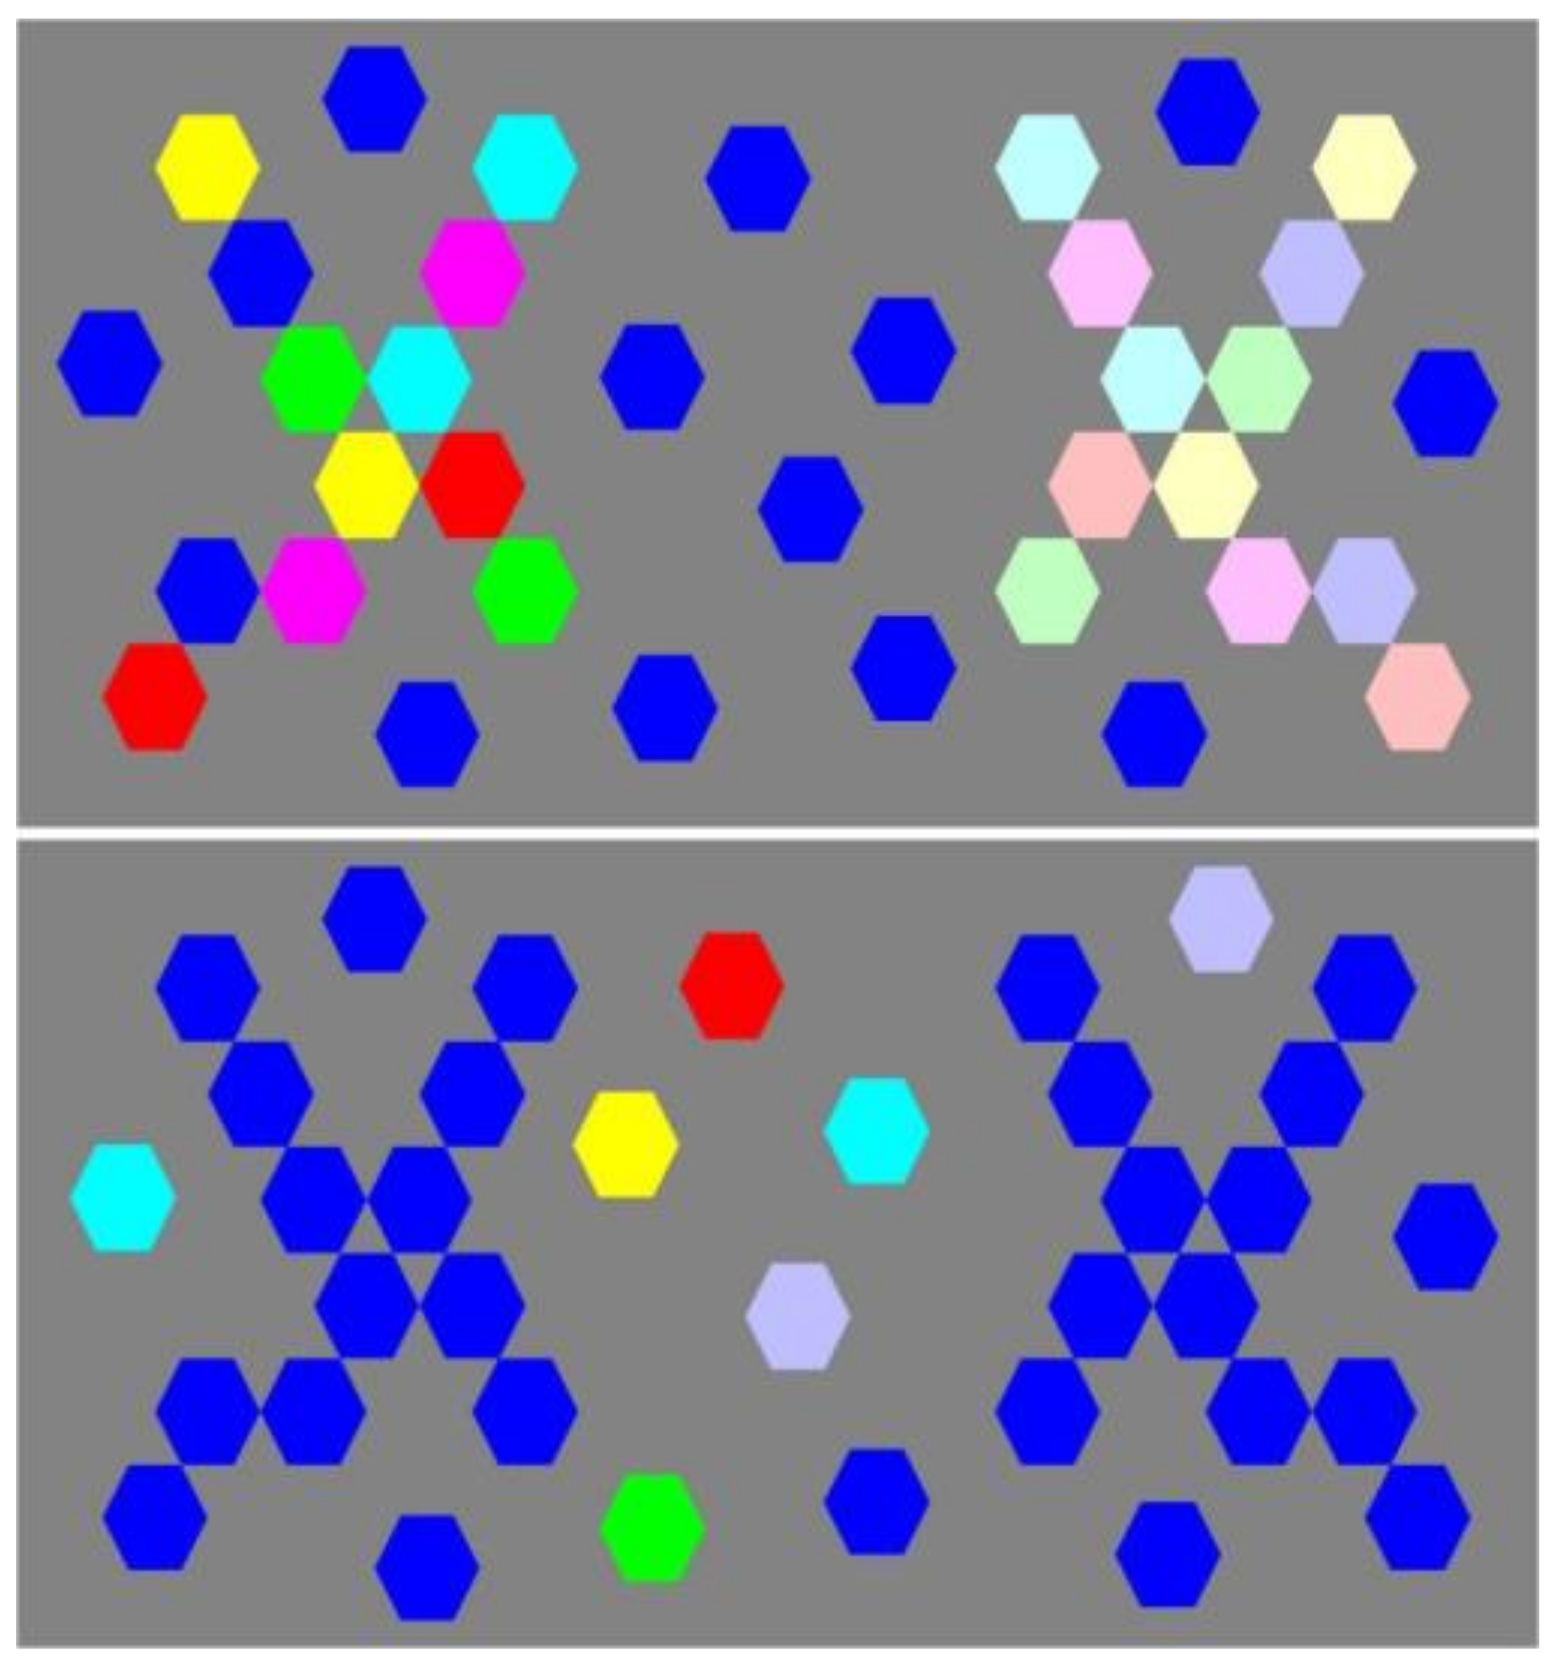
Figure 2.
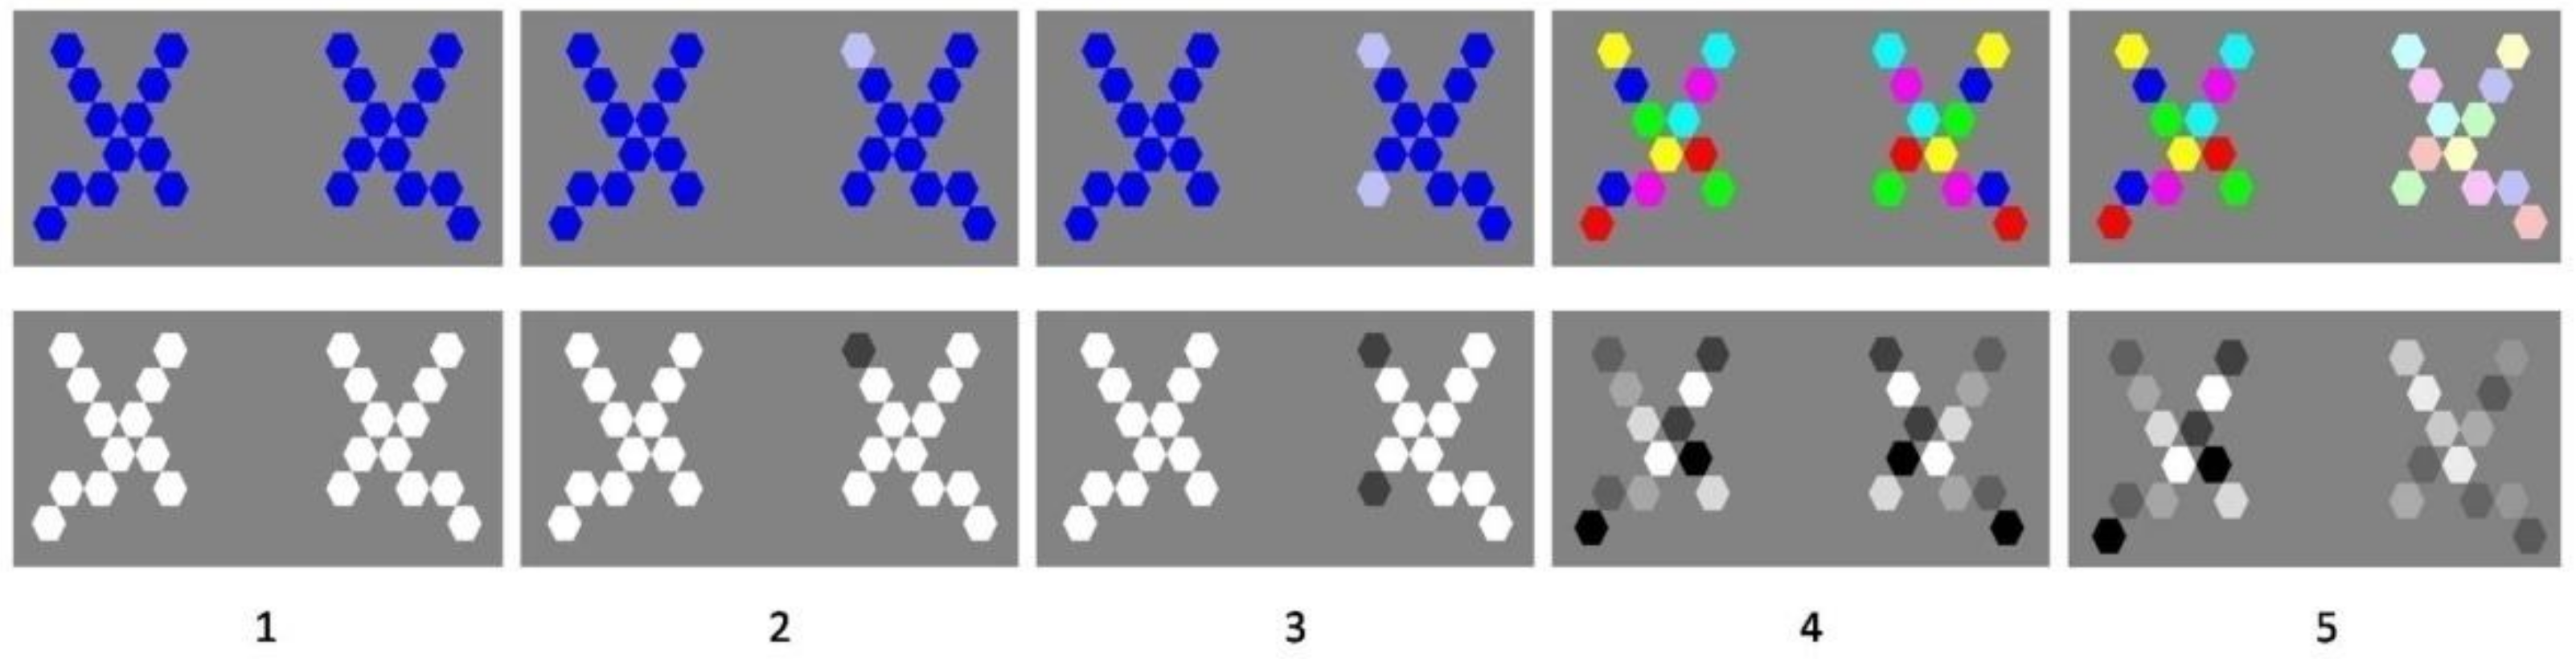
Images used in the choice response time experiment. Shape pairs displaying perfect geometric vertical mirror symmetry within and between shapes of any pair were presented to human individuals in random order. Variations in the symmetry of things in a thing of the shapes in a pair were generated by giving the local shape elements variable local hues or contrasts, producing five levels of increasing variability between the two shapes. This resulted in five arbitrary, experimentally operational levels of local shade variability producing perceptual system uncertainty from lowest (1) to highest (5). In (2), (3) and (5). The locus of variability between left and right was counterbalanced between experimental sessions.
Figure 2.
Images used in the choice response time experiment. Shape pairs displaying perfect geometric vertical mirror symmetry within and between shapes of any pair were presented to human individuals in random order. Variations in the symmetry of things in a thing of the shapes in a pair were generated by giving the local shape elements variable local hues or contrasts, producing five levels of increasing variability between the two shapes. This resulted in five arbitrary, experimentally operational levels of local shade variability producing perceptual system uncertainty from lowest (1) to highest (5). In (2), (3) and (5). The locus of variability between left and right was counterbalanced between experimental sessions.

Figure 3.
Flowchart of a trial sequence for a given individual session.

Figure 4.
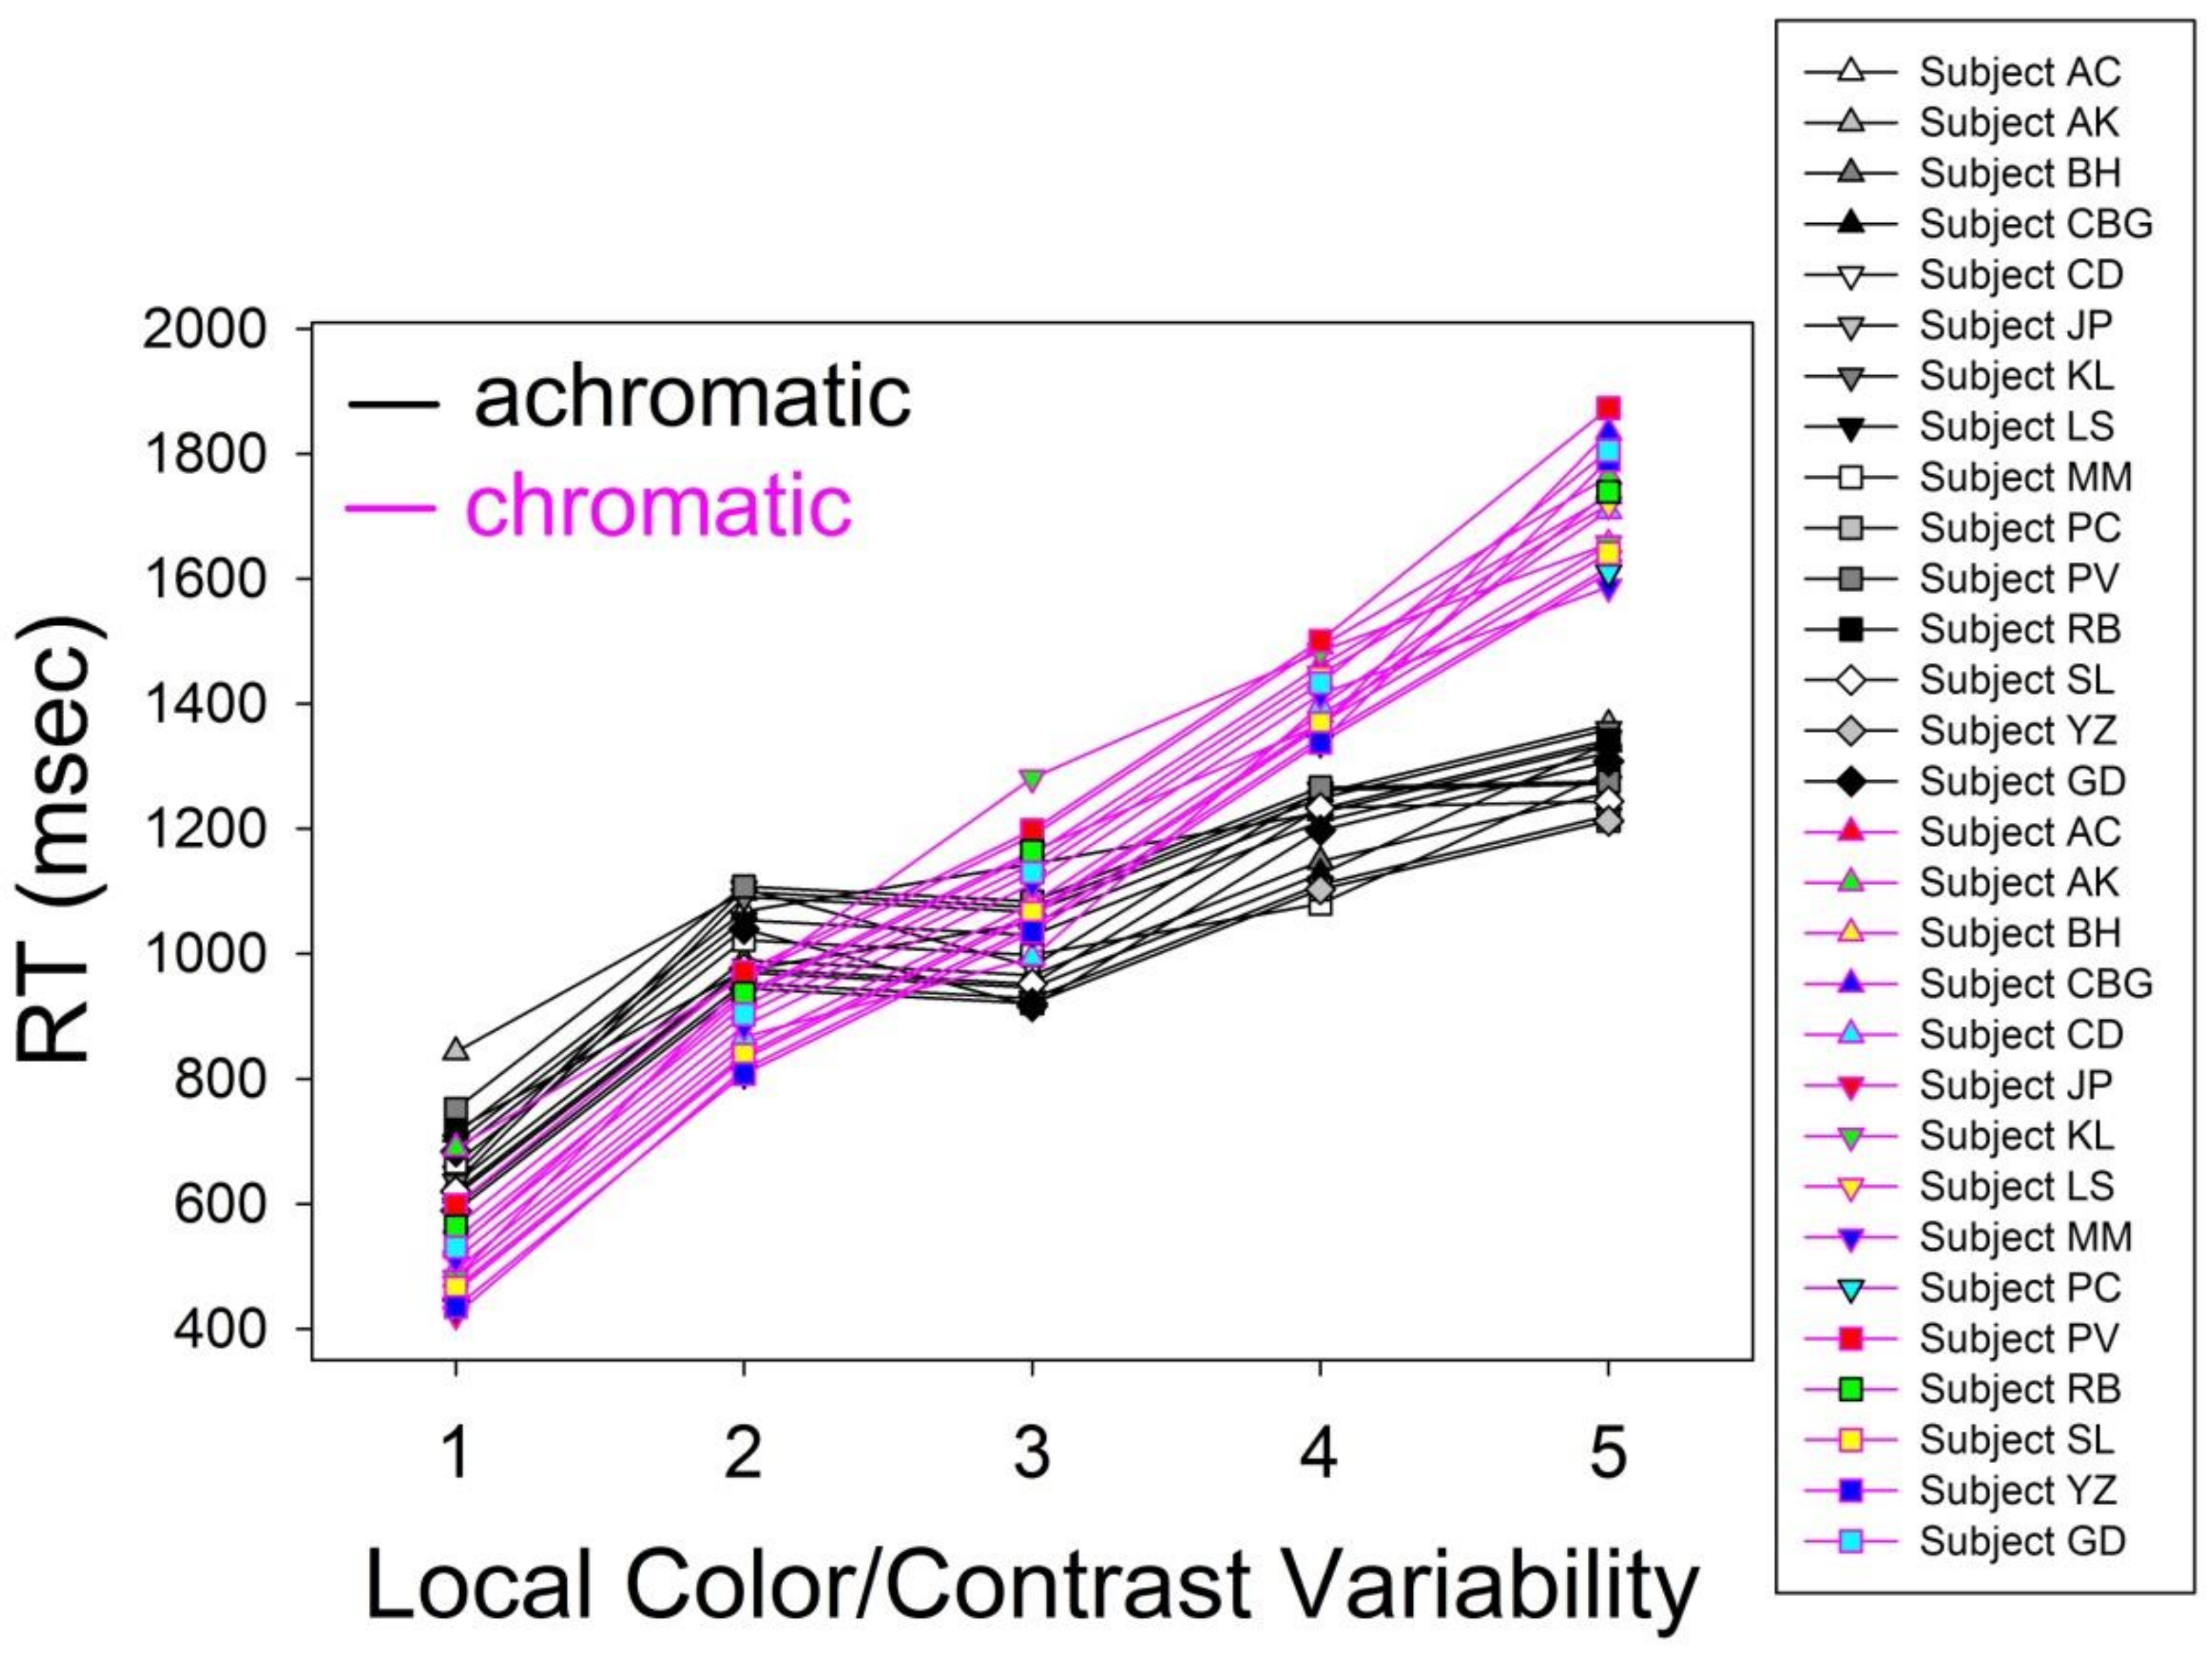
Individual Response Times (RTs) in milliseconds of the fifteen subjects, averaged over repeated stimuli, in the achromatic and chromatic image conditions. The longest RTs are, as could be expected in light of the processing model given in Figure 1, observed for the variability/complexity levels 4 and 5 of the chromatic shapes containing all wavelengths of the visible spectrum.
Figure 4.
Individual Response Times (RTs) in milliseconds of the fifteen subjects, averaged over repeated stimuli, in the achromatic and chromatic image conditions. The longest RTs are, as could be expected in light of the processing model given in Figure 1, observed for the variability/complexity levels 4 and 5 of the chromatic shapes containing all wavelengths of the visible spectrum.

Figure 5.
Average Response Time (RT) in milliseconds as a function of the two levels of the hue factor and the five levels of the variability factor reflecting increasing local color/contrast variations (complexity) across the axis of symmetry in the shape pairs. The error bars here indicate the standard deviations from the means. A linear model provides a good fit to the data for color (red regression line) and for achromatic (black regression line) data, with a moderately better fit in the case of color (R2 = 0.99) by comparison with achromatic (R2 = 0.88).

Figure 6.
When additional noise is added, the saliency of any bilateral symmetry pattern will be more or less severely affected.
Figure 6.
When additional noise is added, the saliency of any bilateral symmetry pattern will be more or less severely affected.

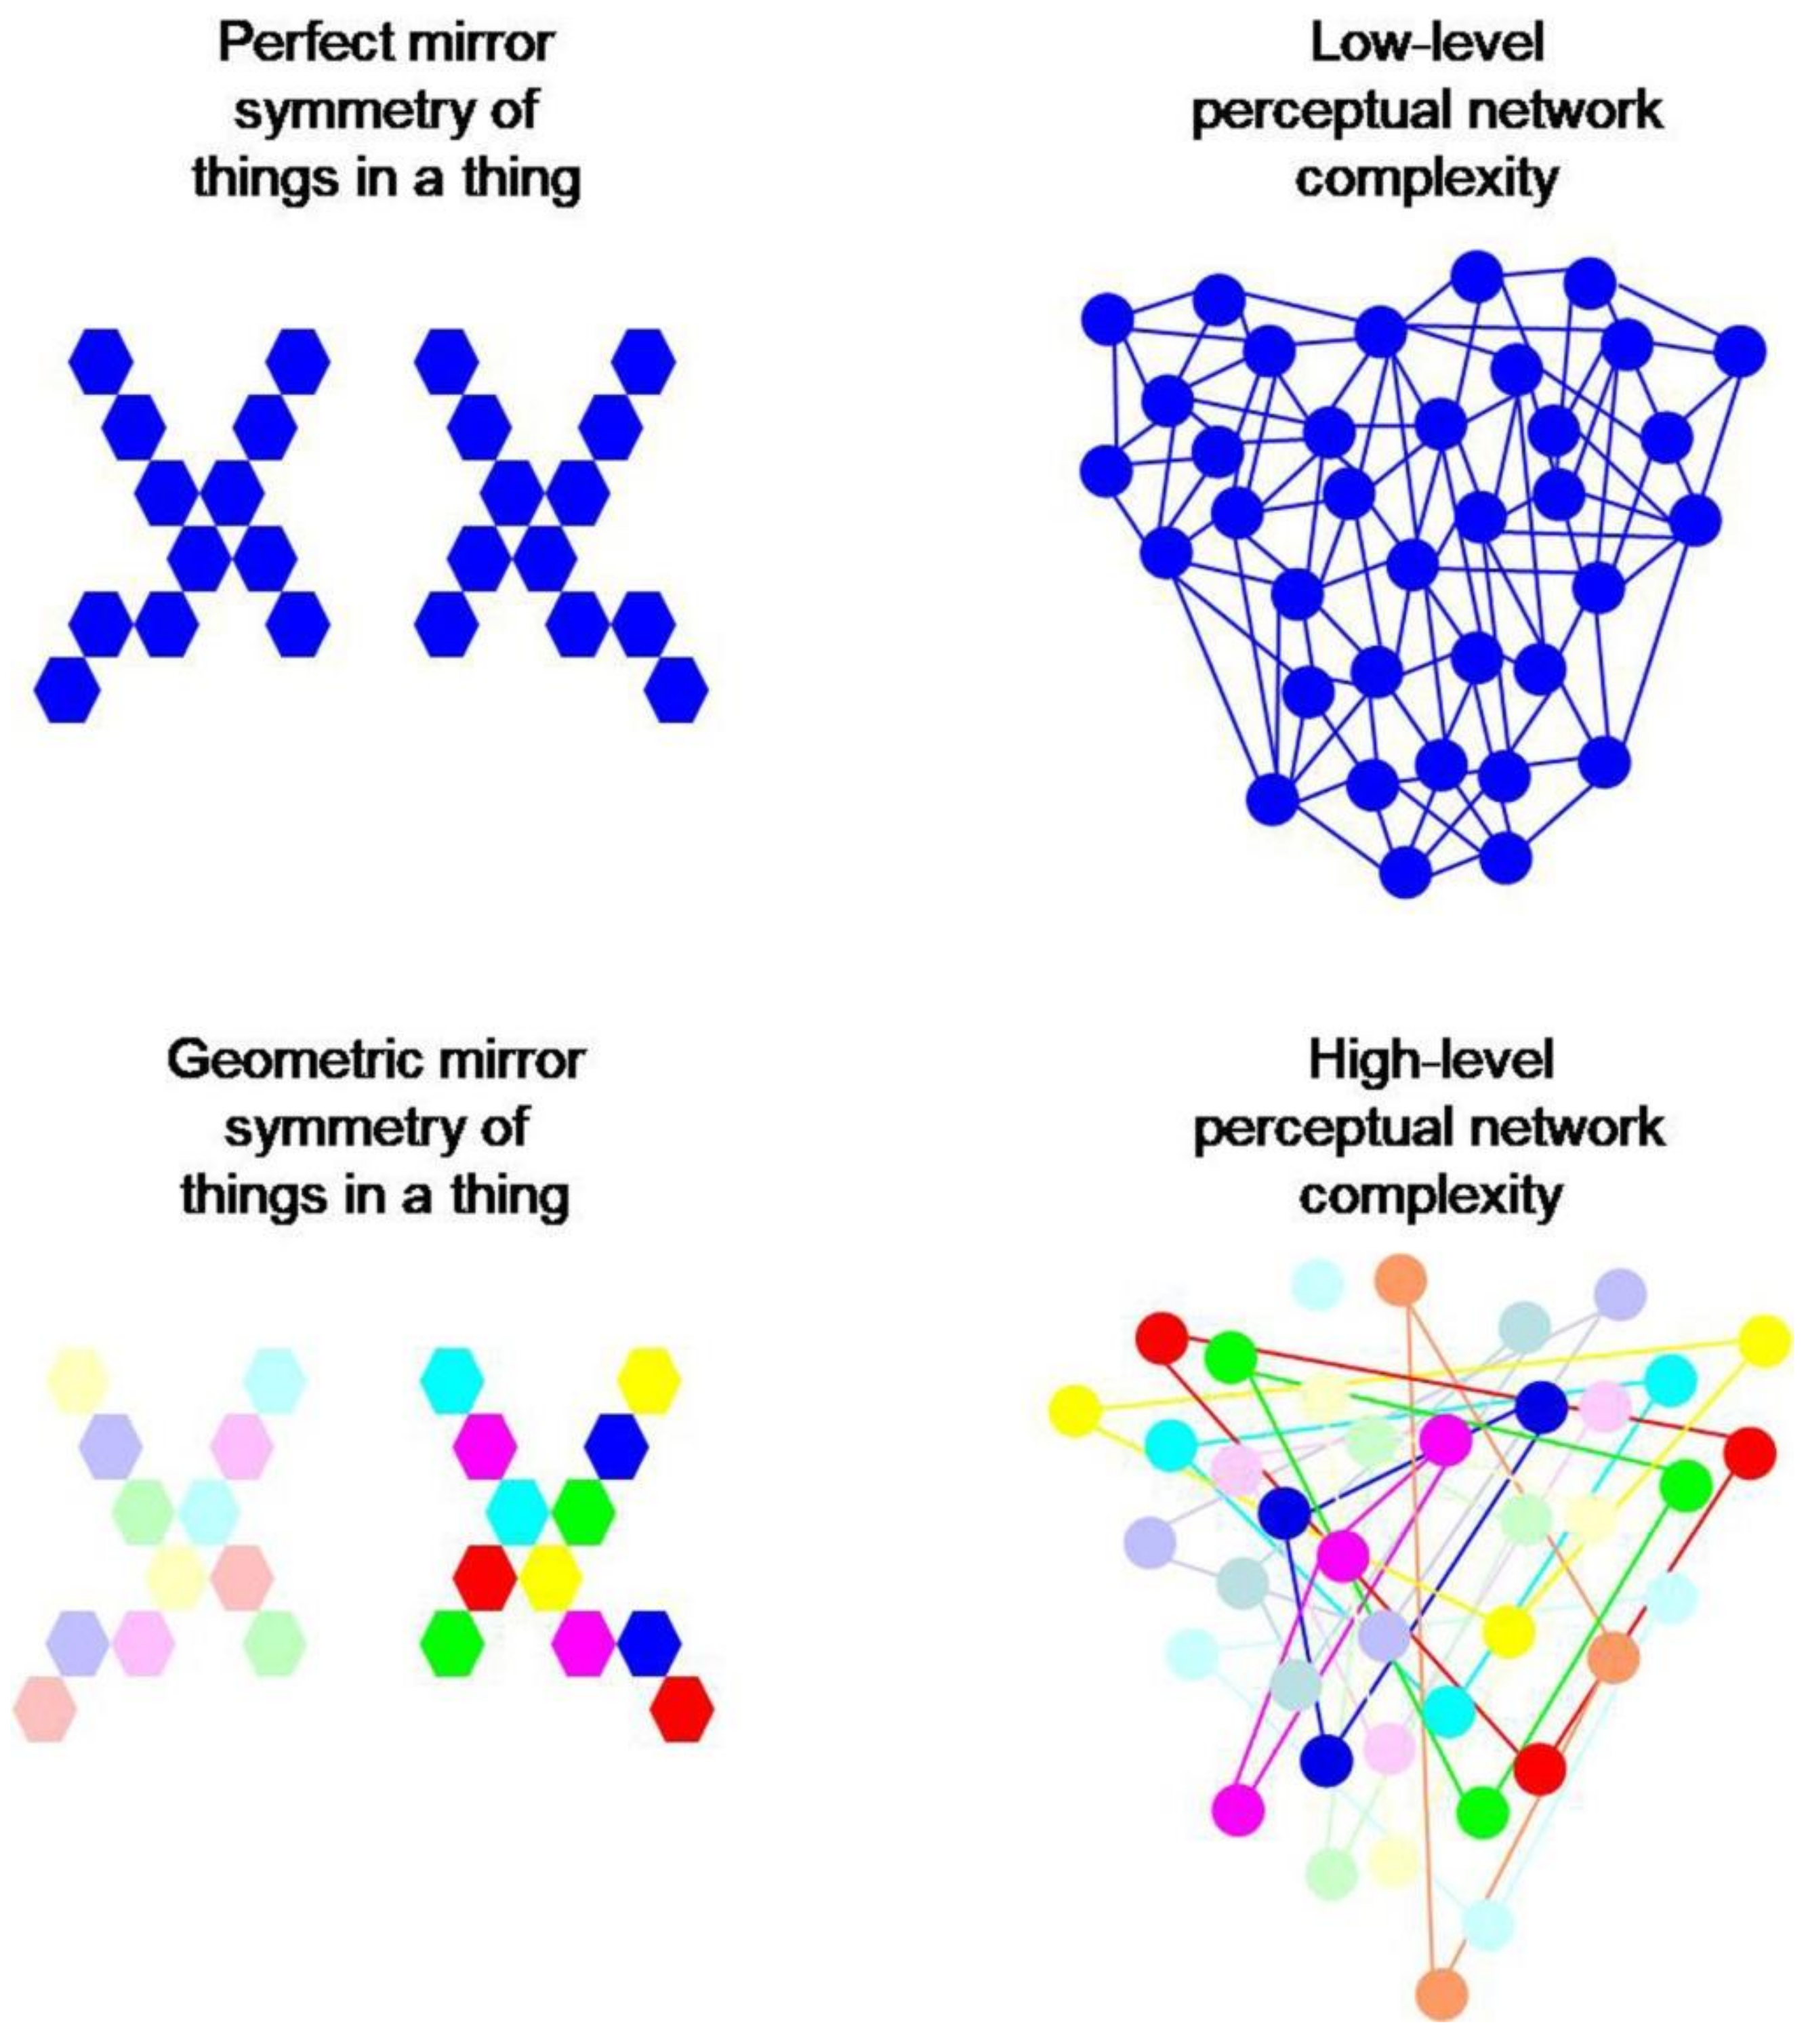
Figure 7.
Local variability in color, saturation or contrast (bottom) across an axis of perfect geometric mirror symmetry involves higher levels of brain network complexity with longer processing times, by comparison with the same geometric configuration not presenting such variability (top). The complexity here originates from the initial complexity of contrast sensitive and wavelength selective computations at the level of visual neurons of the p-pathway in the retina (Figure 1), and affects all further brain computations at higher levels of processing.


Table 1.
Physical color parameters and photometric luminance (L in candela per square meter) generating variability of appearance in the experimental stimuli.
Table 1.
Physical color parameters and photometric luminance (L in candela per square meter) generating variability of appearance in the experimental stimuli.
| Appearance | Hue (deg) | Saturation (%) | L (cd/m2) | R-G-B | |
|---|---|---|---|---|---|
| Saturated Colors | Blue | 240 | 100 | 14 | 0-0-255 |
| Red | 0 | 100 | 36 | 255-0-0 | |
| Green | 120 | 100 | 79 | 0-255-0 | |
| Magenta | 300 | 100 | 50 | 255-0-255 | |
| Desaturated Colors | Yellow | 60 | 100 | 115 | 255-255-0 |
| Cyan | 180 | 100 | 75 | 0-255-255 | |
| Pale Blue | 240 | 25 | 62 | 190-190-255 | |
| Pale Red | 0 | 25 | 87 | 255-190-190 | |
| Pale Green | 120 | 25 | 90 | 190-255-190 | |
| Pale Magenta | 300 | 25 | 92 | 255-190-255 | |
| Pale Yellow | 60 | 25 | 100 | 255-255-190 | |
| Pale Cyan | 180 | 25 | 97 | 190-255-255 | |
| Achromatic Tones | Black | 0 | 0 | 0 | 0-0-0 |
| Dark Grey1 | 0 | 0 | 15 | 80-80-80 | |
| Dark Grey2 | 0 | 0 | 20 | 90-90-90 | |
| Medium Grey1 | 0 | 0 | 50 | 150-150-150 | |
| Medium Grey2 | 0 | 0 | 60 | 170-170-170 | |
| Light Grey1 | 0 | 0 | 70 | 190-190-190 | |
| Light Grey2 | 0 | 0 | 99 | 215-215-215 | |
| White | 0 | 0 | 129 | 255-255-255 |
Table 2.
Michelson contrast ratios (C) of each shape in a pair as a function of the hue condition and local variability/complexity (from 1 to 5 as shown in Figure 2).
Table 2.
Michelson contrast ratios (C) of each shape in a pair as a function of the hue condition and local variability/complexity (from 1 to 5 as shown in Figure 2).
| 1 | 2 | 3 | 4 | 5 | |
|---|---|---|---|---|---|
| Color | 0.7/0.7 | 0.7/0.63 | 0.7/0.63 | 0.8/0.8 | 0.8/0.43 |
| d = 0 | d = 0.13 | d = 0.13 | d = 0 | d = 0.37 | |
| Achromatic | 0.53/0.53 | 0.53/1 | 0.53/1 | 1/1 | 1/0.74 |
| d = 0 | d = 0.47 | d = 0.47 | d = 0 | d = 0.26 |
Table 3.
Means and Standard Errors for the different Factor Levels and their Interactions.
| Hue | Mean | Standard Error |
|---|---|---|
| Chromatic | 1121.5 | 10.2 |
| Achromatic | 1033.1 | 8.9 |
| Variability | ||
| 1 | 589.6 | 9.6 |
| 2 | 954.1 | 10.4 |
| 3 | 1055.6 | 13.5 |
| 4 | 1298.1 | 13.6 |
| 5 | 1489.1 | 14.4 |
| Interactions | ||
| Chromatic × 1 | 512.6 | 11.9 |
| Chromatic × 2 | 885.6 | 12.4 |
| Chromatic × 3 | 1112.6 | 12.9 |
| Chromatic × 4 | 1408.9 | 13.5 |
| Chromatic × 5 | 1687.6 | 16.2 |
| Achromatic × 1 | 666.6 | 9.3 |
| Achromatic × 2 | 1022.6 | 11.0 |
| Achromatic × 3 | 998.6 | 11.9 |
| Achromatic × 4 | 1187.2 | 12.3 |
| Achromatic × 5 | 1290.6 | 12.9 |
Table 4.
Results from the two-way analysis of variance. Degrees of Freedom (DF), Sums of Squares (SS), the corresponding F statistic, and the associated probability limit (p) for each of the two factors and their interaction.
Table 4.
Results from the two-way analysis of variance. Degrees of Freedom (DF), Sums of Squares (SS), the corresponding F statistic, and the associated probability limit (p) for each of the two factors and their interaction.
| DF | SS | MS | F | p | |
|---|---|---|---|---|---|
| Hue | 1 | 292,640 | 292,604 | 64.27 | <0.001 |
| Variability | 4 | 14,754,969 | 3,538,742 | 777.3 | <0.001 |
| Interaction | 4 | 1,674,091 | 418,523 | 91.92 | <0.001 |
| Residual | 140 | 637,422 | 4553 | ||
| Total | 149 | 16,759,087 | 112,477 |
Table 5.
Results of the linear regression analysis on average RT for the two levels of the hue factor as a function of the five levels of the variability factor.
Table 5.
Results of the linear regression analysis on average RT for the two levels of the hue factor as a function of the five levels of the variability factor.
| Coefficients ‘Color’ | Model Function | Coefficients ‘Achromatic’ | Model Function | ||
|---|---|---|---|---|---|
| x | f(x) | x | f(x) | ||
| Intercept (a) = 546.8 Slope (b) = 288 R 2 = 0.9951972709 | 0 | 546.8 | Intercept (a) = 750.6 Slope (b) = 140.6 R 2 = 0.883791256 | 0 | 750.6 |
| 0.08 | 569.84 | 0.08 | 761.84 | ||
| 0.16 | 592.88 | 0.16 | 773.09 | ||
| 0.24 | 615.92 | 0.24 | 784.34 | ||
| 0.32 | 638.96 | 0.32 | 795.59 | ||
| 0.40 | 662.00 | 0.40 | 806.84 | ||
| 0.48 | 685.04 | 0.48 | 818.08 | ||
| 0.56 | 708.08 | 0.56 | 829.33 | ||
| 0.64 | 731.12 | 0.64 | 840.58 | ||
| 0.72 | 754.16 | 0.72 | 851.83 | ||
| 0.80 | 777.20 | 0.80 | 863.08 | ||
| 0.88 | 800.24 | 0.88 | 874.32 | ||
| 0.96 | 823.28 | 0.96 | 885.57 | ||
| 1.04 | 846.32 | 1.04 | 896.82 | ||
| 1.12 | 869.36 | 1.12 | 908.07 | ||
| 1.20 | 892.40 | 1.20 | 919.32 | ||
| 1.28 | 915.44 | 1.28 | 930.56 | ||
| 1.36 | 938.48 | 1.36 | 941.81 | ||
| 1.44 | 961.52 | 1.44 | 953.06 | ||
| 1.52 | 984.56 | 1.52 | 964.31 | ||
| 1.60 | 1007.60 | 1.60 | 975.56 | ||
| 1.68 | 1030.64 | 1.68 | 986.80 | ||
| 1.76 | 1053.68 | 1.76 | 998.05 | ||
| 1.84 | 1076.72 | 1.84 | 1009.30 | ||
| 1.92 | 1099.76 | 1.92 | 1020.55 | ||
| 2.00 | 1122.80 | 2.00 | 1031.80 | ||
| 2.08 | 1145.84 | 2.08 | 1043.04 | ||
| 2.16 | 1168.88 | 2.16 | 1054.29 | ||
| 2.24 | 1191.92 | 2.24 | 1065.54 | ||
| 2.32 | 1214.96 | 2.32 | 1076.79 | ||
| 2.04 | 1238.00 | 2.40 | 1088.04 | ||
| 2.48 | 1261.04 | 2.48 | 1099.28 | ||
| 2.56 | 1284.08 | 2.56 | 1110.53 | ||
| 2.64 | 1307.12 | 2.64 | 1121.78 | ||
| 2.72 | 1330.16 | 2.72 | 1133.03 | ||
| 2.80 | 1353.20 | 2.80 | 1144.28 | ||
| 2.88 | 1376.24 | 2.88 | 1155.52 | ||
| 2.96 | 1399.28 | 2.96 | 1166.77 | ||
| 3.04 | 1422.32 | 3.04 | 1178.02 | ||
| 3.12 | 1445.36 | 3.12 | 1189.27 | ||
| 3.20 | 1468.40 | 3.20 | 1200.52 | ||
| 3.28 | 1491.44 | 3.28 | 1211.76 | ||
| 3.36 | 1514.48 | 3.36 | 1223.01 | ||
| 3.44 | 1537.52 | 3.44 | 1234.26 | ||
| 3.52 | 1560.56 | 3.51 | 1245.51 | ||
| 3.60 | 1583.60 | 3.60 | 1256.76 | ||
| 3.68 | 1606.64 | 3.68 | 1268.00 | ||
| 3.76 | 1629.68 | 3.76 | 1279.25 | ||
| 3.84 | 1652.72 | 3.84 | 1290.50 | ||
| 3.92 | 1675.76 | 3.92 | 1301.75 | ||
| 4.00 | 1698.80 | 4.00 | 1313.00 | ||
Publisher’s Note: MDPI stays neutral with regard to jurisdictional claims in published maps and institutional affiliations. |
© 2022 by the author. Licensee MDPI, Basel, Switzerland. This article is an open access article distributed under the terms and conditions of the Creative Commons Attribution (CC BY) license (https://creativecommons.org/licenses/by/4.0/).
Share and Cite
MDPI and ACS Style
Dresp-Langley, B. Color Variability Constrains Detection of Geometrically Perfect Mirror Symmetry. Computation 2022, 10, 99. https://0-doi-org.brum.beds.ac.uk/10.3390/computation10060099
AMA Style
Dresp-Langley B. Color Variability Constrains Detection of Geometrically Perfect Mirror Symmetry. Computation. 2022; 10(6):99. https://0-doi-org.brum.beds.ac.uk/10.3390/computation10060099
Chicago/Turabian StyleDresp-Langley, Birgitta. 2022. "Color Variability Constrains Detection of Geometrically Perfect Mirror Symmetry" Computation 10, no. 6: 99. https://0-doi-org.brum.beds.ac.uk/10.3390/computation10060099
Note that from the first issue of 2016, this journal uses article numbers instead of page numbers. See further details here.